Global
On a global scale, the key economic data point will be the release of the PMIs across the world on Wednesday. With the global industrial cycle having hit a soft patch, the global PMI will give us a sense of whether or not the global economy is finding a…
As global oil inventories are drawn to meet consumer demand for refined petroleum products like gasoline, diesel fuel, chemicals, and plastics, our global fixed income strategists expect oil prices to influence bond markets. The drawdown in global inventories…
While oil demand growth is slowing somewhat, exports from two of OPEC's largest producers - Iran and Venezuela - are falling precipitously. Global oil inventories are drawing down, while spare capacity is perilously low, leaving little in the way of readily…

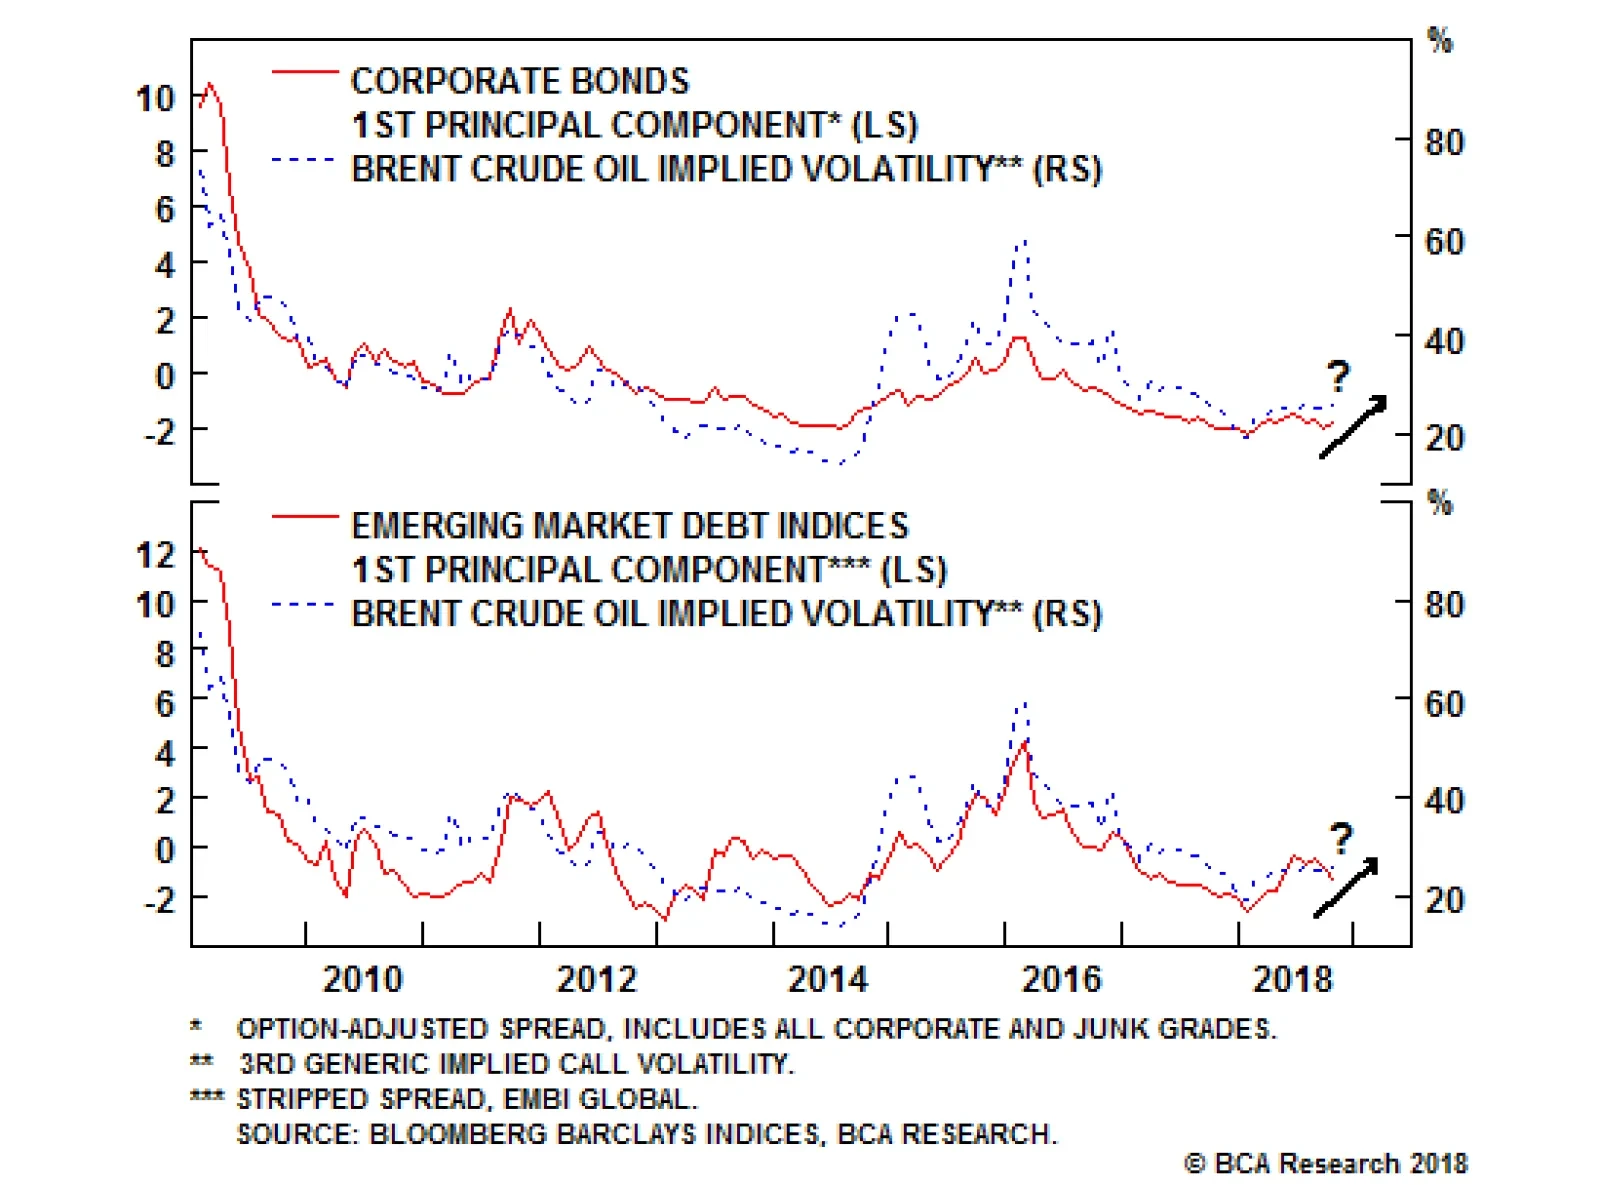
Highlights A supply-driven spike in oil prices in early 2019 is now a highly likely scenario. This represents a potential risk to our current high-conviction view that global bond yields will continue to rise over the next year. Oil prices north of $100/bbl would have negative implications for global growth, especially with a rising U.S. dollar likely to magnify the inflationary impact outside the U.S. A spike in oil prices could alter the recent positive correlation between global bond yields and oil (through higher inflation expectations), even turning into a negative correlation (through weaker expected economic growth). The most reliable historical correlations suggests that more volatile oil prices will lead to greater volatility for both bond yields and corporate credit spreads. Feature The BCA house view remains unequivocally bond bearish, led by additional upside potential for U.S. Treasury yields. The Fed will continue to deliver a steady pace of rate hikes over at least the next year in response to a strong U.S. economy that is fueled by fiscal stimulus and operating well beyond full employment. U.S. bond markets are not discounting enough potential tightening and inflation expectations remain below levels consistent with the Fed's 2% inflation target, so Treasury yields have room to rise further. While we are comfortable with our high-conviction bearish view on government bonds, we recognize that it is prudent to look for potential scenarios that could derail our base-case scenario. Especially since our once out-of-consensus expectation of higher global yields is now a widely-held view among investors, with Treasury yields breaking out to new cyclical highs in recent weeks. One such risk could come from a spike in oil prices in early 2019, and its potential aftermath. A confluence of geopolitical (Iran, Venezuela) and monetary policy risks (Fed tightening, rising U.S. dollar) will likely stoke oil price volatility next year. This will eventually lead to higher bond market volatility both in developed markets (DM) and emerging markets (EM) - a relationship that has had a far more reliable correlation over time than the direct relationship between oil prices and yields (Chart 1). Chart 1Oil Vol & Bond Vol Are Linked
Oil Vol & Bond Vol Are Linked
Oil Vol & Bond Vol Are Linked
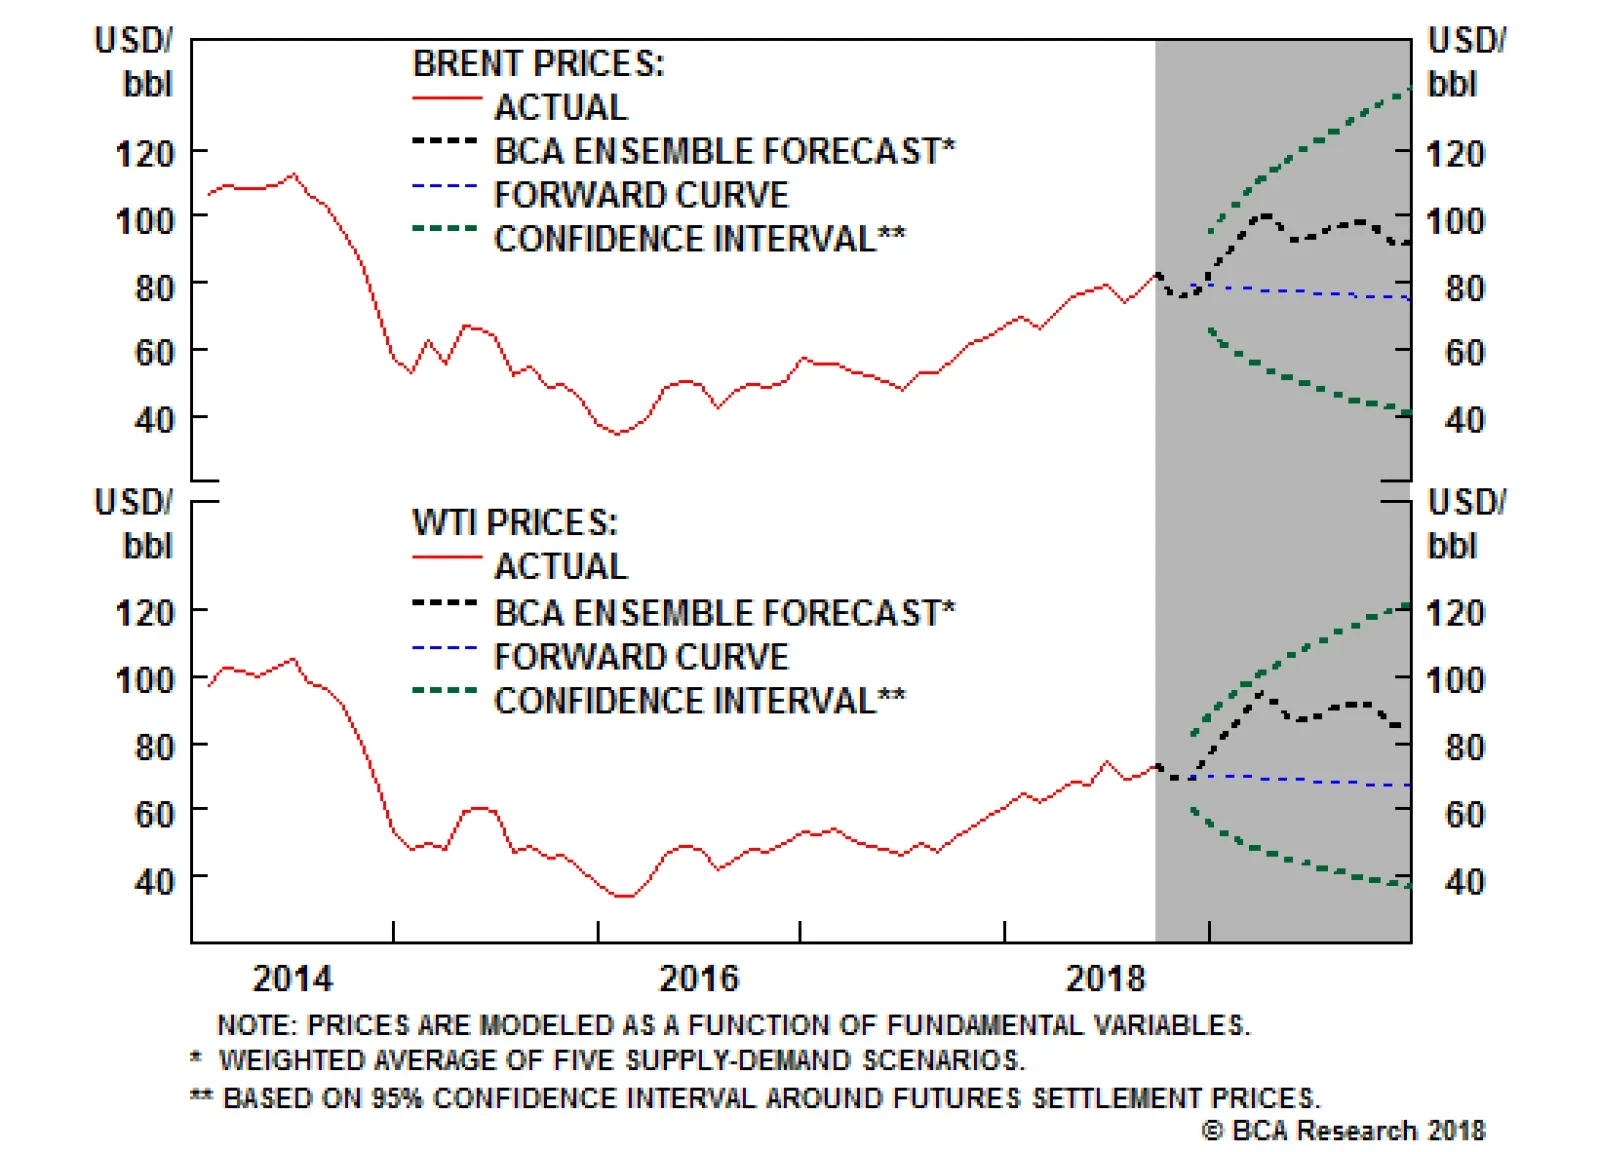
In this joint Special Report, BCA's Commodity & Energy Strategy and Global Fixed Income Strategy services explore how a changing relationship between oil and interest rates could affect the future behavior of global bond markets and, by association, returns to fixed income portfolios. Growing Odds Of A 2019 Oil Price Spike Global oil markets are tightening. While oil demand growth is slowing somewhat, exports from two of OPEC's largest producers - Iran and Venezuela - are falling precipitously. U.S. sanctions against the former, and the unabated collapse in the latter's economy will together remove some 2mm barrels/day (b/d) of supply from an already tight market next year. Global oil inventories are drawing down, while spare capacity is perilously low, leaving little in the way of readily available backup supply to deal with an unplanned production outage even in a minor oil-exporting state. The confluence of these factors is setting the global oil market up for a supply shock, which could take prices to $100/bbl in 1Q19 (Chart 2).1 Those high prices are likely to be sustained, and we expect Brent crude oil, the global benchmark, to trade at $95/bbl on average over the course of next year. Chart 2Get Ready For $100/bbl Oil In Q1 2019
Get Ready For $100/bbl Oil In Q1 2019
Get Ready For $100/bbl Oil In Q1 2019
Against this physical reality, the Fed remains set to continue normalizing interest rates. With other major central banks remaining relatively accommodative, widening rate differentials (Chart 3) will continue to support the U.S. dollar (USD). This will, all else equal, increase the cost of oil in local currency terms outside the U.S., hitting EM economies particularly hard if the price move is both as large, and as rapid, as we expect. Chart 3Rate Differentials Will Remain USD-Supportive
Rate Differentials Will Remain USD-Supportive
Rate Differentials Will Remain USD-Supportive
It is important here to differentiate between a steady demand-driven rise in the price of oil and a rapid supply-driven oil price spike. The former can be bond-bearish by pushing up the inflation expectations components of global bond yields at a time when strong economic growth is also pushing up real bond yields. An oil price spike, however, can eventually produce a DIS-inflationary impulse by depressing real economic growth and destroying oil demand, which ultimately lowers oil prices, inflation expectations and real yields. The IMF, in its most recent World Economic Outlook, highlighted a scenario for 2019 where a big enough rise in oil prices could even cause the Fed to reverse its rates-normalization policies.2 While this is not BCA's base case view, a period of sharply higher oil prices in 1Q19 followed by lower prices in 2H19 would whipsaw global oil markets and raise oil price volatility. History suggests that bond price volatility is likely to also increase in the process, both for government bonds (through more uncertainty over the future path of inflation and policy rates) and corporate bonds (though more uncertainty over future economic growth). Expect Higher Bond Volatility As Oil Volatility Rises Since the end of the Global Financial Crisis (GFC), oil volatility has strongly influenced volatility in DM and EM bond markets. Indeed, we find all grades of corporate and junk bonds grouped together are highly correlated with oil volatility in the post-GFC period. We expect this to continue going forward, as oil inventories are drawn down globally to meet consumer demand for refined petroleum products like gasoline, diesel fuel, chemicals and plastics. The drawdown in global inventories shows up in a backwardated oil-price forward curve, which reflects the increasing inelasticity of supply.3 This means prices have to adjust more frequently and sharply to equilibrate available supply with demand, producing higher volatility in oil prices (Chart 4). Chart 4Implied Volatilities Will Rise As OECD Storage Falls
Man Bites Dog: Could Sharply Rising Oil Prices Lead To Lower Global Bond Yields In 2019?
Man Bites Dog: Could Sharply Rising Oil Prices Lead To Lower Global Bond Yields In 2019?
Using principal components analysis (PCA), we find a high pairwise correlation between oil and bond volatility since 2010. The first principal component (PC) of all grades of corporate and junk bonds grouped together varies strongly with oil volatility, with a correlation of 0.80. Importantly, this component explains 91% of the variability in the group (Chart 5).4 EM bond spreads for smaller issuers like Chile, Peru, Hungary, Poland, Turkey, Indonesia, Mexico, Colombia, and Malaysia are also heavily influenced by greater variability of oil prices, with the first PC of this group highly correlated with oil volatility. Chart 5Oil Volatility Leads To Bond Volatility
Oil Volatility Leads To Bond Volatility
Oil Volatility Leads To Bond Volatility
It comes as no surprise that our U.S. Bond Strategy group, headed by Ryan Swift, has found that lower-quality corporate bonds (i.e., junk) have a high correlation with oil volatility, as do lower-quality corporate spreads (Chart 6). As Ryan noted in a recent report: "there is no consistent correlation between the level of oil prices and junk spreads. However, there is a correlation between implied volatility in the crude oil market and junk spreads, with higher implied vol coinciding with wider spreads and vice-versa. ... The bottom line for junk investors is that a supply shock in the oil market would most likely lead to a steep backwardation in the futures curve and an increase in implied oil volatility. An increase in implied oil volatility will translate into a higher risk premium embedded in junk spreads."5 Chart 6Higher Oil Vol = Wider Junk Spreads Oil Volatility Leads To Credit Spread Widening
Higher Oil Vol = Wider Junk Spreads Oil Volatility Leads To Credit Spread Widening
Higher Oil Vol = Wider Junk Spreads Oil Volatility Leads To Credit Spread Widening
Thus, the oil price spike that we are expecting in 2019 should make corporate bond investors more cautious on the outlook for credit spread and expected returns. BCA's bond strategists have already been expecting to shift to an underweight stance on U.S. corporate debt sometime in 2019 as the Fed moves to a restrictive monetary stance and investors begin to cut U.S. growth expectations and anticipate increased future credit downgrades and defaults. A sharp upward move in oil prices in 1Q19 may prove to be the trigger for that shift to a more bearish outlook on credit. Could An Oil Price Spike Change The Fed's Current Thinking? The combination of an oil price spike and a stronger USD that we anticipate would present a considerable headwind to EM economic growth. Econometric modelling work done by BCA Commodity & Energy Strategy shows that there is a strong correlation between EM growth and U.S. inflation (see Box 1).6 Correlation is not causation, of course, but there is a plausible mechanism for that correlation through the USD, which impacts both EM growth and U.S. inflation. Box 1 Modeling The Links Between The USD, EM & Inflation The two risks we highlight in this Special Report - an oil-price shock in 1Q19 that occurs while the Fed is tightening - have profound implications for EM economies, which makes them particularly important for fixed-income markets globally.7 The near-term effects of an oil-supply shock that quickly sent prices above $100/bbl will hit EM consumers particularly hard. Many governments relaxed or removed fuel subsidies shielding consumers from high oil prices following the OPEC-engineered oil-price collapse of 2014 - 16, which saw Brent crude oil prices - the global benchmark - fall from more than $110/bbl in 1H14 to close to $25/bbl in early 2016.8 An oil-price spike would consume a far larger share of EM households' disposable income now, and would reduce aggregate demand. The second risk - tightening of the Fed's monetary policy - is more complicated. The U.S. economy separated itself from the rest of the world with strong growth this year, partly aided by fiscal stimulus. As a result, the U.S. economy is operating beyond full employment, and wages are growing smartly. This growth allows the Fed to tighten monetary policy, which likely produces four policy-rate rate hikes this year, and, per our House view, four next year. On the back of the Fed's rates-normalization policy, the U.S. trade-weighted dollar appreciated ~ 8% this year. We expect continued strength next year. As the dollar strengthens, EM trade volumes slow. This is partly a result of rising local-currency costs ex U.S., as most commodities are priced in USD. Trade volumes - particularly imports - are closely tied to EM incomes: The World Bank estimates the income elasticity of trade in EM economies averaged 1.5% from 2000-07 p.a., and 1.2% from 2010-17, meaning a 1% increase in income has led to a roughly 1.4% growth in trade over this period.9 Falling trade volumes correspond with weakening or falling income in EM economies. Part of this likely is explained by the expansion and deepening of Global Supply Chains (GSCs) over the past two decades, which fueled the rapid rise in trade of intermediate goods globally, and EM incomes in the process.10 To examine the impact of a rising dollar on EM income, we estimated a regression for the level of EM import volumes using an ensemble of models for the broad trade-weighted index (TWIB) USD as an explanatory variable.11 Our modeling indicates that a 1% increase in our USD TWIB ensemble translates into a 0.33% decline in EM import volumes (Chart 7).12 Chart 7Strong Dollar Dampens EM Trade Volumes Downward Trend In EM Trade Will Continue As USD Strengthens ...
Strong Dollar Dampens EM Trade Volumes Downward Trend In EM Trade Will Continue As USD Strengthens ...
Strong Dollar Dampens EM Trade Volumes Downward Trend In EM Trade Will Continue As USD Strengthens ...
Next, we wanted to take these results and have a closer look at inflation, since, as noted above, wage and price pressures have been transmitted globally through GSCs for the better part of the 21st century. This is a phenomenon that accelerates as GSCs are broadened and deepened. More precisely, we wanted to examine the global aspects of local inflation in DM and EM economies.13 To do this, we look at the level of the U.S. Consumer Price Index (CPI) as a function of EM import volumes. Our modeling indicates that a 1% change in the level of EM import volumes as a function of the USD TWIB translates to a change (in the same direction) in the level of U.S. CPI of between 0.15% and 0.25% - estimated over the post-GFC period (2010 to now). This reflects both the direct and indirect effects of EM incomes on domestic inflation in the U.S. (Chart 8): Chart 8U.S. CPI Vs EM Import Volumes U.S. CPI Vs EM Import Volumes
U.S. CPI Vs EM Import Volumes U.S. CPI Vs EM Import Volumes
U.S. CPI Vs EM Import Volumes U.S. CPI Vs EM Import Volumes
A stronger USD lowers expected U.S. inflation by reducing the cost of imports. EM disposable income growth slows as the USD rises, because the local-currency costs of imports rise and consumes more of available household budgets. Our modeling isolates the common deterministic trend between the U.S. CPI and EM import volumes from the cyclical variations. In fact, these two variables expressed in levels exhibit a strong and stable common trend.14 The U.S. trade-weighted dollar index has already appreciated 8% this year, with more upside likely in the next 6-12 months (Chart 9).15 This would widen the existing sharp divergence between a strong U.S. economy and weaker non-U.S. growth, putting even more upward pressure on the USD. This would represent an additional tightening of U.S. monetary conditions on top of the Fed rate hikes that have already occurred since late 2015. Chart 9Expect Continued USD Appreciation
Expect Continued USD Appreciation
Expect Continued USD Appreciation
BCA's bond strategy services have described a concept known as the "Fed Policy Loop" to explain the link between global growth divergences, a rising USD, financial market volatility and eventual shifts in the Fed's hawkish bias. Such a move occurred in late 2015/early 2016, when the Fed had to delay additional increases beyond the initial 25bp rate hike of the current tightening cycle because of a soaring USD and global financial market instability (Chart 10). Chart 10Is The Fed Policy Loop: Watch U.S. Credit Spreads
Is The Fed Policy Loop: Watch U.S. Credit Spreads"
Is The Fed Policy Loop: Watch U.S. Credit Spreads"
The current backdrop shares some characteristics with that episode, in terms of growth divergences (top panel), USD strength and wider EM credit spreads (second panel). The missing piece today is a large widening of U.S. credit spreads, and U.S. credit market underperformance versus Treasuries (third panel). The U.S. economy is in a much healthier place now compared to three years ago, which is why credit spreads have remained much better behaved in 2018. The global backdrop is also far less disinflationary, with the global output gap now closed and inflation expectations drifting back towards pre-crisis levels consistent with central bank inflation targets (Chart 11). Investors should focus on U.S. corporate bond spreads for signs that a stronger USD is starting to impact U.S. corporate profits and future U.S. growth expectations. This would be the most likely potential trigger for the Fed to pause on its current tightening path, as occurred in early 2016 (bottom panel). Importantly, we firmly believe that the Fed's hurdle for backing off the rate hikes from a tightening of financial conditions is much higher now because the U.S. economy is stronger today. A "garden variety" equity market correction, without much widening of corporate spreads, will not be enough. Investment Implications What we have laid out in this report is a risk to the current BCA house views on global duration exposure (stay below-benchmark) and global credit exposure (stay neutral, but favoring the U.S. over Europe and EM) - a supply-driven spike in oil prices, combined with additional increases in the USD fueled by Fed tightening. The potential trigger for that oil spike is largely geopolitical, stemming from the likely loss of oil supply from Iran via U.S. sanctions and Venezuela through economic collapse. The timing of either outcome is difficult to pin down precisely, but sometime in the first quarter of 2019 is our current best guess for when oil prices reach $100/bbl. The key variables to watch will be the U.S. dollar. If it stays stable, then the impacts on global growth and U.S. inflation from the oil spike could be more modest. If the USD surges higher, then the negative impact on non-U.S. growth will eventually spill back into the U.S. economy. The combination of more volatile oil prices and a stronger USD would be a likely trigger for a surge in U.S. bond volatility and wider corporate bond spreads. Eventually, this could move the Fed to pause on its rate hike cycle and, at least temporarily, end the current bond bear market. Robert Robis, CFA, Senior Vice President Global Fixed Income Strategy rrobis@bcaresearch.com Robert P. Ryan, Senior Vice President Commodity & Energy Strategy rryan@bcaresearch.com Hugo Bélanger, Senior Analyst Commodity & Energy Strategy HugoB@bcaresearch.com 1 Our full oil-price forecast is available in the September 20, 2018, issue of BCA Commodity & Energy Strategy, in a report titled "Odds Of Oil-Price Spike In 1H19 Rise; 2019 Brent Forecast Lifted $15 To $95/bbl." It is available at ces.bcaresearch.com. We will be updating our oil-price forecast next week. 2 Please see the IMF's World Economic Outlook for October 2018, which can be found here https://www.imf.org/en/Publications/WEO/ 3 Backwardation is a term of art in commodity markets used to describe an inverted forward curve - i.e., prompt prices for commodities delivered in the very near future trade higher than prices for commodities delivered further out in time. This is the market's way of signaling supplies are tight; storage holders are being incentivized to release oil in inventory via higher prices for prompt delivery. The opposite of this is referred to as a contango market (prompt prices are lower than deferred prices). Contango markets reflect well-supplied markets, as supply that cannot be immediately used must be stored for later use. In recent research, we were able to extend findings from academic studies that showed a non-linear relationship between oil volatility and the slope of the forward curve - highly backwardated and contango forward curves are accompanied by higher volatility in oil prices, due to the physical constraints on storage in such markets. 4 Principal components analysis (PCA) is a statistical technique used to reduce the most important information contained in a large number of correlated variables into a smaller number of common factors that explains the larger set. 5 Please see BCA U.S. Bond Strategy Weekly Report, "Oil Supply Shock Is A Risk For Junk," dated October 9, 2018, available at usbs.bcaresearch.com. 6 EM trade volumes - particularly imports - are a key variable we use to track EM income levels. The World Bank estimates the income elasticity of trade averaged 1.5% from 2000 - 07, and 1.2% from 2010 - 17, meaning a 1% increase in income has led to a roughly 1.4% growth in trade over this period. Please see "Trade Wars, China Credit Policy Will Roil Global Copper Markets," in the June 21, 2018, issue of BCA Research's Commodity & Energy Strategy. It is available at ces.bcaresearch.com. 7 10 of the 11 post-WW2 recessions in the U.S. were preceded by an oil-price spike. Since 1970, the combination of an oil-price spike and a Fed rate-hiking cycle resulted in recession. Please see "Oil-Supply Shock, Risking U.S. Rates Favor Gold As A Portfolio Hedge," published by BCA Research's Commodity & Energy Strategy on September 13, 2018. It is available at ces.bcaresearch.com. 8 Please see the Special Focus in the World Bank's January 2018 Global Economic Prospects entitled "With The Benefit of Hindsight: The Impact of the 2014 - 16 Oil Price Collapse." 9 We discuss this in "Trade Wars, China Credit Policy Will Roil Global Copper Markets," in the June 21, 2018, issue of BCA Research's Commodity & Energy Strategy. It is available at ces.bcaresearch.com. 10 Please see "Global value chains and the increasingly global nature of inflation," by Raphael Auer, Claudio Borio, Andrew Filardo, published online April 28, 2017, by VOX, the CEPR Policy Portal. 11 We average estimates from five different USD regressions using monetary policy variables, commodity prices and momentum indicators. The period covered is the post-GFC (2010 to now). 12 The regression we estimate includes a trend variable, which allows us to separate out the cyclical aspects of trade (i.e., imports) alone. 13 Please see "The globalisation of inflation: the growing importance of global value chains," by Raphael Auer, Claudio Borio and Andrew Filardo, which was published by the Bank For International Settlements in January 2017. 14 We believe this reflects "hidden variables" that simultaneously drive U.S. inflation and EM incomes such as global growth and global money/credit growth. The coefficient range we report - 0.15% to 0.25% - controls for this. For a discussion of "hidden variables," please see Clive Granger's 2003 Nobel Lecture entitled "Time Series Analysis, Cointegration, and Applications." 15 Please see BCA Commodity & Energy Strategy Weekly Report, "Trade, Dollars, Oil & Metals ...Assessing Downside Risk," dated August 23, 2018, available at ces.bcaresearch.com.
Highlights Rising U.S. bond yields will continue to put downward pressure on global stocks in the near term, but will not trigger an equity bear market until rates reach restrictive territory. We are still at least 12 months away from that point. The blowout in Italian bond yields has further to go, which will also weigh on global risk assets. Nevertheless, we would buy BTPs for a tactical trade if the 10-year yield rose above 4%, because at that level EU policymakers will call out the fire engines. We downgraded global equities from overweight to neutral in June, while maintaining our bias for DM stocks over EM stocks. Barring any major new developments, we would turn bullish again if global stocks were to fall by 8% from current levels. Remain cyclically underweight interest rate duration. We would move to neutral on duration if the U.S. 10-year yield were to rise to 3.7%. We are still bullish on the dollar, but would shift to neutral if the DXY rose above 100. Feature Bond Yields: Up, Up, And Away Global risk assets remained on the back foot this week. The MSCI All-Country World stock market index has now fallen by 6.3% in dollar terms since last Wednesday. Even the mighty S&P 500 has finally buckled under the pressure. The vulnerability of U.S. stocks had been accumulating beneath the surface for some time, as evidenced by the fact that the advance-decline line has been deteriorating since the late summer. The small cap Russell 2000 is down 11.3% from its August 31st highs (Charts 1A& 1B). Chart 1ABreadth Deteriorated In The Lead-Up To The Correction
Breadth Deteriorated In The Lead-Up To The Correction
Breadth Deteriorated In The Lead-Up To The Correction
Chart 1BStocks Under Pressure
Stocks Under Pressure
Stocks Under Pressure
Bond yields usually fall when equities swoon. This time around, it is the increase in bond yields itself that has undermined stocks. In the U.S., yields have risen in response to better-than-expected growth, a wider budget deficit, rising oil prices, and an increasingly hawkish Fed. In Italy, worries about debt sustainability have been the primary driver of rising yields. Neither factor spells doom for global risk assets. However, a period of indigestion is likely over the coming weeks, which could see global equities go down before they go up again. The U.S. Economy: Too Much Winning? We have argued for much of this year that investors were underappreciating the extent to which the Federal Reserve can raise rates without choking off growth. The past few weeks have seen a growing recognition among investors that the Fed may be behind the curve in normalizing monetary policy. This has led to a steepening in the expected path of U.S. short-term rates, which, together with an increase in the term premium, have pushed up yields at the longer-dated maturities. Both better economic data and Fedspeak contributed to the bond sell-off. On the data front, the non-manufacturing ISM index clocked in at 61.6. The all-important employment component of the index hit a record high. Confirming the encouraging labor market signal from the ISM, the unemployment rate fell to a 48-year low of 3.68% in September. While average hourly earnings ticked down to 2.75% on a year-over-year basis, this was entirely due to base effects. On a month-over-month basis, average hourly earnings have risen by 0.3% for three straight months. If this trend continues, the year-over-year rate will rise to 3.2% by the end of this year. Tellingly, recent wage growth has been concentrated among workers at the bottom of the income distribution (Chart 2). This is important because not only do the wages of low-income workers correlate better with labor market slack than those of high-income workers, but low-income workers are also more likely to spend the bulk of their paychecks. Chart 2Wage Growth Has Accelerated At The Bottom Of The Income Distribution
Wage Growth Has Accelerated At The Bottom Of The Income Distribution
Wage Growth Has Accelerated At The Bottom Of The Income Distribution
Higher wage growth will boost consumer spending. Indeed, it is probable that consumption will rise more than income, given that the personal savings rate has plenty of scope to fall from the current elevated level of 6.6%. Rising wages will incentivize companies to invest more in labor-saving technologies, translating into an increase in capital spending.1 Add in ongoing fiscal stimulus, and we have a recipe for an overheated economy. Starstruck No More As of today, the market has priced in one Fed rate hike in December but only two rate hikes in 2019 (Chart 3). Investors expect no rate hikes in 2020 and beyond. That still seems implausible to us, which suggests that the bond sell-off has further to go. Chart 3The Market Still Thinks The Fed Can't Raise Rates Above 3%
Bond Bears Maul Goldilocks
Bond Bears Maul Goldilocks
In contrast to the past, the Fed no longer seems interested in talking down rate expectations. Speaking with Judy Woodruff at The Atlantic Festival, Chairman Powell stated the Fed "may go past neutral, but we are a long way from neutral at this point, probably."2 Even uber-dove Chicago Fed President Charles Evans appears to have jettisoned his worries about deflation, noting in a speech last Wednesday that "I am more comfortable with the inflation outlook today than I have been for the past several years."3 The Fed has also increasingly downplayed the importance of estimates of the neutral rate of interest, the concept on which the long-term "dots" in the Summary of Economic Projections are based. The Fed's new mantra is that economic data, rather than some theoretical model, should guide monetary policy. Ironically, it was New York Fed President John Williams, who developed one of the most widely used models of r-star, the eponymously named Holston-Laubach-Williams model, that best articulated the Fed's position. At a speech last Monday, Williams argued that the neutral rate of interest, or r-star, has "gotten too much attention in commentary about Fed policy." He went on to say that "Back when interest rates were well below neutral, r-star appropriately acted as a pole star for navigation. But, as we have gotten closer to the range of estimates of neutral, what appeared to be a bright point of light is really a fuzzy blur, reflecting the inherent uncertainty in measuring r-star."4 Trump And Bonds President Trump was quick to blame the Fed for this week's stock market sell-off. Within the span of 24 hours, he used the words "crazy," "loco," "ridiculous," "too cute," "too aggressive," and "big mistake" to describe recent Fed policy. We doubt Trump's rhetoric will have any immediate effect on Fed decision-making. But even if it did sway the Fed to slow the pace of rate hikes, the result will be higher bond yields, not lower yields. This is simply because any further delays in raising rates will lead to even more overheating, and ultimately, higher inflation and the need for higher rates down the road. Bond Sell-Off Will Produce A Correction In Stocks, Not A Bear Market At the height of this week's bond sell-off, the 10-year Treasury yield breached its 200-month moving average for the first time since ... October 1987 (Chart 4). While that sounds pretty ominous, keep in mind that the 10-year yield had reached almost 10% on the eve of the 1987 stock market crash, or about 6% in real terms. Chart 4Two Lines Meet After Three Decades
Two Lines Meet After Three Decades
Two Lines Meet After Three Decades
As my colleague, Doug Peta, discussed two weeks ago, it is the level of interest rates that tends to matter more for stocks rather than the change in rates.5 Specifically, equity returns tend to be lowest at times when monetary policy is already in restrictive territory (Chart 5 and Tables 1 and 2). That was the case in 1987. It is not the case today. Chart 5The Fed Funds Rate Cycle
Bond Bears Maul Goldilocks
Bond Bears Maul Goldilocks
Table 1Tight Policy Is Hazardous To Stocks' Health...
Bond Bears Maul Goldilocks
Bond Bears Maul Goldilocks
Table 2...Especially In Real Terms
Bond Bears Maul Goldilocks
Bond Bears Maul Goldilocks
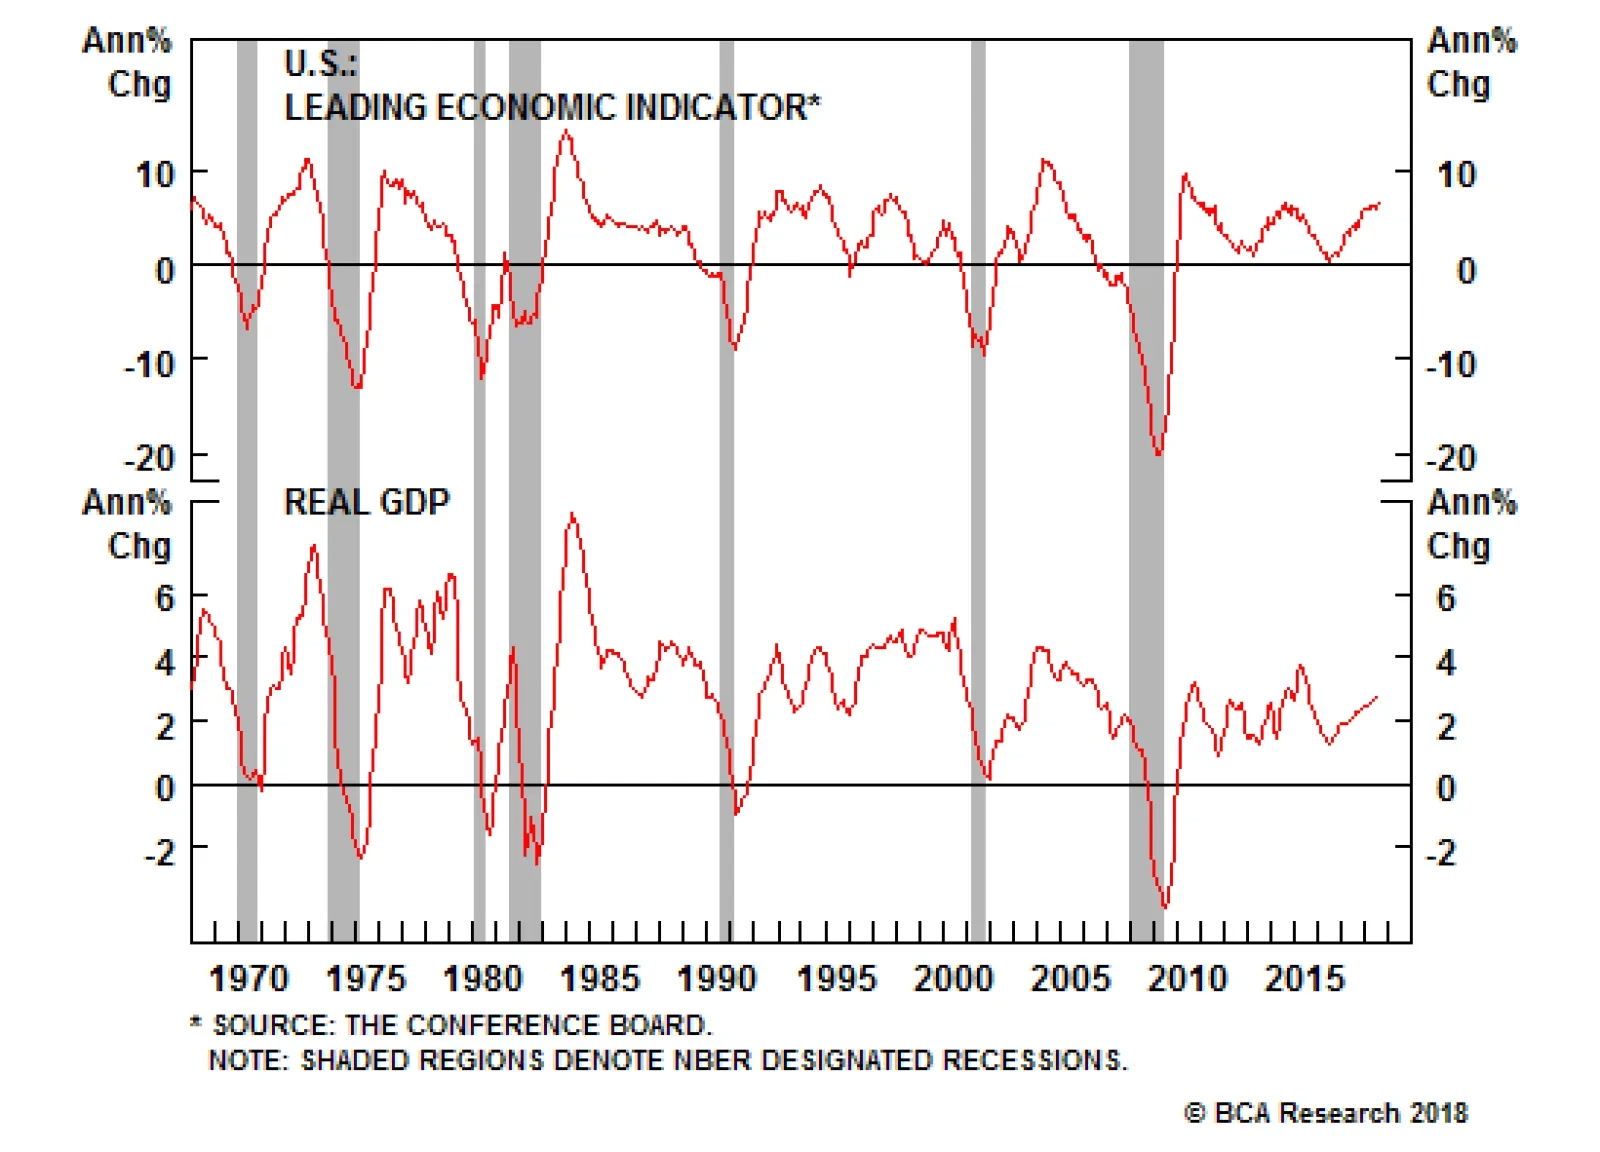
The fact that stocks do worse in environments where monetary policy is tight makes perfect sense. A restrictive monetary policy is usually a prelude to a recession. As Chart 6 illustrates, bear markets and recessions almost always coincide, with the latter usually leading the former by about six-to-twelve months. None of our favorite leading recession indicators are flashing red now (Chart 7). Even the yield curve has steepened in recent weeks. Chart 6Recessions And Bear Markets Usually Overlap
Recessions And Bear Markets Usually Overlap
Recessions And Bear Markets Usually Overlap
Still, higher long-term bond yields do reduce the long-term attractiveness of stocks compared with bonds. The S&P 500 earnings yield has risen modestly since 2016 due to the fact that earnings have grown somewhat more quickly than equity prices. However, the U.S. real 10-year yield has surged by almost 120 basis points over this period. On balance, this has caused the equity risk premium to decline (Chart 8).6 In order to bring the equity risk premium back down to mid-2016 levels, the S&P 500 would need to fall by about 15% from today's levels. We do not expect stocks to fall by that much, partly because the economic environment is more robust than back then, but a further drop of 5%-to-10% from current levels is certainly plausible. Chart 7A U.S. Recession Is Not Imminent
A U.S. Recession Is Not Imminent
A U.S. Recession Is Not Imminent
Chart 8Stocks Versus Bonds
Stocks Versus Bonds
Stocks Versus Bonds
Italy: Heading For A Debt Crisis? The rise in Treasury yields has reduced the attractiveness of other global government bond markets, causing them to sell off in sympathy. Notably, German bund yields have increased by 33 basis points since their May lows (Chart 9). Chart 9Global Bond Yields Moving Higher
Global Bond Yields Moving Higher
Global Bond Yields Moving Higher
Rising German bund yields are bad news for Italy. All things equal, a higher "risk free" bund yield implies a higher Italian bond yield. To make matters worse, as Italian borrowing costs have risen, the perceived likelihood that Italy will be unable to repay its debt has increased. This has caused the spread between German bunds and Italian BTPs to widen, thereby magnifying the effect on Italian bond yields from the increase in risk-free yields. All this has happened at the worst possible moment. Italy's populist government and the European Commission are locked in a battle of wills over next year's budget. The Italian government is targeting a fiscal deficit of 2.4% of GDP for 2019, compared with a deficit of 0.8% that the outgoing caretaker government had proposed in May. Strictly speaking, the new deficit target is still consistent with the 3% limit under the Maastricht Treaty. Nevertheless, it is still causing consternation in Brussels. There are at least three reasons for this: While the government's program has a lot of specifics about how it will increase the deficit - more public investment; a universal minimum income scheme; the ability to retire earlier than under current law; corporate tax cuts; no VAT hike in 2019, etc. - it does not specify which items in the budget will be cut. The program also provides few details on revenue measures, other than proposing a one-off tax amnesty, which will arguably reduce tax receipts over the long haul. The proposed budget assumes real GDP growth of 1.5% in 2019. This is higher than the May projection of 1.4%, and well above the IMF's most recent projection of 1%. The government's real GDP projections for 2020-21 are also about 0.7 percentage points above the IMF's estimates. While Italy's proposed fiscal deficit is below the Maastricht Treaty limit, its current debt-to-GDP ratio of 132% is well above the ceiling of 60% (Chart 10). This implies that Italy should be aiming for a smaller deficit target than what it is currently proposing. Chart 10Italy's Public Debt Mountain
Italy's Public Debt Mountain
Italy's Public Debt Mountain
We expect the Italian government to ultimately acquiesce to the EU's demands, but not before the bond vigilantes have pushed them into a corner. For their part, the EU establishment would love nothing more than to embarrass the Five Star-Lega coalition in order to send a message to voters across Europe about the dangers of voting for populist parties. This means that the Italian 10-year yield may need to break above 4% - the level at which Italian banks would likely be technically insolvent based on the market value of their BTP holdings - before a compromise is reached. We would put on a tactical trade to buy 10-year BTPs at that level, but not before then. Investment Conclusions Goldilocks will survive, but the next couple of months will be challenging. Our soon-to-be-launched MacroQuant model is signaling a bearish outlook for stocks over the next 30 days (Chart 11). On the bond side, the model currently pegs the fair value for the U.S. 10-year yield at 3.7% (Chart 12). Bond sentiment is quite bearish at the moment, which makes a brief countertrend bond rally quite likely. However, the cyclical trend in yields remains to the upside. Chart 11MacroQuant* Recommends That Caution Is Warranted Towards Equities
Bond Bears Maul Goldilocks
Bond Bears Maul Goldilocks
Chart 12MacroQuant Sees 10-Year Treasury Yields Still Below Fair Value
Bond Bears Maul Goldilocks
Bond Bears Maul Goldilocks
We stated last week that investors should consider scaling back risk if they are currently overweight risk assets. We continue to favor this more cautious stance. For the first time in over a decade, short-term U.S. rates are above the dividend yield on the S&P 500 (Chart 13). Holding a bit more cash is finally an attractive option, at least for U.S.-based investors. Chart 13Cash Anyone?
Cash Anyone?
Cash Anyone?
If the sell-off in global equities continues, it will present a buying opportunity, given that the next major global economic downturn is probably at least another two years away. Barring any major new developments, we would turn bullish on stocks again if the MSCI All-Country World Index were to fall by 12% 10% 8% from current levels.7 We would recommend that investors move from an underweight to a neutral interest rate duration position in global bond portfolios if the U.S. 10-year Treasury yield rose to 3.7%. We are still bullish on the dollar, but would shift to neutral if the DXY rose above 100. Peter Berezin, Chief Global Strategist Global Investment Strategy peterb@bcaresearch.com 1 It is true that additional investment spending will raise aggregate supply, but normally it takes a while for that to happen. For example, it may take a few years to build an office tower or a new factory. Corporate R&D investment may not generate tangible benefits for a long time, especially in cases where the research is focused on something complicated (i.e., the design of new computer chips or pharmaceuticals). And even if investment spending could be transformed into additional productive capacity instantaneously, aggregate demand would still rise more than aggregate supply, at least temporarily. Here is the reason: The nonresidential private-sector capital stock is about 120% of GDP in the United States. As such, a one percent increase in investment spending would raise the capital stock by four-fifths of a percentage point. Assuming a capital share of income of 40% of national income, a one percent increase in the capital stock would lift output by 0.4%. Thus, a one-dollar increase in business investment would boost aggregate demand by one dollar in the year it is undertaken, while increasing supply by only 4/5*0.4 = roughly 32 cents. 2 Please see "WATCH: Powell says Fed is focused on 'controlling the controllable,' not politics," PBS News Hour, October 3, 2018; and Jeff Cox, "Powell says we're 'a long way' from neutral on interest rates, indicating more hike are coming," CNBC, October 3, 2018. 3 Charles Evans, "Monetary Policy 2.0?" OMFIF City Lecture on the U.S. Economic Outlook, London, England, October 3, 2018. 4 John C. Williams, "Remarks at the 42nd Annual Central Banking Seminar," Bank for International Settlements, October 1, 2018. 5 Please see U.S. Investment Strategy Special Report, "When Will Higher Rates Hurt Stocks?" dated September 24, 2018; and Special Report, "Revisiting The Fed Funds Rate Cycle," dated September 3, 2018. 6 For this exercise, we define the equity risk premium as the difference between the S&P 500 earnings yield (the inverse of the forward P/E ratio) and the real 10-year bond yield (using CPI swaps as our measure of expected inflation). 7 The perils of writing a report during a week when markets are moving fast. Strategy & Market Trends Tactical Trades Strategic Recommendations Closed Trades
Investors will get a pulse of the household sector next week. Retail sales are released on Monday, but the housing data later in the week is more important. Residential investment is often a critical part of the business cycle given that it is primarily…
BCA continues to recommend that investors underweight EM assets and keep a light touch on cyclical sectors. However, things never happen in a straight line, and our European Investment Strategy service sees an opportunity in industrial commodities. Equity…
Highlights Historically, the dollar exhibits positive seasonality in October and November. Technical and valuation indicators suggest that this year will be no exception. Continuing divergence between U.S. and global growth, rising interest rates, and Italian risks point in this direction as well. However, long positioning in the dollar along with the rebound in the China Play Index are creating non-negligible risks to this bullish dollar view. As a result, investors should overweight dollar exposure in their portfolio, but hedge the above risks by buying NZD/USD and selling EUR/JPY. Feature Through most of September, the dollar traded on the heavy side. However, in the last two trading days of the month, the greenback managed to regain some composure. As October and November have historically been strong months for the DXY (Chart I-1), this week we review if this seasonal pattern will once again hold. The balance of evidence suggests that the historical norm is likely to repeat itself, and that the dollar will continue to rally for the next six months or so, though there are a few risks that should be hedged against. Chart I-1Entering A Seasonally Strong Period For The Dollar
Entering A Seasonally Strong Period For The Dollar
Entering A Seasonally Strong Period For The Dollar
Technicals: No Obstacle For A Strong Dollar An argument rooted in seasonality is a reasoning based on technical factors. Currently, technical indicators continue to paint a supportive backdrop for the greenback. First, by the beginning of the summer, based on its 13-week rate-of-change measure, the dollar index had reached overbought levels. Faced with this hurdle, the dollar's rally essentially took a pause, with the DXY rising only 0.5% since June 28, compared to its 6.4% rally between April 10 and June 28. However, through this side-move, the dollar's overbought conditions resolved themselves, and now the greenback's 13-week rate of change is back in neutral territory (Chart I-2, top two panels). Normally, a sideways correction tends to be a sign that a currency's underlying support remains strong. On the other hand, the euro's oversold correction is also now complete, but the euro has remained on a slightly more pronounced downward path over the same period (Chart I-2, bottom two panels). Chart I-2Short-Term Overbought Conditions Have Been Cleared
Short-Term Overbought Conditions Have Been Cleared
Short-Term Overbought Conditions Have Been Cleared
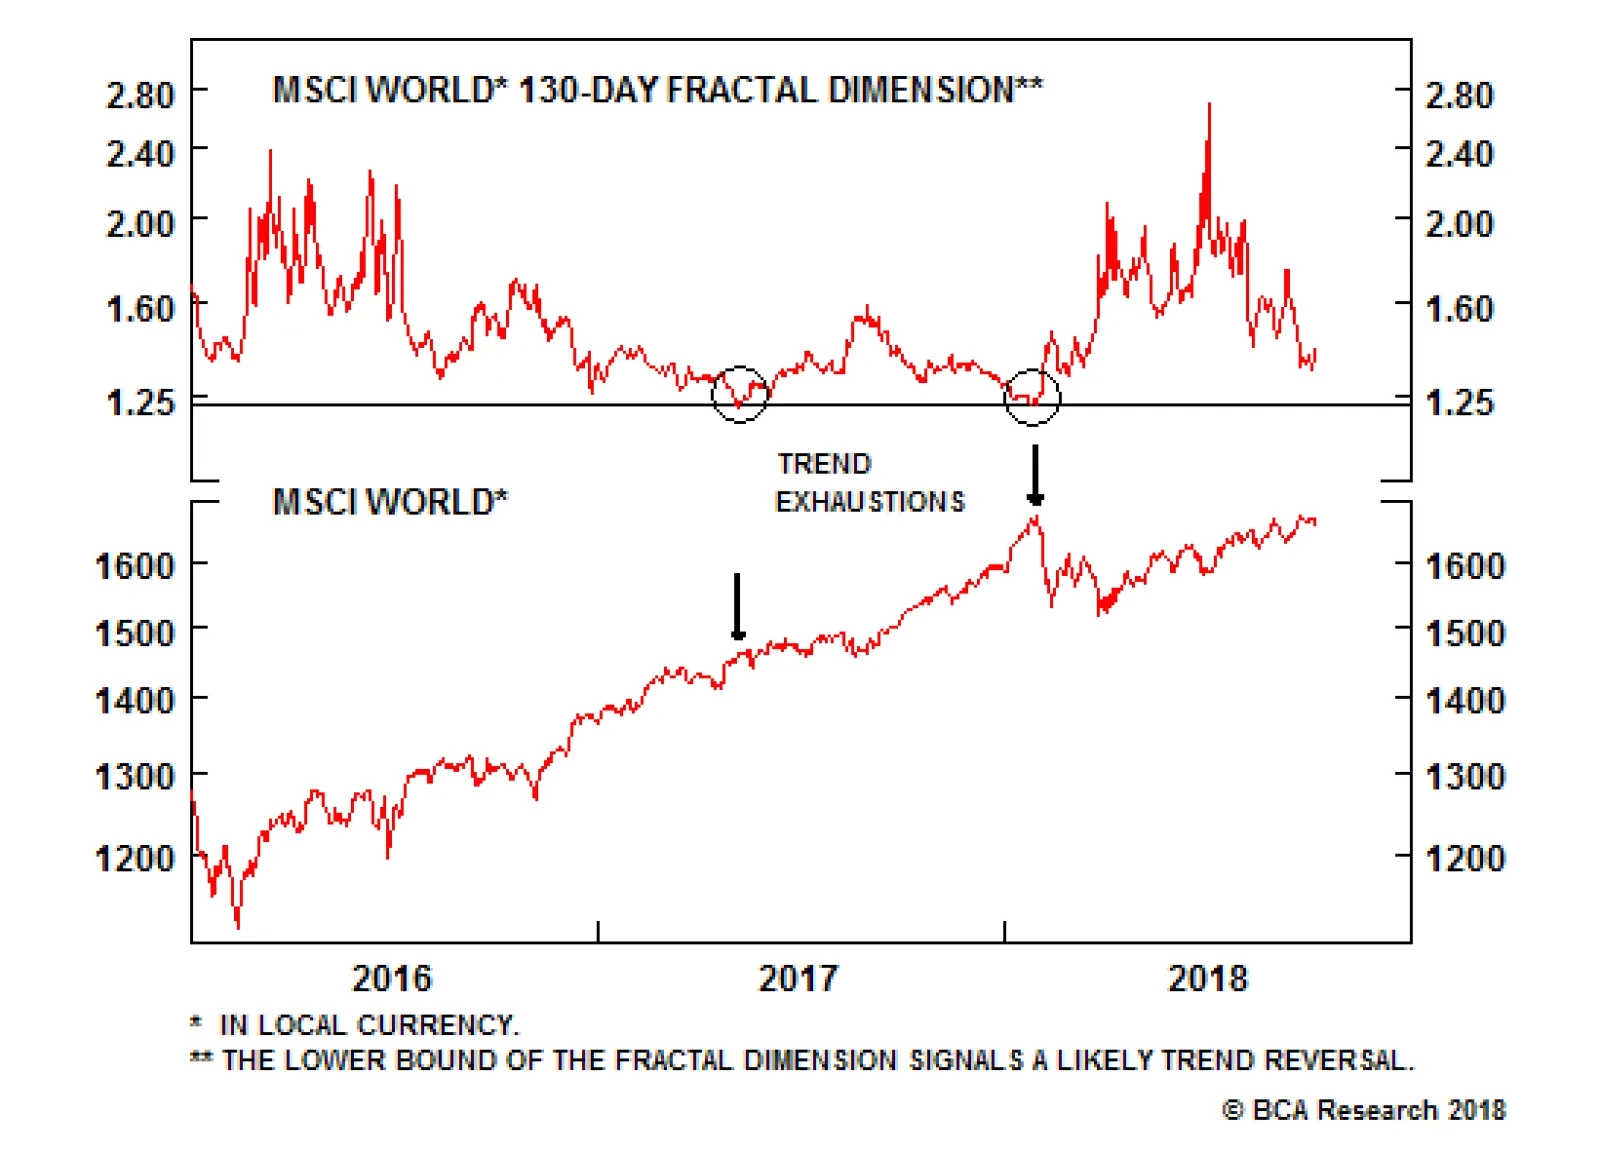
Second, the fractal dimension measure for the trade-weighted dollar shows that despite the recent phase of dollar strength that began in September, the dollar's uptrend is not yet ready to exhaust itself (Chart I-3). The fractal dimension is a measure of groupthink promoted by Dhaval Joshi, head of BCA's European Investment Strategy. It compares the short-term and long-term variance of any asset to gauge if long-term and short-term investors are holding the same positions. If they do, risks are high that a paucity of buyers (or sellers in bear markets) may develop, resulting in a trend reversal as all investors are already similarly positioned. This fractal dimension flagged a yellow card for the dollar in June, but it was only followed by the sideways move described above. Now that the dollar is gaining some vigor, the recent pickup in this indicator suggests that this rally can run further. Chart I-3No Groupthink In The Dollar
No Groupthink In The Dollar
No Groupthink In The Dollar
Third, while the dollar needed to digest some short-term overbought conditions, cyclical indicators like the Coppock Oscillator are still nowhere near overbought (Chart I-4, top two panels). By the spring of 2018, the dollar had reached massively oversold territory on a cyclical basis, and it is now in the midst of a powerful rebound. If history is any guide, once the Coppock Oscillator turns, it is likely to move much more than it has so far, indicating that the dollar rally has legs. However, the euro's Coppock Oscillator looks like it still possesses ample downside, as downdrafts never end at the current level of readings (Chart I-4, bottom two panels). Chart I-4Cyclical Oscillators Still Favor The USD
Cyclical Oscillators Still Favor The USD
Cyclical Oscillators Still Favor The USD
Bottom Line: Technical indicators are currently not arguing against the normal seasonal strength in the USD. The short-term overbought conditions present at the beginning of the summer have evaporated, the dollar's trading action does not show meaningful evidences of groupthink, and a key cyclical momentum measure has further upside. Short-Term Valuations: No Obstacle Here Either An additional factor that might prevent the dollar's normal seasonal strength from realizing itself is the current valuation picture. Here again, there is little to worry about. As Chart I-5 illustrates, our Fundamental Intermediate Term Model and our Intermediate-Term Timing Model do not show any mispricing in the USD. The dollar is trading in line with our two augmented interest rate parity valuation metrics - two indicators that have historically been useful in spotting potential periods of USD risk. Chart I-5No Evident Mispricing In The Dollar
No Evident Mispricing In The Dollar
No Evident Mispricing In The Dollar
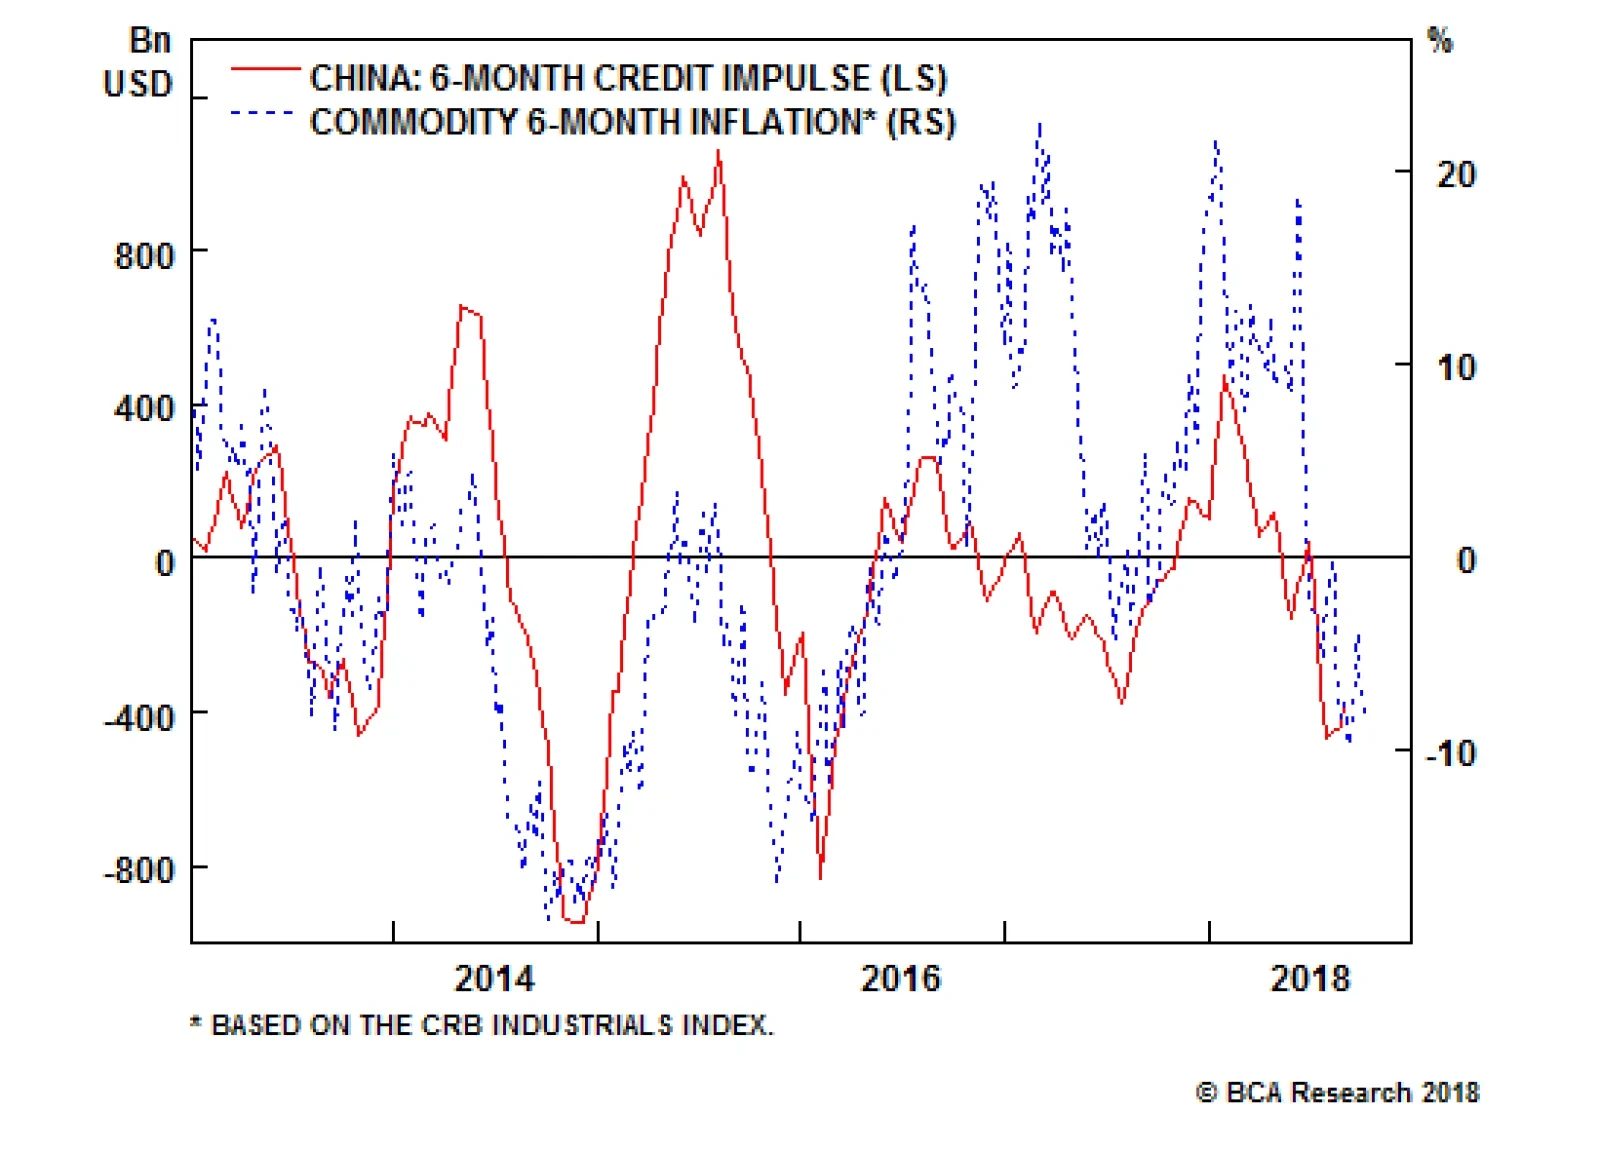
Economic And Financial Market Developments Still Support The Dollar With no danger for the dollar from a technical and valuation standpoint, economic and financial market developments will likely hold the key to the dollar's outlook. First, economic divergences remains fully at play. As Chart I-6 illustrates, the U.S. economy is handily outperforming the rest of the world as the ISM Manufacturing Index has not been dragged down by the weakness observed outside the U.S. Historically, the gap between the ISM and the world's PMI leads the dollar's gyrations as the greenback is ultimately the factor forcing U.S. and global growth to converge. This time around, the growth gap suggests that the dollar has a few more months of strength ahead of itself. Moreover, Arthur Budaghyan writes in BCA's Emerging Market Strategy service that China's deleveraging campaign will continue to hinder global export growth (Chart I-7) - a sector of the economy with little weight in the U.S. This means that the growth gap between the U.S. and the rest of the world may widen further. Chart I-6Economic Divergences Support The Dollar
Economic Divergences Support The Dollar
Economic Divergences Support The Dollar
Chart I-7China Deleveraging Points To Weaker Trade
China Deleveraging Points To Weaker Trade
China Deleveraging Points To Weaker Trade
Second, the U.S.'s economic strength may be a problem for a large swath of the global economy. It is often assumed that strong U.S. growth lifts global demand through exports, undoing some of China's negative impact in the process. However, this does not take into account that U.S. rates determine the global cost of capital. The U.S. economy is currently much stronger than the rest of the world, and the U.S. private sector is not as burdened by debt as is the case outside the U.S. (Chart I-8). This makes the U.S. more capable of handling higher interest rates than the rest of the world. As a result, this year, the rise in both 10-year Treasury yields and TIPS yields has been met with pain in assets levered to global growth, like the German DAX and EM stock prices, as well as EM and commodity currencies (Chart I-9). Chart I-8The U.S. Has A More Robust Balance Sheet
The U.S. Has A More Robust Balance Sheet
The U.S. Has A More Robust Balance Sheet
Chart I-9Higher U.S. Yields Hurt Assets Levered To Global Growth
Higher U.S. Yields Hurt Assets Levered To Global Growth
Higher U.S. Yields Hurt Assets Levered To Global Growth
This is in sharp contrast with the U.S. The market and the Federal Reserve are coming to grips with the reality that the U.S. neutral rate is increasing, courtesy of robust household balance sheets, strong capex intentions, rising inflationary pressures and a large dose of fiscal stimulus. Thus, despite the rise in interest rates, the U.S. yield curve has started to steepen anew, even as global asset markets have been suffering (Chart I-10). Fed Chairman Jerome Powell has even given his subtle acquiescence to this move. Indeed, last week he argued that the Fed's policy might still be quite accommodative as the neutral rate may be sitting well above the current level of the fed funds rate. Chart I-10The U.S. Yield Curve Is Steepening Anew
The U.S. Yield Curve Is Steepening Anew
The U.S. Yield Curve Is Steepening Anew
Third is the question of Italy. Italian yields continue to rise both in absolute terms and relative to German bunds. Some of this reflects the stress created by higher global real yields, which hurt the outlook for Italian growth and hence point toward a worsening debt load, which requires a higher risk premium in BTPs. But there is more to the widening in Italian spreads. Italy is setting its budget for next year, and is engaging in a war of words with Brussels. The Five Star Movement / Lega Nord Coalition wants to set a 2.4% of GDP deficit for 2019, much more than the previously agreed 0.8% penciled by the previous government this past spring. This is still within the 3% limit of the EU's Growth and Stability pact, but the European Commission and investors are concerned as Italy's public debt-to-GDP is already 133% - and this 2.4% deficit rests on extremely rosy growth assumptions. As a result, markets are punishing Italian bonds. This is a problem because when Italian yields rise, Italian banks suffer. Dhaval Joshi has argued in BCA's European Investment Strategy that a move in BTP yields to 4% could render the whole Italian banking system insolvent, as it would wipe out excess capital of EUR30 billion.1 Since the entire German, French, Spanish, Dutch, Austrian, Belgian, Greek, Irish and Portuguese banking systems still have low capital reserves, their combined EUR 479 billion exposure to Italy is fast becoming a Sword of Damocles. As a result, a war of words between Rome and Brussels - one that could last until December - could cause further tumult in European bank shares, and force the European Central Bank to stay on the defensive longer than it wishes to. This would hurt the euro and by symmetry, help the dollar. Bottom Line: Economic and financial market developments still support the dollar. The outperformance of U.S. growth relative to the rest of the world is likely to continue to be felt in the form of a stronger dollar in the coming months, especially as global exports remains negatively affected by China's deleveraging. Moreover, rising U.S. borrowing costs are so far having a limited impact on U.S. growth, but generating potent headwinds for activity outside the U.S. Finally, Italy is likely to remain a sore spot for Europe over the next two to three months, one that may weigh on the ECB's ability to provide any hawkish guidance this year. Risks To The View The view that the dollar can continue to rally is not without impediments. The first and most obvious one is that speculators have already aggressively bought the dollar (Chart I-11, top panel). This makes the greenback vulnerable to any unexpected improvement in global growth. Chart I-11Risks For The Dollar
Risks For The Dollar
Risks For The Dollar
The second impediment is that a temporary reprieve in the global growth slowdown could well be materializing as we speak. G10 economic surprises have regain some vigor, and the diffusion index of BCA's Global Leading Economic Indicator has been rebounding (Chart I-11, bottom two panels). The third risk is that the China Play Index we introduced 10 weeks ago is rebounding (Chart I-12). This indicator, based on AUD/JPY, Swedish industrial stocks denominated in dollars, iron ore prices, Brazilian stocks and EM high-yield bonds, is very sensitive to Chinese reflation, or at the very least to how investors expect Chinese reflation to evolve going forward. This may reflect the fact that the People's Bank of China has injected liquidity into the banking system by cutting the Reserve Requirement Ratio four times this year, or that local government borrowings have increased. Chart I-12Investors May Be Betting On Chinese Reflation
Investors May Be Betting On Chinese Reflation
Investors May Be Betting On Chinese Reflation
However, these three factors remain risks, not our base case. After all, net speculative positions in the dollar can stay elevated for extended periods, and the Chinese stimulus that is helping the China Play Index and maybe even the G10 surprise index still pales in comparison to the size of the aggregate deleveraging that is causing total social financing to weaken. Another risk to monitor is Fed Chairman Powell. The likelihood that he dials down his hawkish rhetoric on the elevated neutral fed funds rate in the coming weeks is significant. This could cause a temporary setback in Treasury yields and global rates - one that is likely to be welcomed by global risk assets but that may cause temporary indigestion for the dollar. Bottom Line: Three key risks could invalidate our thesis that the dollar strengthens this fall. They are: the large overhang of speculative longs in the greenback, a potential temporary stabilization in global growth, and markets pricing in Chinese stimulus. Additionally, Fed Chairman Powell may walk back some of his hawkish comments from last week, which would impact global bond yields and help global risk assets, but weigh on the dollar. Investment Implications Faced with this outlook, what should investors do? We continue to recommend holding a cyclically bullish dollar stance. Long DXY makes sense at this juncture, with upside toward 102 by Q1 2019, Implying a fall in EUR/USD below 1.10. However, the risks highlighted above are also non-negligible. This means that holding some hedges makes perfect sense. This summer, we recommended selling USD/CAD. As Chart I-13 illustrates, the loonie has been the best performing G10 currency - the only one that managed to eke out a gain against the greenback this summer (top panel of Chart I-13). This means that mean-reversion is not likely to be the CAD's friend going forward. It may thus not be the best instrument anymore to hedge against USD weakness. Instead, Chart I-13 proposes that the three currencies best placed to benefit from any mean reversion if the USD weakens are the SEK, the AUD, and especially the NZD. The NZD is extremely oversold now, which suggests that it could benefit greatly if the dollar were to experience any period of weakness. Moreover, the NZD has traditionally been highly levered to EM asset prices and Asian growth conditions. As a result, if the rebound in the China Play Index ends up hurting the USD, the NZD is likely to be the prime beneficiary. Chart I-13G10 Currency Returns
In Fall, Leaves Turn Red, The Dollar Turns Green
In Fall, Leaves Turn Red, The Dollar Turns Green
Moreover, the kiwi money markets are currently pricing in a 12% probability of interest rate cuts by the Reserve Bank of New Zealand over the coming four months. While a lack of inflation means that the environment is not propitious for the RBNZ to increase rates, a rate cuts seems farfetched: the Official Cash Rate remains well below the average level of growth experienced over the past three years, whether in nominal or real terms. In other words, monetary policy remains extremely accommodative, despite the fact that the output gap is closed and the unemployment rate stands below full employment (Chart I-14). Chart I-14The RBNZ Will Not Cut Rates
The RBNZ Will Not Cut Rates
The RBNZ Will Not Cut Rates
Finally, shorting EUR/JPY may well prove to be the best protection if the Fed's leadership guides bond yields lower. As Chart I-15 shows, EUR/JPY performs well when bond yield rise, which explains why this cross has managed to strengthen despite the recent weakness in EM asset prices this year. Hence, if a dollar correction is not driven by global growth converging upward toward the U.S., but instead is driven by the Fed backtracking from its recent hawkish rhetoric, then EUR/JPY will suffer considerably. Chart I-15Short EUR/JPY: A Hedge Against Falling Bond Yields
Short EUR/JPY: A Hedge Against Falling Bond Yields
Short EUR/JPY: A Hedge Against Falling Bond Yields
As a result, we recommend investors with long USD exposure hedge their bets by taking on a bit of long NZD/USD exposure and some short EUR/JPY exposure as well. Bottom Line: Since the seasonal and cyclical outlook is favorable to the greenback, it makes sense for investors to maintain a dollar-bullish bias in their portfolio. However, the tactical risks to the dollar created by a potential rebound in non-U.S. growth or a potentially dovish Fed are meaningful. As a result, some hedges should be maintained to mitigate net positive exposure to the dollar. We recommend buying NZD/USD and selling EUR/JPY in order to achieve optimal protection from these risk factors. Mathieu Savary, Vice President Foreign Exchange Strategy mathieu@bcaresearch.com 1 Please see European Investment Strategy Weekly Report, titled "Italy, Bond Vigilantes, And Bubbles", dated October 4, 2018, available at fes.bcaresearch.com Currencies U.S. Dollar Chart II-1USD Technicals 1
USD Technicals 1
USD Technicals 1
Chart II-2USD Technicals 2
USD Technicals 2
USD Technicals 2
Recent data in the U.S. has been mixed: The unemployment rate surprised positively, coming in at 3.7%. Moreover, initial jobless claims also surprised positively, coming in at 207 thousand. However, while nonfarm payrolls underperformed expectations, coming in at 134 thousand, this miss was compensated by important positive revisions to 270 thousand for August. DXY has risen by roughly 1.4% this week. Overall, we continue to be positive on the dollar, given that inflationary pressures in the U.S. will continue to put upward pressure on interest rates. Moreover, China is tightening monetary conditions, which will continue to act as a drag on global growth. This environment will benefit the green back until at least the beginning of 2019. Report Links: Policy Divergences Are Still The Name Of The Game - August 14, 2018 The Dollar And Risk Assets Are Beholden To China's Stimulus - August 3, 2018 Rhetoric Is Not Always Policy - July 27, 2018 The Euro Chart II-3EUR Technicals 1
EUR Technicals 1
EUR Technicals 1
Chart II-4EUR Technicals 2
EUR Technicals 2
EUR Technicals 2
Recent data in the euro area has been mixed: Retail sales yearly growth surprised to the upside, coming in at 1.8%. However, core inflation underperformed expectations, coming in at 0.9%. Finally, both the composite and manufacturing Markit PMI, also surprised negatively, coming in at 54.1 and 53.2 respectively. Rising U.S. yields as well as renewed concerns about Italy have lowered EUR/USD by roughly 2% this past couple of weeks. We are negative on the euro on a cyclical basis, given that euro area inflationary dynamics are tightly linked to global economic activity, which will likely be armed by China's monetary tightening. Thus, inflation, and consequently rates, will stay low in the euro area for the time being. Report Links: Will Rising Wages Cause An Imminent Change In Policy Direction In Europe And Japan? - October 5, 2018 Policy Divergences Are Still The Name Of The Game - August 14, 2018 Time To Pause And Breathe - July 6, 2018 The Yen Chart II-5JPY Technicals 1
JPY Technicals 1
JPY Technicals 1
Chart II-6JPY Technicals 2
JPY Technicals 2
JPY Technicals 2
Recent data in Japan has been positive: Machinery orders yearly growth outperformed expectations, coming in at 12.6%. Moreover, the leading economic Index also surprised to the upside, coming in at 104.4. Finally, overall household spending yearly growth also surprised to the upside, coming in at 2.8%. USD/JPY has been falling for the past week and a half. We are negative on the yen on a cyclical basis, given that YCC is likely to stay in place for the foreseeable. After all, Japanese inflation expectations remain moribund. Moreover, the expected negative fiscal shock next year will also weigh on aggregate demand. All of these factors, combined with slowing global growth will continue to widen rate differentials, which will create upside in USD/JPY. Report Links: Will Rising Wages Cause An Imminent Change In Policy Direction In Europe And Japan? - October 5, 2018 Rhetoric Is Not Always Policy - July 27, 2018 Updating Our Long-Term FX Fair Value Models - June 22, 2018 British Pound Chart II-7GBP Technicals 1
GBP Technicals 1
GBP Technicals 1
Chart II-8GBP Technicals 2
GBP Technicals 2
GBP Technicals 2
Recent data in the U.K. has been mixed: Manufacturing production yearly growth surprised to the upside, coming in at 1.3%. However, Halifax house prices yearly growth underperformed expectations, coming in at 2.5%. Finally, Markit Services PMI underperformed expectations, coming in at 53.9. GBP/USD has been flat since the middle of September. The European Union has been much more conciliatory than anticipated, causing the pound to rally. However, we will continue to watch the negotiations closely, given that very little geopolitical risk is currently priced into the pound at the moment, which means it will continue to be whipshawed with inevitable setbacks in the negotiations. We remain long GBP vol. Report Links: Updating Our Long-Term FX Fair Value Models - June 22, 2018 Inflation Is In The Price - June 15, 2018 Updating Our Intermediate Timing Models - May 18, 2018 Australian Dollar Chart II-9AUD Technicals 1
AUD Technicals 1
AUD Technicals 1
Chart II-10AUD Technicals 2
AUD Technicals 2
AUD Technicals 2
AUD/USD has fallen by roughly 2.5% over the past couple of weeks, mostly due to the spike in U.S. real yields and the fall in emerging market assets. We continue to be bearish on the Australian dollar, as the Australian economy is the most sensitive G10 currency to policy tightening in China. Moreover, the Australian economy has a very indebted household sectors, which makes it difficult for the RBA to hike rates in the current environment. Investors who wish to express this bearish view on the AUD can do so by shorting AUD/CAD, as the CAD will likely benefit from rising oil prices. Report Links: Policy Divergences Are Still The Name Of The Game - August 14, 2018 What Is Good For China Doesn't Always Help The World - June 29, 2018 Updating Our Long-Term FX Fair Value Models - June 22, 2018 New Zealand Dollar Chart II-11NZD Technicals 1
NZD Technicals 1
NZD Technicals 1
Chart II-12NZD Technicals 2
NZD Technicals 2
NZD Technicals 2
NZD/USD has fallen by nearly 3%. Overall, we are bearish the kiwi, as continued tightening by both the fed and Chinese authorities will keep putting pressure on risk assets like the NZD. Moreover, the momentum in volatility continues to be a negative sign for high yield currencies like NZD. That being said, once volatility momentum becomes negative high carry trades like NZD/CHF will prove to be attractive. Moreover, investors looking to hedge their long dollar positions should look to buy the NZD, as rate expectations in New Zealand have likely hit a bottom. Report Links: Updating Our Long-Term FX Fair Value Models - June 22, 2018 Updating Our Intermediate Timing Models - May 18, 2018 Value Strategies In FX Markets: Putting PPP To The Test - May 11, 2018 Canadian Dollar Chart II-13CAD Technicals 1
CAD Technicals 1
CAD Technicals 1
Chart II-14CAD Technicals 2
CAD Technicals 2
CAD Technicals 2
Recent data in Canada has been mixed: While the net change in employment outperformed expectations significantly, coming in at 63.3 thousand, the devil was in the detail; full time employment contracted by 17 thousand jobs. On the other hand, the participation rate also surprised to the upside, coming in at 65.4%. However, housing starts surprised negatively, coming in at 189 thousand. USD/CAD has gone up by roughly 1.2% the past 2 weeks. We are closing our short USD/CAD trade this week, as we think the tactical upside for the CAD is now limited. Investors looking to hedge their long dollar exposure should instead look to buy the kiwi. That being said we continue to be positive on the Canadian dollar against the Australian dollar, as oil will further outperform base metals. Report Links: Updating Our Long-Term FX Fair Value Models - June 22, 2018 Inflation Is In The Price - June 15, 2018 Rome Is Burning: Is It The End? - June 1, 2018 Swiss Franc Chart II-15CHF Technicals 1
CHF Technicals 1
CHF Technicals 1
Chart II-16CHF Technicals 2
CHF Technicals 2
CHF Technicals 2
Recent data in Switzerland has been negative: Headline inflation underperformed expectations, coming in at 1%. Moreover, the SVMW Purchasing manager's Index also surprised negatively, coming in at 59.7. Finally, real retail sales yearly growth also underperformed expectations, coming in at 0.3%. EUR/CHF has risen by roughly 1.7% this past two weeks. Overall, we are bearish on the franc on a long-term basis, as inflationary forces are too tepid in Switzerland for the SNB to move away from its ultra-dovish monetary policy. Moreover, the strength in the franc over the past few months will likely drive prices down, adding further fuel to the SNB's easy money campaign. Report Links: Updating Our Long-Term FX Fair Value Models - June 22, 2018 Updating Our Intermediate Timing Models - May 18, 2018 Value Strategies In FX Markets: Putting PPP To The Test - May 11, 2018 Norwegian Krone Chart II-17NOK Technicals 1
NOK Technicals 1
NOK Technicals 1
Chart II-18NOK Technicals 2
NOK Technicals 2
NOK Technicals 2
Recent data in Norway has been mixed: Headline and core inflation both outperformed expectations, coming in at 3.4% and 1.9% respectively. Moreover, manufacturing output growth also surprised to the upside, coming in at -0.1%. However, register unemployment surprised negatively, ticking up to 2.3%. USD/NOK has risen by roughly 1% the past couple of weeks, in spite of rising oil prices. We have long argued that USD/NOK is more sensitive to real rate differentials than to oil prices. Given that we expect real U.S. rates to have additional upside, we continue to be bullish on this cross. That being said, the NOK could outperform other commodity currencies like the AUD and the NZD, as the relative performance of oil in the commodity space will provide a cyclical lift to the NOK against these currencies. Report Links: Updating Our Long-Term FX Fair Value Models - June 22, 2018 Updating Our Intermediate Timing Models - May 18, 2018 Value Strategies In FX Markets: Putting PPP To The Test - May 11, 2018 Swedish Krona Chart II-19SEK Technicals 1
SEK Technicals 1
SEK Technicals 1
Chart II-20SEK Technicals 2
SEK Technicals 2
SEK Technicals 2
Recent data in Sweden has been mixed: Retail sales yearly growth outperformed expectations, coming in at 2%. Moreover, consumer confidence also surprised to the upside, coming in at 103.6. However, manufacturing PMI underperformed expectations, coming in at 55.2. USD/SEK has risen by roughly 2.7% the past couple of weeks. Overall, we are bullish on the krona on a long term basis, as monetary policy is too easy in Sweden given Sweden's current inflationary backdrop, which means that the path of least resistance for rates is up. Nevertheless, the policy tightening by Chinese authorities could continue to weigh on global growth. This means that the SEK could have some downside on a 3 to 6 month horizon. Report Links: Updating Our Long-Term FX Fair Value Models - June 22, 2018 Updating Our Intermediate Timing Models - May 18, 2018 Value Strategies In FX Markets: Putting PPP To The Test - May 11, 2018 Trades & Forecasts Forecast Summary Core Portfolio Tactical Trades Closed Trades
Next week, the U.S. calendar will be dominated by the CPI report on Wednesday, which will provide investors with insights on the state of inflationary pressures in the U.S. Additionally, the NFIB small business survey will be released on Tuesday. This will…
A bubble forms when value investors stop investing based on their valuation framework. At some point, nearly all the value investors have joined the momentum herd, yet, a few of them suddenly reverts to type, and begin focusing again on valuations and begin…