Global
Given that we believe the U.S. economy is not vulnerable to recession and that U.S. growth fundamentals will remain solid for the foreseeable future, the recent collapse in forward price-to-earnings (PE) ratios signal buying opportunities are likely near. …
Today’s Q3 estimate for U.S. GDP growth produced a better than expected headline number of 3.5% (versus 3.3%). The household sector looked good, as personal consumption surprised to the upside with 4.0% growth versus expectations of 3.3%. Final sales to…

The Great Recession and financial crisis cast a long shadow that will affect economies, policymakers and investors for years to come. The roots of the crisis are already well known. The first of a two-part series looks forward by examining the areas where we believe structural change has occurred related to the economy or financial markets. First, the financial crisis transformed the corporate bond market in several ways that heighten the risk for quality spreads in the next downturn. Debt and market liquidity are two key concerns. Corporate leverage will not cause the next recession. Nonetheless, when one does occur, corporate spreads in the U.S. and (to a lesser extent) the Eurozone will widen by more for any given degree of recession. This reflects a low interest coverage ratio, poor market liquidity, the downward trend in credit quality and covenant erosion. Second, the shock of the Great Recession and its aftermath appears to have affected the relationship between economic slack and inflation. Firms have been extra reluctant to grant wage gains. However, we argue that the "shell shock" effect will wane. The fact that inflation has been depressed for so long may actually cultivate the risk that inflation will surprise on the upside in the coming years. Investors should hold inflation-protection in the inflation swaps market, or by overweighting inflation-linked bonds versus conventional issues. Third, the events of the last decade have left a lasting impression on monetary policymakers. They will err on the side of allowing the economy to overheat and inflation to modestly overshoot the target in the major economies, despite signs of financial froth. The Fed will respond only with a lag to the current fiscally-driven surge in U.S. growth, leading to a boom/bust economic scenario. Central bankers will have no trouble employing unorthodox policies again in the future, and will be willing to push the boundaries even further during the next recession. Expect aggressive manipulation of the long-end of the yield curve when the time arrives to ease policy. We may also observe more coordination between monetary and fiscal policies. Fourth, global bond yields fell to unprecedented levels, reflecting both structural and cyclical headwinds to demand growth. A dismal productivity performance is another culprit. Productivity growth is poised to recover to some extent, while some of the growth headwinds have reached an inflection point. We do not expect nominal bond yields to return to pre-Lehman norms, and yields could even fall back to previous lows in the case of a recession. Nonetheless, we expect a yield pattern of higher lows and higher highs over the coming business cycles. The 10-year anniversary of the Lehman shock this autumn sparked an avalanche of analysis on the events and underlying causes of the Great Recession and financial crisis. It is a woeful story of greed, a classic bubble, inadequate regulation, new-fangled financial instruments, and a globalized financial system that spread the shock around the world. The crisis cast a long shadow that will affect economies, policymakers and investors for many years to come. The roots of the crisis are well known, so we will not spend any time going over well-trodden ground. Rather, this Special Report looks forward by examining the areas where we believe structural change has occurred related to the economy or financial markets. In Part I, we cover the corporate bond market, the inflation outlook, central bank policymaking and equilibrium bond yields. Part II will look at the debt overhang, systemic risk in the financial sector, asset correlations, the cult of equity and the rise of populism. While not an exhaustive list, we believe these are the key areas of structural change. (1) Corporate Bond Market: Leverage And Downgrade Risk The financial crisis transformed the corporate bond market in several ways that heighten the risk for quality spreads in the next downturn. Debt and market liquidity are two key concerns. An extraordinarily long period of extremely low interest rates was too much for corporate CEOs to pass up. However, because the durability of the economic recovery was so uncertain, it seemed more attractive to hand over the borrowed cash to shareholders than to use it to aggressively expand productive capacity. The ongoing equity bull market rewarded CEOs for the financial engineering, serving to create a self-reinforcing feedback loop. And so far, corporate bondholders have not policed this activity. The result is that the U.S. corporate bond market has grown in leaps and bounds since 2009 (Chart II-1A and Chart II-1B). The average duration of the Bloomberg Barclays index has also risen as firms locked in attractive financing rates. The same is true, although to a lesser extent, in the Eurozone. Chart II-1AU.S. BBB-Rated Share Rising...
U.S. BBB-Rated Share Rising...
U.S. BBB-Rated Share Rising...
Chart II-1B...Same In The Eurozone
...Same In The Eurozone
...Same In The Eurozone
Balance sheet health is obviously not the key driver of corporate bond relative returns at the moment. Nonetheless, investors will begin to worry about the growth outlook if interest rates continue to rise. The U.S. national accounts data suggest that interest coverage remains relatively healthy, but this includes large companies such as some of the FAANGs that have little debt and a lot of cash. The national accounts data are unrepresentative of the companies that are included in the Bloomberg Barclays corporate bond index, which are heavy debt issuers. To gain a clearer picture, we calculated a bottom-up Corporate Health Monitor (CHM) for a sample of U.S. companies that provides a sector and credit-quality composition that roughly matches the Bloomberg Barclay's index. The CHM is the composite of six critical financial ratios. Chart II-2 highlights that the investment-grade (IG) CHM has improved over the past two years due to the profitability sub-components. However, the debt/equity ratio has been in a steep uptrend. Interest coverage does not appear alarming by historical standards at the moment, but one can argue that it should be much higher given the extremely low average coupon on corporate bonds, and given that profit margins are extraordinarily high in the U.S. The rapid accumulation of debt has overwhelmed these other factors. Evidence of rising leverage is broadly based across sectors and ratings. Chart II-2U.S. IG Corporate Health
U.S. IG Corporate Health
U.S. IG Corporate Health
Unfortunately, the profit tailwind won't last forever. At some point, earnings growth will stall and this cycle's debt accumulation will start to bite in the context of rising interest rates. To gauge the risk, we estimate the change in the interest coverage ratio over the next three years for a 100 basis-point rise in interest rates across the corporate curve, taking into consideration the maturity distribution of the debt.1 For our universe of Investment-grade U.S. companies, the interest coverage ratio would drop from a little over 7 to under 6, which is close to the lows of the Great Recession (denoted as "x" in Chart II-3). Of course, the decline in interest coverage will be much worse if the Fed steps too far and monetary tightening sparks a recession. The "o" in Chart II-3 denotes the combination of a 100 basis-point interest rate shock and a mild recession in which the S&P 500 suffers a 25% peak-to-trough decline in EPS. The overall interest coverage ratio plunges close to all-time lows at 4½. Chart II-3Interest Coverage To Plunge...
Interest Coverage To Plunge...
Interest Coverage To Plunge...
These simulations imply that, for any given size of recession, the next economic downturn will have a larger negative impact on corporate health than in the past. Rating agencies have undertaken some downgrading related to shareholder-friendly activity, but downgrades will proliferate when the agencies realize that the economy is turning and the profit boom is over (Chart II-4). Banks will belatedly tighten lending standards, adding to funding pressure for the corporate sector. Chart II-4...And Ratings To Be Slashed
...And Ratings To Be Slashed
...And Ratings To Be Slashed
Fallen Angels The potential for a large wave of fallen angels means that downgrade activity will be particularly painful for corporate bond investors. The surge in lower-quality issuance has led to a downward trend in the average credit rating and has significantly raised the size of the BBB-rated bonds relative to the IG index and relative to the broader universe of corporate bonds including high yield (Chart II-5, and Chart II-1A).2 The downward trend in credit quality predates Lehman, but events since the Great Recession have likely reinforced the trend. Chart II-5Lower Ratings And Longer Duration
Lower Ratings And Longer Duration
Lower Ratings And Longer Duration
Studies show that bonds that get downgraded into junk status can perform well for a period thereafter, suggesting that investors holding a fallen angel should not necessarily sell immediately. Nonetheless, the process of transitioning from investment-grade to high-yield involves return underperformance as the spread widens. Poor market liquidity and covenant erosion will intensify pressure for corporate spreads to widen when the bear market arrives. Market turnover has decreased substantially since the pre-Lehman years, especially for IG (Chart II-6). The poor liquidity backdrop appears to be structural, reflecting regulation that has curtailed banks' market-making activity and prop trading, among other factors. Chart II-6Poor Market Liquidity
Poor Market Liquidity
Poor Market Liquidity
The Eurozone corporate bond market has also seen rapid growth and a deterioration in the average credit rating. Liquidity is an issue there as well. That said, the Eurozone corporate sector is less advanced in the leverage cycle than the U.S. Interest coverage ratios will fall during the next recession, but this will be concentrated among foreign issuers - domestic issuers are much less at risk to rising interest rates and/or an economic downturn.3 Bottom Line: Corporate leverage will not cause the next recession. Nonetheless, when one does occur, corporate spreads in the U.S. and (to a lesser extent) Eurozone will widen by more for any given degree of recession. Current spreads do not compensate for this risk. (2) Inflation Undershoot Breeds Overshoot Inflation in the U.S. and other developed economies has been sticky since the financial crisis. First, inflation did not fall as much in the recession and early years of the recovery as many had predicted, despite the worst economic contraction in the post-war period. Subsequently, central banks have had trouble raising inflation back to target. In the U.S., core PCE inflation has only recently returned to 2%. Several structural factors have been blamed, but continuing tepid wage growth in the face of a very tight labor market raises the possibility that the inflation-generating process has been fundamentally altered by the Great Recession. In other words, the relationship between slack in the labor market (or market for goods and services) and inflation has changed. In theory, inflation should rise when the economy's output is above its potential level or when the unemployment rate is below its full-employment level. Inflation should fall when the reverse is true. This means that the change (not the level) in inflation should be positively correlated with the level of the output gap or the labor market gap. Chart II-7 presents the change in U.S. core inflation with the output gap. Although inflation appears to have become less responsive to shifts in the output gap after 1990, it has been particularly insensitive in the post-Lehman period. Chart II-7The U.S. Phillips Curve: RIP?
The U.S. Phillips Curve: RIP?
The U.S. Phillips Curve: RIP?
One reason may be that the business sector was shell-shocked by the Great Recession and financial crisis to such an extent that business leaders have been more reluctant to grant wage gains than in past cycles. Equally-unnerved workers felt lucky just to have a job, and have been less willing to demand raises. Dampened inflation expectations meant that low actual inflation became self-reinforcing. We have some sympathy with this view. Long-term inflation expectations have been sticky at levels that are inconsistent with the major central banks meeting their inflation targets over the long term. This suggests that people believe that central banks lack the tools necessary to overwhelm the deflationary forces. The lesson for investors and policymakers is that, while unorthodox monetary policies helped to limit the downside for inflation and inflation expectations during and just after the recession, these policies have had limited success in reversing even the modest decline that did occur. That said, readers should keep in mind a few important points: One should not expect inflation to rise much until economies break through their non-inflationary limits. The major advanced economies have only recently reached that point to varying degrees; Inflation lags the business cycle (Chart II-8). This is especially the case in long 'slow burn' economic expansions, as we have demonstrated in previous research; and The historical relationship between inflation and economic slack has been non-linear. As shown in Chart II-9, U.S. inflation has tended to accelerate quickly when unemployment drops below 4½%. Chart II-8U.S. Inflation Lags The Cycle
November 2018
November 2018
Chart II-9A Kinked Phillips Curve
November 2018
November 2018
Shell Shock Is Fading We believe that the "shell shock" effect of the Great Recession on inflation will wane over time. Indeed, my colleague Peter Berezin has made the case that the fact that inflation has been depressed for so long actually cultivates the risk that inflation will surprise on the upside in the coming years.4 Central bankers have been alarmed by the economic and financial events of the last decade. They also cast a wary eye on Japan's inability to generate inflation even in the face of massive and prolonged monetary stimulus. Policymakers at the FOMC are determined to boost inflation and inflation expectations before the next economic downturn strikes. They are also willing to not only tolerate, but actively encourage, an overshoot of the 2% inflation target in order to ensure that long-term inflation expectations return "sustainably" to a level consistent with meeting the 2% target over the long term. In other words, the Fed is going to err on the side of too much stimulus rather than too little. This is an important legacy of the last recession (see below). Meanwhile, other structural explanations for low inflation are less powerful than many believe. For example, globalization has leveled off and rising tariff and non-tariff barriers will hinder important global supply chains. Our research also suggests that the rising industrial use of robots and the e-commerce effect on retail prices have had only a small depressing effect on U.S. inflation. Bottom Line: The Phillips curve relationship has probably not changed in a permanent way since Lehman went down. It is quite flat when the labor market is not far away from full employment, but the relationship is probably non-linear. As the unemployment rate drops further, the business sector will have no choice but to lift wages as labor becomes increasingly scarce. The kinked nature of the Phillips curve augments the odds that the Fed will eventually find itself behind the curve, and inflation will rise more than the market is expecting. The same arguments apply to the Bank of England and possibly even the European Central Bank. Gold offers some protection against inflation risk, but the precious metal is still quite expensive in real terms. Investors would be better off simply buying inflation-protection in the inflation swaps market or overweighting inflation-linked bonds over conventional issues. (3) Monetary Policy: Destined To Fight The Last War There are several reasons to believe that the shocking events of the crisis and its aftermath have left a lasting impression on monetary policymakers. Several factors suggest that they will err on the side of allowing the economy to overheat and inflation to modestly overshoot the target: Inflation Persistence: As discussed above, there is a greater awareness that it is difficult to lift both actual inflation and inflation expectations once they have fallen. Some FOMC members believe that long-term inflation expectations are still too low to be consistent with the Fed meeting its 2% inflation target over the long term. A modest inflation overshoot in this cycle would be beneficial, according to this view, in the sense that it would boost inflation expectations and thereby raise the probability that the FOMC will indeed meet its goals over the long term. It might also encourage some discouraged workers to re-enter the labor market. Some policymakers also believe that the Fed is not taking much of a risk by pushing the economy hard, because the Phillips curve is so flat. Zero Bound: Low inflation expectations, among other factors, have combined to dramatically reduce the level of so-called r-star - the short-term rate of interest that is neither accommodative nor restrictive in terms of growth and inflation. R-star is thought to be rising now, at least for the U.S., but it is probably still low by historical standards across the major economies. This increases the risk that policy rates will again hit the lower bound during the next recession, making it difficult for central banks to engineer a real policy rate that is low enough to generate faster growth.5 Fighting the Last War: Memories of the crisis linger in the minds of policymakers. The global economy came dangerously close to a replay of the Great Depression, and policymakers want to ensure that it never happens again. Some monetary officials have argued that a risk-based approach means that it is better to take some inflation risks to limit the possibility of making a deflationary policy mistake down the road. Fears that the major economies are now more vulnerable to deflationary shocks seem destined to keep central banks too-easy-for-too-long. Central bankers will also be quicker and more aggressive in responding when negative shocks arrive in the future. This applies more to the U.S., the U.K. and Japan than the European Central Bank, but even for the latter there has been a clear change in the monetary committee's reaction function since Mario Draghi took over the reins. Financial Stability Concerns Policymakers are also more concerned about financial stability. Pre-crisis, the consensus among the monetary elite was that financial stability should play second fiddle to the inflation target. It was felt that central banks should focus on the latter, and pay attention to signs of financial froth only when they affect the inflation outlook. In practice, this meant paying only lip service to financial excess until it was too late. It was difficult to justify rate increases when inflation was not threatening. It was thought that macro-prudential regulation on its own was enough to contain financial excesses. Today, policymakers see financial stability as playing a key role in meeting the inflation target. It is abundantly clear that a burst bubble can be highly deflationary. Some policymakers still believe that aggressive macro-prudential policies can be effective in directly targeting financial excesses. However, others feel there is no substitute for higher interest rates; as ex-Governor Jeremy Stein stated, interest rates get "in all the cracks". Moreover, the Fed does not regulate the shadow banking sector. The Fed is thus balancing concerns over signs of financial froth against the zero-bound problem and fears of the next deflationary shock. We believe that the latter will dominate their policy choices, because it will still be difficult to justify rate hikes to the public when there is no obvious inflation problem. In the U.S., this implies that the economic risks are skewed toward a boom/bust scenario in which the FOMC is slow to respond to a fiscally-driven late cycle mini-boom. Inflation and inflation expectations react with a lag, but a subsequent acceleration in both forces the Fed to aggressively choke off growth. Policy Toolkit Central bankers will be quite willing to employ their new-found policy tools again in the next recession. The new toolbox includes asset purchases, aggressive forms of forward guidance, negative interest rates, and low-cost direct lending to banks and non-banks in some countries. Policymakers generally view these tools as being at least somewhat effective, although some have argued that the costs of using negative interest rates have outweighed the benefits in Europe and Japan. The debate on how to deal with the zero-bound problem in the U.S. has focused on lifting r-star, including raising the inflation target, adopting a price level target, policies to boost productivity, and traditional fiscal stimulus. Nonetheless, ex-Fed Chair Yellen's comments at the Jackson Hole conference in 2016 underscored that it will be more of the same in the event that the zero bound is again reached - quantitative easing and forward guidance.6 No doubt, the major central banks will rely heavily on both of these tools in order to manipulate yields far out the curve. Forward guidance may be threshold-based. For example, policymakers could promise to keep the policy rate frozen until unemployment or inflation reaches a given level. Now that central bankers have crossed the line into unorthodox monetary policy and inflation did not surge, future policymakers will be willing to stretch the boundaries even further in the event of a recession. For example, they may consider price-level targeting, which would institutionalize inflation overshoots to make up for past inflation undershoots. It is also possible that we will observe more coordination between monetary and fiscal policies in the next recession. The combination of fiscal stimulus and a cap on bond yields would be highly stimulative in theory, in part by driving the currency lower. Japan has gone half way in this direction by implementing a yield curve control (YCC) policy. However, it has failed so far to provide any meaningful fiscal stimulus since the yield cap has been in place. It also appears likely that central bank balance sheets will not return to levels as a percent of GDP that existed before the crisis. An abundance of bank deposits at the central bank will help to satisfy a structural increase in the demand for cash-like risk-free assets. Maintaining a bloated balance sheet will also allow central banks to provide substantial amounts of reverse repos (RRPs) into the market, which should improve the functioning of money markets that have been impaired to some degree by regulation. We do not expect that a structural increase in central bank balance sheets will have any material lasting impact on asset prices or inflation. We believe that inflation will surprise on the upside, but not because central banks will continue to hold significant amounts of government bonds on their balance sheets over the medium term. Bottom Line: The implication is that the monetary authorities will have a greater tolerance for an overshoot of the inflation target than in the past. The Fed will respond only with a lag to the fiscally-driven surge in U.S. growth, leading to a boom/bust economic scenario. During the next recession, policymakers will rely heavily on quantitative easing and forward guidance to manipulate the yield curve (after the policy rate reaches the lower bound). (4) Bond Prices: Structural Factors Turning Less Bullish Perhaps the most dramatic and lasting impact of the GFC has been evident in the global bond market. Government yields fell to levels never before observed across the developed countries and have remained extremely depressed, even as the expansion matured and economic slack was gradually absorbed. Real government bond yields are still negative even at the medium and long parts of the curve in the Eurozone and Japan (Chart II-10). It is tempting to conclude that there has been a permanent shift down in global bond yields. Chart II-10Real Yields Still Depressed
Real Yields Still Depressed Real Yields Still Depressed
Real Yields Still Depressed Real Yields Still Depressed
Equilibrium bond yields are tied to the supply side of the economy. Potential GDP growth is the sum of trend productivity growth and the pace of expansion of the labor force. Equilibrium bond yields may fall below the potential growth rate for extended periods to the extent that aggregate demand faces persistent headwinds. The headwinds in place over the past decade include fiscal austerity, demographics, household deleveraging, increased regulation and lingering problems in the banking sector that limited the expansion of credit, among others. These headwinds either affect the desire to save or the desire to invest, the interplay of which affects equilibrium bond yields. Some of these economic headwinds predate 2007, but the financial crisis reinforced the desire to save more and invest less. Space limitations prevent a full review of the forces that depressed bond yields, but a summary is contained in Appendix 1 and we encourage interested readers to see our 2017 Special Report for full details.7 The Great Supply-Side Shortfall Falling potential output growth in the major advanced economies also helped to drag down equilibrium bond yields. The pace of expansion in the global labor force has plunged from 1¾% in 2005, to under 1% today (Chart II-11). The labor force has peaked in absolute terms in the G7, and is already shrinking in China. Chart II-11Slower Labor Force Expansion...
Slower Labor Force Expansion...
Slower Labor Force Expansion...
Productivity growth took a dramatic turn for the worst after 2007 (Chart II-12). The dismal productivity performance is not fully understood, but likely reflected the peaking in globalization, increased regulation and the dramatic decline in capital spending relative to GDP. The latter was reflected in a collapse in the growth rate of the global capital stock (Chart II-13). In the U.S., for which we have a longer history of data, growth in the capital stocks has lead shifts in productivity growth with a 3-year lag. Firms have also been slower to adopt new technologies over the past decade. Chart II-12...And Lower Productivity
November 2018
November 2018
Chart II-13Productivity And Investment
Productivity And Investment
Productivity And Investment
The resulting impact on the level of GDP today has been nothing short of remarkable. The current IMF estimate for the level of potential GDP in 2018 is 10% lower than was projected by the IMF in 2008 (Chart II-14). There has been a similar downgrading of capacity in Europe, Japan and the U.K. Actual GDP has closed the gap with potential GDP to varying degrees in the major countries, but at a much lower level than was projected a decade ago. Paul Krugman has dubbed this the "Great Shortfall". Chart II-14A Permanent Loss Of Output
A Permanent Loss Of Output
A Permanent Loss Of Output
The Great Shortfall was even greater with respect to capital spending. For 2017, the IMF estimates that global investment was more than 20% below the level implied by the pre-crisis trend (Chart II-15). Reduced credit intermediation, from a combination of supply and demand factors, was a significant factor behind the structural loss of economic capacity according to the IMF study.8 Chart II-15Permanent Scars On Capital Spending
Permanent Scars On Capital Spending
Permanent Scars On Capital Spending
By curtailing the business investment relative to GDP for a prolonged period, major economic slumps can have a permanent effect on an economy's long-term prospects. The loss of output since the financial crisis will never be regained. That said, bond yields in theory are related to the growth rate of productivity, not its level. The IMF report noted that there may even be some long-lasting effects on the growth rate of productivity. The crisis left lingering scars on future growth due to both reduced global labor force migration and fertility rates. The latter rose in the decade before the crisis in several advanced economies, only to decline afterward. Households postponed births in the face of the economic and financial upheaval. The IMF argues that not all of the decline in fertility rates will be reversed. An Inflection Point In Global Bond Yields On a positive note, the pickup in business capital spending in the major countries in recent years implies an acceleration in the growth rate of the capital stock and, thus, productivity. In the U.S., this relationship suggests that productivity growth could rise by a percentage point over the coming few years (Chart II-13). This should correspond to a roughly equivalent rise in equilibrium bond yields. Moreover, some of the other structural factors behind ultra-low interest rates have waned, while others have reached an inflection point. For example, the age structure of world population is transitioning from a period in which aging added to the global pool of savings to one in which aging will begin to drain that pool as people retire and begin to deplete their nest eggs. Household savings rates will trend sharply lower in the coming years. Again, we encourage readers to read the 2017 Special Report for a full account of the structural factors that are shifting in a less bond-bullish direction. QE Reversal To Weigh On Bond Prices And let's not forget the unwinding of central bank balance sheets. The idea that central bank asset purchases on their own had a significant depressing effect on global bond yields is controversial. Some argue that the impact on yields occurred more via forward guidance; quantitative easing was a signal to markets that the central bank would stay on hold for an extended period, which pulled down yields far out the curve. This publication believes that QE had a meaningful impact on global bond yields on its own (Chart II-16). Nonetheless, either way, the Fed is now shrinking its balance sheet and the European Central Bank will soon end asset purchases. This means that the private sector this year is being forced to absorb a net increase in government bonds available to the private sector for the first time since 2014 (Chart II-17). Investors may demand juicier yields in order to boost their allocation to fixed-income assets. Chart II-16Reverse QE To Weigh On Bonds
Reverse QE To Weigh On Bonds
Reverse QE To Weigh On Bonds
Chart II-17Private Investors Will Have To Buy More
November 2018
November 2018
We are not making the case that real global bond yields are going to quickly revert to pre-Lehman averages. Global yields could even drop back to previous lows in the event of another recession. Nonetheless, from a long-term perspective, current market expectations suggest that investors still have an overly benign view on the outlook for yields. For example, implied real short-term rates remain negative until 2027 in the Eurozone, while they stay negative out to 2030 in the U.K. (Chart II-18). The implied path of real rates in the U.S. looks more reasonable, but there is still upside potential. Moreover, there is room for the inflation expectations component of nominal yields to shift up, as discussed above. Chart II-18Real Yields Still Too Low
Real Yields Still Too Low
Real Yields Still Too Low
Another way of making this point is shown in Chart II-19. The market expects the 10-year Treasury yield in ten years to be only slightly above today's spot yield, which itself is still very low by historical standards. Market expectations are equally depressed for the 5-year/5-year forward rate for the U.S. and the other major economies. Chart II-19Market Expectations Still Low
Market Expectations Still Low
Market Expectations Still Low
Bottom Line: Global bond yields fell to unprecedented levels due to a combination of cyclical and structural factors. The bond-bullish structural factors were reinforced by shifts in desired savings and business investment as a result of the Great Recession and financial crisis. Some of these structural factors will linger in the coming years, but others are shifting in a less bond-bullish direction. We do not expect nominal bond yields to return to pre-Lehman norms, and yields could even return close to previous lows in the case of a recession. Nonetheless, we expect a yield pattern of higher lows and higher highs over the coming business cycles. Mark McClellan Senior Vice President The Bank Credit Analyst Appendix 1: Key Factors Behind The Decline In Equilibrium Global Bond Yields The so-called Global Savings Glut has been a bullish structural force for bonds for the past couple of decades. A key factor is population aging in the advanced economies. Ex-ante desired savings rose as baby boomers entered their high-income years. China became a major source of global savings after it joined the WTO, and its large trade surplus was recycled into the global pool of savings. A slower pace of labor force growth in the developed countries resulted in a permanently lower level of capital spending relative to GDP. Slower consumer spending growth, as a result of a more moderate expansion in the working-age population, meant a reduced appetite for new factories, malls, and apartment buildings. The integration of the Chinese and Eastern European workforces into the global labor pool during the 1990s and 2000s resulted in an effective doubling of global labor supply in a short period of time. The sudden abundance of cheap labor depressed real wages from what they otherwise would have been, thus incentivizing firms to use more labor and less capital at the margin. The combination of slower working-age population growth in the advanced economies and a surge in the global labor force resulted in a decline in desired global capital spending. The increase in ex-ante savings and reduction in ex-ante capital spending resulted in a substantial drop in equilibrium global interest rates. The wave of cheap labor also aggravated the trend toward greater inequality in the advanced economies and the downward trend in labor's share of the income pie. A positive labor supply shock should benefit global living standards in the long run, but the adjustment costs related to China's integration into the global economy imposed on the advanced economies were huge and long-lasting. The lingering adjustment phase contributed to greater inequality in the major countries. Management was able to use the threat of outsourcing to gain the upper hand in wage negotiations. Moreover, technology appears to be resulting in faster, wider and deeper degrees of hollowing-out than in previous periods of massive technological change. The result has been a rise in the share of income going to high-income earners in the Advanced Economies, at the expense of low- and middle-income earners. This represents a headwind to growth that requires lower interest rates all along the curve. In other words, firms in the developed world either replaced workers with machinery in areas where technology permitted, or outsourced jobs to lower-wage countries in areas that remained labor-intensive. Both trends undermined labor's bargaining power, depressed labor's share of income, and contributed to inequality. 1 We make the simplifying assumptions that companies do not issue any more debt over the three years, and that EBIT is unchanged, in order to isolate the impact of higher interest rates. 2 The average credit rating for the U.S. is unavailable before 2000 in the Bloomberg Barclays index. However, other data sources confirm the long-term downward trend. 3 Please see The Bank Credit Analyst Special Report "Leverage And Sensitivity To Rising Rates: The Eurozone Corporate Sector," dated May 31, 2018, available at bca.bcaresearch.com 4 Please see Global Investment Strategy Special Reports "1970s-Style Inflation: Could It Happen Again? (Part 1)," dated August 10, 2018 and "1970s-Style Inflation: Could It Happen Again? (Part 2)," dated August 24, 2018, available at gis.bcaresearch.com 5 The lower bound is zero in the U.S., but is in negative territory for those central banks willing to impose negative rates on the banking sector. 6 For more background on the zero bound debate, the usefulness of a large central bank balance sheet and ways to lift r-star, please see The Bank Credit Analyst Special Report "Herding Cats At the Fed," dated October 2016, available at bca.bcaresearch.com 7 Please see The Bank Credit Analyst Special Report "Beware Inflection Points In The Secular Drivers Of Global Bonds," dated April 27, 2017, available at bca.bcaresearch.com 8 The Global Economic Recovery 10 Years After the 2008 Financial Meltdown. IMF World Economic Outlook, October 2018.
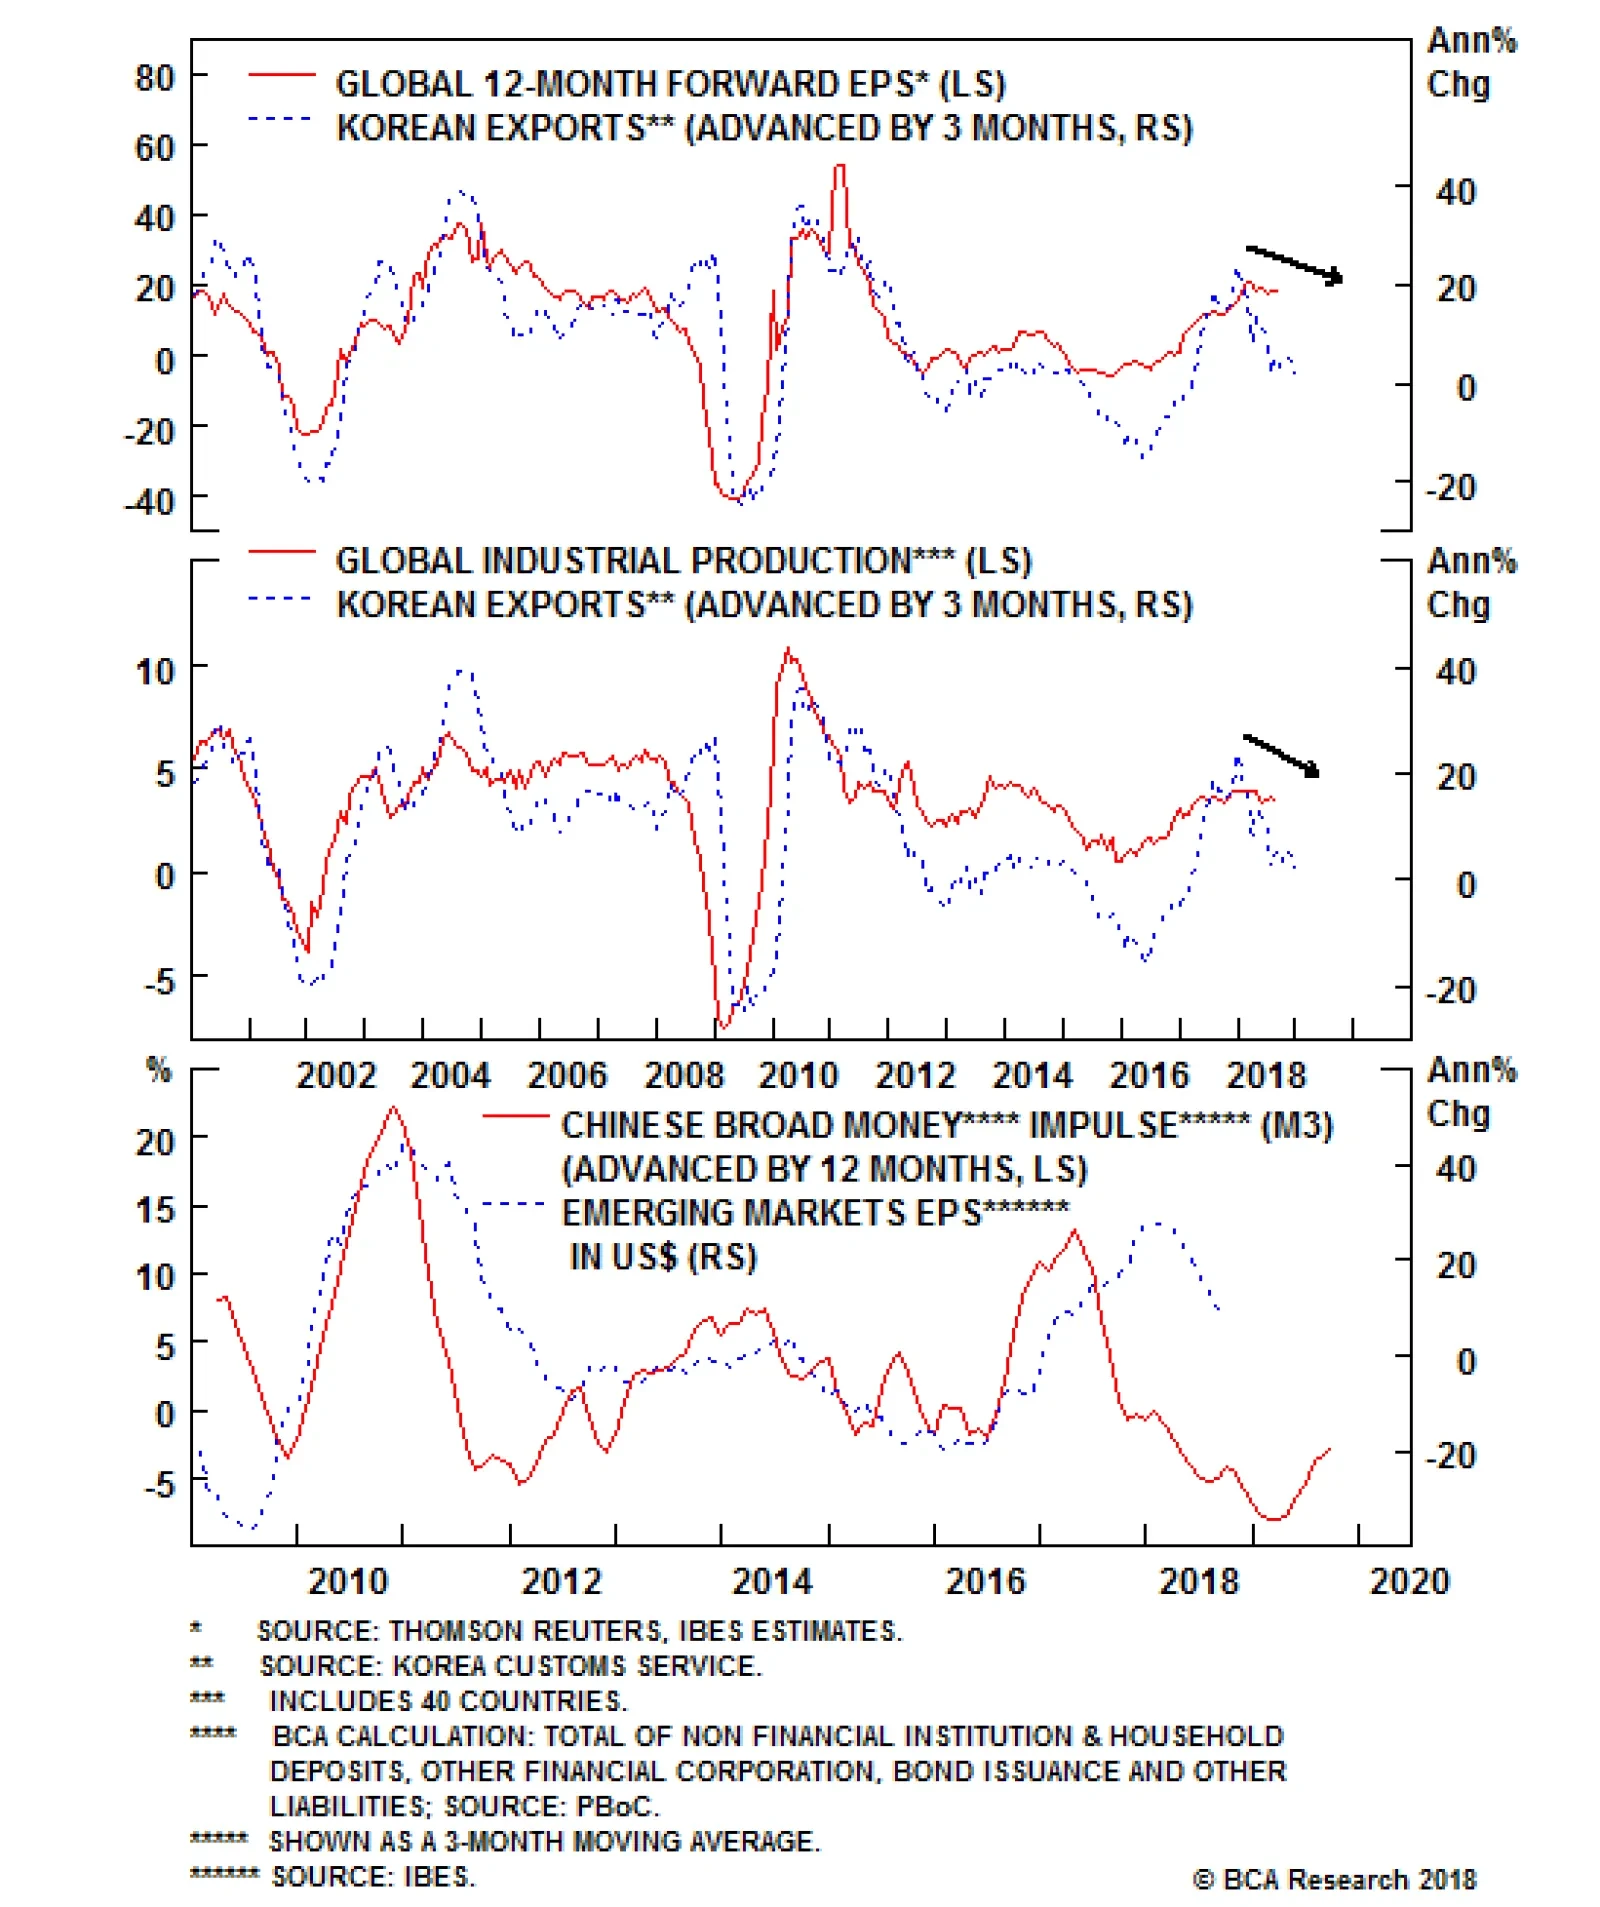
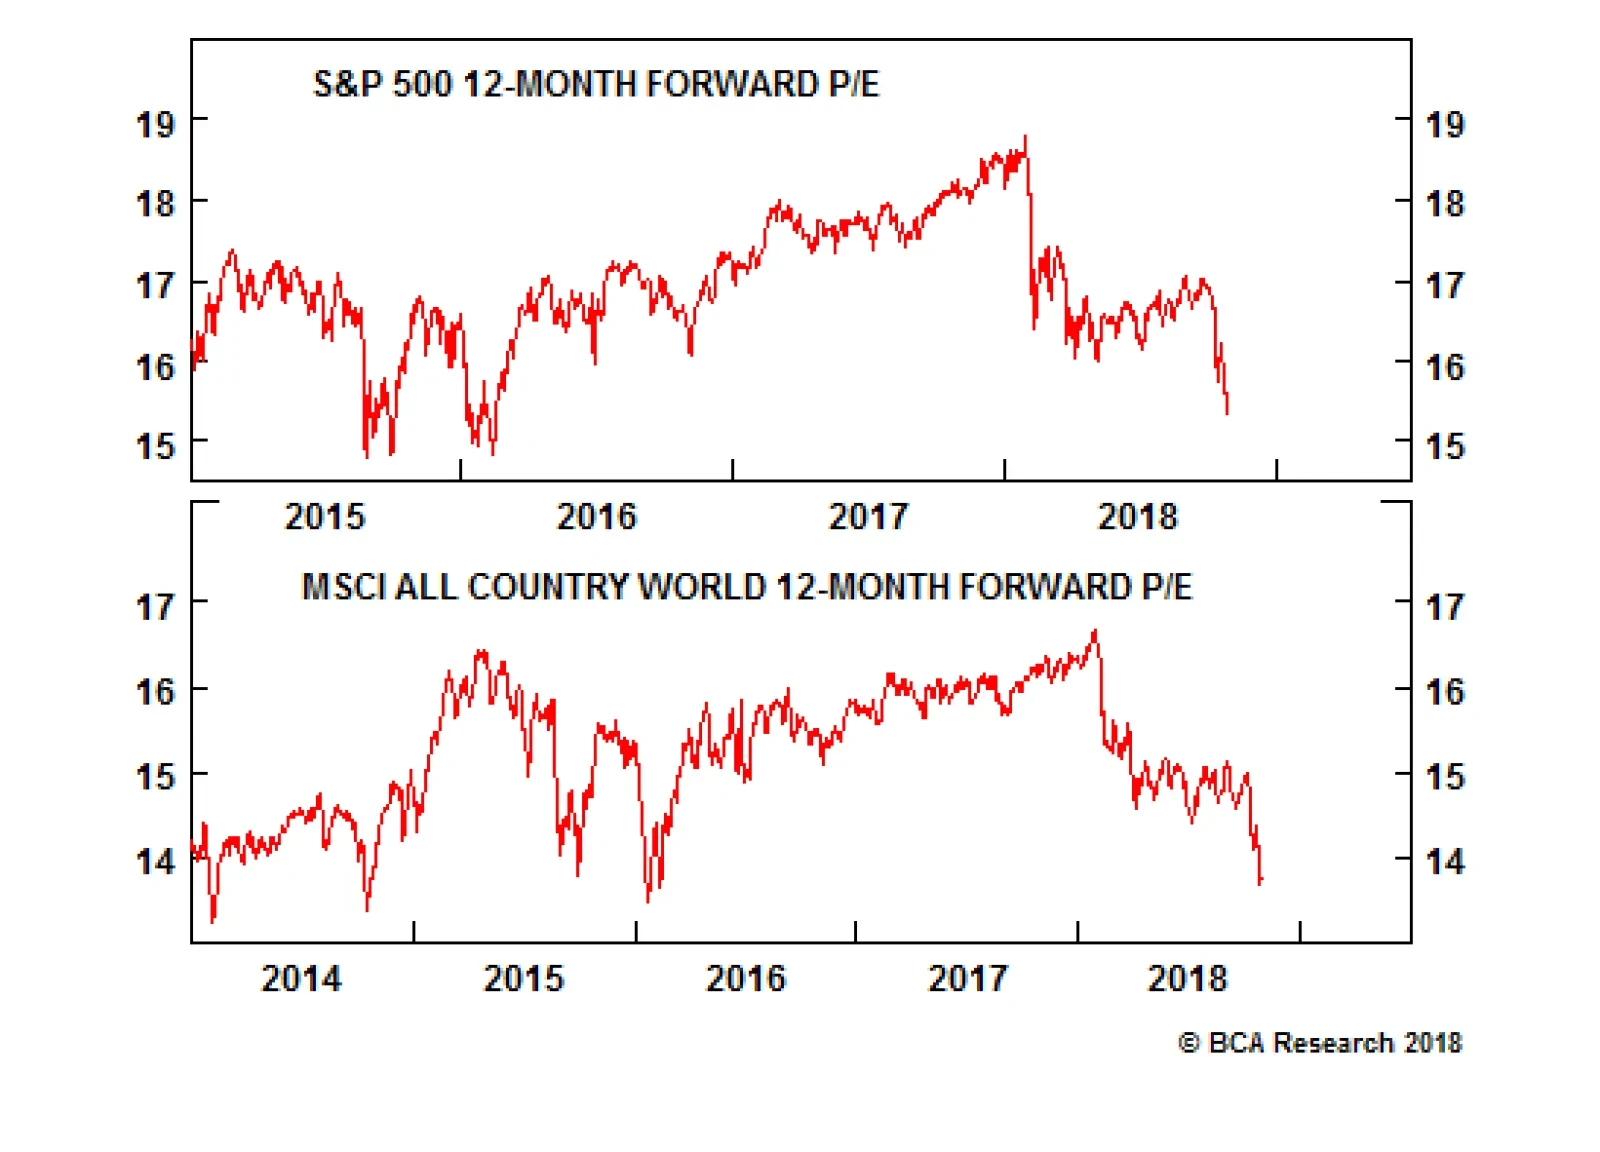
There are a plethora of indicators to gauge the health of the global economy. Korean export growth is one that we like at BCA. Historically, this indicator has been a harbinger for global profit growth and global industrial production. Please see the great…
The anchor of valuation analysis is the deviation in price from fair value. By deduction, the anchor of valuation analysis is fair value, since the actual deviation in price will be skewed by the fair value estimate, whereas fair value is less likely to be…
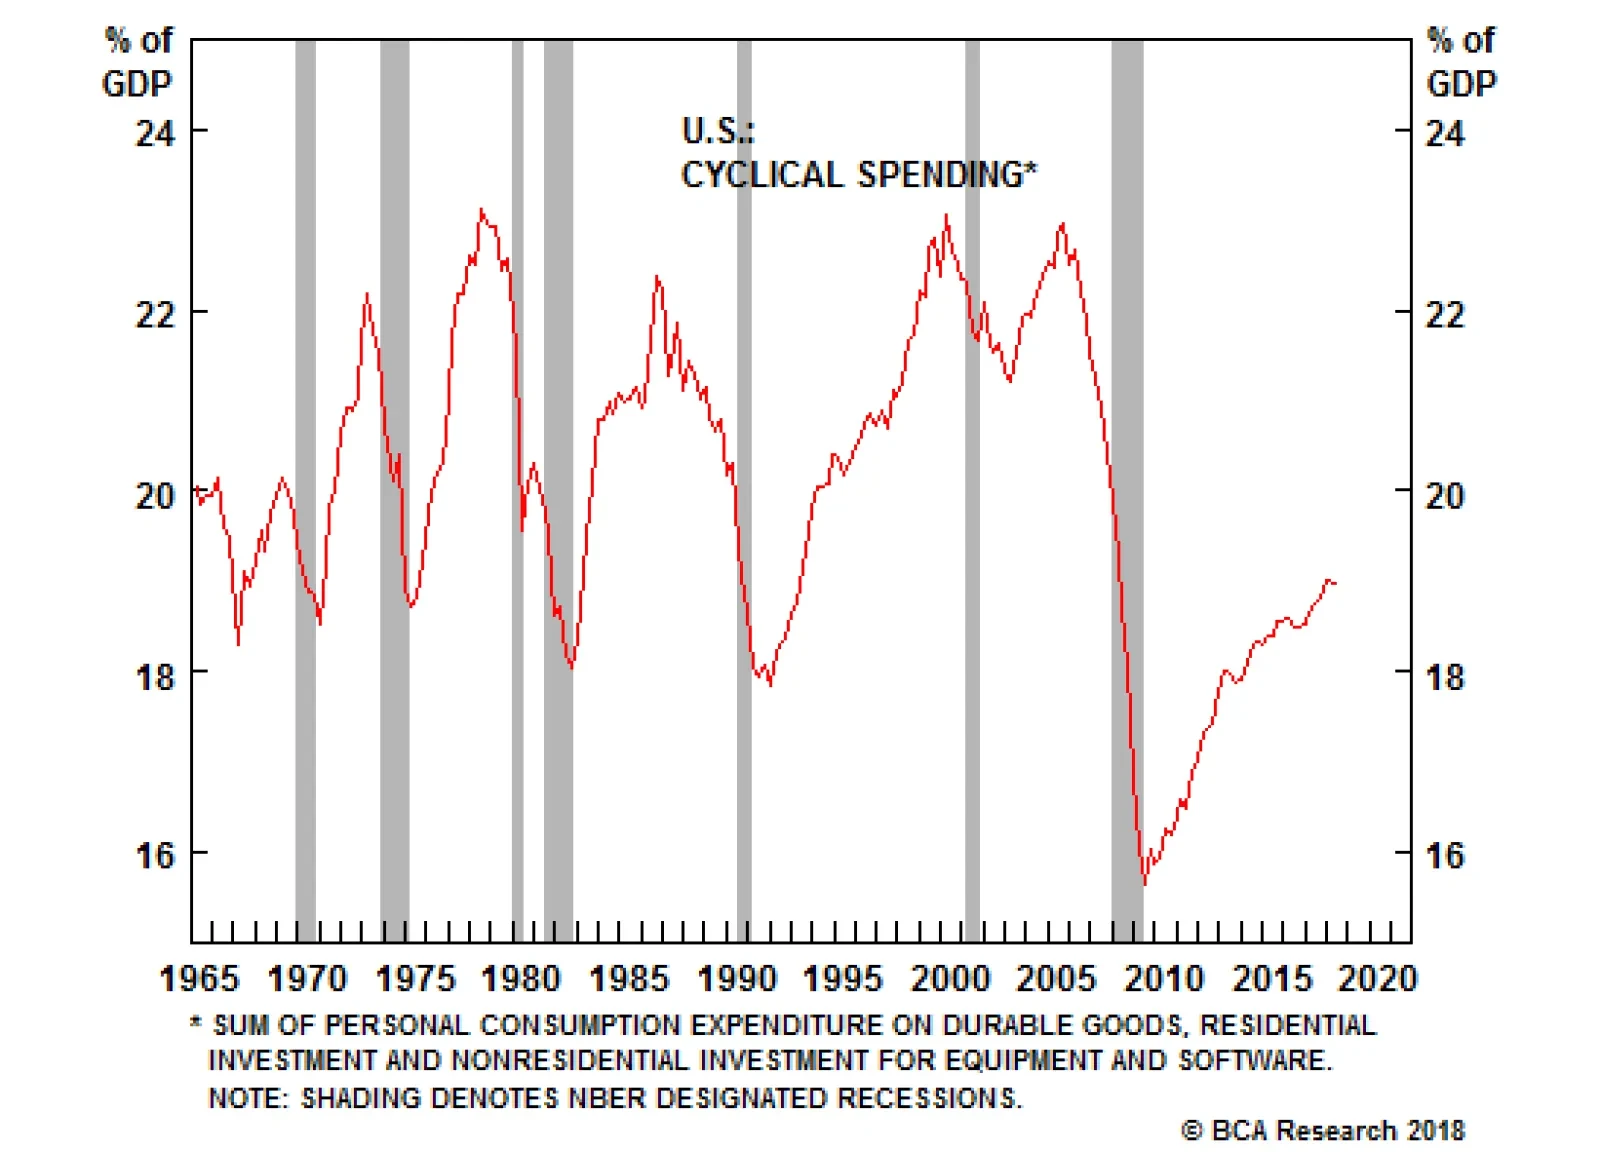
As our U.S. strategists have previously highlighted, the U.S. business cycle is not showing classic signs of leaning toward retirement (i.e., recession): U.S. cyclical spending is low relative to GDP; U.S. ISM and LEI data are strong; and real rates are low. …
I just spent the past three weeks meeting clients, teaching a seminar in geopolitics and investing, and speaking at conferences through the U.S. South West, South, and North West, along with Western Canada and three cities in Australia. I have many takeaways…
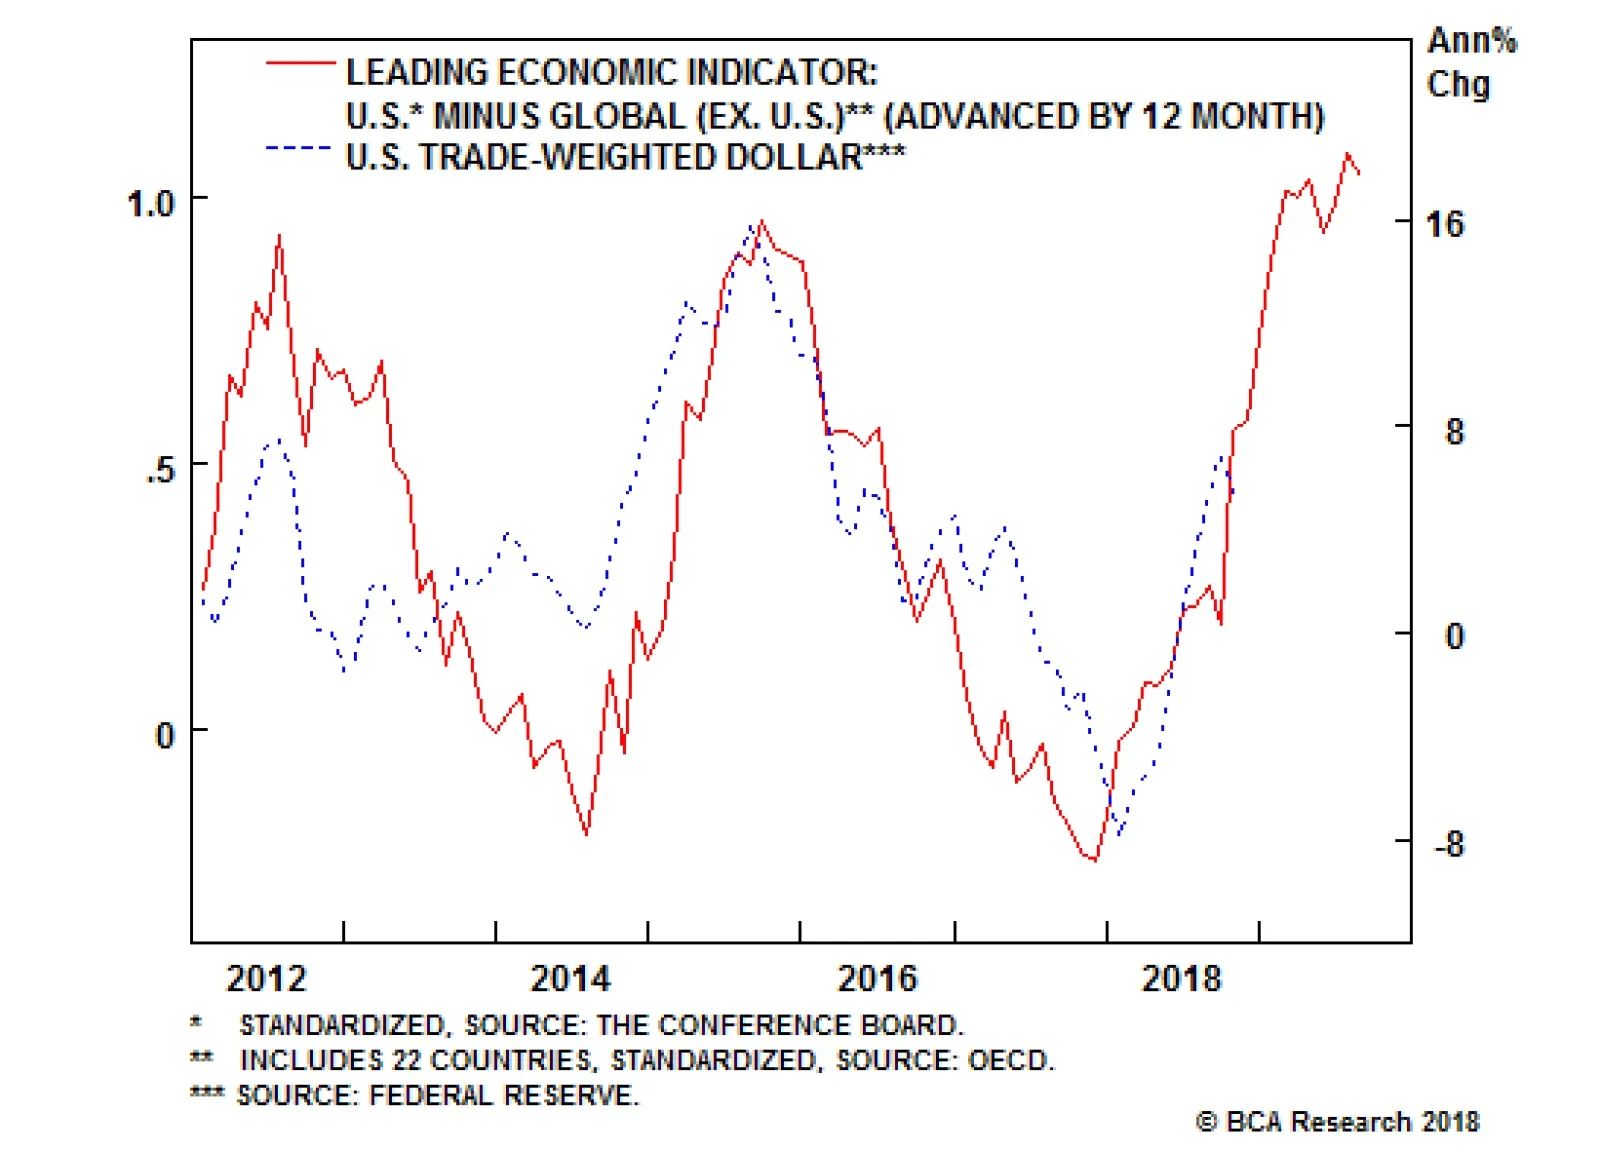
Highlights Duration: Foreign economic growth continues to diverge negatively from growth in the United States. The resulting upward pressure on the U.S. dollar will eventually drag U.S. growth down, and could temporarily threaten the cyclical uptrend in Treasury yields. But so far there is no evidence that dollar strength is too much for the U.S. economy to handle. Investors should maintain below-benchmark duration until signs of contagion are more apparent. Yield Curve: A reading of the macro drivers of the yield curve suggests that the slope of the curve will not steepen or flatten dramatically during the next 6-12 months. In this environment, trades that are long the belly of the curve and short a duration-matched barbell consisting of the short and long ends will profit, due to extremely attractive valuation. We currently recommend going long the 7-year bullet and short the 1/20 barbell. Feature If investors were already worried about the impact of restrictive Fed policy on credit spreads and equities, the minutes from September's FOMC meeting - released last Wednesday - did nothing to calm their nerves. The minutes revealed that "a few participants expected that policy would need to become modestly restrictive for a time" while an additional "number" of participants "judged that it would be necessary to temporarily raise the federal funds rate above their assessments of its longer-run level." There is a small distinction between the "few" participants who expect that a fed funds rate above the estimated longer-run neutral level of 3% will be necessary because restrictive monetary policy will be warranted and the "number" of participants who think that the fed funds rate will move above 3% without policy turning restrictive. However, the main takeaway for investors should be that a large portion of the committee expects that rate hikes will continue until the fed funds rate is at least above 3%. In last week's report we explored the risk that higher yields lead to an excessive tightening of financial conditions and actually sow the seeds of their own decline.1 But we do not view that as the greatest threat to our recommended below-benchmark portfolio duration stance. The biggest risk to that view comes from the ongoing divergence between strong U.S. and weak foreign economic growth. No Contagion... Yet Chart 1 shows that, since 1993, every time our Global (ex. U.S.) Leading Economic Indicator (LEI) has fallen below zero, the U.S. LEI has eventually followed. But while the Global (ex. U.S.) LEI has now been below zero for nine consecutive months, there is so far no evidence of contagion into the United States. The resilience of the U.S. economy probably explains why the September FOMC minutes only briefly mentioned the risk from weak foreign growth. Chart 1U.S. And Foreign Growth Continue To Diverge
U.S. And Foreign Growth Continue To Diverge
U.S. And Foreign Growth Continue To Diverge
From the minutes:2 The divergence between domestic and foreign economic growth prospects and monetary policies was cited as presenting a downside risk because of the potential for further strengthening of the U.S. dollar... But: Participants generally agreed that risks to the outlook appeared roughly balanced. The concern is that, much like in the 2014-16 period, the divergence in growth between the U.S. and the rest of the world puts so much upward pressure on the dollar that it eventually drags U.S. growth and bond yields lower. But despite this year's 4.6% appreciation in the trade-weighted dollar, we have yet to see any impact on our Fed Monitor and Treasury yields remain in an uptrend (Chart 2). This suggests that we have not yet reached peak divergence between U.S. and foreign growth. Further divergence and dollar strength is necessary before the U.S. economy is negatively impacted. Chart 2More $ Strength Required
More $ Strength Required
More $ Strength Required
The reason why the dollar's recent appreciation has not yet exerted a discernible impact on the U.S. economy might be because overall global GDP growth is on a more solid footing than it was in 2014-16 (Chart 3). The IMF forecasts that global GDP growth will be 3.7% in 2018 and 2019, compared to 3.5% in 2015. Meanwhile, the moderation in Eurozone growth represents a decline from lofty 2017 GDP growth of 2.4%. Even in emerging markets, where the global growth slowdown is most apparent, the IMF is still forecasting GDP growth of 4.7% for both 2018 and 2019, a far cry from the 4.3% seen in 2015 (Chart 3, bottom panel). Chart 3Global Growth Stronger Than 2014-16
Global Growth Stronger Than 2014-16
Global Growth Stronger Than 2014-16
Of course, IMF forecasts can always change, and they likely will be revised lower if current trends continue. However, the key point for bond investors is that the global economy is in much better shape than it was between 2014 and 2016. This means that non-U.S. growth needs to see further significant weakness before the uptrend in U.S. Treasury yields is threatened. Bottom Line: Foreign economic growth continues to diverge negatively from growth in the United States. The resulting upward pressure on the U.S. dollar will eventually drag U.S. growth down, and could temporarily threaten the cyclical uptrend in Treasury yields. But so far there is no evidence that dollar strength is too much for the U.S. economy to handle. Investors should maintain below-benchmark duration until signs of contagion are more apparent. Can Uncertainty Steepen The Yield Curve? The yield curve has steepened somewhat during the past few weeks, the result of much higher yields at the long-end of the curve and short-end yields that have been roughly unchanged. We think Fed communication has been an important catalyst for this curve action. Specifically, the Fed's deliberate attempt to introduce uncertainty around its estimates of the neutral fed funds rate.3 Bond investors are finally getting the message that the Fed's median forecast of a 3% longer-run fed funds rate is not written in stone. Depending on the economic outlook, the funds rate could peak for the cycle at a level that is well above or below 3%. Given the recent spate of strong U.S. economic data, the market is starting to discount a peak that is above 3%, no matter what median forecast appears in the Fed's dots. This raises the question of whether a further un-anchoring of long-dated yields could occur. Is it possible that the yield curve will continue to steepen, even with the Fed lifting short rates at a gradual pace of 25 basis points per quarter? Below, we review a few different macro drivers of the yield curve and conclude that neither a large steepening nor large flattening is likely during the next 6-12 months. Nominal GDP Growth One useful rule-of-thumb for when monetary policy turns restrictive is when the 10-year Treasury yield exceeds the rate of growth in nominal GDP. In the past, a 10-year yield above the rate of growth in nominal GDP has coincided with downward pressure on core inflation (Chart 4). With that in mind, we note that nominal GDP has grown by 5.44% during the past year, by 3.98% (annualized) during the past two years and by 3.85% (annualized) during the past three years. Chart 410-Year Yield & Nominal GDP
10-Year Yield & Nominal GDP
10-Year Yield & Nominal GDP
We discount the recent 5.44% growth rate because it was largely fueled by fiscal thrust that will fade in the coming quarters. This leaves us with a recent trend of 3.85% - 4% in nominal GDP growth. Even with no further deterioration in growth as the cycle matures, this puts an approximate cap on how high long-dated yields can rise before policy becomes restrictive and the cycle starts to turn. With the 10-year Treasury yield already at 3.19%, it can rise by between 66 bps and 81 bps before it reaches that range. If that adjustment were to occur very quickly, then the yield curve would steepen sharply and then re-flatten as the Fed lifted rates to catch up with the long end. Alternatively, if that adjustment were to occur over a period of 6-9 months, with the Fed hiking at a pace of 25 bps per quarter, the slope of the yield curve would be roughly unchanged. Wage Growth While nominal GDP growth is useful for thinking about long-maturity yields, wage growth correlates quite strongly with the slope of the yield curve itself. Specifically, rapid wage gains tend to coincide with curve flattening, and vice-versa. In fact, a typical cyclical pattern is that first the yield curve flattens and then wage growth accelerates to catch up with the curve (Chart 5). It would be highly unusual for the yield curve to steepen significantly while wage growth is rising, which it finally appears to be doing. Chart 5Higher Wage Growth = Flatter Curve
Higher Wage Growth = Flatter Curve
Higher Wage Growth = Flatter Curve
We cannot completely rule out the possibility that stronger productivity growth actually causes unit labor costs to decelerate even as "top line" wage pressures mount. Unit labor costs are essentially the ratio of wages (compensation per hour) to productivity (output-per-hour), and the bottom panel of Chart 5 shows that a deceleration in unit labor costs could cause the yield curve to steepen. However, we note that there is not much precedent for strong productivity growth overwhelming an acceleration in wages, causing unit labor costs to diverge from other wage measures. For example, even as productivity growth strengthened in the 1990s, unit labor costs continued to rise alongside other measures of wage growth. Inflation Expectations We have frequently noted that inflation expectations embedded in long-dated Treasury yields remain too low compared to levels that are consistent with inflation being well-anchored around the Fed's 2% target. It stands to reason that long-maturity TIPS breakeven inflation rates could steepen the yield curve as they adjust higher. However, the 10-year TIPS breakeven inflation rate is currently 2.11%, only slightly below the range of 2.3% to 2.5% that has historically been consistent with well-anchored inflation expectations (Chart 6). In other words, the upside in long-dated breakevens is now fairly limited. In contrast, the 2-year TIPS breakeven inflation rate stands at only 1.70%, still considerably below "well-anchored" levels (Chart 6, bottom panel). Chart 6More Upside In Short-Dated Breakevens
More Upside In Short-Dated Breakevens
More Upside In Short-Dated Breakevens
Further, since the financial crisis, breakevens at both the short- and long-ends of the curve have been driven by trends in the actual inflation data (Chart 7). If it is rising realized inflation that has driven both the 2-year and 10-year TIPS breakeven inflation rates higher this cycle, and the 2-year rate is further away from target than the 10-year rate, then it stands to reason that inflation expectations are more likely to exert flattening pressure on the nominal yield curve than steepening pressure. Chart 7Realized Inflation Is Driving Expectations
Realized Inflation Is Driving Expectations
Realized Inflation Is Driving Expectations
Rate Volatility & The Term Premium One final macro driver that could steepen the yield curve would be a spike in interest rate volatility and an increase in the term premium at the long-end of the curve. Our prior research has shown that implied interest rate volatility is linked to uncertainty about the macro environment, and Chart 8 shows that the MOVE index of implied interest rate volatility has tended to track the dispersion of individual forecasts of 3-month T-bill rates and GDP growth. In this context, it should not be surprising that implied volatility fell to very low levels when interest rates were pinned at zero and not expected to move for an extended period. Chart 8Macro Uncertainty & Rate Volatility
Macro Uncertainty & Rate Volatility
Macro Uncertainty & Rate Volatility
But, as was mentioned above, the Fed has been trying scale back its forward guidance and inject some uncertainty into the market. Indeed, we think this is one reason why the yield curve steepened and rate volatility increased during the past few weeks. Taking a broader view, we also observe that, historically, macro uncertainty and implied interest rate volatility have tended to fall when the Fed is hiking rates, only spiking once monetary policy becomes restrictive and the economic recovery is threatened. The yield curve is typically inverted by that point. This leaves us to conclude that some further increase in interest rate volatility from exceptionally low levels is possible, but a large spike is unlikely until monetary policy becomes restrictive. Investment Implications A survey of the macro drivers of the yield curve leaves us to conclude that the most likely outcome for the next 6-12 months is that the slope of the curve remains close to its current level, meaning that the curve undergoes a roughly parallel upward shift as the Fed continues to lift rates. However, if nominal GDP growth fails to decelerate from its current 5.44% clip, it is possible that the yield curve steepens first and then flattens as the Fed lifts rates more quickly to catch up. This is not the most likely outcome, but rather a risk to our base case scenario. The final piece of the puzzle is the observation that curve steepener trades continue to look attractively priced. Our current recommendation is to favor the 7-year bullet over a duration-matched barbell consisting of the 1-year and 20-year notes. This trade offers a spread of +8 bps above the reading from our fair value model (Chart 9). Or alternatively, our model shows that the 1/7/20 butterfly spread is currently priced for 29 bps of 1/20 curve flattening during the next six months (Chart 9, bottom panel). Chart 9Curve Steepeners Are Still Attractive
Curve Steepeners Are Still Attractive
Curve Steepeners Are Still Attractive
That much curve flattening is highly unlikely in the current macro environment, and we continue to recommend curve steepener trades to profit from an unchanged yield curve during the next six months. Bottom Line: A reading of the macro drivers of the yield curve suggests that the slope of the curve will not steepen or flatten dramatically during the next 6-12 months. In this environment, trades that are long the belly of the curve and short a duration-matched barbell consisting of the short and long ends will profit, due to extremely attractive valuation. We currently recommend going long the 7-year bullet and short the 1/20 barbell. Ryan Swift, Vice President U.S. Bond Strategy rswift@bcaresearch.com 1Please see U.S. Bond Strategy Weekly Report, "Rate Shock", dated October 16, 2018, available at usbs.bcaresearch.com 2https://www.federalreserve.gov/monetarypolicy/files/fomcminutes20180926.pdf 3Please see U.S. Bond Strategy Weekly Report, "Rigidly Defined Areas Of Doubt And Uncertainty", dated June 19, 2018, available at usbs.bcaresearch.com Fixed Income Sector Performance Recommended Portfolio Specification
Highlights Duration Strategy: The recent market turmoil was a long overdue risk asset correction that does not change any fundamental underpinnings for rising global bond yields. Stay below-benchmark on overall global duration exposure, concentrated in an underweight stance on U.S. Treasuries. Country Allocations: Continue allocating duration risk for global government bond portfolios in favor of countries where central banks will have difficulty raising interest rates (Australia, U.K., Japan core Europe) relative to countries where rate hikes are more necessary and likely to happen (U.S., Canada). Feature Repricing "Central Banker Puts" Can Be Painful By a quirk of our scheduling, we have not published a regular Weekly Report since September, during what became a period of more turbulent global financial markets. While we trust that our clients have enjoyed the Special Reports that we have published instead, we are certain that many are asking an obvious question: have the more jittery markets triggered any change in BCA's views on global fixed income? The answer is "no". Just like the sharp "Vol-mageddon" risk asset selloff back in early February, the origin of the recent volatility spike was soaring U.S. Treasury yields driven by a rapid upward revision of Fed rate hike expectations (Chart of the Week). We had been expecting such an adjustment based on our positive assessment of the underlying momentum of both economic growth and inflation in the U.S. This remains a critical underpinning for our below-benchmark call on U.S. duration exposure, and our increased caution on U.S. spread product. Chart of the WeekRisk Assets Struggling As Bond Yields Rise
Risk Assets Struggling As Bond Yields Rise
Risk Assets Struggling As Bond Yields Rise
There is more to the story than just the Fed, however. Throughout the course of 2018, we have been warning that global central banks moving away from accommodative monetary policies would be the greatest threat to market stability. This is not only a story of Fed rate hikes. A reduction in the pace of asset purchases by the European Central Bank (ECB) and the Bank of Japan (BoJ), combined with outright contraction of the Fed's swollen balance sheet, has created a backdrop more conducive to volatile spikes - especially if the global economy is losing upward momentum at the same time. The OECD leading economic indicator has been steadily declining throughout 2018, a reflection of the more challenging backdrop for non-U.S. growth. It is no coincidence that, without the support from accelerating liquidity or positive economic momentum, many of last year's best performing investments (Italian government bonds, the Turkish lira, Emerging Market (EM) hard currency corporate debt) have been some of 2018's worst (Chart 2). Investors were willing to ignore the poor structural fundamentals underlying those markets when times were good, but have been much more cautious in 2018 with a less supportive macro environment. Chart 2The Darlings Of 2017 Are The Duds Of 2018
The Darlings Of 2017 Are The Duds Of 2018
The Darlings Of 2017 Are The Duds Of 2018
While there have been numerous political headlines that have caused bouts of market turbulence in the past few months - the escalating U.S.-China "tariff war", the Italian fiscal debate with the European Union - the short-term impact of these moves is magnified when global monetary policy is being tightened and global growth is cooling. The reason why central banks have been forced to turn more hawkish (or at least less dovish) is that diminished economic slack has forced their hands. For policymakers with an inflation-targeting mandate, the Phillips curve framework remains the primary analytical framework. When they see low unemployment, they get nervous. When they see low unemployment AND rising inflation, then become hawkish. Three-quarters of OECD countries now have an unemployment rate below the estimate of the full-employment NAIRU - the highest level in a decade - and realized inflation rates are accelerating in the major developed economies (Chart 3). Our own Central Bank Monitors are signaling the need for tighter monetary policy in most countries, while yields at the front-ends of government bond curves are steadily rising. Chart 3Central Bankers Still Believe In The Phillips Curve
Central Bankers Still Believe In The Phillips Curve
Central Bankers Still Believe In The Phillips Curve
Looking ahead, we continue to see more upward pressure on global bond yields in the next 6-12 months. Market pricing for the future policy actions of the major central bank did not move much even with the surge in volatility earlier this month. The markets now understand that the "policymaker put" that central bankers have implicitly sold to investors has a much lower strike price when labor markets are tight and inflation is accelerating. It will take much larger selloffs to cause central banks to become less hawkish. We still see the decisions we made in late June, moving to a more cautious recommended stance on overall risk in fixed income portfolios, as appropriate. Staying below-benchmark on overall global duration risk, while underweighting those countries where the central banks are under the greatest pressure to tighten policy, is the most sensible way to allocate a fully-investment government bond portfolio. That means underweighting the U.S. and Canada and overweighting Japan, Australia and the U.K. (Chart 4). In terms of credit, we are maintaining an overall neutral stance, but favoring the U.S. versus European equivalents and a maximum underweight on EM credit. Chart 4Interest Rates Remain Unfazed By More Jittery Markets
Interest Rates Remain Unfazed By More Jittery Markets
Interest Rates Remain Unfazed By More Jittery Markets
Bottom Line: The recent market turmoil was a long-overdue risk asset correction that does not change any fundamental underpinnings for rising global bond yields. Stay below-benchmark on overall global duration exposure, concentrated in an underweight stance on U.S. Treasuries. The Most Important Charts For Our Most Important Country Duration Views When determining our recommended fixed income country allocation, there are a few critical indicators we are watching to assess if those views should be maintained. We now go over each of those indicators for the most important developed economy bond markets: U.S. (Underweight): Watch TIPS Breakevens & The Employment/Population Ratio U.S. Treasuries have been the one major government bond market this year that has seen a rise in both inflation expectations and real yields. The breakeven inflation rate implied by the spread between 10-year nominal Treasuries and TIPS has gone up from 1.97% to 2.10% since the start of 2018, while the real 10-year TIPS yield has climbed from 0.44% to 1.09% over the same period. The rise in inflation expectations has occurred alongside an acceleration of U.S. economic growth and a generalized rise in inflation pressures. Reliable cyclical leading indicators like the ISM Manufacturing index and the New York Fed's Underlying Inflation Gauge are pointing to an acceleration of U.S. core CPI inflation towards the 2.5-3% range over the next year (Chart 5). This would be enough to push 10-year TIPS breakevens comfortably into the 2.3-2.5% range that we deem consistent with the Fed's price stability target (core PCE inflation at 2%). Chart 5U.S.: Both Real Yields & Inflation Expectations Are Rising
U.S.: Both Real Yields & Inflation Expectations Are Rising
U.S.: Both Real Yields & Inflation Expectations Are Rising
Any larger move in inflation expectations would only occur if the Fed were to accommodate it by not continuing to hike rates at the current 25bps/quarter pace. That is unlikely with the strength of the U.S. labor market suggesting that the Fed is behind the curve on rate hikes. The U.S. employment/population ratio for prime age (25-54 years old) workers has almost returned back to the peak levels of the mid-2000s near 80% (bottom panel). The Fed had to push the real funds rate to over 3% during that cycle to get policy to a restrictive setting above the Fed's estimate of the r-star neutral real rate. While it is unlikely that the Fed will need to push the real funds rate to as high a level as in the mid-2000s, the current real rate has not even caught up to the Fed's r-star estimate, which is starting to slowly increase alongside the stronger U.S. economy. That implies a higher nominal funds rate would be needed to push up the real rate to neutral levels, with even more nominal increases needed if inflation continues to accelerate. With only 62bps of rate hikes over the next year currently discounted in the USD Overnight Index Swap (OIS) curve, there is scope for Treasury yields to rise further over the next 6-12 months. Core Europe (Underweight): Watch Realized Inflation Relative to ECB Forecasts In the euro area, the evolution of unemployment, wage growth and core inflation compared to the ECB's positive forecasts will be the critical driver of the future direction of government bond yields. In its latest set of economic projections published last month, the ECB expects the overall euro area unemployment rate to be 8.3% in 2018, 7.8% in 2019 and 7.4% in 2020.1 With the actual unemployment rate falling to 8.1% in August, the realized outcomes are already exceeding the ECB's forecasts (Chart 6). The same can be said for euro area wages, where the growth in compensation per employee (2.45%) is already running above the 2018 ECB projection of 2.2%. The ECB expects no acceleration of wage growth in 2019 (2.2%), but a further ratcheting up in 2020 (2.7%). Chart 6Euro Area: Expect Higher Yields If ECB Forecasts Materialize
Euro Area: Expect Higher Yields If ECB Forecasts Materialize
Euro Area: Expect Higher Yields If ECB Forecasts Materialize
In a recent Special Report, we identified a leading relationship between wage growth and core HICP inflation in the euro area of around nine months.2 This would suggest that core HICP inflation should rise towards 1.5% within the next six months based on the current acceleration of wage growth (second panel). This would be above the ECB's current projection for 2018 (1.1%), but in line with the 2019 forecast (1.5%). Core inflation is projected to rise to 1.8% in 2020. If unemployment and inflation even just match the ECB's forecasts, there is likely to be a material repricing of core European bond yields through higher inflation expectations. At 1.7%, 10-year EUR CPI swaps are well below the +2% levels that occurred during the past two ECB rate hike cycles in the mid-2000s and 2010-11 (third panel). Both wage and core price inflation in the euro area were around the ECB's current 2019-2020 projections during both of those prior tightening episodes, suggesting that the past may indeed be prologue when it comes to inflation expectations. Given growing U.S.-China trade tensions, and uncertainties over the future path for Chinese economic growth, there is a risk that the ECB's growth and unemployment forecasts are too optimistic. The euro area economy remains highly levered to exports, and to Chinese demand in particular. Furthermore, the ECB continues to provide very dovish forward guidance, with no rate hikes expected until at least September 2019. Yet with a mere 12bps of rate hikes over the next year currently discounted in the EUR OIS curve, there is scope for core European bond yields to rise further over the next 6-12 months if euro area inflation surprises to the upside. Italy (Underweight): Watch Non-Italian Bond Spreads & The Euro The Italian budget battle with the European Union has been a gripping drama for investors in recent months. Italian bond yields have been under steady upward pressure, with the benchmark 10-year yield getting as high as 3.78%. Yet the story remains as much about sluggish Italian growth as it is about Italian fiscal policy. The populist Italian government has pushed for larger deficits, but has toned down the anti-euro language that dominated the election campaign earlier this year. This is why there has been very minimal contagion from higher Italian bond yields into other Peripheral European bond yields or euro area corporate bond spreads, or into the euro itself which remains very firm on a trade-weighted basis (Chart 7). Chart 7Italy: A Story Of Weak Growth, Not Euro Break-Up
Italy: A Story Of Weak Growth, Not Euro Break-Up
Italy: A Story Of Weak Growth, Not Euro Break-Up
We continue to view Italian government bonds as a growth-sensitive credit instrument, like corporate bonds. In other words, faster Italian economic growth implies greater tax revenues, smaller budget deficits and a less worrisome trajectory for Italy's debt/GDP ratio. The opposite holds true when Italian economic growth is slowing. This is why there is a reliable directional relationship between Italy-Germany bond yield spreads and the OECD's leading economic indicator (LEI) for Italy (top panel). With the Italy LEI still in a downtrend, we do not yet see a cyclical case for shifting away from an underweight stance on Italian government bonds. Yet if the 10-year Italian yield were to reach 4%, the implied mark-to-market loss would wipe out the capital of Italy's banks, who own large quantities of government bonds. In that scenario, the ECB would likely get involved to stem the crisis, possibly by further delaying rate hikes of ramping up asset purchases. This would especially be likely if there was significant widening of non-Italian credit spreads and a sharply weaker euro. Hence, watch those markets for signs that the Italy fiscal crisis could trigger a monetary policy response. U.K. (Overweight): Watch Real Wage Growth & Business Confidence In the U.K., our non-consensus call to stay overweight Gilts has not been based on any long-run value considerations. Real yields remain depressed and the Bank of England (BoE) has kept monetary policy settings at extremely accommodative levels. The BoE continues to expect that a rise in real wage growth is likely due to the very tight U.K. labor market. This would support consumer spending and eventually require higher interest rates. The only problem is that this is happening very slowly. The annual growth in U.K. wage growth is now up to 3.1%, the fastest rate since 2008. This is above the pace of headline CPI inflation of 2.5%, thus real wages are finally starting to perk up (Chart 8). A continuation of this trend would feed into faster consumer spending and, eventually, trigger BoE rate hikes. Chart 8U.K.: Brexit Uncertainty + Middling Inflation = BoE Doing Little
U.K.: Brexit Uncertainty + Middling Inflation = BoE Doing Little
U.K.: Brexit Uncertainty + Middling Inflation = BoE Doing Little
One other big impediment to the BoE turning more hawkish is the uncertainty over the U.K. government's Brexit negotiations with the EU. The extended Brexit drama has weighed on both U.K. business and consumer confidence, both of which have struggled since the 2016 Brexit vote (third panel). With the March 2019 deadline for the U.K. "officially" leaving the EU fast approaching, the odds of no deal being reached in time are increasing. U.K. Prime Minister Theresa May is desperately trying to avoid a no-deal Brexit, but such an outcome would create further instability in U.K. financial markets and close any near-term window of opportunity for the BoE to try and hike rates. For now, we see the depressed confidence from Brexit uncertainty offsetting the bump up in real wage growth, leaving Gilts on a path to continue modestly outperforming as they have throughout 2018 (bottom panel). An announcement of a Brexit deal would be a likely trigger for us to downgrade Gilts to neutral, and perhaps even to underweight given the developing uptrend in real wage growth. Bottom Line: Continue allocating duration risk for global government bond portfolios in favor of countries where central banks will have difficulty raising interest rates (Australia, U.K., Japan core Europe) relative to countries where rate hikes are more necessary and likely to happen (U.S., Canada). Robert Robis, CFA, Senior Vice President Global Fixed Income Strategy rrobis@bcaresearch.com 1https://www.ecb.europa.eu/pub/pdf/other/ecb.ecbstaffprojections201809.en.pdf 2 Please see BCA Foreign Exchange Strategy/Global Fixed Income Strategy Special Report, "Will Rising Wages Cause An Imminent Change In Policy Direction In Europe And Japan?", dated October 5th 2018, available at fes.bcaresearch.com and gfis.bcaresearch.com. Recommendations The GFIS Recommended Portfolio Vs. The Custom Benchmark Index
Expect More Volatility, More Often
Expect More Volatility, More Often
Duration Regional Allocation Spread Product Tactical Trades Yields & Returns Global Bond Yields Historical Returns
Highlights The combination of slower global growth, trade protectionism, Italy's budget crisis, and rising Treasury yields have made U.S. equities increasingly vulnerable to a phase transition from euphoric optimism to a more sober appreciation of the risks facing the global economy. The good news is that the U.S. economy is still quite healthy and none of our recession indicators are flashing red. This suggests that the correction which began last week will be just that, a correction. The bad news is that corrections usually end when investors stop believing that they are witnessing a correction and start thinking that a bear market is afoot. Stock market sentiment is still fairly ebullient, which suggests that it will take more pain to put in a bottom. Investors should anticipate renewed weakness in risk assets over the coming days, but be prepared to increase exposure to global equities if they retreat 9% from current levels. Feature Global Equities: How Low Will They Go? I have been on the road meeting clients this week. Not surprisingly, much of the discussion has focused on what caused last week's stock market sell-off and whether the rebound earlier this week marked the end of the correction. At times like these, I am reminded of Robert Shiller's study of the 1987 stock market crash. Soon after the crash, Shiller sent questionnaires to investors soliciting their views on what caused stocks to swoon. Shiller's assessment downplayed the role of program trading, instead ascribing the crash to investor panic.1 Simply put, Shiller contended that investors were selling because other investors were selling. While I broadly agree with Shiller's conclusion, I think his argument can be enhanced by drawing on a ubiquitous concept in physics: the idea of "phase transitions." Phase Transitions In Financial Markets A phase transition occurs when a substance changes from a solid, liquid, or gas into a different state. For example, water remains a liquid until its temperature either falls below zero degrees Celsius, at which point it becomes a solid (ice), or rises above 100°C, where it turns into gas (steam). The relationship between water and temperature is highly nonlinear. To someone who can only visually observe the contents of a kettle, it is difficult to say if the temperature of the water is 20°C or 80°C. The same principle applies to markets. Sometimes, as economic and financial stresses build, nothing discernible happens until a phase transition is reached, at which point everything goes haywire. Importantly for investors, these phase transitions are surprisingly common and, at least with the benefit of hindsight, are often predictable. The Twilight Zone From Boom To Bust Consider the lead-up to five market crashes in the U.S. over the past 100 years: 1929: The conventional wisdom is that the stock market crash of October 1929 was the first hint that the economy was about to go into a tailspin. But, in fact, automobile, machinery, and steel production were already falling by the summer of 1929 (Chart 1). Automobile output had declined by a third by the time stocks reached their zenith. Investors simply ignored the fact that the economic thermostat was plunging towards zero in those late summer months, setting the stage for a phase transition from boom to bust. Chart 1The Economy Had Started To Deteriorate Before The 1929 Stock Market Crash
The Economy Had Started To Deteriorate Before The 1929 Stock Market Crash
The Economy Had Started To Deteriorate Before The 1929 Stock Market Crash
1987: It was not so much one single thing that caused the stock market crash on October 19, 1987, but a culmination of things that the market either ignored or downplayed in the months leading up to Black Monday. A rising U.S. trade deficit and a falling dollar raised concerns that the Fed would be forced to expedite the pace of rate hikes. The 10-year Treasury yield increased from 7.1% at the start of 1987 to almost 10% on the eve of the crash (Chart 2). The House of Representatives filed legislation that sought to eliminate the tax benefits of financial mergers. Against a backdrop of increasingly stretched valuations, these developments were enough to bring the temperature of the stock market below zero. Chart 2Treasury Yields Spiked In The Run-Up To The 1987 Crash
Treasury Yields Spiked In The Run-Up To The 1987 Crash
Treasury Yields Spiked In The Run-Up To The 1987 Crash
1998: Popular lore attributes the 22% plunge in the S&P 500 from July 20 to October 8 to the implosion of Long-Term Capital Management (LTCM), but in fact almost all of the decline in the index occurred before the problems at LTCM surfaced. It was more the steady drip of bad news over the course of 1998 - the spread of the EM crisis from Thailand to Indonesia, Malaysia, and South Korea; the collapse of Hong Kong-based Peregrine Investments Holdings, Asia's largest private investment bank at the time; growing fears that China would devalue its currency; and finally, the Russian sovereign debt default - which caused market sentiment among U.S. investors to turn from euphoric ambivalence to bearish panic (Chart 3). Chart 3Key Events During The Asian Crisis
Phase Transitions In Financial Markets: Lessons For Today
Phase Transitions In Financial Markets: Lessons For Today
2000: After cutting interest rates three times in the autumn of 1998, the Fed resumed hiking rates, ultimately bringing the fed funds rate to a cycle high of 6.5% in May 2000. The Fed's actions pushed monetary policy into restrictive territory, weakening the foundation on which the stock market boom had been built. A massive wave of equity issuance from initial and secondary public offerings only made matters worse. Net corporate equity issuance went from -$111 billion in 1998, to $6 billion in 1999, to $153 billion in Q1 of 2000 alone (Chart 4). With the market unable to absorb the increase in the supply of shares, prices began to tumble. Chart 4A Tidal Wave Of Equity Issuance Preceded The 2000 Crash
A Tidal Wave Of Equity Issuance Preceded The 2000 Crash
A Tidal Wave Of Equity Issuance Preceded The 2000 Crash
2008: The stock market crash in the autumn of 2008 did not come out of the blue. U.S. home prices peaked in April 2006 - twenty months before the recession officially began. Delinquency rates on both conventional and nonconventional mortgages had already more than doubled by late-2007 (Chart 5). By then, residential investment had already fallen by 2.5% of GDP from its high in December 2005. Investors may be forgiven for not appreciating the full extent of the mortgage problem. However, it should have been clear, even at the time, that nothing was going to fill the void in aggregate demand that the decline in housing-related spending had opened up. This made a recession highly likely. Chart 5The U.S. Housing Sector Weakened Sharply Prior To The 2008 Crash
The U.S. Housing Sector Weakened Sharply Prior To The 2008 Crash
The U.S. Housing Sector Weakened Sharply Prior To The 2008 Crash
Corrections Vs. Bear Markets The five sell-offs discussed above share many similarities, along with a number of key differences. As far as the similarities are concerned, all five began when stocks were richly priced and macro fundamentals were starting to look increasingly shaky (Chart 6). Chart 6Bear Markets Tend To Occur When Earnings Disappoint
Bear Markets Tend To Occur When Earnings Disappoint
Bear Markets Tend To Occur When Earnings Disappoint
The differences lie mainly in what happened to stocks after the dam burst. In 1987 and 1998, equities quickly bottomed; whereas the initial drop in stocks in 1929, 2000, and 2008 was followed by further declines, morphing into major bear markets. The evolution of the economy distinguishes the two sets of episodes. The 1929, 2000, and 2008 sell-offs foreshadowed significant declines in economic activity and corporate earnings. In contrast, neither the stock market crash in 1987 nor the one in 1998 presaged any imminent economic doom. The latter two episodes were among those "false positives" that had led Paul Samuelson to quip decades earlier that "the stock market had predicted nine out of the last five recessions."2 History suggests that recessions are more likely to occur when the economy is suffering from significant macroeconomic imbalances. Both the 1929 and 2008 crashes were preceded by large increases in leverage (Chart 7). This made the financial system highly vulnerable to economic shocks. History also suggests that recessions are more likely to occur when policymakers lack either the will or the tools to stimulate the economy. The Fed did little to arrest the myriad bank failures in the early 1930s. This negligence allowed the money supply to decline by one-third, which caused deflation to set in. Chart 7Large Increases In Leverage Occurred During The Lead-Up To The 1929 & 2008 Crashes
Phase Transitions In Financial Markets: Lessons For Today
Phase Transitions In Financial Markets: Lessons For Today
Policymakers were more adept in combating the Great Recession, but were nevertheless constrained by a lack of regulatory authority to handle distressed nonbank financial institutions. The zero lower bound on short-term interest rates also limited the Fed's ability to cut rates by enough to revive growth, a pernicious constraint given Congress' unwillingness to enact a sufficiently large fiscal stimulus program. Both the 1987 and 1998 crashes had the potential to spawn recessions. Fortunately, policymakers were quick to put out the fire. The Federal Reserve eased short-term liquidity conditions by engaging in large-scale open market operations in the hours following the 1987 crash. The Fed also issued a statement affirming "its readiness to serve as a source of liquidity to support the economic and financial system."3 Likewise, the FOMC's decision to cut rates in the autumn of 1998 helped to temporarily weaken the dollar and give some breathing room to struggling emerging markets. The Fed was slower to cut rates after the stock market fell in March 2000, partly because the economy was more overheated by that point than it was in 1998. In addition, the bubble in stocks was much greater in 2000, as were the economic imbalances created by years of easy financing, chief of which was a massive overhang of capital spending in the tech sector (Chart 8). Chart 8The Dotcom Boom Created A Massive Overhang In Tech Sector Capex
The Dotcom Boom Created A Massive Overhang In Tech Sector Capex
The Dotcom Boom Created A Massive Overhang In Tech Sector Capex
Lessons For Today Buying on the dips in the early stages of a bear market is usually a recipe for disaster. Investors who jumped back into the stock market in September 2008 were in for a rude awakening as stocks continued to plummet into October and November. It was only in March 2009, when the first green shoots appeared, that the stock market finally bottomed. In contrast, buying into a correction tends to be a profitable strategy, provided one does so when technical indicators are signaling that a capitulation point has been reached. This brings us to today. The combination of slower global growth, trade protectionism, Italy's budget crisis, and rising Treasury yields have made U.S. equities increasingly vulnerable to a phase transition from euphoric optimism to a more sober appreciation of the risks presently facing the global economy. The good news is that the U.S. economy is still quite healthy and none of our recession indicators are flashing red (Chart 9). As we discussed two weeks ago, aggregate demand continues to benefit from fiscal stimulus, strong credit growth, and a strengthening labor market.4 While bond yields have risen, they are still far from levels that will choke off growth. This suggests that the correction which began last week will be just that, a correction. Chart 9A U.S. Recession Is Not Imminent
A U.S. Recession Is Not Imminent
A U.S. Recession Is Not Imminent
The bad news is that corrections usually end when investors stop believing that they are witnessing a correction and start thinking that a bear market is afoot. Stock market sentiment is still fairly ebullient, which suggests that it will take more pain to put in a bottom (Chart 10). This message is echoed by our forthcoming MacroQuant model, which is designed to gauge the "internal temperature" of the market. (Chart 11). It is currently pointing to downside risk for the S&P 500 over the next 30 days. Chart 10Stock Market Sentiment Is Still Fairly Elevated
Stock Market Sentiment Is Still Fairly Elevated
Stock Market Sentiment Is Still Fairly Elevated
Chart 11MacroQuant* Recommends Continued Caution Towards Equities
Phase Transitions In Financial Markets: Lessons For Today
Phase Transitions In Financial Markets: Lessons For Today
Even EM sentiment has yet to reach bombed-out levels. The latest BofA Merrill Lynch Global Fund Manager Survey showed that managers were slightly net overweight emerging market equities in October. This is a far cry from 2015, when a net 30% of managers were underweight EM stocks. Bottom Line: Investors should anticipate renewed weakness in risk assets over the coming days, but be prepared to increase exposure to global equities if they retreat 9% from current levels. Peter Berezin, Chief Global Strategist Global Investment Strategy peterb@bcaresearch.com 1 Robert J. Shiller, "Investor Behavior in the October 1987 Stock Market Crash: Survey Evidence," NBER Working Paper (2446), November 1987. 2 Paul Samuelson, "Science and Stocks," Newsweek, September 19, 1966 (p. 92). 3 Mark Carlson, "A Brief History of the 1987 Stock Market Crash with a Discussion of the Federal Reserve Response," Federal Reserve, 2006. 4 Please see Global Investment Strategy Weekly Report, "The Next U.S. Recession: Waiting For Godot?" dated October 5, 2018. Strategy & Market Trends Tactical Trades Strategic Recommendations Closed Trades