Global
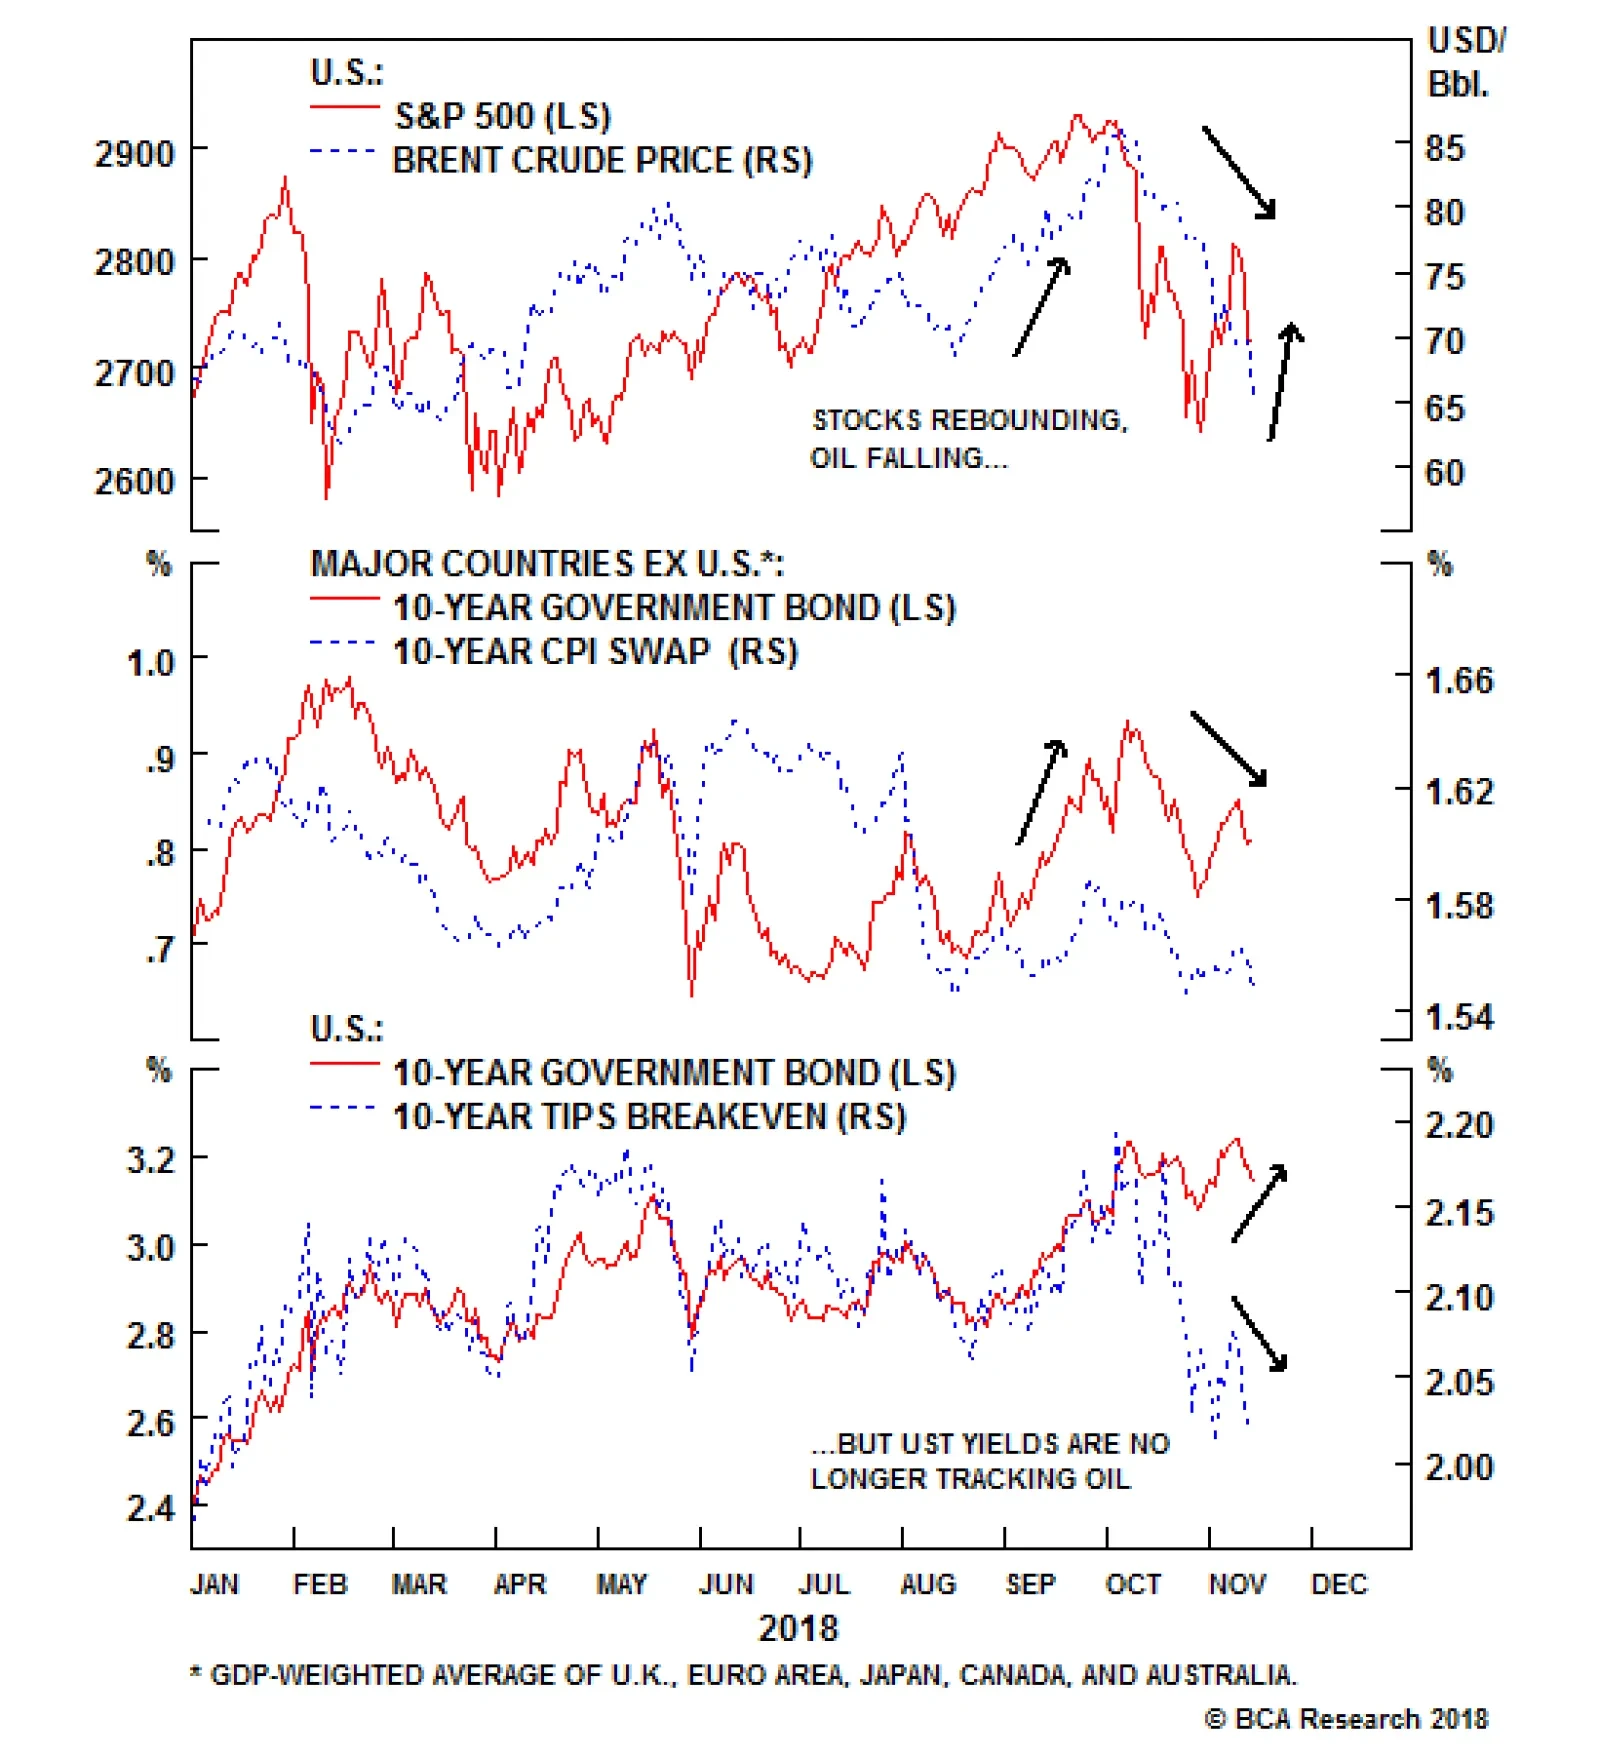
The benchmark Brent oil price fell 11% in October, but has fallen another 7% in November. This has been enough to nearly wipe out the entire 20% run-up seen in August and September. Global government bond yields have been very sensitive to swings in oil…

Highlights Falling Oil Prices & Bond Yields: Murky trends in global growth data, at a time of tight labor markets and gently rising inflation, are preventing a full recovery of risk assets after the October correction. A new concern is the falling price of oil, although this looks more corrective than a true change in trend. For now, maintain a cautious stance within global fixed income portfolios - neutral on corporate credit, below-benchmark on duration exposure. ECB Corporate Bond Purchases: The ECB is set to end the new buying phase of its Asset Purchase Program next month. This suggests that the best days in this cycle for European corporate credit are behind us, as the ECB will not treat its corporate bond purchases any differently than its government bond purchases. Both are going to stop. Remain underweight euro area corporate debt, both investment grade & high-yield. Feature Are Falling Oil Prices Telling Us Something About Global Growth? Thus far in November, global financial markets have reversed some of the steep losses incurred during the "Red October" correction. This has occurred for U.S. equities (the S&P 500 fell -8% last month but has risen +4% so far this month), U.S. corporate bonds (high-yield spreads widened +71bps last month and have tightened -19bps this month) and emerging market hard currency debt (USD-denominated sovereign spreads widened +27bps last month and have tightened -9bps this month). One market that has not rebounded, however, is oil. The benchmark Brent oil price fell -11% in October, but has fallen another -7% in November. This has been enough to nearly wipe out the entire +20% run-up seen in August and September. Global government bond yields have been very sensitive to swings in oil markets in recent years. Such a large decline in the oil price as has been seen of late would typically result in sharp drop in government bond yields, driven by falling inflation expectations. That correlation has been holding up in the major economies outside the U.S., where nominal yields and inflation expectations are lower than the levels seen before the October peak in oil prices. Nominal U.S. Treasury yields, by contrast, remain resilient, despite the fall in TIPS breakevens (Chart of the Week). This is because real Treasury yields have been climbing higher as investors acquiesce to the steady hawkish message from the Fed by making upward revisions to the expected path of U.S. policy rates. Chart of the WeekShifting Correlations
Shifting Correlations
Shifting Correlations
The biggest impediment holding back a full recovery of the October losses for global risk assets is uncertainty over the global growth outlook. While the U.S. economy continues to churn along at an above-trend pace, there are signs that tighter monetary policy is starting to have an impact. Both housing and capital spending have cooled, although not yet by enough to pose a terminal threat to the current long business cycle expansion. The outlook for growth outside the U.S. is far more muddled, adding to investor confusion. China has seen a clear growth deceleration throughout 2018, but the recent reads from imports and the Li Keqiang index suggest that growth may be stabilizing or even modestly re-accelerating (Chart 2). Our China strategists are not convinced that this is anything more than a ramping up of imports and production in advance of the full imposition of U.S. trade tariffs, especially with Chinese policymakers reluctant to deploy significant fiscal or monetary stimulus to boost growth. Chart 2Mixed Messages On Growth
Mixed Messages On Growth
Mixed Messages On Growth
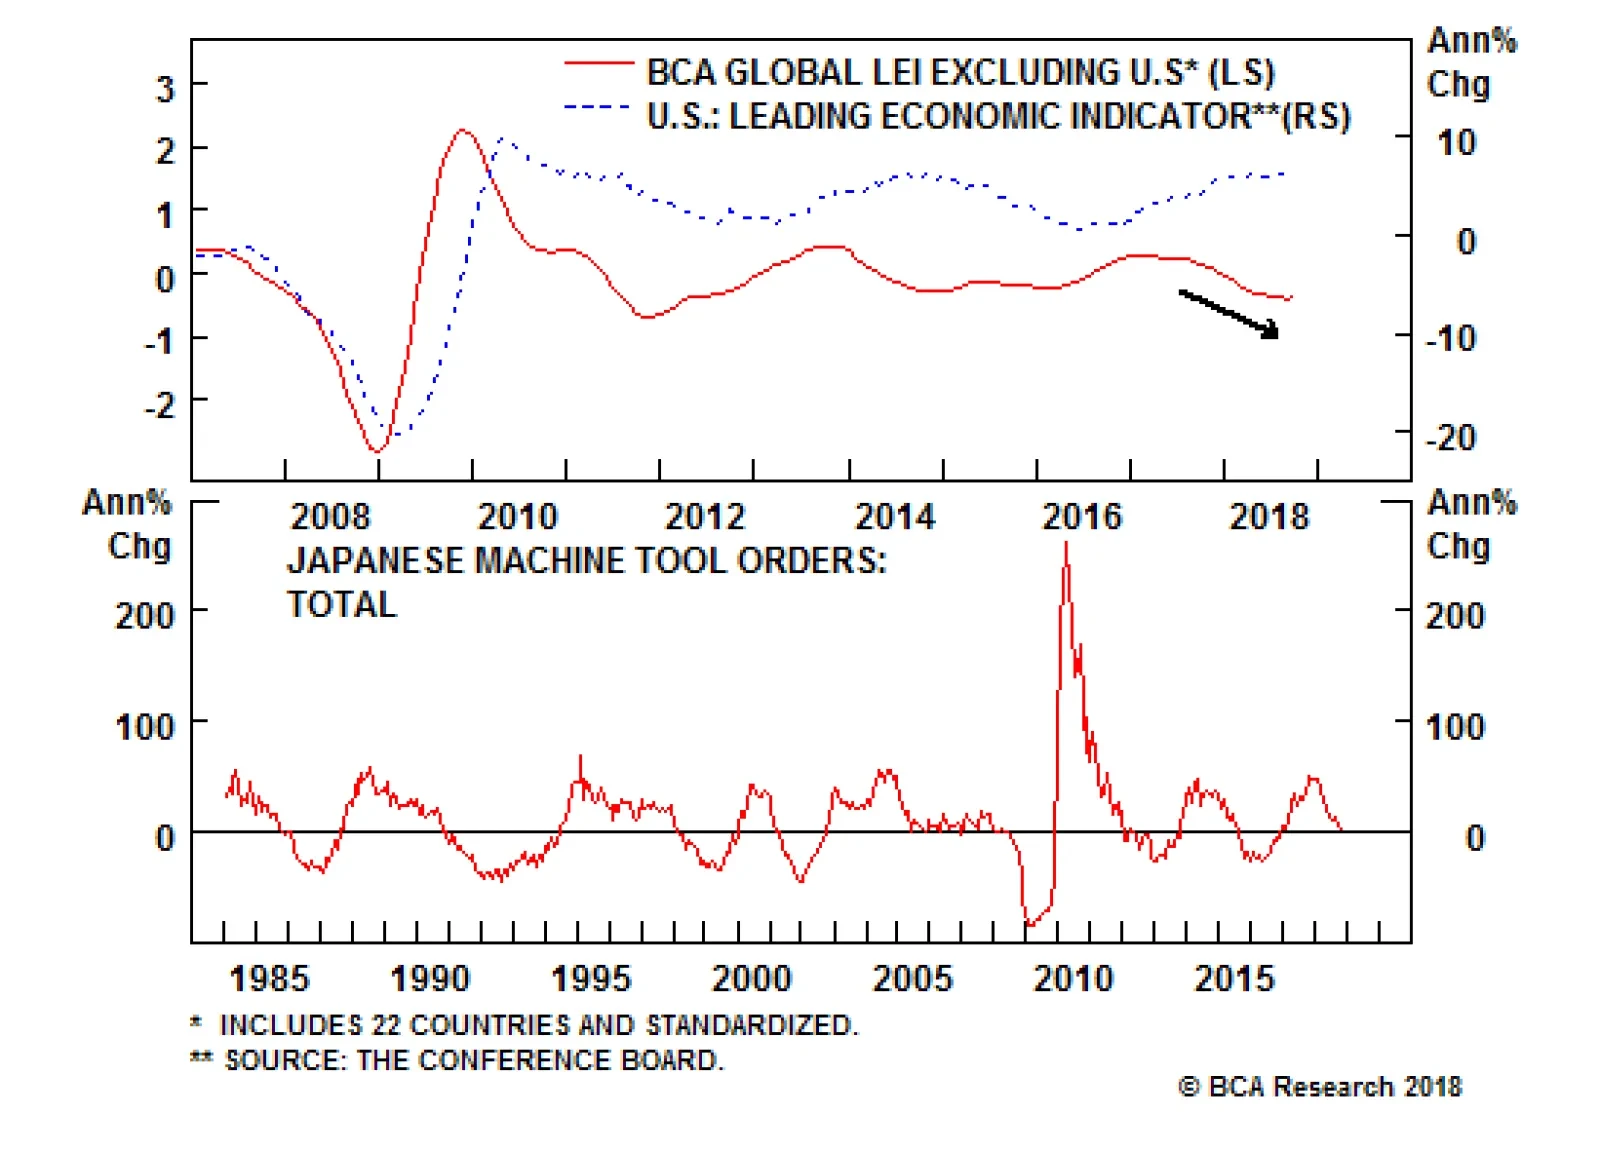
A similar mixed read is evident in overall global trade data. World import growth has also slowed throughout 2018, but has shown some stabilization of late (second panel). A similar pattern can be seen in capital goods imports within the major developed economies. Our global leading economic indicator (LEI) continues to contract, but the pace of the decline has been moderating and our global LEI diffusion index - which measures the number of countries with a rising LEI versus those with a falling LEI - may be bottoming out (third panel). There are also large, and growing, divergences within the major developed economies. The manufacturing purchasing managers' indices (PMIs) for the euro area and the U.K. have been falling steadily since the start of the year, but the PMIs have recently ticked up in the U.S. and Japan (Chart 3). A similar pattern can be seen in the OECD LEIs, which have retreated from the latest cyclical peaks by far more in the U.K. (-1.6%) and euro area (-1.2%) than in the U.S. (-0.3%) and Japan (-0.6%). Chart 3Diverging Growth, Diverging Bond Yields
Diverging Growth, Diverging Bond Yields
Diverging Growth, Diverging Bond Yields
With such mixed messages from the macro data, investors understandably lack conviction. The backdrop does not look soft enough yet to threaten global profit growth and justify sharply lower equity prices and wider corporate bond spreads. Yet the growth divergences between the U.S. and the rest of the world are intensifying, creating a backdrop of rising U.S. real interest rates and a stronger U.S. dollar. That combination is typically toxic for emerging markets, but the impact of that would be muted this time if China were to indeed see a genuine growth reacceleration. This macro backdrop lines up with our current major fixed income investment recommendations. We suggest only a neutral allocation to global corporate bonds given the uncertainty over growth, but favoring the U.S. over Europe and emerging markets given the clearer evidence of a strong U.S. economy. At the same time, we continue to recommend below-benchmark overall portfolio duration exposure, but with regional allocations favoring countries where central banks will have difficulty raising interest rates (Japan, Australia, core Europe, the U.K.) versus nations where policymakers are likely to tighten monetary policy (U.S., Canada). However, the latest dip in oil should not be ignored. A more sustained breakdown of oil prices could force us to downgrade corporate bonds and raise duration exposure - if it were a sign that global growth was slowing and inflation expectations had peaked. The current pullback in oil has occurred alongside a decelerating trend in global economic data surprises, after speculators had ramped up long positions in oil and prices were stretched relative to the 200-day moving average (Chart 4). This suggests that the latest move has been corrective, and not a change in trend, although the burden of proof now falls on the evolution of global growth, both in absolute terms and relative to investor expectations. Chart 4Oil Correction Or Growth Scare?
Oil Correction Or Growth Scare?
Oil Correction Or Growth Scare?
Bottom Line: Murky trends in global growth data, at a time of tight labor markets and gently rising inflation, are preventing a full recovery of risk assets after the October correction. A new concern is the falling price of oil, although this looks more corrective than a true change in trend. For now, maintain a cautious stance within global fixed income portfolios - neutral on corporate credit, below-benchmark on duration exposure. European Corporates Are About To Lose A Major Buyer Last week, we published a Special Report discussing the ECB's options at next month's critical monetary policy meeting.1 One of our conclusions was that the central bank will deliver on its commitment to end the new purchases phase of its Asset Purchase Program (APP) at year-end. The bulk of the assets in the APP are government bonds, but the ECB has also been buying corporate debt in the APP since June 2016. The ECB is set to end those purchases at the end of December, to the likely detriment of euro area corporate bond returns. The Corporate Sector Purchase Program (CSPP), as it is formally known, has been a targeted tool used by the ECB to ease financial conditions for euro area companies. This has occurred through three main channels: tighter corporate bond spreads, greater access for companies to issue debt in the corporate primary market, and increased bank lending to non-financial corporations. The CSPP was intended to complement the ECB's other monetary stimulus measures, like negative interest rates and the buying of government debt. The first CSPP purchases were made on June 8, 2016. The euro area corporate bond market responded as expected, with investment grade spreads tightening from 128bps to 86bps by the end of 2017. There were spillovers into high-yield bonds, as well, with spreads falling -129bps over the same period (Chart 5). Since then, however, spreads have steadily widened and European corporates have underperformed their U.S. equivalents. This suggests that some of the relative performance of euro area credit may have simply reflected the relative strength of the euro area economy compared to the U.S. The greater acceleration of euro area growth in 2017 helped euro area corporates outperform U.S. equivalents, while the opposite has held true in 2018. Chart 5ECB Buying Does Not Control European Credit Spreads
ECB Buying Does Not Control European Credit Spreads
ECB Buying Does Not Control European Credit Spreads
The CSPP has operated with a defined set of rules governing the purchases. Bank debt was excluded, as were bonds rated below investment grade. Only debt issued by corporations established in the euro area were eligible for the CSPP, although bonds from euro-based companies with parents who were not based in the euro area were also eligible. The latest update on the holdings data from the ECB shows that there are just under 1,200 bonds in the CSPP portfolio. Yet despite the ECB's best efforts to maintain some degree of portfolio diversification, the impact of the CSPP on euro area corporate bond markets was fairly consistent across countries and sectors (Chart 6). Italy is the notable diverging country this year, as the rising risk premiums on all Italian financial assets have pushed corporate bond yields and spreads well above the levels seen in core Europe, even with the ECB owning some Italian names in the CSPP. Chart 6Spread Convergence During CSPP
Spread Convergence During CSPP
Spread Convergence During CSPP
There was also convergence of yields and spreads among credit tiers during the first eighteen months of the CSPP, with valuations on BBB-rated debt falling towards the levels on AA-rated and A-rated bonds (Chart 7). That convergence has gone into reverse in 2018, with BBB-rated spreads widening by +55bps year-to-date (this compares to a smaller +25bps increase in U.S. BBB-rated corporate spreads). A surge in the available supply of BBB-rated euro area bonds is a likely factor in that spread widening, as evidenced by the sharp rise in the market capitalization of the BBB segment of the Bloomberg Barclays euro area corporate bond index (top panel). Chart 7A Worsening Supply/Demand Balance For European BBBs?
A Worsening Supply/Demand Balance For European BBBs?
A Worsening Supply/Demand Balance For European BBBs?
More broadly, the CSPP has helped the ECB's goal of boosting the ability of European companies to issue debt in primary bond markets. Traditionally, European firms have used bank loans as their main source of borrowed funds, with only the largest firms being able to issue debt in credit markets. That has changed during the CSPP era. According to data from the ECB, gross debt issuance by euro area non-financial companies (NFCs) has risen by €104bn since the start of the CSPP, taking issuance back to levels not seen since 2014 (Chart 8). The bulk of the issuance has been in shorter-maturity bonds, but there has been a notable increase in the issuance of longer-dated debt since the CSPP began. Chart 8Bank Funding Versus Bond Funding
Bank Funding Versus Bond Funding
Bank Funding Versus Bond Funding
The ECB's role as a marginal buyer of bonds in the primary, or newly-issued, market has helped boost that gross issuance figure. The share of bonds that the ECB owns in the CSPP that was issued in the primary market has gone from 6% soon after the CSPP started to the current 18% (Chart 9). The growth in euro area non-financial corporate debt went from 6% to over 10% during the peak of the CSPP buying between mid-2016 and end-2017, but has since decelerated to 7%. At the same time, the annual growth in loans to NFCs, which was essentially zero during the first eighteen months of the CSPP, has accelerated to 2% over the course of 2018. Chart 9More Bank Loans, Less Debt Issuance
More Bank Loans, Less Debt Issuance
More Bank Loans, Less Debt Issuance
In other words, euro area companies had been substituting bank financing for bond financing in the CSPP "era", but have since shifted back towards bank loans in 2018. That shift in financing was most notable among CSPP-eligible companies, particularly those smaller firms that had not be able to issue debt in the primary market pre-CSPP, according to an ECB analysis conducted earlier this year.2 From the point of view of the investible euro area corporate bond market, however, even larger companies that have done that shift in bank financing to bond financing have seen no noticeable increase in aggregate corporate leverage. In Chart 10, we show our bottom-up version of our Corporate Health Monitor (CHM) for the euro area. This indicator is designed to measure the aggregate financial health of euro area companies using financial ratios incorporating actual data from individual companies. We separated out the list of companies used in that CHM that are currently held in the CSPP portfolio and created a "CSPP-only" version of the CHM (the blue lines in all panels). All issuers that were eligible for inclusion in the CSPP, but whose bonds were not actually purchased by the ECB, are used to create a "non-CSPP" CHM (the black dotted lines). Chart 10No Fundamental Changes From CSPP
No Fundamental Changes From CSPP
No Fundamental Changes From CSPP
As can be seen in the chart, there is no material difference in any of the ratios for bonds within or outside the CSPP. The one notable exception is short-term liquidity, where the ratios were much lower for names purchased by the ECB than for those that were not. This lends credence to the idea that the CSPP most helped firms that were more liquidity-constrained, likely smaller companies. The biggest change in any of the ratios has been in interest coverage, but that has been for both CSPP and non-CSPP issuers, suggesting a common factor outside of ECB buying - zero/negative ECB policy rates, ECB purchases of government bonds that helped reduce all European borrowing rates - has been the main driver of lowering interest costs. Looking ahead, the ECB is likely to stop the net new purchases of its CSPP program when it does the same for the full APP next month. All of which is occurring for the same reason - the euro area economy is deemed by the central bank to no longer need the support of large-scale asset purchases given a full employment labor market and gently rising inflation. As we discussed in our Special Report last week, the ECB has other options available to them if there is a reduction in euro area banks' capacity or willingness to lend, such as introducing a new Targeted Long-Term Refinancing Operation (TLTRO). Continuing with unconventional measures involving direct ECB involvement in financial markets, like buying corporate debt, is no longer necessary. Our euro area CHM suggests that there are no major problems with European corporate health that require a wider credit risk premium. We still have our reservations, however, about recommending significant euro area corporate bond exposure while the ECB is set to end its asset purchase program. New buyers will certainly come in to replace the lost demand from the elimination of CSPP purchases, but private investors will likely require higher yields and spreads than the central bank - especially if the current period of slowing euro area growth were to continue. Bottom Line: The ECB is set to end the new buying phase of its Asset Purchase Program next month. This suggests that the best days for European corporate debt for the current cycle are behind us, as the ECB will not treat its corporate bond purchases any different than its government bond purchases. Both are going to stop. Remain underweight euro area corporate debt, both investment grade and high-yield. Robert Robis, CFA, Senior Vice President Global Fixed Income Strategy rrobis@bcaresearch.com 1 Please see BCA Global Fixed Income Strategy/Foreign Exchange Strategy Special Report, "Evaluating The ECB's Options In December", dated November 6th 2018, available at gfis.bcareserach.com and fes.bcaresearch.com. 2 The ECB report on its CSPP program was published in the March 2018 edition of the ECB Economic Bulletin, which can be found here. https://www.ecb.europa.eu/pub/economic-bulletin/html/eb201804.en.html Recommendations The GFIS Recommended Portfolio Vs. The Custom Benchmark Index
Stubbornly Resilient Bond Yields
Stubbornly Resilient Bond Yields
Duration Regional Allocation Spread Product Tactical Trades Yields & Returns Global Bond Yields Historical Returns
After many hotels and flights, and deep interaction with clients on the current global outlook, it was clear that investors are much more aware of the “U.S. versus China” narrative and the downward potential in China. The slowdown in the Chinese economy and…
Dear Client, I had the pleasure of participating in the Affin Hwang Capital conference in Kuala Lumpur on November 8th. In addition to sharing my views on today's macro environment, I discussed BCA's recent successes in developing quant-based solutions for bottom-up stock picking and market timing. I have transcribed my remarks on the latter topic below. Best regards, Peter Berezin, Chief Global Strategist Feature The Arithmetic Of Active Management Every active investor wants to outperform the market. Unfortunately, just like everyone cannot be above-average in height, beauty, or intelligence, not every investor can outperform their benchmark. I think very few people in the audience would dispute this assertion. What could be more surprising to some of you is the following claim, which is that active investors as a group will always underperform the market. I say this not because I have any ill will towards active investors. I'm an active investor myself. I say this simply because it is a mathematical tautology. As Bill Sharpe has emphasized, the market return is simply the weighted average of the returns that passive and active investors earn before fees.1 The passive return must, by definition, equal the market return. This necessarily implies that the average active return must also equal the market return. Since active investors incur higher costs than passive investors, the former group will always underperform the latter group on average. That's the bad news. The good news is that not all active investors are the same. Some are better than others, and while it is not easy, it is possible to isolate certain strategies that active managers employ that help them outperform the market. Before I discuss these strategies, let me make a generic point, which is that most so-called active investors are not particularly active. In fact, according to one academic paper, the fraction of truly active investors - those whose returns deviate significantly from the market benchmark - shrank from 60% in 1980 to less than 20% in 2009 (Chart 1). In contrast to active investors whose portfolio returns broadly mimic the market's, genuinely active investors typically outperform their benchmarks (Chart 2).2 Chart 1How Active Are Active Investors?
Quant-Based Approaches To Stock Selection And Market Timing
Quant-Based Approaches To Stock Selection And Market Timing
Chart 2Active Stock Pickers Outperform
Quant-Based Approaches To Stock Selection And Market Timing
Quant-Based Approaches To Stock Selection And Market Timing
What are successful active investors doing to beat their benchmark? Well, first of all, let me tell you what they are not doing: They are not taking on more risk. Don't Bet On Beta Chart 3 shows that there is no clear relationship between a stock's beta and its expected return.3 To those familiar with the CAPM model, this may be surprising. The CAPM model predicts that higher-beta stocks will earn superior returns because they are riskier. High-beta stocks outperform the market when the market is going up, but underperform the market when it is going down. Since the market tends to go up more often than it goes down, the expected return to high-beta stocks should exceed the expected return to low-beta stocks. Chart 3Don't Bet On Beta
Quant-Based Approaches To Stock Selection And Market Timing
Quant-Based Approaches To Stock Selection And Market Timing
As I will discuss, the reason this theoretical prediction is refuted by the empirical evidence is because the market is rife with inefficiencies. What is more, these inefficiencies reflect pervasive institutional and behavioral biases that are engrained within the market's very own DNA. Active managers who understand these biases can exploit them to outperform their benchmarks. Let me start with the former: institutional biases. The investment industry often encourages a "heads I win, tails you lose" mentality: If a fund manager takes on a lot of risk and gets lucky, he or she will be well remunerated; if the manager is unlucky, he or she may have to look for a new job, but the primary losers will be the clients of the fund. Such an incentive structure encourages managers to take on excessive risk by purchasing, among other things, high-beta stocks. This bids up the price of these stocks to the point where they no longer offer enough additional return to compensate for their higher risk. Size And Value If buying high-beta stocks simply adds more risk without generating more reward, what types of stocks do outperform the market on a risk-adjusted basis? Much of the early academic literature focused on two factors: size and value. Historically, it has been the case that small caps and value stocks have outperformed large caps and growth stocks. Some academics have offered risk-based explanations for the size and value effects. Personally, I find these explanations unconvincing, especially in the case of value stocks. The main problem with risk-based arguments is that they fail to convincingly identify the nature of the risk that investors who purchase value stocks are being compensated for. It is certainly not market risk - value stocks tend to be low beta (Chart 4). Revealingly, companies that do face greater existential risks - those that have high levels of debt relative to equity, for example - tend to underperform the market.4 This is exactly the opposite of what risk-based arguments would predict. Chart 4Value Tends To Outperform Growth When The Stock Market Is Falling
Quant-Based Approaches To Stock Selection And Market Timing
Quant-Based Approaches To Stock Selection And Market Timing
The presence of market inefficiencies provides a more compelling explanation for why small caps and value stocks outperform. Consider two companies, identical in every way except that one has a lower market capitalization than the other. Since the only difference between the two companies is the price of their shares, the "cheaper" company will generate higher returns for shareholders over the long haul. The cheaper, smaller capitalization company will also initially trade at a lower price-to-earnings and price-to-book ratio. In other words, it will look more like a small cap value stock. Thus, it is not necessary to invoke complex, risk-based explanations for why small caps and value stock outperform. It is exactly what one would expect if markets are not perfectly efficient. Ignore The Analysts? Of course, some stocks are cheap for a reason. How can we distinguish between hidden gems and fool's gold? Wall Street is populated with thousands of analysts paid to make that determination. But are they any good? For the most part, the answer is no. Chart 5 shows analysts' published earnings forecasts versus realized earnings growth. Analysts have had some success at predicting earnings growth over a one-to-two year horizon, but are almost useless over a five-year horizon.5 In fact, large cap companies favoured by analysts tend to underperform companies that analysts pan. Chart 5A Mug's Game
Quant-Based Approaches To Stock Selection And Market Timing
Quant-Based Approaches To Stock Selection And Market Timing
There are two exceptions to this rule. The first applies to small caps. Since many smaller companies are not widely followed, analysts that do follow them often add significant value. Unlike their large cap brethren, small cap stocks with buy recommendations tend to outperform stocks with sell recommendations. Second, changes in analyst recommendations do predict returns. Stocks that have recently been upgraded tend to outperform those that have recently been downgraded.6 Insiders And Short Interest How about insiders? Here, the data suggests that insiders know what they are doing. The shares of companies with a lot of insider buying tend to rise more than those that have experienced insider selling. Short interest also predicts returns. Heavily-shorted companies tend to underperform companies that have attracted few short sellers. Combining data on insider activity and short interest can help supercharge returns. Chart 6 shows the highest returns are earned when insiders are buying and short interest is decreasing.7 The worst-performing stocks end up belonging to companies where insiders are heavy sellers and short interest has risen over the prior 12 months. Chart 6Prefer Stocks Where Insiders Are Buying And Short Interest Is Falling
Quant-Based Approaches To Stock Selection And Market Timing
Quant-Based Approaches To Stock Selection And Market Timing
Mo' Money What about technical analysis? The academic literature on this topic is a mixed bag, with some studies deeming it useless and others suggesting it can be useful in certain situations. For most technical indicators, the noise-to-signal ratio is very high. Nevertheless, some technical indicators are worth following. Momentum is one of them (Chart 7). Over short-term horizons of about one month, mean reversion prevails - stocks that did well over the prior month tend to do poorly during the subsequent month. In contrast, over medium-term horizons of about 12 months, return continuation is the name of the game - stocks that have done well over the last 12 months tend to do well during the subsequent month. Interestingly, at very long time horizons of three-to-five years, mean reversion takes over again: Stocks that have done well over the last five years tend to do poorly over the subsequent month. The implication is that the best stocks are those that have underperformed the market over the past one month and over the past three years, but have outperformed the market over the past 12 months. Chart 7The Three Phases Of Momentum
The Three Phases Of Momentum
The Three Phases Of Momentum
Putting aside the short-term reversal effect which, in practice, is hard to exploit due to trading costs, what are the drivers of the medium-term return continuation effect and the longer-term return reversal effect? I think three factors explain the medium-term return continuation effect. The first is institutional inertia. A large money manager cannot instantly jump in and out of a position. It may take many months to build a position to its desired size and just as much time to liquidate it. Persistent buying and selling generates momentum in equity returns. The second factor is imperfect information. A lot of the return continuation effect occurs around the time of earnings reports. If a company reports better-than-expected earnings, its stock goes up. As others hear about and process the good news, the stock usually continues to advance over the subsequent days. The third factor is behavioral biases. People tend to be quite eager to lock in gains but are usually reluctant to realize losses. When a company reports good news, investors are too quick to sell. This premature selling prevents the stock price from rising to its fair value instantaneously. During the time it takes the stock to reach fair value, the share price displays upward momentum. Conversely, when the company reports bad news, investors avoid taking losses, hoping instead that some miracle will bail them out. The lack of willing sellers prevents the stock from falling to its fair value immediately. In the time it takes investors to come to terms with the fact that a miracle is not forthcoming, the share price displays downward momentum. What about the longer-term return-reversal effect? Ironically, it is probably a function of the medium-term return continuation effect. Upward momentum attracts interest from trend-following investors. People who sold too early or never got in from the beginning kick themselves and look for the slightest dip to buy. All this buying interest eventually pushes the stock price above its fair value, setting the stage for a prolonged period of subpar returns. Anomalies Abound Let me briefly mention a few other factors that predict equity returns. Share turnover is one of them. Investors often presume that high turnover is intrinsically a good thing. Terms such as "healthy volume" abound. The truth is that companies with low rates of share turnover actually outperform the market, all things equal.8 Part of this outperformance reflects a liquidity premium. Part of it may also simply reflect the fact that undervalued companies often hide in the shadows of the market, away from the spotlight. There are also balance sheet and earnings quality factors that are worth highlighting. I already mentioned that companies with high debt-to-equity ratios tend to underperform the market on a risk-adjusted basis. It is also true that companies with high accruals - firms that fail to convert most of their earnings into cash flow - underperform the market. More surprisingly, companies whose assets have been growing very quickly also tend to underperform the market. Such asset growth often ends up reflecting empire building rather than prudent corporate management. Relatedly, a significant dispersion in analyst earnings estimates is often a red flag.9 Companies with something good to say usually say it. Companies that do not have much good to say often clam up, leading to greater uncertainty about their earnings prospects. When analysts have little visibility on what earnings a company is poised to deliver, be careful. Picking Stocks With ETS I have discussed a variety of factors that help predict the performance of individual stocks. There are dozens of others that I could have mentioned but did not. Clearly, successful bottom-up investing requires that one sort through a lot of information. What one would like is a system that distills all this information into a single score that ranks stocks from best to worst. The ideal system should dynamically adjust factor weightings to account for the fact that there is momentum in factor returns. For example, if value stocks have recently been doing well, they are likely to continue to do well. At BCA Research, we have constructed our Equity Trading Strategy (ETS) to do just that.10 Chart 8 shows the backtested returns of the ETS model. As you can see, they are quite impressive. Chart 8ETS Model Back Tested Performance To Date
Quant-Based Approaches To Stock Selection And Market Timing
Quant-Based Approaches To Stock Selection And Market Timing
I have been personally trading a variant of the ETS model for the past 18 years and once wrote a blog chronicling the journey.11 I have added a line in the chart that shows my own personal performance on a pre-tax basis inclusive of brokerage commissions and other trading costs. I typically hold about 30 to 50 stocks. Except in very rare cases, I don't let any single stock exceed five percent of my portfolio. I normally hold a cash cushion of about 10%-to-15%, although occasionally, as in late 2008/early 2009, I have bought stocks on margin. I have lost a lot of money shorting stocks, so I rarely do it. I am not sure how lucky I have been over the years or how scalable my results are - I generally invest only in small cap companies that most money managers would not touch. But it does give you a sense of what is possible with this system. Market Timing With MacroQuant Of course, stock selection is only one half of a successful investment formula. The other half is market-timing - knowing when to scale back or increase exposure to the stock market. That's where our soon-to-be-released MacroQuant model comes in. The model uses over 100 variables on the economy, financial and monetary conditions, sentiment, and valuations to predict the direction of the stock market. Chart 9 shows the back-tested performance of the model. Chart 9MacroQuant* Model Suggests Caution Is Warranted
Quant-Based Approaches To Stock Selection And Market Timing
Quant-Based Approaches To Stock Selection And Market Timing
What is MacroQuant saying today? The signal from the model moved into bearish territory in the lead up to October's correction and continues to flag downside risks to stocks. This is mainly because the leading economic data has softened outside the United States, and more recently, in the U.S. itself. Financial conditions have also tightened on the back of rising bond yields, wider credit spreads, and a stronger dollar. Sentiment enters our model in both level and directional terms. We have found that the best configuration for stocks is when sentiment is bearish but improving while the worst configuration is when sentiment is bullish but deteriorating. Going into October, sentiment began to slip from very bullish levels, which was a warning sign for stocks. Valuations have improved over the past month, but still remain somewhat stretched by historic standards. We do not believe that we are at the beginning of a bear market in stocks. However, our model does suggest that the correction may have further to run. With that, let me conclude my formal remarks, and open it up to questions. Peter Berezin, Chief Global Strategist Global Investment Strategy peterb@bcaresearch.com 1 William F. Sharpe, "The Arithmetic of Active Management," The Financial Analysts Journal 47:1 (January/February 1991): 7-9. 2 Antti Petajisto, "Active Share And Mutual Fund Performance," Financial Analysts Journal 69:4 (July/August 2013): 73-93. 3 Andrea Frazzini And Lasse Heje Pedersen, "Betting Against Beta," Journal Of Financial Economics 111:1 (January 2014): 1-25. 4 John Y. Campbell, Jens Hilscher, and Jan Szilagy, "In Search Of Distress Risk," The Journal of Finance 63:6, (December 2008): 2899-2939. 5 Louis K. C. Chan, Jason Karceski, And Josef Lakonishok, "The Level And Persistence Of Growth Rates," The Journal Of Finance, Vol. 58, No. 2 (2003): 643-684. 6 Ireneus Stanislawek, "Are Stock Recomemndations Useful?"1741 Asset Management Ltd Research Note Series, (IV 2012). 7 Amiyatosh K. Purnanandam, And H. Nejat Seyhun, "Do Short Sellers Trade On Private Information Or False Information?"Journal of Financial and Quantitative Analysis, Vol.53, 3 (2018): 997-1023. 8 Vinay T. Datar, Naik Y. Narayan, and Robert Radcliffe, "Liquidity And Stock Returns: An Alternative Test," Journal of Financial Markets 1:2, (1998): pp. 203-219; and Charles M.C. Lee and Bhaskaran Swaminathan, "Price Momentum And Trading Volume," The Journal of Finance 55:5, (October 2000): 2017-2069. 9 David Veenman and Patrick Verwijmeren, "Earnings Expectations And The Dispersion Anomaly," (January 2015). 10 Please see Global Investment Strategy and Equity Trading Strategy Special Report, "Introducing ETS: A Top-Down Approach To Bottom-Up Stock Picking," dated December 3, 2015. 11 My now-defunct blog, stockcoach.blogspot.com, discussed my real-time trading progress between 2004 and 2007. Strategy & Market Trends Tactical Trades Strategic Recommendations Closed Trades
Next week investors will be focusing on the U.S. CPI report on Wednesday, looking to see if wage pressures are filtering into consumer prices. The NFIB survey, next released on Tuesday, has been highlighting labor shortages and building wage pressures for…
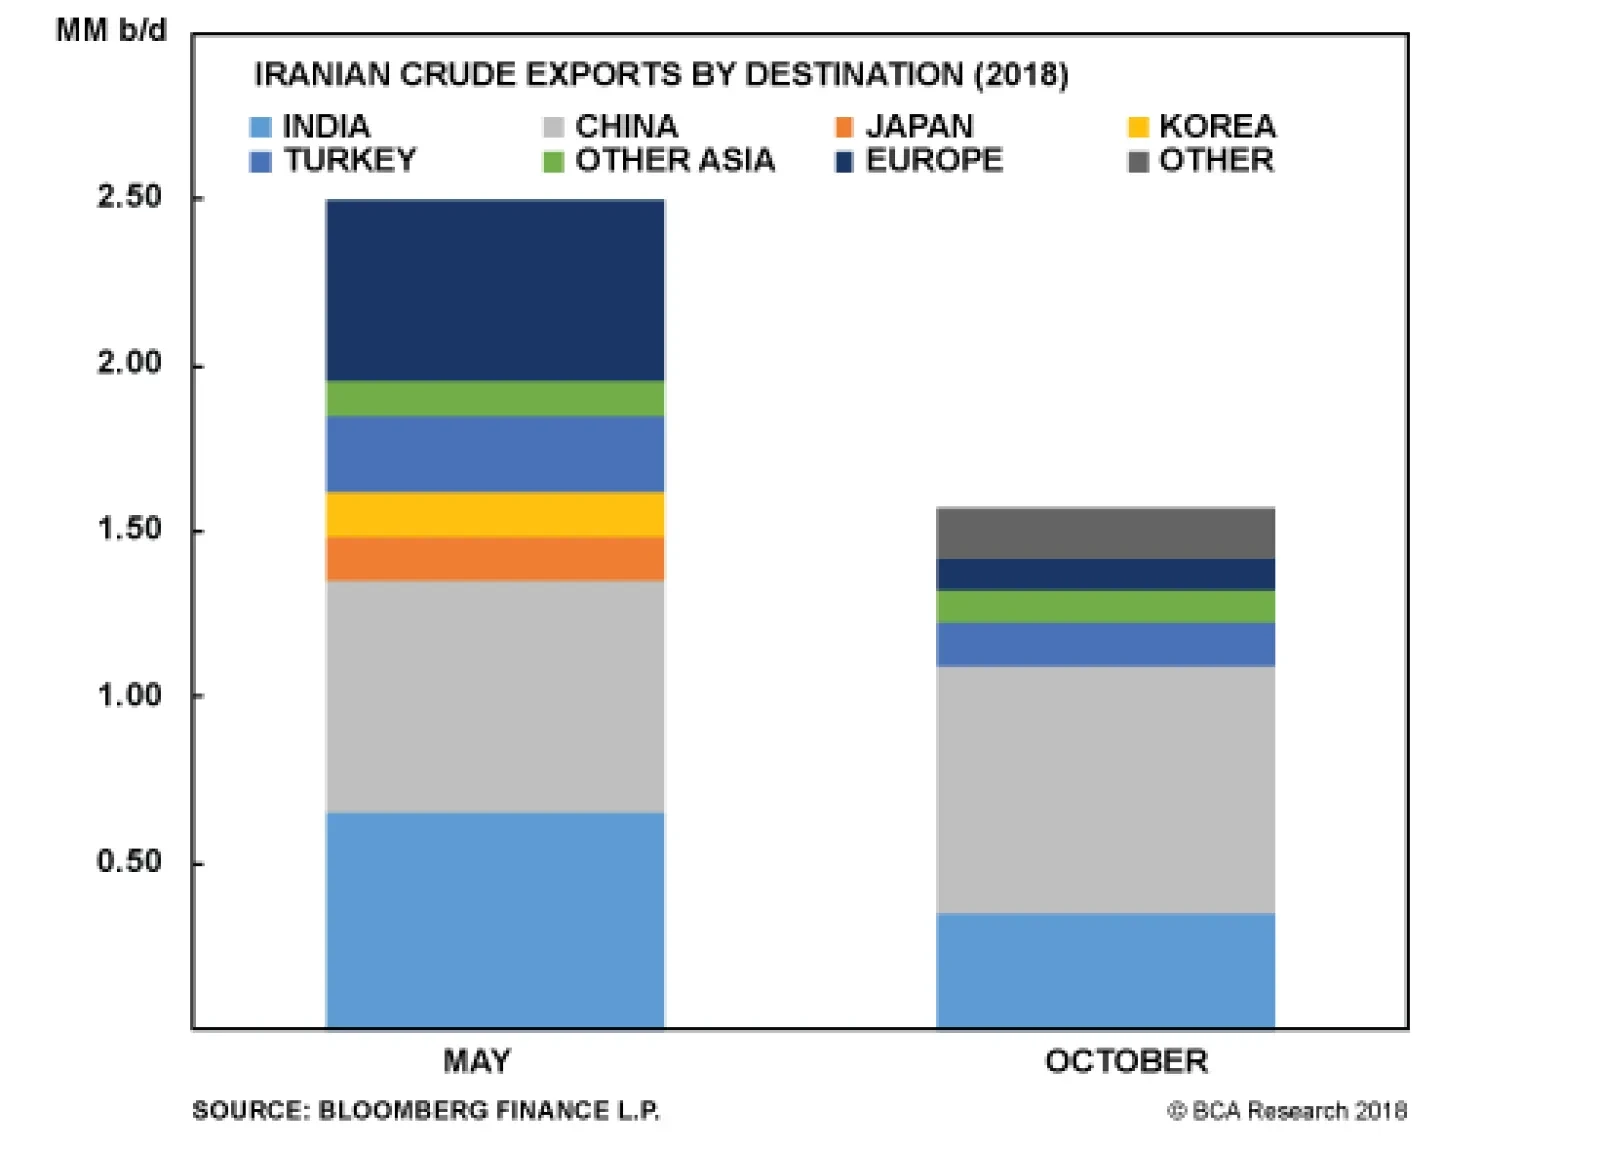
On Monday, the U.S. granted waivers to eight "jurisdictions" - China, India, Japan, South Korea, Turkey, Italy, Greece and Taiwan - allowing them to continue to import Iranian oil for 180 days. This was a higher-than-expected number of waivers than we - and,…
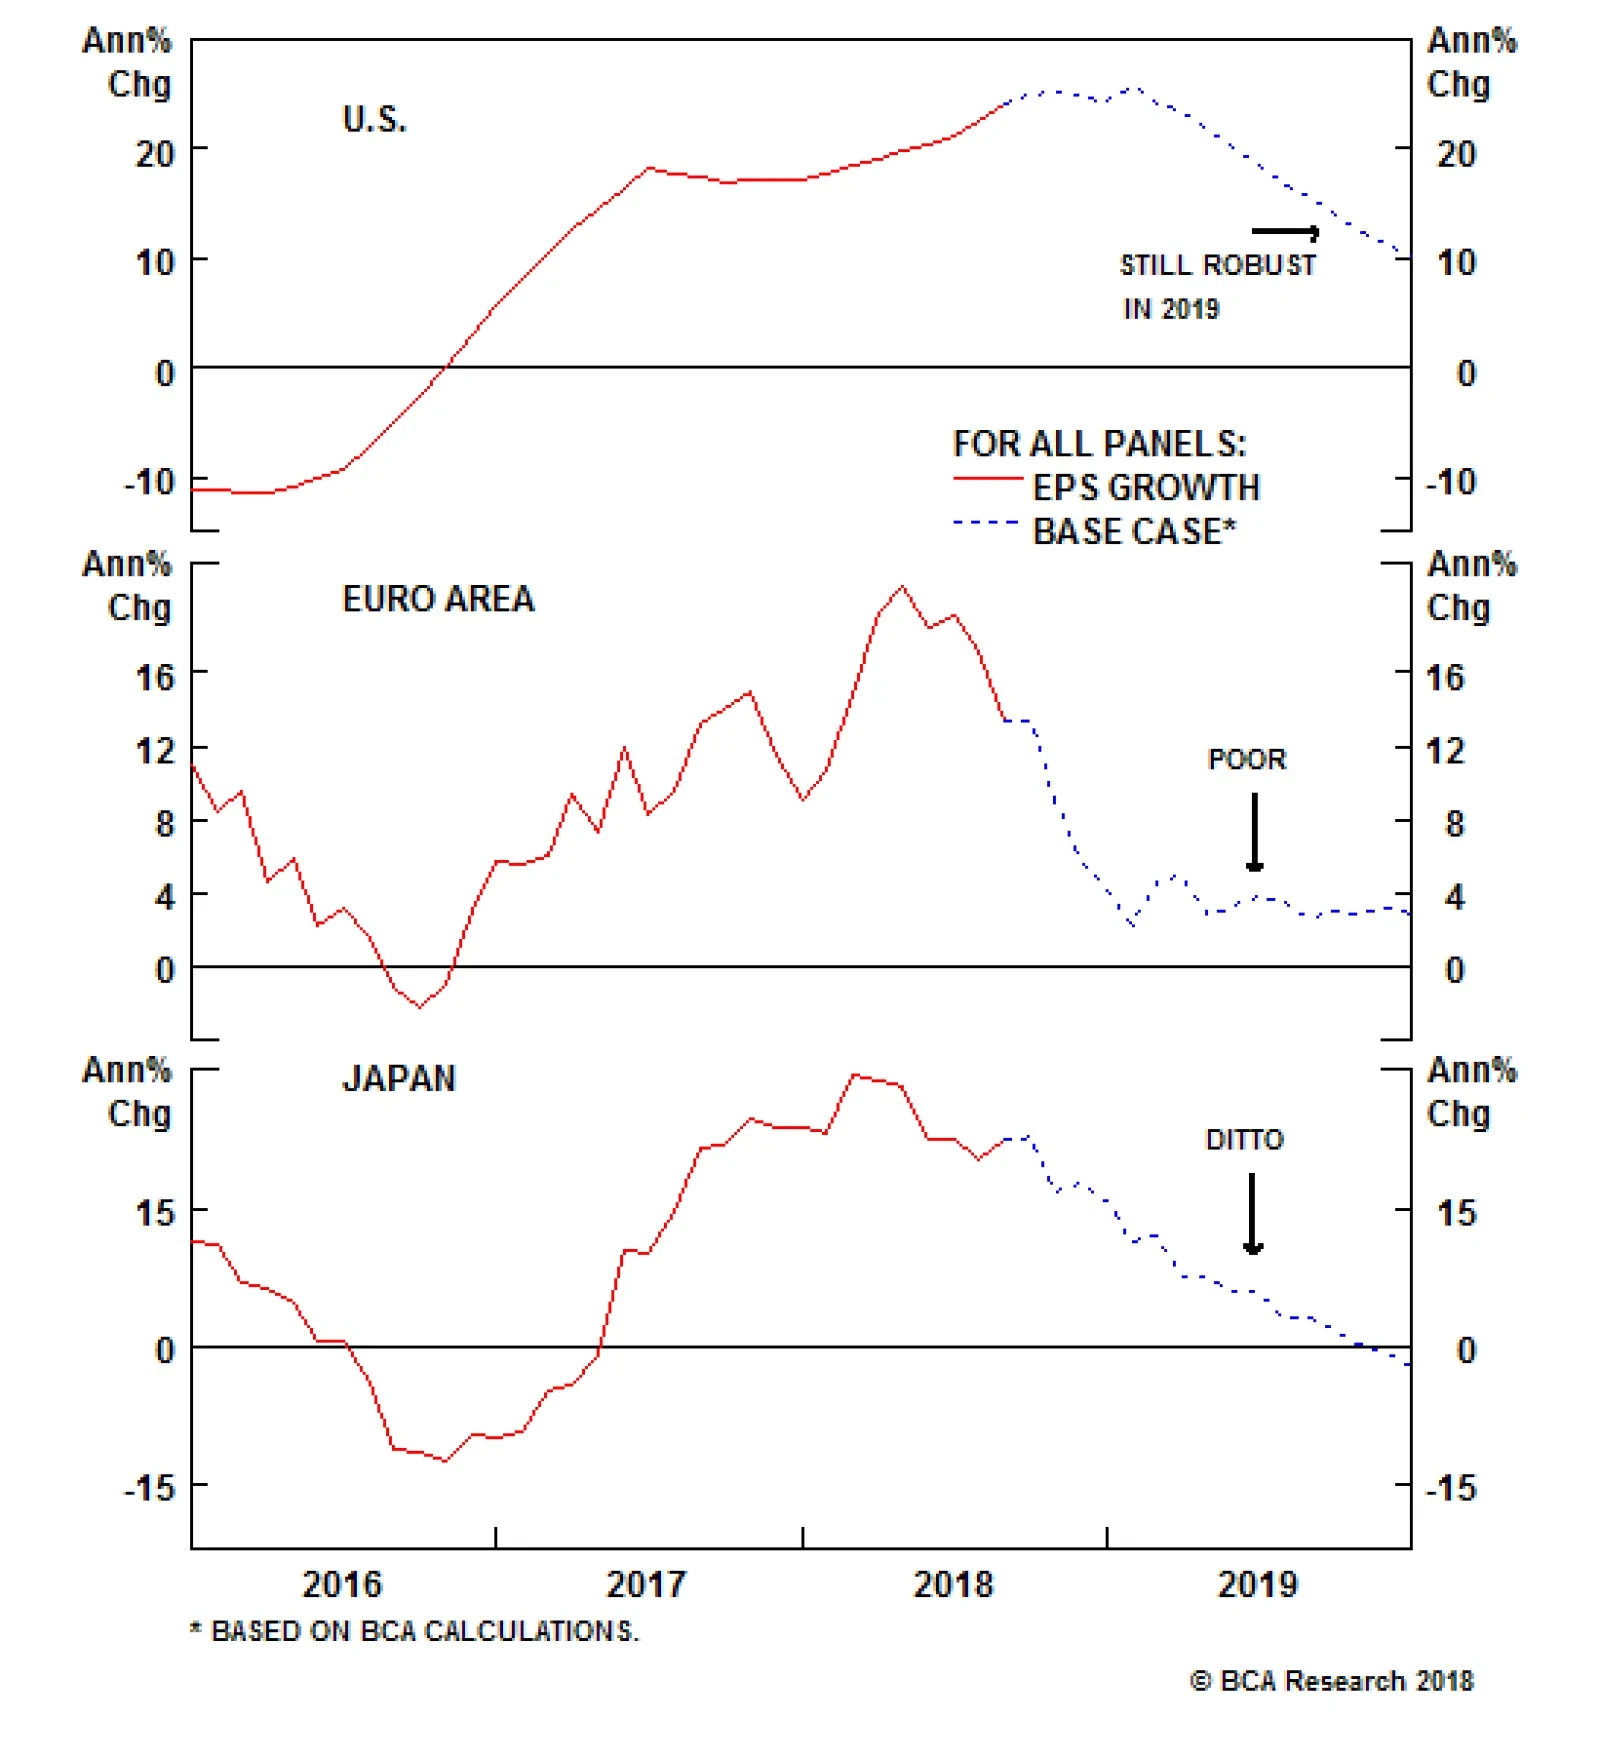
It is not surprising that corporate EPS growth has peaked in the Eurozone and Japan. The macro data that drive our top-down EPS growth models suggest that the profit situation is going to deteriorate quickly in the coming quarters. The peak in industrial…
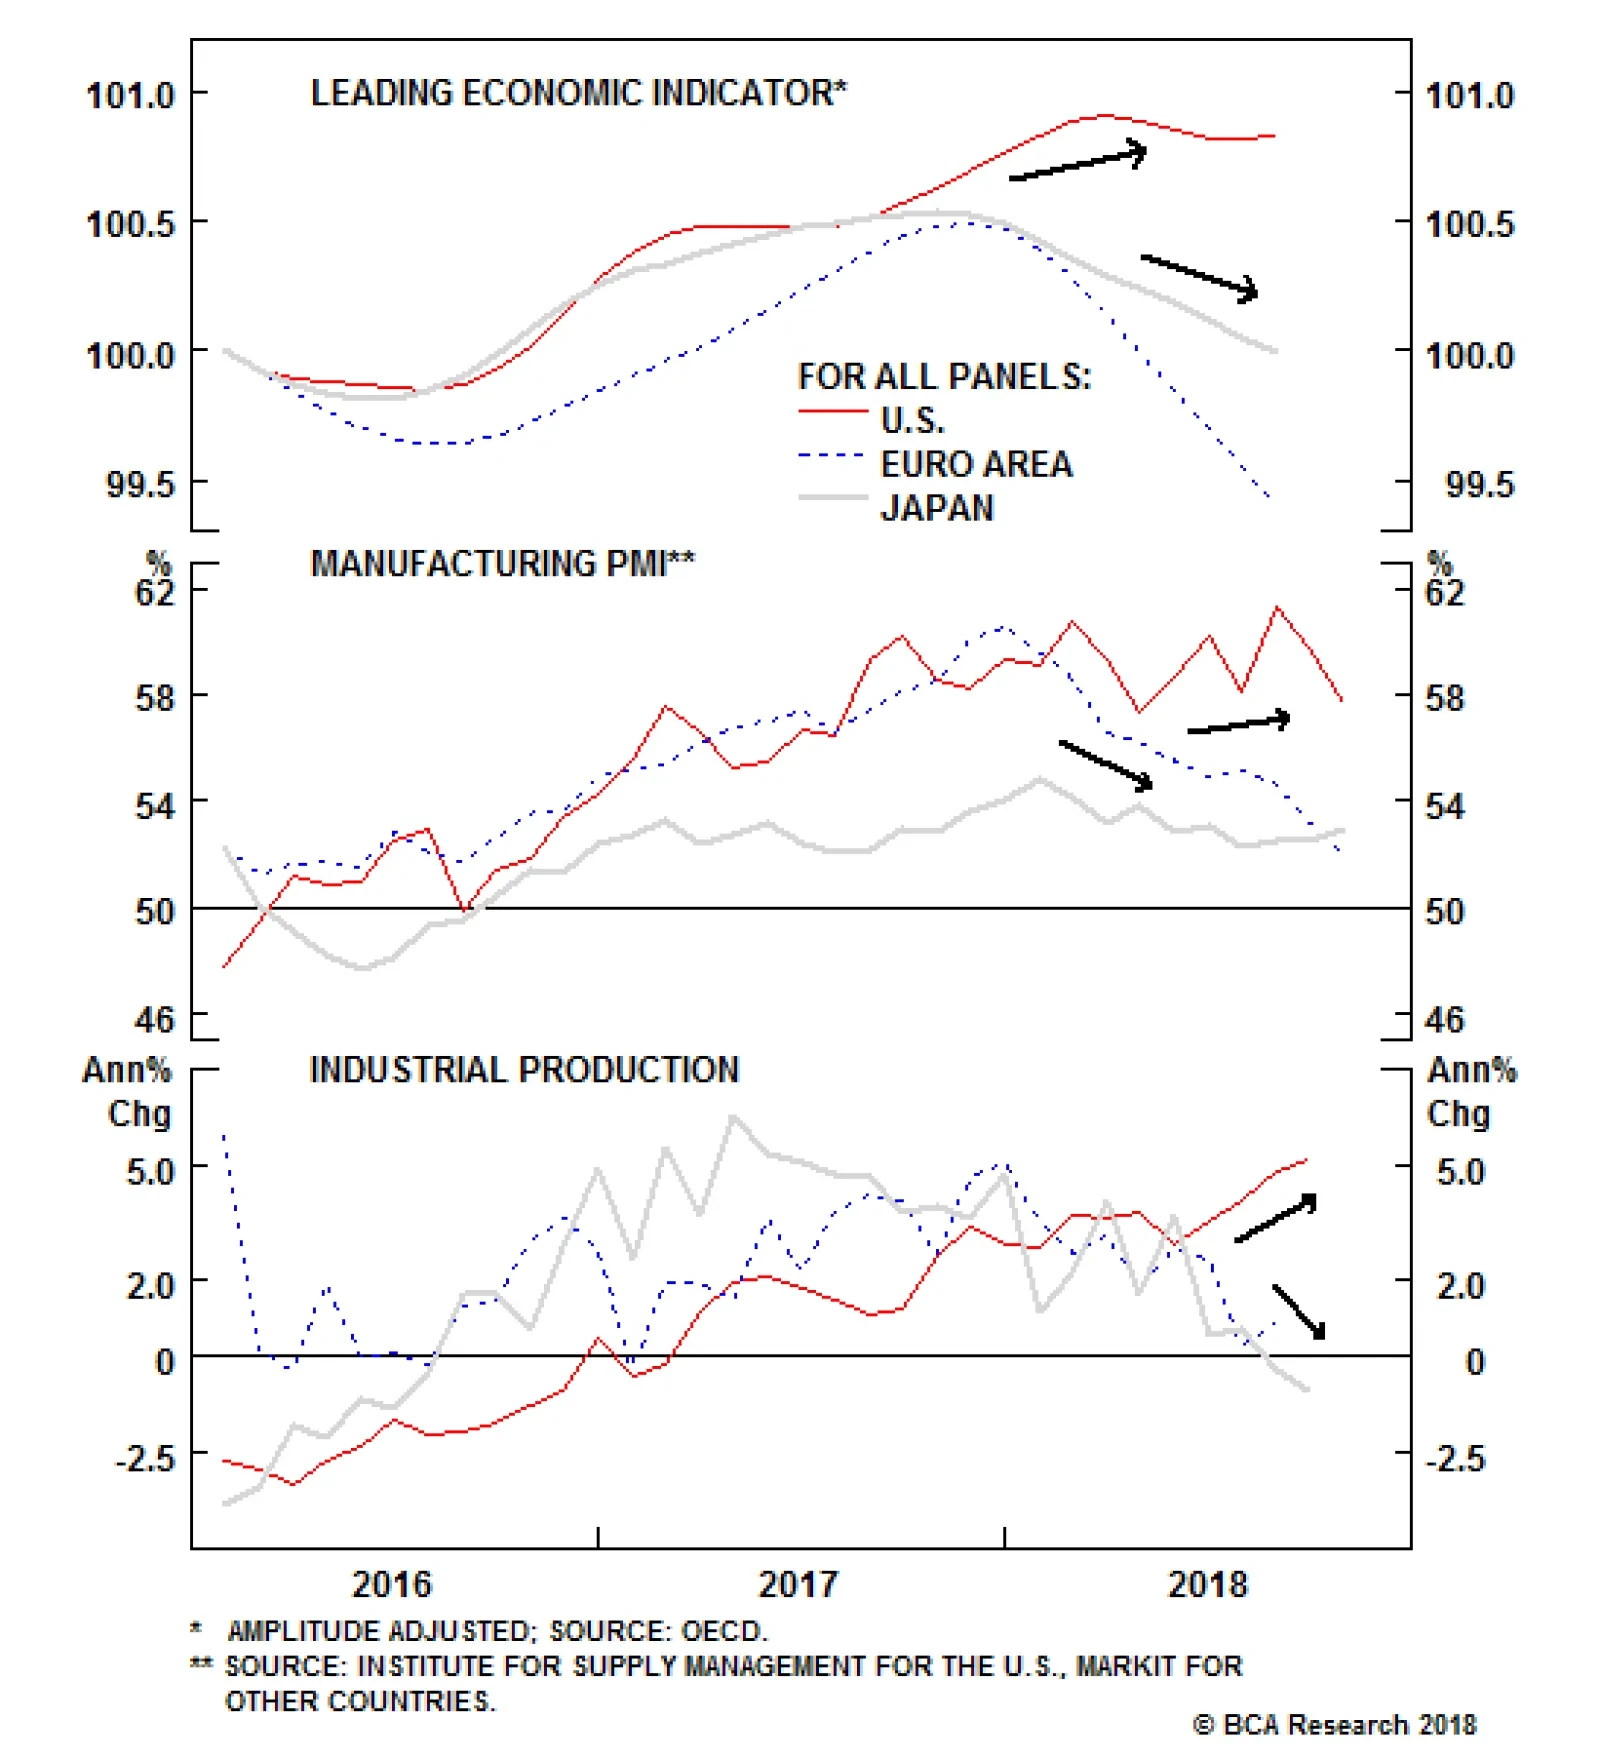
A raft of items has weighed on CEO confidence outside of the U.S., including trade wars, a strong dollar, rising oil prices, emerging market turbulence, the return of Italian debt woes and the continuing slowdown in the Chinese economy. The global PMI is…
Highlights The End Of APP?: Economic growth in the euro area has lost momentum, but it is not clear that an extended period of below-trend growth is unfolding. With most measures of spare capacity showing a lack of it, the ECB must still move forward with its plans to begin removing policy accommodation. Policy Choices: If the ECB downgrades its growth and inflation forecasts next month, delaying the end of the APP into 2019 is unlikely, as is altering the country weightings within the APP portfolio. More plausible options include pushing out forward guidance on future rate hikes, extending the maturity of the existing bond holdings, or introducing a new TLTRO to support lending. Impact On European Bonds & The Euro: The ECB is most likely to take a less hawkish slant in December, but will not signal any rapid move to begin hiking rates. This outcome will be bearish for the euro, but only neutral at best for overvalued European government bonds. Feature For the European Central Bank (ECB), the countdown is on to the December policy meeting, when a final decision will have to be made on the end of the Asset Purchase Program (APP). The central bank has been signaling throughout 2018 that net new APP bond purchases will stop at the end of the year, with a potential interest rate increase coming in September 2019 at the earliest. That decision on APP, however, will be conditional on the ECB remaining confident in its forecast that inflation will sustainably return to the target of "just below" 2%. Slumping European economic growth in 2018 means that the ECB's forecasts may prove to be too optimistic. This is especially true given the risks to growth and financial stability stemming from Italy's fiscal policy debate with the European Union, softening Chinese demand for European exports, and the uncertainties related to U.S. trade protectionism and the final U.K.-E.U. Brexit deal. Some pundits are even suggesting that the ECB may be forced to extend the APP program beyond December - or look for other ways to prevent a tightening of monetary conditions - even with headline inflation and wage growth having picked up across most countries. Against this increasingly muddled backdrop, what can the ECB credibly announce in December? In this Special Report, jointly published by BCA's Global Fixed Income Strategy and Foreign Exchange Strategy services, we discuss the state of the euro area economy and then consider the ECB's next potential policy moves, with ramifications for European bond yields and the euro. Our conclusion is that there are a few policy tools available to the ECB in case of a prolonged slump in growth, without having to bring on the operational difficulties from extending the APP beyond December. Such a "dovish" shift would be bearish for the euro but neutral, at best, for European government bonds which remain deeply overvalued. ECB Policy Dilemma: Slowing Growth Vs. Accelerating Inflation At last month's monetary policy meeting, ECB President Mario Draghi noted that the slowing economy was merely returning to trend (or potential) growth from an unsustainably fast pace in 2017 that was fueled by strong export demand. Looking at the broad swath of euro area economic data, Draghi's relatively optimistic assessment is not far off the mark. The euro zone has seen a clear loss of economic growth momentum since the start of the year (Chart 1). The initial read on real GDP for the third quarter, released last week, showed a deceleration to a below-potential quarterly growth pace of 1.7%. The manufacturing purchasing managers index (PMI) has fallen from a peak of 61 in December 2017 to 52 in October, mirroring a -1% decline in the OECD's leading economic indicator for the region. Chart 1A European Growth Slump, Not Yet A Downtrend
A European Growth Slump, Not Yet A Downtrend
A European Growth Slump, Not Yet A Downtrend
Yet not all the economic news has been that weak. Both consumer and business confidence remain at elevated levels according to the European Commission (EC) surveys, consistent with above-trend real GDP growth (bottom two panels). Even though exports have weakened substantially from the booming pace in 2017 - largely due to China's slowing growth - the EC survey on firms' export order books remains at robust levels and overall export growth has rebounded of late (Chart 2). The current conditions component of the euro area ZEW index has also ticked higher (top panel), as has the bank credit impulse (bottom panel). Chart 2Not All The Economic News Is Bad
Not All The Economic News Is Bad
Not All The Economic News Is Bad
The bigger issue for the ECB is that the recent cooling of growth comes at a time when, by almost all measures, there is little economic slack in the euro area. Capacity utilization is running at an 11-year high of 84%, while the output gap is effectively closed according to estimates from the IMF (Chart 3). Chart 3No Spare Capacity In Europe
No Spare Capacity In Europe
No Spare Capacity In Europe
With that gap projected to turn positive in 2019, core inflation in the euro zone should be expected to drift higher. Yet core inflation now remains stuck around 1%, well below the headline inflation figure of 2% that has been heavily influenced by past increases in energy prices (bottom panel). The labor market is sending signals that the current period of low euro area inflation may be turning around. The unemployment rate for the entire region fell to a 10-year low of 8.1% in September, well below both the ECB's latest 2018 forecast and the OECD's estimate of the full employment NAIRU (Chart 4). This tightening labor market is a broad-based phenomenon across the euro area, with nearly 80% of countries in the region having an unemployment rate below NAIRU (middle panel).1 The last two times there was such a broad-based decline in unemployment in the region, in 2001-02 and 2006-07, a significant tightening of monetary policy was required as measured by a simple Taylor Rule. Chart 4Broad-Based Labor Market Strength
Broad-Based Labor Market Strength
Broad-Based Labor Market Strength
Already, the tightening labor market is starting to put upward pressure on labor costs. The annual growth in wages & salaries accelerated to just over 2% in the second quarter of 2018. Similar to the fall in unemployment rates, the faster wage growth has also been widely seen throughout the region, with nearly three-quarters of euro area countries showing faster wage growth from one year ago (bottom panel). The mix of slowing growth momentum with some inflationary pressures can be seen in our ECB Monitor, which measures the cyclical pressures to tighten or ease monetary policy in the euro area. The Monitor had been signaling a need for tighter policy for most of the past two years, but has now fallen back to levels consistent with no change in policy (Chart 5). When breaking down the Monitor into its inflation and growth components, the latter has fallen the most. The inflation components remain in the "tight money required" zone above the zero line. Chart 5Our ECB Monitor Says 'Do Nothing'
Our ECB Monitor Says 'Do Nothing'
Our ECB Monitor Says 'Do Nothing'
Looking across the balance of the euro area data, President Draghi's assessment that the recent economic weakness is not the beginning of a sustained move to below-trend growth is justified. Given the broad evidence pointing to a lack of excess capacity across the euro area economy, it will take a much bigger growth slump before the ECB can shift to a more dovish policy bias. The critical series to monitor will be business confidence, capital spending and export orders. All are at risk of downshifting due to slowing global trade activity and sluggish Chinese demand. BCA's China experts continue to have doubts that the Chinese government will undertake any typical initiatives to stimulate demand, like interest rate cuts or fiscal spending, given worries about high domestic debt levels. Without the impetus from strong Chinese import demand boosting euro area exports, the current tightness of euro area labor markets, and uptrend in wage growth, may be at risk of a reversal, as we discussed in a recent Special Report.2 Bottom Line: Economic growth in the euro area has lost momentum, but it is not clear that an extended period of below-trend growth is unfolding. With most measures of spare capacity showing a lack of it, the ECB must still move forward with its plans to begin removing policy accommodation. What Tools Are Available For The ECB? Net-net, when looking at the broad balance of growth and inflation data at the moment, there is not yet enough evidence to suggest that the ECB needs to back away from its current plans to end net new APP purchases in December. That does not mean that the ECB would not consider changes to its total mix of monetary policy measures. The ECB has treated the APP, which began in 2015, as a "deflation fighting tool" during a period when there was excess capacity and very low inflation in the euro area. That is no longer the case, so it will be difficult for the ECB Governing Council to argue in December that new APP purchases are still necessary. It would take a substantial downward adjustment to the ECB growth and inflation forecasts, with a subsequent upward revision to the expectations for the unemployment rate, for the ECB to reconsider the plans to stop new bond purchases at year-end. Yet the ECB has also made it clear that interest rate hikes will not happen soon after the APP purchases end. Going back over the entire 20-year history of the ECB, there have only been three tightening episodes through rate hikes: 1999-2000, 2003-07 and 2011. In all three cases, what prompted the rate hikes was a period of broad-based increases in euro zone inflation that followed a period of equally broad-based euro zone economic growth. This can be seen in Chart 6, which shows "diffusion indices", or breadth across countries, for euro area real GDP and inflation. A higher number means that a greater percentage of individual nations is experiencing faster growth or inflation, and vice versa. During those three previous tightening cycles, the diffusion indices all reached elevated levels for growth and, more importantly, inflation. With more countries enjoying the upturn, the ECB could be more confident in seeing the need for interest rate increases to cool off demand to prevent an inflation overshoot. Chart 6No Need For ECB Rate Hikes Anytime Soon
No Need For ECB Rate Hikes Anytime Soon
No Need For ECB Rate Hikes Anytime Soon
At the moment, the diffusion indices are quite low, suggesting that few countries are witnessing accelerating growth or inflation. This means that there is no pressure for the ECB to move up its current dovish guidance to the markets about the timing of the first rate hike in late 2019. That also means that there is a risk that the ECB is forced to consider options for providing additional monetary accommodation if there was a large enough downgrade to its growth and inflation forecasts. If the ECB were to indeed lower its growth forecasts in December and consider additional easing options, there are only four plausible options at their disposal: 1) Extending the APP purchases beyond December, either at the current pace of €15bn/month or a slower pace between €5-10bn/month Extending the APP into 2019 is the least likely choice because the ECB is already close to some of the self-imposed constraints on its government bond holdings. The ECB has set a limit of owning no more than 33% of an individual country's allowable government bonds, with maturities of between 1-31 years. Right now, the ECB owns about 31% of all eligible German government debt (Chart 7), and would breach that 33% level sometime in the first half of 2019 if the current pace of buying was maintained without any increase in German bond issuance (i.e. smaller budget surpluses).3 A similar outcome would also occur for smaller bond markets, like the Netherlands and Finland (bottom panel). Chart 7ECB Will Hit Country Issuer Limits If Current APP Is Maintained
ECB Will Hit Country Issuer Limits If Current APP Is Maintained
ECB Will Hit Country Issuer Limits If Current APP Is Maintained
Of course, this is a self-imposed rule by the ECB that can easily be changed. That already occurred back in 2016 when the ECB allowed the purchase of bonds below the deposit rate as part of its APP operations. This meant that the ECB would buy bonds with negative yields, essentially guaranteeing a loss assuming that the bonds were held to maturity. Yet given how much emphasis the ECB has placed on abiding by the issuer limits, we think the ECB would consider other policy choices before raising them. 2) Changing the composition of the APP portfolio Changing the mix of bonds within the APP portfolio is a more likely option, but even this has its limits. The ECB could choose to buy more corporate bonds or covered bonds, but those are less liquid markets where there is arguably more evidence that ECB buying has impacted market functionality. The ECB may be reluctant to take on more credit risk in its bond portfolio, as well. At the country level, the ECB could choose to move away from using its Capital Key weightings to determine the allocation of its bond purchases by country. In the current heated political atmosphere in Europe, however, with the populist Italian government in a very public battle with the E.U. over its 2019 budget, the ECB will not want to be seen as favoring any country more than another by buying more government bonds in places like Italy or Spain over Germany and France. That can already be seen in how bond purchases have been allocated in 2018, with purchases sticking closer to the Capital Key weightings in Italy and France from the larger weightings seen in 2017 (Charts 8 & 9). Chart 8The ECB Capital Key ...
The ECB Capital Key...
The ECB Capital Key...
Chart 9... Is Not Always Adhered To
...Is Not Always Adhered Too
...Is Not Always Adhered Too
A more likely reallocation of bond holdings could occur within each country by adjusting the maturities held within the ECB's portfolio. Following the template of the Fed's 2012 "Operation Twist", the ECB could aim to sell shorter-dated bonds in exchange for longer-maturity debt, thereby exacting a flattening influence on government yield curves. There is scope for that in Germany, where the weighted-average-maturity (WAM) of the ECB's bond holdings has decline by 18 months since peaking in late 2015 (Chart 10). Large declines in WAW have also occurred for Spanish, Italian and Portuguese bonds owned by the ECB, if policymakers were willing to take on more duration risk in the Periphery. Chart 10The ECB Has Room To Extend Its APP Maturities
The ECB Has Room To Extend Its APP Maturities
The ECB Has Room To Extend Its APP Maturities
3) Extend forward guidance on the first rate hike The easiest option for the ECB in the event of a downgrade of its growth/inflation projections is to simply extend the forward guidance on the timing of the first interest rate hike. Right now, our Months-to-Hike indicators, which measure the time until a full rate hike is discounted in the European Overnight Index Swap (OIS) curve, are discounting a hike of 10bps by November 2019 and a hike of 25bps by May 2020 (Chart 11). The ECB could easily signal that any rate hike, of any size, would not occur before the latter half of 2020 if an additional easing move was required. This would mostly likely result in lower bond yields and a weaker euro, all else equal, helping easy monetary conditions in the euro area. Chart 11Extending Forward Guidance Is An Option
Extending Forward Guidance Is An Option
Extending Forward Guidance Is An Option
4) Introduce a new Targeted Long-Term Lending Operation (TLTRO) One final intriguing option for an ECB policy ease would be the introduction of another TLTRO. The last such targeted lending program occurred in 2016, but the first wave of the much larger program that began in 2014 has already started to run off the ECB's balance sheet. This is the most effective way to get European banks to extend credit to borrowers at lower interest rates, since the banks would be able to fund that borrowing via the TLTRO at a rate lower than market rates. President Draghi did note last month that some members of the Governing Council brought up the idea of a new TLTRO at the ECB's policy meeting, and some well-known investment banks have recently discussed the implications of a new operation. In our view, a new TLTRO is the most effective way for the ECB to provide stimulus via lower private borrowing rates. It would also help offset any negative ramifications of the reduction of the ECB's balance sheet from the expiration of prior TLTROs. This would likely only happen, though, if there was evidence that the credit channel was impaired in the euro area. The previous TLTROs occurred after a period when banks were tightening credit standards, corporate borrowing rates and credit spreads were widening, European bank stocks were falling and European bank lending standards were becoming more restrictive (Chart 12). Chart 12A New TLTRO? Watch Lending Standards
A New TLTRO? Watch Lending Standards
A New TLTRO? Watch Lending Standards
Today, bank stocks are falling and corporate bond yields/spreads are low but slowly rising, while European banks are actually easing lending standards according to the ECB's Q3 Bank Lending Survey. If the latter were to flip into the "tightening standards" zone, without any rebound in European bank shares or decline in corporate borrowing rates, the ECB could be tempted to go down the TLTRO route once again. Bottom Line: If the ECB downgrades its growth and inflation forecasts next month, delaying the end of the APP into 2019 is unlikely, as is altering the country weightings within the APP portfolio. More plausible options include pushing out forward guidance on future rate hikes, extending the maturity of the existing bond holdings, or introducing a new TLTRO to support lending. Likely ECB Options & Investment Implications In our view, the most realistic outcomes for the December ECB meeting can be boiled down to two decisions, conditional on how the ECB's economic forecasts are presented: 1) Unchanged growth & inflation forecasts: The ECB will signal the end of new APP bond purchases at the end of December, while maintaining the current forward guidance on rate hikes that no move will occur until at least September 2019. 2) Downgraded growth & inflation forecasts: The ECB will signal the end of new APP bond purchases at the end of December, but will also push out forward guidance on the first rate hike to at least sometime in mid-2020. In the latter scenario, the ECB could also consider two other options: extending maturities within its German bond holdings, or announcing a new TLTRO. We think that the ECB will wait to see how financial markets absorb the end of new APP buying before considering any move on maturity extension. At the same time, the ECB would signal that a TLTRO is a possibility if lending standards deteriorate and borrowing rates climb higher. While the ECB has talked a lot about how they will continue to reinvest the proceeds of maturing bonds in its portfolio, similar to what the Federal Reserve did after it ended its QE buying, the bigger impact on bond yields will come from a worsening of the supply/demand balance for European bonds. The ECB has been buying amounts greater than the entire net bond issuance of all euro area governments since the APP started in 2015, which has created a scarcity of risk-free sovereign debt for private investors. The result: extremely low bond yields, with a negative term premium (Chart 13). Reduced ECB buying will result in more bonds that have to be purchased by private investors, and a less negative term premium, going forward. Chart 13Bund Term Premium Unwind?
Bund Term Premium Unwind?
Bund Term Premium Unwind?
How high euro area bond yields eventually go will then be determined by more traditional factors, like inflation expectations and the expected path of ECB rate hikes. Going back to the ECB's previous tightening cycles over its existence, actual rate hikes did now occur before inflation expectations - as measured by 5-year CPI swaps, 5-years forward - rose above 2% (Chart 14). Those inflation expectations are now 32bps below that level, and the ECB will not begin to shift to less dovish forward guidance unless the markets begin to discount more stable inflation close to the ECB's "near 2%" target. Chart 14Not Enough Inflation (Yet) To Justify Rate Hikes
Not Enough Inflation (Yet) To Justify Rate Hikes
Not Enough Inflation (Yet) To Justify Rate Hikes
Dovish guidance on future ECB rate hikes will continue to widen the U.S.-Europe interest rate differentials that have helped weaken the euro versus the U.S. dollar in 2018 (Chart 15). This will continue to put downward pressure on EUR/USD cross, particularly with neutral momentum and positioning indicators suggesting that the euro is not yet oversold (bottom panel). Chart 15Likely ECB Actions Are Euro-Bearish
Likely ECB Actions Are Euro-Bearish
Likely ECB Actions Are Euro-Bearish
Bottom Line: The ECB is most likely to take a less hawkish slant in December, but will not signal any rapid move to begin hiking rates. This outcome will be bearish for the euro, but only neutral at best for overvalued European government bonds. Robert Robis, CFA, Senior Vice President Global Fixed Income Strategy rrobis@bcaresearch.com 1 Since not every country in the euro area is also part of the OECD, we could only use 14 of the 19 countries in the euro area in the indicator shown in the middle panel of Chart 5. 2 Please see BCA Foreign Exchange Strategy/Global Fixed Income Strategy Special Report, "Will Rising Wages Cause An Imminent Change In Policy Direction In Europe And Japan?, dated October 6th 2018, available at fes.bcaresearch.com and gfis.bcaresearch.com. 3 The ECB does allow the purchase of both federal government bonds, as well as the debt of government agencies and supranationals, as part of its APP. For our projections, we have assumed that of the €15bn in net new bonds that the ECB buys each month, 82% are debt issued by government-related entities (i.e. 18% goes to credit instruments like corporate bonds and covered bonds), with 10% of those government purchases going to supras. From that reduced number, we assume anywhere from 10-30% of purchases go to agencies, depending on the country. For the sake of simplicity, we also assume a pace of net government bond issuance in line with that seen over the past year, rather than make specific assumptions on changes in individual country budget deficits.
Highlights Investors are worrying too much about the things that caused the global financial crisis, and not enough about those that could cause the next downturn. Despite the recent patch of soft data, the U.S. housing market is in good shape. Go long homebuilders relative to the S&P 500. Imbalances in the corporate debt market have increased, but are not severe enough to generate systemic economic distress. U.S. rates will need to rise quite a bit more than the market anticipates before the economy slows by enough to force the Fed to back off. The combination of a stronger dollar and inadequate Chinese stimulus will continue to pressure emerging markets. Even Brazil's pro-capitalist new president may not be able to reverse the country's bleak fiscal dynamics. Our MacroQuant model, which predicted the correction, points to further near-term downside risk for global equities. The cyclical (12-to-18 month) outlook looks much better, however. Feature The Market's Maginot Line One of the most reliable ways to make money as an investor is to figure out the market's collective biases and trade against them. Behavioral economists have long noted that people tend to assign too much weight to recent experience in taking decisions. As a result, in finance, as in military strategy, there is a constant temptation to fight the last war. The last war policymakers waged was against the scourge of deflation that followed the housing bust and financial crisis. For much of the past decade, investors have held a magnifying glass over anything that could possibly resemble the conditions that led up to the Global Financial Crisis. While such behavior is understandable, it is misplaced. History suggests that both lenders and borrowers tend to act prudently for years, if not decades, following major financial crises. Mistakes are still made, but they are different mistakes. People overcompensate. They obsess about the past rather than focusing on the future. U.S. Housing Is Okay There is no denying that the U.S. housing market has softened this year (Chart 1). Housing starts, building permits, and home sales have all fallen. Residential investment has subtracted from GDP growth over three consecutive quarters. Chart 1Housing Has Been A Drag On The U.S. Economy This Year
Housing Has Been A Drag On The U.S. Economy This Year
Housing Has Been A Drag On The U.S. Economy This Year
There is little mystery as to why the housing market has been on the back foot. The Trump tax bill capped the deduction on state and local property taxes, while reducing the amount of mortgage debt on which homeowners can deduct interest payments from $1 million to $750,000. This had a negative effect on housing activity, especially in high-tax Democrat-leaning states with elevated real estate prices. More importantly, mortgage rates have risen by over 100 basis points since last August. Chart 2 shows that home sales and construction almost always decline after mortgage rates rise. In this respect, the weakness in housing activity is reminiscent of the period following the taper tantrum, when housing activity also slowed sharply. Chart 2No Mystery Why U.S. Housing Has Been Weak...
No Mystery Why U.S. Housing Has Been Weak...
No Mystery Why U.S. Housing Has Been Weak...
We do not expect mortgage rates to fall from current levels. But they are not going to rise at the same pace as they have over the past year. Thus, while the headwinds from higher financing costs will not disappear, they will abate to some extent. Fundamentally, the housing market is on solid ground (Chart 3). Mortgage rates are still well below their historic average. Home prices have risen considerably, but do not appear excessively stretched compared to rents or incomes. Unlike in 2006, the home vacancy rate is near its historic lows. Residential investment stands at only 3.9% of GDP, compared with a peak of 6.7% of GDP in the second half of 2005. The average age of the residential capital stock has risen by nearly five years since 2006, the largest increase since the Great Depression. With household formation rebounding briskly from its post-recession lows, homebuilders are still arguably not churning out enough new homes. Chart 3A...But Fundamentals Are Still In Good Shape (I)
...But Fundamentals Are Still In Good Shape (I)
...But Fundamentals Are Still In Good Shape (I)
Chart 3B...But Fundamentals Are Still In Good Shape (II)
...But Fundamentals Are Still In Good Shape (II)
...But Fundamentals Are Still In Good Shape (II)
Mortgage lenders have learned from past mistakes (Chart 4). While lending standards have eased modestly over the past 4 years, underwriting standards have remained high. The average FICO score for new borrowers is more than 40 points above pre-recession levels. The Urban Institute Housing Credit Availability index, which measures the percentage of home purchase loans that are likely to default over the next 90 days, is at reassuringly low levels. This is particularly the case for private-label mortgages, whose default risk has hovered at just over 2% during the past few years, down from a peak of 22% in 2006. Moreover, banks today hold much more high-quality capital than in the past, which gives them additional space to absorb losses (Chart 5). Chart 4Lending Standards Have Been Tight, But Are Starting To Loosen
Lending Standards Have Been Tight, But Are Starting To Loosen
Lending Standards Have Been Tight, But Are Starting To Loosen
Chart 5U.S. Banks Are Well Capitalized
U.S. Banks Are Well Capitalized
U.S. Banks Are Well Capitalized
With all this in mind, we are initiating a new strategic trade to go long U.S. homebuilders relative to the S&P 500.1 Corporate Debt: How Big Are The Risks? Unlike household debt, U.S. corporate debt has risen over the past decade and now stands at a record high level as a share of GDP. The quality of the lending has also been less than pristine, as evidenced by the proliferation of "covenant lite" loans. The interest coverage ratio for the economy as a whole - defined as the volume of profits corporations generate for every dollar of interest paid - is still above its historic average (Chart 6). However, this number is skewed by a few mega-cap tech companies that hold a lot of cash and have little debt. Chart 6Interest Coverage Looks Relatively High
Interest Coverage Looks Relatively High
Interest Coverage Looks Relatively High
My colleague Mark McClellan, who writes our monthly Bank Credit Analyst publication, has shown that the interest coverage ratio for companies comprising the Bloomberg Barclays index would drop close to the lows of the Great Recession if interest rates were to rise by a mere 100 basis points across the corporate curve. The damage would be far worse if profits also fell by 25% in this scenario.2 While the corporate debt market has become increasingly frothy, it does not pose an imminent danger to the economy. There are several reasons for this. First, while U.S. corporate debt is high in relation to the past, it is still quite low in comparison with many other economies (Chart 7). The ratio of corporate debt-to-GDP, for example, is 30 percentage points higher in the euro area. This suggests that U.S. businesses still have the "carrying capacity" to take on additional debt. Chart 7U.S. Corporate Debt Is Not That High By Global Standards
U.S. Corporate Debt Is Not That High By Global Standards
U.S. Corporate Debt Is Not That High By Global Standards
Second, the average maturity of U.S. corporate debt has risen over the past decade, with an increasing share of companies opting for fixed over floating-rate borrowings. This implies that it will take a while for the effect of higher rates to make their way through the system. Third, and perhaps most importantly, corporate bonds are generally held by non-leveraged investors such as pension funds, insurance companies, and ETFs. Bank loans account for only 18% of nonfinancial corporate-sector debt, down from 40% in 1980 (Chart 8). The share of leveraged loans held by banks has declined from about 25% a decade ago to less than 10% today. Chart 8Banks Have Reduced Their Exposure To The Corporate Sector
Banks Have Reduced Their Exposure To The Corporate Sector
Banks Have Reduced Their Exposure To The Corporate Sector
Tellingly, we already had a dress rehearsal for what a corporate debt scare might look like. Credit spreads spiked in 2015. Default rates rose, but the knock-on effects to the financial system were minimal (Chart 9). This suggests that corporate America could withstand quite a bit of monetary tightening without buckling under the pressure. Chart 9The 2015 Debt Scare Did Not Topple The Economy
The 2015 Debt Scare Did Not Topple The Economy
The 2015 Debt Scare Did Not Topple The Economy
Government Debt: No Worries... Yet If the risks posed by both the housing market and corporate debt market are contained, what about the risks posed by soaring government debt? The long-term fiscal outlook is certainly bleak, but the near-term risks are low.3 President Trump's tweets aside, the U.S. has an independent central bank which has been able to keep inflation expectations well anchored. The U.S. private sector is also running a financial surplus at the moment, meaning that it earns more than it spends (Chart 10). Not only does this make the economy more resilient, it also provides the government with additional savings with which to finance its fiscal deficit. Chart 10The U.S. Private Sector Is A Net Saver
The U.S. Private Sector Is A Net Saver
The U.S. Private Sector Is A Net Saver
The private sector's financial balance will deteriorate over the next two years as household savings decline and corporate investment rises. This will put upward pressure on Treasury yields. However, if rising yields are reflective of stronger aggregate demand, this is unlikely to derail the economy. When Things Break Recessions are usually caused when the Fed raises rates by enough to undermine spending on interest rate-sensitive purchases such as housing, or when higher rates prick an asset bubble just waiting to burst. Given the lack of clear imbalances either in the real economy or financial markets, the Fed may have to raise rates significantly more than the market is currently anticipating. In fact, far from having to press the pause button midway through next year, our baseline expectation is that the Fed will expedite the pace of rate hikes in late 2019 as inflation finally starts to accelerate. Aggressive Fed rate hikes combined with an incrementally less expansionary fiscal policy will sow the seeds of a recession in late 2020 or 2021. Before the next U.S. downturn arrives, the dollar will have strengthened further. A resurgent greenback will cast a long shadow over emerging markets and commodity producers. As we discussed last week, China is unlikely to save the day by launching a massive stimulus program of the sort that it orchestrated in both 2009 and 2015.4 True, not all emerging markets are equal. Emerging Asia is more resilient now than it was two decades ago. Thailand, for example, was patient zero for the Asian crisis in 1997. Today, it sports a current account surplus of over 10% of GDP and low levels of external debt. This resilience will not prevent Asian economies from experiencing slower growth on the back of weaker Chinese demand, but it will prevent a full-blown balance of payments crisis from spiraling out of control. In contrast to Emerging Asia, Latin America looks more vulnerable (Table 1). BCA's chief emerging market strategist, Arthur Budaghyan, wisely upgraded Brazilian assets on a tactical basis on October 9th ahead of the presidential elections. Nevertheless, Arthur still worries that Brazil's daunting fiscal challenges - the budget deficit currently stands at 7.8% of GDP and the IMF expects government debt to rise to nearly 100% of GDP over the next five years (Chart 11) - are so grave that even South America's answer to Donald Trump may not be able to save the Brazilian economy. Table 1Vulnerability Heat Map For Key EM Markets
Fighting The Last War
Fighting The Last War
Chart 11Brazil Is Fiscally Challenged
Brazil Is Fiscally Challenged
Brazil Is Fiscally Challenged
A Correction, Not A Bear Market The current market environment bears some similarities to the late 1990s. The Fed is tightening monetary policy in order to keep the domestic economy from overheating. The U.S. economy is responding to higher rates to some extent, but the main effects are being felt overseas. The Asian Crisis did not end the bull market in U.S. stocks, but it did generate a few nasty selloffs, the most notable being the 22% peak-to-trough decline in the S&P 500 between July 20 and October 8, 1998. We witnessed such a selloff this October. The bad news is that our MacroQuant model is pointing to additional equity weakness over the coming weeks (Chart 12). The model tends to downgrade stocks whenever growth is slipping, financial conditions are tightening, and sentiment is deteriorating from bullish levels. All three of these things are currently occurring. Chart 12MacroQuant* Model Suggests Caution Is Warranted
Fighting The Last War
Fighting The Last War
The good news is that none of our recession indicators are flashing red. Since recessions and bear markets typically overlap (Chart 13), the odds are high that the current stock market correction will be just that, a correction. Chart 13Recessions And Bear Markets Usually Overlap
Recessions And Bear Markets Usually Overlap
Recessions And Bear Markets Usually Overlap
Peter Berezin, Chief Global Strategist Global Investment Strategy peterb@bcaresearch.com 1 The corresponding ETFs are long ITB/short SPY. 2 Please see The Bank Credit Analyst Special Report, "The Long Shadow Of The Financial Crisis," dated October 25, 2018. 3 It is actually not even clear that a loss of confidence in America's fiscal management would cause a recession. The Fed largely determines borrowing costs at the short-to-medium end of the yield curve, which is where the government finances most of its debt. If people lose confidence in the dollar, they will either need to run down their cash balances by purchasing more goods and services or try to move their wealth abroad. The former will directly increase aggregate demand, while the latter will indirectly increase it through a weaker currency. To be clear, we are not suggesting that such an outcome would be beneficial to the economy; it would, among other things, greatly slow potential GDP growth by discouraging investment. But the near-term effect would likely be economic overheating and rising inflation rather than a recession. 4 Please see Global Investment Strategy Weekly Report, "Chinese Stimulus: Not So Stimulating," dated October 26, 2018. Strategy & Market Trends Tactical Trades Strategic Recommendations Closed Trades