Global

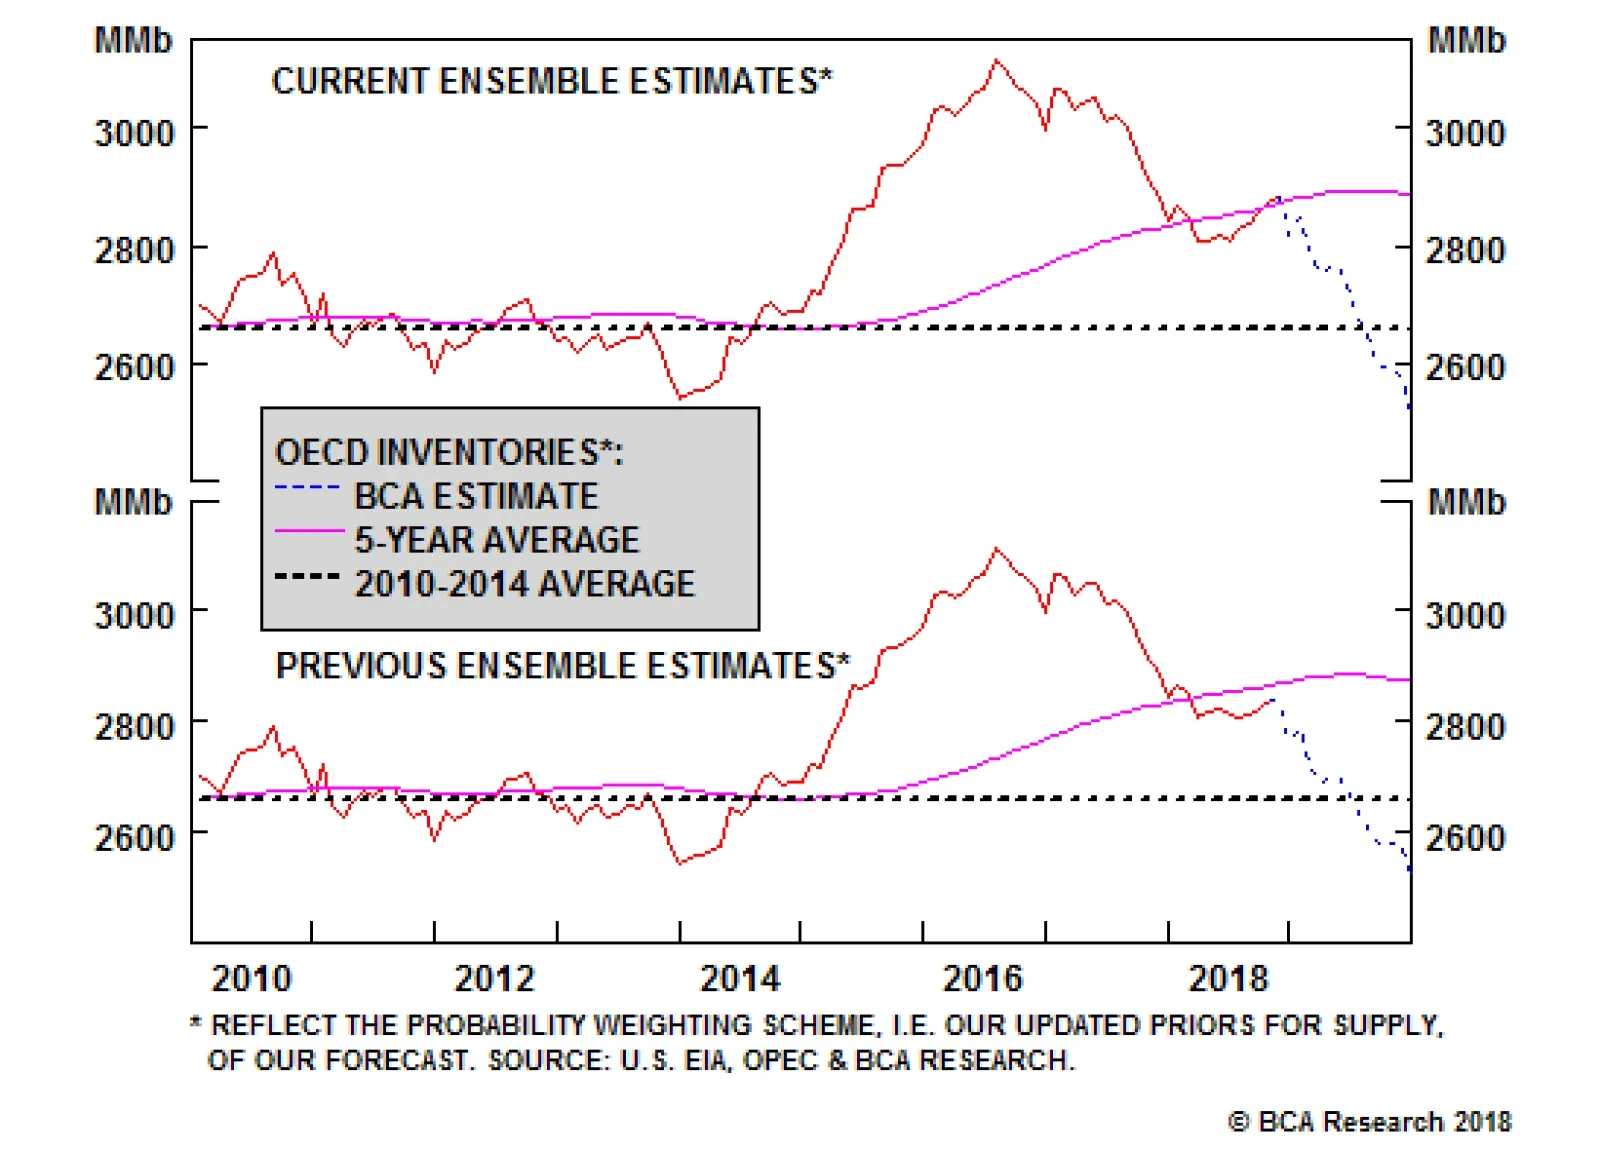
Dear Commodity & Energy Strategy clients, We went into the G20 meeting this past weekend expecting the leaders of OPEC 2.0 to instruct their ministers to cut oil output by 1.0mm – 1.4mm b/d at their upcoming meeting in Vienna. However, we could see higher cuts: News reports suggest OPEC 2.0 – the OPEC/non-OPEC coalition lead by Saudi Arabia and Russia – could agree to re-instate its original production-management accord agreed in November 2016, under which 1.8mm b/d of output was taken off the market. In addition to the G20 news, Alberta Premier Rachel Notley served notice an 8.7% production cut – 325k b/d of crude and oil-sands output in the province – will commence January 1. The province also intends to secure rail transport to move 120k b/d. In this update, we reprise the events that led to the price collapse of the past month, and present what we consider the most likely outcome of the OPEC 2.0 Vienna meeting on December 6. As was the case in 2015, this agreement will be one of the critical determinants of oil prices next year. First a brief review of the price collapse of the past month. Toward end-October, the Trump administration – likely the State Department – realized the re-imposition of sanctions on Iran could remove as much as 1.7mm b/d of exports from the market. Our own estimate had 1.25mm b/d of Iranian exports being lost to the market under the re-imposition of the Iran sanctions. At the upper end of market estimates, the amount of crude removed from the market could have exceeded total global spare capacity to meet any unplanned oil-production outage. Such an outage – e.g., losing 500k b/d from Iraq, Libya or Nigeria, or the total collapse of Venezuela, which would take ~ 1mm b/d off the market – would have produced a supply shock. In such a scenario, prices would rally through $100/bbl, and likely would push even higher if a large unplanned outage occurred while Iranian exports were falling. With U.S. shale supplies growing 1.3mm b/d, and demand growing 1.45mm b/d next year, per our modeling, demand destruction would have ensued, with higher prices required to allocate increasingly scarce supply, if such an outage hit the market. Following what appears to have been a lengthy internal debate on the sanctions at the end of October and beginning of November, the Trump administration ended up granting waivers on the sanctions to Iran’s eight (8) largest importers. In so doing, a potential supply shock that almost surely would have resulted in a price spike was transformed into a short-term supply glut, which collapsed prices. The waivers, in other words, were a supply shock to the downside. Little if any detail has been made available regarding the waivers by the Trump administration. Markets literally were left to scramble to calibrate new supply-demand balances in the dark (Chart 1). Chart 1Waivers Were A Downside Supply Shock to Markets ...
Waivers Were A Downside Supply Shock to Markets ...
Waivers Were A Downside Supply Shock to Markets ...
Following the waivers, longer-dated futures followed the front of the curve lower and backwardated markets – reflecting increasingly tight supply-demand balances – became contango to flat markets (Chart 2). The immediate shock of the waivers likely was compounded by speculative liquidation along the curve, not just at the front (Chart 3). The vertical jump in implied volatilities suggests the entire market – hedgers and speculators – was caught off guard by the waivers (Chart 4). The waivers likely prompted producers to accelerate hedging programs, as speculators unwound long positions. In addition, upward revisions of U.S. production – following the addition of more than 2mm b/d of new takeaway capacity from the Permian Basin by the end of 2019 – likely played a role in accelerating longer-dated hedging programs. It is worthwhile noting the backwardation in Brent returns to the forward curve in 2H19 then flattens, while for WTI, the curve carries slightly month-on-month to the end of 2020, then pretty much flattens out thereafter (Chart 5). It also is worthwhile noting the back of the curve fell less than the front of the curve, as the graphs above show. Chart 2... And Backwardations Disappeared, As Supply Suddenly Increased
... And Backwardations Disappeared, As Supply Suddenly Increased
... And Backwardations Disappeared, As Supply Suddenly Increased
Chart 3Speculators Exited Oil
Speculators Exited Oil
Speculators Exited Oil
Chart 4Volatility Surged Following Waivers
Volatility Surged Following Waivers
Volatility Surged Following Waivers
Chart 5Waivers Flatten Forward Curves
Waivers Flatten Forward Curves
Waivers Flatten Forward Curves
Markets Still Are In The Dark OPEC 2.0 member states – having access to their customers’ demand schedules – have some idea of what the waivers entail, and are adjusting their supply schedules accordingly. We went into the G20 meeting expecting production cuts of between 1.0mm and 1.4mm b/d. All the same, we could see higher cuts: News reports suggest OPEC 2.0 could re-instate its original production-management accord agreed in November 2016, under which 1.8mm b/d of output was taken off the market. Nonetheless, we continue to expect cuts to come in on either side of 1.2mm b/d from OPEC 2.0 following its Vienna meeting. In Alberta, as we discussed in last week’s CES, the government’s action was undertaken to narrow the sometimes-massive basis differentials between WTI, the U.S. benchmark, and WCS, the Canadian benchmark for crude-oil pricing. The WTI – WCS spread has been under persistent pressure due to a lack of storage and takeaway capacity. According to the CBC, the government is losing $80mm per day due to the takeaway and storage constraints. The 8.7% cuts will remain in place until some 35mm barrels of oil in storage is shipped to refining markets, most likely in the Spring, according to the CBC. By the end of next year, the production cuts are expected to fall to 95k b/d, following the opening of new takeaway pipeline capacity. There are a few caveats to keep in mind going forward: Production cuts from OPEC 2.0 could be larger than the upper estimate we are working with (1.4mm b/d). The Iranian import waivers are expected to expire in 2H19. However, the Trump administration could unilaterally extend them, given the expansion of Permian takeaway capacity will not be fully completed till 4Q19. Also, U.S. crude oil export capacity will not be sufficient to move surplus crude from the U.S. to global markets for a couple of years at best. This likely is what underlies the forward market’s flattening post-2020. Venezuela is still subject to larger-than-expected decrease in production: We attach a 33% probability to the total collapse of Venezuela over the next year, which could remove ~ 800k b/d of exports from the market, and severely test OPEC 2.0’s spare capacity. On the demand-side, the market (and BCA Research) expect a slowdown in global growth next year. However, the Trump – Xi talks at the G20 this past weekend pointing toward a greater willingness to resolve trade differences could revive global trade and commodity demand, particularly for oil and base metals. This is not a given, however, and we are not adjusting our demand expectation of 1.46mm b/’d of growth next year because of it. Robert P. Ryan, Senior Vice President Commodity & Energy Strategy rryan@bcaresearch.com
GAA DM Equity Country Allocation Model Update The GAA DM Equity Country Allocation model is updated as of November 30, 2018. The quant model further downgraded U.S. in favor of the non-U.S. block, especially Germany, the Netherlands, Swiss, Spain and Canada as shown in Table 1. Table 1Model Allocation Vs. Benchmark Weights
GAA Quant Model Updates
GAA Quant Model Updates
As shown in Table 2 and Charts 1 - 3, the overall model outperformed the MSCI world benchmark by 1 bp in November, with a 27 bps of outperformance from Level 2 model offset by a 10 bps of underperformance from Level 1. Since going live, the overall model has outperformed by 46 bps, with Level 2 outperforming by 156 bps and level 1 underperforming by 12 bps. Table 2Performance (Total Returns In USD %)
GAA Quant Model Updates
GAA Quant Model Updates
Chart 1GAA DM Model Vs. MSCI World
GAA DM Model Vs. MSCI World
GAA DM Model Vs. MSCI World
Chart 2GAA U.S. Vs. Non U.S. Model (Level 1)
GAA U.S. Vs. Non U.S. Model (Level 1)
GAA U.S. Vs. Non U.S. Model (Level 1)
Chart 3GAA Non U.S. Model (Level 2)
GAA Non U.S. Model (Level 2)
GAA Non U.S. Model (Level 2)
Please see also the website http://gaa.bcaresearch.com/trades/allocation_performance. For more details on the models, please see Special Report, “Global Equity Allocation: Introducing The Developed Markets Country Allocation Model,” dated January 29, 2016, available at https://gaa.bcaresearch.com. Please note that the overall country and sector recommendations published in our Monthly Portfolio Update and Quarterly Portfolio Outlook use the results of these quantitative models as one input, but do not stick slavishly to them. We believe that models are a useful check, but structural changes and unquantifiable factors need to be considered too in making overall recommendations. GAA Equity Sector Selection Model Dear Client, As advised in our October 2018 Special Alert, we have suspended the GAA Equity Sector Selection Model due to the significant changes in the GICS sector classifications, implemented at the end of September. We will rebuild the model using the newly constituted sectors once full back data is available from MSCI, which we understand will be in December. We thank you for your understanding. Xiaoli Tang, Associate Vice President xiaoliT@bcaresearch.com Amr Hanafy, Research Associate amrh@bcaresearch.com
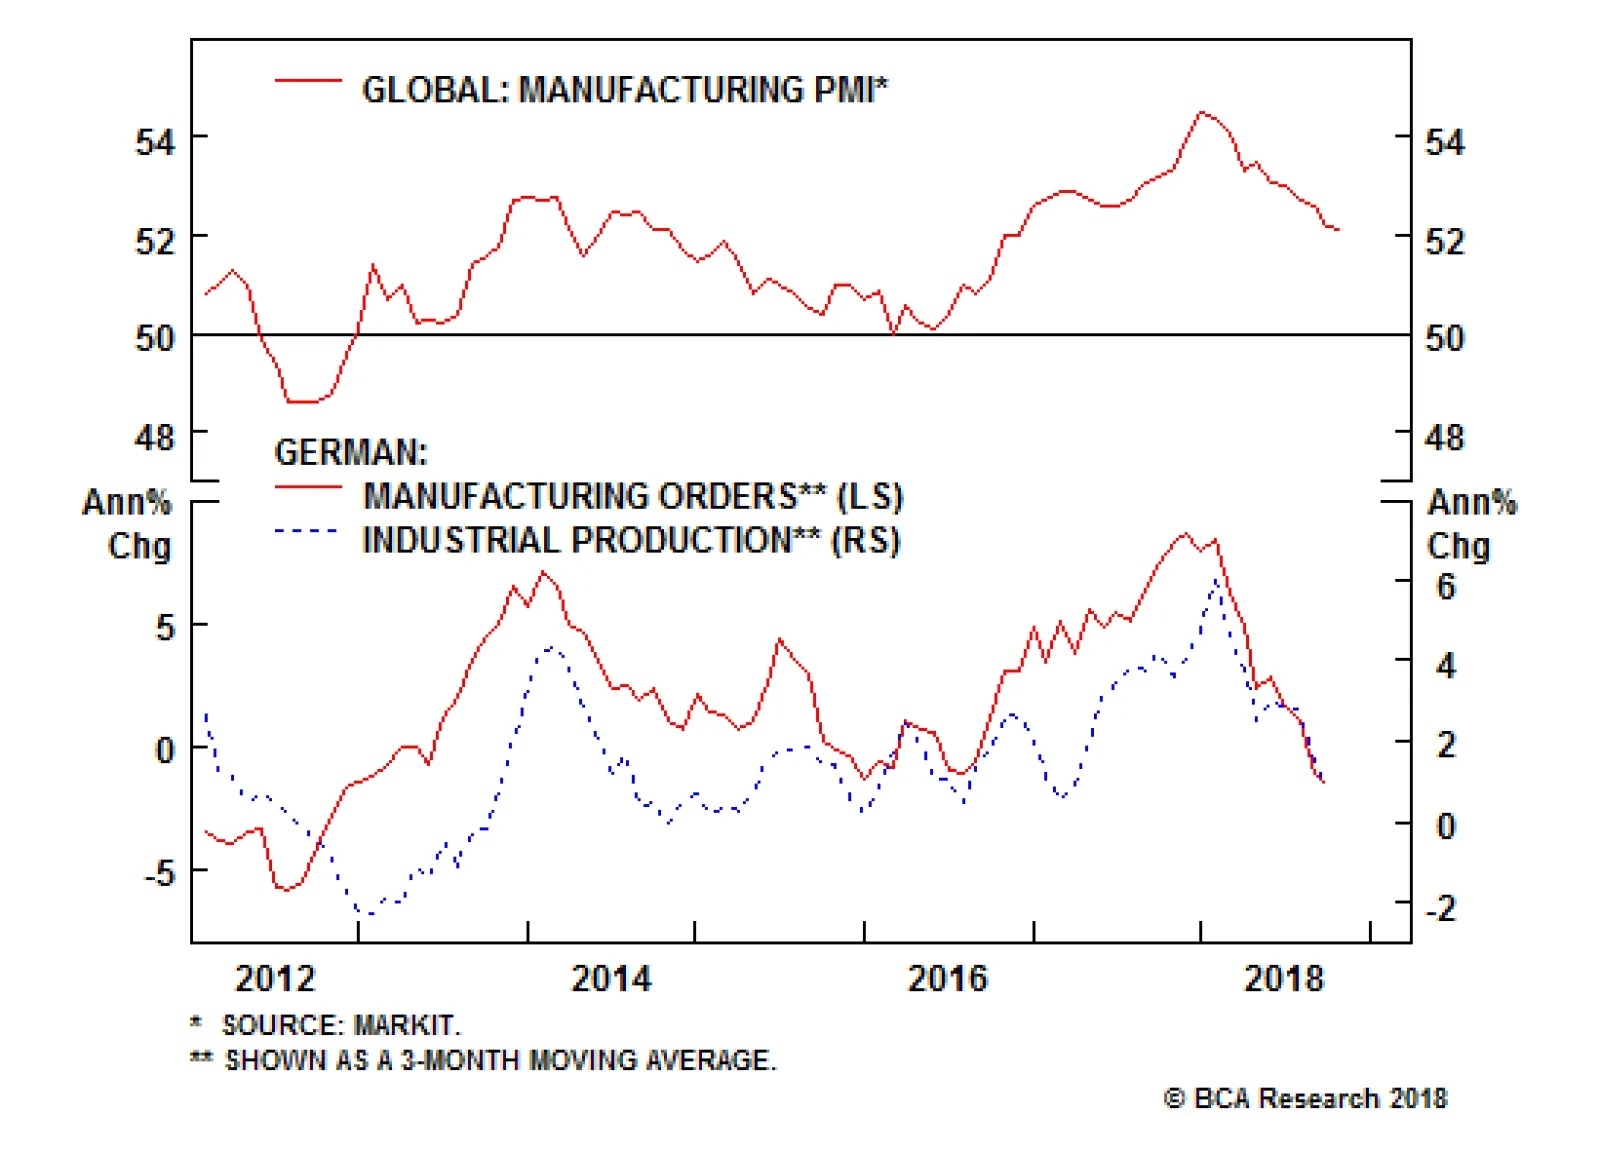
Next week’s economic calendar will be unusually busy. Global manufacturing PMIs will come out on Monday, giving us an opportunity to gauge whether or not the global soft patch in trade and industrial activity is still deepening. If there are no signs of an…
One of these oddities was the sharp decoupling of crude oil from other industrial commodity prices. It is highly unusual for crude oil to outperform copper by 50% in the space of just six months. We argued that such an extreme deviation would have to correct…
Highlights We are exploring the key FX implications of the views presented in BCA’s 2019 annual outlook. Global growth is set to weaken further in the first half of the year. As a result, the U.S. dollar should benefit from a last hurrah before beginning a long painful period of depreciation. The euro will mirror these dynamics and should depreciate below EUR/USD 1.10 before appreciating significantly during the second half. The yen is likely to rally against the EUR in the first half of the year, but the JPY will be left very vulnerable once global growth picks up again. The Swiss franc might be a safe-haven currency, but risks are rising that the Swiss National Bank will increasingly fight against the CHF’s upside vis-à-vis the euro. Thus, EUR/CHF has limited downside while global growth slows, and plenty of upside once global growth firms. The GBP could continue to experience some volatility, but we recommend using any additional weaknesses to buy cable. The commodity and Scandinavian currencies will suffer in the first half of the year, but they should prove the stars of the currency market in the second half. Feature Key View From The Outlook This past Monday we sent you BCA’s Annual Outlook, exploring the key macroeconomic themes that we expect will shape 2019. This year, the discussion between BCA’s editors and Mr. X, and his daughter, Ms. X, yielded the following key views:1 The collision between policy and markets that we discussed last year finally came to a head in October. Rather than falling as they normally do when stocks plunge, U.S. bond yields rose as investors reassessed the Federal Reserve’s willingness to pause hiking rates, even in the face of softer growth. Likewise, hopes that China would move swiftly to stimulate its economy were dashed as it became increasingly clear that the authorities were placing a high emphasis on their reforms agenda of deleveraging and capacity reduction. The ongoing Brexit saga and the stalemate between the populist Italian government and the EU have increased uncertainty in Europe at a time when the region was already beginning to slow. We expect the tensions between policy and markets to be an ongoing theme in 2019. With the U.S. unemployment rate at a 48-year low, it will take a significant slowdown for the Fed to stop hiking rates. Despite the deterioration in economic data over the past month, real final domestic demand is still tracking to expand by 3% in the fourth quarter, well above estimates of a sustainable pace of economic growth. Ultimately, the Fed will deliver more hikes next year than discounted in the markets. This will push up the dollar and keep the upward trend in Treasury yields intact. The dollar should peak midway next year. China will also become more aggressive in stimulating its economy, which will boost global growth. However, until both of these things happen, emerging markets will remain under pressure. For the time being, we continue to favor developed-market equities over their EM peers. We also prefer defensive equity sectors such as health care and consumer staples over cyclical sectors such as industrials and materials. Within the developed market universe, the U.S. will outperform Europe and Japan for the next few quarters, especially in dollar terms. A stabilization in global growth could ignite a blow-off rally in global equities. If the Fed is raising rates in response to falling unemployment, this is unlikely to derail the stock market. However, once supply side constraints begin to fully bite in early 2020 and inflation rises well above the Fed’s 2% target, stocks will begin to buckle. This means a window exists next year where stocks will outperform bonds. We are maintaining a benchmark allocation to stocks for now but will increase exposure if global bourses were to fall significantly from current levels without a corresponding deterioration in the economic outlook. Corporate credit will underperform stocks as government bond yields rise. A major increase in spreads is unlikely so long as the economy is still expanding, but spreads could still widen modestly given their low starting point. U.S. shale companies have been marginal producers in the global oil sector. With breakeven costs in shale at close to $50/bbl, crude prices are unlikely to rise much from current levels over the long term. However, over the next 12 months, we expect production cuts in Saudi Arabia will push prices up, with Brent crude averaging around $82/bbl in 2019. A balanced portfolio is likely to generate average returns of only 2.8% a year in real terms over the next decade. This compares to average returns of around 6.6% a year between 1982 and 2018. Essentially, global growth is likely to stay weak in the first half of 2019. However, even if it experiences a benign slowdown, the U.S. economy continues to run above trend, and a U.S. recession next year is a low-probability event (Chart 1). This suggests the Fed will continue to increase rates at a gradual pace of one hike per quarter until U.S. financial conditions become tight enough to force a re-assessment of the U.S. growth outlook. This configuration is likely to result in additional market stress globally and a stronger dollar. As a result, a defensive stance in the FX market seems warranted. Chart 1The Fed Isn't Ready To Capitulate
The Fed Isn't Ready To Capitulate
The Fed Isn't Ready To Capitulate
However, China has a role to play in this script as well. The Chinese authorities are getting very uncomfortable with the continued deceleration in Chinese activity. They will likely further support their economy, which should cause global growth to trough toward the middle of the year. This will result in a major selling opportunity for the dollar, and a buying opportunity for the most pro-cyclical currencies. Implications For The FX Markets What are the key implications of these views for currency markets? Based on this outlook for global growth and the Fed, the USD should generate a healthy performance in the first half of the year. As Chart 2 illustrates, the dollar is often strong when global growth and global inflation weaken. However, if global growth is indeed set to rebound in the second half of the year, then, at this point, the dollar should depreciate considerably. This is even more likely as speculators are already very long the greenback, and thus there will be ample firepower to sell the USD once macroeconomic conditions warrant it (Chart 3). As a result, a DXY dollar index above 100 could represent an interesting opportunity for long-term investors to lighten up their dollar exposure. Chart 2The Dollar And The Global Business Cycle
2019 Key Views: The Xs And The Currency Market
2019 Key Views: The Xs And The Currency Market
Chart 3Fuel For The Dollar's Downside
Fuel For The Dollar's Downside
Fuel For The Dollar's Downside
The euro continues to behave as the anti-dollar; since buying EUR/USD is the simplest, most liquid vehicle for betting against the dollar, and vice versa. Our bullish dollar stance is therefore synonymous with a negative take on the euro. Also, while American growth is showing budding signs of deceleration, slowing global trade and Chinese economic activity have a more pronounced impact on Europe. As a result, euro area growth is underperforming the U.S. Finally, since the Great Financial Crisis, EUR/USD has lagged the differential between European and U.S. core inflation by roughly six months. Today, this inflation spread does point to a weaker EUR/USD for the opening quarters of 2019, but it also highlights that the euro may rebound toward the end of the second quarter (Chart 4). Chart 4The Euro Will Rebound, But This Will Not Happen Immediately
The Euro Will Rebound, But This Will Not Happen Immediately
The Euro Will Rebound, But This Will Not Happen Immediately
Additionally, since momentum has a great explanatory power for the dollar, it tends to work well for the anti-dollar, the euro. Currently, momentum suggests that the euro has also more downside. Our favored fair value model for EUR/USD – which includes real short rate differentials, the relative slope yield curves, and the price of copper relative to lumber – stands at 1.11 (Chart 5). Since the euro tends to bottom at discounts to its equilibrium, this suggests that the common currency is likely to find a floor toward 1.08. Chart 5The Euro Will Fall Between 1.08 And 1.05
The Euro Will Fall Between 1.08 And 1.05
The Euro Will Fall Between 1.08 And 1.05
On a long-term basis, the yen is cheap, and therefore, already reflects the fact that the Bank of Japan’s balance sheet has now grown to 100% of GDP (Chart 6). However, this is of little comfort for the next 12 months. Over this period, movements in global bond yields will determine the yen’s gyrations. Since we expect global growth to slow further in the first half of the year, global yields are likely to remain contained until the second half of 2019. The impact on the yen of fluctuating global yields will be magnified by Japan’s incapacity to generate much inflationary pressure, with core inflation stuck at 0.4%. This means that while JGB yields have limited downside when global bonds rally, they only have very limited upside when global yields rise. Hence, during the first six months or so of the new year the yen is likely to experience limited downside against the dollar and may even experience significant upside against the euro (Chart 7). However, the second half of 2019 is likely to witness a significant reversal of this trend, with a weaker yen against the dollar, and a much stronger EUR/JPY. Chart 6The Yen Is Very Cheap
The Yen Is Very Cheap
The Yen Is Very Cheap
Chart 7Selling EUR/JPY Should Be A Winner In H1
Selling EUR/JPY Should Be A Winner In H1
Selling EUR/JPY Should Be A Winner In H1
At this juncture, the pound remains the trickiest currency to forecast. We are entering the last innings of the Brexit negotiations, and Prime Minister Theresa May looks particularly frail. Bad news out of Westminster will most likely continue to hit the pound at regular intervals. However, GBP/USD is cheap enough on a long-term basis that after the month of March, it could experience meaningful upside against the dollar (Chart 8). We are therefore reluctant to sell the pound at current levels, and instead are looking to buy cable each time undesirable headlines knock it down. As the probability grows that the ultimate form of divorce agreement will be a “soft Brexit,” this also means that once the ultimate deal between London and Brussels is set to be ratified by the British Parliament, EUR/GBP could experience significant downside as well (Chart 9). Chart 8Start Buying The Pound
Start Buying The Pound
Start Buying The Pound
Chart 9Substantial Downside In EUR/GBP
Substantial Downside In EUR/GBP
Substantial Downside In EUR/GBP
The Swiss franc benefits against the euro when global growth weakens and asset market volatility rises. This safe-haven attribute of the franc lies behind the 5.4% decline in EUR/CHF since April. Therefore, our view on global growth would suggest that EUR/CHF could experience additional downside in the first half of 2019. However, we are not willing to make this bet. The Swiss National Bank continues to characterize the Swiss franc as being expensive, and Swiss inflation, retail sales and industrial production have all decelerated. In fact, the Economic Expansion Survey indicator is plunging at its quickest pace since the Swiss economy relapsed directly after the botched re-evaluation of the franc in January 2015 (Chart 10). This suggests the SNB will likely soon put a cap on the franc’s strength as it is causing potent damage to the country. This means that EUR/CHF has limited downside in the first half of 2019, even if global growth deteriorates, and should have large upside in the second half of the year as global growth perks up. Chart 10The SNB Will Not Seat On Its Hands: Buy EUR/CHF
The SNB Will Not Seat On Its Hands: Buy EUR/CHF
The SNB Will Not Seat On Its Hands: Buy EUR/CHF
Commodity currencies could perform very well in the second half of the year, once global growth finds a firmer footing. The oil currencies should perform best over that period, as BCA’s oil view remains firmly bullish, with a 2019 target of $82/bbl if OPEC agrees to a deal. Moreover, the CAD and the NOK are still the cheapest currencies within this group. However, in the first half of the year, the commodity currency complex remains at risk. Slowing global growth and a Fed committed to lifting interest rates to levels more consistent with the U.S. neutral rate are likely to cause the volatility of the currency market to trend higher (Chart 11). Historically, commodity currencies perform poorly when this happens. This is because when FX volatility picks up, carry trades suffer, which hurts global liquidity conditions and hampers global growth further (Chart 12). The AUD is particularly vulnerable as it is the currency most exposed to China’s capex and construction cycles. Moreover, the Reserve Bank of Australia is still very dovish, as there are no inflationary pressures in Australia. Chart 11The Global Macro Outlook Points To Higher FX Vol...
The Global Macro Outlook Points To Higher FX Vol...
The Global Macro Outlook Points To Higher FX Vol...
Chart 12...And Higher FX Vol Hurts Global Growth Via The Carry Trades
...And Higher FX Vol Hurts Global Growth Via The Carry Trades
...And Higher FX Vol Hurts Global Growth Via The Carry Trades
Scandinavian currencies are traditionally very pro-cyclical. This reflects the high sensitivity of the Swedish and Norwegian economies to the global business cycle. As a result, when global growth weakens and global inflation disappoints, they are likely to perform as poorly as the AUD and the NZD (Chart 13). Chart 13Weak Global Growth Will Hurt Scandinavian Currencies In H1 2019...
2019 Key Views: The Xs And The Currency Market
2019 Key Views: The Xs And The Currency Market
Despite this clouded outlook for the beginning of the year, the scandies should perform very well in the second half of 2019, once global growth stabilizes. With their economies at full employment and exhibiting growing imbalances, both the Riksbank and the Norges Bank are in the process of slowly moving away from extremely easy monetary policy settings. However, they have a long way to go before reaching tight monetary conditions, which implies plenty of upside for real interest rates in both countries. This means that the boost to the SEK and the NOK from rising global growth in the second half of the year will be magnified by domestic factors. Finally, both the SEK and the NOK are very cheap, adding upside risks to these currencies (Chart 14). Chart 14...But Scandies Will Have A Stellar H2 2019
...But Scandies Will Have A Stellar H2 2019
...But Scandies Will Have A Stellar H2 2019
Mathieu Savary, Vice President Foreign Exchange Strategy mathieu@bcaresearch.com Footnote 1 The full report – a BCA Research Special – titled “OUTLOOK 2019: Late-Cycle Turbulence”, dated November 26, 2018, is available at fes.bcaresearch.com Trades & Forecasts Forecast Summary Core Portfolio Closed Trades
Dear Client, In addition to today’s report, we sent you our 2019 Outlook earlier this week, featuring a discussion between BCA editors and Mr. and Ms. X. Best regards, Peter Berezin, Chief Global Strategist Highlights Today’s macroeconomic backdrop of slowing global growth, plunging oil prices, falling equity prices, widening credit spreads, and a strong dollar is reminiscent of what transpired in 2015. We do not expect global capital spending to contract as much as it did back then, partly because Saudi output cuts should preclude the need for shale producers to slash capex plans. Nevertheless, global growth is likely to slow further into the first half of next year, suggesting that equities and other risk assets could face renewed near-term pressures. The sell-off in the dollar following Powell’s speech is unwarranted. We expect the DXY to reach 100 by early next year. Global bond yields will rise by more than currently discounted over a 12-to-18 month horizon, but are likely to fall somewhat over the next few months. Feature Echoes From The Past Today’s macroeconomic backdrop is starting to look increasingly similar to 2015, a year when the global economy slowed sharply and commodity prices took it on the chin. In 2014, the Fed was gearing up to raise rates while other central banks were still in full-out easing mode. The divergence in monetary policies between the U.S. and the rest of the world caused the U.S. dollar to surge. The broad trade-weighted dollar strengthened by 16% between July 2014 and March 2015 (Chart 1). Chart 1Current Dollar Strength: Replay Of 2015?
Current Dollar Strength: Replay Of 2015?
Current Dollar Strength: Replay Of 2015?
The effects of the stronger dollar rippled across the global economy. Notably, since China had a de facto currency peg to the dollar at the time, the resurgent greenback made Chinese companies less competitive in global markets. The appreciation of the yuan came at a time when the Chinese government was tightening both monetary and fiscal policy. The year-over-year change in total social financing (TSF) reached as high as 23% in April 2013 but fell to 12% in May 2015 (Chart 2). Chart 2Just Like Today, China Was Tightening Monetary And Fiscal Policy Going Into 2015
Just Like Today, China Was Tightening Monetary And Fiscal Policy Going Into 2015
Just Like Today, China Was Tightening Monetary And Fiscal Policy Going Into 2015
Eager to give its export sector a competitive boost, China allowed the currency to weaken by about 4% in August 2015 (Chart 3). The “mini-devaluation” backfired. Rather than instilling confidence in the economy, it caused investors to bet on further currency declines. Capital outflows intensified as the yuan came under further pressure. Between June 2014 and January 2016, China lost almost US$1 trillion in foreign exchange reserves. Chart 3China's Mini-Devaluation Backfired
China's Mini-Devaluation Backfired
China's Mini-Devaluation Backfired
The combination of a stronger dollar and sagging Chinese growth led to a steep decline in commodity prices. The London Metals Exchange index fell by nearly 40% between July 2014 and January 2016. Brent crude oil prices plunged from $110/bbl to as low as $26/bbl during this period (Chart 4). Capital spending in the commodity sector collapsed. Fears over the financial health of commodity producers and related firms caused credit spreads to widen (Chart 5). Chart 4Stronger Dollar And Soggy Chinese Growth Were A Bad Combination For Commodity Prices
Stronger Dollar And Soggy Chinese Growth Were A Bad Combination For Commodity Prices
Stronger Dollar And Soggy Chinese Growth Were A Bad Combination For Commodity Prices
Chart 5Weakness In The Commodity Complex Weighed On High-Yield Bonds In 2015
Weakness In The Commodity Complex Weighed On High-Yield Bonds In 2015
Weakness In The Commodity Complex Weighed On High-Yield Bonds In 2015
Throughout the course of 2015, the Fed refused to back off from its plans to start raising rates. It hiked rates in December of that year and signaled four more hikes for 2016. However, as markets continued to swoon, the FOMC quickly backed off. The Fed would not raise rates again for a full 12 months. The Federal Reserve’s decision to temper its hawkish rhetoric, along with China’s decision to ramp up stimulus in early 2016, put a floor under risk assets. Fast forward to the present and investors are again wondering if the Fed is about to blink and whether the Chinese authorities are set to deliver a massive dose of global reflationary stimulus. We would not exclude either option. However, we think that a lot more pain is required before either occurs. China’s Begrudging Stimulus Program The Chinese government’s reform agenda remains focused on curbing credit growth and reducing excess capacity. China has historically stimulated its economy with ever-more debt and investment spending (Chart 6). There is an obvious tension here – one that is likely to make the authorities reluctant to turn on the credit spigot unless the economy slows further. Chart 6China: Debt And Capital Accumulation Have Gone Hand In Hand
China: Debt And Capital Accumulation Have Gone Hand In Hand
China: Debt And Capital Accumulation Have Gone Hand In Hand
Of course, China can try to stimulate its economy without relying on more debt-financed investment spending. In particular, it can try to boost consumption or net exports. The problem is that neither of these two options would be welcome news for other nations. Capital goods and raw materials account for more than 80% of Chinese imports. The rest of the world relies on Chinese investment, not Chinese consumption. Similarly, while stricter capital controls have given the authorities greater scope to weaken the yuan than they had in 2015, such a move would only hurt China’s competitors and curb Chinese imports. The Fed Will Keep Hiking Stocks rallied and the dollar sold off on Wednesday after Chairman Powell seemingly suggested that the fed funds rate was already close to neutral. This appeared to be a sharp recanting of his statement in early October that the Fed was a “long way” from neutral. We think the financial media and many pundits overreacted to Powell’s remarks. What he actually said was that “interest rates are still low by historical standards, and they remain just below the broad range of estimates of the level that would be neutral for the economy.”1 The “broad range” of estimates that Powell was referring to is drawn from September’s Summary of Economic Projections, which showed that FOMC members saw the appropriate “longer run” level of the fed funds rate as ranging between 2.5% and 3.5%. Given that the current target for the fed funds rate is 2%-to-2.25%, Powell was merely stating a fact about the current position of the Fed dots, not offering new forward guidance. In any case, investors are focusing too much on what Powell may or may not be thinking. The Fed does not know where the neutral rate is. True to its “data-dependent” approach, it will keep raising rates until the economy slows by enough that it needs to stop. Our base-case scenario envisions only a modest slowdown in U.S. growth, driven in part by increasing capacity constraints (the latter should make the Fed more, not less, eager to raise rates). So far, the data are consistent with this benign slowdown scenario. Holiday sales have been stronger than expected, based on data from Johnson-Redbook and Adobe Digital Insights. According to the Atlanta Fed’s GDPNow model, real GDP is on track to increase by 2.6% in the fourth quarter. Net exports and inventory destocking are expected to shave about half a percentage point off growth. This means that real final domestic demand is still growing at a healthy 3% pace. GDP growth could slow to about 2.5% next year as the fiscal impulse declines and the lagged effects from the recent tightening in financial conditions make their way through the economy. Nevertheless, given that most estimates peg potential growth at around 1.7%-to-1.8%, this should still be enough to push the unemployment rate towards 3% by the end of 2019, bringing it to the lowest level since the Korean War. This should keep price and wage inflation on an upward trajectory (Chart 7). Chart 7Does The Fed Like It Hot?
Does The Fed Like It Hot?
Does The Fed Like It Hot?
The “dots” in the September Summary of Economic Projections foresaw one rate increase this December and three additional hikes next year. The market is currently pricing in only two hikes through to end-2019 and no hikes beyond then (Chart 8). If our baseline scenario for the U.S. economy unfolds as expected, the Fed will raise rates four times next year, which will keep the U.S. dollar well bid. Chart 8The Market Does Not Buy The Dots
Shades Of 2015
Shades Of 2015
Oil And The Global Economy: Why It Will Not Be As Bad This Time Around As in 2015, a key question today is how the recent drop in oil prices will affect both the U.S. and the global economy. Here there is some good news. The balance sheets of U.S. energy companies have improved markedly over the past few years. Rapid productivity has allowed shale producers to boost production to record levels without having to incur substantially higher costs. In fact, capital spending in the energy sector is far lower as a share of GDP today than it was in the lead-up to the 2015 shale bust (Chart 9). Chart 9Energy Sector Capex Is Far Below Its 2014 Peak
Energy Sector Capex Is Far Below Its 2014 Peak
Energy Sector Capex Is Far Below Its 2014 Peak
Saudi Arabia’s reaction to the slide in oil prices is also likely to be different this time around. In 2015, the Saudis refrained from cutting output in the hope that this would undermine Iran and decimate the fledgling U.S. shale industry. In the end, the Iranian regime endured, and while U.S. production did fall temporarily, it quickly rebounded (Chart 10). Chart 10Who Won The Market Share War Of 2015?
Who Won The Market Share War Of 2015?
Who Won The Market Share War Of 2015?
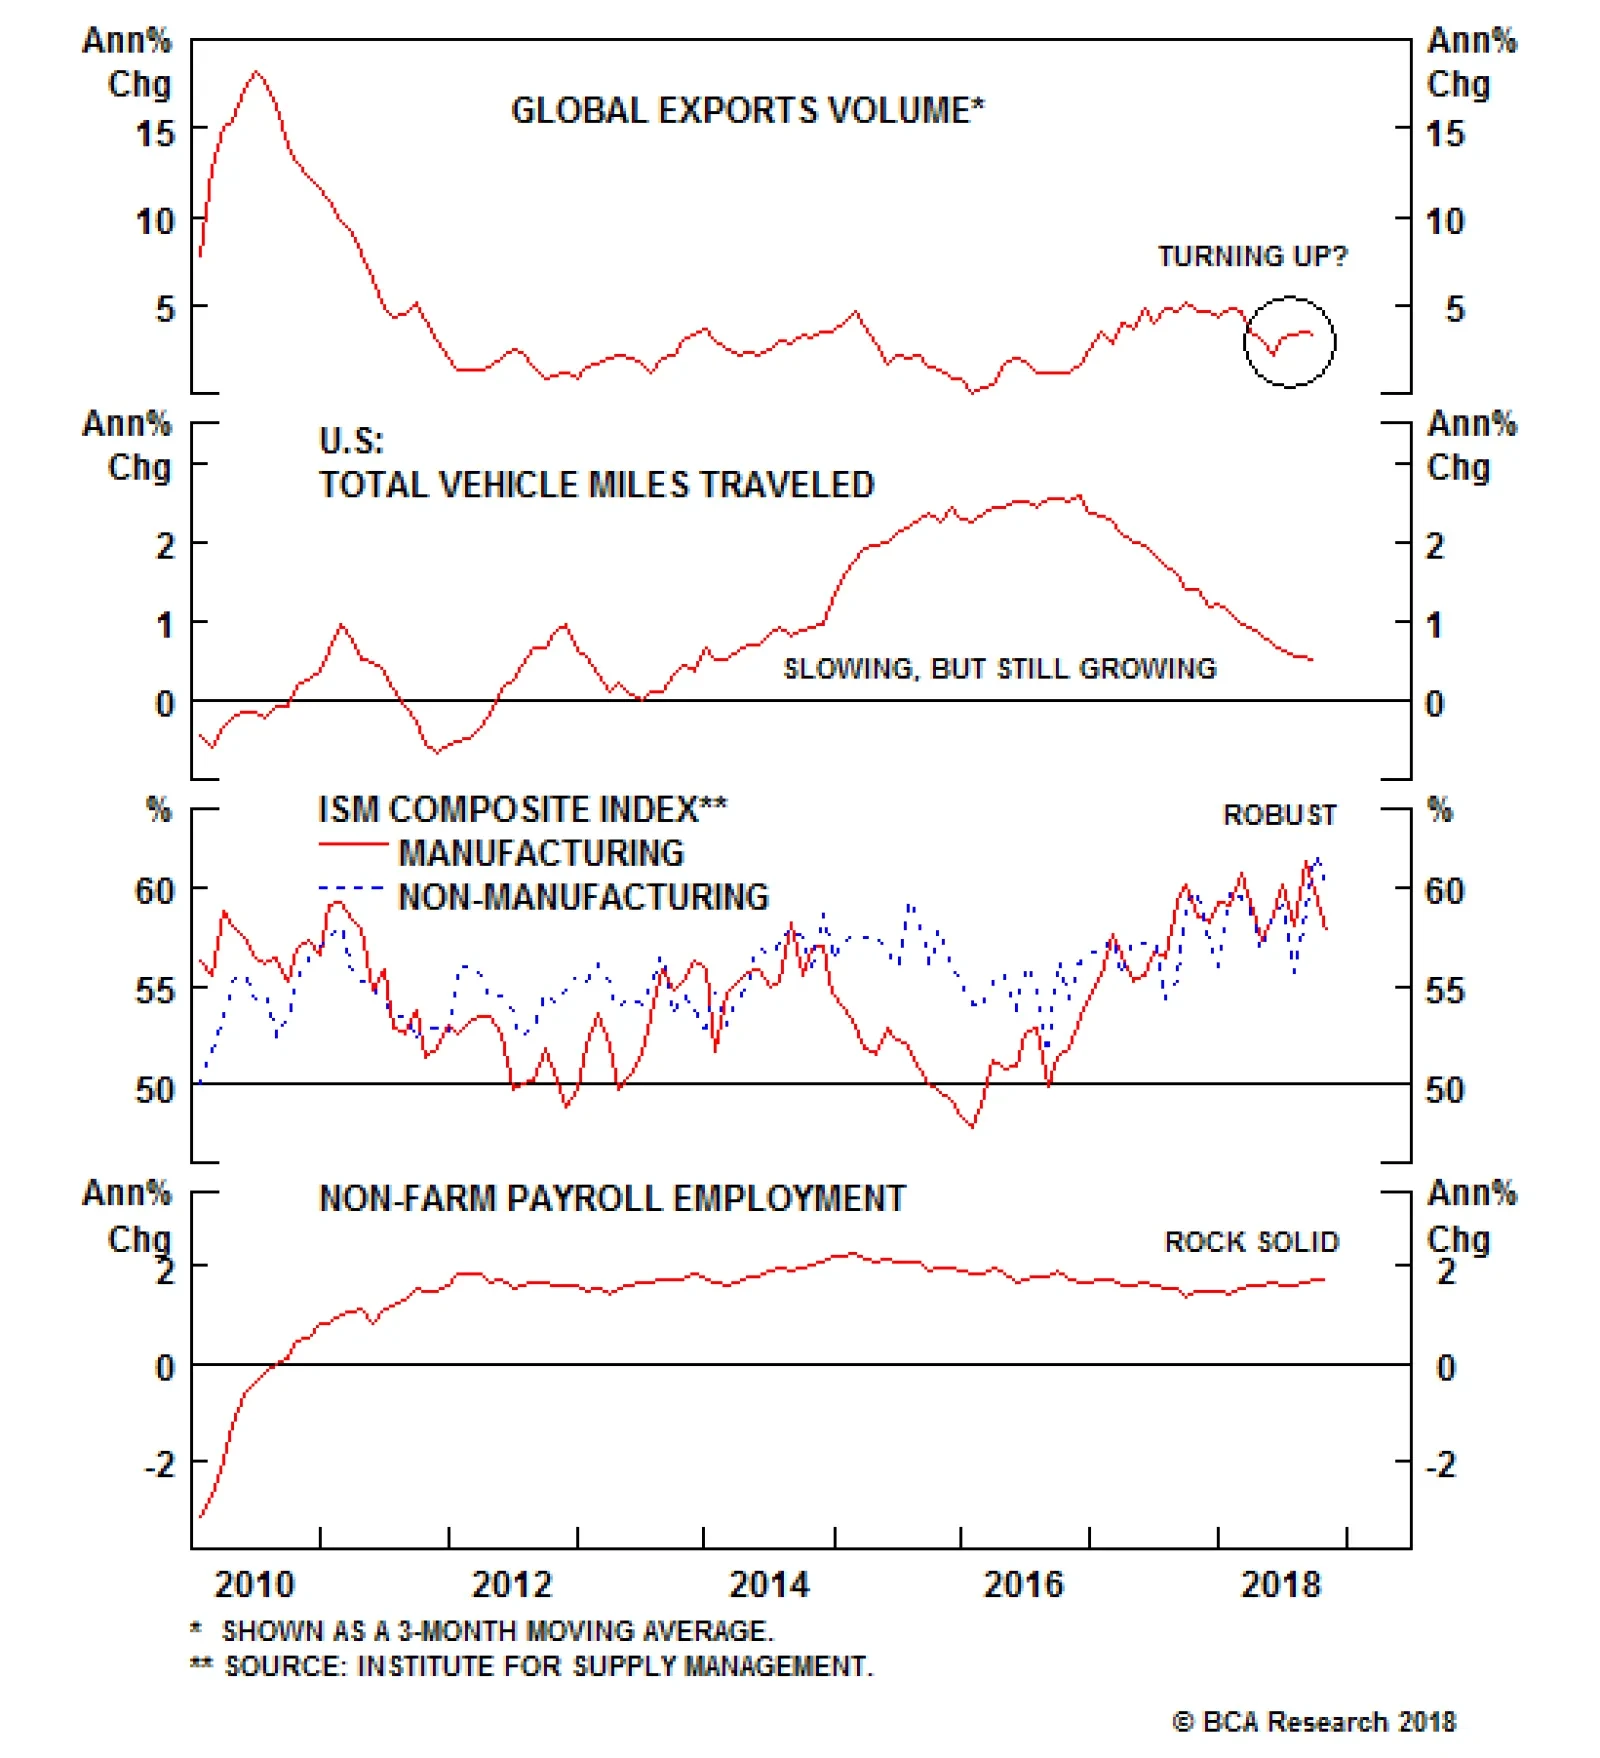
Going into September, the Saudis ramped up production after President Trump indicated his intent to tighten sanctions on Iranian oil exports. In the end, Trump declined to reimpose the sanctions. This left the market with a surfeit of crude. There is a limit to how much Saudi Arabia can cut output. Now that the stock market is well off its highs, President Trump has started to take credit for low oil prices. Nevertheless, the Saudis are keenly aware that they need crude to trade at about $83 per barrel just to balance their budget. Our geopolitical and energy strategists expect the Kingdom to cut production by enough to push up prices from current levels. Russia has also hinted at restraining supply. If U.S. producers fill part of the void created by Saudi and Russian production cutbacks, U.S. energy sector capital spending will hold up much better than it did in 2015. Provided that oil prices do not return all the way to their September highs, U.S. consumers will also benefit from an increase in spending power. Investment Conclusions We do not expect the global economy to weaken as much as it did in 2015. Nevertheless, most forward-looking economic indicators point to slower growth over the next few quarters (Chart 11). Global growth will likely bottom out by the middle of 2019, but until then, investors should continue to favor developed over emerging market stocks. They should also overweight defensive equity sectors, such as consumer staples and health care, relative to deep cyclicals, such as materials and industrials. Given sector skews, this implies a regional preference for the U.S. over Europe and Japan. Chart 11Global Growth Is Slowing
Global Growth Is Slowing
Global Growth Is Slowing
As far as the near-term absolute direction of stocks is concerned, the equity score from our MacroQuant market-timing model has risen from its recent lows thanks to an improvement in sentiment/technical components. Nevertheless, the model is still pointing to heightened downside risks to global equities over the remainder of the year and into early 2019 due to slowing growth and the lagged effects of the recent tightening in financial conditions (Chart 12). Chart 12MacroQuant Equity Model* Score Is Off Its Lows, But Is Still Warning Of More Downside For Stocks
Shades Of 2015
Shades Of 2015
Slower global growth and ongoing Fed rate hikes should keep the dollar well bid. Consistent with our qualitative analysis, our model is currently sending a very bullish signal on the greenback (Chart 13). We expect the DXY to reach 100 by early next year. Chart 13MacroQuant U.S. Dollar Model Is Pointing To Further Upside For The Greenback
Shades Of 2015
Shades Of 2015
The model’s near-term outlook on bonds has improved greatly in recent weeks after having spent the better part of the last 18 months in bearish territory (Chart 14). To be clear, this is a tactical signal: The model’s cyclical fair-value estimate for the U.S. 10-year Treasury yield stands at 3.71% – 67 basis points above current levels – which implies that the 12-to-18 month path for yields remains to the upside (Chart 15). Nevertheless, with global growth slowing and lower energy prices dragging down inflation, there is a good chance that the 10-year yield will temporarily fall below 3% before resuming its structural uptrend. Chart 14MacroQuant Recommended Portfolio*: Tactically Favor Bonds Over Stocks
Shades Of 2015
Shades Of 2015
Chart 15MacroQuant U.S. Bond Model*: Treasury Yields Are Still Well Below Fair Value, But The Upside Is Capped Tactically
Shades Of 2015
Shades Of 2015
Peter Berezin, Chief Global Strategist Global Investment Strategy peterb@bcaresearch.com Footnotes 1 Jerome H. Powell, “The Federal Reserve’s Framework for Monitoring Financial Stability,” Federal Reserve, November 28, 2018. Strategy & Market Trends Tactical Trades Strategic Recommendations Closed Trades
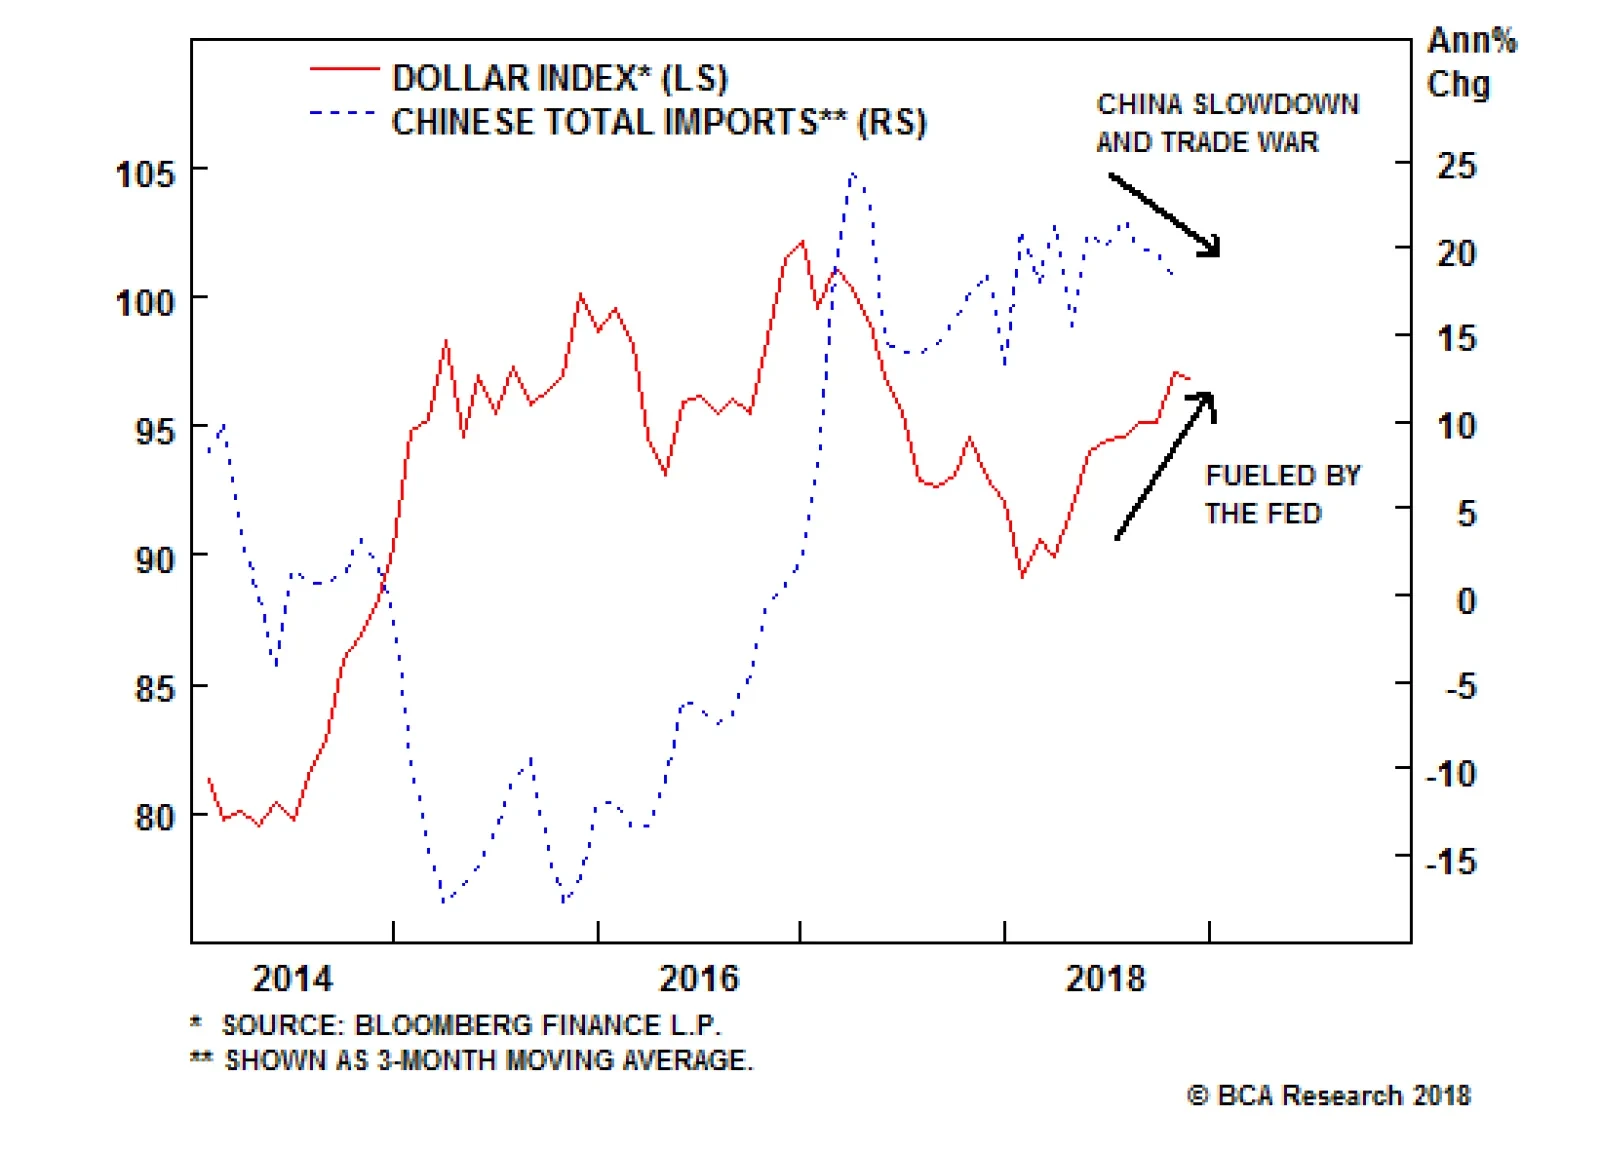
The U.S. economy continues to support the case for Fed normalization, while China’s stimulus continues to disappoint. The result is a double whammy for commodity prices and EM assets as the dollar strengthens and exports of resources and capital goods to…
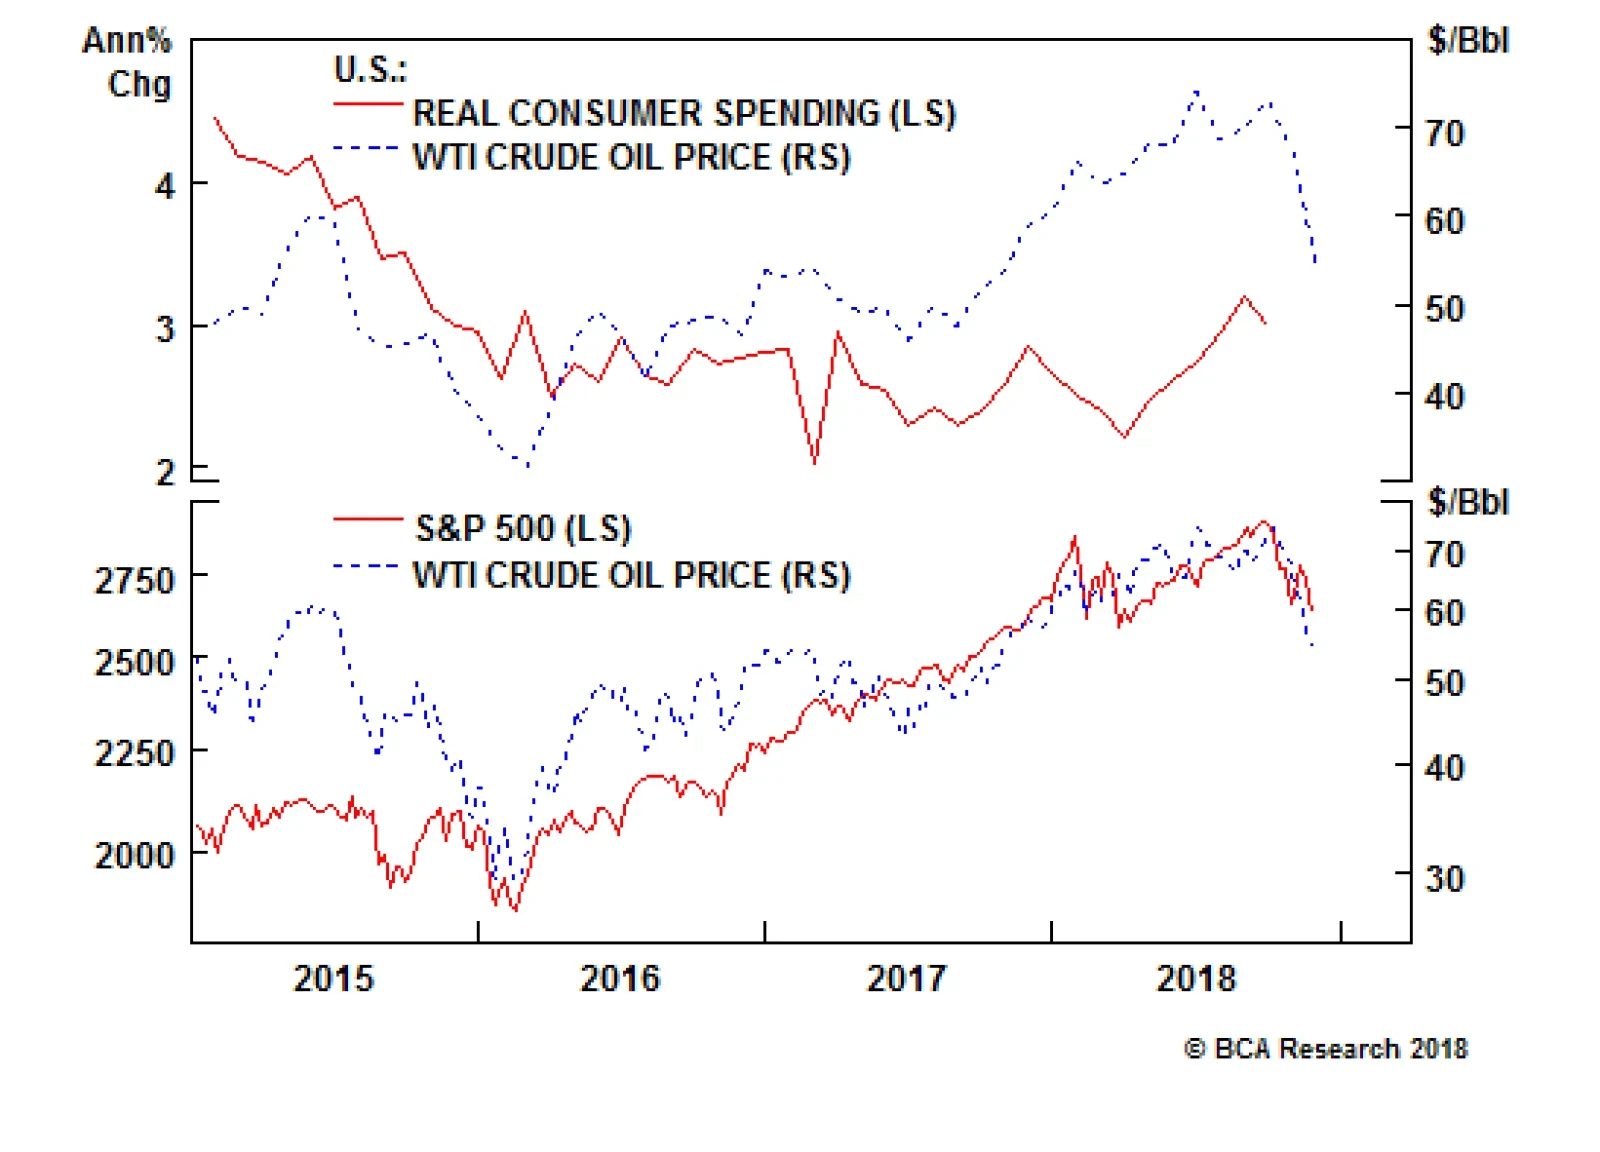
The lack of a discernible 2015-16 consumption boost after oil cratered upended the notion that the U.S. economy is as negatively correlated with oil prices as it has been cracked up to be, and the equity reaction also bucked the conventional wisdom (see…
Our Commodity & Energy Strategy group has been prescient about oil since 2015. The team blends bottom-up fundamental analysis, top-down global macro analysis, and insights from trading markets fosters a holistic view of all the factors driving oil prices.…
October and November were terrible months for global markets, but oil prices stand out as the primary underperformer among the major assets. If a global recession really were afoot, EM and Chinese equities would not likely be outperforming global equities.…