Global
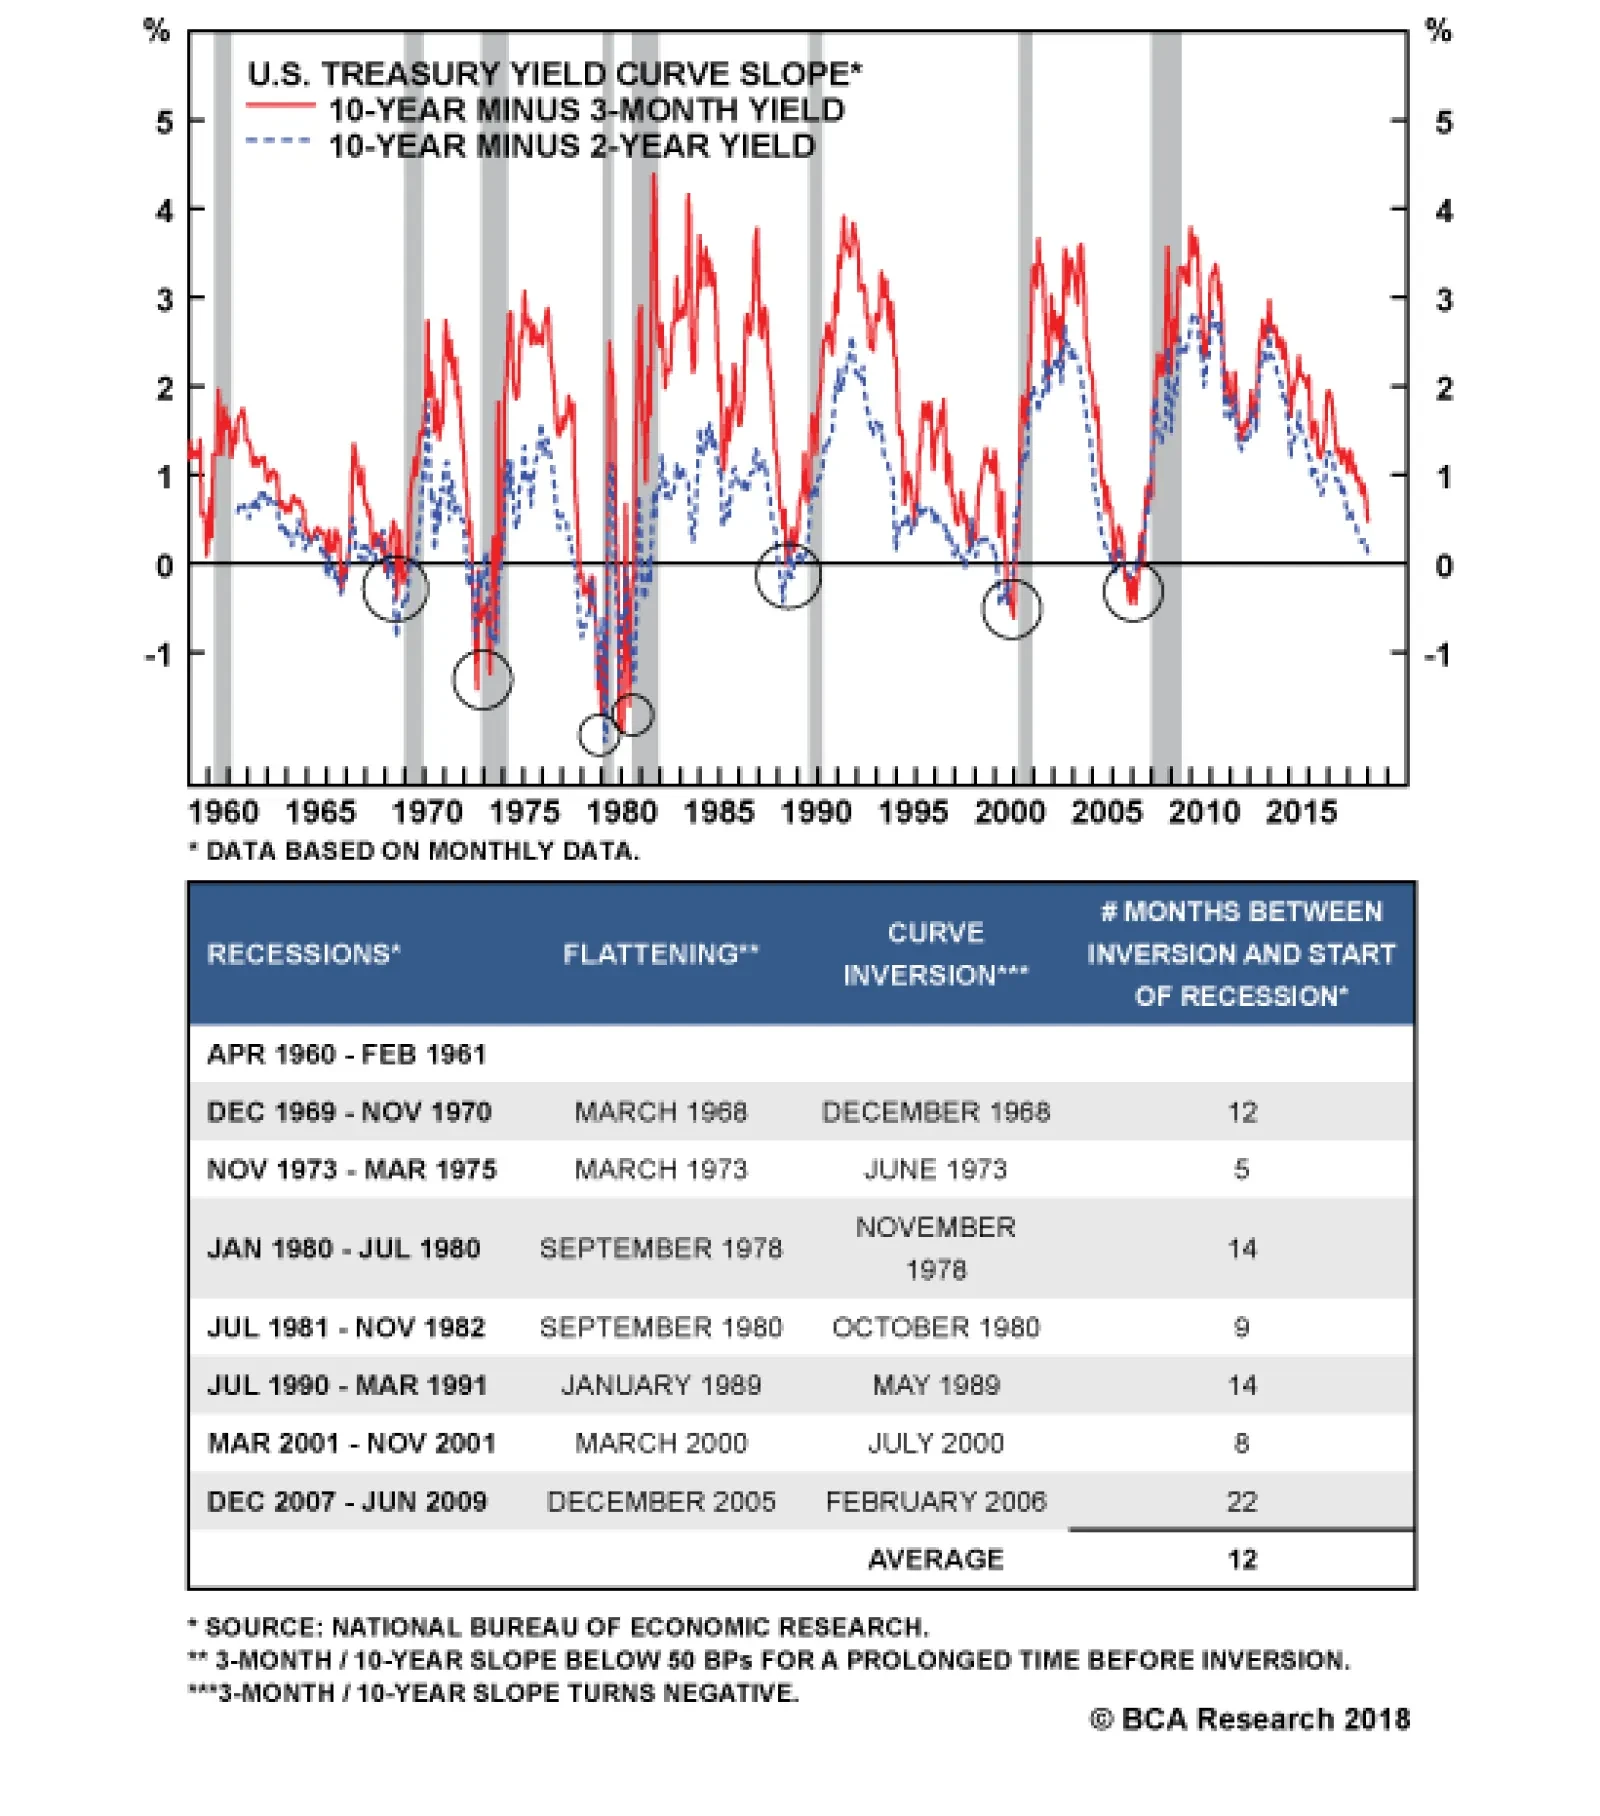
Academic studies have highlighted the importance of the yield curve as a leading indicator of recessions. In fact, every U.S. recession since the mid-1960s has been preceded by an inverted yield curve (see chart). There has only been one time in the past 50…
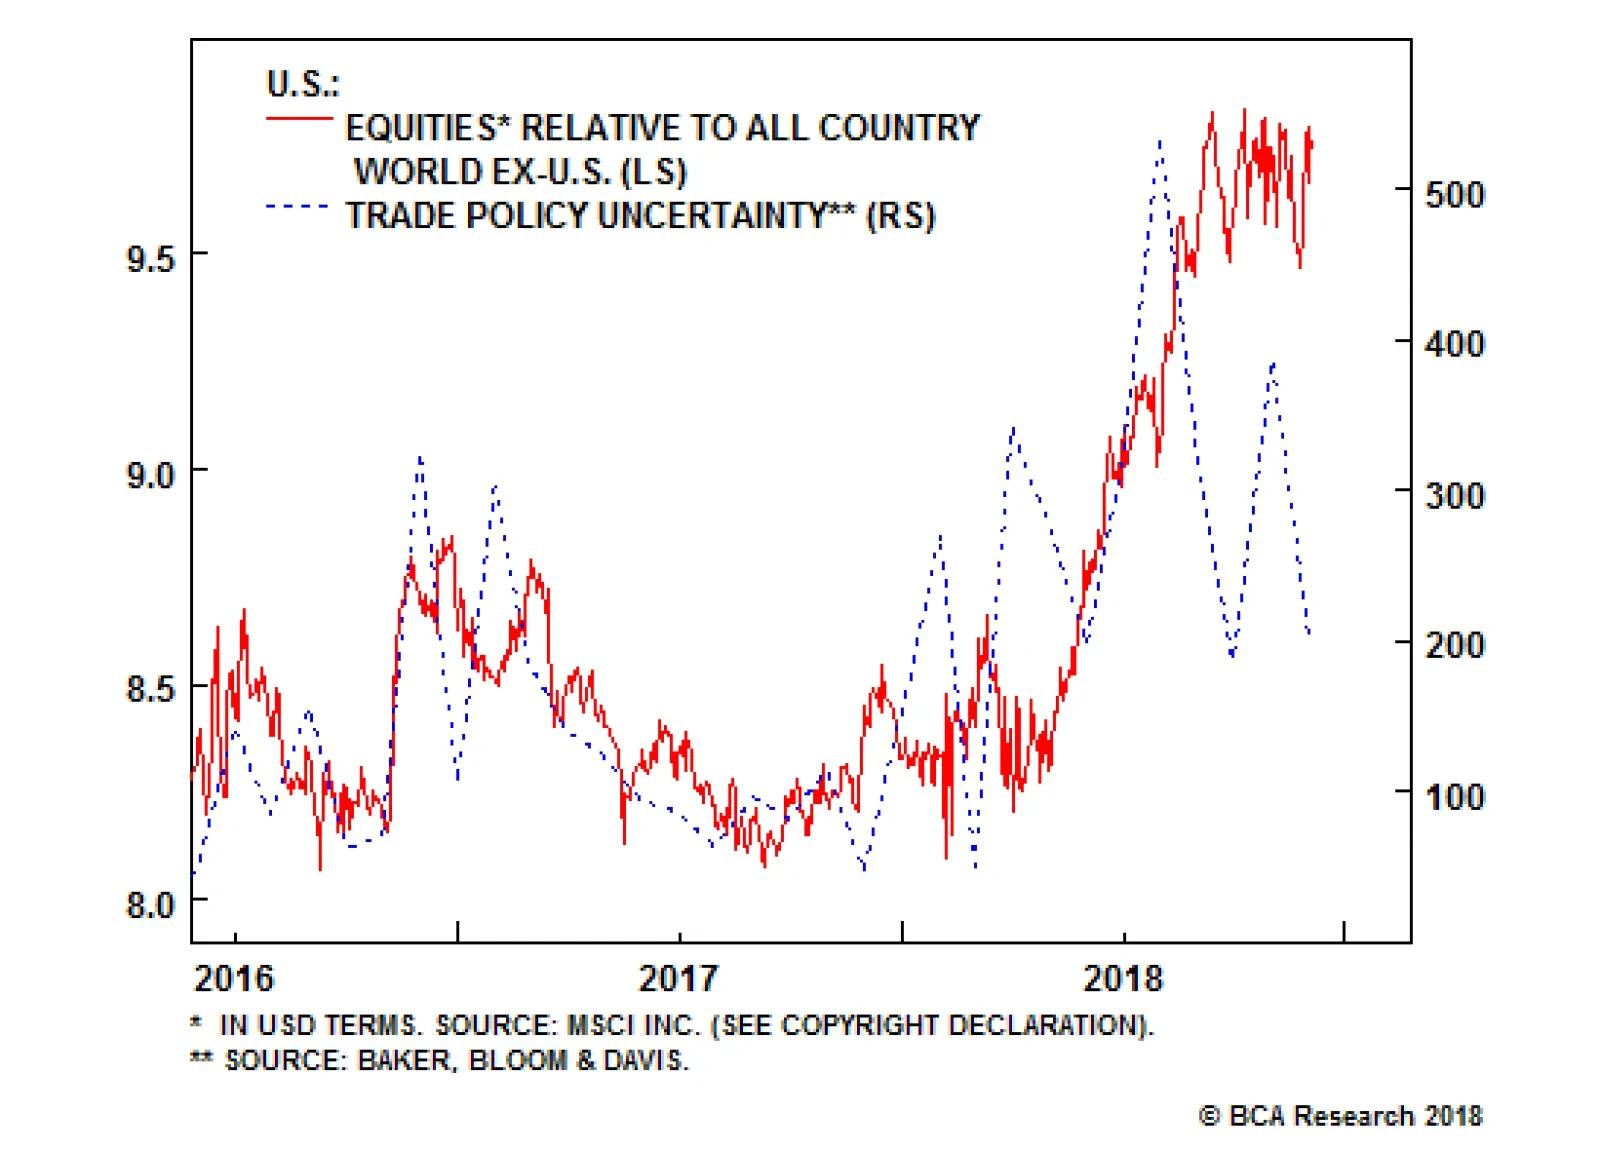
There are various drivers of the U.S.-China trade war. Geopolitics is a big one. From a structural perspective, the redistribution of power from the U.S. to China is creating ‘fat geopolitical tails’. This implies that risk premia on assets will be higher. …

Highlights The dollar will continue to rally despite the trade truce agreed upon last weekend between U.S. President Donald Trump and China President Xi Jinping. Not only is this truce far from a permanent deal, but global growth continues to slow. Moreover, if the truce were to generate a genuine improvement in global growth conditions, this would likely result in a much more hawkish Federal Reserve than the market is currently pricing in. This would lead to a further deterioration in global liquidity conditions, causing additional growth problems for the world. Buy EUR/CHF, as the Swiss National Bank will soon have to intervene in the market. Sell AUD/NOK, as oil should outperform metals and the Norges Bank is better placed to tighten policy than the Reserve Bank of Australia. Feature Presidents Donald Trump and Xi Jinping have agreed to freeze additional new tariffs on Chinese exports to the U.S. for three months. This means that as of January 1, 2019, U.S. tariffs on US$200 billion of Chinese exports to the U.S. will remain at 10%, and will not jump to 25%. Meanwhile, China has agreed to immediately resume its imports of soybeans and LNG from the U.S. Moreover, China has also agreed to begin talks to open up Chinese markets to U.S. exports as well as to address U.S. worries regarding intellectual property theft. The world has let out a collective sigh of relief. A potent narrative exists that fears of a trade war have been the root cause of the slowdown in global growth witnessed this year. Consequently, since the dollar performs well when global industrial activity slows, this also means that ending the trade war could be key to abort the dollar’s bull market. We are doubtful this narrative will pan out, and we do not think that the Buenos Aires truce will lead to the end of the dollar rally. This also means that the G-20 armistice is also unlikely to reverse the underperformance of commodity and Scandinavian currencies. First, this truce does not mark the end of the trade war. It is only an agreement to delay the implementation of U.S. tariffs. Come March, the Trump administration may well sing a very different tune. The U.S. domestic political climate has not changed one iota, and protectionism, particularly when directed at China, still wins votes (Chart I-1). Meanwhile, the concessions China is willing to give are long-term in nature; however, Trump wants visible wins well ahead of the 2020 elections. This mismatch creates a real danger that the White House imposes new tariffs again beyond the three-month armistice agreed at the G-20. The news yesterday afternoon that the CFO of Huawei was indicted in Vancouver already casts doubts on the deal. Chart I-1Americans Will Remain Tough On China
Waiting For A Real Deal
Waiting For A Real Deal
Second, the dollar has been strong, and risk assets have been weak for more reasons than the trade war alone. As shown by the slowdown in Japanese or Taiwanese exports, as well as by the contraction in German foreign orders and in the CRB Raw Industrial Index’s inflation, global trade and global growth are slowing (Chart I-2). This development is likely to last until mid-2019, as our global leading economic indicator continues to fall. This deterioration in the global LEI does not look set to stop soon, as normally any improvement in the global LEI is first telegraphed by a stabilization in the Global LEI Diffusion Index – an indicator that is still falling (Chart I-3). Chart I-2Global Growth Continues To Slow
Global Growth Continues To Slow
Global Growth Continues To Slow
Chart I-3No Bottom In Sight For The Global LEI
No Bottom In Sight For The Global LEI
No Bottom In Sight For The Global LEI
China is not yet coming to the rescue either. The slowdown in Chinese economic activity continues, and in fact, the paucity of a rebound in Chinese credit growth despite injections of liquidity by Beijing suggests that a bottom is not yet in sight (Chart I-4). Hopes that were raised by increased bond issuance from local governments have also been dashed as this proved to be a very temporary phenomenon (Chart I-5). What is more worrisome is that so far Chinese exports have held their ground; however, the decline in the new export orders of the Chinese PMI suggests that this support to growth is likely to taper sharply in the coming months (Chart I-6). Chart I-4Credit Growth Decelerating Despite Stimulus
Credit Growth Decelerating Despite Stimulus
Credit Growth Decelerating Despite Stimulus
Chart I-5Chinese Infrastructure Push Looks Transitory
Waiting For A Real Deal
Waiting For A Real Deal
Chart I-6Chinese Exports: The Last Shoe To Drop
Chinese Exports: The Last Shoe To Drop
Chinese Exports: The Last Shoe To Drop
Finally, despite the cloudy outlook for global growth that built up this year, U.S. yields had risen 80 basis points by November 8, adding stress to economies already negatively impacted by weakening manufacturing activity. This increase in global borrowing costs has worsened the already noticeable decline in U.S.-dollar based liquidity (Chart I-7). This decline in liquidity has been a great source of concern as EM economies, the source of marginal growth in the global economy, have large dollar-denominated debt loads, and thus need abundant dollar liquidity in order to support their economies (Chart I-8). Chart I-7Slowing Dollar Liquidity Explains Weak Global Growth...
Slowing Dollar Liquidity Explains Weak Global Growth...
Slowing Dollar Liquidity Explains Weak Global Growth...
Chart I-8...Because There Is A Lot Of Dollar Debt Where Growth Is Generated
...Because There Is A Lot Of Dollar Debt Where Growth Is Generated
...Because There Is A Lot Of Dollar Debt Where Growth Is Generated
This last point is especially unlikely to change in response to the Buenos Aires truce. Since November, 10-year U.S. yields have fallen around 25 basis points, and now fed funds rate futures are only pricing in 45 basis points of rate hikes over the coming two years, including the December hike. If business sentiment improves because of a trade truce, and consequently U.S. capex proves more resilient than anticipated by market participants, the Federal Reserve will increase rates by much more than what is currently priced into the futures curve (Chart I-9). Chart I-9U.S. Rates Have Plenty Of Upside, Even More So If The Trade Truce Becomes A Peace Treaty
Waiting For A Real Deal
Waiting For A Real Deal
This will lift yields, resuscitating one of the first reasons why markets have been weak this fall. This risk is even greater than the market appreciates. After Fed Chair Jerome Powell gave what was perceived as a dovish speech last week, markets were further emboldened to bet on a Fed pause. However, Fed Vice-Chairman Richard Clarida and New York Fed President John Williams have both argued since that the U.S. economy will continue to run above trend and warrants further gradual increases in interest rates. A truce in Buenos Aires may only provide them with more ammunition to implement those hikes. Global liquidity conditions are unlikely to improve significantly anytime soon. Moreover, the truce could also change the calculus in Beijing. Much of the stimulus implemented since last summer in China has been to limit the negative impact of a trade war. However, if a trade war is not in the cards, Beijing has fewer reasons to abandon its deleveraging campaign. It thus raises the possibility that with a risk to China evaporating, the Xi Jinping administration would instead not do anything to limit the slowdown in credit. This implies that Chinese capex would stay weak and that China’s intake of raw materials and machinery would not pick up. This means that the euro area and countries like Australia will continue to lag behind the U.S. Ultimately, the market speaks louder than anything else. The incapacity for risk assets to catch a bid in the wake of what was good news is disconcerting. It suggests that the combined assault of slowing global growth and a tightening Fed remains the main problem for global financial markets. Hence, in this kind of deflationary environment, the dollar reign supreme – even if U.S. growth were to slow (Chart I-10). Chart I-10A Strong Dollar Is Not A Function Of Strong U.S. Growth
A Strong Dollar Is Not A Function Of Strong U.S. Growth
A Strong Dollar Is Not A Function Of Strong U.S. Growth
Bottom Line: A trade truce in Buenos Aires could have aborted the bull market in the dollar. So far, it has not, and we do not think it will be able to end the dollar’s rally. First, this truce remains flimsy, and does not guarantee an end of the trade war between China and the U.S. Second, global growth continues to exhibit downside. Finally, the Fed is unlikely to change its course and pause its hiking campaign. In fact, if a trade truce is so good for trade, it will give more reasons for the Fed to hike and may even incentivize Chinese authorities to abandon their efforts to cushion the Chinese economy against slowing global trade. Stay long the dollar and keep a defensive exposure in the FX market, one that favors the yen and the greenback at the expense of Scandinavian and commodity currencies. Buy EUR/CHF Despite our view that global growth is set to slow, we are inclined to buy EUR/CHF this week. We expect the Swiss National Bank to stop sitting on its hands as a stronger CHF is becoming too painful. First, as we highlighted last week, aggregate Swiss economic activity is slowing sharply.1 What is more concerning is that consumer spending is also suffering, as shown by the contraction in real retail sales (Chart I-11). This implies that despite record-low interest rates, Swiss households are feeling the pinch of the tightening in Swiss monetary conditions created by the stronger CHF. Chart I-11Swiss Households Are Feeling The Pinch
Swiss Households Are Feeling The Pinch
Swiss Households Are Feeling The Pinch
Second, the franc remains a problem for Swiss competitiveness. As Chart I-12 shows, Swiss labor costs are completely out of line with its competitors. This phenomenon worsened significantly after 2008 due to the Franc’s strength vis-à-vis the euro. Despite the weakness in the franc from mid-January 2015 to April 2018, Swiss unit labor costs remain uncompetitive. This means that going forward, either the SNB will have to tolerate a further contraction in wages, something unpalatable as Swiss households have a debt load equal to 212% of disposable income, or the franc will have to fall. Chart I-12The CHF Makes Switzerland Uncompetitive
The CHF Makes Switzerland Uncompetitive
The CHF Makes Switzerland Uncompetitive
Third, the franc’s recent strength is only accentuating the deflationary impact of softer global growth on the local economy. As Chart I-13 illustrates, the recent strengthening in the trade-weighted CHF portends to a potentially painful contraction in import prices, while core inflation is already well off the SNB’s 2% objective. Moreover, as the second panel of Chart I-13 shows, our CPI model suggests that Swiss inflation is about to fall into negative territory again. This would imply that not only will the Swiss economy suffer from the recent strengthening in the franc, but also that Swiss real interest rates are about to increase by 100 basis points, the last thing a slowing economy needs. Chart I-13Swiss Deflation Will Return
Swiss Deflation Will Return
Swiss Deflation Will Return
This economic backdrop suggests to us that after 16 months where the SNB played nearly no active role in managing the CHF exchange rate, the Swiss central bank is about to come back to the market in order to limit the downside in EUR/CHF. This makes buying this cross attractive, as it offers a favorable asymmetric payoff. EUR/CHF generates a small positive carry, has limited downside and offers ample upside if the SNB intervenes – all while offering low volatility. Meanwhile, if global growth picks up, EUR/CHF should also rebound. In fact, the pro-cyclical behavior of EUR/CHF, as well as its asymmetric payoff, increases the attractiveness of this trade within our broadly defensive portfolio stance: It hedges us against being wrong on the global growth outlook and the importance of the trade truce. Furthermore, any resolution to Italy’s battle with Brussels will also boost this cross. Bottom Line: EUR/CHF normally depreciates when global growth slows. While this pattern materialized in 2018, we anticipate EUR/CHF to stabilize and potentially rally, even if global growth slows. The strong CHF is now causing serious pain to the Swiss economy, and the SNB will have to prevent any deepening of the malaise. The SNB is thus set to begin intervening in the market. Additionally, if we are wrong and global growth does not slow further, being long EUR/CHF provides a hedge to our defensive market stance. AUD/NOK To Be Knocked Down An attractive opportunity to sell AUD/NOK has emerged. First, on the back of the weakness in oil prices relative to metals prices, AUD/NOK has caught a furious bid in recent weeks (Chart I-14). However, we expect the underperformance of oil relative to metals to peter off. The main factor that has weighed on petroleum prices is that Saudi Arabia has kept extracting oil at full speed, expecting a shortage of oil in global markets once U.S. sanctions on Iran kicked in. Chart I-14AUD/NOK Strength: A Reflection Of Weak Crude Prices
AUD/NOK Strength: A Reflection Of Weak Crude Prices
AUD/NOK Strength: A Reflection Of Weak Crude Prices
However, with President Trump greatly softening his stance and allowing exemptions for some countries to import Iranian oil, the crude market instead has experienced a mini unforeseen oil glut. OPEC 2.0, just agreed to essentially remedy this problem by limiting their oil output. This should boost oil prices. Meanwhile, slowing global growth centered on slowing Chinese capex will have a much deeper impact on industrial metals prices than on oil. This represents a negative terms-of-trade shock for Australia vis-à-vis Norway. Second, domestic economic conditions also favor betting on a weaker AUD/NOK. Australian nominal GDP growth often weakens when compared to Norway’s ahead of periods of depreciation in AUD/NOK. Today, Australia’s nominal GDP growth is sagging relative to Norway’s, and the contraction in Australia’s LEI relative to Norway suggests that this trend will deepen (Chart I-15). A rebound in oil prices relative to metals prices will only reinforce this process. Chart I-15Domestic Economic Conditions Point To A Lower AUD/NOK
Domestic Economic Conditions Point To A Lower AUD/NOK
Domestic Economic Conditions Point To A Lower AUD/NOK
Third, AUD/NOK seems expensive relative to the anticipated path of policy of the Reserve Bank of Australia relative the Norges Bank (Chart I-16). Moreover, the Norwegian central bank has begun lifting rates, and since real interest rates in Norway are still negative, it will continue to tighten policy next year. Meanwhile, the RBA remains reticent to increase interest rates as Australian inflation and wage growth are still tepid. The recent deceleration in Australian GDP growth as well as budding problems in the Aussie real estate market will only further cajole the RBA in its reluctance to lift the cash rate higher. Hence, the real interest rate differentials will continue to point toward a lower AUD/NOK. Chart I-16AUD/NOK At A Premium To Expected Rates
AUD/NOK At A Premium To Expected Rates
AUD/NOK At A Premium To Expected Rates
Fourth, AUD/NOK is once again very expensive, trading at a 12% premium to it purchasing power parity equilibrium (Chart I-17). It only traded for an extended period of time at a richer premium when Brent was free-falling to US$25/bbl. Since we anticipate oil to rebound, such a premium in AUD/NOK is unwarranted. Chart I-17AUD/NOK Is Pricey
AUD/NOK Is Pricey
AUD/NOK Is Pricey
Finally, all our technical indicators show that AUD/NOK is massively overbought (Chart I-18). The study on momentum we conducted last year showed that out of 45 G-10 FX pairs tested, after AUD/SEK, AUD/NOK was the second worst one to implement momentum-continuation trades.2 As a result, we would anticipate that the recent period of overbought conditions will lead to a period of oversold conditions. Chart I-18The Mean-Reverting AUD/NOK Is Overbought
The Mean-Reverting AUD/NOK Is Overbought
The Mean-Reverting AUD/NOK Is Overbought
Bottom Line: Selling AUD/NOK today makes sense. BCA anticipates oil prices to rebound relative to metals prices, the Australian economy is slowing relative to Norway’s, monetary policy is moving in a NOK-friendly fashion, AUD/NOK is expensive, and the cross is well-placed to experience a large episode of momentum reversal. Mathieu Savary, Vice President Foreign Exchange Strategy mathieu@bcaresearch.com Footnotes 1 Please see Foreign Exchange Strategy Special Report, titled “2019 Key Views: The Xs And The Currency Market”, dated November 30, 2018, available at fes.bcaresearch.com 2 Please see Foreign Exchange Strategy Special Report, titled “Riding The Wave: Momentum Strategies In Foreign Exchange Markets”, dated December 8, 2017, available at fes.bcaresearch.com Currencies U.S. Dollar Chart II-1USD Technicals 1
USD Technicals 1
USD Technicals 1
Chart II-2USD Technicals 2
USD Technicals 2
USD Technicals 2
Recent data in the U.S. has been mixed: The price component of the ISM manufacturing survey underperformed expectations, coming in at 60.7. This measure also declines sharply from the previous month. However, the headline ISM Manufacturing survey surprised to the upside, coming in at 59.3. Total vehicle sales also outperformed expectations, coming in at 17.50 million. The DXY U.S. dollar Index was flat for the past two weeks. We continue to be bullish on the U.S. dollar. The current environment of falling global growth and falling inflation has historically been very positive for this currency. Moreover, the fed will likely hike more than anticipated by the market, providing another tailwind for the dollar until at least the first quarter of 2019. Report Links: 2019 Key Views: The Xs And The Currency Market - December 7, 2018 Six Questions From The Road - November 16, 2018 Updating Our Intermediate Timing Models - November 2, 2018 The Euro Chart II-3EUR Technicals 1
EUR Technicals 1
EUR Technicals 1
Chart II-4EUR Technicals 2
EUR Technicals 2
EUR Technicals 2
Recent data in Europe has been mixed: Retail sales growth underperformed expectations, coming in at 1.7%. Moreover, core inflation also surprised to the downside, coming in at 1%. However, market services and composite PMI surprised positively, coming in at 53.4 and 52.7 respectively. EUR/USD has been flat for the past two weeks. We are bearish on the euro, given that we expect Chinese tightening to continue to weigh on global growth. Furthermore, recent disappointment in euro area inflation confirms our view that it will be very difficult for the ECB to tighten policy. This means that rate differentials will continue to move against EUR/USD. Report Links: 2019 Key Views: The Xs And The Currency Market - December 7, 2018 Six Questions From The Road - November 16, 2018 Evaluating The ECB’s Options In December - November 6, 2018 The Yen Chart II-5JPY Technicals 1
JPY Technicals 1
JPY Technicals 1
Chart II-6JPY Technicals 2
JPY Technicals 2
JPY Technicals 2
Recent data in Japan has been mixed: The Nikkei manufacturing PMI outperformed expectations, coming in at 52.2. Moreover, housing starts yearly growth came in line with expectations, at 0.3%. However, Markit Services PMI came in at 52.3, decreasing from last month’s number. USD/JPY has decreased by -0.4% these past two weeks. We are positive on the yen for the first quarter of 2019. The current risk off environment should be positive for safe havens like the yen. We are particularly negative on EUR/JPY, as this cross is very well correlated with bond yields, which should keep decreasing as markets continue to sell off. Report Links: 2019 Key Views: The Xs And The Currency Market - December 7, 2018 Updating Our Intermediate Timing Models - November 2, 2018 Will Rising Wages Cause An Imminent Change In Policy Direction In Europe And Japan? - October 5, 2018 British Pound Chart II-7GBP Technicals 1
GBP Technicals 1
GBP Technicals 1
Chart II-8GBP Technicals 2
GBP Technicals 2
GBP Technicals 2
Recent data in the U.K. has been mixed: Nationwide housing prices yearly growth came in at 1.9%, outperforming expectations. Moreover, Markit manufacturing PMI as well as construction PMI both surprised positively, coming in at 53.1 and 53.4 respectively. However, Markit Services PMI underperformed expectations, coming in at 50.4. GBP/USD has decreased by 0.7% these past two weeks. The pound continues to be a complex currency to forecast. While the pound is cheap and makes for a potentially attractive long-term buy, current political risk continue to make a shorter-term position very risky. Report Links: Six Questions From The Road - November 16, 2018 Updating Our Intermediate Timing Models - November 2, 2018 Clashing Forces: The Fed And EM Financial Conditions - October 19, 2018 Australian Dollar Chart II-9AUD Technicals 1
AUD Technicals 1
AUD Technicals 1
Chart II-10AUD Technicals 2
AUD Technicals 2
AUD Technicals 2
Recent data in Australia has been negative: Gross domestic product yearly growth underperformed expectations, coming in at 2.8%. Moreover, building permits month-on-month growth also surprised negatively, coming in at -1.5%. Finally, construction done also surprised to the downside, coming in at -2.8%. AUD/USD has decreased by -0.5% these past two weeks. We believe that the AUD is the currency with the most potential downside in the G10. After all, the Australian economy is the economy in the G10 most leveraged to the Chinese industrial cycle, due to Australia’s high reliance on industrial metal exports. This means that the continued tightening by Chinese authorities should be most toxic for this currency. Report Links: Updating Our Intermediate Timing Models - November 2, 2018 Policy Divergences Are Still The Name Of The Game - August 14, 2018 What Is Good For China Doesn’t Always Help The World - June 29, 2018 New Zealand Dollar Chart II-11NZD Technicals 1
NZD Technicals 1
NZD Technicals 1
Chart II-12NZD Technicals 2
NZD Technicals 2
NZD Technicals 2
Recent data in New Zealand has been mixed: Building permits month on month growth outperformed expectations, coming in at 1.5%. However, retail sales as well as retail sales ex-autos both declines from the previous quarter, coming in at 0% and 0.4%. NZD/USD has increased by 1% these past two weeks. After being bullish in the NZD for a couple of months, we have recently turned bearish, as we believe that this currency is very likely to suffer in the current environment of declining inflation and global growth. With that said, we remain bullish on the NZD relative to the AUD, given that the kiwi economy is less exposed to the Chinese industrial cycle than Australia. Report Links: Updating Our Intermediate Timing Models - November 2, 2018 Clashing Forces: The Fed And EM Financial Conditions - October 19, 2018 In Fall, Leaves Turn Red, The Dollar Turns Green - October 12, 2018 Canadian Dollar Chart II-13CAD Technicals 1
CAD Technicals 1
CAD Technicals 1
Chart II-14CAD Technicals 2
CAD Technicals 2
CAD Technicals 2
Recent data in Canada has been positive: Retail sales month on month growth outperformed expectations, coming in at 0.2%. Moreover, headline inflation also surprised to the upside, coming in at 2.4%. Finally, the BOC core inflation measure increased from last month’s number, coming in at 1.6%. USD/CAD has risen by 1.7% these past two weeks. A lot of this weakness was caused by the dovish communication of the Bank of Canada following their announcement to keep rates on hold at 1.75%. This change in stance is likely a response to the collapse in oil prices in the past months. With that in mind, we are inclined to believe that the CAD might be reaching oversold levels, as oil is likely to stabilize and the economy continue to show signs of strength. Report Links: Updating Our Intermediate Timing Models - November 2, 2018 Clashing Forces: The Fed And EM Financial Conditions - October 19, 2018 Updating Our Long-Term FX Fair Value Models - June 22, 2018 Swiss Franc Chart II-15CHF Technicals 1
CHF Technicals 1
CHF Technicals 1
Chart II-16CHF Technicals 2
CHF Technicals 2
CHF Technicals 2
Recent data in Switzerland has been negative: Gross domestic product yearly growth underperformed expectations, coming in at 2.4%. Moreover, the KOF leading indicator also surprised to the downside, coming in at 99.1. Finally, headline inflation also surprised negatively, coming in at 0.9%. EUR/CHF has decreased by 0.5% these past two weeks. Our bullish view on EUR/CHF is a high conviction view for the first part of 2019. This is because the recent strength in the franc is choking out any inflationary pressures in the Swiss economy. Thus, we are reaching the threshold at which the SNB is very likely to intervene in the currency market to prevent the franc’s strength from derailing the path toward the inflation target. Report Links: Updating Our Intermediate Timing Models - November 2, 2018 Updating Our Long-Term FX Fair Value Models - June 22, 2018 Updating Our Intermediate Timing Models - May 18, 2018 Norwegian Krone Chart II-17NOK Technicals 1
NOK Technicals 1
NOK Technicals 1
Chart II-18NOK Technicals 2
NOK Technicals 2
NOK Technicals 2
Recent data in Norway has been negative: Retail sales growth underperformed expectations, coming in at -0.2%. Moreover, registered unemployment also surprised negatively, coming in at 2.3%. Finally, the credit indicator came in line with expectations at 5.7%. USD/NOK has been flat these past two weeks. We are shorting AUD/NOK this week, as a way to take advantage of stabilizing oil prices and a continued growth slowdown in China. Moreover, AUD/NOK is expensive in PPP terms, and is technically overbought. Finally, this currency shows one the most mean reverting tendencies in the G10, which means that the recent surge in this cross is likely to reverse. Report Links: Updating Our Intermediate Timing Models - November 2, 2018 Clashing Forces: The Fed And EM Financial Conditions - October 19, 2018 Updating Our Long-Term FX Fair Value Models - June 22, 2018 Swedish Krona Chart II-19SEK Technicals 1
SEK Technicals 1
SEK Technicals 1
Chart II-20SEK Technicals 2
SEK Technicals 2
SEK Technicals 2
Recent data in Sweden has been negative: Consumer confidence underperformed expectations, coming in at 97.5. Moreover, retail sales growth also underperformed expectations, coming in at -0.1%. Finally, gross domestic product yearly growth also surprised negatively, coming in at 1.6%. USD/SEK has fallen by roughly 1% these past two weeks. On a short-term basis, we are negative on the krona, given that this currency is very sensitive to global growth dynamics, which means that the continued tightening by both Chinese authorities and the Fed will create a headwind for any SEK rally. That being said, on a longer-term basis we are more positive on the krona, as the Riksbank continues to be too dovish given the current inflationary backdrop. Report Links: Updating Our Intermediate Timing Models - November 2, 2018 Updating Our Long-Term FX Fair Value Models - June 22, 2018 Updating Our Intermediate Timing Models - May 18, 2018 Trades & Forecasts Forecast Summary Core Portfolio Tactical Trades Closed Trades
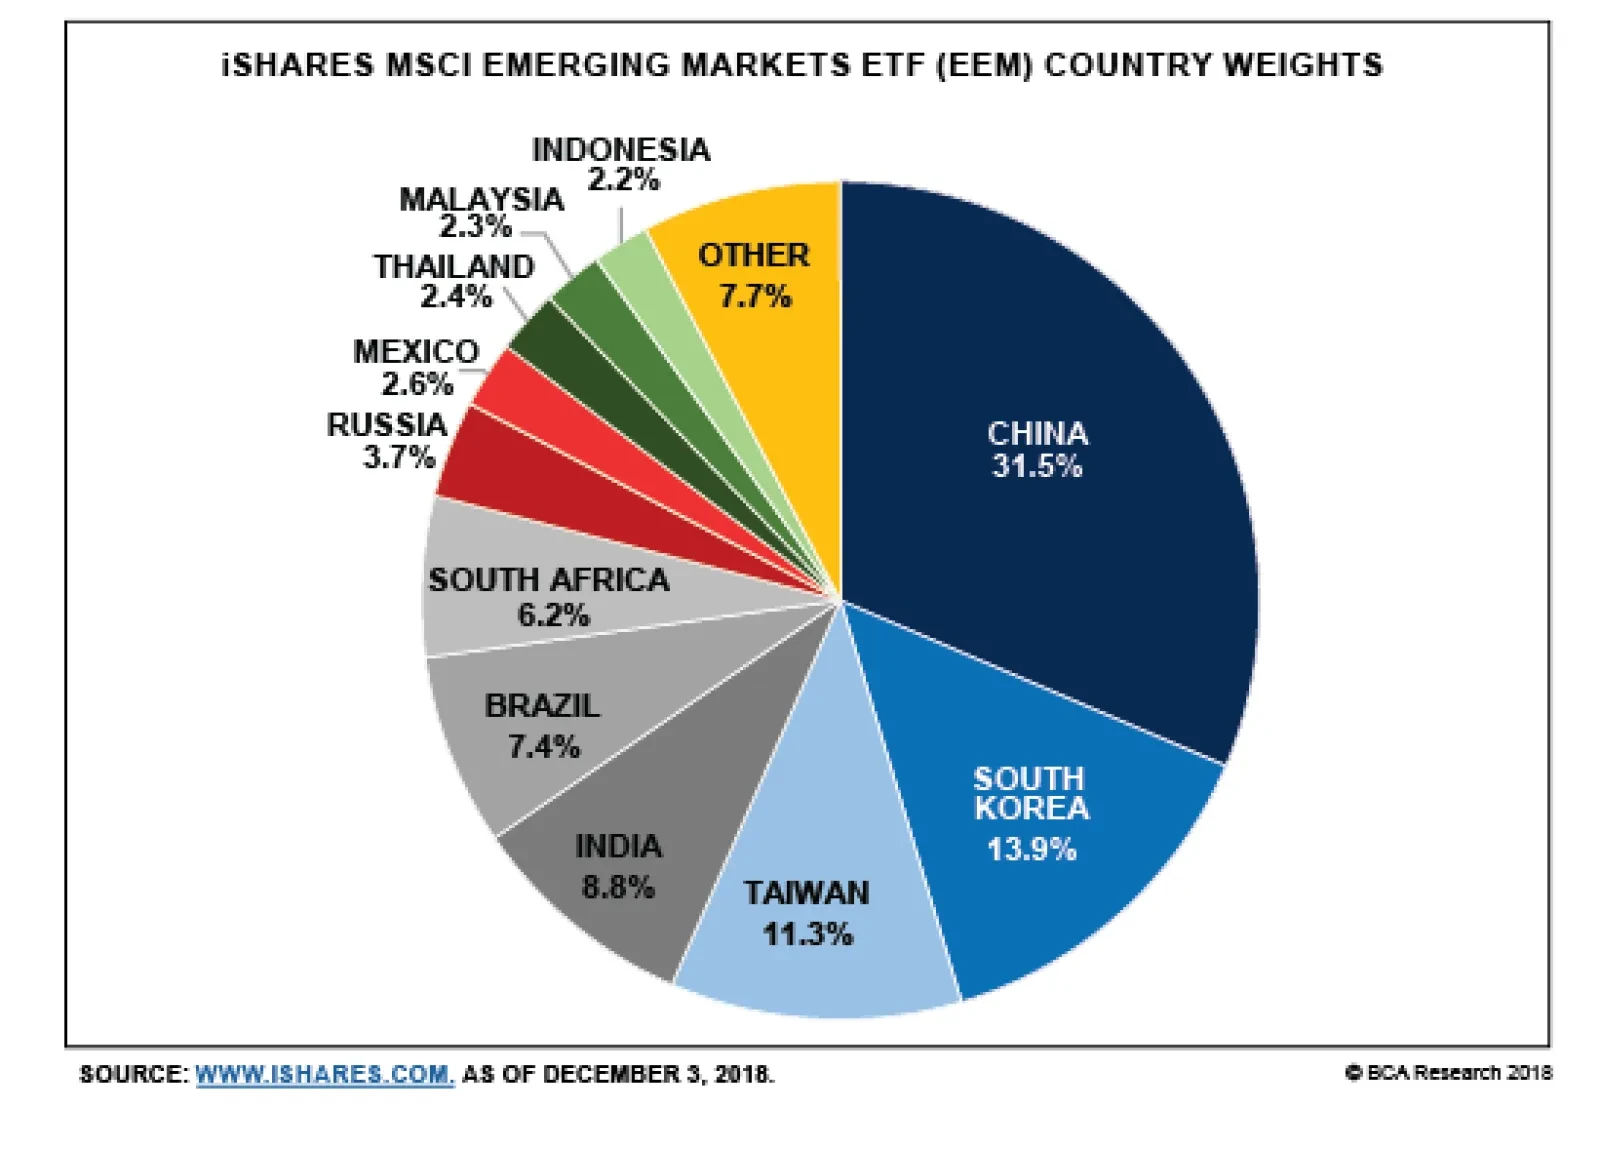
Highlights Deep-seated economic and political forces will undermine the trade truce between China and the United States. U.S. economic momentum is strong enough to allow the Fed to deliver more rate hikes next year than what the market is discounting. Global growth should stabilize by the middle of next year as China picks up the pace of stimulus and the dollar peaks. Until then, a cautious stance towards global equities and other risk assets is warranted. Global bond yields will fall further in the near term, but will rise by a faster-than-expected pace over a horizon of 6-to-18 months. Feature Trade War Roller Coaster Investors breathed a short-lived sigh of relief following the G20 summit in Buenos Aires this past weekend. During the course of a two-and-a-half hour dinner on the sidelines of the summit, President Donald Trump agreed to postpone raising tariffs from 10% to 25% on $200 billion of Chinese imports by two months to March 1st. For his part, President Xi Jinping pledged to engage in substantive talks to open up the Chinese economy to U.S. imports, while addressing U.S. concerns about forced technology transfers and IP theft. In one of the more ironic moments in history, China also agreed to restrict opioid exports to the West. Unfortunately, the euphoria did not last very long. By Tuesday, President Trump was back to his old self, calling himself “Tariff Man” and ominously warning that “We are going to have a REAL DEAL with China, or no deal at all – at which point we will be charging major Tariffs against Chinese product being shipped into the United States.” News reports indicated that the Chinese were “puzzled and irritated” by Trump’s change in tone. The mood brightened on Wednesday. Trump sounded more conciliatory, perhaps reflecting China’s decision to immediately resume importing soybeans and liquefied natural gas from the United States. By Wednesday night, however, global equities were in turmoil again due to revelations that a high-ranking Chinese tech executive had been arrested in Canada at the behest of the U.S. government on suspicion of violating sanctions against Iran. U.S. stocks recouped some of their losses Thursday afternoon, but the S&P 500 still finished down fractionally for the day. Political Stumbling Blocks To A Trade Deal At times like this, it is crucial to focus on the big picture, which is that major hurdles remain to consummating a trade deal that satisfies both sides. As our geopolitical strategists have argued, the trade war is just as much a tech war.1 China wants access to western technology, but the West, fearful of China’s ascent, is reluctant to provide it. The fact that China has had a history of appropriating western technology without due compensation only makes things worse. It is notable that U.S. Trade Representative Robert Lighthizer issued a hawkish report ahead of the summit concluding that China has not substantively changed any of the trade practices that initiated U.S. tariffs.2 Domestic U.S. politics will also undermine prospects for a lasting trade war ceasefire. Protectionism against China remains popular in the U.S., especially in the Midwestern swing states. If Trump agrees on a permanent deal to end the trade war, who will he blame if the trade deficit continues to widen? This is not just idle speculation. Trump’s trade goals are inconsistent with his fiscal policy. Fiscal stimulus will boost aggregate demand, which will suck in more imports. An overheated economy will prompt the Fed to raise rates more aggressively than it otherwise would, leading to a stronger dollar. The result will be a wider trade deficit. This does not mean that Chinese stocks cannot rally for a few weeks. The MSCI China investable index is in oversold territory, trading at less than 11-times forward earnings, compared to 14-times at the start of the year (Chart 1). Given that China represents nearly one-third of EM stock market capitalization, any sentiment-driven rally that pushes up Chinese stocks is likely to give a solid lift to the aggregate EM equity index (Chart 2). However, for EM equities to put in a durable bottom, two things need to happen: Chinese growth needs to stabilize and the dollar needs to peak. We do not see either happening until the middle of next year. Chart 1Chinese Stocks Have Taken It On The Chin
Chinese Stocks Have Taken It On The Chin
Chinese Stocks Have Taken It On The Chin
Chart 2China Is Large Enough To Give EM A Lift
Sorry, But The Trade Truce Won’t Last And The Fed Will Keep Hiking
Sorry, But The Trade Truce Won’t Last And The Fed Will Keep Hiking
Waiting For A Bottom In Chinese Growth The slowdown in Chinese growth this year has been concentrated in domestic demand rather than in trade. Chinese exports to the U.S. have actually increased by 13% in the first ten months of the year compared to the same period last year. A lull in the trade war, a weaker yuan, and lower energy input costs are all beneficial to Chinese exporters. However, the collapse in the new export order component of the Chinese manufacturing PMI suggests that these positive developments will not be enough to prevent exports from decelerating sharply in the first half of 2019 (Chart 3). Chart 3China: An Ominous Sign For Exports
China: An Ominous Sign For Exports
China: An Ominous Sign For Exports
If Chinese growth is to rebound, domestic demand will need to reaccelerate. While the Chinese government has loosened fiscal and monetary policy at the margin, this has not been sufficient to revive animal spirits. Growth continues to sag, as measured by a variety of activity measures (Chart 4). After a brief rebound, credit growth relapsed in October, pushing the year-over-year change to a multi-year low (Chart 5). Chart 4Still Waiting For Growth To Stabilize
Still Waiting For Growth To Stabilize
Still Waiting For Growth To Stabilize
Chart 5The Chinese Credit Spigot Has Not Been Opened
The Chinese Credit Spigot Has Not Been Opened
The Chinese Credit Spigot Has Not Been Opened
Looking out, there is a risk that undue optimism over the resolution of the trade war will prompt the government to redouble its efforts on its reform agenda. This agenda has been focused on reducing debt-financed investment spending – exactly the sort of expenditure commodity producers and capital goods exporters around the world rely on. Ultimately, China will be forced to pick up the pace of stimulus, as it becomes increasingly clear that the economy needs it. However, this is likely to be a story only for the second or third quarter of 2019, suggesting Chinese growth may continue to disappoint until then. No Help From The Fed The equity sell-off on Tuesday was exacerbated by comments by New York Fed President John Williams who noted that the Fed should continue raising rates “over the next year or so.”3 Williams is regarded as one of the thought-leaders at the Federal Reserve. He is also generally seen as a centrist on monetary policy. As such, his words often echo the views of the majority of FOMC members. Williams said that the U.S. economy was “on a very strong path with a lot of momentum.” We tend to agree with this assessment. Despite weakness in a few areas such as housing, the economy continues to grow at an above-trend pace. The Atlanta Fed’s GDP tracker is pointing to growth of 2.7% in the fourth quarter. Personal consumption is set to rise by 3.4%, one full percentage point above the average during the recovery. The manufacturing sector remains robust. The ISM manufacturing index rose to 59.3 in November from 57.7 the prior month. The all-important new orders component jumped 4.7 points to a three-month high of 62.1. The non-manufacturing ISM index also surprised on the upside. Strong wage growth, lower gasoline prices, and a declining savings rate will boost consumer spending next year. High levels of capacity utilization, easing lending standards, and rising labor costs will also support business investment. Residential investment should stabilize as well, given the recent decline in bond yields (Chart 6). We see the fed funds rate rising by 125 basis points through to end-2019. This stands in sharp contrast to current market pricing, which foresees only 40 basis points of hikes during this period (Chart 7). Chart 6U.S. Residential Investment Should Stabilize
U.S. Residential Investment Should Stabilize
U.S. Residential Investment Should Stabilize
Chart 7The Market Is Ignoring The Fed Dots
Sorry, But The Trade Truce Won’t Last And The Fed Will Keep Hiking
Sorry, But The Trade Truce Won’t Last And The Fed Will Keep Hiking
Don’t Fear A Flatter Yield Curve… Yet The flattening of the yield curve would seem like a major rebuke to our positive U.S. economic outlook. The 10-year/2-year Treasury spread has declined to 14 basis points. The 5-year/2-year spread has fallen into negative territory, marking the first notable inversion of any part of the Treasury curve. How worried should we be? Some concern is clearly warranted. Policymakers have been too quick to downplay the signal from the yield curve in the past. In 2006, they blamed the “global savings glut” for dragging down long-term yields. In 2000, they argued that the U.S. federal government’s budget surplus was reducing the supply of long-term bonds. In both cases, the bond market turned out to be seeing something more ominous than they were. Nevertheless, one should keep two points in mind. First, part of the recent decline in long-term bond yields reflects a fall in inflation expectations stemming from lower oil prices (Chart 8). As we discussed last week, lower oil prices should give consumers more spending power without hurting energy capex to the degree that they did in 2015.4 Chart 8Oil Price Decline Is Dragging Down Inflation Expectations
Oil Price Decline Is Dragging Down Inflation Expectations
Oil Price Decline Is Dragging Down Inflation Expectations
Second, the term premium – the extra compensation that investors demand for buying long-term bonds compared to rolling over short-term bills – is currently negative (Chart 9). This partly stems from the fact that investors see long-term Treasurys as a good hedge against recession risk (i.e., bond prices tend to go up when the economy weakens). Chart 9The U.S. Term Premium Is Negative Partly Because Bonds Are A Good Hedge Against A Weaker Economy
The U.S. Term Premium Is Negative Partly Because Bonds Are A Good Hedge Against A Weaker Economy
The U.S. Term Premium Is Negative Partly Because Bonds Are A Good Hedge Against A Weaker Economy
Quantitative easing has also driven down the term premium. While this effect has diminished as the Fed’s balance sheet has shrunk, estimates by the New York Fed indicate that the 10-year yield is still 65 points lower than it would have been in the absence of asset purchases.5 If the term premium were 84 basis points – the average between 2004 and 2007 – the 10-year/3-month slope would be 195 basis points. Empirically, the 10-year/3-month slope is the best recession predictor of any yield curve measure. It still stands at 50 basis points. If long-term yields stay put and the Fed raises rates once per quarter, this part of the yield curve will not invert until the second half of next year. It usually takes about 12-to-18 months for an inversion in the 10-year/3-month slope to culminate in a recession (Chart 10). In the last downturn, the slope fell into negative territory in February 2006, 22 months before the start of the recession. This suggests that the next recession will not occur until late 2020 at the earliest. Chart 10The U.S. Yield Curve: An Admirable Track Record In Forecasting Recessions
The U.S. Yield Curve: An Admirable Track Record In Forecasting Recessions
The U.S. Yield Curve: An Admirable Track Record In Forecasting Recessions
Investment Conclusions The signal for global equities from our tactical MacroQuant model has improved since early October, mainly because the sell-off has gone a long way towards discounting some of the negative macro developments that have occurred. Nevertheless, the model continues to signal downside risks for global stocks stretching into early 2019 (Chart 11). Chart 11The MacroQuant Equity Score Has Improved, But Is Still In Bearish Territory
Sorry, But The Trade Truce Won’t Last And The Fed Will Keep Hiking
Sorry, But The Trade Truce Won’t Last And The Fed Will Keep Hiking
The model utilizes a “what you see is what you get” approach, meaning that it only relies on observable data rather than estimates of unobservable variables like the neutral rate of interest. Right now, global growth is decelerating and financial conditions have tightened, which has caused the model to turn bearish on the near-term outlook for stocks. If we are correct that China will be forced to step up the pace of stimulus; that worries over Italian debt will fade, at least temporarily, with an agreement over next year’s budget; and that U.S. growth will remain buoyant even in the face of higher rates (implying that the neutral rate is higher than widely believed), then global growth should stabilize by the middle of next year. The dollar tends to weaken whenever global growth accelerates, which should provide a further reflationary impulse to the world economy (Chart 12). Chart 12Accelerating Global Growth Tends To Be Bearish For The Dollar
Accelerating Global Growth Tends To Be Bearish For The Dollar
Accelerating Global Growth Tends To Be Bearish For The Dollar
Equity bull markets typically end about six months before the onset of a recession (Table 1). If the next global recession does not occur for at least another two years, this will provide enough time for a blow-off rally in stocks starting in mid-2019. Hence, investors should stay tactically cautious towards global equities over a 3-month horizon, but be prepared to turn cyclically opportunistic over a 6-to-18 month horizon. Table 1Too Soon To Get Out
Sorry, But The Trade Truce Won’t Last And The Fed Will Keep Hiking
Sorry, But The Trade Truce Won’t Last And The Fed Will Keep Hiking
Over the past few months, we have argued that bond yields will temporarily decline due to slower global growth amid widespread bearish bond sentiment. This has indeed happened. Yields are likely to remain under downward pressure into early 2019, but should then begin to stabilize and move higher, ultimately rising much more than expected as global inflation accelerates. Peter Berezin, Chief Global Strategist Global Investment Strategy peterb@bcaresearch.com Footnotes 1 Please see Geopolitical Strategy Weekly Report, “Trade Truce: Narrative Vs. Structural Shift?” dated December 3, 2018; and “Trump’s Demands On China,” dated April 4, 2018. 2 Please see Office of the United States Trade Representative, “Update Concerning China’s Acts, Policies, And Practices Related To Technology Transfer, Intellectual Property, And Innovation,” dated November 20, 2018, available at www.ustr.gov. 3 Jonathan Spicer, “Fed's Williams says rate hikes 'over next year or so' still make sense,” Reuters, December 4, 2019. 4 Please see Global Investment Strategy Weekly Report, “Shades Of 2015,” dated November 30, 2018. 5 Please see Brian Bonis, Ihrig, Jane, and Wei, Min, “The Effect of the Federal Reserve’s Securities Holdings on Longer-term Interest Rates,” FEDS Notes, Federal Reserve (April 20, 2017). Strategy & Market Trends Tactical Trades Strategic Recommendations Closed Trades
Today’s U.S. payroll report was a bit on the soft side. The important question now is whether the weaker payrolls growth is because of weakening demand or is it starting to reflect supply side constraints in the economy. While the direction of wage growth is…
News reports suggest OPEC 2.0 could re-instate its original production-management accord agreed in November 2016, under which 1.8mm b/d of output was taken off the market. Nonetheless, we continue to expect cuts to come in on either side of 1.2mm b/d.…
The U.S. economy has been buoyed by pro-cyclical stimulus, whereas Chinese policymakers have created a macro-prudential framework that has impaired the country’s credit channel. This divergence has led to the outperformance of the U.S. economy over the rest…

The good news is that the balance sheets of U.S. energy companies have improved markedly over the past few years. Rapid productivity gains have allowed shale producers to boost production to record levels without having to incur substantially higher costs. In…
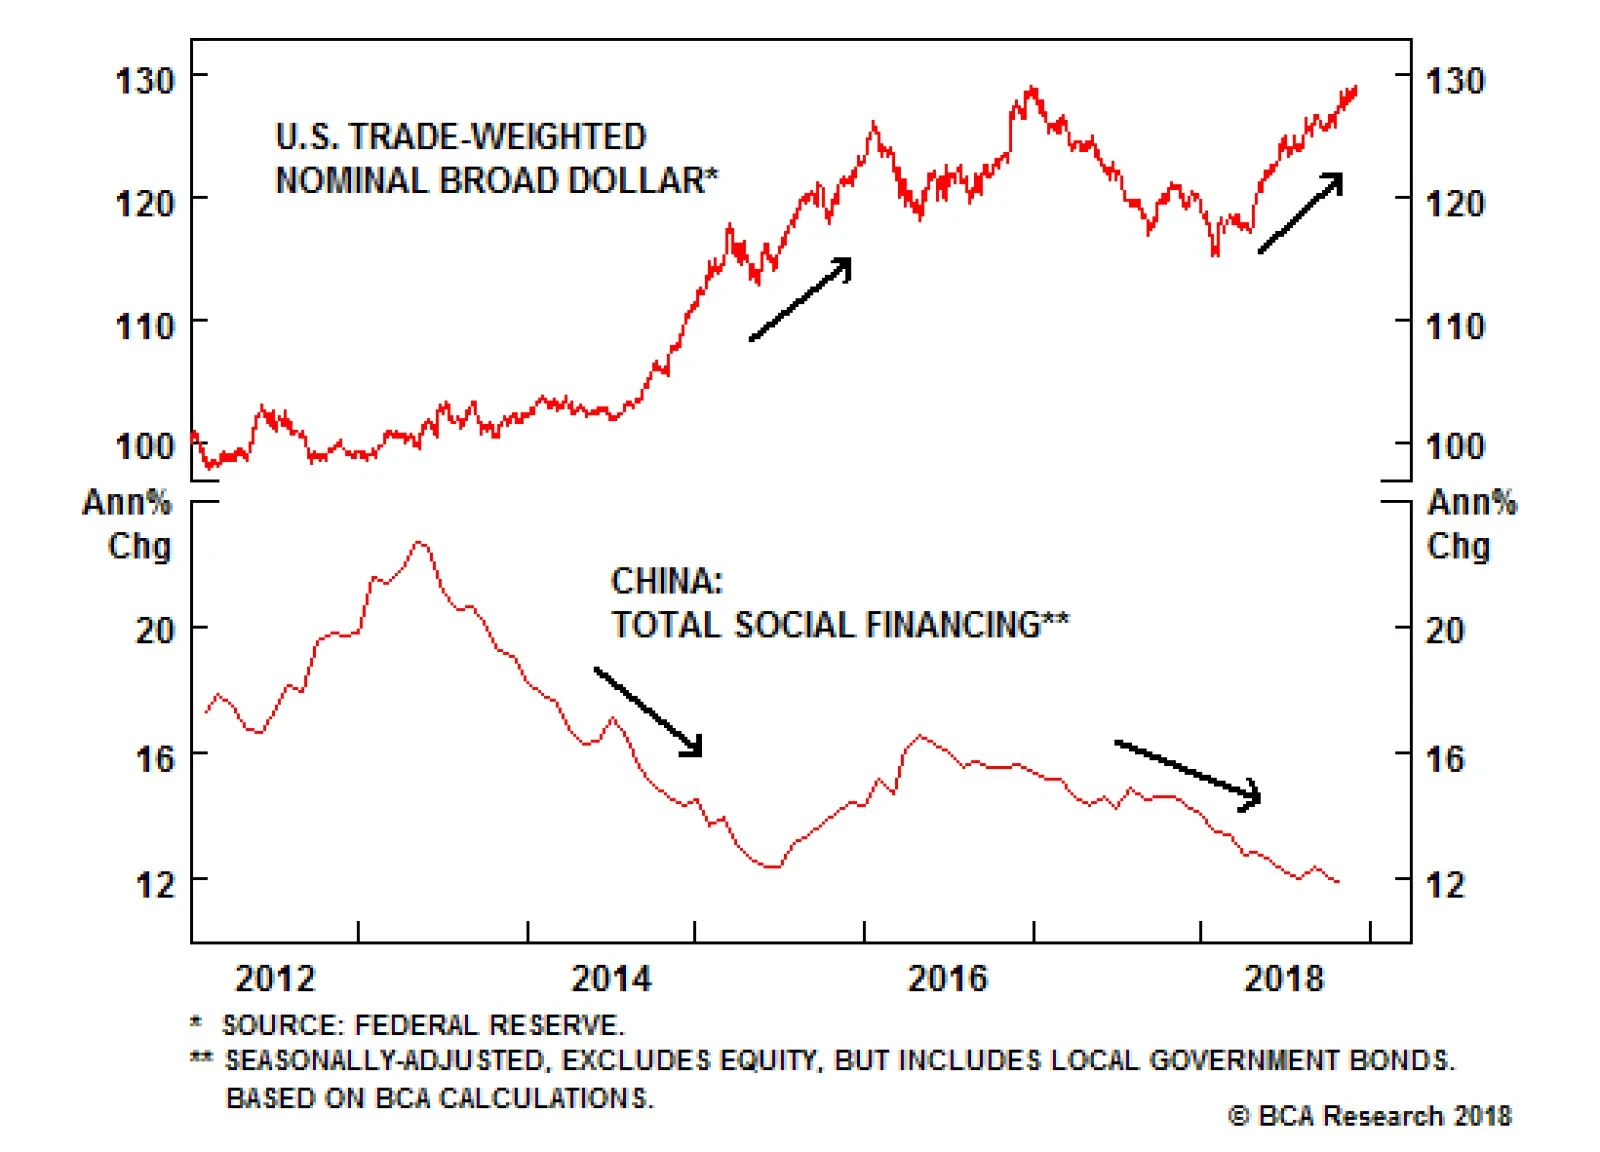
In 2014, the Fed was gearing up to raise rates while other central banks were still in full-out easing mode. The divergence in monetary policies between the U.S. and the rest of the world caused the U.S. dollar to surge. The broad trade-weighted dollar…
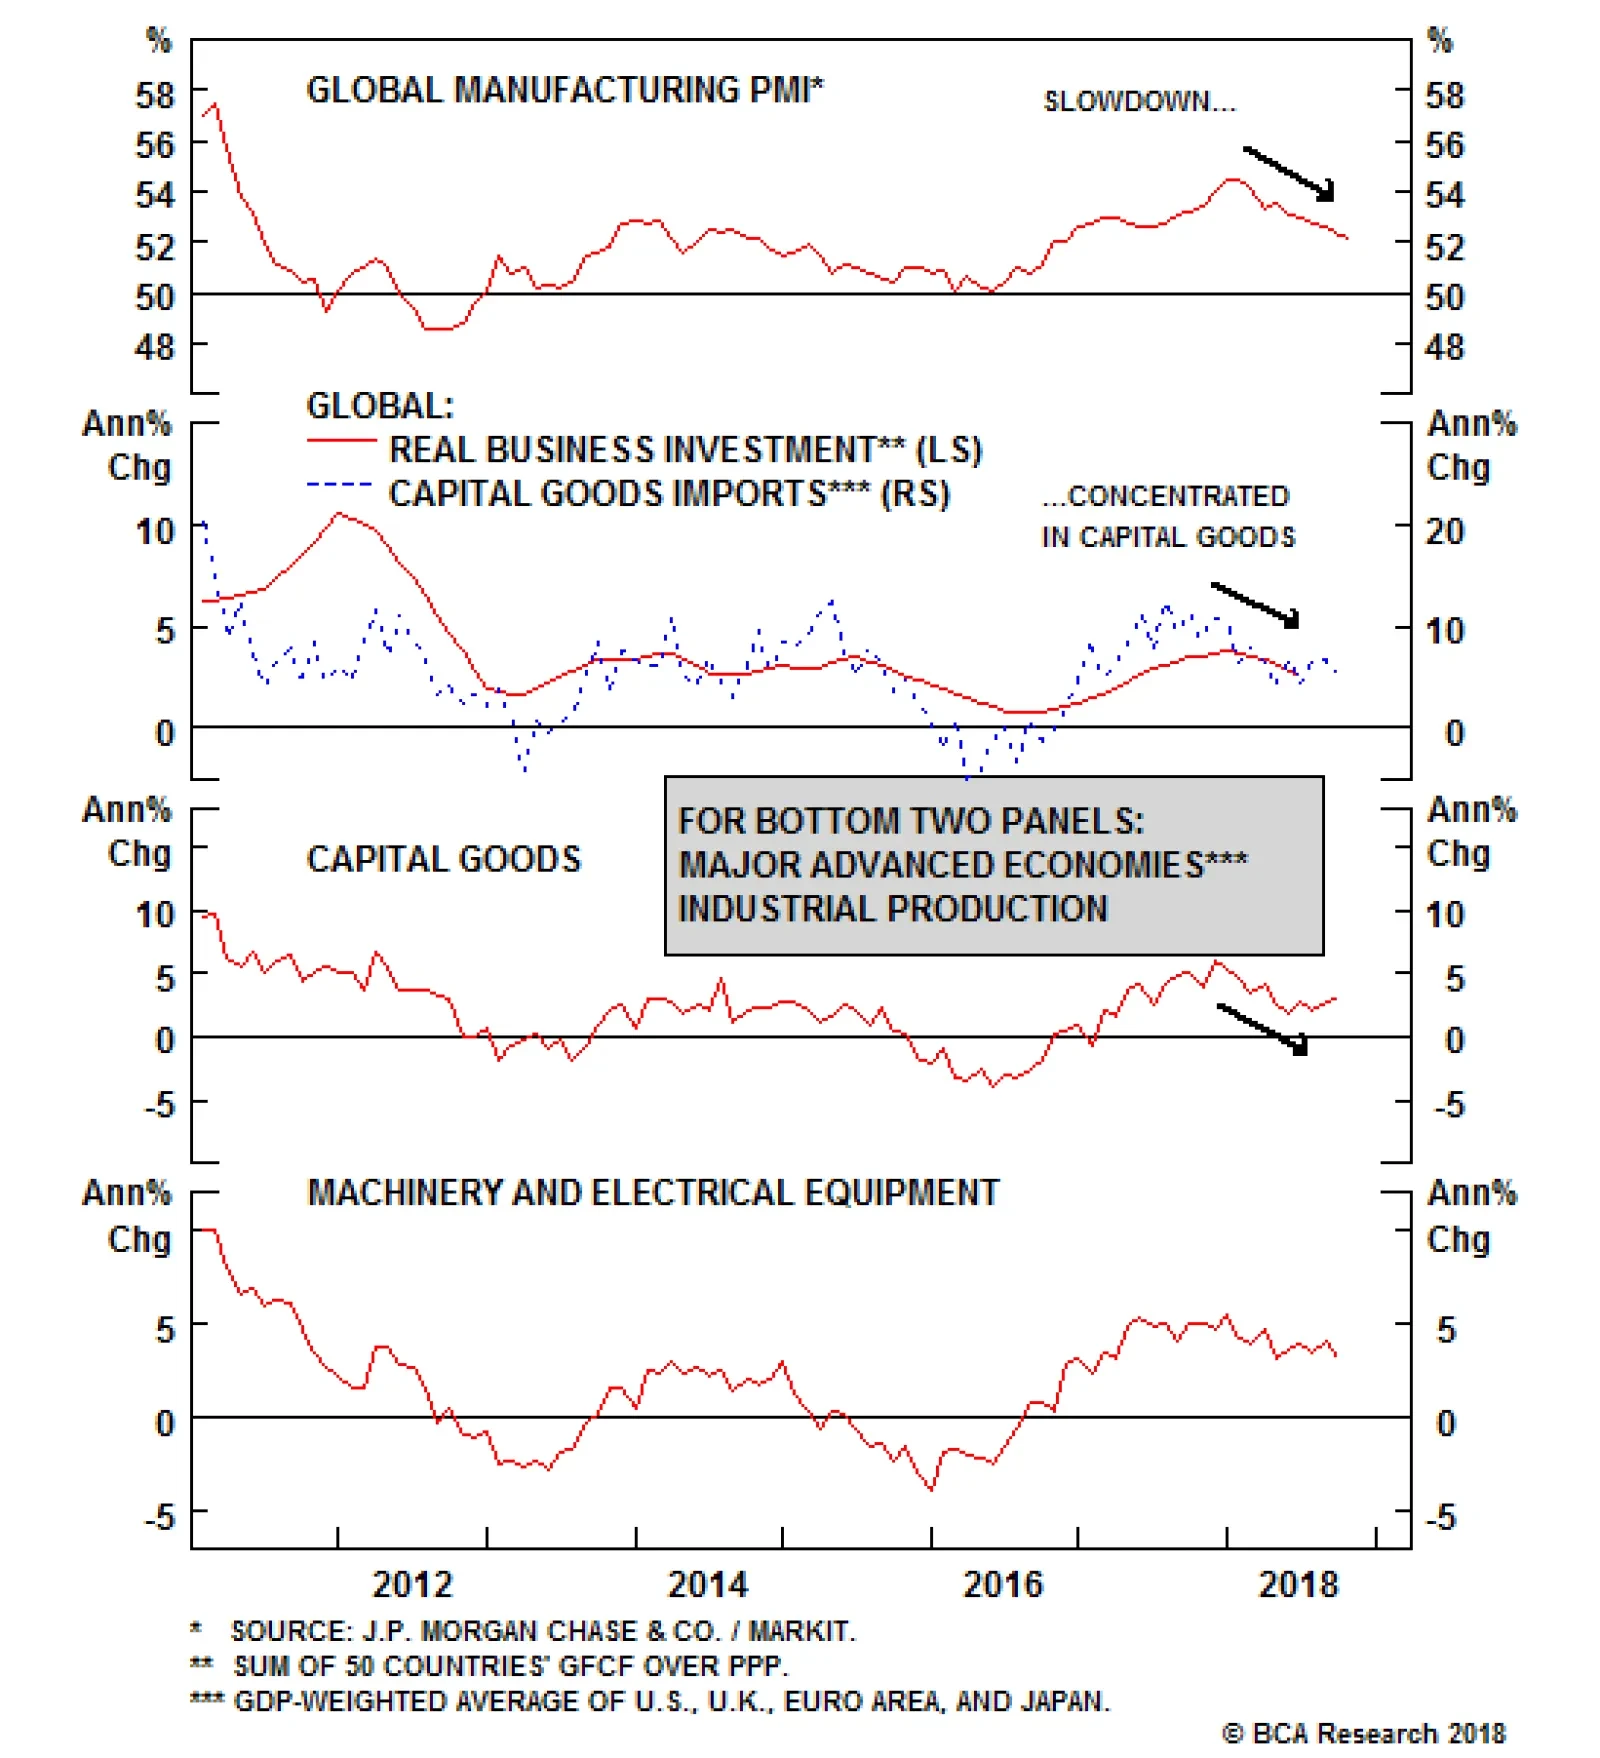
Several factors have weighed on business confidence outside the U.S. Among the chief worries, trade wars, a strong dollar, higher oil prices, emerging market turbulence, the return of Italian debt woes, and a slowdown in the Chinese economy all stand tall. …