Global

We downgraded global equities this summer based on lofty valuations, overly bullish sentiment, and the prospect of slowing global growth. Since then, valuations have improved, sentiment has turned more cautious, and while global growth will continue to decelerate in the first half of 2019, asset markets have largely discounted this outcome. Consistent with this turn of events, our MacroQuant equity model is now sending a more upbeat signal on equities, while flagging a more challenging outlook for bonds. As such, we recommend that clients overweight global equities during the next 12 months, underweight government bonds, and move cash allocations from overweight back down to neutral. We discussed our key views for 2019 in this week’s report and they remain in place following today’s adjustments. Today’s FOMC statement and press conference do not alter these conclusions. The Fed now expects to raise rates two times in 2019, down from three hikes in the September statement. The more gradual pace of rate increases reflects the tightening in financial conditions observed over the past few months as well as somewhat lower-than-expected inflation readings. Ultimately, we think the Fed will be able to raise rates at least three times next year as it becomes clear that the U.S. economy can tolerate tighter monetary policy. Higher U.S. rates, in conjunction with slowing Chinese growth, will keep the dollar well bid in the first half of next year, allowing U.S. stocks to outperform their foreign peers in dollar terms. In past reports, we highlighted our intention to go long the MSCI All-Country World index if the ACWI ETF reached $64. This occurred today and we are now long the index as part of our structural trade recommendations. Peter Berezin, Chief Global Strategist Global Investment Strategy peterb@bcaresearch.com
We downgraded global equities this summer based on lofty valuations, overly bullish sentiment, and the prospect of slowing global growth. Since then, valuations have improved, sentiment has turned more cautious, and while global growth will continue to decelerate in the first half of 2019, asset markets have largely discounted this outcome. Consistent with this turn of events, our MacroQuant equity model is now sending a more upbeat signal on equities, while flagging a more challenging outlook for bonds. As such, we recommend that clients overweight global equities during the next 12 months, underweight government bonds, and move cash allocations from overweight back down to neutral. We discussed our key views for 2019 in this week’s report and they remain in place following today’s adjustments. Today’s FOMC statement and press conference do not alter these conclusions. The Fed now expects to raise rates two times in 2019, down from three hikes in the September statement. The more gradual pace of rate increases reflects the tightening in financial conditions observed over the past few months as well as somewhat lower-than-expected inflation readings. Ultimately, we think the Fed will be able to raise rates at least three times next year as it becomes clear that the U.S. economy can tolerate tighter monetary policy. Higher U.S. rates, in conjunction with slowing Chinese growth, will keep the dollar well bid in the first half of next year, allowing U.S. stocks to outperform their foreign peers in dollar terms. In past reports, we highlighted our intention to go long the MSCI All-Country World index if the ACWI ETF reached $64. This occurred today and we are now long the index as part of our structural trade recommendations. Peter Berezin, Chief Global Strategist Global Investment Strategy peterb@bcaresearch.com
At the country level, our global fixed income strategists recommend underweighting government bond markets where central banks will be more likely to raise interest rates (because of firm domestic economic growth and building inflation pressures), but where…
Government bond yields enter 2019 at very low (i.e. expensive) levels across the major developed markets, even after the cumulative rise in U.S. Treasury yields seen over the past twelve months. Real yields remain below trend real GDP growth rates, a…
Dear Client, This will be the last Global Investment Strategy report of 2018. Publication will resume on January 4th. On behalf of the entire Global Investment Strategy team, I would like to wish you a Merry Christmas, Happy Holidays, and a Healthy New Year! Best regards, Peter Berezin, Chief Global Strategist Feature 1. Will the Fed raise rates more or less than what is priced into the futures curve? Answer: More. The fed funds futures curve is pricing in less than one rate hike in 2019 and rate cuts beyond then. In contrast, we think the Fed will raise rates three or four times next year and continue hiking into 2020. For all the worries about a slowdown, U.S. real GDP growth is still tracking at 3% in Q4 according to the Atlanta Fed, while consumption is set to rise by 4.1%. Ongoing fiscal stimulus, decent credit growth, rising wages, and a decline in the savings rate should continue to support the economy in 2019. Housing construction should also stabilize thanks to a low vacancy rate and a pickup in household formation. The fact that mortgage applications for purchase have rebounded swiftly in recent weeks is evidence that the housing market is not as weak as many people believe (Chart 1). Chart 1U.S. Housing: No Oversupply Problem, While Demand Is Firming
U.S. Housing: No Oversupply Problem, While Demand Is Firming
U.S. Housing: No Oversupply Problem, While Demand Is Firming
2. Will U.S. 10-year Treasury yields rise more or less than expected? Answer: More. Treasurys almost always underperform cash when the Fed delivers more rate hikes than the market is discounting (Chart 2). We expect a modest bear flattening of the yield curve in 2019, with rising bond yields nearly offsetting the increase in short-term rates. Most of the flattening is likely to come in the next six months, as slower global growth and the disinflationary effects of lower oil prices keep bond yields contained. As we enter the second half of next year, global growth should reaccelerate as the effects of Chinese stimulus measures fully kick in and the drag on global growth from the recent tightening in financial conditions dissipates. By that time, the U.S. unemployment rate will be in the low 3% range, a level that could trigger material inflationary pressures. Chart 2Treasurys Will Underperform If The Fed Hikes Rates By More Than Expected
Treasurys Will Underperform If The Fed Hikes Rates By More Than Expected
Treasurys Will Underperform If The Fed Hikes Rates By More Than Expected
3. Will the yield spreads between U.S. Treasurys and other developed economy bond markets widen? Answer: Yes, particularly at the short end of the curve. The Fed is still the one central bank that is most likely to hike rates multiple times in 2019, which will support wider differentials between Treasurys and non-U.S. bond yields. The greatest potential for spread widening will be for Treasurys versus JGBs. With Japanese inflation still stubbornly low and fiscal policy set to tighten from a hike in the sales tax, the BoJ will be in no position to abandon its yield curve control regime. The 10-year Treasury-gilt spread could also widen if the Bank of England is forced to stay on the sidelines until Brexit uncertainty is resolved. Likewise, the U.S.-New Zealand spread will widen as the RBNZ stays on hold due to underwhelming growth and inflation momentum. The U.S.-Canada spread will be range-bound, with the Bank of Canada coming close to matching, but not surpassing, Fed tightening in 2019. While the ECB will refrain from raising rates next year, the U.S. Treasury-German bund spread should narrow marginally if the end of ECB QE lifts bund yields via a recovery in the German term premium. There is more (albeit still modest) scope for a narrowing in the 10-year U.S.-Australia and U.S.-Sweden spreads, as both the RBA and Riksbank begin a tightening cycle. 4. What will happen to U.S. corporate credit spreads? Answer: They are likely to finish 2019 close to current levels. As a rule of thumb, corporate bond returns are highest when the yield curve is very steep, and lowest when it is inverted (Table 1). The former generally corresponds to the early stages of business-cycle expansions, while the latter encompasses the period directly preceding recessions. We are still in the intermediate phase, when excess corporate bond returns (relative to cash) are positive but low. This conclusion is consistent with the observation that corporate balance-sheet leverage has increased over the past four years, but not by enough to instigate a major wave of defaults. Table 1Corporate Bond Performance Given The Slope Of The Yield Curve (1975-Present)
2019 Key Views: Ten Market Questions
2019 Key Views: Ten Market Questions
5. Will the U.S. dollar continue to strengthen? Answer: The dollar will strengthen until the middle of 2019 and then begin to weaken. Three main factors determine the short-to-medium term direction of the dollar: 1) momentum; 2) interest rate spreads between the U.S. and its trading partners; and 3) global growth. In general, the dollar does well when it is trending higher, spreads relative to the rest of the world are wide and getting wider, and global growth is slowing (Chart 3). For the time being, momentum continues to work in the greenback’s favor. Spreads have narrowed a bit recently, but the dollar still looks cheap relative to what one would expect based on the current level of spreads (Chart 4). As in 2017, the direction of global growth will likely be the key driver of the dollar next year. If growth bottoms in mid-2019, as we expect, the dollar will probably put in a top. Chart 3Dollar Returns Driven By Momentum, Rate Differentials, And Global Growth
2019 Key Views: Ten Market Questions
2019 Key Views: Ten Market Questions
Chart 4Wider Spreads Bode Well For The Dollar
Wider Spreads Bode Well For The Dollar
Wider Spreads Bode Well For The Dollar
6. Will global equities rise or fall? Answer: Rise. Our tactical MacroQuant stock market timing model finally moved back into neutral territory on Monday after having successfully flagged the correction that began in October (Chart 5). Having downgraded global equities this past summer, we will return to overweight if the ACWI ETF drops to $64, which is only 2.4% below yesterday’s close. The cyclical backdrop for stocks is reasonably constructive. We expect the MSCI All-Country World Index to rise by about 10%-to-15% in dollar terms from current levels by the end of 2019. The higher end of this range would leave it slightly below its January 2018 peak (Chart 6). The index is currently trading at 13.3-times forward earnings, similar to where it was in early-2016. The U.S. accounts for over 50% of global stock market capitalization (Chart 7). As such, the U.S. equity market tends to influence non-U.S. stocks more than the other way around. Sustained U.S. equity bear markets are rare outside of recessions (Chart 8). With another U.S. recession unlikely to occur at least until late-2020, that gives global stocks enough room to rally. Indeed, history suggests that the late stages of business-cycle expansions are often the juiciest for equity investors (Table 2). Chart 5The MacroQuant Equity Score* Improves To Neutral
2019 Key Views: Ten Market Questions
2019 Key Views: Ten Market Questions
Chart 6Global Stocks Have Cheapened
Global Stocks Have Cheapened
Global Stocks Have Cheapened
Chart 7The U.S. Is The Dominant Equity Market
2019 Key Views: Ten Market Questions
2019 Key Views: Ten Market Questions
Chart 8Recessions And Bear Markets Usually Overlap
Recessions And Bear Markets Usually Overlap
Recessions And Bear Markets Usually Overlap
Table 2Too Soon To Get Out
2019 Key Views: Ten Market Questions
2019 Key Views: Ten Market Questions
7. Will cyclical stocks outperform defensives? Answer: Yes, although this is likely to be more of a phenomenon for the second half of 2019. Cyclicals typically outperform defensives when bond yields are climbing (Chart 9). Rising bond yields are usually a sign of stronger growth — manna from heaven for capital goods and commodity producers. As long as global growth is under pressure, cyclicals will struggle. But once growth bottoms in the middle of next year, cyclical stocks will have their day in the sun. Chart 9Cyclicals Tend To Outperform When Yields Rise
Cyclicals Tend To Outperform When Yields Rise
Cyclicals Tend To Outperform When Yields Rise
8. Will U.S. equities continue to outperform other global stock markets? Answer: Yes, but probably only until mid-2019. The U.S. stock market has less exposure to cyclical sectors such as industrials, materials, energy, and financials than the rest of the world (Table 3). Therefore, it stands to reason that an inflection point for cyclicals versus defensives will correspond to an inflection point for U.S. versus non-U.S. stocks. If this were to happen, it would resemble the period between October 1998 and April 2000, a time when bond yields rose, the dollar rally stalled, cyclicals outperformed defensives, and non-U.S. equities outperformed (Chart 10). Table 3Tech And Health Care Stocks Are Heavily Weighted In The U.S., While Financials And Materials Are Overrepresented In Markets Outside The U.S.
2019 Key Views: Ten Market Questions
2019 Key Views: Ten Market Questions
Chart 10Will The Late-1990s Pattern Be Repeated?
Will The Late-1990s Pattern Be Repeated?
Will The Late-1990s Pattern Be Repeated?
9. Will oil prices rise more than expected? Answer: Yes. The December-2019 Brent futures contract is currently trading at $61/bbl (Chart 11). Our energy strategists expect Saudi Arabia and Russia to cut production by enough to push prices to an average of $82/bbl in 2019. Looking further out, the outlook for oil prices is less favorable. As every first-year economics student learns, prices in a competitive market eventually converge to average costs. Shale companies are now the swing producers in the global petroleum market. Their breakeven costs are in the low-$50 range, a number that has been trending lower due to productivity gains. If that is the long-term anchor for oil prices, it means that any major rally in oil is unlikely to extend deep into the next decade. Chart 11Oil Prices Will Recover
Oil Prices Will Recover
Oil Prices Will Recover
10. Will gold prices finally rally? Answer: Yes, but only in the second half of 2019. Gold prices typically fall when the dollar is strengthening (Chart 12). Given our view that the dollar will rally into mid-2019, now is not the time to be loading up on bullion. However, once the dollar peaks and U.S. inflation moves decidedly higher late next year, gold should become a star performer. Chart 12Gold Will Shine Bright After The Dollar Peaks
Gold Will Shine Bright After The Dollar Peaks
Gold Will Shine Bright After The Dollar Peaks
Peter Berezin, Chief Global Strategist Global Investment Strategy peterb@bcaresearch.com Strategy & Market Trends Tactical Trades Strategic Recommendations Closed Trades
However, at this juncture, the global policy backdrop still favors remaining long the dollar and using any correction to build up larger long-dollar bets. Our BCA Fed Monitor continues to point to the need for tightening U.S. monetary policy. However, the…
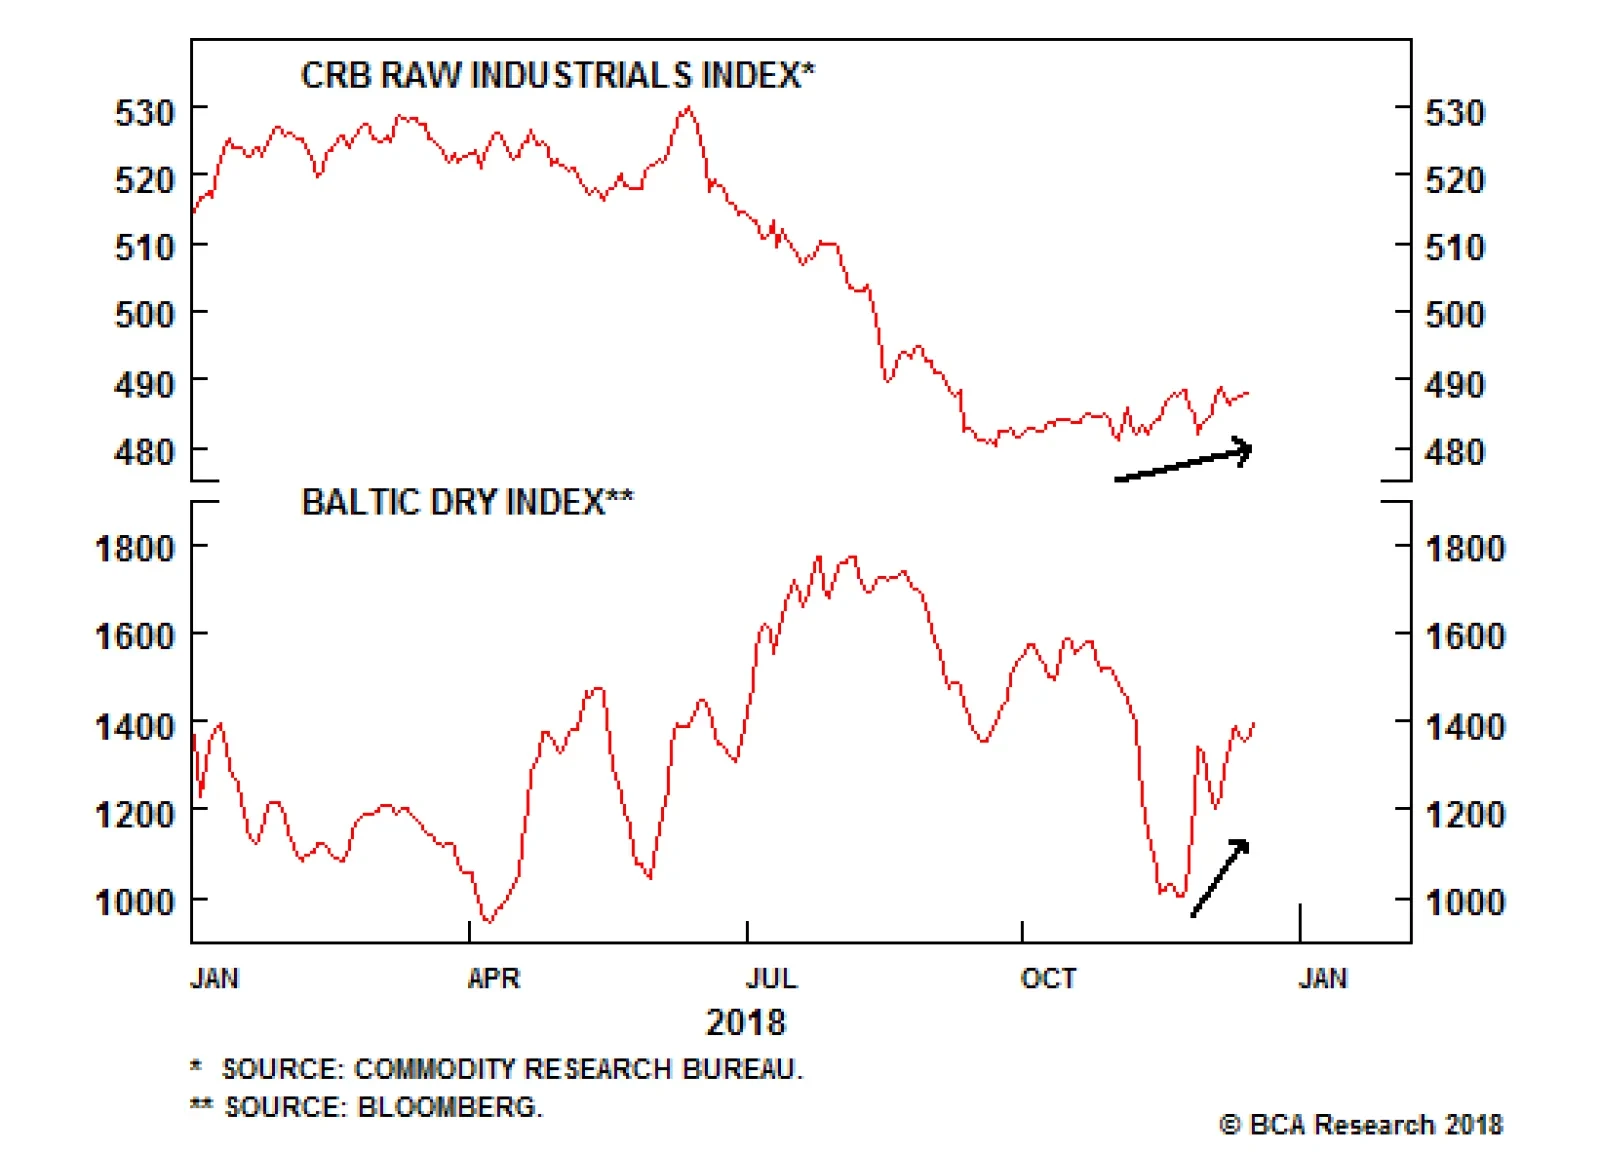
In recent weeks, a few market signals have offered some hope. The growth-sensitive CRB Raw Industrials index has been firming, and the Baltic Dry index has recouped 40% of its loss from August to November. EM FX has also staged a bit of a rebound, led by…
Highlights A progressing Sino-U.S. trade truce, rallying commodities and EM FX as well as improving Swedish economic activity point to a respite in the global growth slowdown. This should support commodity currencies and cause a correction in the dollar – moves we would fade. Ultimately, tightening U.S. policy and a rising Chinese marginal propensity to save point to both slower growth and a stronger dollar over the coming six to nine months. The European Central Bank is extremely data dependent, and in our view, our outlook on global growth will compromise the ECB’s ability to lift rates in September 2019. A tactical trade: Sell EUR/GBP. Feature Glimmers of hope are emerging for dollar bears and EM bulls. The Sino-U.S. trade truce seems to be progressing: Meng Wanzhou, the CFO of Huawei, was released on bail this week, and U.S. President Donald Trump suggested he would lean in her favor; China dropped its tariffs on U.S. auto imports to 15%; and the communication channels between China and the U.S. are clearly open. Green shoots for global growth have also emerged, with commodity prices staging a bit of a rebound, and data in some small, open economies very levered to global growth showing improvement. These developments can easily help risk assets temporarily rebound, lifting EM currencies and G-10 commodity currencies in the process while hurting the greenback for a month or two. However, we remain doubtful that these glimmers of hope for global growth will morph into a sustained rebound in global industrial activity. Consequently, we are inclined to use any weakness in the greenback to buy the dollar, and any rebound in EM and commodity currencies to sell them in anticipation of deeper lows. A Set Up For Some Dollar Weakness… The continued warming up in Sino-U.S. relations is encouraging, but as we argued last week, a more important consideration is whether global growth is finding a floor.1 In recent weeks, a few market signals have offered some hope. The growth-sensitive CRB Raw Industrials index has been firming, and the Baltic Dry index has recouped 40% of its loss from August to November (Chart I-1). Chart I-1Green Shoots In The Commodity Space...
Green Shoots In The Commodity Space...
Green Shoots In The Commodity Space...
EM FX has also staged a bit of a rebound, led by the Turkish lira. The most positive development on this front has been the recent gains in the yuan. Its rebound keeps at bay a large deflationary shock for the global economy, and the stability in EM FX means that EM financial conditions are not deteriorating further (Chart I-2). Chart I-2...Green Shoots In EM FX...
...Green Shoots In EM FX...
...Green Shoots In EM FX...
In our view, the greatest source of optimism comes from the Swedish economy. Sweden is a small, open economy where industrial and intermediate goods account for 25% of exports, or 11% of GDP. Its manufacturing PMI have been rebounding – a phenomenon repeated across multiple data sets. In fact, our diffusion index of 15 Swedish economic variables has been recovering. Based on history, the current recovery in the Swedish economic advance/decline line points to an upcoming rebound in EM exports growth, and to a temporary stabilization in the Global Leading Economic Indicator (Chart I-3). Chart I-3...And Green Shoots In Sweden As Well!
...And Green Shoots In Sweden As Well!
...And Green Shoots In Sweden As Well!
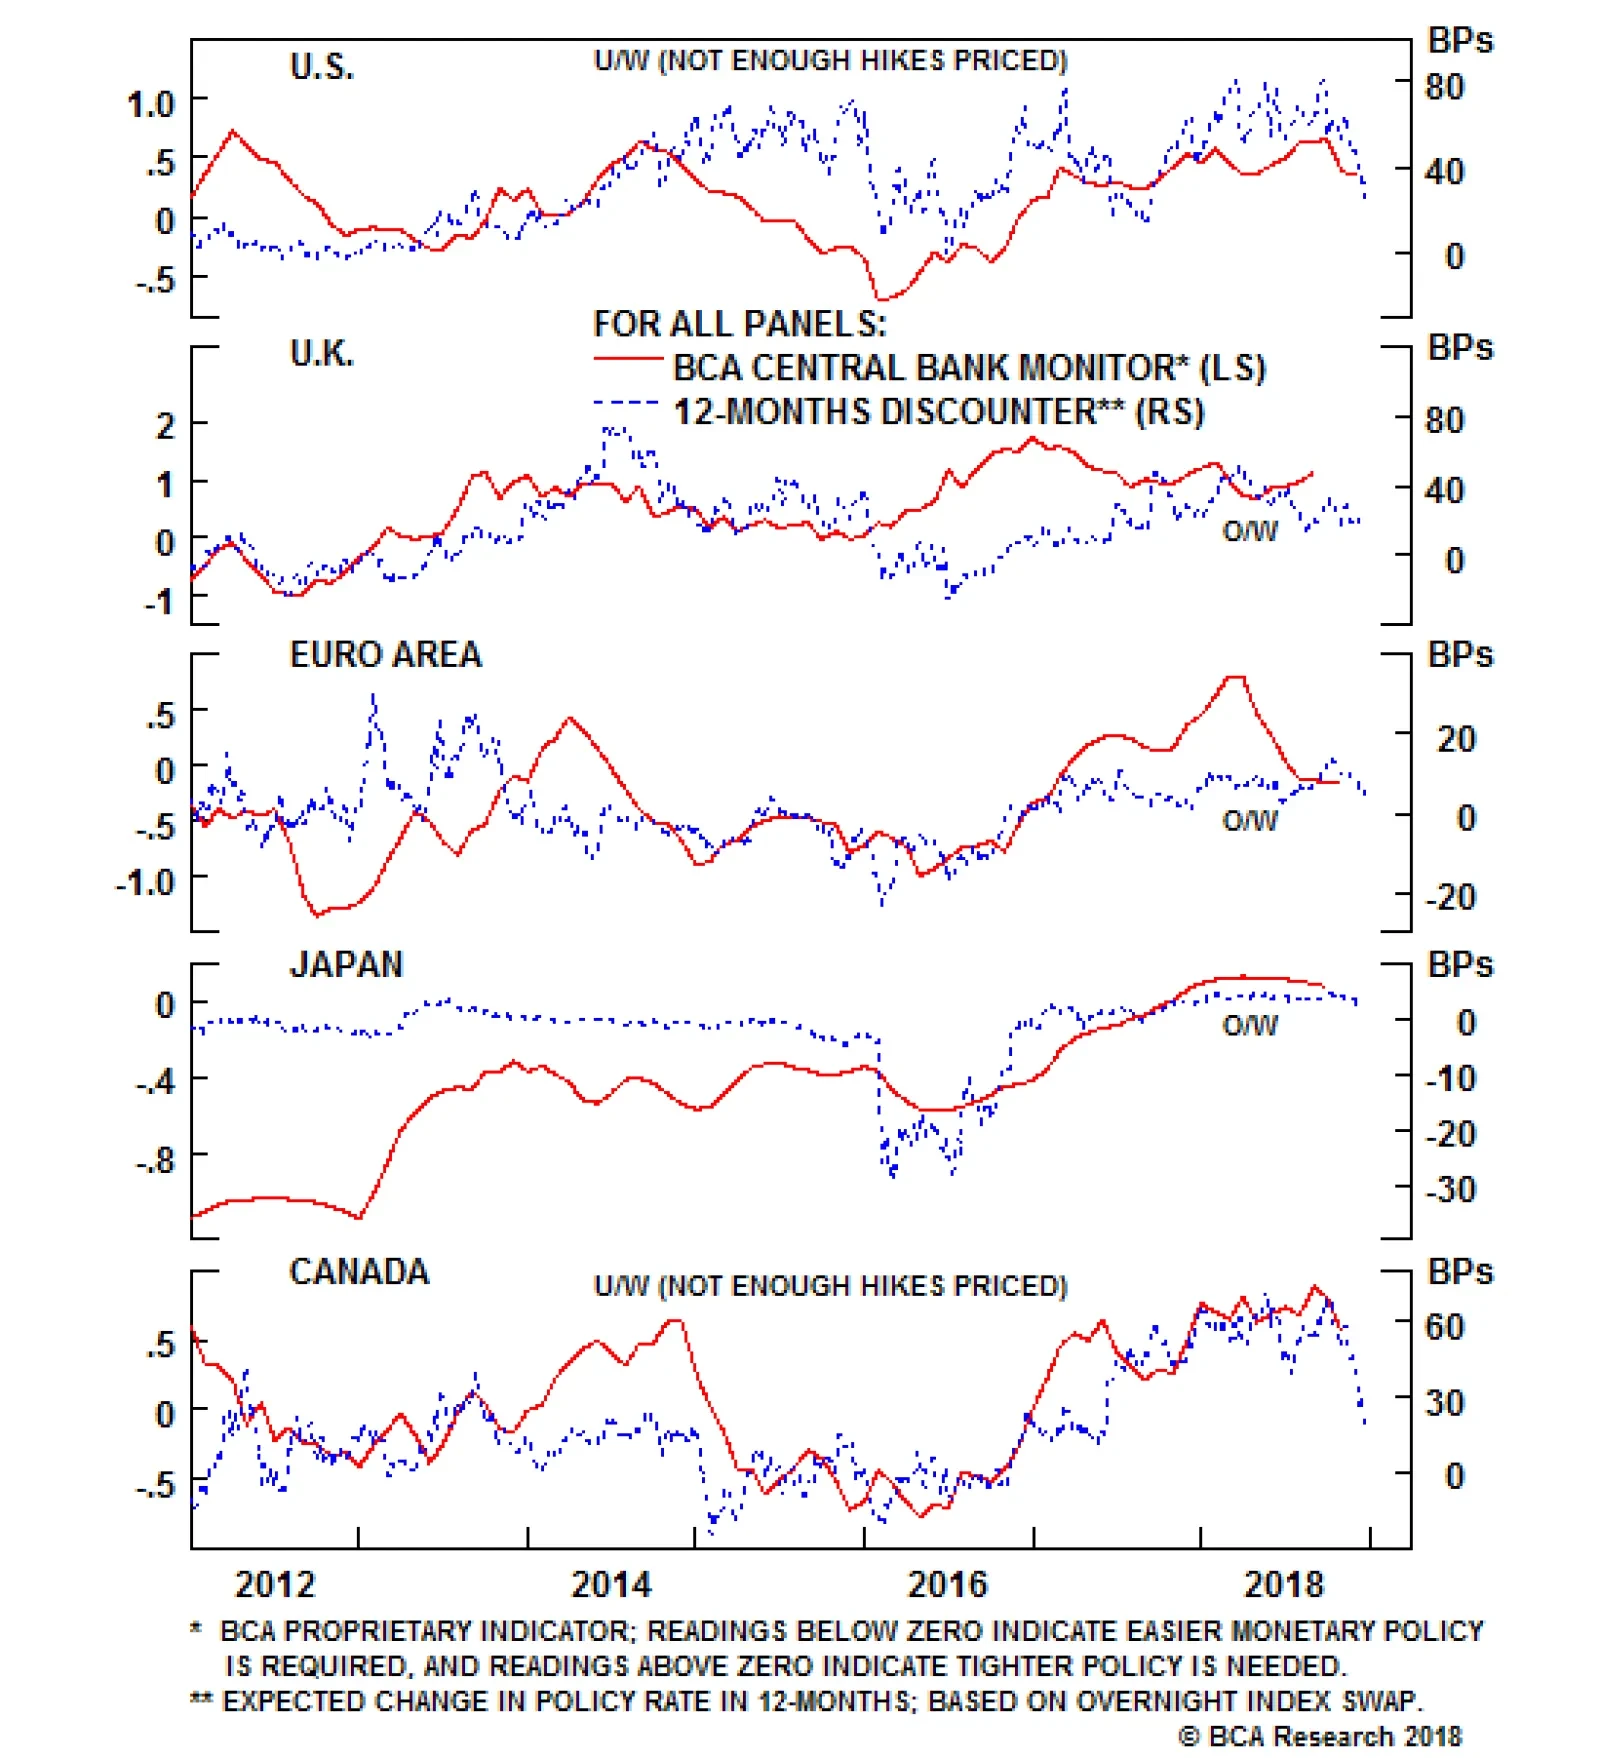
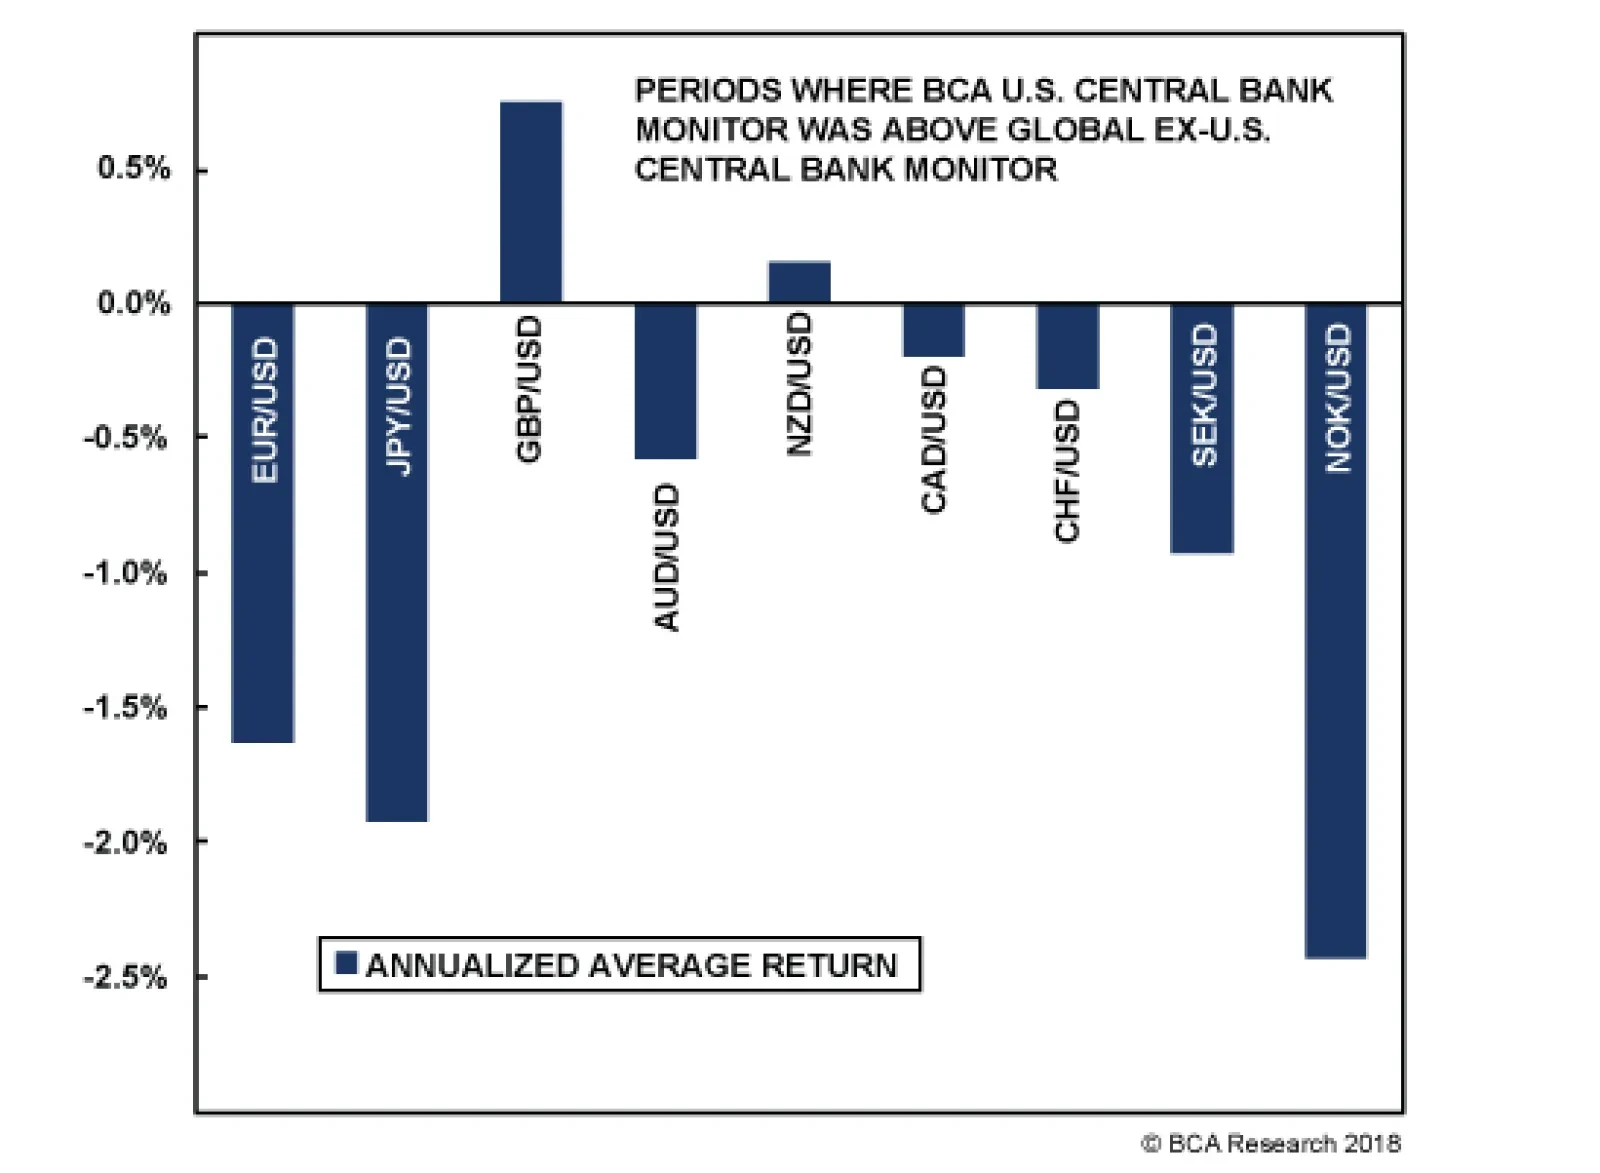
Any sign of stabilization in global economic activity will generate a period of weakness in the dollar, a traditionally countercyclical currency, which has now been made more vulnerable to good global growth by extended long speculative positioning. However, before bailing on the greenback, we need to see if this period of respite for the world will prove durable. Bottom Line: Indications that the Sino-U.S. trade truce has staying power for now, coupled with signs from both financial market prices and from Sweden – one of the G-10’s most growth sensitive economies – are likely to prompt a dollar correction over the next month or two. Short-term traders are likely to be able to take advantage of this move. ...But Not For A Cyclical Top… Even the most ferocious dollar bull markets can be punctuated by periods of weakness. This was the case throughout the first half of the 1980s and the second half of the 1990s. There is no reason why this rally will prove different. Thus, a period of stabilization in global growth prompting a dollar correction should not come as a surprise. However, at this juncture, the global policy set up still favors remaining long the dollar and using any correction to build up bigger long-dollar bets. Today, our BCA central bank monitor continues to point to the need of tightening U.S. monetary policy. However, the same cannot be said about the rest of the G-10 in aggregate. We estimated the performance of G-10 currency pairs versus the dollar when, like today, the BCA central bank monitors showed a greater need for policy tightening in the U.S. than in the rest of the world. What we found was during the past 26 years, this kind of environment is associated with depreciations versus the U.S. dollar in the euro, the yen, the Australian dollar, the Canadian dollar, the Swiss franc and the Scandinavian currencies (Chart I-4). Interestingly, the GBP and the NZD seem to buck this trend. Chart I-4The Current Currency Setup Is Dollar Bullish
Fade The Green Shoots
Fade The Green Shoots
The EUR/USD pair is of particular interest, as it accounts for 58% of the DXY dollar index and is often the preferred vehicle for investors to bet on the dollar’s trend. Right now, in sharp contrast with the U.S., the euro area central bank monitor points to a need for easing policy in Europe (Chart I-5). Chart I-5Economic Conditions Warrant More Hikes In The U.S., But Not In Europe...
Economic Conditions Warrant More Hikes In The U.S., But Not In Europe...
Economic Conditions Warrant More Hikes In The U.S., But Not In Europe...
We expect our monitors to continue to point toward the need for tighter U.S. than European monetary policy. Today, European growth has decelerated, and the slowdown in euro area M1 money supply indicates that continental growth will slow further before finding a bottom (Chart I-6, top panel). The European Central Bank is not immune to growth risks. Chart I-6...And This Is Not About To Change
...And This Is Not About To Change
...And This Is Not About To Change
Meanwhile, the Federal Reserve is fixated on inflationary developments, especially those emanating from the labor market. While U.S. core PCE has disappointed, U.S. wages, as measured by average hourly earnings and the Atlanta Fed Wage Tracker, are all trending higher (Chart I-6, middle panel). Moreover, while there has been a concerning slowdown in the U.S. housing sector, mortgage applications are beginning to regain some vigor (Chart I-6, bottom panel). The Fed may thus pause in March, but we do not think it is done hiking for the remainder of 2019, as markets currently expect. As a result, we anticipate one-year-ahead policy differentials between the U.S. and the DXY-weighted G-10 central banks to widen, lifting the dollar in the process (Chart I-7). Therefore, any dollar correction should be short-lived. Investors with longer investment horizons than three months should ride the volatility and remain long the dollar. Chart I-7More Dollar Upside
More Dollar Upside
More Dollar Upside
Bottom Line: BCA’s Fed monitor is pointing to the need for further U.S. rate hikes. Meanwhile, outside the U.S., G-10 policy should remain easy. Historically, this set-up is associated with dollar strength. The dichotomy between slowing European growth and growing U.S. wages suggests expected policy differentials will remain negative for EUR/USD. Stay long the dollar. ...Especially As China Remains Challenged China is now such an important diver of the global industrial cycle that it could nullify any of the conclusions noted above. However, at this point, Chinese economic dynamics seem to reinforce the dollar-bullish outcome, not weaken it. Chinese policy rates have collapsed, and the People’s Bank of China has cut the Reserve Requirement Ratio to 14.5%, injecting RMB 750 billion into the interbank market. This apparent easing in policy lifted hopes that we would see a significant rebound in the credit number in November. However, as Chart I-8 illustrates, total social financing excluding equity issuance has not picked up and continues to crawl along at a 16-year low. Moreover, the shadow-banking sector remains weak. Chart I-8Despite Stimulus, Chinese Credit Is Still Slowing
Despite Stimulus, Chinese Credit Is Still Slowing
Despite Stimulus, Chinese Credit Is Still Slowing
Why is the Chinese economy not responding to what seems like an easing in liquidity conditions? First, it is far from clear that Beijing has abandoned its desire to limit the growth of indebtedness in China. As a result, bankers remain reluctant to open the lending taps aggressively. Second, Chinese borrowers themselves have curtailed their appetite for credit. After binging on easy credit, state-owned enterprises have misallocated vast amounts of capital and are now unable to generate sufficient returns on assets to cover their costs of borrowing (Chart I-9). Meanwhile, the private sector is also reluctant to borrow aggressively amid uncertainty regarding the Chinese growth outlook. Chart I-9Too Much Debt Leads To Misallocated Capital
Too Much Debt Leads To Misallocated Capital
Too Much Debt Leads To Misallocated Capital
The result is a sharp rise in the Chinese marginal propensity to save (MPS). We can approximate China’s MPS by looking at the growth of M2 money supply relative to M1. The difference between the two monetary aggregates are savings deposits. If M2 grows faster than M1, Chinese economic agents are parking their funds in savings deposits faster than they are adding to their checking accounts, despite low interest rates. This suggests a greater desire to save. This means it will take much more stimulus than what has so far been injected into the Chinese economy to put a floor under growth. Indeed, this proxy for China’s MPS has historically been a reliable leading indicator of Chinese economic activity, announcing turning points in the Li Keqiang index (Chart I-10, top panel). The rising MPS is currently signaling a further deceleration in Chinese import volumes growth (Chart I-10, second panel), which is reflected in a call for greater downside to global export growth (Chart I-10, third panel). Finally, China’s MPS also forewarns that global industrial activity, as measured by our nowcast, will slow more (Chart I-10, bottom panel). In aggregate, China’s rising marginal propensity to save clearly points toward further global growth weakness. Chart I-10China's Rising Marginal Propensity To Save Hurts Global Growth
China's Rising Marginal Propensity To Save Hurts Global Growth
China's Rising Marginal Propensity To Save Hurts Global Growth
As we have shown many times, slowing global growth is good for the dollar, as it has a more negative impact on economic activity outside the U.S. than inside.2 Additionally, when global growth decelerates in response to slowing Chinese economic activity, Chinese interest rates also normally fall relative to U.S. ones, as China is forced to ease policy vis-a-vis the U.S. This interest rate differential has already narrowed considerably. If the correlation of the past 12 years is any guide, this means the recent rebound in the CNY is to be faded, and that USD/CNY has significant upside in the upcoming six to nine months (Chart I-11). This is deflationary for the global economy. Chart I-11Chinese Rates Will Further Lag U.S. Ones, The Yuan Will Follow
Chinese Rates Will Further Lag U.S. Ones, The Yuan Will Follow
Chinese Rates Will Further Lag U.S. Ones, The Yuan Will Follow
The impact of falling Chinese interest rates relative to the U.S. is not limited to the USD/CNY. As Chart I-12 shows, when U.S. one-year rates rise relative to China, the DXY also strengthens. This is again because U.S. rates overtake Chinese rates in an environment where global growth is slowing. Today, U.S. 12-month rates are higher than Chinese rates, and the differential will widen as Chinese policymakers are forced to continue stimulating. Hence, any correction in the USD should prove transitory. Chart I-12When U.S. Rates Rise Relative To China, The DXY Appreciates
When U.S. Rates Rise Relative To China, The DXY Appreciates
When U.S. Rates Rise Relative To China, The DXY Appreciates
The impact of these dynamics is most evident in the currencies of the economies most exposed to the Chinese business cycle. As Chart I-13 shows, when Chinese 12-month interest rates fall relative to U.S. 12-month rates, EM FX and G-10 commodity currencies depreciate significantly. A further drop in the Sino-U.S. spread, a consequence of a high and rising MPS hurting Chinese growth, will lead to further weakness in EM FX, the AUD, the NZD, the CAD, and the NOK against the dollar. Thus, it seems any respite these currencies may currently enjoy will prove temporary. Chart I-13Falling Sino-U.S. Spreads Will Hurt EM FX And Commodity Currencies
Falling Sino-U.S. Spreads Will Hurt EM FX And Commodity Currencies
Falling Sino-U.S. Spreads Will Hurt EM FX And Commodity Currencies
Bottom Line: Despite injections of stimulus, China’s credit growth is not rising because the Chinese marginal propensity to save has risen significantly. It will take much more stimulus before credit growth rises anew. Thus, Chinese and global growth will not find a durable bottom for at least two more quarters. This implies that rate differentials between China and the U.S. will fall further, and hence USD/CNY and the DXY have more upside on a six- to nine-month basis, even if they weaken in the coming weeks. Meanwhile, EM FX and commodity currencies have a lot more downside in their future. ECB: The End Of An Era Yesterday, the ECB announced the well-anticipated end of its asset purchase program, but couched its discussion in rather hedged terms. The ECB focused on the importance of forward guidance and is open to adding to the TLTRO program if need be. The first rate hike being through the summer of 2019 is clearly conditional on economic circumstances. In this regard, the ECB downgraded its growth forecast for 2018 and 2019 to 1.9% from 2% and to 1.7% from 1.8%, respectively. The inflation forecast was revised up to 1.8% from 1.7% in 2018 and was revised down to 1.6% from 1.7% in 2019. Additionally, ECB President Mario Draghi highlighted that risks to the forecasts are balanced, but downside risk is growing. Not only do we agree that downside risk is growing, we also agree on the source of this risk: foreign growth and global protectionism. However, on this front, we are more pessimist than the ECB as we expect a greater deterioration in EM conditions and global trade. As a result, we think that risks are very significant that the ECB will find it difficult to implement a first rate hike in September 2019, yet markets are currently pricing in a 10 basis-point move that month. Hence, we expect that if our view on global growth is correct, the ECB will guide markets to price in the first hike later than September 2019, a process that will weigh on the euro, especially as investors already take a dim view on the capacity of the Fed to lift rates next year. Bottom Line: The ECB is ending its asset purchase program, but it remains committed to supporting growth in the euro area. The ECB is now heavily leaning on forward guidance, and any policy tightening is conditional on economic circumstances. BCA’s view on global growth suggests that it will be hard for the ECB to lift rates in September 2019. Short-Term Trade: Sell EUR/GBP This week’s political survival of Prime Minister Theresa May means that for another year, the hard Brexiters cannot challenge her for leadership of the Conservative Party. While it does not mean that the Brexit saga is over, it does mean that the probability of a Hard, No-Deal Brexit has fallen even further. As such, this implies that the politically driven rally in EUR/GBP since mid November is likely to reverse (Chart I-14). Chart I-14Tactical Trade: Sell EUR/GBP
Tactical Trade: Sell EUR/GBP
Tactical Trade: Sell EUR/GBP
Additionally, the outperformance of British wages relative to the euro area should also support the pound in the short term (Chart I-15). A lower risk of a crash Brexit together with an ECB displaying a somewhat dovish side should cause an upgrade by investors in the expected path of monetary policy in the U.K. relative to the euro area. Moreover, while the euro area current account surplus has rolled over, the U.K.’s is steadily improving, making the pound progressively less dependent on international flows. Chart I-15Relative Wages Favor BoE Hikes Versus ECB Hikes
Relative Wages Favor BoE Hikes Versus ECB Hikes
Relative Wages Favor BoE Hikes Versus ECB Hikes
As such, we are opening a tactical trade: selling EUR/GBP with a tight stop at 0.9100 and a target at 0.8700. Mathieu Savary, Vice President Foreign Exchange Strategy mathieu@bcaresearch.com Footnotes 1 Please see Foreign Exchange Strategy Weekly Report, titled “Waiting For A Real Deal”, dated December 7, 2018, available at fes.bcaresearch.com 2 Please see Foreign Exchange Strategy Weekly Report, titled “Appetite For Destruction? FX Investing For Slowing Global Growth And Inflation”, dated November 23, 2018, as well as the Foreign Exchange Strategy Weekly Report, titled “The Dollar And Risk Assets Are Beholden To China’s Stimulus”, dated August 3, 2018. Both are available at fes.bcaresearch.com Currencies U.S. Dollar Chart II-1USD Technicals 1
USD Technicals 1
USD Technicals 1
Chart II-2USD Technicals 2
USD Technicals 2
USD Technicals 2
Recent data in the U.S. has been mixed: Core inflation came in line with expectations at 2.2%. This measure also increased from last month’s reading. Meanwhile, the JOLTS job openings outperformed expectations, coming in at 7.079 million However, while nonfarm payrolls underperformed expectations, coming in at 155 thousand, U.S. average hourly earnings remains solid DXY has risen by 0.5% this past week. We continue to be bullish on the U.S. dollar. The current environment of falling global growth and inflation has historically been very positive for this currency. Moreover, the market has already priced out any Fed hikes beyond December. This means that the risk for U.S. rates vis-à-vis the rest of the world remains to the upside. Report Links: Waiting For A Real Deal - December 7, 2018 2019 Key Views: The Xs And The Currency Market - December 7, 2018 Six Questions From The Road - November 16, 2018 The Euro Chart II-3EUR Technicals 1
EUR Technicals 1
EUR Technicals 1
Chart II-4EUR Technicals 2
EUR Technicals 2
EUR Technicals 2
Recent data in the euro area has been mixed: Industrial production yearly growth surprised to the upside, coming in at 1.2%. However, the Sentix Investor Confidence index surprised negatively, coming in at -0.3. Finally, Gross domestic product yearly growth underperformed expectations coming in at 1.6%. EUR/USD has been flat this week. Yesterday, the ECB downgraded its 2018 and 2019 growth forecasts. Moreover ECB president Mario Draghi hinted at increasing caution, as he remarked that downside risks where growing. We believe that EUR/USD has further downside, towards the 1.08-1.05 range, as the ECB will be unable to tighten monetary policy in the current environment of slowing global growth. Report Links: 2019 Key Views: The Xs And The Currency Market - December 7, 2018 Six Questions From The Road - November 16, 2018 Evaluating The ECB’s Options In December - November 6, 2018 The Yen Chart II-5JPY Technicals 1
JPY Technicals 1
JPY Technicals 1
Chart II-6JPY Technicals 2
JPY Technicals 2
JPY Technicals 2
Recent data in Japan has been negative: Machinery orders yearly growth underperformed expectations, coming in at 4.5%. Moreover, the final revisions to GDP annualized growth also surprised downside, coming in at -2.5%. Finally, the leading economic index also surprised negatively, coming in at 100.5. USD/JPY has risen by 0.8% this week. We are positive on the yen for the first quarter of 2019, especially on its crosses. The current risk off environment should be positive for safe havens like the yen. We are particularly negative on EUR/JPY, as this cross is very well correlated with bond yields, which have possess short-term downside. Report Links: 2019 Key Views: The Xs And The Currency Market - December 7, 2018 Updating Our Intermediate Timing Models - November 2, 2018 Will Rising Wages Cause An Imminent Change In Policy Direction In Europe And Japan? - October 5, 2018 British Pound Chart II-7GBP Technicals 1
GBP Technicals 1
GBP Technicals 1
Chart II-8GBP Technicals 2
GBP Technicals 2
GBP Technicals 2
Recent data in the U.K. has been mixed: Industrial production yearly growth underperformed expectations, coming in at -0.8%. Moreover, the claimant count change also surprised negatively, coming in at 21.9 thousand. However, average hourly earnings excluding and including bonus both outperformed expectations, coming in at 3.3%. GBP/USD has fallen by 1.2% this week on political risks. However, on Wednesday PM Theresa May survived a vote of no confidence that would have removed her from the leadership of the tory party. With this win, Prime Minister May is now protected from intra-party challenges for at least a year, strengthening her ability to fend-off demands by hard-brexiters. This event has created a tactical opportunity to sell EUR/GBP. Report Links: Six Questions From The Road - November 16, 2018 Updating Our Intermediate Timing Models - November 2, 2018 Clashing Forces: The Fed And EM Financial Conditions - October 19, 2018 Australian Dollar Chart II-9AUD Technicals 1
AUD Technicals 1
AUD Technicals 1
Chart II-10AUD Technicals 2
AUD Technicals 2
AUD Technicals 2
Recent data in Australia has been positive: The house price index yearly growth came in line with expectations, declining by -1.5%. Moreover, home loans growth outperformed expectations, coming in at 2.2%. AUD/USD has been flat this week. We believe that the AUD is the currency with the most potential downside in the G10. After all, Australia is the G-10 economy most leveraged to the Chinese industrial cycle, due to Australia’s high reliance on industrial metal and coal exports. This means that the continued tightening by Chinese authorities should be most toxic for this currency. Report Links: Waiting For A Real Deal - December 7, 2018 Updating Our Intermediate Timing Models - November 2, 2018 Policy Divergences Are Still The Name Of The Game - August 14, 2018 New Zealand Dollar Chart II-11NZD Technicals 1
NZD Technicals 1
NZD Technicals 1
Chart II-12NZD Technicals 2
NZD Technicals 2
NZD Technicals 2
NZD/USD has fallen by 0.5% this week. After being bullish in the NZD for a couple of months, we have recently turned bearish, as this currency is very likely to suffer in the current environment of declining inflation and global growth. said that being said, we remain bullish on the NZD relative to the AUD, given that the kiwi economy is less exposed to the Chinese industrial cycle than Australia’s. Report Links: Updating Our Intermediate Timing Models - November 2, 2018 Clashing Forces: The Fed And EM Financial Conditions - October 19, 2018 In Fall, Leaves Turn Red, The Dollar Turns Green - October 12, 2018 Canadian Dollar Chart II-13CAD Technicals 1
CAD Technicals 1
CAD Technicals 1
Chart II-14CAD Technicals 2
CAD Technicals 2
CAD Technicals 2
Recent data in Canada has been positive: Net change in employment surprised positively, coming in at 94.1 thousand. Moreover, the unemployment rate also surprised positively, coming in at 5.6%. Finally, housing starts growth also surprised to the upside, coming in at 216 thousand. After falling by nearly 1%, USD/CAD finished the week flat. While we are bearish on the Canadian dollar relative to the U.S. dollar, we are more positive on the CAD against the AUD. Renewed tightening in oil supply should serve as a support for global oil producers. Meanwhile, Chinese deleveraging will continue, hurting base metals in the process. This will cause oil to outperform base metals, which means that the CAD should have upside against currencies like the AUD. Finally, domestic economic conditions favor BoC hikes versus RBA hike, even after the recent pause flagged by the BoC. Report Links: Updating Our Intermediate Timing Models - November 2, 2018 Clashing Forces: The Fed And EM Financial Conditions - October 19, 2018 Updating Our Long-Term FX Fair Value Models - June 22, 2018 Swiss Franc Chart II-15CHF Technicals 1
CHF Technicals 1
CHF Technicals 1
Chart II-16CHF Technicals 2
CHF Technicals 2
CHF Technicals 2
EUR/CHF has been flat this week. Our bullish view on EUR/CHF is a high conviction view for the first part of 2019. This is because the recent strength in the franc is choking out any inflationary pressures in the Swiss economy. Thus, we are reaching the threshold at which the SNB is very likely to intervene in the currency market to prevent the franc’s strength from derailing the path toward the inflation target. In fact, the SNB even acknowledged this reality this week by downgrading its inflation outlook. Report Links: Waiting For A Real Deal - December 7, 2018 Updating Our Intermediate Timing Models - November 2, 2018 Updating Our Long-Term FX Fair Value Models - June 22, 2018 Norwegian Krone Chart II-17NOK Technicals 1
NOK Technicals 1
NOK Technicals 1
Chart II-18NOK Technicals 2
NOK Technicals 2
NOK Technicals 2
USD/NOK has risen by 0.7% this week. While we maintain a bearish stance toward the krone versus the U.S. dollar, we are short AUD/NOK, as a way to take advantage of stabilizing oil prices and a continued growth slowdown in China. Moreover, AUD/NOK is expensive in PPP terms, and is technically overbought. Finally, this currency is one of the most mean-reverting within the G10, which means that the recent surge in this cross is likely to reverse. Report Links: Waiting For A Real Deal - December 7, 2018 Updating Our Intermediate Timing Models - November 2, 2018 Clashing Forces: The Fed And EM Financial Conditions - October 19, 2018 Swedish Krona Chart II-19SEK Technicals 1
SEK Technicals 1
SEK Technicals 1
Chart II-20SEK Technicals 2
SEK Technicals 2
SEK Technicals 2
USD/SEK has risen by 0.9% this week. On a short-term basis, we are negative on the krona, given that this currency is very sensitive to global growth dynamics, which means that the continued tightening by both Chinese authorities and the Fed will create a headwind for any SEK rally. That being said, on a longer-term basis we are more positive on the krona, as the Riksbank has a lot of room to lift rates as the Swedish economy is increasingly displaying large internal imbalances that need to be addressed. Report Links: Updating Our Intermediate Timing Models - November 2, 2018 Updating Our Long-Term FX Fair Value Models - June 22, 2018 Updating Our Intermediate Timing Models - May 18, 2018 Trades & Forecasts Forecast Summary Core Portfolio Tactical Trades Closed Trades
… quick’s the word and sharp’s the action. Jack Aubrey1 Idiosyncratic supply-demand adjustments – some induced by head-spinning reversals of policy (e.g., the U.S. about-face on Iran oil export sanctions) – and uncertainty regarding monetary policy and trade will keep volatility in oil, metals and grains elevated in 2019. We remain overweight energy – particularly oil – expecting OPEC 2.0 to maintain production discipline, and for demand to remain resilient.2 We remain neutral base metals and precious metals, seeing the former relatively balanced, and the latter somewhat buoyant, even as the Fed continues its rates-normalization policy. We remain underweight ags, although weather-induced supply stress has reduced the global inventories some. While we continue to favor being long the energy-heavy S&P GSCI on a strategic basis, tactical positioning will continue to dominate commodity investing in 2019. Highlights Energy: Overweight. OPEC 2.0’s 1.2mm b/d of production cuts goes into effect in January vs. October levels, and should allow inventories to resume drawing. Base Metals: Neutral. Fundamentally, base metals are largely balanced, which is keeping us neutral going into 2019. Precious Metals: Neutral. Gold prices will remain sensitive to Fed policy and policy expectations. Palladium prices have soared as a growing physical deficit noted earlier widens.3 If China cuts sales taxes on autos again, demand could soar. Ags/Softs: Underweight. A strong USD will weigh on ag markets, particularly grains, next year. An agreement on contentious Sino – U.S. trade issues could re-open Chinese markets to U.S. exports. However, the arrest of the CFO of China’s Huawei Technologies in Canada for possible extradition to the U.S. complicates negotiations. Feature Going into 2019, commodity markets once again are sending conflicting signals. While we continue to favor exposure to commodities as an asset class by being long the energy-heavy S&P GSCI index, which fell 6% this year on the back of the collapse in crude oil prices and flattening of the forward curves in Brent and WTI. Nonetheless, we believe investors will continue to be rewarded by taking tactical exposure on an opportunistic basis. Volatility remains the watchword, particularly in 1H19, for the primary industrial commodities – oil and base metals. While idiosyncratic supply-demand adjustments will drive prices in each market, Fed policy also will contribute to volatility, as the U.S. central bank likely remains the only systemically important monetary authority following through on rates-normalization. In line with our House view, we expect the Fed to deliver its fourth rate hike of 2018 at its December meeting next week, and four additional hikes next year. On the back of Fed policy, we expect the broad trade-weighted USD to rise another 3-5% in 2019, following a 6% increase in 2018 (Chart of the Week). This will supress demand ex-U.S. for commodities priced in USD, by raising the USD cost of these commodities. Chart of the WeekStronger USD Pressures Commodity Demand
Stronger USD Pressures Commodity Demand
Stronger USD Pressures Commodity Demand
Below, we highlight the key themes we believe will dominate commodities in 2019. Oil Markets Still Re-Calibrating Fundamentals We continue to expect global oil demand to remain strong next year, despite the slight downgrading of global GDP growth earlier this year by the IMF. We expect EM import volumes – one of the key variables we track to proxy EM income levels – to hold up in 1H19, which supports our assessment commodity demand will grow, albeit at a slower rate than this year (Chart 2).4 Chart 2Slowing Trade Volumes Might Pre-sage Softer Commodity Demand
Slowing Trade Volumes Might Pre-sage Softer Commodity Demand
Slowing Trade Volumes Might Pre-sage Softer Commodity Demand
In 2H19, we see the volume of EM imports dipping y/y from higher levels, then recovering toward year-end. This indicates the all-important level of EM income – hence commodity demand – will remain resilient, but the rate of growth in incomes will slow. This is confirmed by the behavior of the Global Leading Economic Indicators we use to cross check our EM income expectation via import volumes (Chart 3). Chart 3Global Leading Economic Indicators Lead EM Import Volume Changes
Global Leading Economic Indicators Lead EM Import Volume Changes
Global Leading Economic Indicators Lead EM Import Volume Changes
There is a chance Sino – U.S. trade relations will thaw, which would remove a large uncertainty over the evolution of demand next year. This would be supportive for EM trade volumes generally, particularly imports. However, this is not a given, and we are not assuming any pick-up in demand in anticipation of such a development. We need to see concrete actions, followed by tangible trade improvement first. On the supply side, oil markets still are in the process of re-adjusting to an extraordinary policy reversal by the Trump administration on its Iranian oil-export sanctions last month – i.e., the last-minute granting of waivers to Iran’s largest oil importers. However, following OPEC 2.0’s decision last week to cut 1.2mm b/d of production to re-balance markets in 1H19, we continue to expect prices to recover. Indeed, going into the OPEC 2.0 meeting last week, we had already lowered our December 2018 production estimates for OPEC 2.0, and also reduced 2019 output estimates by ~ 1mm b/d, so the producer coalition’s action did not come as a surprise (Chart 4).5 Chart 4BCA's Global Oil Balances Anticipated OPEC 2.0 Cuts
BCA's Global Oil Balances Anticipated OPEC 2.0 Cuts
BCA's Global Oil Balances Anticipated OPEC 2.0 Cuts
In addition to the cuts by OPEC 2.0, the Alberta, Canada, government mandated production cuts, which will become effective January 1, 2019, to clear a persistent supply overhang that was decimating producers’ revenues in the province. We estimate there is ~ 200k b/d of trapped Alberta supply – i.e., excess production over takeaway capacity (pipeline and rail) – along with ~ 35mm bbls of accumulated excess production in storage the government intends to draw over the course of 2019 at a rate of ~ 96k b/d. This will lower overall OECD inventories, even if the Canadian barrels are transferred south. Net, in addition to the 1.2mm b/d of cuts from OPEC 2.0, the ~ 300k b/d coming from Canada next year will mean close to 1.5 mm b/d of production, or ~1.4mm b/d of actual supply when accounting for the inventory release, is being cut or curtailed from these two sources. We cannot, at this point, forecast over-compliance with the OPEC 2.0 accord, which was one of the signal features of the deal in 2017 and 1H18. The Trump administration’s waivers for Iran’s eight largest oil importers expire May 2019. We view it as highly unlikely the Trump administration will re-impose export sanctions in full on Iranian exports following the expiration of waivers, and fully expect they will be extended at least for 90 days. This is because oil fundamentals will remain tight next year, despite the massive de-bottlenecking of the Permian Basin in West Texas. While an additional 2mm b/d of new takeaway capacity will be added to the region, it will not be fully operational until 4Q19. We have ~ 300k b/d of additional supply coming out of the Permian after the pipeline expansions are done in 2H19. Even as pipeline capacity is filled, the U.S. still needs to significantly increase its deep-water oil-export capacity to get this crude to market.6 Bottom Line: We expect the oil market to re-balance in 1H19, as production falls by ~ 1.4mm b/d – the combination of OPEC 2.0 and Canadian production cuts – and consumption grows by a similar amount. The USD will continue to appreciate next year, which, at the margin, will temper demand growth and prices. Gold: Remaining Long Equity And Inflation Risks Trump Higher Rates in 2019 As the U.S. economic cycle matures and advances into its final innings, we continue to recommend holding gold in a diversified portfolio. U.S. inflationary pressure will surprise to the upside in 2019, per our House view, which will offset the effects of somewhat less accommodative U.S. monetary policy in the U.S. The October equity correction is a reminder that, when rising UST yields drag stocks down in late-cycle markets, gold works as an effective hedge against equity risks, and can outperform bonds. In fact, both of the corrections we saw in 2018 likely were caused by a sharp increase in bond yields. This convexity on the upside and downside is what makes gold our preferred portfolio hedge. Easy Monetary Policy + Rising Rate = Bullish Gold Prices Despite being negatively correlated with interest rates, gold tends to perform well when the fed funds rate is below r-star – known as the “natural rate of interest” – and is rising (Chart 5, panel 1).7 When this happens, policy rates are below the so-called natural interest rate consistent with a fully employed economy, which, all else equal, is inflationary. In these late-cycle environments, gold’s ability to hedge against inflation and equity risks dominate its price formation, while its correlation with U.S. real rates diminishes. Chart 5Gold Will Stay in Trading Range
Gold Will Stay in Trading Range
Gold Will Stay in Trading Range
In our view, gold will remain in an upward trading range until rates become restrictive enough to depress the inflation outlook (Chart 5, panel 2). Our U.S. strategists estimate the equilibrium fed funds rate is at ~ 3%, and project it will rise to ~ 3⅜% by end-2019. Therefore, despite our House view of four rate hikes next year, we expect the U.S. economy to remain in a below-r-star-and-rising phase for most of the year. Consistent with our House view, we believe U.S. inflation is likely to surprise to the upside next year, which will push gold prices higher (Chart 6, panel 1). The U.S. economy remains strong, particularly on the employment front. This means wage growth will work its way through inflation rates. Chart 6U.S. Inflation Likely to Surprise
U.S. Inflation Likely to Surprise
U.S. Inflation Likely to Surprise
Admittedly, this is not the consensus view. Investors are not worried about significantly higher inflation (Chart 6, panel 2). However, our Bond strategists argue that long-maturity TIPS breakeven inflation is stuck below historical levels because of this abnormally low fear of elevated inflation (i.e. > 2.5%). Once inflation starts drifting higher, there will be an upward shift in investors’ inflation expectations. Any short-term dip in inflation on the back of lower oil prices will be transitory, given our view that oil prices will recover next year. If such a transitory dip, or concerns about a global growth slowdown spilling back into the U.S. causes the Fed to pause, we would add to our precious metal view position, given our assessment that this would raise the probability of an inflation overshoot. Lastly, gold prices recently have been depressed by an abnormally high correlation with the U.S. dollar (Table 1). We put this down to speculative positioning: Net speculative positions are stretched for both the U.S. dollar and gold, Table 1Gold Vs. USD Correlations Running Higher Than Normal
2019 Key Views: Policy-Induced Volatility Will Drive Markets
2019 Key Views: Policy-Induced Volatility Will Drive Markets
therefore, any change in expectations likely will be amplified by a reversal in positioning (Chart 7). In the medium-term, we expect the gold-dollar correlation to converge back to its average, which would mute the dollar’s impact on gold. This would, all else equal, raise inflation and equity risks factors. Chart 7Spec Positioning Stretched
Spec Positioning Stretched
Spec Positioning Stretched
Bottom Line: We continue to recommend gold as a portfolio hedge for investors, given its convexity – it outperforms during equity downturns, and participates on the upside (albeit not as much). Given our out-of-consensus House view for inflation, we believe gold also will provide a hedge against this risk. Palladium: China Tax Policy Could Lift Price Palladium soared to dizzying heights this year, on the back of an expanding physical deficit (Chart 8). Were it not for the loss of an automobile-tax break in China, which reduced the rate of growth in sales there to unchanged y/y, this deficit likely would have been considerably wider, inventories would have drawn even harder, and palladium prices would have been higher (Chart 9). Chart 8Palladium's Physical Deficit Expanding
Palladium's Physical Deficit Expanding
Palladium's Physical Deficit Expanding
Chart 9Palladium Inventories Collapse
Palladium Inventories Collapse
Palladium Inventories Collapse
Palladium’s demand is mainly driven by its use in catalytic converters for gasoline-powered cars, which dominate sales in the U.S. and China, the world’s two largest car markets (Chart 10). U.S. sales growth has leveled off this year (Chart 11), as has China’s. However, the China Automobile Dealers Association (CADA) is pressing policymakers to reduce the 10% auto sales tax by half, which could keep palladium demand elevated relative to supply, should it happen.8 Chart 10Auto Catalyst Demand Dominates Palladium
2019 Key Views: Policy-Induced Volatility Will Drive Markets
2019 Key Views: Policy-Induced Volatility Will Drive Markets
Chart 11China Car Sales Could Revive With Tax Cut
China Car Sales Could Revive With Tax Cut
China Car Sales Could Revive With Tax Cut
Russian producers, led by Norilsk Nickel, supply ~ 40% of the world’s palladium. Markets have been fearful U.S. sanctions could be imposed on Norilsk and other Russian producers throughout the year by the U.S., most recently in re Russia’s seizure of Ukrainian naval vessels in international waters, and over Russia’s response to the threatened withdraw from the Intermediate-Range Nuclear Forces (INF) Treaty by the U.S., which could be keeping a risk premium firmly embedded in palladium prices.9 With platinum trading below $800/oz, or ~ 65% of palladium’s value, autocatalyst makers could begin to switch out their catalysts (Chart 12). Chart 12Platinum Could Fill Palladium Supply Gap
Platinum Could Fill Palladium Supply Gap
Platinum Could Fill Palladium Supply Gap
Base Metals: Trade Tensions, USD Cloud Outlook Base metals remain inextricably bound up with EM income growth. When EM incomes are growing, commodity demand – particularly for base metals – is growing, and vice versa. This typically shows up in EM GDP and import volume levels, which we use as explanatory variables in our base-metals price modeling (Chart 13). Chart 13Base Metals Demand Tied To EM Income, Trade Volumes
Base Metals Demand Tied To EM Income, Trade Volumes
Base Metals Demand Tied To EM Income, Trade Volumes
There are, in our view, two significant risks to EM income growth over the short and medium terms: Sino – U.S. trade disputes, which erupted earlier this year. They carry the risk of spreading globally and unwinding supply chains that have taken decades to develop between DM and EM economies;10 Fed monetary policy, which is immediately reflected in USD levels. A strong dollar raises the local-currency costs of commodities for consumers ex-U.S., and debt-servicing costs in EM economies. In addition, it lowers the local-currency costs of producing commodities ex-U.S., which incentivizes producers to raise production to capture this arbitrage, since they are paid in USD. The trade-war risk remains, despite the agreement between presidents Trump and Xi at the G20 in Buenos Aires to work on a trade deal. Even so, the actual level of tariffs imposed by both sides is trivial relative to the level of global trade, which is in excess of $20 trillion p.a. – ~$17 trillion for goods, $5 trillion for services, according to the WTO (Chart 14). Chart 14Sino – U.S. Tariffs Remain Trivial Relative to Overall Global Trade
2019 Key Views: Policy-Induced Volatility Will Drive Markets
2019 Key Views: Policy-Induced Volatility Will Drive Markets
Fed policy, on the other hand, is a threat of far greater moment to EM income growth, and, through this, import volumes, which we use to proxy that growth. The LMEX index, a gauge of base-metals prices traded on the LME, is extremely sensitive to changes in EM import volumes. This is not unexpected, given the income elasticity of trade for EM economies is greater than 1.0. Our modeling finds a 1% increase in EM import volumes translates to a 1.3% increase in the LMEX, which is consistent with the World Bank’s estimate of EM income elasticity of trade.11 Per our House view, we believe markets are too sanguine regarding the possibility of a Sino – U.S. trade deal. Such an event, should it occur, would immediately affect base metals markets, as China accounts for roughly half of base metals demand globally(Chart 15). Market participants’ default setting appears to be the U.S. and China will resolve their trade differences in short order – i.e., by the March 1, 2019, deadline agreed at the G20 meeting – resulting in a win-win for both countries and the world. We are hopeful this view is correct, but we would not take any positions in base metals in expectation of such an outcome. Instead, we think the substantive technological and strategic differences between the two countries, and underlying distrust, will result in a renewed escalation of tensions. Chart 15China Demand Remains Pivotal Base Metals Demand Could Wobble
China Demand Remains Pivotal Base Metals Demand Could Wobble
China Demand Remains Pivotal Base Metals Demand Could Wobble
Bottom Line: We remain neutral base metals going into 2019. Fundamentally, most of the metals in the LME index are in balance, or can get there in short order. The Fed’s rates-normalization policy continues to represent a larger short-term risk to EM income growth than Sino – U.S. trade tensions, but, longer term, we continue to expect tension between the world’s dominant economies to escalate. Ags: Trade Tensions, USD Cloud Outlook That’s not a typo in the sub-head above; ags – particularly soybeans – are dealing with the same headwinds bedeviling base metals. The agreement to work on a trade agreement reached at the G20 summit between the U.S. and China lifted grain markets, and supported the upward trend in grain and bean prices. All the same, Sino – U.S. trade relations are prone to go off the rails at any time. The Buenos Aries understanding, after all, only holds for 90 days. In addition to the hoped-for agreement to resolve trade-war issues, grain prices received support from the signing of the United States-Mexico-Canada Agreement (USMCA). This helped align supply-demand fundamentals globally with prices. Focusing too much on China can obscure the fact that the USMCA, which replaces the North American Free Trade Agreement (NAFTA), eliminated major uncertainties over the fate of U.S. grain exports to Mexico, the second-largest destination for U.S grains, beans and cotton. In fact, Mexico accounts for 13% of all U.S. ag exports (Chart 16).12 Chart 16Trade Negotiations Hit American Farmers Hard
2019 Key Views: Policy-Induced Volatility Will Drive Markets
2019 Key Views: Policy-Induced Volatility Will Drive Markets
All the same, the Sino – U.S. trade war is hitting U.S. ags hard, particularly soybeans. The 25% tariff on China’s imports of U.S. grains created two parallel agriculture markets. In one market, China is scrambling to secure supplies, creating a deficit. In the other, U.S. farmers are struggling to market their produce overseas, suffering from storage shortages and in some cases left with no option but to leave their crops to rot. Close to 60% of U.S. bean exports historically went to China. The U.S. – China trade war caused a soybean shortage in Brazil, as demand from China for its crops soared, while a record 11% of American beans are projected to be left over after accounting for exports and domestic consumption (Chart 17). Chart 17Bean Shortage in Brazil, Supply Glut in the U.S.
Bean Shortage in Brazil, Supply Glut in the U.S.
Bean Shortage in Brazil, Supply Glut in the U.S.
A successful resolution to the U.S. – China trade tensions is unlikely to reverse the over-supply of beans globally (Chart 18). In fact, we expect beans stocks-to-use (STU) ratios to build next year, unlike global corn and wheat stocks (Chart 19). This will set a record for the soybean STU ratios, pushing them above 30%. Chart 18Expect Another Bean Surplus
Expect Another Bean Surplus
Expect Another Bean Surplus
Chart 19Bean STU Ratios Will Grow
Bean STU Ratios Will Grow
Bean STU Ratios Will Grow
As is the case for metals, the USD will weigh on ag markets, which will make U.S. exports more expensive than their foreign competition (Chart 20). As is the case for all of the commodities we cover, a strong dollar will weigh on prices at the margin. Chart 20A Strong USD Will Make U.S. Exports Expensive
A Strong USD Will Make U.S. Exports Expensive
A Strong USD Will Make U.S. Exports Expensive
Bottom Line: A thaw in the Sino – U.S. trade war should realign global grain markets, but will not keep soybeans from setting new global inventory records. A strong USD will be a headwind for ag markets, as it is for other commodity markets we cover. Robert P. Ryan, Senior Vice President Commodity & Energy Strategy rryan@bcaresearch.com Hugo Bélanger, Senior Analyst Commodity & Energy Strategy HugoB@bcaresearch.com Footnotes 1 This is a fictional character in the movie Master and Commander, based on the novels of Patrick O’Brian. 2 OPEC 2.0 is the name we coined for the OPEC/non-OPEC coalition led by the Kingdom of Saudi Arabia (KSA) and Russia. It was formed in November 2016 to manage oil production. 3 Please see “Silver, Platinum At Risk As Fed Tightens; Palladium Less So,” published by BCA Research’s Commodity & Energy Strategy February 15, 2018. It is available at ces.bcaresearch.com. 4 Please see “The Role of Major Emerging Markets in Global Commodity Demand,” published as a Special Focus in the IMF’s Global Economic Prospects in June 2018 for a discussion of income elasticities for oil, base metals and other commodities in large EM economies. 5 In our current forecast for 2019, we expect Brent to average $82/bbl next year, and for WTI to trade $6/bbl below that. Please see “All Fall Down: Vertigo In the Oil Market … Lowering 2019 Brent Forecast to $82/bbl,” published by BCA Research’s Commodity & Energy Strategy November 15, 2018. We will be updating our supply-demand balances and price forecast next week. 6 At 11.7mm b/d and growing, the U.S. is the largest crude oil producer in the world, having recently eclipsed Russia’s total crude and liquids production of 11.4mm b/d, and the U.S. EIA’s projected 2019 output of 11.6mm b/d. U.S. crude oil exports hit 3.2mm b/d for the week ended November 30, 2018, an all-time high, according to EIA data. It is worthwhile recalling crude oil exports were illegal until December 2015. U.S. product exports totalled 5.8mm b/d for the week ended November 30, and 6.3mm b/d the week before that. Total U.S. crude and product exports are running ~ 9mm b/d at present, which placed them just above total imports of crude and products – i.e., the U.S. became a net exporter of crude and products at the end of November. 7 The San Francisco Fed defines r-star as the inflation-adjusted “natural” rate of interest consistent with a fully employed economy, with inflation close to the Fed’s target. r-star is used to guide interest-rate policy consistent with long-term macro goals set by the Fed. Please see “R-star, Uncertainty, and Monetary Policy,” by Kevin J. Lansing, published in the FRBSF Economic Letter May 30, 2017. 8 Please see “Exclusive: Reverse gear - China car dealers push for tax cut as auto growth stalls,” published by reuters.com October 11, 2018. 9 Please see “Is Norilsk Nickel too big to sanction?” published by ft.com on April 19, 2018, and “U.S. to Tell Russia It Is Leaving Landmark I.N.F. Treaty,” published by nytimes.com October 19, 2018. 10 We discuss this in “Escalating Trade Disputes Pressuring Base Metals,” published July 12, 2018, in BCA Research’s Commodity & Energy Strategy. It is available at ces.bcaresearch.com. 11 For a discussion of the World Bank’s trade elasticities, please see “Trade Wars, China Credit Policy Will Roil Global Copper Markets” published by BCA Research’s Commodity & Energy Strategy June 21, 2018. It is available at ces.bcaresearch.com. 12 Canada makes up a smaller share of U.S. exports, at ~ 2%. Investment Views and Themes Recommendations Strategic Recommendations Commodity Prices and Plays Reference Table Trade Recommendation Performance In 3Q18
2019 Key Views: Policy-Induced Volatility Will Drive Markets
2019 Key Views: Policy-Induced Volatility Will Drive Markets
Trades Closed in 2018 Summary of Trades Closed in 2017
2019 Key Views: Policy-Induced Volatility Will Drive Markets
2019 Key Views: Policy-Induced Volatility Will Drive Markets
Highlights Late-cycle pressures will keep pushing bond yields higher. Global growth will remain above trend in 2019, keeping unemployment rates low and preventing central banks from turning dovish. The unwind of crisis-era global monetary policies will continue. Slowing central bank asset purchases will worsen the supply/demand balance for government bonds, resulting in gentle upward pressure on yields via higher term premia. It is too early to worry about inverted yield curves. The time to be concerned about the recessionary implications of an inverted U.S. Treasury curve will come after the Fed has lifted real interest rates to above neutral (R*), which should occur in the latter half of 2019. Expect poor corporate bond returns from an aging credit cycle. While default risk is likely to stay benign through 2019, the greater risk for corporates could come from concerns over future credit downgrades, as well as diminished inflows in a “post-QE” world. Feature BCA’s annual Outlook report, outlining the main investment themes that will drive global asset markets in 2019, was sent to all clients in late November.1 In this Weekly Report, we discuss the four broad implications of those themes for global fixed income. In a follow-up report to be published next week, we will translate those themes into strategic investment recommendations and allocations within our model bond portfolio framework. Key View #1: Late-Cycle Inflation Pressures Will Keep Pushing Bond Yield Higher The main theme from last year’s BCA Outlook was that markets and policy would collide in 2018. This year’s Outlook concluded that those same frictions would persist in 2019, and for similar reasons. The global economy is likely to see another year of above trend growth, after the current deceleration phase bottoms out in the first half of the year. Tight labor markets will continue to force developed market central banks, who still strongly believe in the Phillips Curve relationship as the best way to forecast inflation, to move toward less dovish monetary policies, putting steady upward pressure on global bond yields. Our own Central Bank Monitors signal a need for tighter monetary policy (Chart of the Week), most notably in the U.S. That may sound strange given the recent softening of global growth momentum and plunge in oil prices. Yet economic survey data (like the global ZEW index) show a huge divergence between actual and expected growth, with real bond yields responding more to the former than the latter (Chart 2). Chart of the WeekStill A Bearish Bond Backdrop
Still A Bearish Bond Backdrop
Still A Bearish Bond Backdrop
Chart 2Global Yields Will Remain Resilient In 2019
Global Yields Will Remain Resilient In 2019
Global Yields Will Remain Resilient In 2019
The fear of a global economic downturn appears greater than the current reality - a trend likely magnified by the ongoing U.S.-China trade tensions and the sharp fall in oil prices which some are interpreting to be a sign of weaker demand. BCA’s commodity strategists view the oil decline as purely supply driven, and expect that a tighter demand/supply balance will result in oil prices recovering recent losses and rising smartly in 2019. This should lead to a rebound in the inflation expectations component of global bond yields later next year (bottom panel). As was argued in the 2019 BCA Outlook, the conditions for a deep pullback in global growth are not yet in place, especially in the U.S. where consumer fundamentals remain solid (strong income growth, booming net worth and a low debt service ratio). China, where growth is currently slowing, remains the biggest wild card for the world economy, especially given the degree to which emerging market economies are levered to Chinese growth. Yet the most likely outcome is that Chinese authorities will make enough policy adjustments to stabilize the economy in the first half of 2019, which will help put a floor under global growth. With over 80% of OECD economies now with an unemployment rate below estimates of “full employment”, the backdrop today is more conducive to sustained higher inflation than at any point since the 2008 Global Financial Crisis (Chart 3). This means that actual inflation readings are likely to be stickier to the upside, especially for domestically focused measures like wages and services which are accelerating in many countries. Chart 3Tight Labor Markets Will Prevent A Sharp Drop In Inflation
Tight Labor Markets Will Prevent A Sharp Drop In Inflation
Tight Labor Markets Will Prevent A Sharp Drop In Inflation
From the point of view of global central bankers, this means that as long as global growth does not slow sustainably below trend, then unemployment rates are unlikely to begin to rise. For policymakers who slavishly follow the Phillips Curve when forecasting inflation, that will make it difficult to shift to a more dovish policy bias, even if inflation remains below target for a time thanks to the recent pullback in oil prices (Chart 4). Chart 4Central Banks Who Believe In The Phillips Curve Can’t Turn Dovish
2019 Key Views: Normalization Is The "New Normal"
2019 Key Views: Normalization Is The "New Normal"
The degree of policy bias in 2019 will not be uniform, though, which was also the case in 2018. Central banks in countries with core inflation rates closer to policymaker targets (the U.S., Canada, the U.K. if the Brexit uncertainty fades, Sweden) will be more likely to raise rates than those where inflation is still well below target (Japan, the euro area, Australia). Relative government bond market performance over the course of 2019 should reflect those trends. U.S. Treasury yields will still most likely to see the largest increase from current levels as the Fed will lift rates over the full 2019 calendar by more than markets are currently discounting (only 33bps are currently priced in the U.S. Overnight Index Swap curve – a low hurdle to beat). Key View #2: The Unwind Of Crisis-Era Global Monetary Policies Will Continue Quantitative easing (QE) – central banks buying huge amounts of bonds to help keep yields low enough to sustain economic growth amid weak inflation expectations – has been a dominant feature of global bond markets since the 2009 recession. Policymakers have been forced to engage in such unusual activities to try and boost weak inflation expectations even after policy interest rates have been cut to 0% (and even lower in some cases). Now, a decade later, inflation expectations are more stable and much closer to central bank targets in most countries (except, as always, Japan). That means government bond returns are no longer negatively correlated to equity returns (Chart 5), reducing the value of bonds as a hedge to stocks. Chart 5Bonds Are A Less-Effective Hedge For Equities With More Stable Inflation
Bonds Are A Less-Effective Hedge For Equities With More Stable Inflation
Bonds Are A Less-Effective Hedge For Equities With More Stable Inflation
In the 2019 BCA Outlook, several other reasons were given as to why that correlation has been weakening, including a shift towards more consumption and less savings from aging populations entering their retirement years. The biggest change, however, has been the move from QE to “QT” (quantitative tightening) as central banks buy fewer bonds or, in the case of the U.S. Fed, actually letting bonds run of its massive balance sheet. The new year will bring an end to the net new buying phase of the European Central Bank (ECB) Asset Purchase Program. That represents a loss of €180 billion of liquidity into European bond markets compared to 2018 (twelve months at €15bn per month), both for government debt and investment grade corporates which are also part of the ECB’s program. This will come on top of reduced purchases from the Bank of Japan (BoJ), who will likely buy at a reduced ¥30 trillion pace in 2019 (down from around ¥40 trillion in 2018), and from the Fed who will let $600bn of maturing bonds run off its balance sheet ($360bn of which will be Treasuries). That slowing pace of central bank asset accumulation means that private investors must absorb an even greater supply of government bonds next year. The BCA Outlook estimated that the change in the supply of government bonds available to private investors would equal $1.2 trillion in 2019, a huge increase from the $400bn seen in 2018 (Chart 6). This will come at a time when new government bond issuance is set to increase once again thanks to wider U.S. budget deficits, further worsening the global supply/demand balance for government debt from the major developed economies. Chart 6Private Sector To Absorb More Bonds
Private Sector To Absorb More Bonds
Private Sector To Absorb More Bonds
The reduction in the pace of central bank bond buying will continue to put gentle upward pressure on government bond yields, as has been the case since the pace of ECB purchases peaked in 2016 (Chart 7). More importantly, the diminished central bank liquidity expansion means there will be less money going into risky assets via the portfolio balance channel (i.e. private investors taking the funds earned from selling bonds to central banks and placing that in equity and credit markets). Chart 7Upward Pressure On Yields & Vol From 'QT'
Upward Pressure On Yields & Vol From 'QT'
Upward Pressure On Yields & Vol From 'QT'
This creates a backdrop where volatility spikes will be more frequent, as has been the case in 2018 (bottom panel). Risky asset valuations will also be impacted from reduced inflows from yield-seeking investors who have sold government bonds to central banks. This suggests wider credit spreads and lower equity price/earnings multiples, all else equal (Chart 8). Chart 8Risk Asset Valuations Will Continue To Suffer From QT In 2019
Risk Asset Valuations Will Continue To Suffer From QT In 2019
Risk Asset Valuations Will Continue To Suffer From QT In 2019
Of course, all is not equal. A rebound in global growth could trigger a new wave of inflows into global equity and credit markets with valuations having cheapened in recent months. The important point is that, without central bank liquidity propping up asset prices, global risk assets will trade more off fundamentals in 2019 than has been the case during the past couple of years. Key View #3: Too Soon To Worry About Inverted Yield Curves “Yield curve inversions lead to recessions” is a well-known (if not well understood) relationship that has gained almost mythical status among investors. As the widely-watched spread between 2-year and 10-year U.S. Treasury yields (the 2/10 curve) has melted away during the course of 2018 – now sitting at a mere 13bps – the prognosticating power of the curve has many worried that a U.S. recession could be just around the corner. Especially after the Fed has raised the fed funds rate by 200 basis points over the past three years. Those fears are misguided, for several reasons: 1. The Treasury curve segment with the most successful track record in heralding U.S. recessions is the spread between the 10-year U.S. Treasury bond yield and the 3-month U.S. Treasury bill rate (Chart 9). That spread is still a firmly positive 42bps. We showed in a Special Report published last July that, on average, the length of time between the inversion of the 3-month/10-year Treasury curve and the beginning of a recession is seventeen months.2 Chart 9UST Curve Not Close To A True Recessionary Inversion Signal
UST Curve Not Close To A True Recessionary Inversion Signal
UST Curve Not Close To A True Recessionary Inversion Signal
2. The slope of the Treasury curve is unusually flat given the level of the fed funds rate measured in real (inflation-adjusted) terms. The previous three episodes where the 2-year/10-year Treasury curve has inverted over the past thirty years have occurred when the real fed funds rate was between 300-400bps (Chart 10). The current level of the real funds rate (deflated by headline CPI inflation) is near zero which, in the past, has occurred alongside a 2-year/10-year Treasury curve that had a positive slope between 150-200bps. Chart 10Global Yield Curves Look Too Flat Vs Real Policy Rates...
Global Yield Curves Look Too Flat Vs Real Policy Rates...
Global Yield Curves Look Too Flat Vs Real Policy Rates...
3. The depressed level of bond term premia is weighing on longer-dated Treasury yields and dampening the slope of the curve. This is happening not only in the U.S., but also in other major bond markets in Germany, the U.K. and Japan (Chart 11). The impact of global QE programs is the most likely common factor. Chart 11...With Global Term Premia Depressed
...With Global Term Premia Depressed
...With Global Term Premia Depressed
4. The 2-year/10-year U.S. Treasury curve has never been inverted without the real fed funds rate being above the neutral real rate, also known as R-star (Chart 12). Chart 12No 2/10 UST Inversion Before Real Rates Exceed R*
No 2/10 UST Inversion Before Real Rates Exceed R*
No 2/10 UST Inversion Before Real Rates Exceed R*
The implication for fixed income investing for 2019 is that it is too soon in the Fed’s monetary tightening cycle to expect an inverted yield curve driven by an overly tight monetary policy. That outcome is more likely by late 2019 after inflation expectations pick up and the Fed delivers at least another 75bps over the course of the year, pushing the funds rate into restrictive territory. Key View #4: Poor Corporate Returns From The Aging Credit Cycle The other major fixed income implication of the 2019 BCA Outlook is that global corporate bond markets are likely to see another year of poor returns (both in absolute terms and relative to government bonds). Spreads remain near historically tight levels across most spread product sectors, suggesting that credit risk premia will need to be repriced higher as the endgame of the multi-year credit cycle draws nearer (Chart 13). Both investors and policymakers have grown increasingly worried about the risks to the U.S. corporate bond market from high corporate leverage. However, as was discussed in the Outlook, U.S. corporate interest coverage remains well above levels that have preceded the end of previous credit cycles and BCA’s models suggest U.S. corporate profit growth will remain solid (albeit much slower than the rapid +20% growth seen in 2018). Chart 13Fading Support For Corporate Bonds From Growth & Policy
Fading Support For Corporate Bonds From Growth & Policy
Fading Support For Corporate Bonds From Growth & Policy
That does not mean that corporate bonds are without risk. With 50% of global investment grade bond indices now rated BBB (one notch above junk), the greater threat to corporates may come from downgrades. While those are less likely in a growing economy, investors in lower-rated investment grade bonds may require higher yields and spreads to compensate for the future risk of losses as those bonds could become “fallen angel” high-yield debt in the next economic downturn. This impact would be magnified as how many large fixed income managers have mandates that forbid investment in bonds rated below investment grade, thus creating forced selling in the event of downgrades. More fundamentally, the outlook for global corporate bonds, with spreads still much closer to historical tights than long-run averages, remains reliant on strong economic growth momentum and supportive monetary policy. On the former, we do not anticipate a move to sub-trend global growth, as discussed earlier, and corporate bond returns could stabilize once the current downtrend in the world economy subsides (Chart 14). This would likely represent a final period of calm, however. Tightening global monetary policies – both Fed hikes and diminished asset purchases – will create a more bearish backdrop for credit in the latter half of 2019 as markets begin to discount slower economic growth in 2020. Chart 14Fading Support For Corporate Bonds From Growth & Policy
Fading Support For Corporate Bonds From Growth & Policy
Fading Support For Corporate Bonds From Growth & Policy
Robert Robis, CFA, Senior Vice President Global Fixed Income Strategy rrobis@bcaresearch.com Footnotes 1 Please see the December 2018 edition of The Bank Credit Analyst, “Outlook 2019 – Late Cycle Turbulence”, available at bca.bcaresearch.com and gfis.bcaresearch.com. 2 Please see BCA Global Fixed Income Strategy Special Report, “Three Frequently Asked Questions About Global Yield Curves”, dated July 31st 2018, available at gfis.bcaresearch.com. Recommendations The GFIS Recommended Portfolio Vs. The Custom Benchmark Index
2019 Key Views: Normalization Is The "New Normal"
2019 Key Views: Normalization Is The "New Normal"
Duration Regional Allocation Spread Product Tactical Trades Yields & Returns Global Bond Yields Historical Returns