Global

Dear Client, In lieu of next week’s report, I will be hosting a webcast on Wednesday, January 9th at 10 AM EST, when I will be discussing the economic and financial market outlook for 2019 and answering your questions. Best regards, Peter Berezin, Chief Global Strategist Highlights The lack of major financial and economic imbalances in the U.S., as well as the Fed’s ability to moderate the pace of rate hikes, reduce the risk of a vicious cycle where tighter financial conditions lead to slower economic growth and even tighter financial conditions. The scope for central banks to cut rates is more limited outside the United States. Imbalances are also greater abroad. Nevertheless, the news is not all bleak, with the recent rebound in China’s credit impulse being a case in point. We turned more bullish on risk assets following December’s post-FOMC equity sell-off. A moderately overweight position in global equities over a 12-month horizon is currently justified. While we continue to favor the U.S. over other bourses in dollar terms, our conviction level in this regional bias has decreased. Treasury yields are likely to rise in an environment where U.S. growth is strong enough to enable the Fed to continue raising rates. Outside Japan, global government bond yields will also increase in 2019. We are removing our long June-2019 Fed funds futures contract hedge, and we are now solely outright short the December-2020 contract. We are also taking profits on our March-2019 EEM ETF put for a gain of 104%. Feature Merry Crisis And A Happy New Fear Santa arrived early this year. The plunge in stocks allowed investors to buy some of the world’s premier companies at a mouthwatering 20%-to-30% discount to what they would have paid just a few months earlier. What a gift! Needless to say, most investors would not regard last month’s stock market performance in such a favorable light. But why not? One answer is that investors must mark their portfolios to market. Thus, even if the decline in equity prices raised future returns, it still implied a decline in present net worth. Yet, this cannot be the whole explanation, because if all investors expected stocks to bounce back quickly, they would not have sold in the first place. Clearly, many investors must have come to the conclusion that the stock market would not only go down but stay down. However, this presents a puzzle. The economic environment did not change that much in the weeks leading up to the October sell-off. Growth has slowed more recently (Chart 1), with this morning’s disappointing ISM manufacturing report being the latest example, but this appears to have been mainly a response to the souring market climate rather than the cause of it. Chart 1Tighter Financial Conditions Have Led To Slower Growth
Tighter Financial Conditions Have Led To Slower Growth
Tighter Financial Conditions Have Led To Slower Growth
Reverse Causality? This raises an intriguing possibility: What if the drop in stock prices and jump in credit spreads that began in late September hurt expectations of economic growth by enough to justify a further discount in risk asset valuations? Such a “Financial Conditions Index (FCI) doom loop” is not just a theoretical construct. The last two U.S. recessions were both the products of burst asset bubbles — first the dotcom bubble and then the housing bubble. Could such a self-fulfilling vicious cycle be erupting again? If so, any rally in stocks or credit should be sold into, just as was the case in both 2001 and 2007. U.S. Fairly Resilient To A Doom Loop Fortunately, there are two reasons to think that such an outcome will not reoccur, at least not in the United States. First, as Box 1 explains, an FCI doom loop is more likely to unfold when economic growth becomes very sensitive to changes in financial conditions. This normally happens when economic and financial imbalances are elevated. That does not appear to be the case today. Unlike in the lead-up to the last two recessions, the U.S. private sector is a net saver whose income outstrips spending by 2.1% of GDP (Chart 2). Cyclical spending – the sum of residential investment, business capex, and expenditures on consumer durable goods – is also far below prior business-cycle peaks as a share of GDP (Chart 3). Chart 2The U.S. Private Sector Is A Net Saver
The U.S. Private Sector Is A Net Saver
The U.S. Private Sector Is A Net Saver
Chart 3U.S. Economy: Cyclical Spending Is Still Restrained
U.S. Economy: Cyclical Spending Is Still Restrained
U.S. Economy: Cyclical Spending Is Still Restrained
Despite recent releveraging in some categories, U.S. household debt has continued to decline in relation to the size of the economy. The ratio of personal debt-to-disposable income is now 34 percentage points below pre-crisis levels (Chart 4). Chart 4Household Leverage Is Below Its Peak
Household Leverage Is Below Its Peak
Household Leverage Is Below Its Peak
U.S. corporate debt has moved in the opposite direction. Nevertheless, while the ratio of U.S. corporate debt-to-GDP has climbed to a record high, it is still quite low by global standards (Chart 5). Perhaps more importantly, corporate debt is generally held by non-leveraged institutions. If corporate defaults were to rise unexpectedly, the losses to lenders would not pose the same systemic risk to the financial sector as mortgage defaults did during the Global Financial Crisis. Chart 5U.S. Corporate Debt Is High, But It Is Higher Elsewhere
U.S. Corporate Debt Is High, But It Is Higher Elsewhere
U.S. Corporate Debt Is High, But It Is Higher Elsewhere
The Fed’s Reaction Function It is not surprising that the stock market sell-off accelerated in early October following Fed Chairman, and failed golfer, Jay Powell’s comment that interest rates were “far from neutral.” We think that worries that the Fed will tighten too quickly are misplaced. Yes, monetary policy operates with “long and variable lags.” However, financial conditions, which lead growth, can be observed in real time (Chart 6). Chart 6Global Financial Conditions Have Tightened
Global Financial Conditions Have Tightened
Global Financial Conditions Have Tightened
Most of the tightening in financial conditions since late September has been due to falling equity prices. Our baseline scenario envisions a gain of roughly 10% in the S&P 500 in 2019. A rebound in stocks of this magnitude will reverse most of the recent FCI tightening, thereby allowing the Fed to raise rates three times this year. But if equities continue to sag, the Fed will scale back further monetary tightening or even cut rates. The mere possibility of such a policy response reduces the odds of an FCI doom loop. A Mixed Bag Outside The U.S. The economic outlook is murkier outside the United States. Economic and financial imbalances are greater in the EM space and parts of Europe. Non-U.S. central banks also have less scope to respond to adverse shocks, either because of fears that looser monetary policy will spark capital outflows (as is the case in many emerging markets) or because of the presence of the zero-bound constraint on interest rates (as is the case in the euro area and Japan). Nevertheless, the situation is not that bad. EM assets have been fairly resilient over the past few months, at least in comparison to their developed economy counterparts (Chart 7). China’s credit impulse has actually perked up, an indication that while credit growth is falling, it is doing so at a slower pace. Chart 8 shows that the Chinese credit impulse is highly correlated with global industrial commodity prices. We still expect global growth to slow in the first half of 2019, but at this point, much of the slowdown has been discounted in asset markets. With that in mind, we are raising the stop on our short AUD/JPY trade to 10% and instituting a profit target of 15%. Chart 7EM Assets Have Been Outperforming Recently
EM Assets Have Been Outperforming Recently
EM Assets Have Been Outperforming Recently
Chart 8The Increase In China's Credit Impulse Bodes Well For Industrial Commodity Prices
The Increase In China's Credit Impulse Bodes Well For Industrial Commodity Prices
The Increase In China's Credit Impulse Bodes Well For Industrial Commodity Prices
The Perils Of Discrete Decision-Making One of the annoyances of being an investment strategist is that you often feel compelled to take discrete views on where the markets are heading. Are you bullish, bearish, or neutral? Actually, it is usually just bullish or bearish because most people regard neutral views as lacking in conviction and insight. This incentive structure is counterproductive. Not only does it cause analysts to turn a blind eye to incoming data that may challenge their thesis, it disregards how professional investors actually operate. Successful investors scale into positions as the market gets cheaper and scale out as it becomes more expensive. Trying to time the bottom (or the top) with exact precision is futile. With that in mind, we are going to tweak the way we make recommendations going forward in order to improve transparency, accountability, and accuracy. Rather than simply stating whether we are bullish, bearish, or neutral, we will assign the main asset classes a subjective score between zero and one hundred, with 0-to-40 being bearish, 40-to-60 being neutral, and 60-to-100 being bullish. We will adjust the score in every publication. To add analytic rigor to this framework, we will also compare our subjective model score with that of our MacroQuant model. Where Things Now Stand We downgraded global equities last June, but moved back to overweight following December’s post-FOMC meeting sell-off, as valuations reached that rather blurry line at which a modest equity overweight was warranted. Our subjective score for global equities currently stands at 65%, above the model’s estimate of 50%. Our moderately bullish view reflects our expectation that global growth will stabilize by mid-year and monetary policy will remain accommodative, even if the Fed raises rates by more than what the markets are currently discounting. Tempering our enthusiasm is the recognition that the business cycle is getting long in the tooth – especially in the U.S. – and that global equity valuations, while far cheaper than they were a few months ago, are still significantly less favorable than they were near past market bottoms (Chart 9). Chart 9Global Equity Valuations Have Improved
Global Equity Valuations Have Improved
Global Equity Valuations Have Improved
Regionally, we continue to favor U.S. stocks over other developed markets, and DM over EM more broadly. However, our conviction level on this view is not high, and we are prepared to revise it if it looks like global growth is accelerating, an outcome that would limit any further dollar strength (our subjective dollar score currently stands at 70%, below the model’s estimate of 92%). Reflecting our expectation of decent global equity returns in 2019 and our waning conviction to be underweight EM, we are taking profits on in our March-2019 EEM ETF put for a gain of 104%. Please note that our view on EM is more optimistic than that of Arthur Budaghyan, BCA’s chief emerging markets strategist, who continues to see considerable downside risks to EM assets. For now, Treasury yields are likely to rise in an environment where U.S. growth is strong enough to enable the Fed to continue raising rates. We assign the 10-year yield a score of 30%, which is close to our model estimate of 32%. Accordingly, we are removing our long June-2019 Fed funds futures contract hedge, and we are now solely outright short the December-2020 contract. Core European bond yields will increase, reflecting diminished excess capacity in the euro area and the end of ECB net asset purchases. U.K. yields should also grind higher, as the odds of a soft Brexit (or no Brexit) improve. Only in Japan will yields remain contained, thanks to the BoJ’s ongoing yield curve control regime. We do not expect spread product to have a banner year, but the current yield pick-up should be sufficient to ensure that risky credit outperforms cash. Peter Berezin, Chief Global Strategist Global Investment Strategy peterb@bcaresearch.com Box 1 The Analytics Of Doom Loops When will a tightening in financial conditions stemming from lower equity prices and higher borrowing costs lead to a vicious circle of slower economic growth and even tighter financial conditions? The answer depends on how sensitive economic growth is to financial conditions in relation to how sensitive financial conditions are to growth. Figure 1 shows two equilibrium schedules, one for the economy (EE) and one for asset markets (AA). Both schedules slope downward. The EE schedule is downward-sloping because easier financial conditions boost growth. If growth is too strong given the prevailing level of financial conditions, economic activity will slow (Panel A). The AA schedule is downward-sloping because equity prices tend to fall and credit spreads rise when growth slows. If equity prices are too high and credit spreads are too narrow for a certain level of growth, then financial conditions will tighten (Panel B). Suppose economic growth is not very sensitive to changes in financial conditions, perhaps because imbalances in the economy are limited (Panel C). Then changes in financial conditions will be fleeting: A decline in equity prices or a widening in credit spreads will not hurt growth very much, allowing the stock market and credit market to quickly normalize. In contrast, suppose that economic growth is very sensitive to financial conditions, so much so that the EE schedule is flatter than the AA schedule. In this case, the economy will be vulnerable to self-reinforcing booms and busts (Panel D). In particular, a small random jump from U to UI will send the economy careening towards a doom loop of ever-weaker growth and tighter financial conditions.
Chart 10
Strategy & Market Trends MacroQuant Model And Current Subjective Scores
Chart 11
Tactical Trades Strategic Recommendations Closed Trades
Getting right to the point: Oil fundamentals are, and could remain, disconnected from benchmark prices, as they were in the waning days of 2018, when markets were forced to recalibrate global supply-demand balances in the dark. Four factors will drive this disconnect and keep volatility elevated (Chart of the Week): Chart of the WeekPrice-Fundamentals Disconnect Will Persist
Price-Fundamentals Disconnect Will Persist
Price-Fundamentals Disconnect Will Persist
Continuing uncertainty over how much oil Iran will export this year; A lack of precise information about individual production cuts from OPEC 2.0; Uncertainty over EM demand; and Illiquid markets, brought about by a diminution of speculators’ risk-bearing capacity, which is largely the result of the price-fundamentals disconnect. Nonetheless, we do not believe markets are responding to an as-yet undetected collapse in demand or run-away supply, which recent price action would suggest. To the contrary, we expect OPEC 2.0 and Canadian production cuts of ~ 1.4mm b/d, continued decline-curve losses and slower U.S. shale growth resulting from price-induced capex declines, will face off against stout demand to rebalance markets in 1H19. We are, therefore, getting long spot WTI, and long July 2019 Brent vs. short July 2020 Brent as a spread at today’s close. Highlights Energy: Overweight. We ended 2018 with an average gain of 24% on recommendations we closed or were stopped out of. Open positions going into 2019 – mostly Brent call spreads with stop-losses of -$1.00/bbl – were down 49%. Base Metals: Neutral. Chile’s national statistics agency INE reported copper output was 5.3mm MT over the January – November 2018 period, its highest level since December 2005, and 6% higher than year-ago levels.1 Precious Metals: Neutral. Gold markets appear to be pricing less than the four rate hikes we’re expecting this year from the Fed. We remain long as a portfolio hedge. Ags/Softs: Underweight. U.S. negotiators head to Beijing next week to continue trade talks. We remain bearish soybeans all the same, given our expectation the current crop year will end with record-high stocks-to-use ratios worldwide. Feature The last time WTI oil futures traded this close to $40/bbl, OECD crude and products inventories stood at ~ 3.1 billion barrels, and OPEC 2.0 had just begun its output cuts in Jan17 (Chart 2). OECD inventories now stand under 2.9 billion barrels, and are on course to fall to ~ 2.5 billion by year-end, as the physical surplus is drained by a combination of falling production and still-strong demand (Chart 3). Chart 2OECD Inventories Will Draw, Taking Crude Prices Higher
OECD Inventories Will Draw, Taking Crude Prices Higher
OECD Inventories Will Draw, Taking Crude Prices Higher
Chart 3Supply Cuts, Demand Strength Will Rebalance Markets
Supply Cuts, Demand Strength Will Rebalance Markets
Supply Cuts, Demand Strength Will Rebalance Markets
Brent and WTI prices have fallen 39% and 41% from their October 2018 highs, following the about-face by the U.S. on Iranian oil-export sanctions in November. On the back of this, we expect OPEC 2.0 to follow through on its 1.2mm b/d production cuts – possibly even exceed them, as they did over the 2017 – 1H18 period. OPEC 2.0’s track record on production discipline is strong, hence our expectation the group’s 2019 output will fall to 31.14mm b/d vs. 2018’s 32.40mm b/d level.2 The Trump administration’s waivers for Iran’s eight largest oil importers expire May 2019. We view it as unlikely the administration will re-impose export sanctions in full on Iranian exports following the expiration of waivers, and expect they will be extended at least for 90 days. We expect Iranian production to fall from ~ 2.80mm b/d in 1H19 to an average 2.60mm b/d from June – December 2019, resulting in the loss of 1.25mm b/d of exports. We expect Saudi Arabia to raise production from 10.15mm b/d to 10.30mm b/d to offset most of this incremental loss of Iranian production. Government-mandated production cuts of 325k b/d in Alberta, Canada – undertaken to drain a persistent inventory overhang and loosen the flow of oil pipeline-transport-constrained production – also will remove actual production from the market this year.3 In addition, we continue to model the loss of 190k b/d of decline-curve losses in OPEC 2.0 member states that are incapable of maintaining or lifting output due to low prices and a lack of investment (Chart 4). The contribution of these states to the OPEC 2.0 cuts is to “manage” their depletion rates per their November 2016 accord (Table 1). Chart 4Production Outside Gulf OPEC Continues Decline, Led By Venezuela
Production Outside Gulf OPEC Continues Decline, Led By Venezuela
Production Outside Gulf OPEC Continues Decline, Led By Venezuela
Table 1Table 1 BCA Global Oil Supply - Demand Balances (MMb/d) (Base Case Balances)
Oil Volatility Will Persist; 2019 Brent Forecast Lowered To $80/bbl
Oil Volatility Will Persist; 2019 Brent Forecast Lowered To $80/bbl
Net, we have world supply growth at 0.5mm b/d this year vs. the 1.4mm b/d estimated by the EIA. Most of this again comes from the U.S., where we expect 1.3mm b/d growth. Due to the price rout following Iranian import waivers, we lowered our rig count projections – the main input of our U.S. production forecast – which took our Lower 48 U.S. (i.e., ex GOM) production growth to 1.2mm b/d from the 1.4mm b/d rate we estimated last month. Despite pipeline bottlenecks in the Permian Basin, which will be fully alleviated by 4Q19 when the last of ~ 2mm b/d of new takeaway capacity comes on line, U.S. shales still account for most of the net growth in U.S. ouput (Chart 5).4 If WTI prices remain in the mid- to low-$40/bbl range, however, rig counts will be driven lower, which will, all else equal, lower U.S. shale-oil output this year. Chart 5Lower WTI Prices Slow U.S. Shale Growth
Lower WTI Prices Slow U.S. Shale Growth
Lower WTI Prices Slow U.S. Shale Growth
Lower Prices Will Support Demand The price collapse since October will keep global oil demand from breaking down, leading us to expect consumption to grow ~ 1.40mm b/d this year. This is down slightly from our previous estimate of 1.45mm b/d of growth, and falls 200k b/d short of the ~ 1.6mm b/d of growth we expect for 2018.5 Forecasting demand is notoriously difficult. This is particularly true for forecasting EM demand, the source of most of the growth in the world. We have non-OECD demand – our proxy for EM oil consumption – growing 1.0mm b/d this year, down from 2018’s rate of 1.2mm b/d. This reflects our expectation the IMF will lower its growth expectation for EM GDP to 4.6% this year, from its October 2018 estimate of 4.7% growth. This will take global GDP growth to 3.6% to 3.7% previously estimated. EM demand continues to be led by China and India, which we expect will grow 450k b/d and 210k b/d, respectively, this year, again accounting for more than half of EM growth. China’s oil consumption is expected to average 14.3mm b/d, while India’s will average just over 5mm b/d. We continue to expect modest stimulus coming from China in 2H19, which will support oil demand and consumer spending. However, this could surprise to the upside, with the 100th anniversary of the Chinese Communist Party coming up in 2021. Our colleagues at BCA Research’s Geopolitical Strategy (GPS) noted that if China’s government is to launch another large-scale stimulus package (not a foregone conclusion), then the likeliest time frame is 2H19 or 2020. Indeed, this is more probable than anytime earlier, due to the desire of Chinese policymakers to dispel any doubts about stability in 2021 for the Party’s centenary. GPS’s Matt Gertken observed the average gap between the bottom of China’s credit impulse and the top of nominal GDP growth is ~ 1.5 to 2 years. Policymakers will not want to stimulate too aggressively in early 2019 and risk having a flagging economy in the midst of 2021 celebration.6 Investment Implications Over the short term, oil prices could remain disconnected from market fundamentals, which we believe remain broadly supportive. Indeed, the balance of risks still favors the upside, despite the epic volatility over the past 3 months brought about by the larger-than-expected waivers to importers of Iranian oil just before U.S.-imposed sanctions were due to kick in in November (Chart 6). Chart 62019 Brent, WTI Price Forecasts: Slightly Lower at And /bbl
2019 Brent, WTI Price Forecasts: Slightly Lower at $80 And $74/bbl
2019 Brent, WTI Price Forecasts: Slightly Lower at $80 And $74/bbl
We have lowered our average 2019 Brent forecast to $80 this year from $82/bbl, and our WTI forecast to $74 from $76/bbl, given our assessments of production and consumption.7 Markets continue to re-calibrate supply and demand balances largely in the dark, and will continue to do so until greater clarity is gained on actual OPEC 2.0 production cuts and the state of EM demand. On the supply side, we expect sharp production cuts from OPEC 2.0 and Canadian producers of ~ 1.4mm b/d; falling output in non-Gulf OPEC states from continuing decline-curve losses; and slower U.S. shale growth resulting from lower capex in the wake of the price collapse. On the demand side, we lowered our EM growth estimate slightly ahead of an expected downgrade of EM growth this year, but we still expect consumption to show relatively strong growth of 1.4mm b/d. Net, the combination of supply cuts plus still-strong demand will remove the current global surplus, and rebalance the market by the end of 1H19. Thus, in our view, the balance of risks – as seen in our ensemble scenarios – still is to the upside (Chart 7). Chart 7Balance of Risks Favors Upside
Balance of Risks Favors Upside
Balance of Risks Favors Upside
In line with our expectation for higher prices, we are getting long spot WTI, believing prices in the low- to mid-$40s extending beyond 1Q19 will cause a 5 – 10% slowdown in U.S. production growth later this year, which will set up a rally later in the year. We also are getting long July 2019 Brent vs. short July 2020 Brent as a spread at today’s close, in the expectation of a return to backwardation by the end of 1H19, as OECD inventories draw. We have touched on 3 of the 4 drivers of volatility in this week’s research. Next week we will examine the effect of this volatility on speculators’ risk-bearing capacity, and the implications for price discovery. Contrary to popular and received political opinion, speculation is a necessary and vital activity for the efficient functioning of commodity markets, particularly those used by commercial participants to hedge untoward price risks. Robert P. Ryan, Senior Vice President Commodity & Energy Strategy rryan@bcaresearch.com Hugo Bélanger, Senior Analyst Commodity & Energy Strategy HugoB@bcaresearch.com Footnotes 1 Please see “UPDATE 1-Chile monthly copper output highest in 13 years,” published December 31, 2018, by reuters.com. 2 Our estimates include continued production declines ex OPEC Gulf states and in other non-OPEC members like Mexico that are covered by the OPEC 2.0 agreement (Table 1). Under the production-cutting accord agreed at OPEC 2.0’s December meeting in Vienna, October 2018 is the benchmark against which new quotas – yet to by made public – are assessed. We note here that OPEC 2.0 has not published any official quota schedule following its December 2018 meeting, where it agreed to the 1.2mm b/d of production cuts. Our supply estimates use data from the U.S. EIA, IEA and OPEC, along with trade press reports. 3 We estimate there is ~ 200k b/d of trapped Alberta supply – i.e., excess production over takeaway capacity (pipeline and rail) – along with ~ 35mm bbls of accumulated excess production in storage the Alberta government is attempting to draw down by its action over the course of 2019 at a rate of ~ 96k b/d. 4 By year-end, we expect U.S. crude oil production of 12.6mm b/d, which will keep the U.S. the largest crude oil producer in the world. U.S. crude oil exports can be expected to continue to grow as a result, after hitting 3.2mm b/d for the week ended November 30, 2018, an all-time high, according to EIA data. U.S. product exports likely will run ~ 6mm b/d this year. 5 The IEA and OPEC are expecting 2019 demand growth of 1.3mm and 1.29mm b/d, respectively, while the U.S. EIA is expecting consumption will grow 1.5mm b/d. 6 Please see “China Sticks To The ‘Three Battles’,” published by BCA Research’s Geopolitical Strategy October 24, 2018. It is available at gps.bcaresearch.com. 7 This puts us above the consensus Brent forecast of $69.13/bbl reported by Reuters. Please see “Oversupply, faltering growth to weigh on oil prices in 2019: Reuters poll,” published by reuters.com December 31, 2018. Investment Views and Themes Recommendations Strategic Recommendations Trade Recommendation Performance In 3Q18
Image
Commodity Prices and Plays Reference Table Trades Closed in 2018 Summary of Trades Closed in 2017
Image
Over the past couple of months global equities have fallen by more than 10%, the 10-year U.S. Treasury yield has dipped from above 3.2% to below 2.6%, and high-yield bond spreads have risen by more than 200 basis points. The market is sniffing out the risk…
Feature No Recession – Add To Risk Again Markets have been notably weak and volatile since we published our 2019 Outlook1 in late November. Over the past couple of months, global equities have fallen by more than 10%, the 10-year U.S. Treasury yield has dipped from above 3.2% to below 2.7%, and high-yield bond spreads have risen by more than 200 basis points. The market is sniffing out the risk of recession on the near-term horizon. We think the market has got this wrong, and so we move back to overweight global equities (from neutral, to where we lowered our recommendation last June). Recommendations
Monthly Portfolio Update
Monthly Portfolio Update
Last year, U.S. growth was much stronger than growth in the rest of the world (Chart 1). Markets are implying that the global slowdown will soon infect the U.S., with the stock market pointing to the manufacturing ISM, currently at 59.3, falling back to 50 in very short order (Chart 2). Chart 1Will U.S. Growth Also Fall Back?
Will U.S. Growth Also Fall Back?
Will U.S. Growth Also Fall Back?
Chart 2Stocks Imply ISM At 50
Stocks Imply ISM At 50
Stocks Imply ISM At 50
It is, indeed, probable that growth will slow this year: the FOMC’s median forecast suggests a slowdown in real GDP growth from 3.0% in 2018 to 2.3%. And it may take the market a little longer to digest that deceleration. However, growth is likely to remain above trend (currently estimated at 1.8%). Higher interest rates have begun to take their toll on the housing market (with a noticeable deterioration in new housing starts and builder confidence). But residential investment is now only 4% of GDP, compared to 7% in 2006, so the impact of the slowdown will be limited. Moreover, consumption is likely to remain buoyant, with wage growth accelerating, consumer confidence strong, and the savings rate with room to fall (Chart 3). Additionally, though fiscal stimulus will not be as powerful in 2019, the IMF estimates that it will add a further half of one percentage point to U.S. GDP growth. Chart 3Consumption Likely To Remian Buoyant
Consumption Likely To Remian Buoyant
Consumption Likely To Remian Buoyant
The Fed is reacting very pragmatically to the evolving circumstances. Chair Jerome Powell emphasized in his post-FOMC press conference in December that “some cross currents have emerged” and that “policy decisions are not on a pre-set course”. The FOMC cut its forecast for hikes in 2019 from three to two and lowered its estimate of the terminal rate from 3.0% to 2.8% (currently the fed funds rate is at 2.4%). This implies that it will take approximately two more 25 basis point rate hikes before the Fed gets rates back to neutral. As we have often shown, risk assets tend to outperform bonds until monetary policy is restrictive (Chart 4).
Chart 4
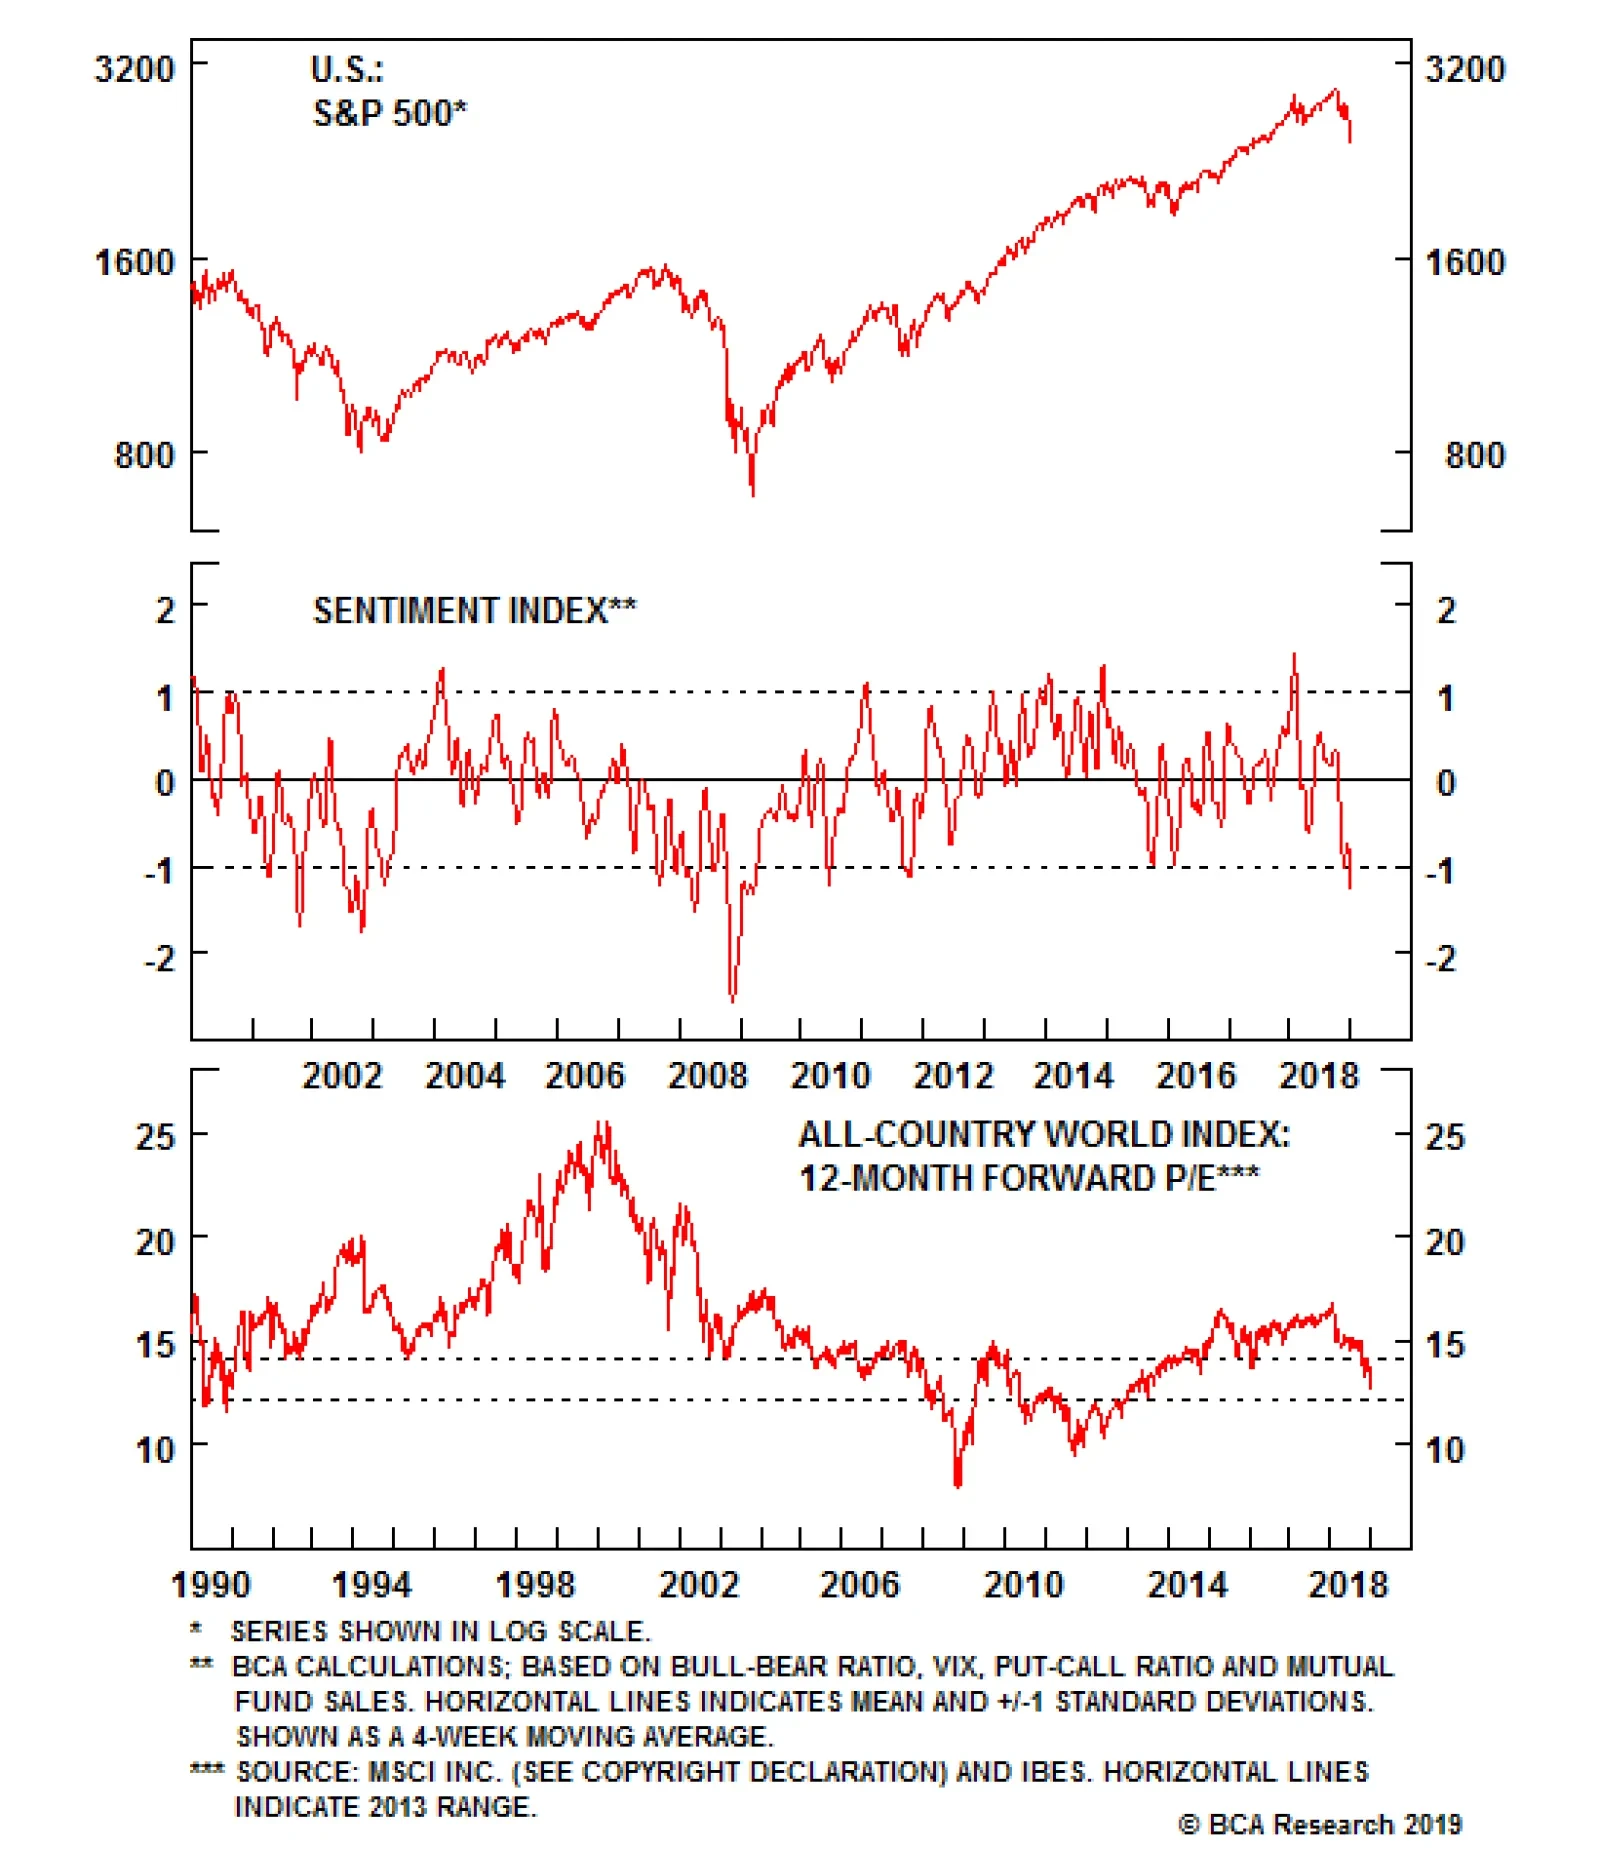
Meanwhile, market sentiment has turned excessively bearish. Our sentiment index is at a level that has historically pointed to a good buying opportunity (Chart 5). The AAII survey shows that recently only 25% of U.S. retail investors expect the market to rise over the next six months, compared to 47% who expect it to fall. Valuations are cheap again: the forward PE for the MSCI All Country World Index (ACWI) is now back to the range it traded at in 2013 (Chart 6). The classic indicators of recession, such as the yield curve, are not yet flashing warning signals: the 3-month/10-year curve, which we have shown has historically been the most reliable,2 remains at +20 basis points (Chart 7). It needs to invert to signal recession – and, typically, it does that as much as 18-24 months in advance. Chart 5Sentiment Is Very Bearish
Sentiment Is Very Bearish
Sentiment Is Very Bearish
Chart 6Global PE Back To To 2013 Level
Global PE Back To To 2013 Level
Global PE Back To To 2013 Level
Chart 7Yield Curve Has Not Inverted
Yield Curve Has Not Inverted
Yield Curve Has Not Inverted
Certainly, there are risks (we would highlight a reignition of the trade war after March 1, Brexit, U.S. government shutdown, the possibility that falling stock and house prices hurt consumer and business sentiment, and China’s reluctance to implement a massive 2016-style reflationary stimulus). But our analysis suggests there is significantly more upside than downside risk for equities over the next 12 months. If earnings growth, particularly in the U.S., comes in close to our top-down forecasts (Chart 8), it is hard to imagine – given the current depressed multiples – equities underperforming bonds this year. Accordingly, we recommend raising global equities to overweight in a multi-asset portfolio on a 12-month horizon, and lowering cash to neutral. For now, we have not changed our other tilts, and continue to recommend an overweight on U.S. equities and defensive sectors, a preference for equities over credit, and a high degree of caution towards emerging market assets. Chart 8Earnings On Track To Grow Healthily In 2019
Earnings On Track To Grow Healthily In 2019
Earnings On Track To Grow Healthily In 2019
Currencies: With growth likely to remain stronger in the U.S. than in the rest of the world, we expect appreciation of the dollar over the next six months. BCA’s Central Bank Monitors point to the need for the Fed to tighten policy further, but for the ECB to remain dovish. The gap between these two monitors has done a good job at forecasting EUR/USD over the past 10 years (Chart 9). However, speculative positions are already quite long dollar (Chart 10) and so the upside might be limited to around 5% in trade-weighted terms. If global growth begins to reaccelerate midway through 2019, the dollar might weaken again. Chart 9Relative Policy Suggests Stronger USD
Relative Policy Suggests Stronger USD
Relative Policy Suggests Stronger USD
Chart 10
Equities: We prefer DM equities over EM. Further rises in the dollar and long-term U.S. interest rates, combined with continuing slowdown in global trade and Chinese growth, will remain headwinds for EM equities even if the market moves into a more risk-on phase. Valuations in EM do not look attractive either, with forward PE relative to DM in line with recent averages, and earnings growth forecasts likely to be revised down into negative territory over the coming months given the challenges facing developing economies (Chart 11). Within DM, we have a preference for the U.S., given its stronger growth and likely currency appreciation, over the euro zone and Japan, which are more sensitive to the global manufacturing cycle. Europe, in particular, will continue to be held back by the travails of its banks, which have been a major determinant of relative equity market performance in recent years (Chart 12). In a recent Special Report, we concluded that the long-term outlook for euro zone bank profitability remains lackluster.3 Chart 11EM Equities Are Not Cheap
EM Equities Are Not Cheap
EM Equities Are Not Cheap
Chart 12Banks Will Weigh On Euro Zone Stocks
Banks Will Weigh On Euro Zone Stocks
Banks Will Weigh On Euro Zone Stocks
Fixed Income: We see further upside for long-term rates in 2019, driven by a combination of above-trend economic growth, more Fed hikes than the market is pricing in, a moderate pick-up in inflation, and the unwinding of the Fed’s balance-sheet. We do not see rates being an impediment to growth until they reach the level of trend nominal GDP growth, currently 3.8% (which was the crunch point in both 1999 and 2006 – Chart 13). Despite our more positive view on equities, we remain more cautious on credit. Spreads have widened recently to more attractive levels (Chart 14). However, we remain concerned about the high leverage of U.S. corporates, whose debt/assets ratio is on average higher now than in 2009 (Chart 15). Signs of strain are already showing in the junk bond market, with new issuance having largely dried up since early December. If this continues, borrowers may struggle to refinance maturing debt in early 2019. At this stage of the cycle, credit spreads are unlikely to tighten much, even with an equity market rally. Furthermore, given the high leverage, credit is an asset class that is likely to perform particularly poorly in the next recession. Chart 13Only At 3.8% Do Rates Become A Risk
Only At 3.8% Do Rates Become A Risk
Only At 3.8% Do Rates Become A Risk
Chart 14Credit Spreads Not More Attractive
Credit Spreads Not More Attractive
Credit Spreads Not More Attractive
Chart 15U.S. Corporate Leverage Is A Problem
U.S. Corporate Leverage Is A Problem
U.S. Corporate Leverage Is A Problem
Commodities: The sell-off in crude oil over the past two months was due to short-term supply-side shocks, most notably the U.S.’s agreeing to 180-day exceptions on Iranian sanctions. But supply is likely to tighten in coming months (Chart 16). Saudi Arabia and Russia intend to reduce production by 1.2 million barrels/day, and U.S. shale oil supply growth is likely to slow since one-year forward WTI is now around $49, slightly below the average breakeven level for shale oil producers. With global oil demand set to remain strong, our energy strategists see Brent oil rebounding to around $80 a barrel in 2019, with WTI $6 below that.4 Industrial commodities will continue to face headwinds from a stronger dollar and slowing China. Only when the effects of China’s moderate reflation measures start to come through in 2H 2019 would we expect to see a recovery in metals prices. Chart 16Oil Supply Set To Tighten
Oil Supply Set To Tighten
Oil Supply Set To Tighten
Garry Evans, Senior Vice President Global Asset Allocation garry@bcaresearch.com Footnotes 1 Please see “Outlook 2019: Late-Cycle Turbulence,” dated 27 November 2018, available at bca.bcaresearch.com 2 Please see Global Asset Allocation Special Report, “Can Asset Allocators Rely On Yield Curves?”, dated 15 June 2018, available at gaa.bcaresearch.com 3 Please see Global Asset Allocation Special Report, “Euro Area Banks: Value Play Or Value Trap?”, dated 14 December 2018, available at gaa.bcaresearch.com 4 For the detailed rationale of their forecast, please see Commodity & Energy Strategy Weekly Report, “2019 Key Views Policy-Induced Volatility Will Drive Markets,” dated 13 December 2018, available at ces.bcaresearch.com GAA Asset Allocation
This is the second of a two-part Special Report on the structural changes that have occurred as a result of the Great Recession and financial crisis. We look at three issues: asset correlation, the safety of the financial system, and the level of global debt. First, correlations among financial assets shifted dramatically during the financial crisis and the after-effects lingered for years. Some believe that the underlying level of correlation among risk assets has shifted permanently higher for two main reasons: (1) trading factors such as the increased use of exchange-traded funds and algorithms; and (2) the risk-on/risk-off environment in which trading has become more binary in nature, due to the sharp rise in policy uncertainty, risk aversion and risk premiums in the aftermath of the Great Recession. We have sympathy for the second explanation. The equity risk premium (ERP) was forced higher on a sustained basis by the financial crisis, driven by fears that the advanced economies had entered a ‘secular stagnation’. Elevated correlation among risk assets was a result of a higher-than-normal ERP. The ERP should decline as fears of secular stagnation fade, leading to a lower average level of risk asset correlation than has been the case over the last decade. Second, regulators have been working hard to ensure that the financial crisis never happens again. But is the financial system really any safer today? Undoubtedly, banks have improved balance sheet and funding resilience, and have significantly reduced their involvement in complex financial activities. The propensity for contagion among banks has diminished and there has been a dramatic decline in the volume of complex structured credit securities. The bad news is that the level of global debt has increased at an alarming pace. The third part of this report highlights that elevated levels of debt could cause instability in the global financial system. Choking debt levels boost the vulnerability to negative shocks. The number and probability of potential shocks appear to have increased since 2007, including extreme weather events, sovereign debt crises, large-scale migration, populism, water crises and cyber & data attacks. The lack of a fiscal buffer in most countries means that it will be difficult or impossible to provide any fiscal relief in the event of a negative shock. Moreover, the end of the Debt Supercycle means that the monetary and fiscal authorities will find it difficult to encourage the private sector to spend more in most cases. For EM, deleveraging has not even started and more financial fireworks seem inevitable in the context of a strong dollar and rising global yields. China may avoid a crisis, but the adjustment to a less credit-driven economy is already proving to be a painful process. The Great Recession and Financial Crisis cast a long shadow that will affect economies, policy and financial markets for years to come. Rather than reviewing the roots of the crisis, the first of our two-part series examined the areas where we believe structural change has occurred related to the economy or financial markets. We covered the changing structure of the corporate bond market, the inflation outlook, central bank policymaking and equilibrium bond yields. We highlighted that the financial crisis transformed the corporate bond market in several ways that heighten the risk for quality spreads in the next downturn. We made the case that the prolonged inflation undershoot is sowing the seeds of an overshoot in the coming years, in part related to central bank policymakers that are doomed to fight the last war. Finally, we argued that the forces behind the structural and cyclical bull market in bonds reached an inflection point in 2016/2017. In Part II, we examine the theory that the financial crisis has permanently lifted market correlations among risk assets. Next, we look at whether regulatory changes implemented as a result of the financial crisis have made the global financial system safer. Finally, we highlight the implications of the continued rise in global leverage over the past decade in the context of BCA’s Debt Supercycle theme. The bottom line is that the global financial system still faces substantial risks, despite a more highly regulated banking system. (1) Are Risk Asset Correlations Permanently Higher? Correlations among financial assets shifted dramatically during the financial crisis and the after-effects lingered for years. For example, risk assets became more highly correlated, suggesting little differentiation within or across asset classes. Chart II-1 presents a proxy for U.S. equity market correlations, using a sample of current S&P 100 companies. The average correlation was depressed in the 1990s and 2000s relative to the 1980s. It spiked in 2007 and fluctuated at extremely high levels for several years, before moving erratically lower. It has jumped recently and is roughly in the middle of the post-1980s range. Chart II-1Two Factors Driving Correlation
bca.bca_mp_2019_01_01_s2_c1
bca.bca_mp_2019_01_01_s2_c1
Correlations will undoubtedly ebb and flow in the coming years and will spike again in the next recession. But a key question is whether correlations will oscillate around a higher average level than in the 1990s and 2000s. The consensus seems to believe that the underlying level of correlation among risk assets has indeed shifted higher on a structural basis for two main reasons: Market Structure Changes: Many investors point to trading factors such as the increased use of index products (exchange-traded funds for example), and high-frequency/algorithmic trading as likely culprits. Macro “theme” investing has reportedly become more popular and is often implemented through algorithms. The result is an increase in stock market volatility and a tendency for risk-asset prices to move up and down based on momentum because they are all being traded as a group. These factors would likely be evident today even if the financial crisis never happened, but the popularity of algorithm trading may have been encouraged by the fact that the macro backdrop was so uncertain for years after Lehman collapsed. Risk On/Off Trading Environment: Trading has become more binary in nature, due to the sharp rise in policy uncertainty, risk aversion and risk premiums in the aftermath of the Great Recession. Even after the recession ended, the headwinds to growth were formidable and many felt that the sustainability of the recovery hinged largely on the success or failure of unorthodox monetary policies. The general feeling was that either the policies would “work”, the output gap would gradually close and risk assets would perform well, or it would fail and risk assets would be dragged down by a return to recession. Thus, markets traded on an extreme “risk-on/risk-off” basis, as sentiment swung wildly with each new piece of economic and earnings data. While the market structure thesis has merit on the surface, the impact should only be short term in nature. It is difficult to see how a change in the intra-day microstructure of the market could have such a fundamental, wide-ranging and permanent impact on market prices. Previous research suggests that any impact on market correlation beyond the very short term is likely to be small. For the sake of brevity, we won’t present the evidence here, but instead refer readers to two BCA Special Reports.1 The risk on/off trading environment thesis is a more plausible explanation. However, we find it more useful to think about it in terms of the equity risk premium (ERP). A higher ERP causes investors to revalue cash flows from all firms, which, in turn, causes structural shifts in the correlation among stocks. A lower ERP results in less homogenization of the present value of future cash flows, and raises the effect of differentiation among business models. A rise in the ERP could occur for different reasons, but the most obvious are an increase in the perceived riskiness of firms, a shift in investor risk aversion, or both. Shifts in the ERP are sometimes structural in nature, but there is also a strong cyclical element in that persistent equity declines historically have had the effect of temporarily raising the ERP and correlations. A simple model based on the ERP and volatility explains a lot of the historical variation in equity correlation, including the elevated levels observed in the years after 2007 (Chart II-2).2 The shift lower in correlations after 2012 reflects both a lower equity risk premium and a dramatic decline in downside volatility. Chart II-2Simple Model Explains Correlation
Simple Model Explains Correlation
Simple Model Explains Correlation
It is tempting to believe that the lingering shell-shock related to the financial crisis means that the underlying equity risk premium has shifted permanently higher. The ERP is still elevated by historical standards, but this is more reflective of extraordinarily low bond yields than an elevated forward earnings yield. Investors evidently believe that the U.S. and other developed economies are stuck in a “secular stagnation”, which will require low interest rates for many years just to keep economic growth near its trend pace. In other words, the equilibrium interest rate, or R-star, is still very low. The ERP and correlations among risk assets will undoubtedly spike again in the next recession. Nonetheless, in the absence of recession, we expect fears regarding secular stagnation to fade further. If the advanced economies hold up as short-term interest rates and bond yields rise, then concerns that R-star is extremely low will dissipate and expectations regarding equilibrium bond yields will shift higher. The ERP will move lower as bond yields, rather than the earnings yield, do most of the adjustment. The underlying correlations among risk asset prices should correspondingly recede. This includes correlations among a wide variety of risk assets, such as corporate bonds and commodities. While this describes our base case outlook, there is a non-trivial risk that the next recession arrives soon and is deep. This would underscore the view that R-star is indeed very low and the economy needs constant monetary stimulus just to keep it out of recession (i.e. the secular stagnation thesis). The ERP and correlations would stay elevated on average in that scenario. What About The Stock/Bond Correlation? Chart II-3 shows the rolling correlation between monthly changes in the 10-year Treasury bond yield and the S&P 500. The correlation was generally negative between the late-1960s and the early-2000s. Bond yields tended to rise whenever the S&P 500 was falling. Over the past two decades, however, bond yields have generally declined when the stock market has swooned. Chart II-3Structural Shifts In The Stock/Bond Correlation
Structural Shifts In The Stock/Bond Correlation
Structural Shifts In The Stock/Bond Correlation
Inflation expectations can help explain the shift in stock/bond correlation. Expectations became unmoored after 1970, which meant that inflationary shocks became the primary driver of bond yields. Strong growth became associated with rising inflation and inflation expectations, and the view that central banks had fallen behind the curve. Bond yields surged as markets discounted aggressive tightening designed to choke off inflation. And, given that inflation lags the cycle and had a lot of persistence, central banks were not in a position to ease policy at the first hint of a growth slowdown. This was obviously a poor backdrop for stocks. When inflation expectations became well anchored again around the late 1990s, investors no longer feared that central banks would have to aggressively stomp on growth whenever actual inflation edged higher. Central banks also had more latitude to react quickly by cutting rates at the first sign of slower economic growth. Fluctuations in growth became the primary driver of bond yields, allowing stock prices to rise and fall along with yields. The correlation has therefore been positive most of the time since 2003. Bottom Line: A negative correlation between stocks and bond yields reared its ugly head in the last quarter of 2018. The equity correction reflected several factors, but the previous surge in bond yields and hawkish Fed comments appeared to spook markets. Investors became nervous that the fed funds rate had already entered restrictive territory, at a time when the global economy was cooling off. We expect more of these episodes as the Fed normalizes short-term interest rates over the next couple of years. Nonetheless, we see no evidence that inflation expectations have become unmoored. This implies that the stock-bond correlation will generally be positive most of the time over the medium term. In addition, the average level of correlation among risk assets has probably not been permanently raised, although spikes during recessions or growth scares will inevitably occur. (2) Is The Global Financial System Really Safer Today? The roots of the great financial crisis and recession involved a global banking and shadow banking system that encouraged leverage and risk-taking in ways that were hard for investors and regulators to assess. Complex and opaque financial instruments helped to hide risk, at a time when regulators were “asleep at the switch”. In many countries, credit grew at a much faster pace than GDP and capital buffers were dangerously low. Banking sector compensation skewed the system toward short-term gains over long-term sustainable returns. Lax lending standards and a heavy reliance on short-term wholesale markets to fund trading and lending activity contributed to cascading defaults and a complete seizure in parts of the money and fixed income markets. A vital question is whether the financial system is any less vulnerable today to contagion and seizure. The short answer is that the financial system is better prepared for a shock, but the problem is that the number of potential sources of instability have increased since 2007. Since the financial crisis, regulators have been working hard to ensure that the financial crisis never happens again. Reforms have come under four key headings: Capital: Regulators raised the minimum capital requirement for banks, added a buffer requirement, and implemented a surcharge on systemically important banks. Liquidity: Regulators implemented a Liquidity Coverage Ratio (LCR) and a Net Stable Funding Ratio (NSFR) in order to ensure that banks have sufficient short-term funds to avoid liquidity shortages and bank runs.3 Risk Management: Banks are being forced to develop systems to better monitor risk, and are subject to periodic stress tests. Resolution Planning: Banks have also been asked to detail options for resolution that, hopefully, should reduce systemic risk should a major financial institution become insolvent. Global systemically-important banks, in particular, will require sufficient loss-absorbing capacity. A major study by the Bank for International Settlements,4 along with other recent studies, found that systemic risk in the global financial system has diminished markedly as a result of the new regulations. On the whole, banks have improved balance sheet and funding resilience, and have significantly reduced their involvement in complex financial activities. Lending standards have tightened almost across the board relative to pre-crisis levels, particularly for residential mortgages. Additional capital and liquid assets provide a much wider buffer today against adverse shocks, allowing most banks to pass recent stress tests (Chart II-4). Financial institutions have generally re-positioned toward retail and commercial banking and wealth management, and away from more complex and capital-intensive activities (Chart II-5). The median share of trading assets in total assets for individual G-SIBs has declined from around 20% to 12% over 2009-16.
Chart II-4
Chart II-5
Moreover, the propensity for contagion among banks has diminished. The BIS notes that assessing all the complex interactions in the global financial system is extremely difficult. Nonetheless, a positive sign is that banks are focusing more on their home markets since the crisis, and that direct connections between banks through lending and derivatives exposures have declined. The BIS highlights that aggregate foreign bank claims have declined by 16% since the crisis, driven particularly by banks from the advanced economies most affected by the crisis, especially from some European countries (Chart II-6). It is also positive that European banks have made some headway in diminishing over-capacity, although problems still exist in Italy. Finally, and importantly, there has been a distinct shift toward more stable sources of funding, such as deposits, away from fickle wholesale markets (Charts II-7 and II-8). Chart II-6Less Cross Border Lending (Until Recently)
Less Cross Border Lending (Until Recently)
Less Cross Border Lending (Until Recently)
Chart II-7
Chart II-8
Outside of banking, many other regulatory changes have been implemented to make the system safer. One important example is that rules were adjusted to reduce the risk of runs on money market funds. What About Shadow Banking? Of course, more could be done to further indemnify the financial system. Concentration in the global banking system has not diminished, and it appears that the problem of “too big to fail” has not been solved. And then there is the shadow banking sector, which played a major role in the financial crisis by providing banks a way of moving risk to off-balance sheet entities and securities, and thereby hiding the inherent risks. Shadow banking is defined as credit provision that occurs outside of the banking system, but involves the key features of bank lending including leverage, and liquidity and maturity transformation. Complex structured credit securities, such as Collateralized Debt Obligations, allowed this type of transformation to mushroom in ways that were difficult for regulators and investors to understand. A recent study by the Group of Thirty5 concluded that securitization has dropped to a small fraction of its pre-crisis level, and that growing non-bank credit intermediation since the Great Recession has primarily been in forms that do not appear to raise financial stability concerns. Much of the credit creation has been in non-financial corporate bonds, which is a more stable and less risky form of credit extension than bank lending. Other types of lending have increased, such as corporate credit to pension funds and insurance companies, but this does not involve maturity transformation, according to the Group of Thirty. There has been a dramatic decline in the volume of complex structured credit securities such as collateralized debt obligations, asset-backed commercial paper, and structured investment vehicles since 2007 (Chart II-9). While the situation must be monitored, the Group of Thirty study concludes that the financial system in the advanced economies appears to be less vulnerable to bouts of self-reinforcing forced selling, such as occurred during the 2008 crisis. Chart II-9Less Private-Sector Securitization
Less Private-Sector Securitization
Less Private-Sector Securitization
One exception is the U.S. leveraged loan market, which has swelled to $1.13 trillion and about half has been pooled into Collateralized Loan Obligations. As with U.S. high-yield bonds, the situation is fine as long as profitability remains favorable. But in the next recession, lax lending standards today will contribute to painful losses in leveraged loans. The Bad News That’s the good news. The bad news is that, while the financial system might have become less complex and opaque, the level of debt has increased at an alarming rate in both the private and public sectors in many countries. Elevated levels of debt could cause instability in the global financial system, especially as global bond yields return to more normal levels by historical standards. We discuss other pressure points such as Emerging Markets and China in the next section, although the latter deserves a few comments before we leave the subject of shadow banking. The Group of Thirty notes that 30% of Chinese credit is provided by a broad array of poorly regulated shadow banking entities and activities, including trust funds, wealth management products, and “entrusted loans.” Links between these entities and banks are unclear, and sometimes involve informal commitments to provide credit or liquidity support. The study takes some comfort that most of Chinese debt takes place between Chinese domestic state-owned banks and state-owned companies or local government financing vehicles. Foreign investors have limited involvement, thus reducing potential direct contagion outside of China in the event of a financial event. Still, the potential for contagion internationally via global sentiment and/or the economic fallout is high. The other bad news is that, while regulators in the advanced economies have managed to improve the ability of financial institutions to weather shocks, potential risks to the financial system have increased in number and in probability of occurrence. The Global Risk Institute (GRI) recently published a detailed comparison of potential shocks today relative to 2007.7 The report sees twice the number of risks versus 2007 that are identified as “current” (i.e. could occur at any time) and of “high impact”. The most pressing risks today include extreme weather events, asset bubbles, sovereign debt crises, large-scale involuntary migration, water crises and cyber & data attacks. Any of these could trigger a broad financial crisis if the shock is sufficiently intense, despite improved regulation. The GRI study also eventuates how the risks will evolve over the next 11 years. Readers should see the study for details, but it is interesting that the experts foresee cyber dependency rising to the top of the risk pile by 2030. The increase is driven by the importance of data ownership, the increasing role of algorithms and control systems, and the $1.2 trillion projected cost of cyber, data and infrastructure attacks. Our computer systems are not prepared for the advances of technology, such as quantum computing. Climate change moves to the number two risk spot in its base-case outlook. Space limitations precluded a discussion of the rise of populism in this report, but the GRI sees the political tensions related to income inequality as the number three threat to the global financial system by 2030. Bottom Line: Regulators have managed to substantially reduce the amount of hidden risk and the potential for contagion between financial institutions and across countries since 2007. Banks have a larger buffer against stocks. Unfortunately, the number and probability of potential shocks to the financial system appear to have increased since 2007. (3) Implications Of The Global Debt Overhang The End of the Debt Supercycle is a key BCA theme influencing our macro view of the economic and market outlook for the coming years. For several decades, the willingness of both lenders and borrowers to embrace credit was a lubricant for economic growth and rising asset prices and, importantly, underpinned the effectiveness of monetary policy. During times of economic and/or financial stress, it was relatively easy for the Federal Reserve and other central banks to improve the situation by engineering a new credit up-cycle. However, since the 2007-09 meltdown, even zero (or negative) policy rates have been unable to trigger a strong revival in private credit growth in the major developed economies, except in a few cases. The end of the Debt Supercycle has severely impaired the key transmission channel between changes in monetary policy and economic activity. The combination of high debt burdens and economic uncertainty has curbed borrowers’ appetite for credit while increased regulatory pressures and those same uncertainties have made lenders less willing to extend loans. This has severely eroded the effectiveness of lower interest in boosting credit demand and supply, forcing central banks to rely increasingly on manipulating asset prices and exchange rates. On a positive note, the plunge in interest rates has lowered debt servicing costs to historically low levels. Yet, it is the level, rather than the cost, of debt that seems to have been an impediment to the credit cycle, contributing to a lethargic economic expansion. The Bank for International Settlements (BIS) publishes an excellent dataset of credit trends across a broad swath of developing and emerging economies. Some broad conclusions come from an examination of the data (Charts II-10 and II-11):7 Chart II-10Advanced Economies: Some Deleveraging
Advanced Economies: Some Deleveraging
Advanced Economies: Some Deleveraging
Chart II-11EM: Deleveraging Has Not Even Started
EM: Deleveraging Has Not Even Started
EM: Deleveraging Has Not Even Started
Private debt growth has only recently accelerated for the advanced economies as a whole. There are only a handful of developed economies where private debt-to-GDP ratios have moved up meaningfully in the past few years. These are countries that avoided a real estate/banking bust and where property prices have continued to rise (e.g. Canada and Australia). The high level of real estate prices and household debt currently is a major source of concern to the authorities in those few countries. Even where some significant consumer deleveraging has occurred (e.g. the U.S., Spain and Ireland), debt-to-income ratios remain very high by historical standards. In many cases, a stabilization or decline in private debt burdens has been offset by a continued rise in public debt, keeping overall leverage close to peak levels. This is a key legacy of the financial crisis; many governments were forced to offset the loss of demand from private sector deleveraging by running larger and persistent budget deficits. Weak private demand accounts for close to 50% of the rise in public debt on average according to the IMF. Global debt of all types (public and private) has soared from 207% of GDP in 2007 to 246% today. The Debt Supercycle did not end everywhere at the same time. It peaked in Japan more than 20 years ago and has not yet reached a decisive bottom. The 2007-09 meltdown marked the turning point for the U.S. and Europe, but it has not even started in the emerging world. The financial crisis accelerated the accumulation of debt in the latter as investors shifted capital away from the struggling advanced economies to (seemingly less risky) emerging markets. Both EM private- and public-sector debt ratios have continued to move up at an alarming pace. The lesson from Japan is that deleveraging cycles following the bursting of a major credit bubble can last a very long time indeed. One key area where there has been significant deleveraging is the U.S. household sector (Chart II-12). The ratio of household debt to income has fallen below its long-term trend, suggesting that the deleveraging process is well advanced. However, one could argue that the ratio will undershoot the trend for an extended period in a mirror image of the previous overshoot. Or, it may be that the trend has changed; it could now be flat or even down. Chart II-12U.S. Household Deleveraging...
U.S. Household Deleveraging...
U.S. Household Deleveraging...
What is clear is that U.S. attitudes toward saving and spending have changed dramatically since the Great Financial Crisis (GFC) (Chart II-13). Like the Great Depression of the 1930s that turned more than one generation off of debt, the 2008/09 crisis appears to have been a watershed event that marked a structural shift in U.S. consumer attitudes toward credit-financed spending. The Debt Supercycle is over for this sector. Chart II-13...As Attitudes To Debt Change
...As Attitudes To Debt Change
...As Attitudes To Debt Change
Developing Countries: Debt And Economic Fundamentals BCA’s long-held caution on emerging economies and markets is rooted in concern about deteriorating fundamentals. Trade wars and a tightening Fed are negative for EM assets, but the main headwinds facing this asset class are structural. Excessive debt is a ticking time bomb for many of these countries. EM dollar-denominated debt is now as high as it was in the late 1990s as a share of both GDP and exports (Chart II-14). Moreover, the declining long-term growth potential for emerging economies as a group makes it more difficult for them to service the debt. The structural downtrend in EM labor force and productivity growth underscores that trend GDP growth has collapsed over the past three decades (Chart II-14, bottom panel). Chart II-14EM: High Debt And Slow Growth...
EM: High Debt And Slow Growth...
EM: High Debt And Slow Growth...
The 2019 Key Views8 report from our Emerging Markets Strategy team highlights that excessive capital inflows over the past decade have contributed to over-investment and mal-investment. Much of the borrowing was used to fund unprofitable projects, as highlighted by the plunge in productivity growth, profit margins and return on assets in the EM space relative to pre-Lehman levels (Chart II-15) Decelerating global growth in 2018 has exposed these poor fundamentals. Chart II-15...Along With Deteriorating Profitability
...Along With Deteriorating Profitability
...Along With Deteriorating Profitability
As we highlighted in the BCA Outlook 2019, emerging financial markets may enjoy a rally in the second half of 2019 on the back of Chinese policy stimulus. However, this will only represent a ‘sugar high’. The debt overhang in emerging market economies is unlikely to end benignly because a painful period of corporate restructuring, bank recapitalization and structural reforms are required in order to boost productivity and thereby improve these countries’ ability to service their debt mountains. China’s Debt Problem Space limitations preclude a full discussion of the complex debt situation in China and the risks it poses for the global financial system. Waves of stimulus have caused total debt to soar from 140% of GDP in 2008 to 260% of GDP at present (Chart II-16). Since most of the new credit has been used to finance fixed-asset investment, China has ended up with a severe overcapacity problem. The rate of return on assets in the state-owned corporate sector has fallen below borrowing costs (Chart II-17). Chinese banks are currently being told that they must lend more money to support the economy, while ensuring that their loans do not sour. This has become an impossible feat. Chart II-16China's Overinvestment...
China's Overinvestment...
China's Overinvestment...
Chart II-17Has Undermined The Return On Assets
Has Undermined The Return On Assets
Has Undermined The Return On Assets
The previous section highlighted that much of the debt has been created in the opaque shadow banking system, where vast amounts of hidden risk have likely accumulated. Whether or not the central government is willing and/or able to cover a wave of defaults and recapitalize the banking system in the event of a negative shock is hotly debated, both within and outside of BCA. But even if a financial crisis can be avoided, bringing an end to the unsustainable credit boom will undoubtedly have significant consequences for the Chinese economy and the emerging economies that trade with it. Interest Costs To Rise Globally, many are concerned about rising interest costs as interest rates normalize over the coming years. In Appendix Charts II-19 to II-21, we provide interest-cost simulations for selected government, corporate and household sectors under three interest-rate scenarios. The good news is that the starting point for interest rates is still low, and that it takes years for the stock of outstanding debt to adjust to higher market rates. Even if rates rise by another 100 basis points, interest burdens will increase but will generally remain low by historical standards. It would take a surge of 300 basis points across the yield curve to really ‘move the needle’ in terms of interest expense. This does not imply that the global debt situation is sustainable or that a financial crisis can be easily avoided. The next economic downturn will probably not be the direct result of rising interest costs. Nonetheless, elevated government, household and/or corporate leverage has several important long-term negative implications: Limits To Counter-Cyclical Fiscal Policy: Government indebtedness will limit the use of counter-cyclical fiscal policy during the next economic downturn. Chart II-18 highlights that structural budget deficits and government debt levels are higher today compared to previous years that preceded recessions. The risk is especially high for emerging economies and some advanced economies (such as Italy) where investors will be unwilling to lend at a reasonable rate due to default fears. Even in countries where the market still appears willing to lend to the government at a low interest rate, political constraints may limit the room to maneuver as voters and fiscally-conservative politicians revolt against a surge in budget deficits. This will almost certainly be the case in the U.S., where the 2018 tax cuts mean that the federal budget deficit is likely to be around 6% of GDP in the coming years even in the absence of recession. A recession would push it close to a whopping 10%. Even in countries where fiscal stimulus is possible, the end of the Debt Supercycle means that the monetary and fiscal authorities will find it difficult to encourage the private sector to spend and take on more debt.
Chart II-18
Growth Headwinds: The debt situation condemns the global economy to a slower pace of trend growth in part because of weaker capital spending. From one perspective this is a good thing, because spending financed by the excessive use of credit is unsustainable. Still, deleveraging has much further to go at the global level, which means that spending will have to be constrained relative to income growth. The IMF estimates that deleveraging in the private sector for the advanced economies is only a third of historical precedents at this point in the cycle. The IMF also found that debt overhangs have historically been associated with lower GDP growth even in the absence of a financial crisis. Sooner or later, overleveraged sectors have to retrench. Vulnerability To Negative Shocks: If adjustment is postponed, debt reaches levels that make the economy highly vulnerable to negative shocks as defaults rise and lenders demand a higher return or withdraw funding altogether. IMF work shows that economic downturns are more costly in terms of lost GDP when it is driven or accompanied by a financial crisis. This is particularly the case for emerging markets. Bottom Line: Although credit growth has been subdued in most major advanced economies, there has been little deleveraging overall and debt-to-GDP is still rising at the global level. Elevated debt levels are far from benign, even if it appears to be easily financed at the moment. It acts as dead weight on economic activity and makes the world economy vulnerable to negative shocks. It steals growth from the future and, in the event of such a shock, the lack of a fiscal buffer in most countries means that it will be difficult or impossible to provide fiscal relief. The end of the Debt Supercycle means that the monetary and fiscal authorities will find it difficult to encourage the private sector to spend in most cases. For EM, deleveraging has not even started and more financial fireworks seem inevitable in the context of a strong dollar and rising global yields. China may avoid a crisis, but the adjustment to a less credit-driven economy is already proving to be a painful process. Mark McClellan Senior Vice President The Bank Credit Analyst APPENDIX Chart II-19Corporate Interest Cost Scenarios
Corporate Interest Interest Cost Scenarios
Corporate Interest Interest Cost Scenarios
Chart II-20Government Interest Cost Scenarios
Government Interest Cost Scenarios
Government Interest Cost Scenarios
Chart II-21U.S. Household Sector Interest Cost Scenarios
U.S. Household Sector Interest Cost Scenarios
U.S. Household Sector Interest Cost Scenarios
1 Please see BCA U.S. Investment Strategy Special Report "The Bane Of Investors’ Existence: Why Is Correlation High And When Will It Fall?" dated January 4, 2012, available at usis.bcaresearch.com. Also see BCA Global ETF Strategy Special Report "The Passive Menace," dated September 13, 2017, available at etf.bcaresearch.com 2 We use only below average returns in the calculation of volatility (downside volatility) because we are more concerned with the risk of equity market declines for the purposes of this model. 3 The LCR requires a large bank to hold enough high-quality liquid assets to cover the net cash outflows the bank would expect to occur over a 30-day stress scenario. The NSFR complements the LCR by requiring an amount of stable funding that is tailored to the liquidity risk of a bank’s assets and liabilities, based on a one-year time horizon. 4 Structural Changes in Banking After the Crisis. CGFS Papers No.60. Bank for International Settlements, January 2018. 5 Shadow Banking and Capital Markets Risks and Opportunities. Group of Thirty. Washington, D.C., November 2016. 6 Back to the Future: 2007 to 2030. Are New Financial Risks Foreshadowing a Systemic Risk Event? Global Risk Institute. 7 For more details on public and private debt trends, please see BCA Special Report "The End Of The Debt Supercycle: An Update," dated May 11, 2016, available at bca.bcaresearch.com 8 Please see BCA Emerging Markets Strategy Weekly Report "2019 Key Views: Will The EM Lost Decade End With A Bang Or A Whimper?" dated December 6, 2018, available at ems.bcaresearch.com
Highlights Investors ran for cover in December as they succumbed to a litany of worries regarding the outlook. The key question is whether the pessimism is overdone or an extended equity bear market is underway. Our outlook for the U.S. and global economies has not changed since we published our 2019 Outlook. There are some tentative signs that the two U.S. weak spots, housing and capital spending, are bottoming out. However, our global leading economic indicators continue to herald a soft first half of 2019 outside of the U.S. The dollar thus has more upside in the near term. The political risks facing investors have not diminished either. In particular, we expect turbulence related to the U.S./China trade war to extend well beyond the 3-month “truce” period. The returns to stocks, corporate bonds and commodities historically have not been particularly attractive on average when the U.S. yield curve is this flat. Nonetheless, the risk/reward balance has improved enough as prices fell over the past month to justify upgrading equities in the advanced economies back to overweight. Move to a neutral level of cash, and keep bonds underweight on a 6-12 month investment horizon. The upgrade to stocks in the developed markets does not carry over to emerging markets. The backdrop will remain hostile to EM assets until China pulls out the big policy stimulus guns and the dollar peaks. Stay clear of EM assets and neutral on base metals for now, but be prepared to upgrade sometime in 2019. Global government bonds could rally a little more in the near term if the risk-off phase continues. Nonetheless, with little chance of any more rate hikes discounted in the U.S. yield curve, the risks for U.S. and global yields are tilted to the upside. Bond investors with a 6-12 month horizon should ride out the near-term volatility with a short-duration position. Oil prices have overshot to the downside. Supply is adjusting and, given robust energy demand in 2019, we still expect prices to rise to $82. Feature Investors ran for cover in December as they succumbed to concerns regarding the U.S./China trade war, corporate leverage, global growth, rising U.S. interest rates and the shift toward quantitative tightening. Some equity indexes, such as the Russell 2000, reached bear market territory, having lost more than 20%. Losses have been even worse outside the U.S. Earnings revisions have plunged into the “net downgrade” zone. Implied volatility has spiked and corporate bond spreads are surging (Chart I-1). The key question is whether the pessimism is overdone or an extended equity bear market is underway. Chart I-1A Flight To Quality
A Flight To Quality
A Flight To Quality
We laid out our economic view in detail in the BCA Outlook 2019 report, published in late November. Not enough has changed on the global economic front in the three weeks since then that would justify such a violent shift in investor sentiment. That said, our favorite global leading economic indicators continue to erode (Chart I-2). The only ray of hope is that the diffusion index constructed from our Global Leading Economic Indicator appears to have bottomed. Nonetheless, the actual LEI will keep falling until the diffusion index shifts into positive territory. Chart I-2Global Leading Indicators Still Weak
Global Leading Indicators Still Weak Global Leading Indicators Flashing Red
Global Leading Indicators Still Weak Global Leading Indicators Flashing Red
For China, a key source of investor angst, the latest retail sales and industrial production reports reinforced that economic momentum continues to recede. We will not be convinced that growth is bottoming until we see an upturn in our credit impulse indicator (Chart I-3). Its continued decline in November suggests that the outlook for emerging market assets and commodity prices is poor for at least the next quarter. Global industrial output appears headed for a mild contraction. The manufacturing troubles are centered in the emerging Asian economies, but Europe and Japan are also feeling the negative effects. Chart I-3China: No Bottom Yet
China: No Bottom Yet
China: No Bottom Yet
In the U.S., November’s bounce in housing starts and permits is a hopeful sign that the soft patch in this sector is ending. However, it is not clear how the devastating wildfires on the west coast have affected the housing data (Chart I-4). The downdraft in capital goods orders may also be drawing to a close, based on the latest reading from the Fed’s survey of capital spending intentions. The U.S. leading economic indicator dipped slightly in November, but remains consistent with above-trend real GDP growth in the months ahead. Chart I-4U.S.: Some Hopeful Signs
U.S.: Some Hopeful Signs
U.S.: Some Hopeful Signs
The bottom line is that our outlook for growth has not been significantly altered. We see little risk of a U.S. recession in 2019. The global economy continues to weaken, but we expect enough policy stimulus out of China to stabilize growth in that economy in the second half of the year. We highlighted in the BCA Outlook 2019 that, while the risks appeared elevated, we would consider shifting back to overweight in stocks if they cheapened sufficiently. Valuation has indeed improved in recent weeks and sentiment has turned more cautious. Global growth will likely continue to decelerate in the first half of 2019, but markets have largely discounted this outcome. In other words, the shift toward pessimism in financial markets appears overdone. The fact that the Fed has signaled a move away from regular quarter-point rate hikes adds to our confidence in playing what will likely be the last upleg in risk assets in this cycle. Fed: Rate Hikes No Longer On Autopilot The Fed lifted rates by a quarter point in December and signaled that any additional tightening will be data-dependent. The FOMC also trimmed the expected peak in the funds rate and its estimate of the long-run, or neutral, level. Policymakers were likely swayed by some disappointing U.S. economic data, the pullback in core PCE inflation, and the sharp tightening in financial conditions (Chart I-5). Chart I-5Financial Conditions Have Tightened
Financial Conditions Have Tightened
Financial Conditions Have Tightened
Monetary conditions are not tight by historical yardsticks, such as the level of real interest rates. The problem is that investors fear that the neutral level of the fed funds rate, the so-called R-star, remains very depressed. If true, it could mean that the Fed is already outright restrictive, which would signal that the monetary backdrop has turned hostile for risk assets. The OIS curve signals that the consensus believes that the Fed is pretty much done the tightening cycle (Chart I-6) Chart I-6Investors Believe The Fed Is Done!
Investors Believe The Fed Is Done!
Investors Believe The Fed Is Done!
We believe that R-star is higher than the current policy setting and is rising, as the growth headwinds related to the Great Financial Crisis fade with the passage of time. The problem is that nobody knows the level of the neutral rate. Thus, we need to watch for signs that the fed funds rate has surpassed that level, such as an inverted yield curve. The 10-year/3-month T-bill spread is still in positive territory, but barely so. Meanwhile, our R-star indicator is also flashing yellow as it sits on the zero line (Chart I-7). It is a composite of monetary indicators that in the past have been useful in signaling that monetary policy had become outright restrictive, leading to slower growth and trouble for risk assets. The lead time of this indicator relative to economic activity and risk asset prices has been quite variable historically, but a breakdown below zero would send a powerful bearish signal for risk assets if confirmed by an inverted yield curve. Chart I-7Worrying Signs Of Tight Money
Worrying Signs Of Tight Money
Worrying Signs Of Tight Money
The Implications Of Four Fed Scenarios It is not surprising that investors are struggling with a number of different possible scenarios on how the R-star/Fed policy nexus will play out. We can perhaps boil down discussion of the Fed and the implications for financial markets to a matrix of four main outcomes, based on combinations related to the level of R-Star (high or low) and the pace of Fed rate hikes in 2019 (pause or continue increasing rates by 25 basis points per quarter). Policy Mistake #1: R-star is still very low, but policymakers do not realize this and the FOMC continues to tighten into restrictive territory in 2019. By definition, the economy begins to suffer in this scenario, inflation and inflation expectations decline and long-bond yields are flat-to-lower. The yield curve inverts. However, current real rates are still so low that the fed funds rate cannot be very far above R-Star, which means it would represent only a small policy mistake. As long as the Fed recognizes the economic slowdown early enough and truncates the rate hike cycle, then there is a good chance that a recession would be avoided. Investors would initially fear a recession, however, which means that risk assets would be hit hard in absolute terms and relative to bonds and cash until recession fears fade. The direction of the dollar is perhaps trickiest part because there are so many potential cross currents. To keep things simple we will assume that global growth follows our base-case view and remains lackluster in the first half of 2019, followed by a modest re-acceleration. We believe the dollar would likely rally a little as the Fed continues tightening, but then would fall back as the FOMC is forced to turn dovish in the face of a U.S. growth scare. Policy Mistake #2: R-Star is high and rising but the Fed fails to hike rates fast enough to keep up. The economy accelerates in this scenario because monetary policy remains stimulative through 2019, at a time when the 2018 fiscal stimulus will still be providing a demand tailwind. Core PCE inflation moves above 2% and long-term inflation expectations shift up, signaling to investors that the Fed has fallen behind the inflation curve. Risk assets rip for a while and the yield curve bear-steepens as the 10-year Treasury yield moves gradually higher at first. Belatedly, the FOMC realizes it has underestimated the neutral rate and signals a hawkish policy shift. A 50-basis point rate hike at one FOMC meeting causes risk assets to buckle on the back of surging Treasury yields. The yield curve begins to bear-flatten. Eventually the curve inverts and the economy enters recession. The dollar weakens at first because higher inflation lowers U.S. real interest rates relative to the rest of the world. Global growth prospects would initially get a boost from the acceleration in U.S. growth, which is also dollar-bearish. However, in the end the dollar would likely rise as global financial markets turn risk-off. Fed Gets It Right (1): R-star is high and rising. The Fed continues to tighten in line with the increase in the neutral rate. Treasurys sell off hard and the yield curve shifts higher, but remains fairly flat (parallel shift). The curve could mildly invert temporarily, but market worries about a recession eventually recede as economic momentum remains robust, allowing the curve to subsequently trade in the 0-50 basis point range. As discussed below, risk assets tend to outperform Treasurys and cash when the yield curve is in this range, but not by much. The Treasury market would suffer significant losses. This is the most dollar-bullish of the four scenarios, given our global growth view (tepid) and the fact that the market is not even priced for a full quarter-point rate hike in 2019. Fed Gets It Right (2): R-Star is actually still quite low, but the Fed correctly sees recent economic data disappointments and the tightening in financial conditions as signs that policy is close to neutral. The Fed pauses the rate hike cycle, followed by a slower and more data-dependent pace of tightening. The yield curve stays fairly flat and flirts with inversion as investors try to figure out if the Fed has overdone it. Risk assets are volatile and deliver little return over cash. Treasurys rally a bit as the chance of any further rate hikes is priced out of the market, but the rally is limited unless the economy falls into recession (which is not part of this scenario because we are assuming the Fed “gets it right”). The dollar fluctuates, but delivers no real trend since U.S. yield differentials versus the rest of the world do not change much. As we go to press, financial markets are moving in a way that is consistent the Policy Mistake #1; the consensus appears to believe that the Fed has already lifted the fed funds rate too far, causing financial conditions to tighten. But if U.S. real GDP growth remains above-trend as we expect, then the market view could eventually transition to a belief in Mistake #2; the Fed falls behind the inflation curve. The curve would re-steepen and risk assets could have one last hurrah before the Fed gets hawkish again and the 2020 recession arrives. The transition from Mistake #1 to Mistake #2 is essentially our base-case outlook. Nonetheless, obviously the risks around this central scenario are high, especially given how late it is in the U.S. economic and policy cycle. Asset Returns And The Yield Curve Our 2018 late-cycle investing theme focussed on historical asset return and policy dynamics after the U.S. unemployment rate fell below the full-employment level in past cycles. We found that risk assets tend to run into trouble once the U.S. S&P 500 operating margin peaks. As we highlighted in the BCA Outlook 2019, our margin proxies are still not heralding that a peak is at hand. Given the recent investor obsession with the U.S. yield curve, this month we look at historical asset returns at different levels of the 10-year/3-month T-bill yield curve slope: Phase I, when the slope is above 50 basis points; Phase II, when the curve is between 0 and 50 basis points; and Phase III, when the curve is inverted (Table I-1). The data are presented as (not annualized) monthly average returns. It may be surprising that risk asset returns are for the most part positive even in when the curve is inverted. However, keep in mind that we are focussing on the curve, not on recession periods. The curve can be inverted for a long time before the subsequent recession occurs. Risk asset returns often remain positive during this period. The broad conclusions are as follows: Unsurprisingly, risk assets perform their best, in absolute terms and relative to government bonds and cash, in Phase I when the yield curve is steep. Returns tend to deteriorate as the curve flattens. This includes equities, corporate bonds and commodities. Small caps underperform large caps when the curve is between 0 and 50 basis points, but the reverse is true when the curve is flatter or steeper than that range. The ratio of cyclical stocks to defensives has not revealed a consistent pattern with respect to the yield curve, although this may reflect the short historical period available. Value stocks shine versus growth when the curve is inverted. Hedge fund and private equity returns have not varied greatly across the three yield curve environments. Structured product, such as CMBS and ABS, have enjoyed their best performance when the curve is inverted. Timberland and Farmland have also rewarded investors during Phase III. We suspected that asset returns when the curve is in the 0-50 basis point range would vary importantly with the direction of the curve. In Table I-I we split Phase II into two parts: when the curve is steepening after being inverted, and when the curve is flattening after being steep. In other words, when the consensus is either transitioning from quite bullish to very bearish, or vice-versa.
Chart I-
Risk assets such as equities (U.S. and Global) and U.S. investment-grade corporate bonds indeed perform much better in absolute terms when the curve is flat but is steepening rather than flattening. The same is true for U.S. structured product. In terms of excess returns relative to government issues, both U.S. IG and HY corporates have tended to underperform when the curve is in the 0-50 basis point range. Surprisingly, the underperformance is worse when the curve is steepening than when it is flattening. This appears to reflect an anomalous period in early 2006 when the curve was flattening but corporate bonds enjoyed strong excess returns. Emerging market equities show very strong returns in all three curve phases. This reflects the inclusion of the pre-2000 period in the mean calculations, a time when EM equities were much less correlated with U.S. financial conditions. EM equity returns have been significantly lower on average since 2000 when the curve is in the 0-50 basis point range (and especially when the curve is flattening) The bottom line is that risk assets can still reward investors with positive returns during periods when the yield curve is flat. However, it is a dangerous time, especially when the global economy is up to its eyeballs in debt. This month’s Special Report beginning on page 17 argues that, although regulation has made the global financial system more resilient to shocks compared to the pre-Lehman years, the number of potentially destabilizing shocks has increased. Moreover, the trade war and Brexit risks make the investment backdrop all the more precarious. No Quick End To The Trade War The honeymoon following the trade ceasefire between the U.S. and China, agreed at the G20 summit in early December, did not last long. The arrest of the chief financial officer of Chinese telecom maker Huawei and continuing hawkish tweets from the U.S. president dampened hopes that a trade agreement can be negotiated by March. Even news that China intended to cut tariffs on U.S. auto imports did not help much. We highlighted in the BCA Outlook 2019 that negotiations will prove to be protracted and testy. It will take a lot more than some token market-opening action on the part of China to placate the U.S. Our geopolitical team emphasizes that “trade war” is a misnomer for a broader strategic conflict that is centered on the military-industrial balance rather than the trade balance.1 For example, while China is rapidly catching up to the U.S. in research and development spending, it is only spending about half as much as the U.S. relative to its overall economy (Chart I-8). While the U.S. can accept China’s eventually surpassing it in economic output, it cannot accept China’s technological superiority. This would translate into military and strategic supremacy over time. Chart I-8R&D Expenditure By Country
R&D Expenditure By Country
R&D Expenditure By Country
U.S. demands will also be hard for China to swallow. Most importantly, the U.S. is requesting that China rein in its hacking and spying, shift its direct investment to less tech-sensitive sectors, adjust its “Made in China” targets to allow for more foreign competition, and lower foreign investment equity restrictions. These stumbling blocks will make it difficult to strike a deal on trade. We continue to believe that a final trade deal between the U.S. and China will not arrive in the 90-day timeframe of the ceasefire. Thus, global risk assets will be subject to swings in sentiment regarding the likelihood of a trade deal well beyond March. Meanwhile, as previously discussed, Chinese policy stimulus has not yet become aggressive enough to spark animal spirits in the private sector. The Chinese authorities are proceeding cautiously so as to avoid adding significantly to private- and public-sector’s debt mountain. This month’s Special Report also discusses the risks that the surge in debt over the past decade poses for the global financial system, including escalating risk in China’s shadow banking system. Brexit Pain Continues Politics surrounding the torturous Brexit process will also remain a source of volatility for global markets in 2019. Prime Minister May survived a leadership challenge, but this is hardly confidence-inspiring. The question is whether any deal can get through Westminster. The votes appear to be in place for the softest of soft Brexits, the so-called Norway+ option, if May convinces the Labour Party to break ranks. Such a deal would entail Common Market access, but at the cost of having to essentially pay for full EU membership with no ability to influence the regulatory policies that London would have to abide by. The alternative is to call for a new election (which may usher the even less pro-Brexit Labour Party into power), or to delay Brexit for a more substantive period of time, or simply to buckle under the pressure and call for a second referendum. We disagree that the failure of the Tories to endorse May’s proposed agreement means that the “no deal Brexit,” or the “Brexit cliff,” is nigh. Such an outcome is in nobody’s interest and both May and the EU can offer delays to ensure that it does not happen. Whatever happens, one thing is clear; the median voter is turning forcefully towards Bremain (Chart I-9). It will soon become untenable to delay the second referendum. The bottom line is that, while a soft Brexit is the most likely outcome, the path from here to the end result will be punishing. We do not recommend Brexit-related bets on the pound, despite the fact that it is cheap. Chart I-9A Shift Toward Bremain
A Shift Toward Bremain
A Shift Toward Bremain
2019: A Tale Of Two Halves For EM, Commodities And The Dollar One of our key themes in the BCA Outlook 2019 is that the growth divergence between China and the U.S. will persist at least for the first half of 2019. The result will be weak EM asset prices and currencies, little upside for base metals and a strong U.S. dollar. We expect the Chinese authorities will do enough to stabilize growth by mid-year, providing the impetus for a playable bounce in EM and commodity prices in the second half of 2019, coinciding with a peak in the U.S. dollar. Nonetheless, the dollar still has some upside potential in broad trade-weighted terms in the first half of 2019. Our Central Bank Monitors continue to show a greater need for policy tightening in the U.S. than in the rest of the major countries. The dollar has usually strengthened when this has been the case historically. In particular, the ECB’s Central Bank Monitor has slipped back into “easy money required” territory, reflecting moderating economic momentum and still-depressed consumer price inflation (Chart I-10). Chart I-10Our CB Monitors Support A Stronger Dollar
Our CB Monitors Support A Stronger Dollar
Our CB Monitors Support A Stronger Dollar
The ECB announced the well-anticipated end of its asset purchase program in December. The central bank will now focus on forward guidance as its main policy tool outside of setting short-term interest rates. Lending via targeted LTROs will also be considered under certain circumstances. Policymakers retained the latest forward guidance after the December MPC meeting, that rates are on hold “through the summer of 2019”. The latest reading from our ECB Monitor suggests that the central bank could be on hold for longer than that. We expect Eurozone growth to improve somewhat through the year, but we still believe that interest rate differentials will move further in favor of the dollar relative to the euro and the other major currencies. Periods of slow global growth also tend to favor the greenback. The bottom line is that, while a correction is possible in the very near term, investors with at least a six-month horizon should remain long the dollar. Investment Conclusions: Our outlook for the U.S. and global economies has not changed since we published our 2019 Outlook. The risks facing investors have not diminished either, especially given the precarious nature of late-cycle investing and the uncertainty regarding the neutral level of the fed funds rate. Historically, the returns to stocks, corporate bonds and commodities have not been particularly attractive on average when the yield curve is this flat. Nonetheless, we believe that the risk/reward balance has improved enough as prices fell over the past month to justify upgrading equities in the advanced economies to overweight. Move to a neutral level of cash, and keep bonds underweight on a 6-12 month investment horizon. Despite our more positive view on equities, we remain cautious on credit. Spreads have widened recently to more attractive levels, but we remain concerned about the high leverage of U.S. corporates, whose debt/assets ratio is on average higher now than in 2009. Signs of strain are already showing in the junk bond market, with new issuance having largely dried up since early December. If this continues, borrowers may struggle to refinance maturing debt in early 2019. Credit is an asset class that is likely to perform particularly poorly in the next recession. Our upgrade to stocks in the advanced markets does not carry over to emerging markets. The backdrop will remain hostile to EM assets until China pulls out the big policy stimulus guns and the dollar peaks. Stay clear of EM assets and neutral on base metals for now. Global government bonds could rally a little more in the near term if the risk-off phase continues. Nonetheless, with little chance of any more rate hikes discounted in the U.S. yield curve, the risks for U.S. and global yields are tilted to the upside. Bond investors with a 6-12 month horizon should ride out the near-term volatility with a short-duration position. Oil markets are still in the process of re-adjusting to an extraordinary policy reversal by the Trump Administration on its Iranian oil-export sanctions in November, as last-minute waivers were granted to Iran’s largest oil importers. We believe that oil prices have overshot to the downside. Following OPEC 2.0’s decision to cut 1.2mm b/d of production to re-balance markets in the first half of the year, we continue to expect prices to recover on the back of solid global energy demand. Canada also mandated energy firms to trim production. Our energy experts expect oil prices to reach $82/bbl in 2019. We also like gold as long as the fed funds rate remains below its neutral level. Mark McClellan Senior Vice President The Bank Credit Analyst December 21, 2018 Next Report: January 31, 2019 II. (Part II) The Long Shadow Of The Financial Crisis This is the second of a two-part Special Report on the structural changes that have occurred as a result of the Great Recession and financial crisis. We look at three issues: asset correlation, the safety of the financial system, and the level of global debt. First, correlations among financial assets shifted dramatically during the financial crisis and the after-effects lingered for years. Some believe that the underlying level of correlation among risk assets has shifted permanently higher for two main reasons: (1) trading factors such as the increased use of exchange-traded funds and algorithms; and (2) the risk-on/risk-off environment in which trading has become more binary in nature, due to the sharp rise in policy uncertainty, risk aversion and risk premiums in the aftermath of the Great Recession. We have sympathy for the second explanation. The equity risk premium (ERP) was forced higher on a sustained basis by the financial crisis, driven by fears that the advanced economies had entered a ‘secular stagnation’. Elevated correlation among risk assets was a result of a higher-than-normal ERP. The ERP should decline as fears of secular stagnation fade, leading to a lower average level of risk asset correlation than has been the case over the last decade. Second, regulators have been working hard to ensure that the financial crisis never happens again. But is the financial system really any safer today? Undoubtedly, banks have improved balance sheet and funding resilience, and have significantly reduced their involvement in complex financial activities. The propensity for contagion among banks has diminished and there has been a dramatic decline in the volume of complex structured credit securities. The bad news is that the level of global debt has increased at an alarming pace. The third part of this report highlights that elevated levels of debt could cause instability in the global financial system. Choking debt levels boost the vulnerability to negative shocks. The number and probability of potential shocks appear to have increased since 2007, including extreme weather events, sovereign debt crises, large-scale migration, populism, water crises and cyber & data attacks. The lack of a fiscal buffer in most countries means that it will be difficult or impossible to provide any fiscal relief in the event of a negative shock. Moreover, the end of the Debt Supercycle means that the monetary and fiscal authorities will find it difficult to encourage the private sector to spend more in most cases. For EM, deleveraging has not even started and more financial fireworks seem inevitable in the context of a strong dollar and rising global yields. China may avoid a crisis, but the adjustment to a less credit-driven economy is already proving to be a painful process. The Great Recession and Financial Crisis cast a long shadow that will affect economies, policy and financial markets for years to come. Rather than reviewing the roots of the crisis, the first of our two-part series examined the areas where we believe structural change has occurred related to the economy or financial markets. We covered the changing structure of the corporate bond market, the inflation outlook, central bank policymaking and equilibrium bond yields. We highlighted that the financial crisis transformed the corporate bond market in several ways that heighten the risk for quality spreads in the next downturn. We made the case that the prolonged inflation undershoot is sowing the seeds of an overshoot in the coming years, in part related to central bank policymakers that are doomed to fight the last war. Finally, we argued that the forces behind the structural and cyclical bull market in bonds reached an inflection point in 2016/2017. In Part II, we examine the theory that the financial crisis has permanently lifted market correlations among risk assets. Next, we look at whether regulatory changes implemented as a result of the financial crisis have made the global financial system safer. Finally, we highlight the implications of the continued rise in global leverage over the past decade in the context of BCA’s Debt Supercycle theme. The bottom line is that the global financial system still faces substantial risks, despite a more highly regulated banking system. (1) Are Risk Asset Correlations Permanently Higher? Correlations among financial assets shifted dramatically during the financial crisis and the after-effects lingered for years. For example, risk assets became more highly correlated, suggesting little differentiation within or across asset classes. Chart II-1 presents a proxy for U.S. equity market correlations, using a sample of current S&P 100 companies. The average correlation was depressed in the 1990s and 2000s relative to the 1980s. It spiked in 2007 and fluctuated at extremely high levels for several years, before moving erratically lower. It has jumped recently and is roughly in the middle of the post-1980s range. Chart II-1Two Factors Driving Correlation
bca.bca_mp_2019_01_01_s2_c1
bca.bca_mp_2019_01_01_s2_c1
Correlations will undoubtedly ebb and flow in the coming years and will spike again in the next recession. But a key question is whether correlations will oscillate around a higher average level than in the 1990s and 2000s. The consensus seems to believe that the underlying level of correlation among risk assets has indeed shifted higher on a structural basis for two main reasons: Market Structure Changes: Many investors point to trading factors such as the increased use of index products (exchange-traded funds for example), and high-frequency/algorithmic trading as likely culprits. Macro “theme” investing has reportedly become more popular and is often implemented through algorithms. The result is an increase in stock market volatility and a tendency for risk-asset prices to move up and down based on momentum because they are all being traded as a group. These factors would likely be evident today even if the financial crisis never happened, but the popularity of algorithm trading may have been encouraged by the fact that the macro backdrop was so uncertain for years after Lehman collapsed. Risk On/Off Trading Environment: Trading has become more binary in nature, due to the sharp rise in policy uncertainty, risk aversion and risk premiums in the aftermath of the Great Recession. Even after the recession ended, the headwinds to growth were formidable and many felt that the sustainability of the recovery hinged largely on the success or failure of unorthodox monetary policies. The general feeling was that either the policies would “work”, the output gap would gradually close and risk assets would perform well, or it would fail and risk assets would be dragged down by a return to recession. Thus, markets traded on an extreme “risk-on/risk-off” basis, as sentiment swung wildly with each new piece of economic and earnings data. While the market structure thesis has merit on the surface, the impact should only be short term in nature. It is difficult to see how a change in the intra-day microstructure of the market could have such a fundamental, wide-ranging and permanent impact on market prices. Previous research suggests that any impact on market correlation beyond the very short term is likely to be small. For the sake of brevity, we won’t present the evidence here, but instead refer readers to two BCA Special Reports.2 The risk on/off trading environment thesis is a more plausible explanation. However, we find it more useful to think about it in terms of the equity risk premium (ERP). A higher ERP causes investors to revalue cash flows from all firms, which, in turn, causes structural shifts in the correlation among stocks. A lower ERP results in less homogenization of the present value of future cash flows, and raises the effect of differentiation among business models. A rise in the ERP could occur for different reasons, but the most obvious are an increase in the perceived riskiness of firms, a shift in investor risk aversion, or both. Shifts in the ERP are sometimes structural in nature, but there is also a strong cyclical element in that persistent equity declines historically have had the effect of temporarily raising the ERP and correlations. A simple model based on the ERP and volatility explains a lot of the historical variation in equity correlation, including the elevated levels observed in the years after 2007 (Chart II-2).3 The shift lower in correlations after 2012 reflects both a lower equity risk premium and a dramatic decline in downside volatility. Chart II-2Simple Model Explains Correlation
Simple Model Explains Correlation
Simple Model Explains Correlation
It is tempting to believe that the lingering shell-shock related to the financial crisis means that the underlying equity risk premium has shifted permanently higher. The ERP is still elevated by historical standards, but this is more reflective of extraordinarily low bond yields than an elevated forward earnings yield. Investors evidently believe that the U.S. and other developed economies are stuck in a “secular stagnation”, which will require low interest rates for many years just to keep economic growth near its trend pace. In other words, the equilibrium interest rate, or R-star, is still very low. The ERP and correlations among risk assets will undoubtedly spike again in the next recession. Nonetheless, in the absence of recession, we expect fears regarding secular stagnation to fade further. If the advanced economies hold up as short-term interest rates and bond yields rise, then concerns that R-star is extremely low will dissipate and expectations regarding equilibrium bond yields will shift higher. The ERP will move lower as bond yields, rather than the earnings yield, do most of the adjustment. The underlying correlations among risk asset prices should correspondingly recede. This includes correlations among a wide variety of risk assets, such as corporate bonds and commodities. While this describes our base case outlook, there is a non-trivial risk that the next recession arrives soon and is deep. This would underscore the view that R-star is indeed very low and the economy needs constant monetary stimulus just to keep it out of recession (i.e. the secular stagnation thesis). The ERP and correlations would stay elevated on average in that scenario. What About The Stock/Bond Correlation? Chart II-3 shows the rolling correlation between monthly changes in the 10-year Treasury bond yield and the S&P 500. The correlation was generally negative between the late-1960s and the early-2000s. Bond yields tended to rise whenever the S&P 500 was falling. Over the past two decades, however, bond yields have generally declined when the stock market has swooned. Chart II-3Structural Shifts In The Stock/Bond Correlation
Structural Shifts In The Stock/Bond Correlation
Structural Shifts In The Stock/Bond Correlation
Inflation expectations can help explain the shift in stock/bond correlation. Expectations became unmoored after 1970, which meant that inflationary shocks became the primary driver of bond yields. Strong growth became associated with rising inflation and inflation expectations, and the view that central banks had fallen behind the curve. Bond yields surged as markets discounted aggressive tightening designed to choke off inflation. And, given that inflation lags the cycle and had a lot of persistence, central banks were not in a position to ease policy at the first hint of a growth slowdown. This was obviously a poor backdrop for stocks. When inflation expectations became well anchored again around the late 1990s, investors no longer feared that central banks would have to aggressively stomp on growth whenever actual inflation edged higher. Central banks also had more latitude to react quickly by cutting rates at the first sign of slower economic growth. Fluctuations in growth became the primary driver of bond yields, allowing stock prices to rise and fall along with yields. The correlation has therefore been positive most of the time since 2003. Bottom Line: A negative correlation between stocks and bond yields reared its ugly head in the last quarter of 2018. The equity correction reflected several factors, but the previous surge in bond yields and hawkish Fed comments appeared to spook markets. Investors became nervous that the fed funds rate had already entered restrictive territory, at a time when the global economy was cooling off. We expect more of these episodes as the Fed normalizes short-term interest rates over the next couple of years. Nonetheless, we see no evidence that inflation expectations have become unmoored. This implies that the stock-bond correlation will generally be positive most of the time over the medium term. In addition, the average level of correlation among risk assets has probably not been permanently raised, although spikes during recessions or growth scares will inevitably occur. (2) Is The Global Financial System Really Safer Today? The roots of the great financial crisis and recession involved a global banking and shadow banking system that encouraged leverage and risk-taking in ways that were hard for investors and regulators to assess. Complex and opaque financial instruments helped to hide risk, at a time when regulators were “asleep at the switch”. In many countries, credit grew at a much faster pace than GDP and capital buffers were dangerously low. Banking sector compensation skewed the system toward short-term gains over long-term sustainable returns. Lax lending standards and a heavy reliance on short-term wholesale markets to fund trading and lending activity contributed to cascading defaults and a complete seizure in parts of the money and fixed income markets. A vital question is whether the financial system is any less vulnerable today to contagion and seizure. The short answer is that the financial system is better prepared for a shock, but the problem is that the number of potential sources of instability have increased since 2007. Since the financial crisis, regulators have been working hard to ensure that the financial crisis never happens again. Reforms have come under four key headings: Capital: Regulators raised the minimum capital requirement for banks, added a buffer requirement, and implemented a surcharge on systemically important banks. Liquidity: Regulators implemented a Liquidity Coverage Ratio (LCR) and a Net Stable Funding Ratio (NSFR) in order to ensure that banks have sufficient short-term funds to avoid liquidity shortages and bank runs.4 Risk Management: Banks are being forced to develop systems to better monitor risk, and are subject to periodic stress tests. Resolution Planning: Banks have also been asked to detail options for resolution that, hopefully, should reduce systemic risk should a major financial institution become insolvent. Global systemically-important banks, in particular, will require sufficient loss-absorbing capacity. A major study by the Bank for International Settlements,5 along with other recent studies, found that systemic risk in the global financial system has diminished markedly as a result of the new regulations. On the whole, banks have improved balance sheet and funding resilience, and have significantly reduced their involvement in complex financial activities. Lending standards have tightened almost across the board relative to pre-crisis levels, particularly for residential mortgages. Additional capital and liquid assets provide a much wider buffer today against adverse shocks, allowing most banks to pass recent stress tests (Chart II-4). Financial institutions have generally re-positioned toward retail and commercial banking and wealth management, and away from more complex and capital-intensive activities (Chart II-5). The median share of trading assets in total assets for individual G-SIBs has declined from around 20% to 12% over 2009-16.
Chart II-4
Chart II-5
Moreover, the propensity for contagion among banks has diminished. The BIS notes that assessing all the complex interactions in the global financial system is extremely difficult. Nonetheless, a positive sign is that banks are focusing more on their home markets since the crisis, and that direct connections between banks through lending and derivatives exposures have declined. The BIS highlights that aggregate foreign bank claims have declined by 16% since the crisis, driven particularly by banks from the advanced economies most affected by the crisis, especially from some European countries (Chart II-6). It is also positive that European banks have made some headway in diminishing over-capacity, although problems still exist in Italy. Finally, and importantly, there has been a distinct shift toward more stable sources of funding, such as deposits, away from fickle wholesale markets (Charts II-7 and II-8). Chart II-6Less Cross Border Lending (Until Recently)
Less Cross Border Lending (Until Recently)
Less Cross Border Lending (Until Recently)
Chart II-7
Chart II-8
Outside of banking, many other regulatory changes have been implemented to make the system safer. One important example is that rules were adjusted to reduce the risk of runs on money market funds. What About Shadow Banking? Of course, more could be done to further indemnify the financial system. Concentration in the global banking system has not diminished, and it appears that the problem of “too big to fail” has not been solved. And then there is the shadow banking sector, which played a major role in the financial crisis by providing banks a way of moving risk to off-balance sheet entities and securities, and thereby hiding the inherent risks. Shadow banking is defined as credit provision that occurs outside of the banking system, but involves the key features of bank lending including leverage, and liquidity and maturity transformation. Complex structured credit securities, such as Collateralized Debt Obligations, allowed this type of transformation to mushroom in ways that were difficult for regulators and investors to understand. A recent study by the Group of Thirty6 concluded that securitization has dropped to a small fraction of its pre-crisis level, and that growing non-bank credit intermediation since the Great Recession has primarily been in forms that do not appear to raise financial stability concerns. Much of the credit creation has been in non-financial corporate bonds, which is a more stable and less risky form of credit extension than bank lending. Other types of lending have increased, such as corporate credit to pension funds and insurance companies, but this does not involve maturity transformation, according to the Group of Thirty. There has been a dramatic decline in the volume of complex structured credit securities such as collateralized debt obligations, asset-backed commercial paper, and structured investment vehicles since 2007 (Chart II-9). While the situation must be monitored, the Group of Thirty study concludes that the financial system in the advanced economies appears to be less vulnerable to bouts of self-reinforcing forced selling, such as occurred during the 2008 crisis. Chart II-9Less Private-Sector Securitization
Less Private-Sector Securitization
Less Private-Sector Securitization
One exception is the U.S. leveraged loan market, which has swelled to $1.13 trillion and about half has been pooled into Collateralized Loan Obligations. As with U.S. high-yield bonds, the situation is fine as long as profitability remains favorable. But in the next recession, lax lending standards today will contribute to painful losses in leveraged loans. The Bad News That’s the good news. The bad news is that, while the financial system might have become less complex and opaque, the level of debt has increased at an alarming rate in both the private and public sectors in many countries. Elevated levels of debt could cause instability in the global financial system, especially as global bond yields return to more normal levels by historical standards. We discuss other pressure points such as Emerging Markets and China in the next section, although the latter deserves a few comments before we leave the subject of shadow banking. The Group of Thirty notes that 30% of Chinese credit is provided by a broad array of poorly regulated shadow banking entities and activities, including trust funds, wealth management products, and “entrusted loans.” Links between these entities and banks are unclear, and sometimes involve informal commitments to provide credit or liquidity support. The study takes some comfort that most of Chinese debt takes place between Chinese domestic state-owned banks and state-owned companies or local government financing vehicles. Foreign investors have limited involvement, thus reducing potential direct contagion outside of China in the event of a financial event. Still, the potential for contagion internationally via global sentiment and/or the economic fallout is high. The other bad news is that, while regulators in the advanced economies have managed to improve the ability of financial institutions to weather shocks, potential risks to the financial system have increased in number and in probability of occurrence. The Global Risk Institute (GRI) recently published a detailed comparison of potential shocks today relative to 2007.7 The report sees twice the number of risks versus 2007 that are identified as “current” (i.e. could occur at any time) and of “high impact”. The most pressing risks today include extreme weather events, asset bubbles, sovereign debt crises, large-scale involuntary migration, water crises and cyber & data attacks. Any of these could trigger a broad financial crisis if the shock is sufficiently intense, despite improved regulation. The GRI study also eventuates how the risks will evolve over the next 11 years. Readers should see the study for details, but it is interesting that the experts foresee cyber dependency rising to the top of the risk pile by 2030. The increase is driven by the importance of data ownership, the increasing role of algorithms and control systems, and the $1.2 trillion projected cost of cyber, data and infrastructure attacks. Our computer systems are not prepared for the advances of technology, such as quantum computing. Climate change moves to the number two risk spot in its base-case outlook. Space limitations precluded a discussion of the rise of populism in this report, but the GRI sees the political tensions related to income inequality as the number three threat to the global financial system by 2030. Bottom Line: Regulators have managed to substantially reduce the amount of hidden risk and the potential for contagion between financial institutions and across countries since 2007. Banks have a larger buffer against stocks. Unfortunately, the number and probability of potential shocks to the financial system appear to have increased since 2007. (3) Implications Of The Global Debt Overhang The End of the Debt Supercycle is a key BCA theme influencing our macro view of the economic and market outlook for the coming years. For several decades, the willingness of both lenders and borrowers to embrace credit was a lubricant for economic growth and rising asset prices and, importantly, underpinned the effectiveness of monetary policy. During times of economic and/or financial stress, it was relatively easy for the Federal Reserve and other central banks to improve the situation by engineering a new credit up-cycle. However, since the 2007-09 meltdown, even zero (or negative) policy rates have been unable to trigger a strong revival in private credit growth in the major developed economies, except in a few cases. The end of the Debt Supercycle has severely impaired the key transmission channel between changes in monetary policy and economic activity. The combination of high debt burdens and economic uncertainty has curbed borrowers’ appetite for credit while increased regulatory pressures and those same uncertainties have made lenders less willing to extend loans. This has severely eroded the effectiveness of lower interest in boosting credit demand and supply, forcing central banks to rely increasingly on manipulating asset prices and exchange rates. On a positive note, the plunge in interest rates has lowered debt servicing costs to historically low levels. Yet, it is the level, rather than the cost, of debt that seems to have been an impediment to the credit cycle, contributing to a lethargic economic expansion. The Bank for International Settlements (BIS) publishes an excellent dataset of credit trends across a broad swath of developing and emerging economies. Some broad conclusions come from an examination of the data (Charts II-10 and II-11):8 Chart II-10Advanced Economies: Some Deleveraging
Advanced Economies: Some Deleveraging
Advanced Economies: Some Deleveraging
Chart II-11EM: Deleveraging Has Not Even Started
EM: Deleveraging Has Not Even Started
EM: Deleveraging Has Not Even Started
Private debt growth has only recently accelerated for the advanced economies as a whole. There are only a handful of developed economies where private debt-to-GDP ratios have moved up meaningfully in the past few years. These are countries that avoided a real estate/banking bust and where property prices have continued to rise (e.g. Canada and Australia). The high level of real estate prices and household debt currently is a major source of concern to the authorities in those few countries. Even where some significant consumer deleveraging has occurred (e.g. the U.S., Spain and Ireland), debt-to-income ratios remain very high by historical standards. In many cases, a stabilization or decline in private debt burdens has been offset by a continued rise in public debt, keeping overall leverage close to peak levels. This is a key legacy of the financial crisis; many governments were forced to offset the loss of demand from private sector deleveraging by running larger and persistent budget deficits. Weak private demand accounts for close to 50% of the rise in public debt on average according to the IMF. Global debt of all types (public and private) has soared from 207% of GDP in 2007 to 246% today. The Debt Supercycle did not end everywhere at the same time. It peaked in Japan more than 20 years ago and has not yet reached a decisive bottom. The 2007-09 meltdown marked the turning point for the U.S. and Europe, but it has not even started in the emerging world. The financial crisis accelerated the accumulation of debt in the latter as investors shifted capital away from the struggling advanced economies to (seemingly less risky) emerging markets. Both EM private- and public-sector debt ratios have continued to move up at an alarming pace. The lesson from Japan is that deleveraging cycles following the bursting of a major credit bubble can last a very long time indeed. One key area where there has been significant deleveraging is the U.S. household sector (Chart II-12). The ratio of household debt to income has fallen below its long-term trend, suggesting that the deleveraging process is well advanced. However, one could argue that the ratio will undershoot the trend for an extended period in a mirror image of the previous overshoot. Or, it may be that the trend has changed; it could now be flat or even down. Chart II-12U.S. Household Deleveraging...
U.S. Household Deleveraging...
U.S. Household Deleveraging...
What is clear is that U.S. attitudes toward saving and spending have changed dramatically since the Great Financial Crisis (GFC) (Chart II-13). Like the Great Depression of the 1930s that turned more than one generation off of debt, the 2008/09 crisis appears to have been a watershed event that marked a structural shift in U.S. consumer attitudes toward credit-financed spending. The Debt Supercycle is over for this sector. Chart II-13...As Attitudes To Debt Change
...As Attitudes To Debt Change
...As Attitudes To Debt Change
Developing Countries: Debt And Economic Fundamentals BCA’s long-held caution on emerging economies and markets is rooted in concern about deteriorating fundamentals. Trade wars and a tightening Fed are negative for EM assets, but the main headwinds facing this asset class are structural. Excessive debt is a ticking time bomb for many of these countries. EM dollar-denominated debt is now as high as it was in the late 1990s as a share of both GDP and exports (Chart II-14). Moreover, the declining long-term growth potential for emerging economies as a group makes it more difficult for them to service the debt. The structural downtrend in EM labor force and productivity growth underscores that trend GDP growth has collapsed over the past three decades (Chart II-14, bottom panel). Chart II-14EM: High Debt And Slow Growth...
EM: High Debt And Slow Growth...
EM: High Debt And Slow Growth...
The 2019 Key Views9 report from our Emerging Markets Strategy team highlights that excessive capital inflows over the past decade have contributed to over-investment and mal-investment. Much of the borrowing was used to fund unprofitable projects, as highlighted by the plunge in productivity growth, profit margins and return on assets in the EM space relative to pre-Lehman levels (Chart II-15) Decelerating global growth in 2018 has exposed these poor fundamentals. Chart II-15...Along With Deteriorating Profitability
...Along With Deteriorating Profitability
...Along With Deteriorating Profitability
As we highlighted in the BCA Outlook 2019, emerging financial markets may enjoy a rally in the second half of 2019 on the back of Chinese policy stimulus. However, this will only represent a ‘sugar high’. The debt overhang in emerging market economies is unlikely to end benignly because a painful period of corporate restructuring, bank recapitalization and structural reforms are required in order to boost productivity and thereby improve these countries’ ability to service their debt mountains. China’s Debt Problem Space limitations preclude a full discussion of the complex debt situation in China and the risks it poses for the global financial system. Waves of stimulus have caused total debt to soar from 140% of GDP in 2008 to 260% of GDP at present (Chart II-16). Since most of the new credit has been used to finance fixed-asset investment, China has ended up with a severe overcapacity problem. The rate of return on assets in the state-owned corporate sector has fallen below borrowing costs (Chart II-17). Chinese banks are currently being told that they must lend more money to support the economy, while ensuring that their loans do not sour. This has become an impossible feat. Chart II-16China's Overinvestment...
China's Overinvestment...
China's Overinvestment...
Chart II-17Has Undermined The Return On Assets
Has Undermined The Return On Assets
Has Undermined The Return On Assets
The previous section highlighted that much of the debt has been created in the opaque shadow banking system, where vast amounts of hidden risk have likely accumulated. Whether or not the central government is willing and/or able to cover a wave of defaults and recapitalize the banking system in the event of a negative shock is hotly debated, both within and outside of BCA. But even if a financial crisis can be avoided, bringing an end to the unsustainable credit boom will undoubtedly have significant consequences for the Chinese economy and the emerging economies that trade with it. Interest Costs To Rise Globally, many are concerned about rising interest costs as interest rates normalize over the coming years. In Appendix Charts II-19 to II-21, we provide interest-cost simulations for selected government, corporate and household sectors under three interest-rate scenarios. The good news is that the starting point for interest rates is still low, and that it takes years for the stock of outstanding debt to adjust to higher market rates. Even if rates rise by another 100 basis points, interest burdens will increase but will generally remain low by historical standards. It would take a surge of 300 basis points across the yield curve to really ‘move the needle’ in terms of interest expense. This does not imply that the global debt situation is sustainable or that a financial crisis can be easily avoided. The next economic downturn will probably not be the direct result of rising interest costs. Nonetheless, elevated government, household and/or corporate leverage has several important long-term negative implications: Limits To Counter-Cyclical Fiscal Policy: Government indebtedness will limit the use of counter-cyclical fiscal policy during the next economic downturn. Chart II-18 highlights that structural budget deficits and government debt levels are higher today compared to previous years that preceded recessions. The risk is especially high for emerging economies and some advanced economies (such as Italy) where investors will be unwilling to lend at a reasonable rate due to default fears. Even in countries where the market still appears willing to lend to the government at a low interest rate, political constraints may limit the room to maneuver as voters and fiscally-conservative politicians revolt against a surge in budget deficits. This will almost certainly be the case in the U.S., where the 2018 tax cuts mean that the federal budget deficit is likely to be around 6% of GDP in the coming years even in the absence of recession. A recession would push it close to a whopping 10%. Even in countries where fiscal stimulus is possible, the end of the Debt Supercycle means that the monetary and fiscal authorities will find it difficult to encourage the private sector to spend and take on more debt.
Chart II-18
Growth Headwinds: The debt situation condemns the global economy to a slower pace of trend growth in part because of weaker capital spending. From one perspective this is a good thing, because spending financed by the excessive use of credit is unsustainable. Still, deleveraging has much further to go at the global level, which means that spending will have to be constrained relative to income growth. The IMF estimates that deleveraging in the private sector for the advanced economies is only a third of historical precedents at this point in the cycle. The IMF also found that debt overhangs have historically been associated with lower GDP growth even in the absence of a financial crisis. Sooner or later, overleveraged sectors have to retrench. Vulnerability To Negative Shocks: If adjustment is postponed, debt reaches levels that make the economy highly vulnerable to negative shocks as defaults rise and lenders demand a higher return or withdraw funding altogether. IMF work shows that economic downturns are more costly in terms of lost GDP when it is driven or accompanied by a financial crisis. This is particularly the case for emerging markets. Bottom Line: Although credit growth has been subdued in most major advanced economies, there has been little deleveraging overall and debt-to-GDP is still rising at the global level. Elevated debt levels are far from benign, even if it appears to be easily financed at the moment. It acts as dead weight on economic activity and makes the world economy vulnerable to negative shocks. It steals growth from the future and, in the event of such a shock, the lack of a fiscal buffer in most countries means that it will be difficult or impossible to provide fiscal relief. The end of the Debt Supercycle means that the monetary and fiscal authorities will find it difficult to encourage the private sector to spend in most cases. For EM, deleveraging has not even started and more financial fireworks seem inevitable in the context of a strong dollar and rising global yields. China may avoid a crisis, but the adjustment to a less credit-driven economy is already proving to be a painful process. Mark McClellan Senior Vice President The Bank Credit Analyst APPENDIX Chart II-19Corporate Interest Cost Scenarios
Corporate Interest Interest Cost Scenarios
Corporate Interest Interest Cost Scenarios
Chart II-20Government Interest Cost Scenarios
Government Interest Cost Scenarios
Government Interest Cost Scenarios
Chart II-21U.S. Household Sector Interest Cost Scenarios
U.S. Household Sector Interest Cost Scenarios
U.S. Household Sector Interest Cost Scenarios
III. Indicators And Reference Charts Our tactical upgrade of equities to overweight this month goes against most of our proprietary indicators. Our Willingness-to-Pay (WTP) indicators for the U.S., Japan and Europe are all heading lower. The WTP indicators track flows, and thus provide information on what investors are actually doing, as opposed to sentiment indexes that track how investors are feeling. Investors are clearly moving funds away from the equity market at the moment. Our Revealed Preference Indicator (RPI) for stocks continues to issue a ‘sell’ signal. The RPI combines the idea of market momentum with valuation and policy measures. It provides a powerful bullish signal if positive market momentum lines up with constructive signals from the policy and valuation measures. Conversely, if constructive market momentum is not supported by valuation and policy, investors should lean against the market trend. Momentum remains out of sync with valuation and policy, supporting the view that caution is still warranted. The U.S. net earnings revisions ratio has dropped into negative territory. The earnings surprises index has also declined, although it remains above 60%. Finally, our Composite Technical Equity Indicator has broken below the zero line and its 9-month exponential moving average, sending a negative technical signal. On the positive side, our Monetary Indicator has hooked up, although it is still in negative territory for equities. From a contrary perspective, the fact that equity sentiment has turned bearish is positive for stocks. In fact, this is the main reason why we upgraded stocks this month. While it is late in the U.S. economic expansion and the Fed is tightening, sentiment regarding U.S. and global growth has become overly pessimistic. Thus, we are playing a late-cycle bounce in stocks. For bonds, the term premium moved further into negative territory in December, which is unsustainable from a long-term perspective. Long-term inflation expectations are also too low to be consistent with the Fed meeting its 2% target over the medium term. These facts suggest that bond yields have not peaked for the cycle, although at the moment they have not yet worked off oversold conditions according to our technical indicator. The U.S. dollar is overbought and very expensive on a PPP basis. Nonetheless, we believe it will become more expensive in the first half of 2019, before its structural downtrend resumes in broad trade-weighted terms. EQUITIES: Chart III-1U.S. Equity Indicators
U.S. Equity Indicators
U.S. Equity Indicators
Chart III-2Willingness To Pay For Risk
Willingness To Pay For Risk
Willingness To Pay For Risk
Chart III-3U.S. Equity Sentiment Indicators
U.S. Equity Sentiment Indicators
U.S. Equity Sentiment Indicators
Chart III-4Revealed Preference Indicator
Revealed Preference Indicator
Revealed Preference Indicator
Chart III-5U.S. Stock Market Valuation
U.S. Stock Market Valuation
U.S. Stock Market Valuation
Chart III-6U.S. Earnings
U.S. Earnings
U.S. Earnings
Chart III-7Global Stock Market And Earnings: Relative Performance
Global Stock Market And Earnings: Relative Performance
Global Stock Market And Earnings: Relative Performance
Chart III-8Global Stock Market And Earnings: Relative Performance
Global Stock Market And Earnings: Relative Performance
Global Stock Market And Earnings: Relative Performance
FIXED INCOME: Chart III-9U.S. Treasurys And Valuations
U.S. Treasurys And Valuations
U.S. Treasurys And Valuations
Chart III-10Yield Curve Slopes
Yield Curve Slopes
Yield Curve Slopes
Chart III-11Selected U.S. Bond Yields
Selected U.S. Bond Yields
Selected U.S. Bond Yields
Chart III-1210-Year Treasury Yield Components
10-Year Treasury Yield Components
10-Year Treasury Yield Components
Chart III-13U.S. Corporate Bonds And Health Monitor
U.S. Corporate Bonds And Health Monitor
U.S. Corporate Bonds And Health Monitor
Chart III-14Global Bonds: Developed Markets
Global Bonds: Developed Markets
Global Bonds: Developed Markets
Chart III-15Global Bonds: Emerging Markets
Global Bonds: Emerging Markets
Global Bonds: Emerging Markets
CURRENCIES: Chart III-16U.S. Dollar And PPP
U.S. Dollar And PPP
U.S. Dollar And PPP
Chart III-17U.S. Dollar And Indicator
U.S. Dollar And Indicator
U.S. Dollar And Indicator
Chart III-18U.S. Dollar Fundamentals
U.S. Dollar Fundamentals
U.S. Dollar Fundamentals
Chart III-19Japanese Yen Technicals
Japanese Yen Technicals
Japanese Yen Technicals
Chart III-20Euro Technicals
Euro Technicals
Euro Technicals
Chart III-21Euro/Yen Technicals
Euro/Yen Technicals
Euro/Yen Technicals
Chart III-22Euro/Pound Technicals
Euro/Pound Technicals
Euro/Pound Technicals
COMMODITIES: Chart III-23Broad Commodity Indicators
Broad Commodity Indicators
Broad Commodity Indicators
Chart III-24Commodity Prices
Commodity Prices
Commodity Prices
Chart III-25Commodity Prices
Commodity Prices
Commodity Prices
Chart III-26Commodity Sentiment
Commodity Sentiment
Commodity Sentiment
Chart III-27Speculative Positioning
Speculative Positioning
Speculative Positioning
ECONOMY: Chart III-28U.S. And Global Macro Backdrop
U.S. And Global Macro Backdrop
U.S. And Global Macro Backdrop
Chart III-29U.S. Macro Snapshot
U.S. Macro Snapshot
U.S. Macro Snapshot
Chart III-30U.S. Growth Outlook
U.S. Growth Outlook
U.S. Growth Outlook
Chart III-31U.S. Cyclical Spending
U.S. Cyclical Spending
U.S. Cyclical Spending
Chart III-32U.S. Labor Market
U.S. Labor Market
U.S. Labor Market
Chart III-33U.S. Consumption
U.S. Consumption
U.S. Consumption
Chart III-34U.S. Housing
U.S. Housing
U.S. Housing
Chart III-35U.S. Debt And Deleveraging
U.S. Debt And Deleveraging
U.S. Debt And Deleveraging
Chart III-36U.S. Financial Conditions
U.S. Financial Conditions
U.S. Financial Conditions
Chart III-37Global Economic Snapshot: Europe
Global Economic Snapshot: Europe
Global Economic Snapshot: Europe
Chart III-38Global Economic Snapshot: China
Global Economic Snapshot: China
Global Economic Snapshot: China
Mark McClellan Senior Vice President The Bank Credit Analyst 1 For more details, please see BCA Geopolitical Strategy Special Report "U.S.-China: The Tech War And Reform Agenda," dated December 12, 2018, available at gps.bcaresearch.com 2 Please see BCA U.S. Investment Strategy Special Report "The Bane Of Investors’ Existence: Why Is Correlation High And When Will It Fall?" dated January 4, 2012, available at usis.bcaresearch.com. Also see BCA Global ETF Strategy Special Report "The Passive Menace," dated September 13, 2017, available at etf.bcaresearch.com 3 We use only below average returns in the calculation of volatility (downside volatility) because we are more concerned with the risk of equity market declines for the purposes of this model. 4 The LCR requires a large bank to hold enough high-quality liquid assets to cover the net cash outflows the bank would expect to occur over a 30-day stress scenario. The NSFR complements the LCR by requiring an amount of stable funding that is tailored to the liquidity risk of a bank’s assets and liabilities, based on a one-year time horizon. 5 Structural Changes in Banking After the Crisis. CGFS Papers No.60. Bank for International Settlements, January 2018. 6 Shadow Banking and Capital Markets Risks and Opportunities. Group of Thirty. Washington, D.C., November 2016. 7 Back to the Future: 2007 to 2030. Are New Financial Risks Foreshadowing a Systemic Risk Event? Global Risk Institute. 8 For more details on public and private debt trends, please see BCA Special Report "The End Of The Debt Supercycle: An Update," dated May 11, 2016, available at bca.bcaresearch.com 9 Please see BCA Emerging Markets Strategy Weekly Report "2019 Key Views: Will The EM Lost Decade End With A Bang Or A Whimper?" dated December 6, 2018, available at ems.bcaresearch.com EQUITIES:FIXED INCOME:CURRENCIES:COMMODITIES:ECONOMY:
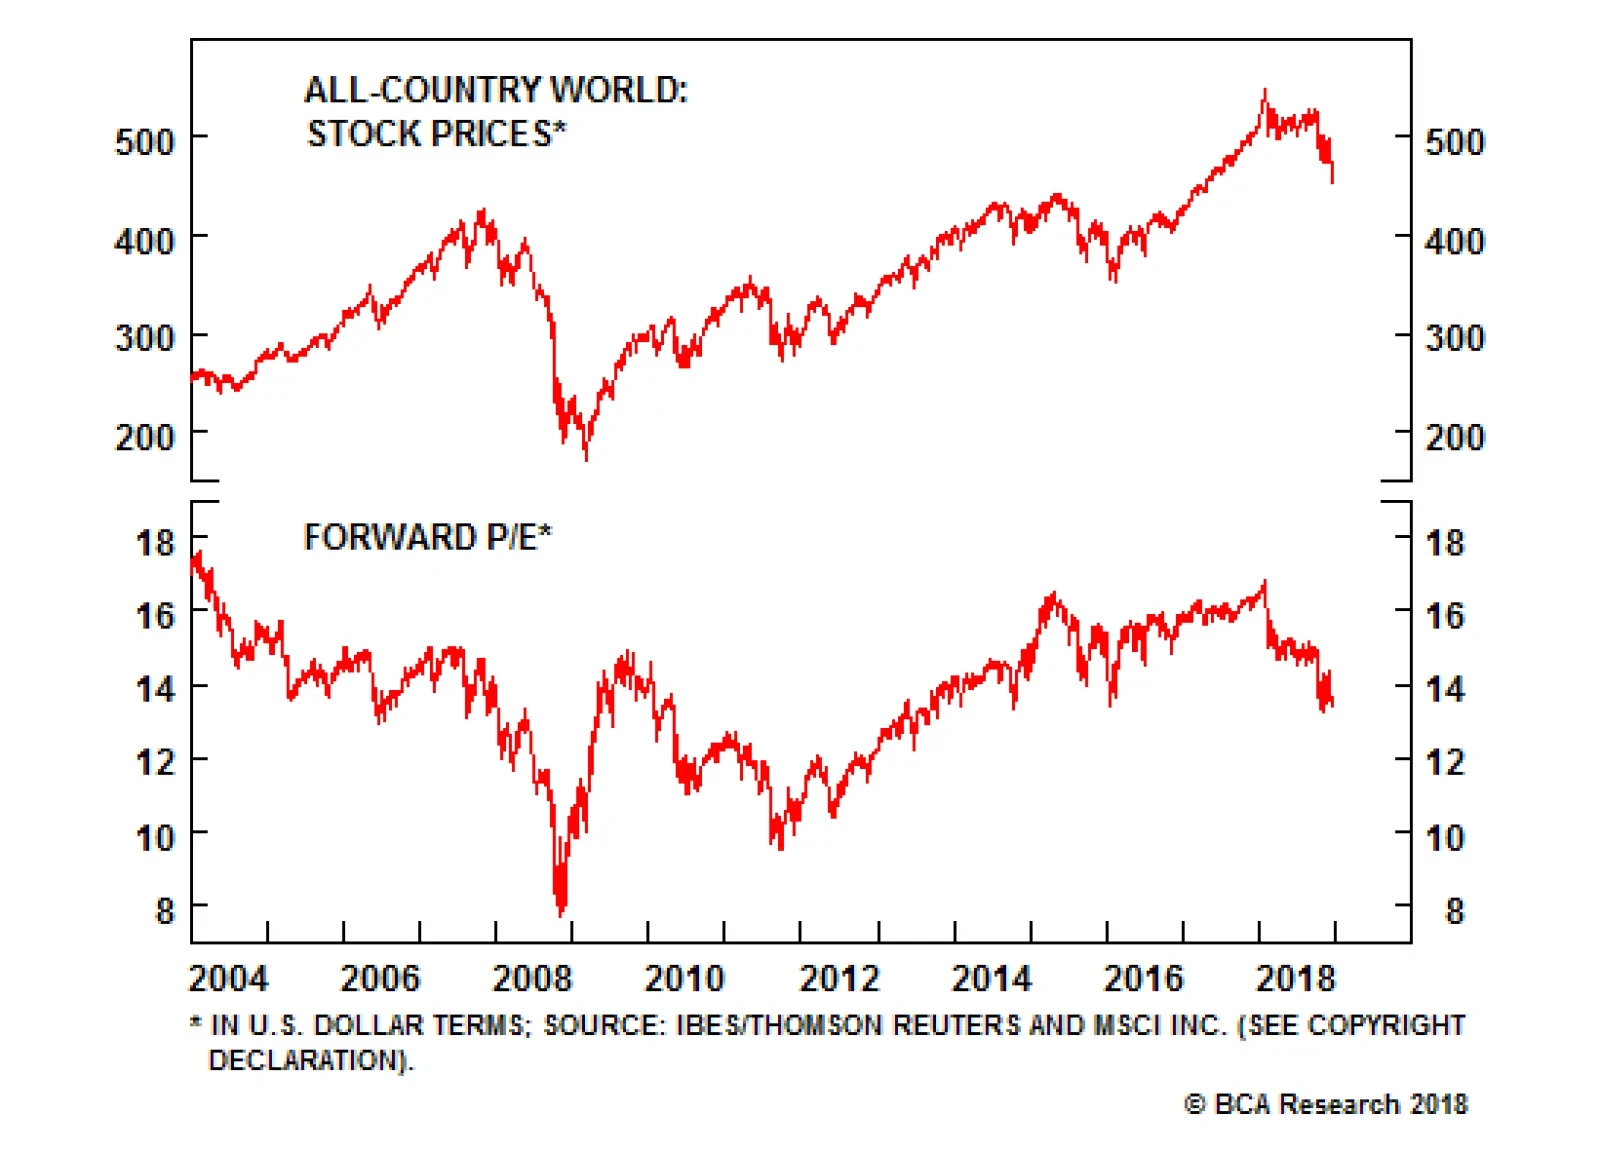
We downgraded global equities during the summer based on lofty valuations, overly bullish sentiment, and the prospect of slowing global growth. Since then, valuations have improved and sentiment has turned more cautious. Global growth will continue to…
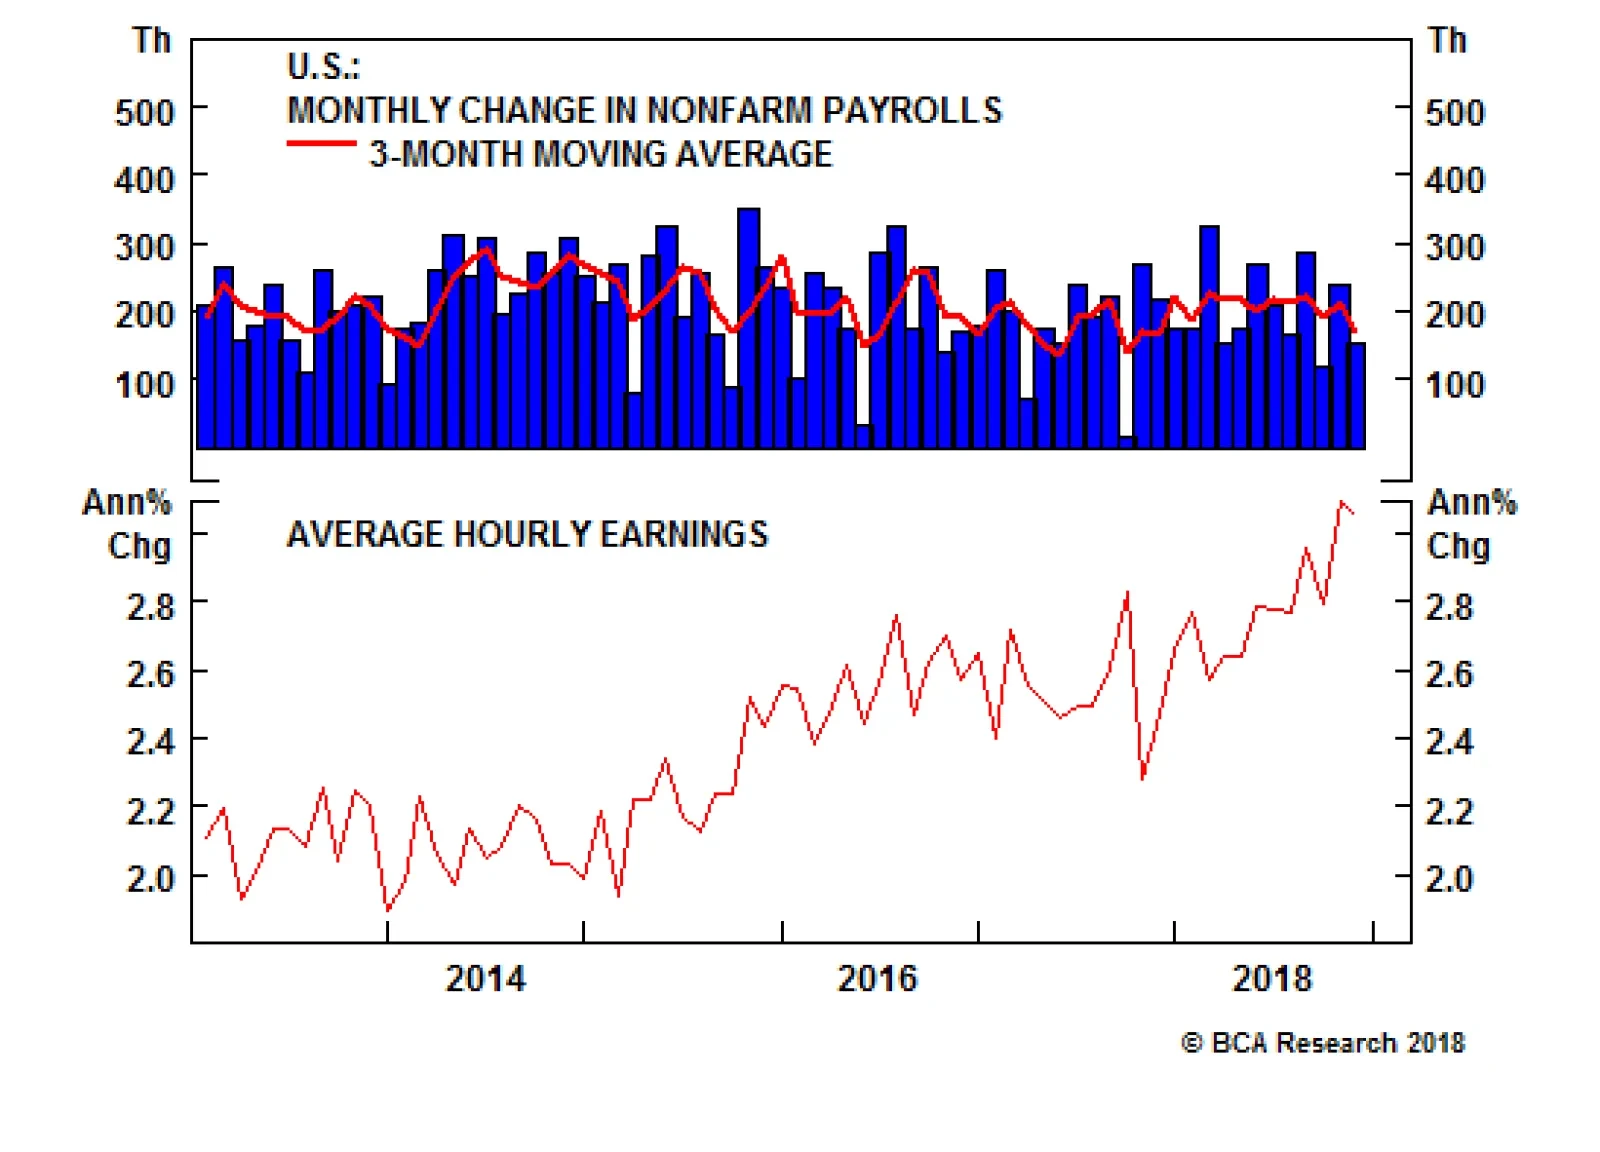
The next two weeks will be fairly quiet due to the holidays. In the U.S., new and pending home sales are released on December 27 and December 28. The main U.S. event will be December's employment report on January 4. Investors will be looking to payrolls for…
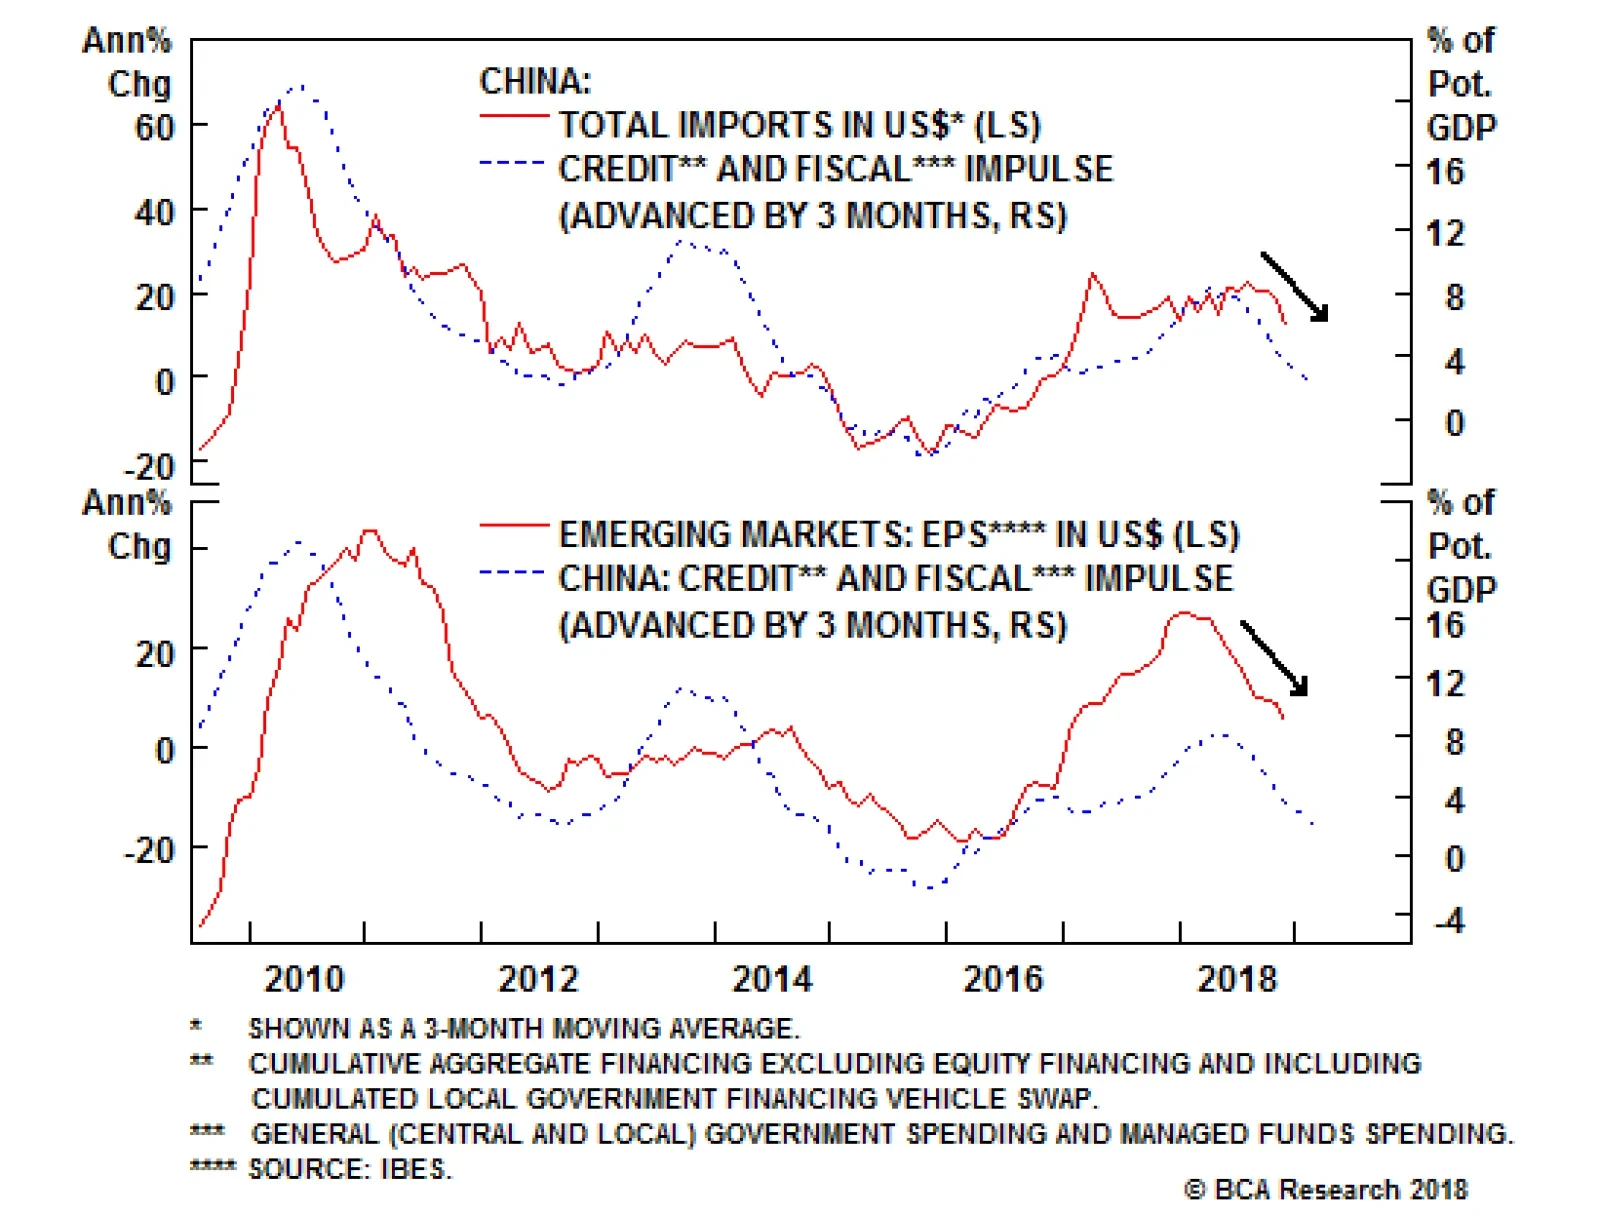
In China, the slowdown is occurring not only in the industrial parts of the economy, but also in household spending. In the case of the industrial segments, falling new and backlog orders are heralding further deterioration in manufacturing output growth. …
Dear Client, We are sending you our last issue of the year, which contains a lighter fare than usual, highlighting 10 charts we find important. The first three charts tackle questions of Chinese growth, global activity and the outlook for the Federal Reserve. The other seven relate directly to the currency market. We will resume our regular publishing schedule on January 4th, 2019. The Foreign Exchange Strategy team would like to thank you for your continued readership and wish you and yours a joyful holiday season as well as a healthy, happy and prosperous 2019. Warm Regards, Mathieu Savary, Vice President Foreign Exchange Strategy mathieu@bcaresearch.com Feature 1) Chinese Growth Outlook Since the 19th National Congress of the Communist Party of China, Beijing has been focused on controlling debt growth. The Chinese leadership is worried that too much debt will lead to the dreaded middle-income trap, whereby a country’s development stalls once it achieves middle-income status. Because of Beijing’s laser focus on debt, Chinese growth, especially in the industrial sector, has slowed. Yet in the second half of 2018, Chinese policymakers have grown concerned by the deepening malaise in the domestic economy. Consequently, they have loosened policy, accelerating the issuance of local government bonds, letting the repo rate fall to 2.7% and cutting the reserve requirement ratio to 14.5%. Despite these measures, credit growth has continued to slow, hitting 16-year lows, and crucially, the shadow banking system is still contracting (Chart 1, left panel). While the supply of credit remains tepid, declining demand for credit is more concerning. China’s marginal propensity to save, as approximated by the gap between the growth of M2 and M1 money supply, is still rising. Historically, a rising marginal propensity to save leads to slowing industrial activity and slowing import growth (Chart 1, right panel). This implies that China will continue to weigh on global trade and global industrial activity. Thus, to turn growth around, Chinese policymakers will need to ease policy further. Chart 1AChinese Growth Will Slow Further (I)
Chinese Growth Will Slow Further (I)
Chinese Growth Will Slow Further (I)
Chart 1BChinese Growth Will Slow Further (II)
Chinese Growth Will Slow Further (II)
Chinese Growth Will Slow Further (II)
2) Global Growth And Inflation Outlook Already, the outlook for Chinese growth points to additional downside to global growth – something EM carry trades financed in yen are already sniffing out (Chart 2, left panel). The deterioration in the performance of those carry trades further amplifies the negative impulse emanating from China. If high-yielding EM currencies depreciate versus funding currencies like the yen, money is leaving those economies. Hence, EM liquidity conditions are tightening and financial conditions are deteriorating, reinforcing the leading property of EM carry trades vis-à-vis global industrial activity. Chart 2ASlowing Global Growth And Inflation (I)
Slowing Global Growth And Inflation (I)
Slowing Global Growth And Inflation (I)
Chart 2BSlowing Global Growth And Inflation (II)
Slowing Global Growth And Inflation (II)
Slowing Global Growth And Inflation (II)
Moreover, as telegraphed by the relative performance of EM bonds to EM equities, global inflation is set to peak soon, and then decelerate (Chart 2, right panel). This is a natural consequence of the deflationary impact of slowing Chinese growth and tightening EM liquidity conditions – the two most crucial factors lying behind the softness in global growth. Thus, financial markets are likely to remain volatile, at least until global policymakers have changed their tune enough to reverse global growth and inflation dynamics. 3) The Fed Is On Track To Hike More Than The Market Believes In its latest set of forecasts, the Federal Reserve may have been forced to adjust how much it will hike interest rates over the coming years. Nonetheless, by the end of 2020, the FOMC still anticipates having to increase interest rates by more than the -8 basis points currently priced into the futures curve. We are inclined to side with the Fed. U.S. growth may be slowing, but it will remain above trend in 2019. Additionally, the U.S. economy is most likely already at full employment, thus inflationary pressures are building. For the Fed, the labor market remains the fulcrum of potential inflation. As the left panel of Chart 3 shows, both the Atlanta Fed Wage Tracker and BLS average hourly earnings are growing at an accelerating pace, giving the Fed ammo to hike rates further. Moreover, the highly interest-sensitive housing sector has been a great source of concern for U.S. growth. However, now that this year’s surge in mortgage rates is being digested, mortgage applications are once again rebounding (Chart 3, right panel). This suggests that real estate activity will stabilize. Hence, even if the Fed pauses, it will still surprise markets to the upside over the coming 24 months. Chart 3AGood Reasons To Keep Hiking In 2019
Good Reasons To Keep Hiking In 2019
Good Reasons To Keep Hiking In 2019
Chart 3BGood Reasons To Keep Hiking In 2019
Good Reasons To Keep Hiking In 2019
Good Reasons To Keep Hiking In 2019
4) The Dollar Can Rally Even If U.S. Growth Falls Off A Cliff In our assessment, U.S. growth will slow next year, but will nonetheless remain above trend. However, if we are wrong and U.S. growth weakens much more, the dollar is unlikely to crater. As Chart 4 illustrates, periods of broad growth weakness – as measured by our U.S. economic diffusion index – often generate a strong – not weak – dollar. U.S. growth weakness often happens as global growth deteriorates. Since the U.S. economy exhibits a low beta to global industrial activity – the segment of the economy that contributes most to the variance in GDP growth – it follows that if a shock is global, the U.S. is likely to perform better than the rest of the world, leading to a strong dollar. Today, the downside risk is that the U.S. catches the cold that has hit the global economy. Hence, if U.S. growth has significantly more downside, it would suggest that economies outside the U.S. would suffer even more. The dollar should perform well in this environment. Chart 4The Dollar Doesn't Really Care If U.S. Growth Slows
The Dollar Doesn't Really Care If U.S. Growth Slows
The Dollar Doesn't Really Care If U.S. Growth Slows
5) The Dollar Versus Global Growth And Global Inflation The most important question to forecast the path of the dollar is where we stand in the global growth and inflation cycle. As Chart 5 shows, the dollar tends to perform most poorly early in the business cycle, when global growth is picking up but inflation remains muted (bottom-right quadrant), and late in the cycle when global growth has begun to weaken but inflation remains perky (top-left quadrant). The best time to hold the greenback is during global downturns, when both global growth and inflation are decelerating (bottom-left quadrant). With global industrial activity on a downtrend and inflation set to roll over soon, we are entering the bottom-left quadrant. As a result, the greenback should continue to rally on a trade-weighted basis, gaining most against the commodity currency complex. The yen may be the one currency bucking this trend, as in recent years it has become even more counter-cyclical than the dollar.
Chart 5
6) The Dollar Is A Momentum Currency One of the defining characteristics of the greenback is that from an investment-style perspective, it is a momentum currency. As the left panel of Chart 6 illustrates, among G-10 currencies, momentum continuation strategies work best for the USD. This is because of feedback loops present in the global economy.
Chart 6
Chart 6BMomentum Still Flashing A Greenlight For The Greenback (II)
Momentum Still Flashing A Greenlight For The Greenback (II)
Momentum Still Flashing A Greenlight For The Greenback (II)
Of the major economies, the U.S. is the least sensitive to global trade and global investment – a consequence of the low share of exports and manufacturing in GDP and employment. As a result, when global growth deteriorates, the U.S. economy experiences less of a slowdown and American rates of return decline less. Thus, money comes back into the U.S., lifting the dollar in the process. However, since there is USD 14-trillion in dollar-denominated foreign-currency debt, a rising dollar increases the cost of capital for these borrowers. The ensuing tightening in financial conditions hurts global growth, further enhancing the greenback’s appeal. The relationship goes in reverse once global growth improves. These powerful feedback loops explain why when the dollar strengthens, it remains stronger for longer than anyone anticipated, and vice versa when it weakens. Today, the momentum signal for the dollar remains positive (Chart 6, right panel). Along with slowing global growth, momentum was one of the key factors behind the dollar’s strength this year. If, as we expect, global inflation also weakens in the first half of 2019, the dollar will likely experience a beautiful first six months of the year. 7) Keep An Eye On Sino-U.S. Rate Differentials When one-year interest rate differentials between the U.S. and China widen, the DXY tends to strengthen (Chart 7, left panel). This is a reflection of global growth dynamics. U.S rates tend to rise relative to China when Chinese growth is decelerating. Since a slowing Chinese economy implies less intake of machinery and raw materials, a weaker China hurts Europe, Japan, EM and commodity producers a lot more than it affects the U.S. This lifts the dollar in the process. Moreover, so long as Chinese one-year interest rates keep falling versus the U.S., it also signals that any reflationary efforts by China have not yet had any impact on growth. Chart 7AU.S.-China Rate Differentials Point To A Stronger Dollar (I)
U.S.-China Rate Differentials Point To A Stronger Dollar (I)
U.S.-China Rate Differentials Point To A Stronger Dollar (I)
Chart 7BU.S.-China Rate Differentials Point To A Stronger Dollar (II)
U.S.-China Rate Differentials Point To A Stronger Dollar (II)
U.S.-China Rate Differentials Point To A Stronger Dollar (II)
This same rate differential between the U.S. and China also drives fluctuations in USD/CNY (Chart 7, right panel). Since falling relative Chinese rates are a symptom of a weaker Chinese economy, this relationship makes sense. Moreover, in recent years, more than against the dollar, Chinese policymakers have targeted the value of the CNY on a trade-weighted basis. Mechanically, if slowing Chinese growth flatters the trade-weighted dollar, it also forces USD/CNY up. This can further reinforce the strength in the broad trade-weighted dollar as a falling CNY is deflationary for the global economy. Because Chinese growth remains weak, we expect U.S. rates to continue to move higher vis-à-vis Chinese ones, lifting both the DXY and USD/CNY in the process. 8) EUR/USD: More Downside And A Complex Bottoming Process Ahead EUR/USD will suffer if global growth weakens and the dollar strengthens. On one hand, the European economy is much more sensitive to the Chinese and global industrial cycle than U.S. activity is. Our outlook for global growth therefore implies that the European Central Bank will find it difficult to raise rates in the fall of 2019, while the Fed is likely to surprise markets on the hawkish side. On the other hand, the simplest vehicle to bet on a strengthening dollar is to sell EUR/USD. Our fair-value model for EUR/USD currently pegs its equilibrium at 1.11 (Chart 8, left panel). However, EUR/USD never ends its downdrafts at its fair value – a consequence of its negative correlation with the dollar, a momentum currency that easily over- and under-shoots fair value. Thus, we expect the euro to find stability closer to 1.08. Chart 8AEUR/USD Will Bottom Later Next Year (I)
EUR/USD Will Bottom Later Next Year (I)
EUR/USD Will Bottom Later Next Year (I)
Chart 8BEUR/USD Will Bottom Later Next Year (II)
EUR/USD Will Bottom Later Next Year (II)
EUR/USD Will Bottom Later Next Year (II)
Moreover, inflationary dynamics do not suggest that EUR/USD is yet ripe for the taking. Since 2008, the gap between euro area and U.S. core CPI has been a reliable leading indicator for EUR/USD (Chart 8, right panel). In fact, this chart suggests that EUR/USD is more likely to bottom towards the second half of 2019; so as long as European inflation remains tepid, it will be hard for this currency to suddenly rebound and recoup the losses it has experienced this year. A complex bottom is more likely than a V-shaped one. 9) EUR/JPY: All About Bond Yields Even more so than USD/JPY, EUR/JPY remains beholden to trends in global bond yields (Chart 9). BCA’s view is that on a cyclical horizon of nine to 12 months, bond yields have upside. However, with global growth and inflation likely to decelerate further in the first half of 2019, safe haven assets could remain well bid over that timeframe. This implies the time to buy EUR/JPY is not now, and that a better buying opportunity will emerge once global growth stabilizes. Thus, we remain short EUR/JPY for the time being, a view we have held since the beginning of 2018. Chart 9Risks To Global Growth Equals EUR/JPY Downside
Risks To Global Growth Equals EUR/JPY Downside
Risks To Global Growth Equals EUR/JPY Downside
10) EUR/GBP Is At Risk At the current juncture, EUR/GBP is a binary bet: Either a hard Brexit comes to fruition, in which case U.K. real rates plummet and British inflation rises above 5%, creating a deeply pound-bearish environment. Alternatively, a soft Brexit (or even no Brexit) materializes, in which cases British real rates have upside, the Bank of England has a freer hand to combat inflationary pressures, and the pound can rally. With EUR/GBP currently trading toward the top of its historical distribution, we believe it is an attractive shorting opportunity (Chart 10). Marko Papic, BCA’s chief geopolitical strategist, assigns a less than 10% probability of a hard Brexit. As such, the pound is more likely to exist in a soft/no-Brexit world in 12 months than otherwise. This means the pound should be-revalued. Chart 10Sell EUR/GBP
Sell EUR/GBP
Sell EUR/GBP
We prefer playing the pound’s strength against the euro rather than the dollar, as we expect the dollar to rally further in the first half of 2019, so cable would be swimming against the tide. Moreover, when the dollar strengthens, historically EUR/GBP weakens, as the GBP has a lower beta to the dollar than the euro does. Hence, our dollar view is also consistent with a lower EUR/GBP. Mathieu Savary, Vice President Foreign Exchange Strategy mathieu@bcaresearch.com Trades & Forecasts Forecast Summary Core Portfolio Tactical Trades Closed Trades