Global
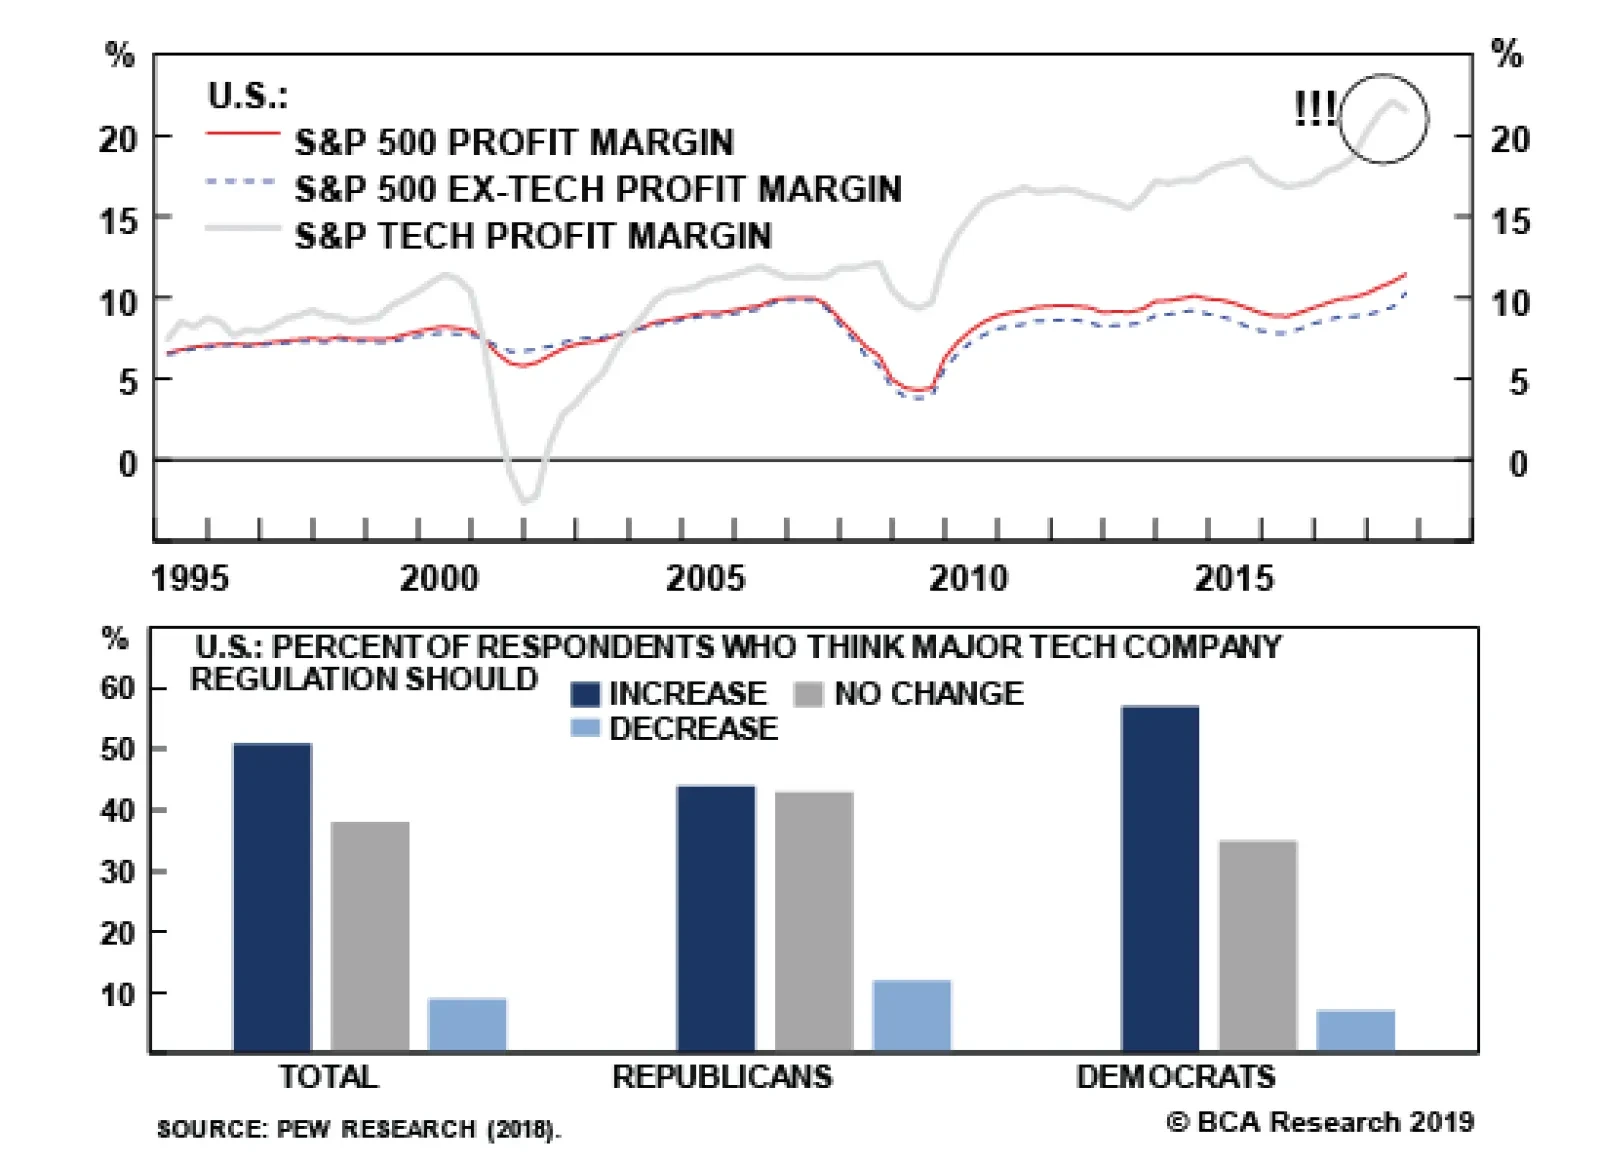
Populism > Profits: Watch Out Tech
…
Populism > Profits
Populism >…
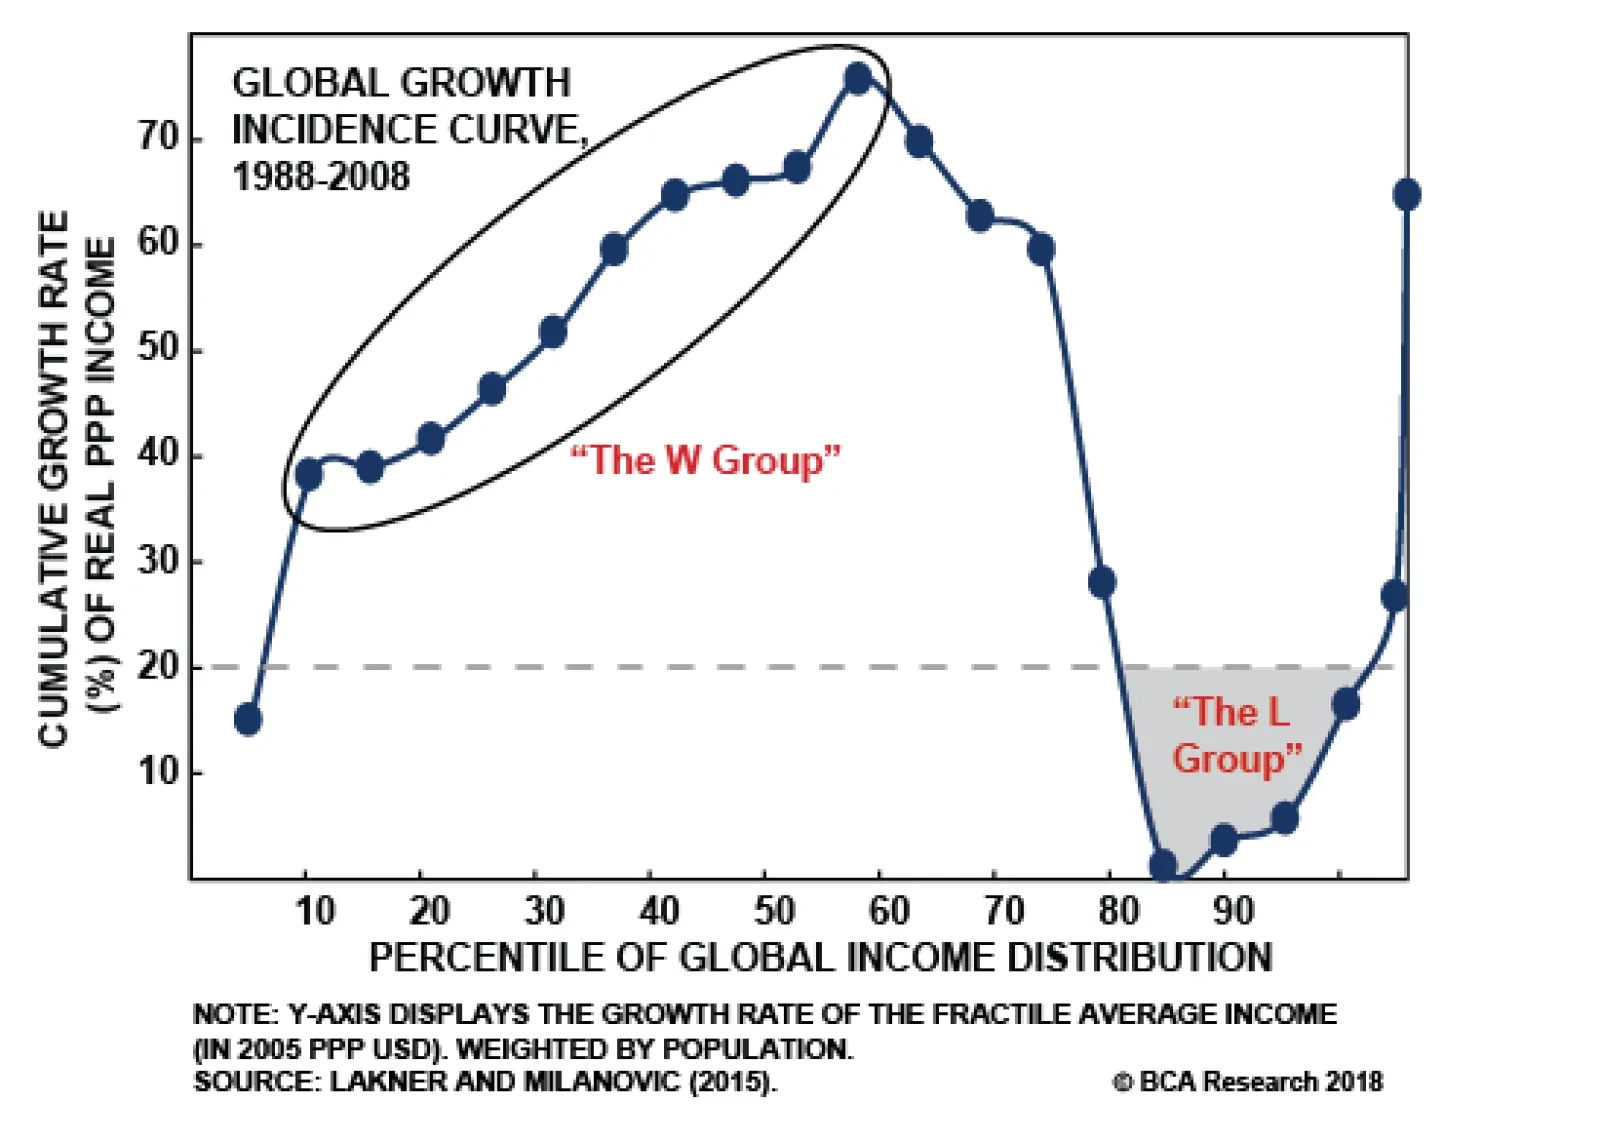
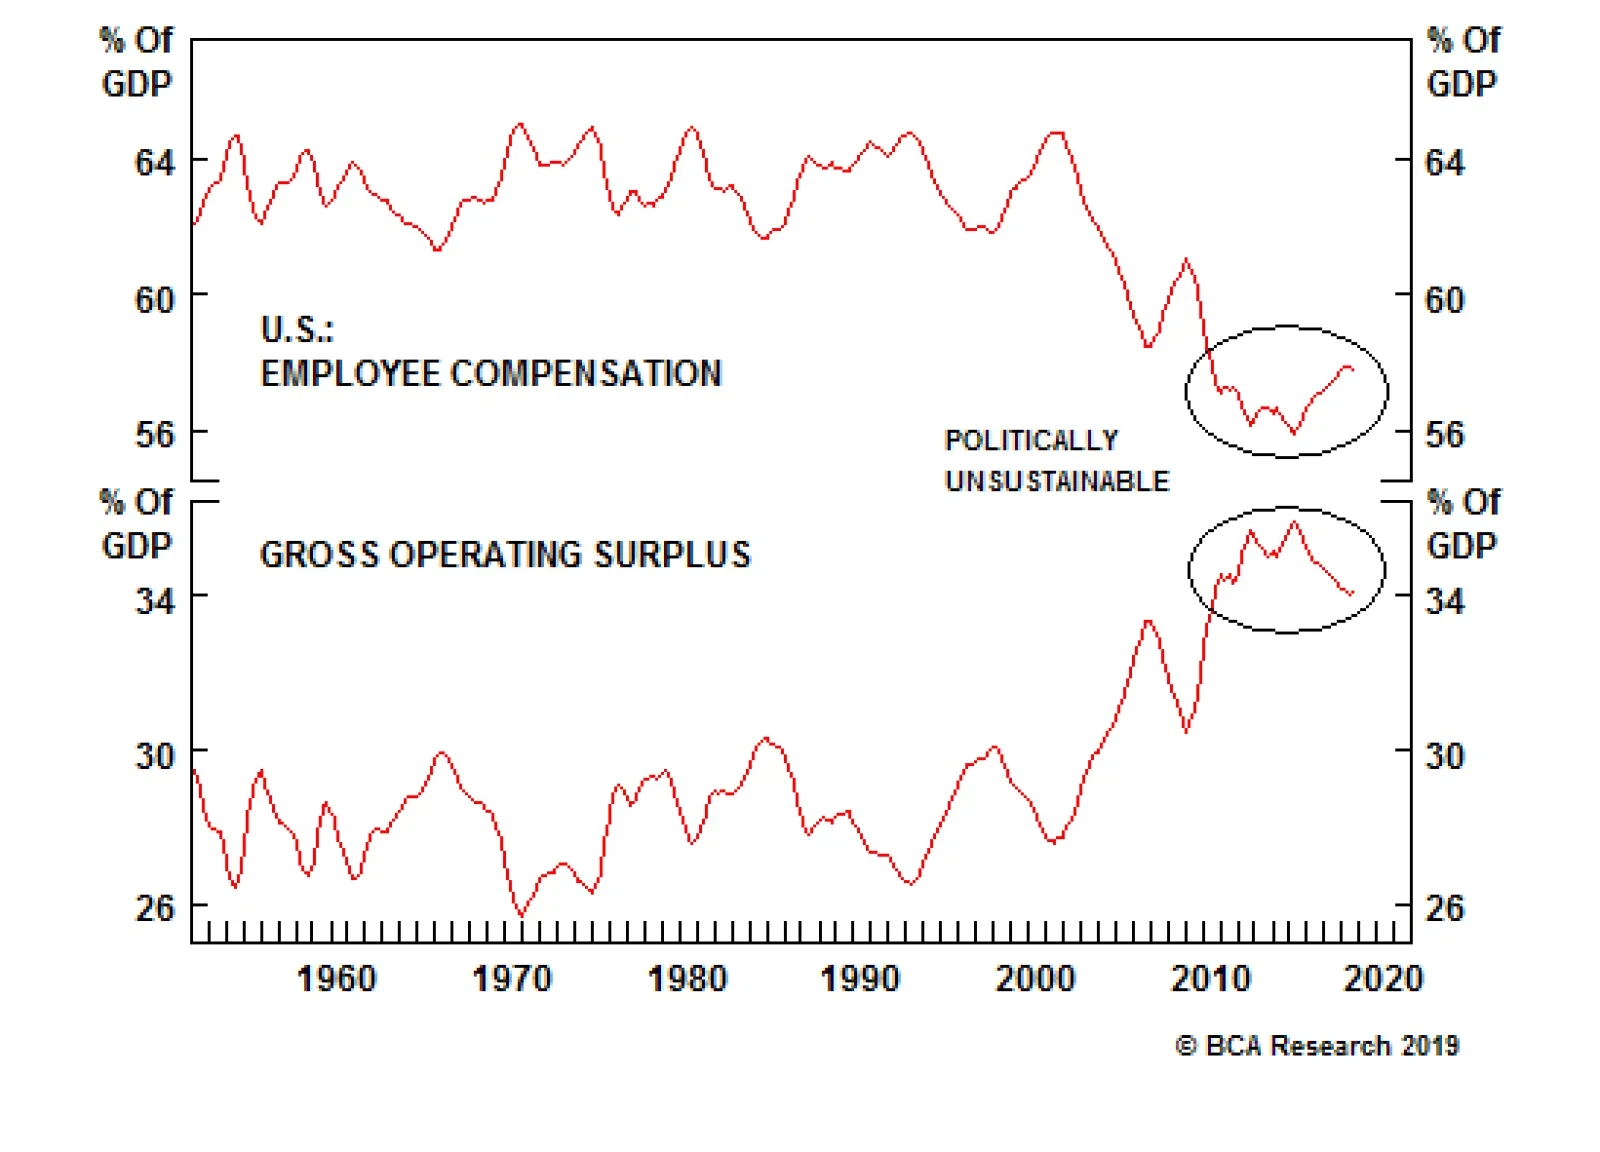
There are three levels of inequality that investors need to be familiar with in the context of populism: global, national, labor. The first level starts big, on the international stage, where economic outcomes are examined on a cross-sectional basis.…
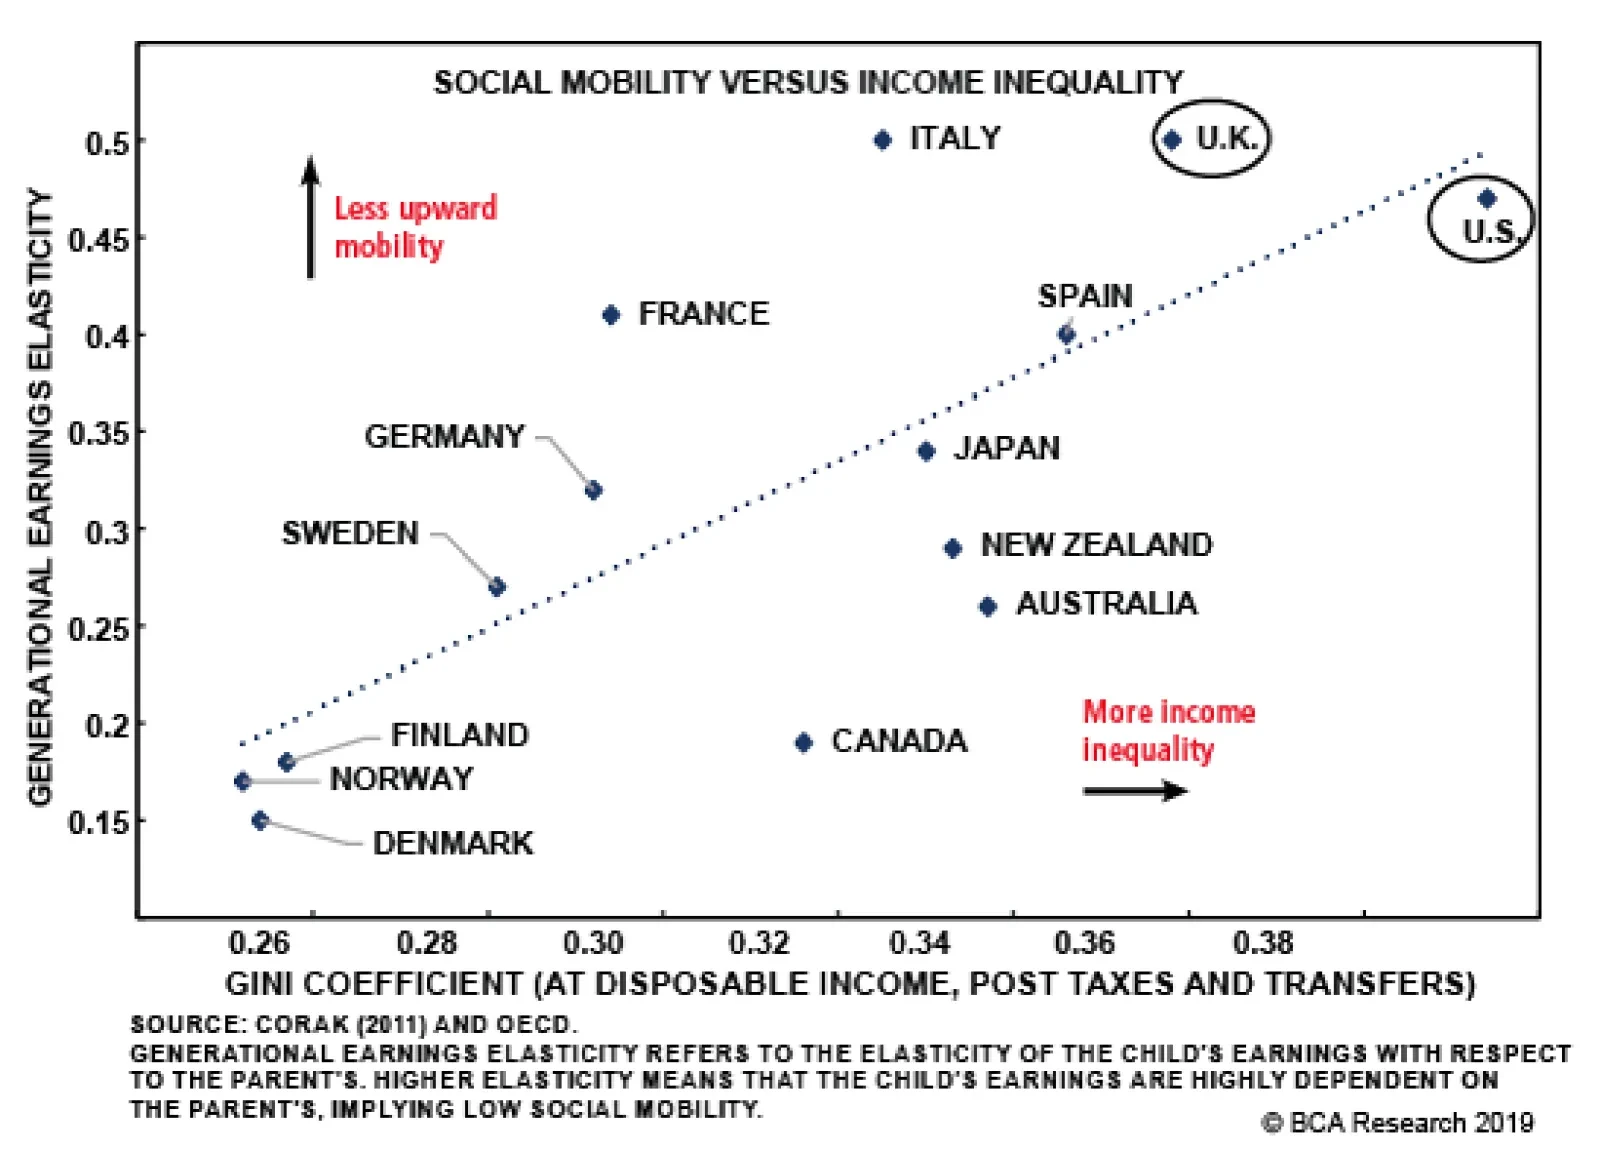
Income inequality has been one of the key drivers of the rise in populism witnessed across the globe. Today’s Insights investigate two levels of inequality and consider some policy and financial market implications. It is no coincidence that the most…

Highlights Are Markets Too Pessimistic On U.S. Growth & Inflation? What Is China’s Economic Pain Threshold To Trigger A Policy Response? Have Central Banks Become Less Concerned About Financial Markets? Feature Happy New Year! 2019 has started much like 2018 ended, with elevated global market volatility. The combination of more evidence of slowing global growth – fueled by spillovers from U.S.-China trade tensions – and central banks perceived to be overly hawkish has crushed investor sentiment. Money has flooded out of risk assets like equities and corporate debt and shifted into the traditional safe haven assets – government bonds, surplus currencies like the Japanese yen and even gold. U.S. equities and credit, which had been a refuge from the global market weakness for much of last year, have underperformed sharply as markets have moved to price in the global economic softness reaching U.S. shores. These market trends obviously run counter to our recommended positioning for overall portfolio duration (below benchmark) and credit exposure (neutral overall, favoring the U.S. over Europe and Emerging Markets). Yet we advise staying the course with our recommendations, as market pricing has become too pessimistic relative to likely global growth and inflation outcomes. The bulk of the recent decline in global bond yields has come from falling inflation expectations, which have been linked to the sharp fall in oil prices seen in the final months of 2018 (Chart of the Week). This is shown in Table 1, which presents the breakdown of the decline in the 10-year benchmark government bond yields for the major developed markets since the peak in U.S. Treasury yields back on November 8. Real yields have fallen by a more modest amount than inflation expectations in most countries, even with the pullback in cyclical indicators like the global PMI. Expected 2019 rate hikes are now fully priced out of money market curves, most notably in the U.S. Chart of the WeekSlowing Growth Is Not Why Yields Have Plunged
Slowing Growth Is Not Why Yields Have Plunged
Slowing Growth Is Not Why Yields Have Plunged
Table 1Decomposing 10-Year Yield Changes Since The November 2018 Peak
Three Big Questions To Start Off 2019
Three Big Questions To Start Off 2019
In our view, there are three vital questions regarding the recent market turbulence that must be answered before determining the appropriate global fixed income investment strategy over the next 6-12 months. The answers lead us to maintain our current recommendations on duration, country allocation and credit exposure, even with the recent market turbulence. 1) Are Markets Too Pessimistic On U.S. Growth & Inflation? The December reading for the U.S. ISM Manufacturing purchasing managers’ index (PMI) released last week showed the largest single month deceleration since 2008 (Chart 2). All the main subcomponents of the ISM index fell, including the New Orders and Export indices which are now close to falling below the 50 threshold (Chart 3). Coming on the heels of China’s PMI dipping below 50, markets became more worried that the mighty U.S. economy was being dragged down to the weaker pace of growth seen outside the U.S. Chart 2Decomposing 10-Year Yield Changes Since The November 2018 Peak
Decomposing 10-Year Yield Changes Since The November 2018 Peak
Decomposing 10-Year Yield Changes Since The November 2018 Peak
Chart 3U.S. ISM Overstating U.S. Economic Weakness
U.S. ISM Overstating U.S. Economic Weakness
U.S. ISM Overstating U.S. Economic Weakness
Yet when looking a broader array of U.S. indicators, the domestic economy still appears to be in good shape, albeit with some lost growth momentum. Consumer confidence remains solid, employment growth is accelerating, household incomes are growing at a faster pace and the personal savings rate remains elevated – all of which provide support for a faster pace of consumer spending (third panel). At the same time, the U.S. Conference Board leading economic indicator is still pointing to a healthy above-trend pace of GDP growth in 2019. U.S. Treasury yields have fallen to levels consistent with the drift lower in the ISM index (top panel), with the market now discounting one full 25bp rate cut to occur within the next twelve months. That will not happen given the tightness of the U.S. labor market and persistence of underlying domestic inflation pressures. The robust December gain reported in last Friday’s U.S. Payrolls report (+312k) may have surprised the markets, but our U.S. Employment Growth model had been signaling a faster pace of job growth for the past several months (Chart 4). The year-over-year growth in Average Hourly Earnings rose to 3.2%, the highest level in nearly a decade. With the overall unemployment still at a historically low 3.9% as labor demand is increasing, wages are likely to remain under upward pressure in the next 6-12 months. Chart 4U.S. Employment & Wages Are Accelerating
U.S. Employment & Wages Are Accelerating
U.S. Employment & Wages Are Accelerating
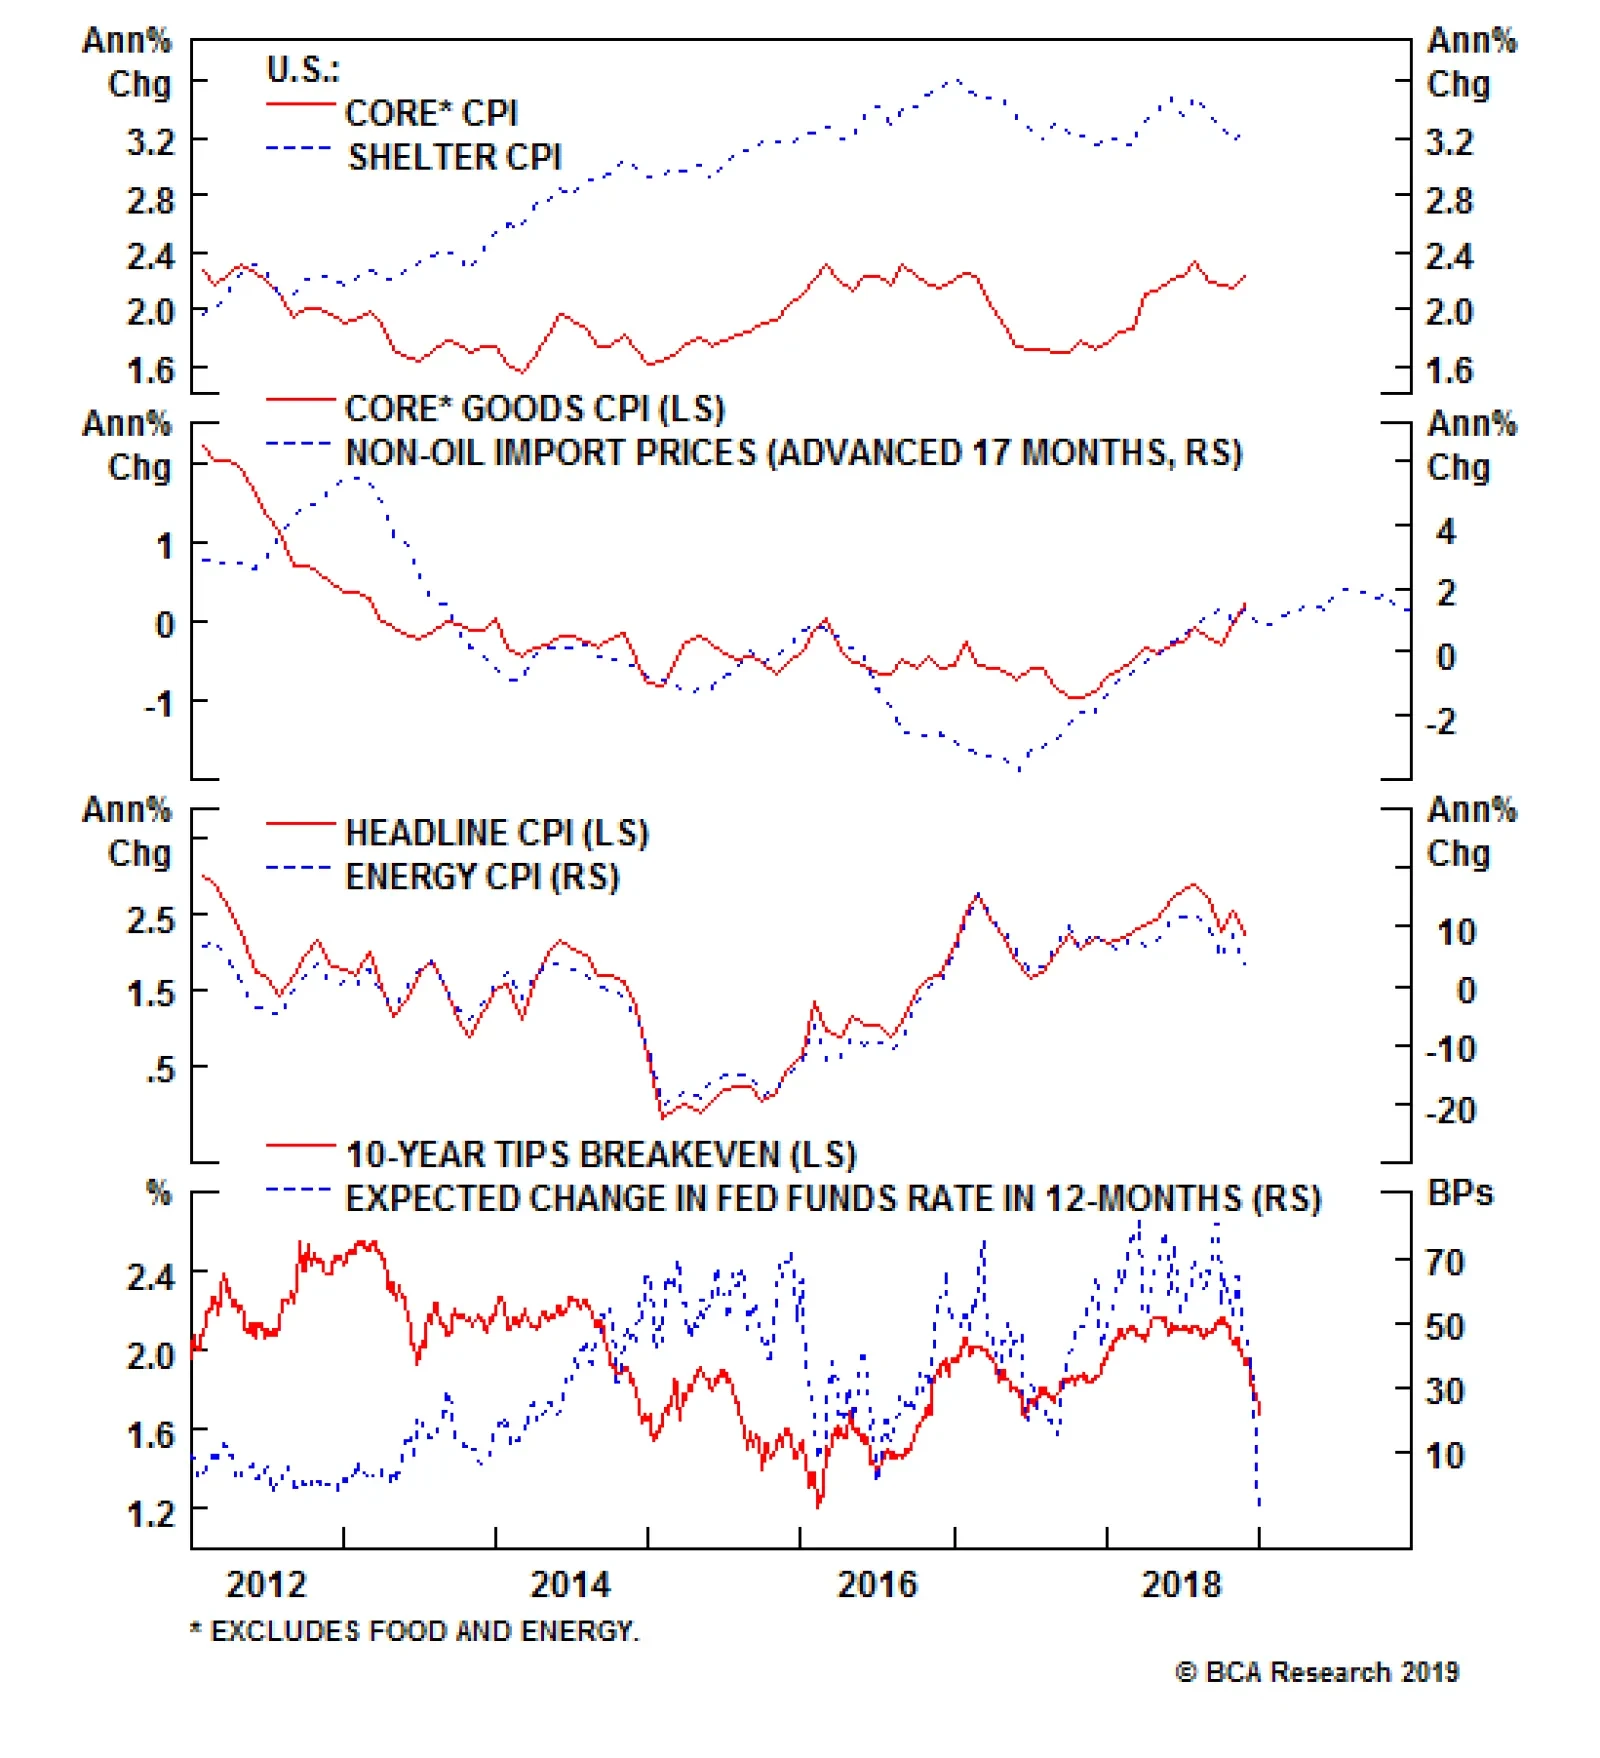
Given this backdrop of economic growth that is likely to remain above-trend throughout 2019, it will be difficult to generate a sustained downturn in U.S. inflation this year, even given the lagged impact of the strong U.S. dollar and lower oil prices. While some decline in headline inflation measures is inevitable in the coming months given the rapid pace and magnitude of the 2018 oil plunge, BCA’s Commodity & Energy Strategy team continues to see a positive demand/supply balance helping push oil prices back towards the $80/bbl level in 2019.1 That would ensure that any decline in headline U.S. inflation would be short in duration, and of far less magnitude than the move that occurred after the 2014/15 oil plunge given the more robust domestic inflation backdrop (Chart 5). Chart 5This Is NOT A Repeat Of the 2015/16 Deflation Scare
This Is NOT A Repeat Of the 2015/16 Deflation Scare
This Is NOT A Repeat Of the 2015/16 Deflation Scare
A sober assessment of the U.S. economic and inflation data leads us to conclude that U.S. interest rate markets have swung too far to the dovish side. The inflation expectations component of U.S. Treasury yields is now too low, and the Fed rate cut that is now discounted in money markets will not materialize. Rate hikes are the more likely outcome, the repricing of which will put renewed upward pressure on Treasury yields. 2) What Is China’s Economic Pain Threshold To Trigger A Policy Response? Of the potential catalysts that could turn the current investor pessimism into optimism, signs of improving Chinese growth would likely top the list. China’s economy has lost considerable momentum, with year-over-year real GDP growth slowing to 6.5% in the third quarter of last year and higher frequency data showing a further deceleration in the fourth quarter. The profit warning issued by Apple last week, prompted by an unexpectedly sharp slowing of Chinese mobile phone demand, is a sign that Chinese consumer spending may be faltering. There are several causes for the growth slump, both domestic and foreign. Chinese authorities have been clamping down on domestic leverage given elevated private debt levels, while also taking action to reduce domestic pollution levels – policies that all have helped dampen industrial activity. More recently, and more importantly, the U.S.-China tariff war has started to have a real economic impact on the economy through slowing trade activity and diminished business confidence. Given the Chinese government’s perpetual interest in maintaining domestic stability by limiting any cyclical increases in unemployment, the incentive is there for policymakers to provide renewed stimulus to put a floor under economic growth. The last such boost came in 2015/16, when the Chinese government implemented an aggressive expansion of fiscal spending alongside monetary policy measures such as interest rate cuts, reductions in reserve requirement ratios and currency depreciation. That package was enough to cause a sharp reacceleration of the Chinese economy, but only after nominal GDP growth had fallen to an 16-year low of 6.4% at the end of 2015 (Chart 6). Chart 6Nominal China Growth Less Than 7.5% Should Trigger More Stimulus …
Nominal China Growth < 7.5% Should Trigger More Stimulus...
Nominal China Growth < 7.5% Should Trigger More Stimulus...
Policymakers will likely be forced into action again in 2019 if nominal GDP growth, which hit 9.6% in the third quarter of 2018, falls back below 7.5%. Forward-looking economic measures like our Li Keqiang leading indicator and the export orders component of China’s manufacturing PMI suggest that weaker growth outcome could occur by mid-2019. China’s policymakers are likely to announce some form of stimulus in the first half of the year help counteract the growth slump, which could help boost global investor confidence (especially if it is accompanied by a new trade agreement with the U.S.). While Chinese policymakers are now under more pressure to provide stimulus measures, the tools available to them are more limited than was the case in 2015/16 (Chart 7). Interest rate cuts could happen if growth continues to fall more rapidly than expected, but that would create a burst in private sector leverage that policymakers would seek to avoid. The currency could also be weakened further, but the USD/CNY exchange rate is already back to near the 7.0 level reached in the 2016 devaluation. Chart 7...Atlhough Policy Options Are More Limited Than 2016
...Atlhough Policy Options Are More Limited Than 2016
...Atlhough Policy Options Are More Limited Than 2016
That leaves additional cuts in the reserve requirement ratio and increases in fiscal spending as the two most likely means for China to stimulate its economy in the coming months. Yet even the fiscal channel has limits, given the much higher starting point for the budget deficit today (3.7% of GDP) than in 2015 (2%). So while the trigger for a China policy stimulus will likely be reached by mid-2019, the magnitude of the stimulus will be nowhere near as large as the 2015/16 measures. This will help stabilize global growth expectations, but likely not by enough to provide a major boost to global commodity prices or export demand from emerging market countries that are heavily dependent on China. This leads us to remain cautious on emerging market credit exposure, as we prefer to own U.S. corporate debt instead where the growth/profit outlook is better. 3) Have Central Banks Become Less Concerned About Financial Markets? A popular market narrative of late has been that the Fed “made a mistake” with its last rate hike in December. A similar argument was made for the ECB choosing the end its Asset Purchase Program last month with inflation still well short of its target and European growth decelerating. The idea that central banks had fallen “out of tune” with financial markets has spooked investors who fear that policymakers are carrying out a pre-conceived plan to normalize monetary policy without any regard to financial markets. We find this to be a highly dubious conclusion. Central bankers still care about financial markets – or, more accurately, financial conditions – but the hurdle for policymakers to respond to falling asset prices is higher now than in previous years because of a lack of spare economic capacity. Simply put, any tightening of financial conditions must be large enough to trigger a slowing of growth to a below-potential pace, resulting in rising unemployment and weaker inflation pressures. That has not been the case – yet – in the major developed economies. Financial conditions indices (FCIs) – which measure the combined impact of equity prices, credit spreads and currencies – typically lead economic growth by 2-3 quarters. The latest selloffs in equity and credit markets in the U.S. and Europe, while significant, have not been large enough to push FCIs for those regions to levels that would be consistent with below-trend growth, using the 2015/16 episode as a reference point (Chart 8). Chart 8Tightening Financial Conditions Not Signaling Below-Trend Growth...Yet
Tightening Financial Conditions Not Signaling Below-Trend Growth...Yet
Tightening Financial Conditions Not Signaling Below-Trend Growth...Yet
Financial conditions in the U.S. are much closer to that 2015/16 reference point than in Europe, where bond yields remain very depressed and the euro is still an undervalued currency. Yet the domestic U.S. economy is in a much better state than was the case in 2015/16, as discussed earlier in this report. It is highly likely that the level of the U.S. FCI that would trigger a move to below-trend U.S. growth is much different today than in 2015/16. In other words, it would take a bigger widening of U.S. corporate credit spreads, or a sharper selloff in U.S. equity values, to generate the same type of drag on U.S. growth relative to 2015/16. Yet U.S. interest rate markets have already responded as if there was no such change in the amount of FCI tightening that would result in a more dovish Fed policy. The U.S. money markets have gone from pricing three rate hikes in 2019 to one rate cut, while bond investors have largely neutralized their bearish Treasury duration positioning (Chart 9). Chart 9USTs Now Discounting Too Much Fed Dovishness
USTs Now Discounting Too Much Fed Dovishness
USTs Now Discounting Too Much Fed Dovishness
That swing in sentiment on the Fed’s next move flies in the face of the underlying health of the U.S. economic data, as well as our Fed Monitor which continues to signal the need for more Fed rate hikes (Chart 10). Our other Central Bank Monitors tell a similar story (outside of Australia), with the Monitors signaling no need for easier monetary policy but with money markets pricing out any probability of a rate hike over the next year. This leaves global government bond yields exposed to any sign that global growth momentum is stabilizing, particularly with the inflation expectations component of bond yields also vulnerable to a rebound in oil prices (Chart 11). Chart 10Bond Yields Are Now Exposed To A Repricing Of Rate Hikes
Bond Yields Are Now Exposed To A Repricing Of Rate Hikes
Bond Yields Are Now Exposed To A Repricing Of Rate Hikes
Chart 11Bond Yields Are Now Exposed To A Rebound In Oil Prices
Bond Yields Are Now Exposed To A Rebound In Oil Prices
Bond Yields Are Now Exposed To A Rebound In Oil Prices
Our conclusion is that financial conditions in the major economies have not yet tightened by enough to end the process of normalizing global monetary policy from the extraordinarily accommodative settings seen in recent years. In other words, bond yields have not yet peaked for this cycle. Robert Robis, CFA, Senior Vice President Global Fixed Income Strategy rrobis@bcaresearch.com Footnotes 1 Please see BCA Commodity & Energy Strategy Weekly Report, “Oil Volatility Will Persist: 2019 Brent Forecast Lowered to $80/bbl”, dated January 3rd 2018, available at ces.bcaresearch.com. Recommendations The GFIS Recommended Portfolio Vs. The Custom Benchmark Index
Three Big Questions To Start Off 2019
Three Big Questions To Start Off 2019
Duration Regional Allocation Spread Product Tactical Trades Yields & Returns Global Bond Yields Historical Returns
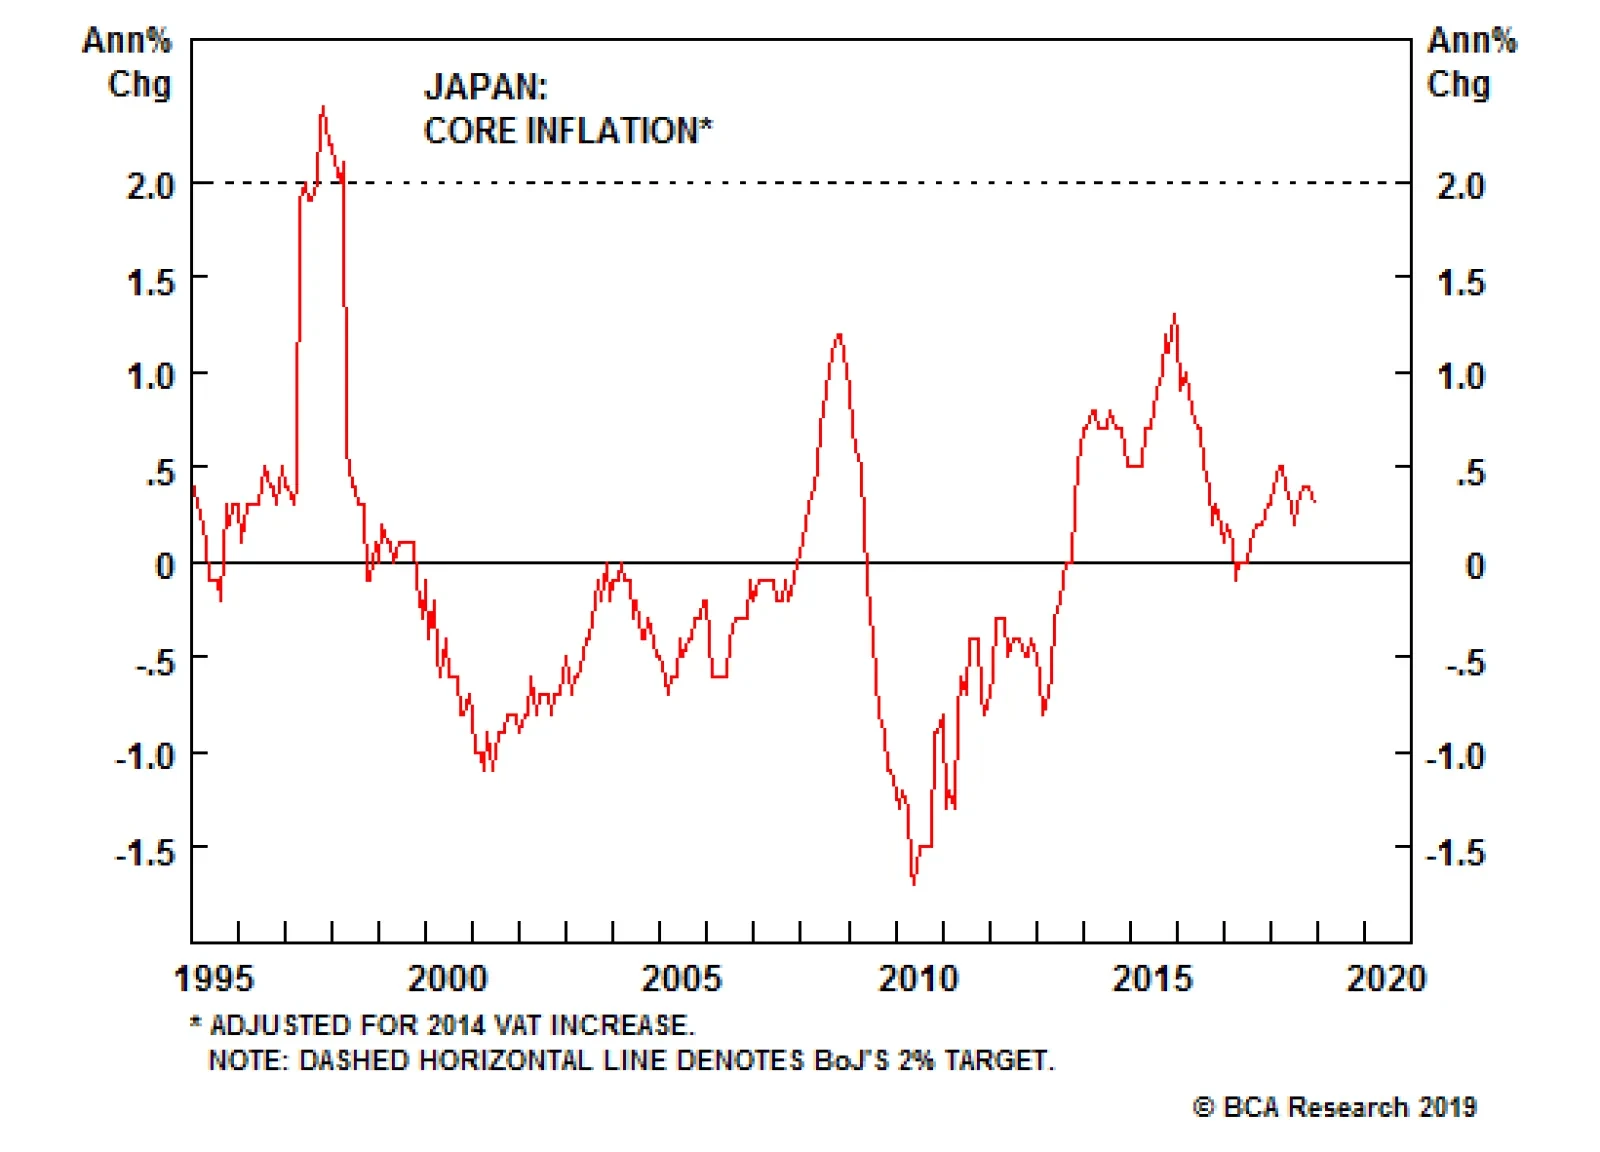
The JPY may be cheap, but Japan’s core inflation remains well below the Bank of Japan’s objective, and shows little sign of hitting 2% within a reasonable period (see chart). The recent strength in the yen only re-enforces the inability of the BoJ to hit its…
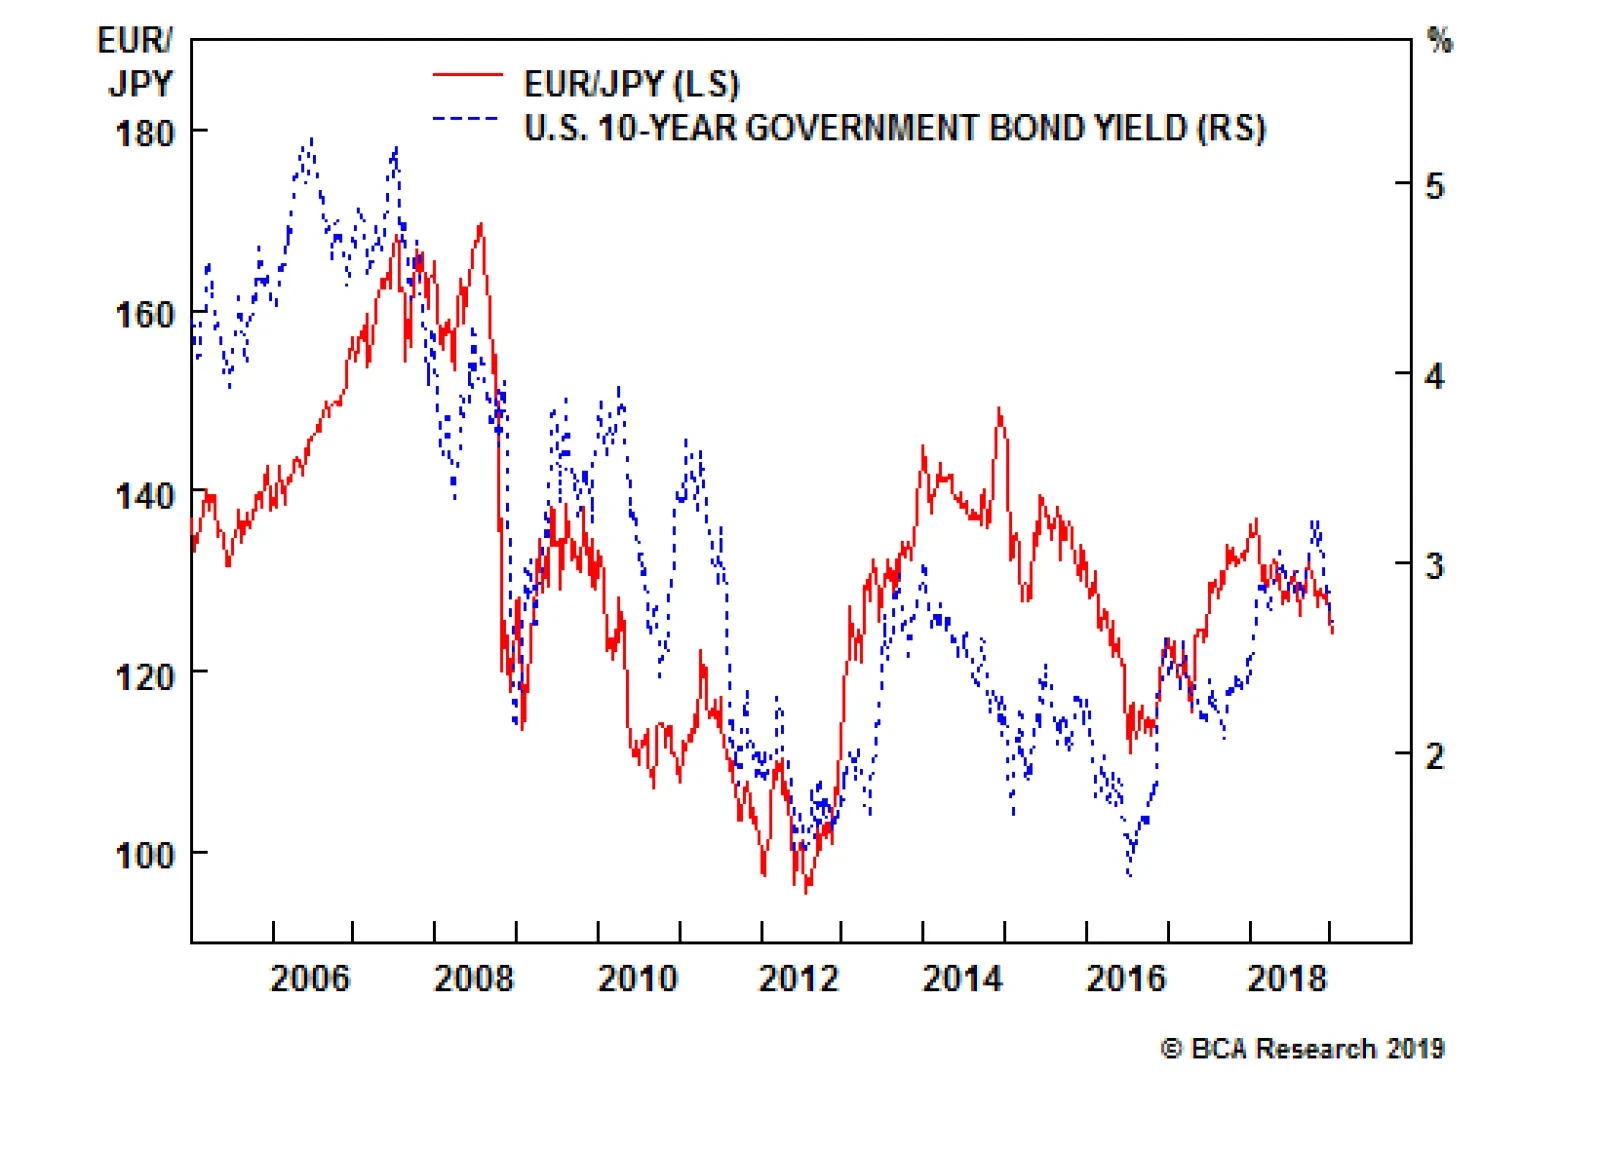
As we have been arguing, the yen should be strong in the current environment, especially against the euro, the Australian dollar and high-yielding EM currencies. When global growth weakens and safe heaven yields fall, the yen benefits. Not only do Japanese…
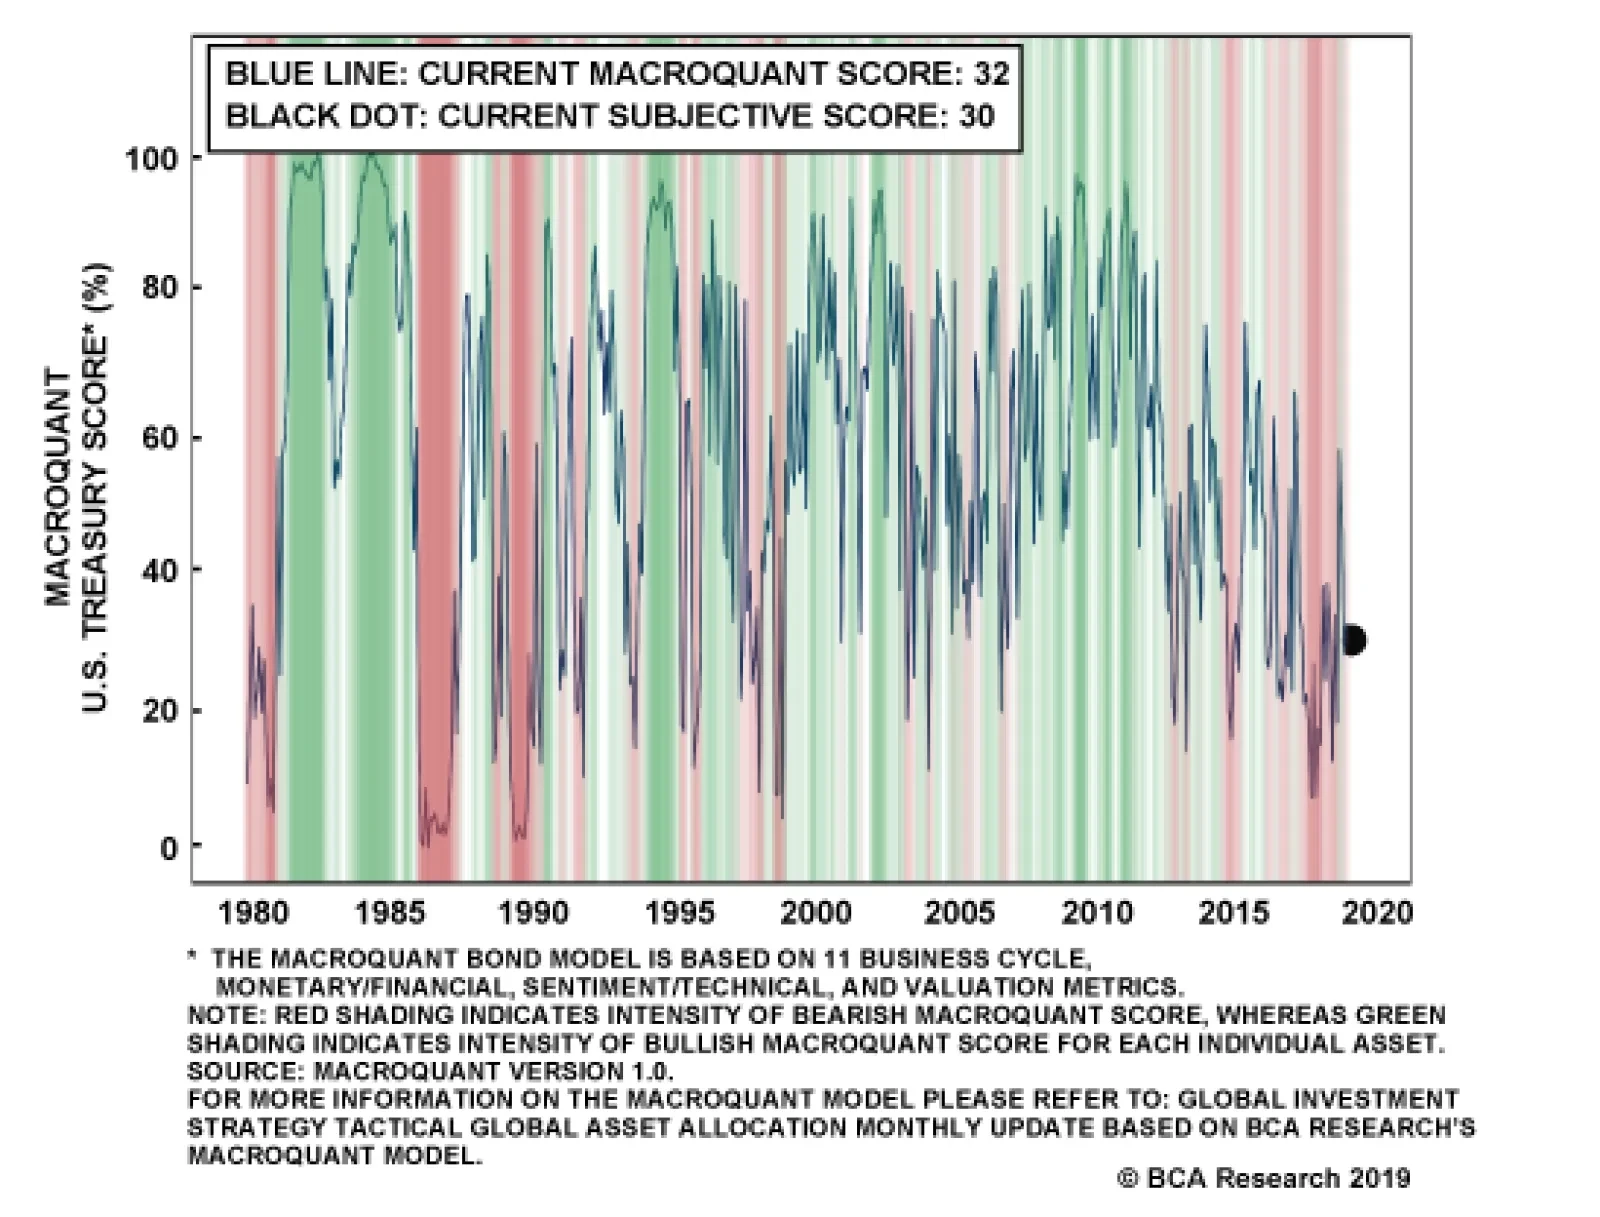
However, our conviction level on this view is not high, and we are prepared to revise it if it looks like global growth is accelerating, an outcome that would limit any further dollar strength (our subjective dollar score currently stands at 70%, below the…
Actually, it is usually just bullish or bearish because most people regard neutral views as lacking in conviction and insight. Our chief global strategist thinks this incentive structure is counterproductive. Not only does it cause analysts to turn a blind…
Next week’s key day in the U.S. economic calendar will be Wednesday, with the release of the minutes from the last FOMC meeting. We will get a finer sense on how monetary policy is likely to evolve and what risk factors the Fed is monitoring. Friday will see…