Global
21st Century central bankers mostly subscribe to a “risk management” approach to policymaking. This means setting policy dovish enough to cut off downside tail risks to growth during periods of elevated economic uncertainty – especially when inflation is…

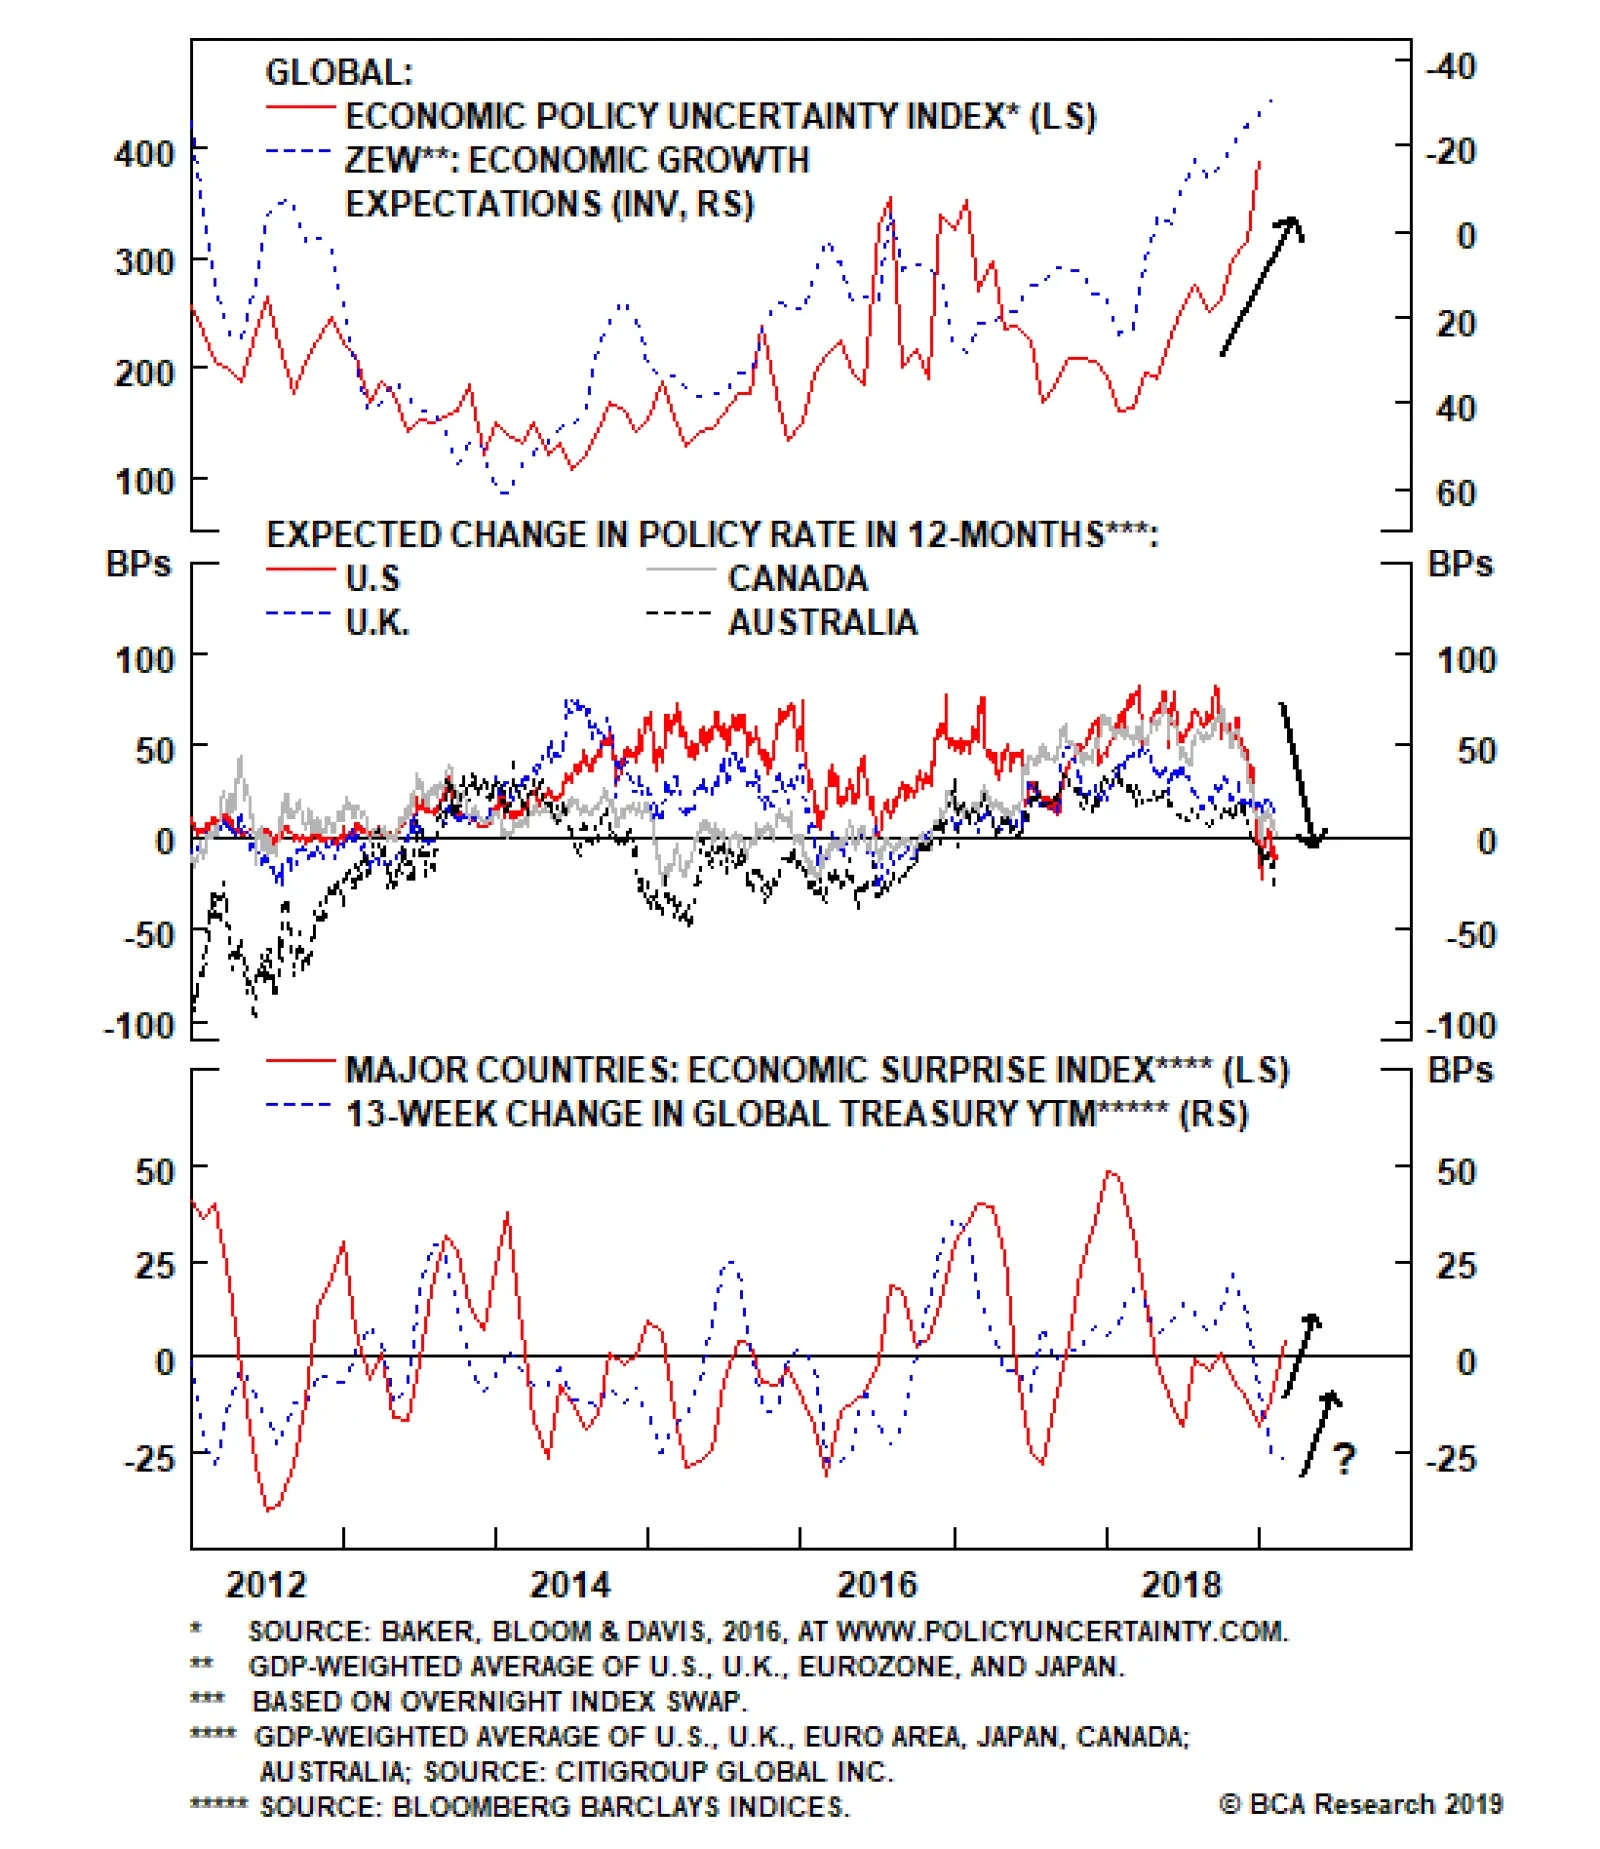
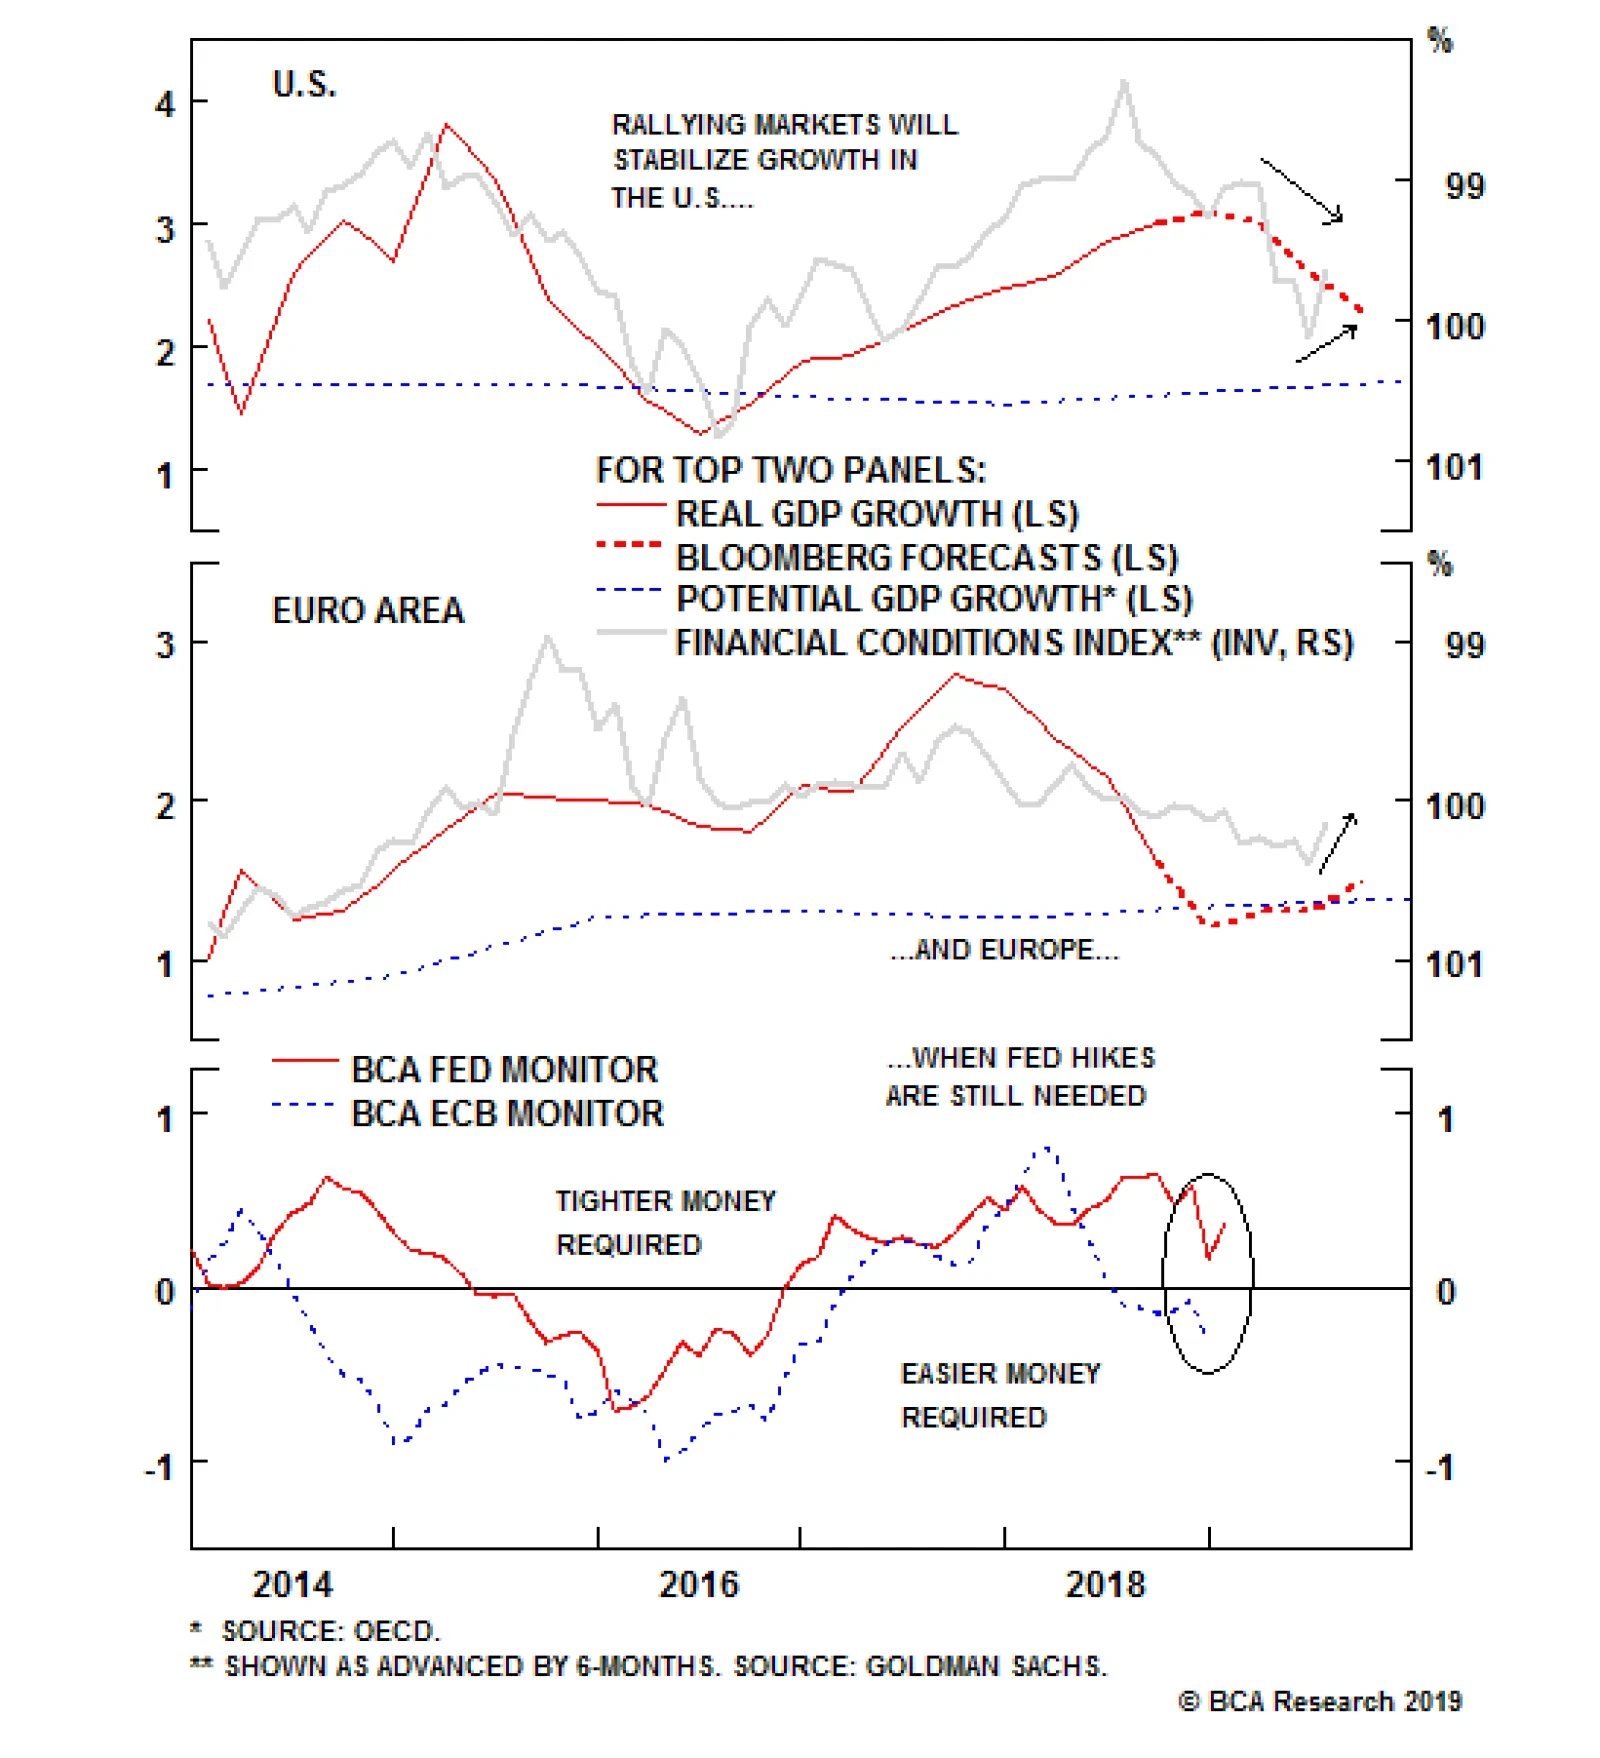
Highlights Uncertainty & Growth: There is currently a strong link between depressed global growth expectations and elevated levels of economic policy uncertainty (U.S.-China trade tensions, Brexit, etc). Monetary Policy: A growing number of central banks have taken “risk management” measures to try and prevent a deeper downturn in actual economic activity by shifting to a less hawkish policy bias – even with tight labor markets. Implications For Bond Yields: We do not expect the current soft patch for global growth to extend into a more prolonged period of weak activity, given that global policy rates remain at highly stimulative levels. This will set up the next wave of rising global bond yields, but likely not until the latter half of 2019 (and focused mostly on U.S. Treasury yields). Feature Central Banks Take Out Some Insurance The list of global central banks taking a more cautious stance on monetary policy expanded last week. The Bank of England and Reserve Bank of Australia both cut their growth forecasts for 2019 and signaled that there was no chance of interest rate increases in the near term. This follows similar guidance provided in recent weeks by the U.S. Federal Reserve, the Bank of Canada and Sweden’s Riksbank. There was even a dovish surprise in the emerging world, with the Reserve Bank of India delivering an unexpected rate cut last week. In Europe, the European Central Bank (ECB) has not yet shifted its already highly-dovish policy guidance (no rate hikes until at least September), but ECB President Mario Draghi recently noted that the downside risks to European growth have increased. The European Commission went a step further and downgraded its growth forecasts for 2019 last week. The Bank of Japan cut its inflation forecast for 2019 last month, also indicating that monetary policy would remain unchanged over at least the rest of the year. The language used by all of these policymakers to explain their dovish turn was eerily similar, highlighting elevated global uncertainty weighing on growth expectations and, through plunging asset prices, tightening financial conditions (Chart of the Week). The sources of that uncertainty are well known to investors: U.S.-China tariff negotiations, slowing global trade, Brexit, domestic U.S. political squabbles (i.e. government shutdowns over “The Wall”). Until those developments begin to get resolved, uncertainty will continue to weigh on economic confidence. Chart of the WeekThe “Risk Management” Approach To Setting Monetary Policy
The 'Risk Management' Approach To Setting Monetary Policy
The 'Risk Management' Approach To Setting Monetary Policy
21st Century central bankers mostly subscribe to a “risk management” approach to policymaking. This means setting policy dovish enough to cut off downside tail risks to growth during periods of elevated uncertainty about the economic outlook – especially when inflation is below policymaker targets. Yet central bankers remain devoted followers of the Phillips Curve framework. There is a limit to how dovish they can become while unemployment is low and wage growth is increasing. This limits how far government bond yields can fall if growth does not slow enough to cause unemployment to rise. So far, the softer global growth seen in recent quarters has not resulted in any increase in unemployment rates in the major developed economies. Of course, employment is a lagging variable. If the current soft patch for growth extends into a more prolonged slowdown in the coming months, resulting in companies cutting hiring or shedding labor to protect weakening profitability, then there is room for bond yields to continue to fall as markets begin to price in easier monetary policy. That is not our expectation. The U.S. economy remains on solid footing, and we anticipate additional policy actions from China to stabilize economic growth and put a floor under global trade activity. This will eventually cause central bankers to move back to a less dovish policy stance more consistent with trends in unemployment and inflation, with the U.S. Fed leading the way on that front in the latter half of 2019. The eventual result will be higher U.S. Treasury yields, both in absolute terms and relative to government bond yields of the other major developed economies. Bottom Line: There is currently a strong link between depressed global growth expectations and elevated levels of economic policy uncertainty. Central banks are taking the appropriate “risk management” measures to prevent a deeper downturn in actual economic activity by shifting to a less hawkish policy bias – even with tight labor markets. The Link Between Economic Confidence & Monetary Policy The pro-risk rally that opened 2019 endured its first test last week, with several major market prices – including the S&P 500 index, U.S. high-yield spreads, the 10-year Italy-Germany government bond yield differential and the DXY index of the U.S. dollar - bouncing off key medium-term moving averages (Chart 2). Purely from a technical analysis perspective, a test of the primary trends established in the latter half of 2018 (bearish equities and credit, bullish the U.S. dollar) was to be expected, particularly given the severity of the past selloff in global equity markets. Chart 2The First Test For The 2019 Risk Rally
The First Test For The 2019 Risk Rally
The First Test For The 2019 Risk Rally
Investor sentiment towards global growth, however, remains pessimistic. Nervousness over the outcome for the U.S.-China trade talks, with the March 1 deadline fast approaching, is an obvious source of concern given how slowing Chinese import demand has spilled over so dramatically into weaker global trade activity (Chart 3). Yet there are several other dates for investors to fret about in the near term, including the deadline for a deal to avert another U.S. government shutdown (this Friday), the U.S. debt ceiling deadline (also March 1) and “Brexit day” in the U.K. (March 29). Chart 3A China-Led Slowing Of Global Trade
A China-Led Slowing Of Global Trade
A China-Led Slowing Of Global Trade
Yet this current soft patch for the global economy is occurring alongside an extreme divergence between plunging growth expectations and more stable readings on current economic conditions. The fall in expectations is visible in the most countries, according to data series that measure confidence for businesses, consumers and investors. One such set of data that we pay close attention to is the ZEW survey. The ZEW survey, produced by a prominent German economic think tank, is most well-known for the data related to Germany itself. The ZEW also produces similar survey data measuring readings on “current conditions” and “expectations” for other major developed economies: the U.S., U.K., Japan, France, and Italy (as well as an aggregate measure for the entire euro area). This makes the ZEW data useful for conducting cross-country analysis of economic sentiment, as the survey structure and questions are consistent for each country. Looking at the individual country readings from the ZEW data, shown in Charts 4 and 5, it is clear that the depressed readings on global growth sentiment are similar across all major countries. Yet at the same time, the individual ZEW Current Conditions indices, while off their cyclical peaks, are exhibiting more diverse trends. The U.S., in particular, stands out as having a very robust reading on Current Conditions, which lines up with the overall firmness of the U.S. economic data. Chart 4A Co-Ordinated Decline Of Expectations, Not Actual Growth
A Co-Ordinated Decline Of Expectations, Not Actual Growth
A Co-Ordinated Decline Of Expectations, Not Actual Growth
Chart 5The European Growth Slump Is Broad-Based
The European Growth Slump Is Broad-Based
The European Growth Slump Is Broad-Based
The strong correlation between the ZEW Expectations readings suggests that there is a common factor causing market participants to become more worried about the outlook for global growth. These can all be summarized under “uncertainty”, for which we also have data available at the country level from the Economic Policy Uncertainty indices developed by researchers Scott Baker, Nick Bloom and Steven Davis.1 In Charts 6 and 7, we plot the Policy Uncertainty indices against the ZEW growth expectations indices for the individual countries/regions for which the ZEW conducts its surveys. The growth expectations data is shown inverted to correlate with the Policy Uncertainty indices. The visual relationship shows that the current period of elevated Policy Uncertainty has occurred alongside the plunge in growth expectations, seen most strongly in the U.S., U.K. and Italy. Chart 6Uncertainty Slamming Sentiment Hardest In The U.S. & U.K.
Uncertainty Slamming Sentiment Hardest In The U.S. & U.K.
Uncertainty Slamming Sentiment Hardest In The U.S. & U.K.
Chart 7Germany Weathering The Storm Better Than Italy & France
Germany Weathering The Storm Better Than Italy & France
Germany Weathering The Storm Better Than Italy & France
But can this link between uncertain and growth expectations result in an actual slowing of economic activity? Can slumping expectations become a self-fulfilling prophecy? One way to look at this is to see how growth expectations evolve relative to current economic growth. We show those gaps between the Current Conditions and Growth Expectations components of the ZEW survey in Charts 8 and 9. A rising line indicates a wide gap between Current Conditions and Expectations and vice versa. We also add real GDP growth in each panel of the charts, to compare that “ZEW Gap” to actual growth outcomes. Chart 8The “ZEW Gap” Now At Levels That Have Heralded Past Downturns …
The 'ZEW Gap' Now At Levels That Have Heralded Past Downturns...
The 'ZEW Gap' Now At Levels That Have Heralded Past Downturns...
Chart 9… Within Europe Too …
...Within Europe Too...
...Within Europe Too...
The current gap between the two measures is at or near the widest levels seen in the history of the ZEW data dating back to the early 1990s. The previous times that the ZEW Gap reached such levels, economic growth slowed for all the countries in the ZEW survey – most notably in the run-up to the recessions in the early 1990s, early 2000s and 2009. The ZEW Gap also accurately signaled the recessions seen within the euro area after the 2011 European Debt Crisis. The first implication of this result is large discrepencies between strong current growth and expectations almost always resolve themselves with actual weaker growth, if not outright recession – not a good sign for the global economy in the coming quarters. Yet one major difference between today and those prior episodes of a wide ZEW Gap is the level of monetary policy accommodation. In those prior episodes that ended in recession, central bankers raised policy rates to restrictive levels that eventually caused the growth slowdown. This can be seen in Chart 10, where we plot the ZEW Gaps vs the “Monetary Policy Gaps”, defined as the difference between actual central bank policy rates and an estimate of neutral rates derived from a simple Taylor Rule formula.2 Chart 10...But Monetary Policy Is Not Tight This Time
...But Monetary Policy Is Not Tight This Time
...But Monetary Policy Is Not Tight This Time
Today, central banks are maintaining policy rates far below levels of neutral consistent with long-run potential growth and economies operating at or beyond full capacity – even with inflation rates that are below central bank targets. This should help cushion the blow from weakening growth expectations stemming from the current period of elevated economic uncertainty. The root cause of all recessions is always monetary policy that becomes too restrictive. Typically, that occurs directly through central banks hiking rates above neutral and actively engineering a growth slowdown. It can also occur if an external shock to growth is severe enough to depress economic activity faster than policymakers can identify the slowdown and respond with easier monetary policy. The latter appears to be the outcome that investors are most worried about today. Yet with central banks now turning more dovish in response to elevated uncertainty, at a time when monetary policy appears already highly stimulative, the odds of a monetary policy error crushing growth are low. We are more worried about the opposite outcome, where policymakers are giving more stimulus to a global economy that does not necessarily need it, given that overly tight monetary policy is not the main problem at the moment. In other words, policymakers who have become more dovish today will need to become less dovish later, if and when the current laundry list of uncertainties begin to get resolved. We think that is only a real issue in the U.S. at the moment, though. Our Central Bank Monitors continue to indicate that tighter monetary policy is still required in the U.S. (Chart 11), unlike the Monitors from the U.K., euro area and Japan – the other countries where we have looked at the expectations/uncertainty relationship. Thus, we expect U.S. Treasury yields to have more upside than German Bund, U.K. Gilt or Japanese government bonds over the next 6-12 months. Chart 11The Message From Our CB Monitors - Stay Underweight U.S. Treasuries
The Message From Our CB Monitors - Stay Underweight U.S. Treasuries
The Message From Our CB Monitors - Stay Underweight U.S. Treasuries
Bottom Line: We do not expect the current soft patch for global growth to extend into a more prolonged period of weak activity, given that global policy rates remain at highly stimulative levels. This will set up the next wave of rising global bond yields, but likely not until the latter half of 2019 (and focused mostly on U.S. Treasury yields). Robert Robis, CFA, Senior Vice President Global Fixed Income Strategy rrobis@bcaresearch.com Footnotes 1 The full set of global Policy Uncertainty Indices, with data downloads and methodological descriptions, can be found at www.policyuncertainty.com. 2 Neutral Policy Rate = Potential GDP growth + central bank inflation target + (0.5 x (current inflation minus central bank inflation target)) +( 0.5 * the IMF estimate of the output gap)). Recommendations The GFIS Recommended Portfolio Vs. The Custom Benchmark Index
A Crisis Of Confidence?
A Crisis Of Confidence?
Duration Regional Allocation Spread Product Tactical Trades Yields & Returns Global Bond Yields Historical Returns
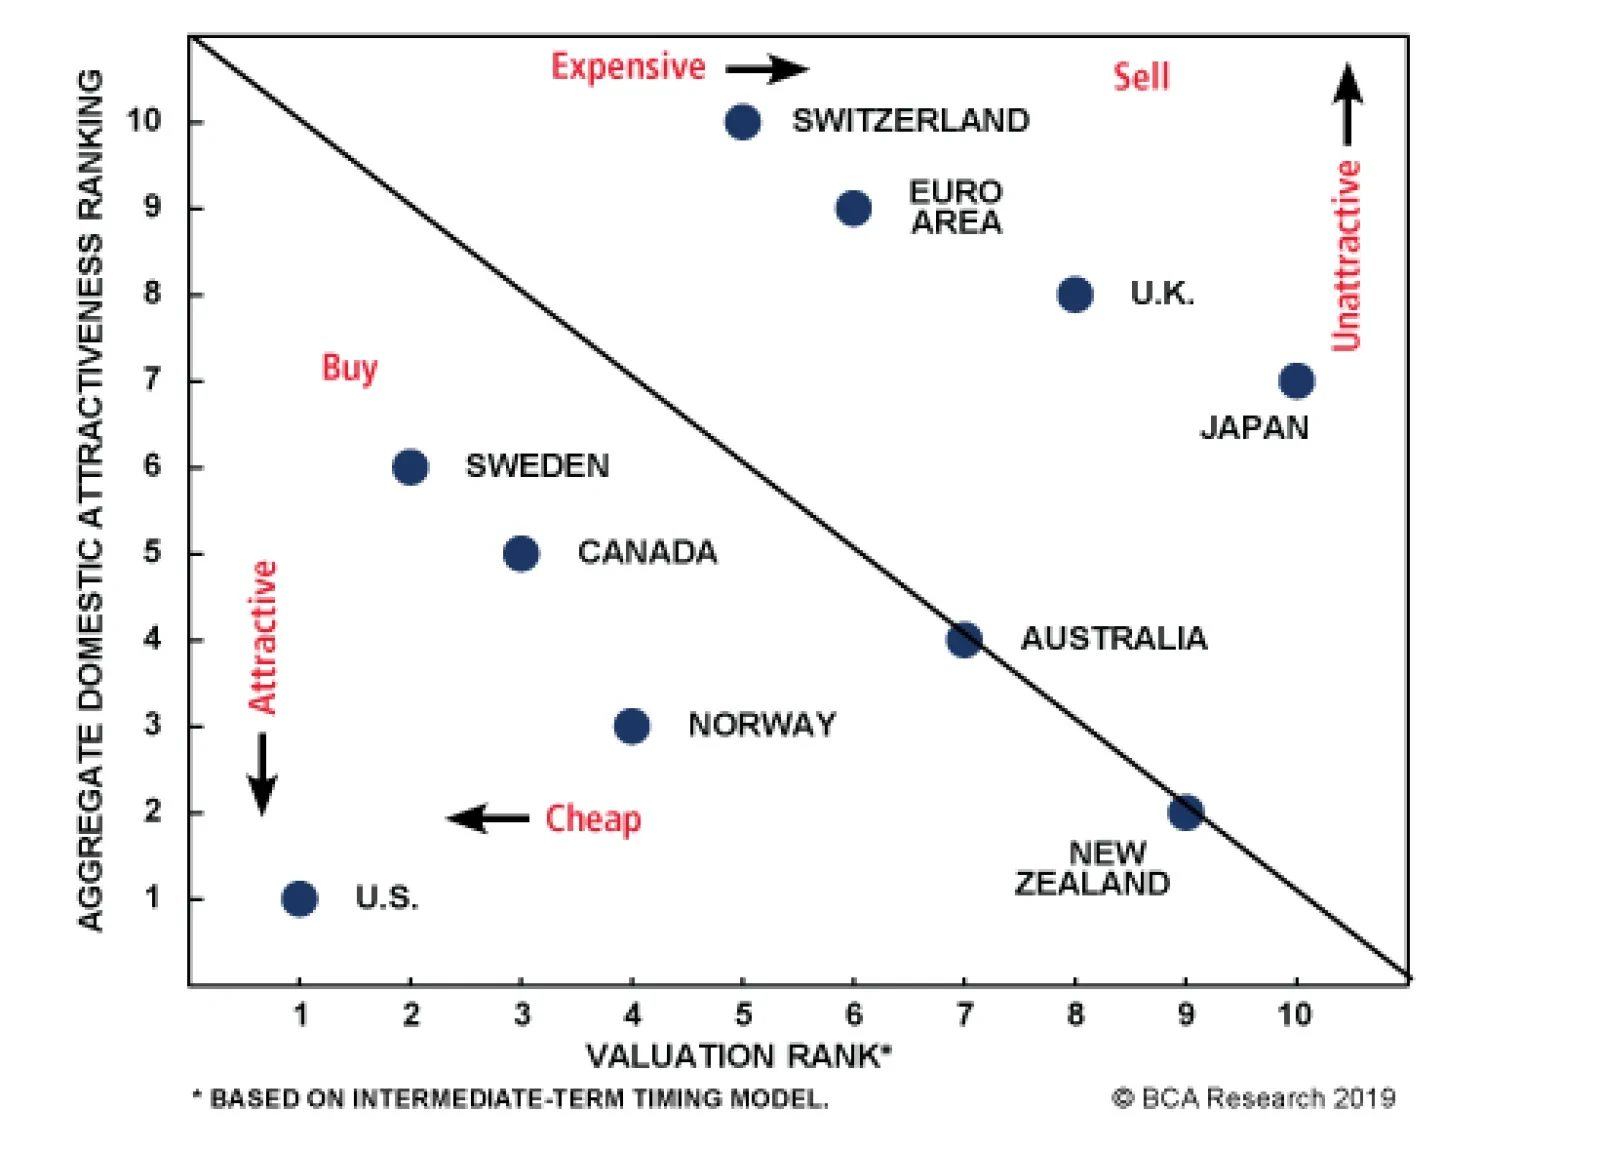
We often rely on our Intermediate-Term Timing Model (ITTM) to gauge if a currency is cheap or not. The above chart compares the Aggregate Domestic Attractiveness Ranking of G-10 currencies to their deviation from their ITTM. Countries at the bottom left offer…
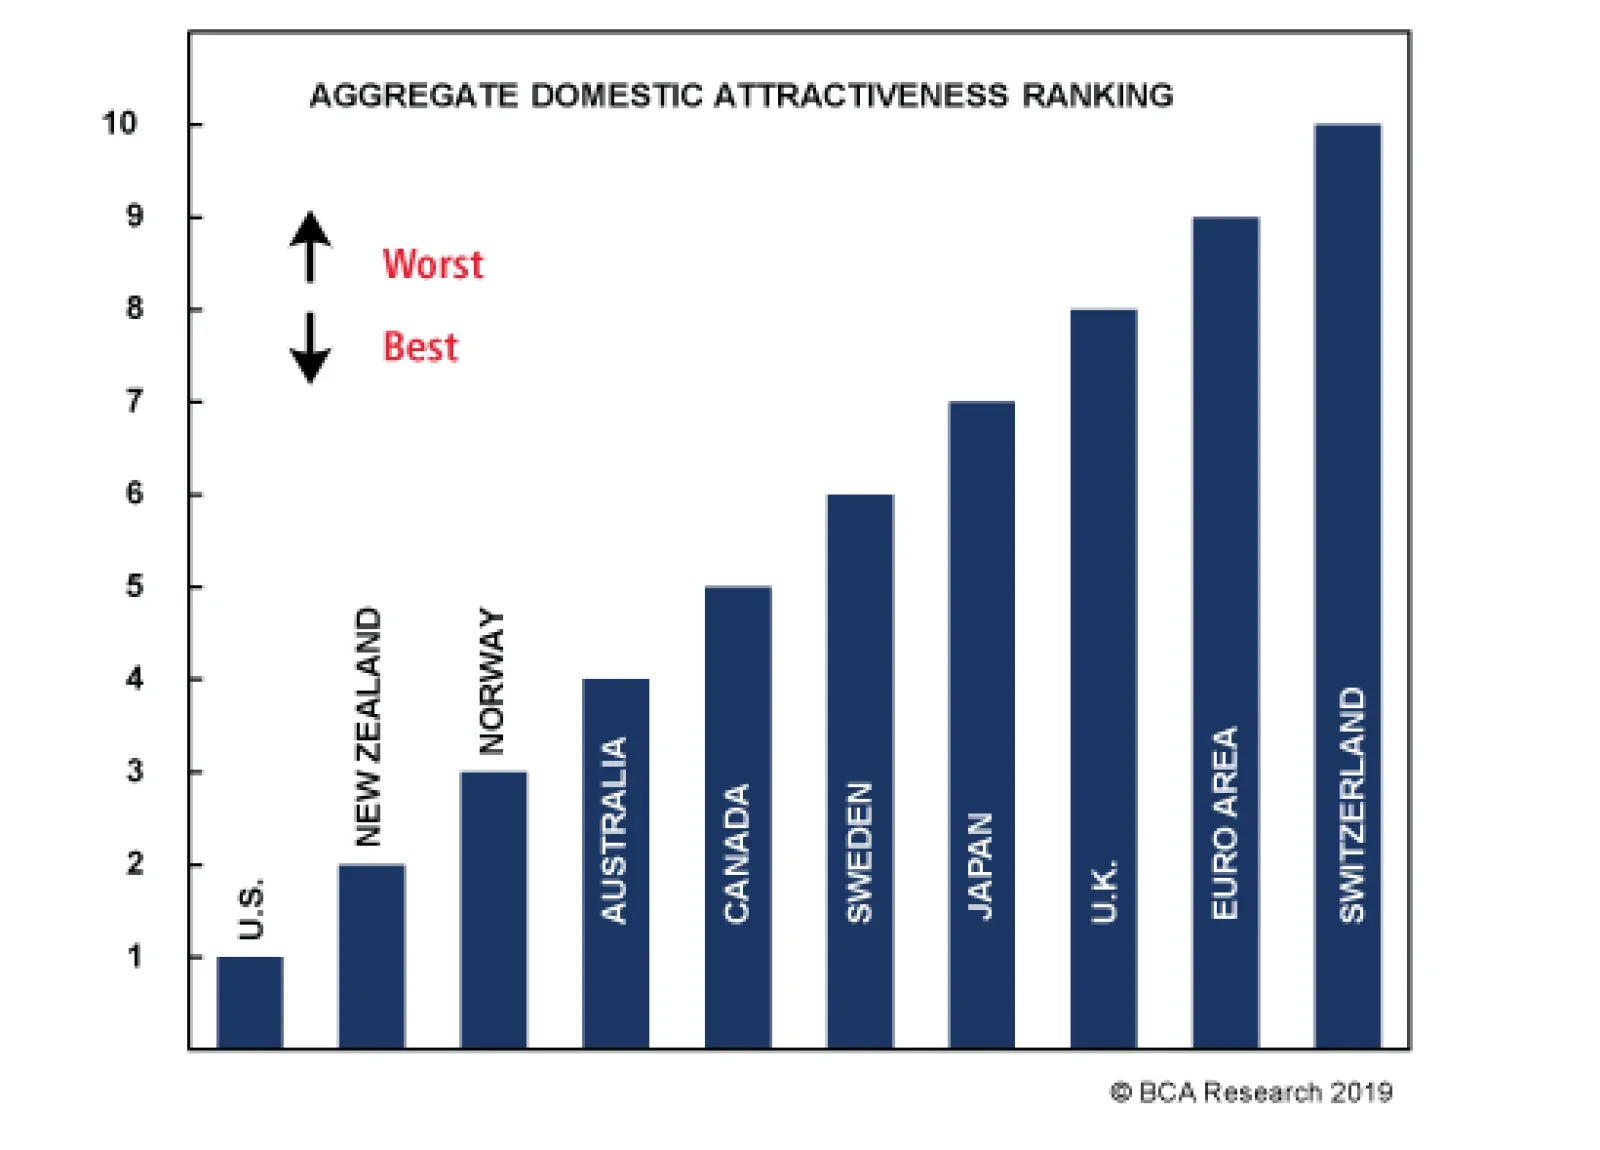
We build a ranking methodology using domestic economic variables only, intentionally excluding global business cycle factors. Essentially, we want to create an additional filter to be used independently of our main method. This way, we can develop a true…
The U.S. will experience a busy economic calendar next week. Not only are quite a few Fed speakers on tap, but also, some of the backlog of releases delayed by the government shutdown will come out. Tuesday will see the NFIB survey of small business…
At low yields, bond prices develop the same unattractive negative asymmetry as equities. Therefore, an extended period of ultra-low interest rates removes the need for an equity risk premium, and justifies sharply higher valuations for equities and other…
Highlights Hyman Minsky famously said that “stability begets instability.” The converse is also true: Instability begets stability. None of the preconditions for a U.S. recession are in place yet. The Fed’s decision to press the pause button on further rate hikes ensures that it will take at least another 18 months for monetary policy to turn restrictive. Global growth should accelerate by mid-2019, as Chinese stimulus kicks in and the headwinds facing Europe dissipate. Investors should overweight global equities and underweight bonds over the next 12 months. The leadership role in the equity space will gradually shift outside the United States. Feature The Long Shadow Of The Financial Crisis "Stability begets instability” declared Hyman Minsky in his widely cited, seldom-read book.1 By this, Minsky meant that periods of economic tranquility often encourage excessive risk-taking, sowing the seeds of their own demise. We would not quarrel with Minsky’s assessment, but we would point out that the converse is also true: Instability begets stability. Following periods of intense financial stress, lenders become more circumspect about whom they lend to, while borrowers become reluctant to take on debt. The result is economically bittersweet. On the plus side, the newfound caution of lenders and borrowers alike ensures that financial imbalances are slow to build up again. On the negative side, sluggish credit growth restrains spending. The net effect is a recovery that is often slow and uneven, but one which lasts longer than expected. Few Signs Of Major U.S. Economic Imbalances This is the world in which we find ourselves today. It took a decade following the subprime crisis for the U.S. to return to full employment. Much of Europe is not even there yet. Lenders continue to take risks. However, they have been quicker than usual to scale back exposure at the first sign of trouble. For example, as U.S. auto loan defaults began rising in 2015, banks tightened lending standards. As a result, the share of auto loans transitioning into delinquency peaked in Q4 of 2016 and has since drifted down modestly (Chart 1). Chart 1Lenders Are More Circumspect These Days: The Case Of Autos
Lenders Are More Circumspect These Days: The Case Of Autos
Lenders Are More Circumspect These Days: The Case Of Autos
A similar thing happened when corporate credit spreads blew out in 2015 following the crash in oil prices (Chart 2). Banks tightened lending standards starting in late 2015. Once defaults peaked in early 2017, banks started easing standards. Chart 2Banks Were Quick To Tighten Lending Standards In 2015
Banks Were Quick To Tighten Lending Standards In 2015
Banks Were Quick To Tighten Lending Standards In 2015
Tellingly, the distress in corporate debt markets in 2015-16 did not cause the financial system to seize up, as evidenced by the fact that financial stress indices only increased marginally during that period. This suggests that financial imbalances never had a chance to rise to a level that threatened the overall economy. The Preconditions For The Next U.S. Recession Are Not Yet In Place Today, the U.S. private-sector financial balance – the difference between what the private sector earns and spends – stands at a healthy surplus of 2.1% of GDP. Both of the last two recessions began when the private-sector balance was in deficit (Chart 3). Chart 3The Private Sector Is Not Living Beyond Its Means The Way It Was Before The Last Two Recessions
The Private Sector Is Not Living Beyond Its Means The Way It Was Before The Last Two Recessions
The Private Sector Is Not Living Beyond Its Means The Way It Was Before The Last Two Recessions
This raises an intriguing question: If the U.S. private sector is not suffering from any major imbalances, what is going to cause the next recession? That’s a very good question, with no obvious answer! The past two recessions were triggered by the bursting of asset bubbles – first the dotcom bubble and then the housing bubble. Today, U.S. equities are far from cheap, but with the S&P 500 trading at 16.1-times forward earnings, they are hardly in a bubble (Chart 4). The housing market is also on much firmer footing: The homeowner vacancy rate is near all-time lows, while the quality of mortgage lending has been very high (Chart 5). Chart 4While U.S. Stocks Are Not Cheap, They Aren't In A Bubble
While U.S. Stocks Are Not Cheap, They Aren't In A Bubble
While U.S. Stocks Are Not Cheap, They Aren't In A Bubble
Chart 5Housing Fundamentals Are Solid
Housing Fundamentals Are Solid
Housing Fundamentals Are Solid
Of course, recessions can occur for reasons other than the bursting of asset bubbles. The 1973-74 recession and the recessions of the early 1980s were triggered by a surge in oil prices, requiring the Fed to hike rates aggressively. Luckily, such an oil-induced recession is highly unlikely today. Inflation expectations are better anchored, while oil consumption represents a much smaller share of GDP than it did back then (Chart 6). In addition, the U.S. has become a major oil producer, which implies that the drag to consumers from higher oil prices would be partly offset by increased capital spending in the energy sector. At any rate, the ability of shale producers to respond to higher prices with additional output limits the extent to which prices can rise in the first place. Chart 6An Oil Price Shock Is Unlikely To Cause A Recession
An Oil Price Shock Is Unlikely To Cause A Recession
An Oil Price Shock Is Unlikely To Cause A Recession
Past economic downturns have also been caused by major adjustments in the cyclical parts of the economy. As a share of GDP, cyclical spending is lower today than it has been at the outset of most recessions (Chart 7). The proliferation of just-in-time inventory systems has also reduced the influence that inventory swings have on the economy (Chart 8). Chart 7Cyclical Spending Is Not Extended
Cyclical Spending Is Not Extended
Cyclical Spending Is Not Extended
Chart 8
A severe tightening of fiscal policy can also trigger a recession.2 Fortunately, the end of the government shutdown reduces the risk of such an outcome. Rightly or wrongly, voters blamed President Trump for the recent closure (Chart 9). As we speak, the Trump administration is negotiating with Democrats to avert another shutdown slated to begin on February 15. The key item of contention concerns funding for a border wall with Mexico. Even if a deal falls through, rather than shuttering the government again, Trump will probably pursue funding for the wall by declaring a national emergency. Our geopolitical strategists believe such an action will be challenged by the Democrats, but is likely to be upheld by the Supreme Court. Chart 9''I Am Proud To Shut Down The Government''
''I Am Proud To Shut Down The Government'''
''I Am Proud To Shut Down The Government'''
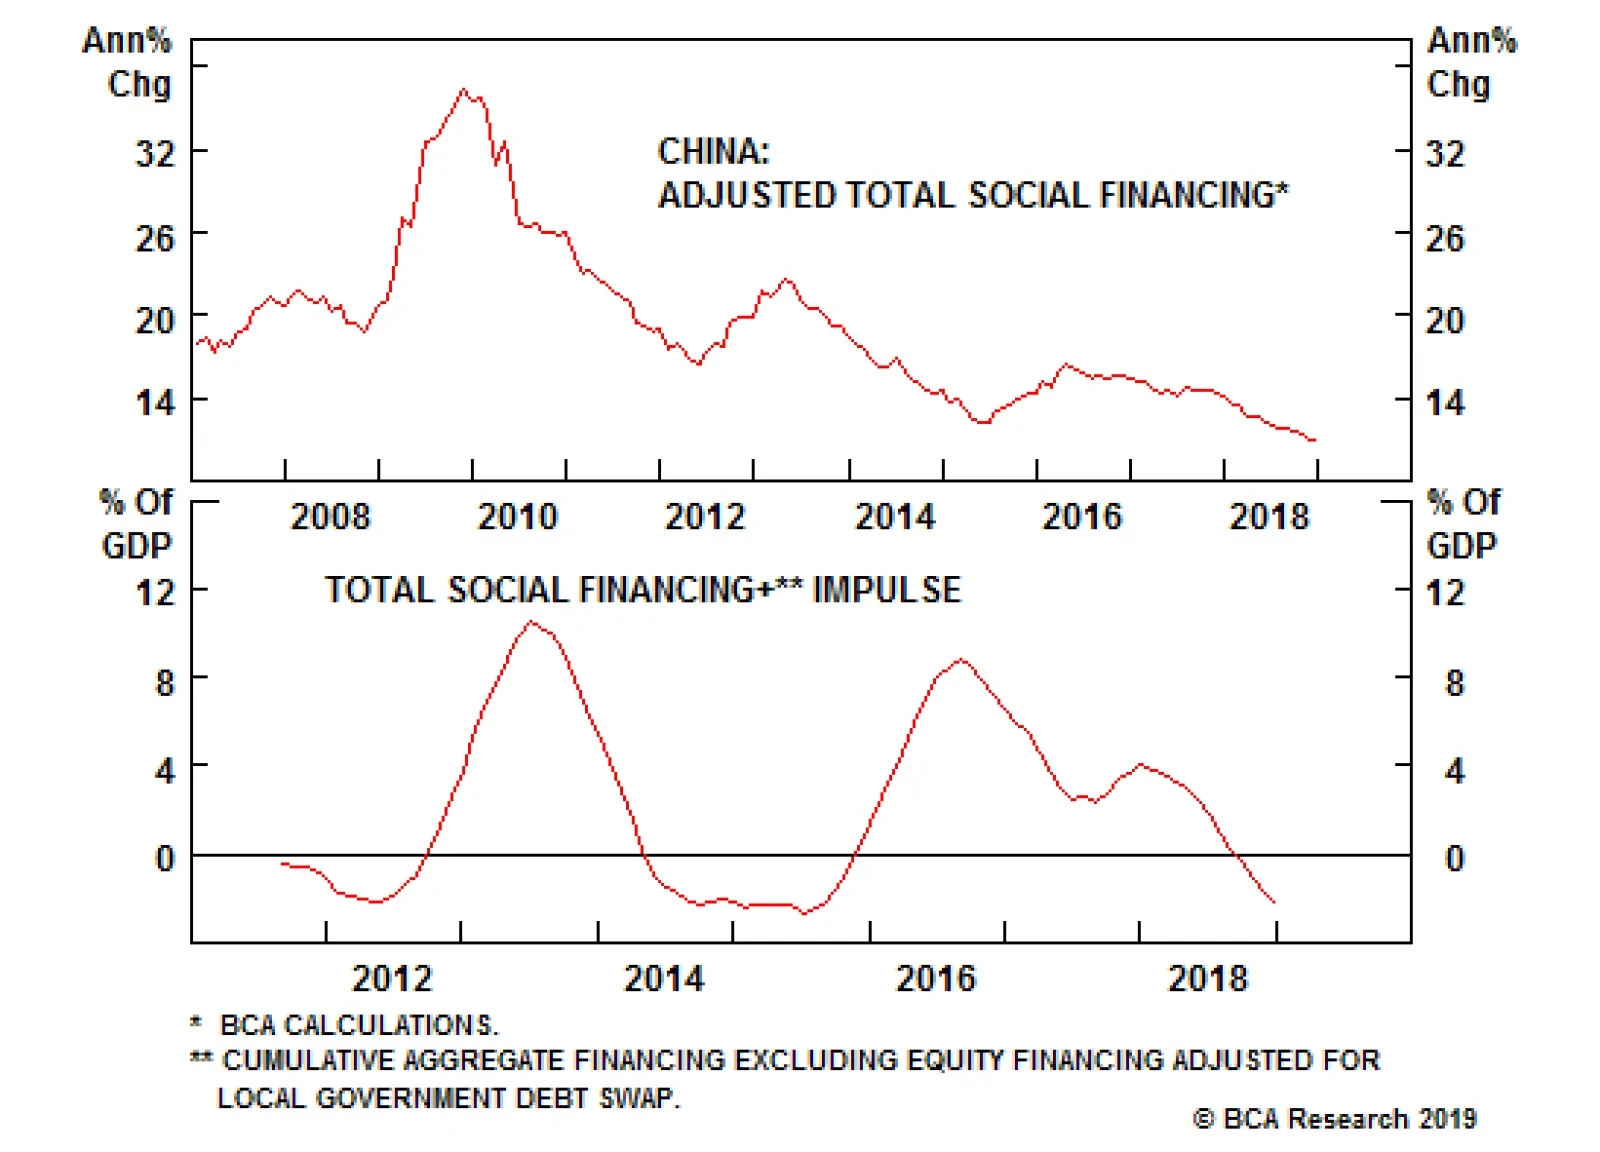
Global Growth Should Improve Admittedly, the external environment now has a greater influence on the U.S. economy than in the past. Nevertheless, given that exports are only 12% of GDP, it would take a sizeable external shock to knock the U.S. into recession. We think that such a shock is not in the cards. The trade war is likely to go on hiatus as Trump seeks to take credit for a deal with China. In addition, as we discussed two weeks ago, China will scale back its deleveraging campaign now that credit growth has fallen close to nominal GDP growth (Chart 10).3 Chart 10China: Time To Scale Back Deleveraging
China: Time To Scale Back Deleveraging
China: Time To Scale Back Deleveraging
Euro area growth should reaccelerate over the coming months thanks to lower oil prices, a revival in EM demand, modestly more stimulative fiscal policy, and the palliative effects from the decline in government bond yields across the region. We have also argued that the risks of a “Hard Brexit” should abate.4 Waiting... And Waiting For Inflation To Rise When the next recession rolls around, it will probably be sparked by a surge in inflation, which forces the Fed to raise interest rates much more rapidly than it has so far. Here is the thing though: Inflation is a highly lagging indicator. It usually only peaks long after a downturn has started and troughs after the recovery is well underway (Chart 11).
Chart 11
Consider the example of the 1960s. The unemployment rate fell below NAIRU in 1964, but it took another four years for inflation to break out in earnest (Chart 12). The U.S. unemployment rate has been below NAIRU only since 2017. The unemployment rate in Germany and Japan has been below NAIRU for much longer, yet inflation remains stubbornly low in both countries (Chart 13). Chart 12It Took An Overheated Economy For Inflation To Take Off In The Late-1960s
It Took An Overheated Economy For Inflation To Take Off In The Late-1960s
It Took An Overheated Economy For Inflation To Take Off In The Late-1960s
Chart 13The U.S., Japanese, And German Economies Are At Full Employment
The U.S., Japanese, And German Economies Are At Full Employment
The U.S., Japanese, And German Economies Are At Full Employment
Cheer Up This leaves us with a striking conclusion: Perhaps the next U.S. recession is not around the corner, as some grumpy economists seem to think. Perhaps this economic expansion can endure beyond 2020. The recent U.S. data has certainly been consistent with that thesis. The ISM manufacturing index rose 2.3 percentage points to 56.6 in January. New orders jumped by 6.9 percentage points to 58.2. Payroll growth has also accelerated. Real aggregate earnings are up 4.2% from a year earlier, the fastest pace since October 2015 (Chart 14). Chart 14U.S. Labor Income Growth Has Been Accelerating
U.S. Labor Income Growth Has Been Accelerating
U.S. Labor Income Growth Has Been Accelerating
Housing data are showing tentative evidence of stabilization. New home sales are rebounding, while mortgage applications are back near cycle-highs (Chart 15). Chart 15Housing Activity Is Stabilizing After Last Year's Weakness
Housing Activity Is Stabilizing After Last Year's Weakness
Housing Activity Is Stabilizing After Last Year's Weakness
Reflecting these positive developments, the Citigroup economic surprise index has jumped into positive territory (Chart 16). The New York Fed’s estimate for Q1 2019 GDP growth has also moved up to 2.4%. Chart 16U.S. Economic Data Are Beating Low Expectations
U.S. Economic Data Are Beating Low Expectations
U.S. Economic Data Are Beating Low Expectations
Investment Conclusions Recessions and bear markets usually overlap (Chart 17). With the next recession still at least 18 months away, it is premature to turn bearish on equities. We upgraded stocks in December following the post-FOMC sell-off. Although our tactical MacroQuant model is pointing to an elevated risk of a setback over the next few weeks, we continue to see global equities finishing the year 5%-to-10% above current levels. As global growth bottoms out mid-year, the leadership role in equity markets should increasingly move away from the U.S. towards EM and Europe. Chart 17Recessions And Bear Markets Usually Overlap
Recessions And Bear Markets Usually Overlap
Recessions And Bear Markets Usually Overlap
Bonds are a tougher call. We do not expect the Fed to raise rates again at least until June. This will limit the upside for bond yields, as well as the dollar, in the near term. Nevertheless, with the fed funds futures pricing in no rate hikes for the next few years, even a modest shift back to tightening in the second half of this year and beyond will push up bond yields, dampening total returns to fixed income. Looking beyond 2019, the case for maintaining a short duration stance in fixed-income portfolios is very strong. The longer the Fed allows the economy to overheat, the greater the eventual overshoot in inflation will be. Inflation expectations have fallen over the past few months (Chart 18). They should have risen. Ultimately, Gentle Jay Powell’s decision to press the pause button on further rate hikes means that rates will end up peaking at a higher level during this cycle than they would have otherwise. Chart 18Inflation Expectations Have Declined
Inflation Expectations Have Declined
Inflation Expectations Have Declined
Peter Berezin, Chief Global Strategist Global Investment Strategy peterb@bcaresearch.com Footnotes 1 As argued in Hyman P. Minsky, “Stabilizing an Unstable Economy,” Yale University Press, (1986). 2 Severe episodes of fiscal tightening have normally followed military demobilizations. These include the recessions following WW1, WW2, and the Korean War, and to a much lesser extent, the 1990-91 recession which was exacerbated by cuts to the defense budget at the end of the Cold War. 3 Please see Global Investment Strategy Weekly Report, “China’s Savings Problem,” dated January 25, 2019. 4 Please see Global Investment Strategy Weekly Report, “Patient Jay,” dated January 18, 2019. Strategy & Market Trends MacroQuant Model And Current Subjective Scores
Chart 19
Tactical Trades Strategic Recommendations Closed Trades
Highlights Since 2008, no developed economy central bank has been able to hike interest rates sequentially by more than 2 percent before needing to take a breather… and then reverse course. The current vulnerability to further tightening emanates from stock markets and risk spreads. Through the next couple of years U.S. long bonds will strongly outperform German bunds… …and USD/EUR will trend lower. Since October 2017, no stock market rally or sell-off has lasted more than three months. Overweight equities tactically, but don’t get too comfortable. The broad stock market will remain trendless, but offer excellent tactical opportunities in both directions. Feature More than a decade has passed since the Global Financial Crisis. Yet through the past ten years, no developed economy central bank has been able to hike interest rates sequentially by more than 2 percent before needing to take a breather… and then swiftly reverse course. 2019 is a pivotal year for monetary policy because it will answer a fundamental question: will the 2 percent limit for monetary tightening that has held since 2008 continue to hold, or finally break? (Chart of the Week). The answer will have a huge bearing on European investment strategy for equities, bonds and currencies. Chart of the WeekSince 2008, The Limit For Sequential Rate Hikes Has Been 2 Percent... So Far
Since 2008, The Limit For Sequential Rate Hikes Has Been 2 Percent... So Far
Since 2008, The Limit For Sequential Rate Hikes Has Been 2 Percent... So Far
A History Of Policy Reversals Swedish interest rates peaked near 5 percent in 2008 before collapsing to the zero bound in the financial crisis. But when the Riksbank started its so-called ‘policy normalisation’ in 2010, the interest rate could only reach 2 percent before the central bank had to backtrack; Norway could manage just 1 percent of tightening before its volte-face. Admittedly, Sweden and Norway were caught in the maelstrom of the euro debt crisis in 2011-12. But on the other side of the world and relatively immune to the crisis in Europe, New Zealand could achieve a tightening of only 1 percent; Korea could manage just 1.25 percent (Chart I-2); the Reserve Bank of Australia marched interest rates up by 1.75 percent before taking a breather… and then marched them down again. Chart I-2Since 2008, The Limit For Sequential Rate Hikes Has Been 2 Percent
Since 2008, The Limit For Sequential Rate Hikes Has Been 2 Percent
Since 2008, The Limit For Sequential Rate Hikes Has Been 2 Percent
The Federal Reserve has sequentially raised interest rates by 2 percent, and guess what? It has just decided to take a breather! Last week, Chairman Jay Powell was asked the question as plainly as possible: is the next move in interest rates as likely to be up as down? And his answer: “we don’t have a strong prior… we will patiently wait and let the data clarify.”1 There is no requirement at BCA for strategists to agree. In fact, the opposite is true in that we encourage independent thinking and diverse ways of looking at the world. BCA’s house view is that the Fed will resume its sequential hiking later in the year. But I believe this takes a too rosy view on the global financial system’s capacity to tolerate further tightening. The Vulnerability Is In Stock Markets And Risk Spreads Monetary policy operates on an economy by adjusting its financial conditions: its bond yields, credit availability, currency, stock market, and risk spreads. And the neutral monetary policy stance – the so-called ‘neutral real interest rate’ – is the policy stance consistent with the economy growing at trend. In the past, a simple rule of thumb was that real rates, over time, should approximate to the real growth in the economy. But some studies argue that the neutral real rate may now be close to zero. All the Fed has done is bring the real interest rate out of negative territory to barely above zero. Yet its recent hikes have been blamed for extreme volatility in stock markets and risk spreads. Last week, Powell acknowledged that if there is a sustained change in financial conditions through any one or more of its components then “that has to play into our thinking.” Furthermore, “the policy stance is now in the range of the Committee’s estimates of neutral… and when you get to that (neutral) range we have to put aside our own priors and let the data speak to us.” All of which raises a salutary observation from my colleague Martin Barnes, BCA Chief Economist: if a real interest rate that is barely above zero is enough to trigger extreme market volatility and threaten the economic expansion, then the system is much more vulnerable than generally assumed.2 Martin has hit the nail on the head. At the current level of tightening, the system is much more vulnerable than generally assumed. But the vulnerable components of financial conditions are not bond yields, credit availability, or currency; the vulnerability emanates from stock markets and risk spreads, and specifically their potential for extreme volatility. Previous reports have focused on the source of this vulnerability. To recap, at low yields, bond prices develop the same unattractive negative asymmetry as equities. Therefore, an extended period of ultra-low interest rates removes the need for an equity risk premium, and justifies sharply higher valuations for equities and other risk-assets. But when the 10-year global bond yield rises back to around 2 percent, the process viciously reverses: bond prices lose their negative asymmetry, re-requiring an equity risk premium and sharply lower valuations for risk-assets.3 Put simply, when interest rates rise from low levels they undermine the support for elevated risk-asset valuations in a viciously non-linear way. The consequent plunge in risk-asset prices aggressively tightens financial conditions and thereby sets an unusually low ceiling for nominal interest rates and bond yields. This dynamic proved to be the major feature of the financial market landscape in 2018 and will loom large in 2019 too. It also solves the riddle as to why the neutral real rate may now be close to zero. An unusually low ceiling for the nominal interest rate combined with inflation hovering around 2 percent, translates into a neutral real interest rate that is not much higher than zero. The Investment Implications When the Riksbank paused after its near 2 percent of hiking, it proved to be a good structural entry point for Swedish long bonds, and a good structural exit point for the Swedish krona (Chart I-3 and Chart I-4). Likewise, when the Reserve Bank of Australia paused after its near 2 percent of hiking, it was an excellent moment to buy Australian long bonds and to sell the Australian dollar (Chart I-5 and Chart I-6). Chart I-3When The Riksbank Paused, It Was A Good Structural Entry Point In To Swedish Bonds...
When The Riksbank Paused, It Was A Good Structural Entry Point In To Swedish Bonds...
When The Riksbank Paused, It Was A Good Structural Entry Point In To Swedish Bonds...
Chart I-4...And A Good Structural Exit Point Out Of The Swedish Krona
...And A Good Structural Exit Point Out Of The Swedish Krona
...And A Good Structural Exit Point Out Of The Swedish Krona
Chart I-5When The RBA Paused, It Was A Good Structural Entry Point In To Australian Bonds...
When The RBA Paused, It Was A Good Structural Entry Point In To Australian Bonds...
When The RBA Paused, It Was A Good Structural Entry Point In To Australian Bonds...
Chart I-6...And A Good Structural Exit Point Out Of The Australian Dollar
...And A Good Structural Exit Point Out Of The Australian Dollar
...And A Good Structural Exit Point Out Of The Australian Dollar
Will the the 2 percent limit for monetary tightening that has held since 2008 continue to hold? If, as we expect, the answer is yes the implication is that through the next couple of years U.S. long bonds will strongly outperform German bunds. Over the same time frame, USD/EUR will trend lower (Chart I-7 and Chart I-8). Chart I-7A Good Structural Entry Point In To Long T-Bonds/Short Bunds
A Good Structural Entry Point in To Long T-Bonds/Short Bunds
A Good Structural Entry Point in To Long T-Bonds/Short Bunds
Chart I-8A Good Structural Exit Point Out Of USD/EUR
A Good Structural Exit Point Out Of USD/EUR
A Good Structural Exit Point Out Of USD/EUR
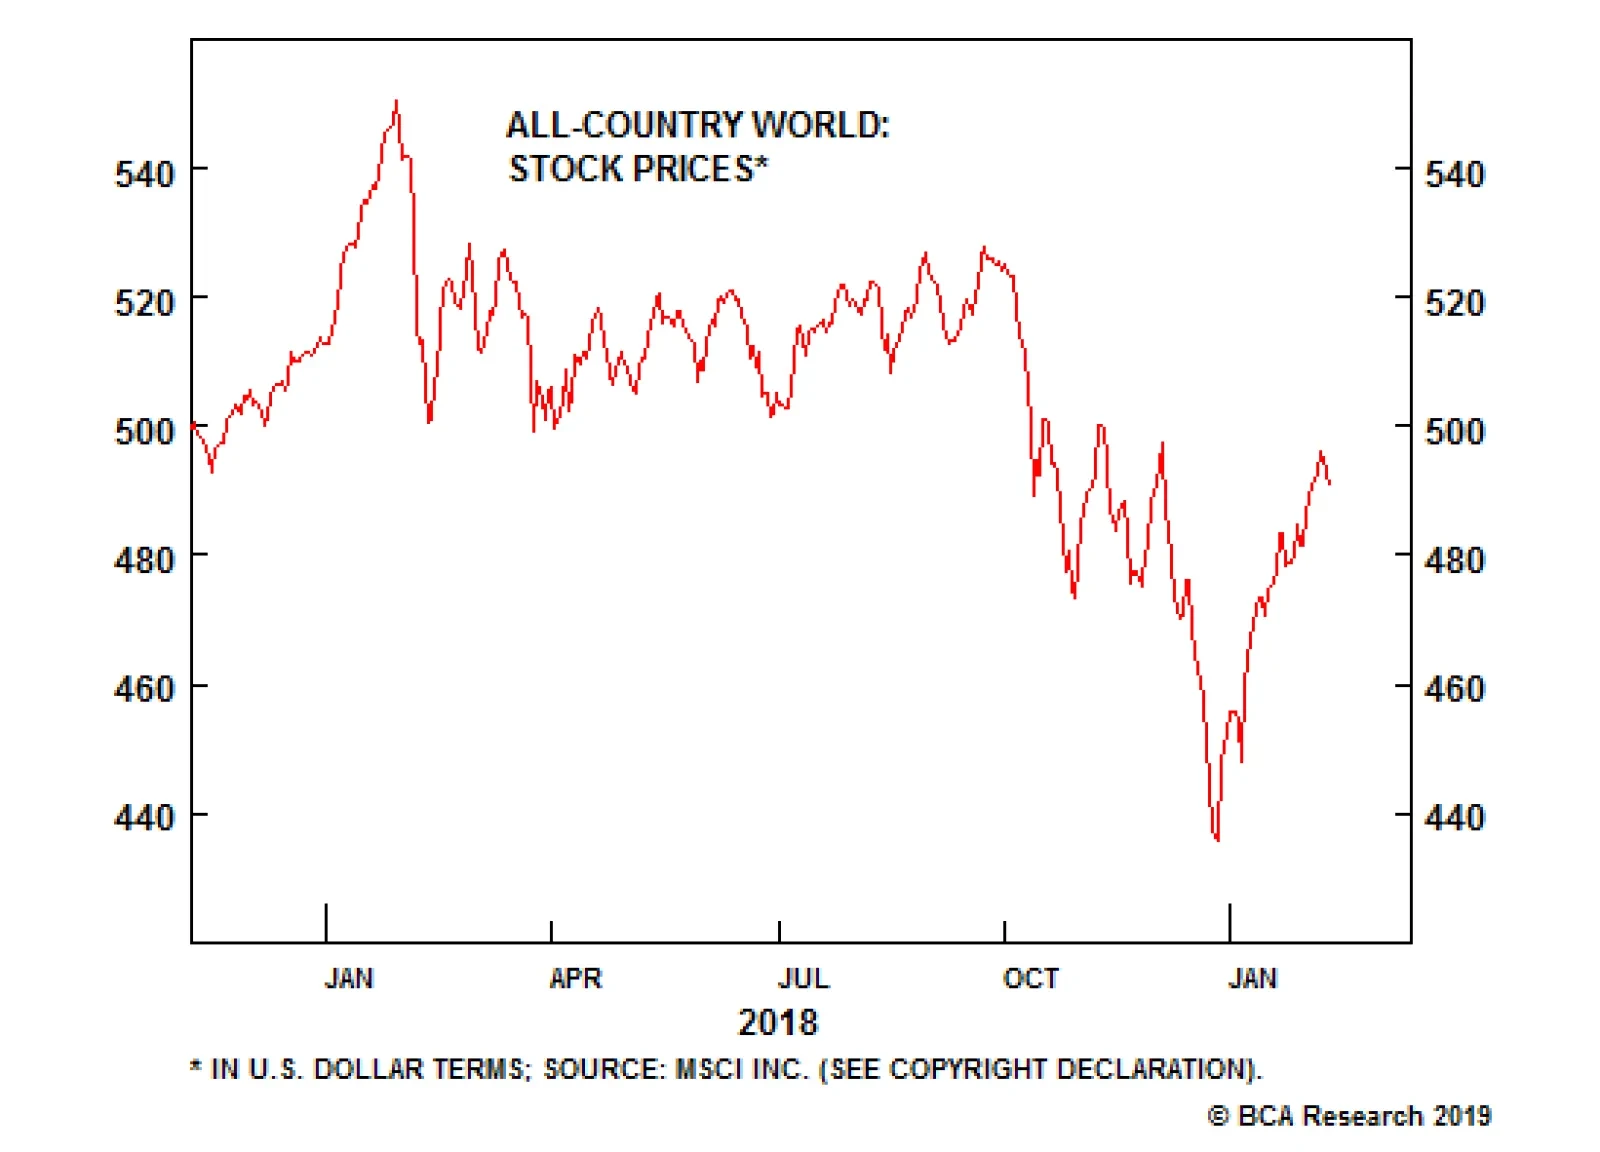
Finally, as regards the broad stock market, a quick glance at the MSCI all country world index shows a striking feature. Since October 2017, no rally or sell-off has lasted more than three months (Chart I-9). Given the current highly non-linear relationship between equities and bond yields, this pattern is set to continue. Chart I-9Since October 2017, No Rally Or Sell-Off Has Lasted More Than Three Months
Since October 2017, No Rally Or Sell-Off Has Lasted More Than Three Months
Since October 2017, No Rally Or Sell-Off Has Lasted More Than Three Months
In essence, the broad stock market will remain trendless, but offer excellent tactical opportunities in both directions. The current stance is tactically long, but don’t get too comfortable! Fractal Trading System* The sharp recent rally in government bonds has hit a point where tight liquidity conditions could trigger a temporary reversal. Accordingly, the 65-day trade is to go short 30-year T-bonds, setting a profit target at 3 percent with a symmetrical stop-loss. All of the five other open positions are in healthy profit. For any investment, excessive trend following and groupthink can reach a natural point of instability, at which point the established trend is highly likely to break down with or without an external catalyst. An early warning sign is the investment’s fractal dimension approaching its natural lower bound. Encouragingly, this trigger has consistently identified countertrend moves of various magnitudes across all asset classes. Chart I-10
Short U.S. 30 year T-Bond
Short U.S. 30 year T-Bond
The post-June 9, 2016 fractal trading model rules are: When the fractal dimension approaches the lower limit after an investment has been in an established trend it is a potential trigger for a liquidity-triggered trend reversal. Therefore, open a countertrend position. The profit target is a one-third reversal of the preceding 13-week move. Apply a symmetrical stop-loss. Close the position at the profit target or stop-loss. Otherwise close the position after 13 weeks. Use the position size multiple to control risk. The position size will be smaller for more risky positions. Dhaval Joshi, Senior Vice President Chief European Investment Strategist dhaval@bcaresearch.com * For more details please see the European Investment Strategy Special Report “Fractals, Liquidity & A Trading Model,” dated December 11, 2014, available at eis.bcaresearch.com Footnotes 1 The Federal Reserve has raised the federal funds rate by a total of 2.25 percent comprising an isolated 0.25 percent hike at the end of 2015 and a sequential 2 percent hike from December 2016 through December 2018. 2 Please see the BCA Special Report “A Grumpy View Of The Outlook” January 28, 2019 available at www.bcaresearch.com 3 Please see the European Investment Strategy Weekly Report “Risk: The Great Misunderstanding Of Finance”, October 25, 2018 available at eis.bcaresearch.com Fractal Trading System Recommendations Asset Allocation Equity Regional and Country Allocation Equity Sector Allocation Bond and Interest Rate Allocation Currency and Other Allocation Closed Fractal Trades Trades Closed Trades Asset Performance Currency & Bond Equity Sector Country Equity Indicators Bond Yields Chart II-1Indicators To Watch - Bond Yields
Indicators To Watch - Bond Yields
Indicators To Watch - Bond Yields
Chart II-2Indicators To Watch - Bond Yields
Indicators To Watch - Bond Yields
Indicators To Watch - Bond Yields
Chart II-3Indicators To Watch - Bond Yields
Indicators To Watch - Bond Yields
Indicators To Watch - Bond Yields
Chart II-4Indicators To Watch - Bond Yields
Indicators To Watch - Bond Yields
Indicators To Watch - Bond Yields
Interest Rate Chart II-5Indicators To Watch - Interest Rate Expectations
Indicators To Watch - Interest Rate Expectations
Indicators To Watch - Interest Rate Expectations
Chart II-6Indicators To Watch - Interest Rate Expectations
Indicators To Watch - Interest Rate Expectations
Indicators To Watch - Interest Rate Expectations
Chart II-7Indicators To Watch - Interest Rate Expectations
Indicators To Watch - Interest Rate Expectations
Indicators To Watch - Interest Rate Expectations
Chart II-8Indicators To Watch - Interest Rate Expectations
Indicators To Watch - Interest Rate Expectations
Indicators To Watch - Interest Rate Expectations
Both central banks cited similar risks to justify their increasingly cautious outlook, such as financial market instability related to geopolitical uncertainty. Importantly, neither the Fed nor the ECB expressed conviction that monetary policy settings had…
Highlights After rising for thousands of years, human intelligence has begun to decline in developed economies. This can be seen in falling IQ scores and a decline in math and science test scores. Environmental factors appear to account for the bulk of this decline, but no one knows what these factors are. If left unchecked, falling intelligence will severely undermine productivity growth. This could lead to lower equity multiples, larger budget deficits, and ultimately, much higher government bond yields. Technological advances, particularly in the genetic realm, promise to radically raise IQs. In a complete abandonment of its one-child policy, China will combine these controversial technologies with pro-natal measures in order to boost sagging birth rates. The coming Eugenic Wars will be one of the most important economic and geopolitical developments of the 21st century. Feature Part 1: What The Tame Fox Says In 1959, a Soviet scientist named Dmitry Belyaev embarked on an ambitious experiment: to domesticate the silver fox. A geneticist by training, Belyaev wanted to replicate the process by which animals such as cats and dogs came to live side-by-side with humans. It was a risky endeavor. The Soviets had essentially banned the study of Mendelian genetics in favor of the blank slate ideology that is popular in progressive circles today. Belyaev persevered. Working under the guise of studying vulpine physiology, he selected foxes based on only one trait – tamability. Less than 10% of foxes made it to the subsequent generation, with the other 90% being sent off to fur farms. By the fourth generation, the changes were undeniable. Rather than fleeing humans, the foxes sought out their attention with no prompting whatsoever. They even wagged their tails and whined and whimpered like dogs do. The tame foxes also displayed physical changes. Their ears flopped over. Their snouts became shorter and their tails stood upright. “By intense selective breeding, we have compressed into a few decades an ancient process that originally unfolded over thousands of years,” wrote Lyudmila Trut, who began as Belyaev’s assistant and took over the project when her boss died in 1985. Genetically Capitalist? Evolution can broadly proceed in two ways. The first way is through random mutations. This form of evolution, which scientists sometimes refer to as genetic drift, can take thousands of years to yield any discernable changes. The second way is through natural selection, a process that exploits existing variations in genetic traits. As the Russian fox experiment illustrates, evolution driven by selective pressures (either natural or artificial) can occur fairly quickly. Did selective pressures manifest themselves in human evolution in the lead up to the Industrial Revolution? Did humans, in some sense, domesticate themselves? In his book, A Farewell To Alms, economic historian Gregory Clark argued in the affirmative. Clark documented that members of skilled professions in Medieval England had twice as many surviving children as unskilled workers (Chart 1). Indeed, the fledgling middle class of the time had even more surviving children than the aristocracy, who were often out fighting wars. As a result, the wages of craftsmen declined by a third relative to laborers between 1200 and 1800, implying that the supply of skilled labor was growing more quickly than the demand for skilled workers over this period.
Chart 1
In subsequent work, Clark and Cummins argued that the spread of bourgeois values across pre-industrial England was more consistent with a model of genetic transmission than a cultural one (see Box 1 for details). Similar developments occurred in other parts of the world. For example, in China, the gateway into the bureaucracy for a thousand years was the highly competitive imperial exam. Xi Song, Cameron Campbell, and James Lee showed that high-status men had more surviving children during the eighteenth- and nineteenth-centuries (Chart 2).1
Chart 2
The 10,000 Year Explosion Stephen Jay Gould famously said that “There’s been no biological change in humans in 40,000 or 50,000 years. Everything we call culture and civilization we’ve built with the same body and brain.” Gould was wrong. Data from the International HapMap Project show that human evolution accelerated by 100-fold starting around 10,000 years ago (Chart 3).
Chart 3
In their book The 10,000 Year Explosion: How Civilization Accelerated Human Evolution, Gregory Cochran and the late Henry Harpending explained why evolution sped up so rapidly.2 The advent of agriculture led to a surge in population levels. This, in turn, increased the absolute number of potentially beneficial genetic mutations that could be subject to selection effects. Farming and the rise of city states also completely reshaped the environment in which people lived. Basic biology teaches us that environmental dislocations of this kind tend to generate selective pressures that cause evolution to accelerate. John Hawks, professor of anthropology and genetics at the University of Wisconsin-Madison, put it best: “We are more different genetically from people living 5,000 years ago than they were different from Neanderthals.” Many of the changes to our genomes relate to diet and diseases. The various genetic resistances that people have built up to malaria are all less than 10,000 years old. Mutations to the LCT gene, which confers lactose tolerance into adulthood, occurred independently in three different geographical locations: one in East Asia, one in the Middle East, and one in Africa. The Middle Eastern variant was probably responsible for the rapid enlargement of the Indo-European language group, which now stretches from India to Ireland. The African variant likely facilitated the Bantu expansion, which started near the present-day border of Nigeria and Cameroon, and then spread out across almost all of sub-Saharan Africa. Evolution Of The Human Brain About half of the genes in the human genome regulate some aspect of brain function. Given the rapid acceleration in evolution, it would be rather surprising if our own brains had not been affected. And indeed, there is plenty of evidence that they were. The frontal lobe of the brain has increased in size over the past 10,000 years. This is the part of the brain that regulates such things as language, memory, and long-term planning. Testosterone levels have also declined. That may explain the steady reduction in violent crime rates (Chart 4).
Chart 4
We know that certain genes that are associated with higher intelligence have been under recent selective pressure. For example, the gene that leads to torsion dystonia – a debilitating movement disorder – appears to have increased in frequency. Why would a gene that causes a known disease become more widespread? The answer is that individuals who have this particular mutation tend to have IQs that are around 10-to 20-points above the population average. Why IQ Matters IQ has a long and contentious history. Yet, despite numerous efforts to jettison the concept, it has endured for one simple reason: It has more predictive power than virtually anything else in the psychological realm. A simple 30-minute IQ test can help predict future educational attainment, job performance, income, health, criminality, and fertility choices (Table 1 and Chart 5). IQ even predicts trader performance!3 Table 1What IQ Predicts (Results From Meta-Analyses)
The Most Important Trend In The World Has Reversed And Nobody Knows Why
The Most Important Trend In The World Has Reversed And Nobody Knows Why
Chart 5
Like most physiological traits, IQ is highly heritable.4 The genetic contribution to IQ increases from 20% in early childhood to as high as 80% by one’s late teens and remains at that level well into adulthood.5 This makes IQ almost as heritable as height (Chart 6).
Chart 6
Although there is a great deal of variation among individuals, on average, more intelligent people earn higher incomes (Chart 7). If the same relationship existed in the pre-industrial era, as seems likely, then human intelligence probably increased in a way that facilitated the economic explosion that we associate with the Industrial Revolution. The stunning implication is that the emergence of the modern era was a question of “when, not if.”
Chart 7
Part 2: The Flynn Effect By the late-19th century, it had become clear that the rich were no longer having as many children as the poor. This realization, together with the growing popularity of Darwin’s theories, helped galvanize the eugenics movement. Contrary to popular belief, this movement was not a product of the far-right. In fact, the most vocal proponents of eugenics were among the progressive left. John Maynard Keynes, for example, served as the Director of the British Eugenics Society between 1937 and 1944. Yet, a funny thing happened on the road to idiocracy: The concerns of eugenicists did not come to pass. Rather than becoming dimmer, people became smarter. This phenomenon is now known as the Flynn Effect, named after James Flynn, a psychologist who was among the first to document it. Chart 8 shows the evolution of IQ scores in a sample of countries between 1940 and 1990. The average country recorded IQ gains of three points per decade over this period, a remarkably large increase over such a relatively short period of time.
Chart 8
Explaining The Flynn Effect The Flynn Effect must have been entirely driven by environmental factors since genetic factors – namely the tendency of less-educated people to have more children, and to have them at an earlier age – would have reduced average IQs over the past two hundred years. But how could environmental factors have played the dominant role in light of the strong role of genes discussed above? The answer was proposed by geneticist Richard Lewontin in the 1970s. Lewontin suggested imagining a genetically-diverse sack of seed corn randomly distributed between two large identical fields. One field had fertilizer added to it while the other did not. Genetic variation would explain all of the differences in the height of corn stalks within each field, while environmental factors (the addition of fertilizer) would explain all of the difference in the average height of corn stalks between the two fields. This logic explains why genes can account for the bulk of the variation in IQs within any demographic group, while environmental effects may explain most of the variation across groups, as well as why average scores have changed over time. And what environmental effects are these? The truth is that no one really knows. Plenty of theories have been advanced, but so far there is still little consensus on the matter. Bigger, Healthier Brains It has long been known that learning increases the amount of grey matter in the brain. For example, a recent study showed that the hippocampi of London taxi drivers tend to be larger due to the need for drivers to memorize and navigate complex routes.6 The emergence of modern societies likely kicked off a virtuous circle where the need to solve increasingly complex tasks forced people to hone their learning skills, leading to higher IQs and further technological progress. The introduction of universal primary education amplified this virtuous circle. Better health undoubtedly helped as well. Early childhood diseases reduce IQ by diverting the body’s resources away from mental development towards fighting off infections. There is a strong correlation between measured IQ and disease burden across countries (Chart 9). A number of studies have documented a strong relationship between the timing of malaria eradication in the U.S. and other parts of the world and subsequent observed gains in childhood IQs.7
Chart 9
Brain size and IQ are positively correlated. Forensic evidence from the U.S. suggests that the average volume of adult human skulls has increased by 7% since the late 1800s, or roughly the size of a tennis ball.8 Part 3: The End Of A 10,000 Year Trend The problem with environmental effects is that they eventually run into diminishing returns. This appears to have happened with the Flynn Effect. In fact, not only does the recent evidence suggest that the Flynn Effect has ended, but the data suggest that IQs are starting to decline. Chart 10 shows that average math and science test scores fell in the OECD’s Program For International Scholastic Achievement (PISA) between 2009 and 2015, the latest year of the examination. The drop in math and science test scores has been mirrored in falling IQ scores. Flynn observed a decade ago that IQs of British teenagers were slipping.9 Similar results have been documented in France, the Netherlands, Germany, Denmark, and most recently, Norway.
Chart 10
The Norwegian results, published last year, are particularly noteworthy.10 Bernt Bratsberg and Ole Rogeberg examined three-decades worth of data on IQ tests of Norwegian military conscripts. Military duty has been mandatory for almost all men in Norway since 1814, which means that the study’s authors were able to collect comprehensive data on most Norwegian men and their fathers. Their paper clearly shows that IQ peaked with the generation born in the mid-1970s and declined by about five points, or one-third of a standard deviation, for the one born in 1990 (Chart 11). For the first time in recorded history, Norwegian kids today are not scoring as well as their parents.
Chart 11
A Mystery What caused the sudden reversal of the Flynn Effect in Norway and most other developed economies? Nobody knows. We can, however, offer three possible theories: New Technologies For much of human history, rising intelligence and technological innovation were complementary processes, meaning that the smartest people were the ones who could best exploit the new technologies that were coming their way. Moreover, as noted above, even those who were less gifted benefited from the mental stimulation that a technologically advanced society provided. It remains to be seen how future technological advances such as generalized AI will affect human intelligence, but recent technological advances seem to have had a dumbing down effect.11 For example, the GPS has obviated the need for people to navigate unfamiliar locations, thus blunting the development of their visuospatial skills. Modern word processors have made spelling skills less important. Having all the information in the world just a click away is a wonderful thing, but it has reduced the need for our brains to retain and codify what we learn. Meanwhile, the constant bombardment of information to which we are subject has made it difficult to concentrate on anything for long. How many youth today can read a report of this length without checking their Facebook feed multiple times? My guess is not many. Diminishing Returns To Education The ability to take young bright minds, who would have otherwise spent their lives doing menial labor, and provide them with an education was probably the greatest tailwind to growth that the 20th century enjoyed. There is undoubtedly still scope to continue this process, but the low-hanging fruit have been picked. Educational attainment has slowed dramatically in most of the world (Chart 12). Economist James Heckman estimates that U.S. high-school graduation rates, properly measured, peaked over 40 years ago.12
Chart 12
Despite billions of dollars spent, efforts to improve school performance have generally fallen flat. A recent high-level report by the U.S. Department of Education concluded that “The panel did not find any empirical studies that reached the rigor necessary to determine that specific turnaround practices produce significantly better academic outcomes.”13 This gets to a point that most parents already know, which is that when people talk about “bad schools,” they are really talking about “bad students.” Deteriorating Health Better health probably contributed to the Flynn Effect. But is it possible to have too much of a good thing? More calories are welcome when people are starving, but today’s calorie-rich, nutrient-poor diets have led to a surge in obesity rates. A clean environment reduces the spread of germs, but it also makes children hypersensitive to foreign substances. Following German reunification, researchers observed that allergies were much more common among West German children than their Eastern peers, presumably because of the West’s more salubrious environment.14 All sorts of weird and concerning physiological changes are occurring. Sperm counts have fallen by nearly 60% since the early 1970s.15 Testosterone levels in young men are dropping. Among girls, the age of first menarche has declined by two years over the past century.16 Are chemical agents in the environment responsible? If they are, what impact are they having on cognitive development? Nobody knows. Reported mental illness is also on the rise. The share of U.S. teenagers with a reported major depressive episode over the prior year surged by over 60% between 2010 and 2017 (Chart 13). The fraction of young adults that made suicide plans nearly doubled.17 More than 20% of U.S. women over the age of 40 are on antidepressants.18 Five percent of U.S. children are receiving ADHD medication.19
Chart 13
Implications For Economic Growth And Asset Markets So far, the reversal of the Flynn Effect has been largely confined to the developed economies. Test scores are still rising in the developing world, albeit from fairly low levels. For example, two recent studies have documented significant IQ gains in Kenya and Brazil.20 In the poorest countries, opportunities for improving health abound. Even small steps such as fortifying salt with iodine (which costs about five cents per person per year) have been shown to boost IQ by nearly one standard deviation.21 Measures to reduce inbreeding are also likely to boost IQ scores.22 Yet, we should not underestimate the importance of falling cognitive skills in developed economies. Chart 14 shows that there is a clear positive correlation between student score on math and science and per capita incomes.
Chart 14
Most technological innovation still takes place in developed economies. There is an extremely tight relationship between visuospatial IQ and the likelihood of becoming an inventor (Chart 15). Since IQ is distributed along a bell curve, a 0.1 standard deviation drop in IQs across the entire distribution will result in an 8% decline in the share of people with IQs over 100, a 14% decline in those with IQs over 115, and a 21% decline in those with an IQ over 130 (by convention, each standard deviation on an IQ test is worth 15 points).
Chart 15
Falling IQs could result in slower productivity growth, which could further strain fiscal balances. Lower IQs are also associated with decreased future orientation.23 People who live for the moment tend to save less. A decline in savings would push up real rates, leading to less capital accumulation. History suggests that a deceleration in productivity growth and higher real rates will put downward pressure on equity multiples (Chart 16). Chart 16Equity Multiples Tend To Fall When Real Rates Rise And Productivity Growth Declines
Equity Multiples Tend To Fall When Real Rates Rise And Productivity Growth Declines
Equity Multiples Tend To Fall When Real Rates Rise And Productivity Growth Declines
Part 4: Generation E For 200 years, the environmentally-driven Flynn Effect disguised the underlying genetically-driven decline in IQs that began not long after the dawn of the Industrial Revolution. Flynn has acknowledged this himself, noting at the 2017 International Society For Intelligence Research Conference that “I have no doubt that there has been some deterioration of genetic quality for intelligence since the late Victorian times.”24 Now that the Flynn Effect has reversed, both genes and the environment are working together to reduce cognitive abilities in developed economies. This means that the most important trend in the world – a trend that allowed the human population to increase during the Malthusian era and later allowed output-per-worker to soar following the Industrial Revolution – has broken down. Yet, there may be another twist in the story – one that began just a few months ago: the first members of Generation E were born. E Is For Edited ... Or Eugenics Lulu and Nana will be like most other children, but with one key difference: They will be the first humans ever to have their genomes edited through a procedure know as CRISPR-Cas9. Rogue Chinese scientist He Jiankui deactivated their CCR5 gene, which the HIV virus uses as a gateway into the body. His actions were rightfully condemned around the world for endangering the twins’ health by using a procedure that has not yet been fully vetted in animal studies, let alone in human trials (Lulu and Nana’s father is HIV+ but it is debatable whether the children were at an elevated risk of infection). He Jiankui remains under house arrest at the university where he worked. But whatever his fate, the dam has been broken. For better or for worse, the era of personal eugenics has arrived. The Return Of The Silver Fox It is easier to delete a gene than to add one. It is even more difficult to swap out a large number of genes in a way that achieves a predictable outcome. Thus, the successful manipulation of highly polygenic traits such as intelligence – traits that are linked to hundreds of different genes – may still be decades away.25 Predicting a trait is much simpler than modifying it, however. The cost of sequencing a human genome has fallen by more than 99% since 2001 (Chart 17). Start-up company Genomic Prediction has already developed a test for fertilized embryos for IVF users that predicts height within a few centimetres and IQ with a correlation of 0.3-to-0.4, roughly as accurate as standardized tests such as the SAT or ACT.26 Other companies are following suit.27
Chart 17
Some will recoil in horror at the prospect of selecting prospective children in this manner. They will argue that such technologies, beyond being simply immoral, will widen social inequality between those who can afford them and those who cannot. Others will counter that screening embryos for certain traits is not that dissimilar to what people already do with prospective romantic partners. They will also point out that mass usage of these technologies will drive down prices to the point that even poor people will be able to access them, thus giving low IQ parents the chance to have high IQ kids. They might also note that such technologies may be the only way to reverse the ongoing accumulation of deleterious mutations within the human germline that has been the unintended by-product of the proliferation of life-saving medicines.28 We will not wade into this thorny debate, other than to note that there will be huge incentives for people to avail themselves of these technologies. The Coming Eugenic Wars And not just individuals either – governments too. While the initial impact of eugenic technologies will be small, the effects will compound over time. Carl Shulman and Nick Bostrom estimate that genetic screening could boost average IQs by up to 65 points in five generations (Table 2). Table 2A Poisoned Chalice? Genetic Screening Can Raise IQ
The Most Important Trend In The World Has Reversed And Nobody Knows Why
The Most Important Trend In The World Has Reversed And Nobody Knows Why
China has been investing heavily in genetic technologies. As Geoffrey Miller has argued, China’s infatuation with eugenics spans into the modern day.29 Like most other countries, fertility in China is negatively correlated with IQ. Mingrui Wang, John Fuerst, and Jianjun Ren estimate that China is currently losing nearly one-third of a point in generalized intelligence per decade, with the loss having accelerated rapidly between the 1960s and mid-1980s.30 The decline in the genetic component of Chinese IQs is coming at a time when the population itself is about to shrink. According to the UN’s baseline forecast, China will lose 450 million working-age people by the end of the century (Chart 18). Meanwhile, the country is saddled with debt, the result of an economic model that has, for decades, recycled copious household savings into debt-financed fixed-investment spending in an effort to shore up domestic demand.
Chart 18
The authorities may be tempted to tackle all three problems simultaneously by adopting generous pro-natal measures – call it the “at least one-child policy”– which increasingly harnesses emerging eugenic technologies. The resulting baby boom would strengthen domestic demand, thus making the economy less dependent on exports, while ensuring China’s long-term geopolitical viability. The Eugenic Wars are coming, and they will be unlike anything the world has seen before. Peter Berezin, Chief Global Strategist Global Investment Strategy peterb@bcaresearch.com Box 1 The Diffusion Of Bourgeois Values: Culture Or Genes? Higher-income people had more surviving children in the centuries leading up to the Industrial Revolution. Real per capita income was broadly stable during this period. This implies that there must have been downward social mobility, with sons, on average, being less wealthy than their fathers. This downward mobility, in turn, spread the characteristics of higher-income people across the broad swathe of society. What were these characteristics? Cultural values that emphasized thrift, diligence, and literacy were undoubtedly part of what was passed on to future generations. But surprisingly, it also appears that genetic transmission played an important, and perhaps pivotal, role. Models of genetic transmission make very concrete predictions about the correlations in economic status that one would expect to see among relatives. Biological brothers share 50% of their genes, as do fathers and sons. Likewise, first cousins share 25% of their genes, the same as grandfathers and sons. These facts yield two testable predictions: The first is that the correlation coefficient on status measures such as wealth, occupation, and education should be the same for relatives that share the same fraction of genes such as sibling pairs and father-son pairs. Box Chart 1 shows that this is borne out by the data. The second prediction is that the correlation between status and genetic distance should follow a linear trend so that, for example, the correlation in wealth among brothers is twice that of first cousins and four times that of second cousins. Box Chart 2 shows that this is also borne out by the data. Other evidence supports the importance of genes in the transmission of status across generations. The correlation in measures such as wealth, education, and occupation is much higher among identical twins than fraternal twins. Adopted children turn out to be more similar to their biological parents on these measures when they reach adulthood than their adopted parents, even when the children have never met their biological parents. The parent-child correlation also remains the same regardless of family size, suggesting that spreading the same resources over more children may not harm life outcomes to any discernible degree, at least on the measures listed above.
Image
Image
Source: Gregory Clark and Neil Cummins, "Nature Versus Nurture in Social Outcomes. A Lineage Study of 263,000 English Individuals, 1750-2017," Luxembourg Institute of Socio-Economic Research. Footnotes 1 Xi Song, Cameron Campbell, and James Lee, "Descent Line Growth and Extinction From A Multigenerational Perspective, Extended Abstract," American Sociological Review 80:3, (April 21, 2015): 574-602. 2 Gregory Cochran and Henry Harpending, "The 10,000 Year Explosion: How Civilization Accelerated Human Evolution," Basic Books, (2009). 3 Mark Grinblatt, Matti Keloharju, and Juhani T. Linnainmaa, “IQ, Trading Behavior, and Performance,” Journal of Financial Economics, 104:2, (May 2012): 339-362. 4 Thomas Bouchard, “Genetic Influence On Human Psychological Traits - A Survey,” Current Directions in Psychological Science 13:4, (August 2004): 148-151. 5 The tendency for the genetic contribution to IQ to increase until early adulthood and then to remain at high levels until old age is known as the Wilson Effect. There is no consensus on what causes it, but it probably reflects a number of factors: 1) It may take some children longer than normal to reach full intellectual maturity. Testing their IQs at a young age will result in scores that are lower than those expected based on their parents’ IQs. The opposite is true for children whose IQs increase relatively quickly in young age, but possibly top out earlier; 2) Environmental effects are probably more important in young age when a child’s brain is still quite malleable; 3) Self-reinforcing gene-environment interactions tend to increase with age. Children do not have much control over their environment, but as they get older, they will seek out activities that are more in keeping with their genetic predispositions. For example, a studious child may pursue a career that reinforces their love of learning. 6 "Cache Cab: Taxi Drivers' Brains Grow to Navigate London's Streets," Scientific American, (December 2011). 7 Atheendar Venkataramani, “Early Life Exposure to Malaria and Cognition in Adulthood: Evidence from Mexico,” Journal of Health Economics 31:5, (July 2012): 767-780; Hoyt Bleakley, “Health, Human Capital and Development,” Annual Review of Economics 2, (March 2010): 283-310; Hoyt Bleakley, “Malaria Eradication in the Americas: A Retrospective Analysis of Childhood Exposure,” American Economic Journal: Applied Economics 2, (April 2010): 1-45. 8 “Anthropologists Find American Heads Are Getting Larger,” ScienceDaily, (May 2012). 9 “British Teenagers Have Lower IQs Than Their Counterparts Did 30 Years Ago,” The Telegraph, (February 2009). 10 Bernt Bratsberg and Ole Rogeberg, “Flynn Effect And Its Reversal Are Both Environmentally Caused,” Proceedings of the National Academy of Sciences 115:26, (June 2018): 6674-6678. 11 On the face of it, artificial intelligence would appear to be a substitute for human intelligence. Many applications of AI would undoubtedly have this feature, especially those that allow computers to perform complex mental tasks that humans now must do. However, there are several ways that AI may eventually come to complement human intelligence. First, and most obviously, AI could be used to augment human capabilities either directly by hardwiring it into our brains, or indirectly through the development of drugs or genetic techniques which improve cognition. Second, looking further out, the benefits of highly intelligent AI systems would be limited if humans did not possess the requisite intelligence to understand certain concepts that are currently beyond our mental reach. No matter how well intentioned, trying to explain string theory to a mouse is not going to succeed. There are probably a multitude of ideas that AI could reveal that we simply cannot comprehend at current levels of human intelligence. 12 James Heckman and Paul La Fontaine, “The American High School Graduation Rate: Trends and Levels,” The Review of Economics and Statistics 92:2, (May 2010): 244–262. 13 “Turning Around Chronically Low-Performing Schools,” The Institute of Education Sciences (IES), (May 2008). 14 E. von Mutius, F.D. Martinez, C. Fritzsch, T. Nicolai, G. Roell, and H. H. Thiemann, "Prevalence Of Asthma And Atopy In Two Areas Of West Germany And East Germany," American Journal of Respiratory and Critical Care Medicine 149:2, (February 1994): 358-64. 15 "Sperm Counts In The West Plunge By 60% In 40 Years As ‘Modern Life’ Damages Men’s Health," Independent, (July 2017). 16 Kaspar Sørensen, Annette Mouritsen, Lise Aksglaede, Casper P. Hagen, Signe Sloth Mogensen, and Anders Juul, "Recent Secular Trends in Pubertal Timing: Implications for Evaluation and Diagnosis of Precocious Puberty," Hormone Research in Paediatrics 77:3, (May 2012): 137-145. 17 “Results from the 2017 National Survey On Drug Use And Health: Detailed Tables,” Substance Abuse and Mental Health Services Administration, Center for Behavioral Health Statistics and Quality, Rockville (Maryland), (September, 2018). 18 Laura A. Pratt, Debra J. Brody, and Qiuping Gu, “Antidepressant Use Among Persons Aged 12 and Over: United States, 2011–2014,” NCHS Data Brief No. 283, Centers for Disease Control and Prevention, (August 2017). 19 Some, but not all, of the increase in reported rates of mental illness may be due to more aggressive diagnosis by health practitioners. For example, a recent study revealed that children born in August were 30% more likely to receive an ADHD diagnosis than those born in September, simply because they were less mature compared to other kids in the first few years of elementary school. See: Timothy J. Layton, Michael L. Barnett, Tanner R. Hicks, and Anupam B. Jena, “Attention Deficit-Hyperactivity Disorder and Month of School Enrollment,” New England Journal of Medicine 379:22, (November 2018): 2122-2130. 20 Tamara C. Daley, Shannon E. Whaley, Marian D. Sigman, Michael P. Espinosa, and Charlotte Neumann, “IQ On The Rise: The Flynn Effect In Rural Kenyan Children,” Psychological Science 14:3, (June 2003): 215-9; Jakob Pietschnig and Martin Voracek, “One Century of Global IQ Gains: A Formal Meta-Analysis of the Flynn Effect (1909-2013),” Perspectives on Psychological Science 10:3, (May 2015): 282-306. 21 N. Bleichrodt and M. P. Born, “Meta-Analysis of Research on Iodine and Its Relationship to Cognitive Development,” In: ed. J. B. Stanbury, “The Damaged Brain of Iodine Deficiency,” Cognizant Communication Corporation, New York, (1994): 195-200; “Iodine status worldwide: WHO Global Database on Iodine Deficiency,” World Health Organization, Geneva, (2004). 22 Mohd Fareed and Mohammad Afzal, “Estimating the Inbreeding Depression on Cognitive Behavior: A Population Based Study of Child Cohort,” PLOS ONE 9:12, (October 2015): e109585. 23 H. de Wit, J. D. Flory, A. Acheson, M. McCloskey, and S. B. Manuck, “IQ And Nonplanning Impulsivity Are Independently Associated With Delay Discounting In Middle-Aged Adults,” Personality and Individual Differences 42:1, (January 2007): 111-121; W. Mischel and R. Metzner, “Preference For Delayed Reward As A Function Of Age, Intelligence, And Length Of Delay Interval,” Journal of Abnormal and Social Psychology 64:6, (July 1962): 425-31. 24 James Flynn, “IQ decline and Piaget: Does the rot start at the top?” Lifetime Achievement Award Address, 18th Annual meeting of ISIR, (July 2017). 25 For a good discussion of these issues, please see Richard J. Haier, “The Neuroscience of Intelligence,” Cambridge Fundamentals of Neuroscience in Psychology, (December 2016). 26 “The Future of In-Vitro Fertilization and Gene Editing,” Psychology Today, (December 2018). 27 “DNA Tests For IQ Are Coming, But It Might Not Be Smart To Take One,” MIT Technology Review, (April 2018). 28 Michael Lynch, “Rate, Molecular Spectrum, And Consequences Of Human Mutation,” Proceedings of the National Academy of Sciences 107:3, (January 2010): 961-968. 29 Geoffrey Miller, “What *Should* We Be Worried About?” Edge, (2013). 30 Mingrui Wang, John Fuerst, and Jianjun Ren, “Evidence Of Dysgenic Fertility In China,” Intelligence 57, (April 2016): 15-24. Strategy & Market Trends MacroQuant Model And Current Subjective Scores
Image
Tactical Trades Strategic Recommendations Closed Trades