Global

Feature Recommendations
Monthly Portfolio Update
Monthly Portfolio Update
Two Key Questions For Asset Allocators Stocks have rallied this year – MSCI ACWI is up 17% from its late December low – despite the fact that economic growth outside the U.S. has continued to deteriorate. The PMI in Germany has fallen to 47.6, in Japan to 48.5, and the average in Emerging Markets to 49.5 (Chart 1). Chart 1PMIs Ex-U.S. Still Falling
PMIs Ex-U.S. Still Falling
PMIs Ex-U.S. Still Falling
U.S. growth remains robust, though recent data have showed some signs of weakness. The Citigroup Economic Surprise Index has fallen sharply, capex indicators have slipped, and December retail sales were terrible (Chart 2). The New York Fed NowCast for Q1 is now pointing at only 1.2% real GDP growth. Most of the slippage, however, was caused by the six-week government shutdown, and should be reversed in Q2. And the retail sales number appears “rogue”, perhaps caused by irregular data-collection methods during the shutdown, since other retail data do not support it (Chart 2, panel 3). The tightening of financial conditions in the last months of 2018 – which has now partly reversed – may have added to the slowdown (Chart 3). BCA’s view is that U.S. GDP growth is likely to come in well above 2% in 2019, slower than last year’s 2.9% but still above trend. Chart 2Should We Worry About U.S. Growth Too?
Should We Worry About U.S. Growth Too?
Should We Worry About U.S. Growth Too?
Chart 3Financial Conditions Now Easing
Financial Conditions Now Easing
Financial Conditions Now Easing
Our recommendation, therefore, is to continue to overweight equities (particularly U.S. equities), which should be supported by decent earnings growth (our top-down model points to 12% EPS growth for the S&P500 this year, compared to a bottom-up consensus forecast of only 5%), reasonable valuations, and sentiment that appears still to be damaged by the Q4 sell-off (Chart 4). Chart 4Environment Still Positive For U.S. Equities
Environment Still Positive For U.S. Equities
Environment Still Positive For U.S. Equities
Two key questions will determine which asset allocation will be optimal this year. First, how long will the Fed stay “patient” and keep rates on hold? The futures market has almost completely priced out the possibility of any rate hikes in 2019, and even assigns a 15% probability of a cut (Chart 5). We still see upside risk to inflation, with core PCE likely to print above the Fed’s target of 2% by mid-year, partly because of the year-on-year base effect (in January 2018, monthly inflation was especially high), but also because underlying inflation pressures remain (Chart 6). Chart 5Is The Fed Really Going To Cut Rates?
Is The Fed Really Going To Cut Rates?
Is The Fed Really Going To Cut Rates?
Chart 6Inflation Pressures Haven't Gone Away
Inflation Pressures Haven't Gone Away
Inflation Pressures Haven't Gone Away
The market has misunderstood two of the Fed’s recent messages. Its mooted plan to end balance-sheet reduction by year-end is not intended as part of monetary policy. It is simply that bank excess reserves will have reached USD1-1.2 trillion, the level required to operate monetary policy using current tools, rather than those used before 2007 when reserves were zero (Chart 7). Second, recent discussions about changing the Fed’s inflation target from 2% a year to a price-level target will probably become effective only when the effective lower bound is hit in the next recession and, anyway, no decision will be taken until mid-2020. Chart 7Excess Reserves Will Be At Equilibrium Soon
Excess Reserves Will Be At Equilibrium Soon
Excess Reserves Will Be At Equilibrium Soon
The market has taken this talk as dovish. We read recent comments by Fed Chairman Jay Powell to mean that if, by June, the economy is robust, risk assets are still rebounding, and inflation is ticking up, the Fed will continue to hike, maybe two or three times by year-end. This implies long-term bond yields will rise too. Equities may wobble initially but, as long as the Fed is hiking because growth is solid and not because of an inflation scare, this should not undermine the 12-month case for equity outperformance. The second key question is whether China has now abandoned its focus on deleveraging and switched to a 2016-style liquidity-driven stimulus. Certainly, the January total social financing number pointed in that direction, with new credit creation of almost 5 trillion RMB ($750 billion) and the first signs of an easing of restrictions on shadow banking (Chart 8). But the jury is still out on whether this is the massive reflation the market has been waiting for. Premier Li Keqiang criticized the increase, saying, “the increase in total social financing appears rather large…it may also bring new potential risks”. A PBOC official commented that the big increase was “due to seasonal factors” and emphasized that China was not embarking on “flood irrigation-style” stimulus. The recent more positive noises on the U.S./China trade war may also alleviate the pressure on China to stimulate. Chart 8First Signs Of Chinese Reflation?
First Signs Of Chinese Reflation?
First Signs Of Chinese Reflation?
If and when Chinese growth does rebound, this will have major implications for asset allocation. It would signal a bottoming of the global cycle, which would favor stocks in Emerging Markets, Europe and Japan. It would push up commodity prices, and imply a weaker dollar. For now, we are not positioning ourselves like this, since global growth remains weak. Nonetheless, the first signs of a bottoming are appearing with, for example, the diffusion index of the global Leading Economic Index (which often leads the LEI itself) turning up (Chart 9). We may shift in this direction mid-year, and are now making some minor changes to our recommendations (see below) to hedge against this risk. But for the moment we prefer U.S. equities, expect further USD appreciation, and remain cautious on EM. Chart 9Is The LEI Close To Bottoming?
Is The LEI Close To Bottoming?
Is The LEI Close To Bottoming?
Equities: We prefer U.S. equities given their better growth, reasonable valuations, and depressed sentiment (despite their outperformance year-to-date). But we are watching for an opportunity to increase our weighting in Europe, where growth still looks poor but may rebound in H2 due to fiscal stimulus, improving wage growth, a dovish turn by the ECB, and an eventual recovery in exports to China (Chart 10). We still see problems in EM, since earnings growth expectations need to be revised down further and stock prices have risen prematurely on expectations of a Chinese recovery (Chart 11). But we reduce the size of our underweight bet, to hedge against Chinese credit growth continuing to accelerate. We are also raising our recommendation for the industrials sector (with its large weight in capital goods companies dependent on exports to China) to overweight for the same reason. We fund this by cutting consumer staples to underweight. We also raise our weighting on the energy sector, given our positive view on oil prices (see below). This gives our sector weightings a slightly more cyclical tilt, in line with our macro view. Chart 10Some Good News In Europe Too
Some Good News In Europe Too
Some Good News In Europe Too
Chart 11EM Has Further Downside
EM Has Further Downside
EM Has Further Downside
Fixed Income: It has been a conundrum this year why equities have risen and credit spreads tightened significantly, but the 10-year Treasury yield remains stuck below 2.7%. One explanation is that inflation expectations have been dampened by the crude oil price and if, as we forecast, oil continues to recover, the inflation component of the yield will rise (Chart 12). U.S. yields have also been dragged down by weak growth in other developed markets, where bond yields have therefore fallen. The spread between U.S. and German and Japanese yields reached record high levels in late 2018 (Chart 13). The term premium also is deeply into negative territory because many investors remain highly bearish and have hedged this view by buying Treasuries. If our view of robust U.S. growth, rising inflation, and more Fed hikes is correct, we would see 10-year Treasury yields rising towards 3.5% over the next 12 months. Accordingly, we are underweight global government bonds. We raised credit to neutral last month, but continue to have some qualms about this asset class, and prefer equities as a way of taking exposure to further upside for risk assets. Besides high leverage among U.S. corporates, we are worried about the deterioration in the quality of the credit market, since duration has been extended, covenants weakened, and the average credit rating fallen (Chart 14). Chart 12Inflation Expectations Driven By Oil
Inflation Expectations Driven By Oil
Inflation Expectations Driven By Oil
Chart 13U.S. Yields Pulled Down By Europe And Japan
U.S. Yields Pulled Down By Europe And Japan
U.S. Yields Pulled Down By Europe And Japan
Chart 14Deterioration In Credit Market Fundamentals
Deterioration In Credit Market Fundamentals
Deterioration In Credit Market Fundamentals
Currencies: We see some more upside in the U.S. dollar over the next few months, given U.S. growth and monetary policy relative to the euro area and Japan (Chart 15). This may reverse, however, if global cyclical growth rebounds in the second half. The dollar is particularly vulnerable if macro conditions change, since it looks around 10% overvalued relative to other major DM currencies, and speculative positions are predominantly long dollar (Chart 16). Chart 15Relative Rates Support USD
Relative Rates Support USD
Relative Rates Support USD
Chart 16But Dollar Vulnerable To Macro Shifts
But Dollar Vulnerable To Macro Shifts
But Dollar Vulnerable To Macro Shifts
Commodities: With demand likely to grow steadily this year, but supply under pressure because of production cuts by OPEC and Canada, lower U.S. shale oil output, and disruptions in Venezuela and elsewhere, our energy strategists see drawdowns in inventories throughout the year (Chart 17). They forecast Brent to average $75 a barrel during 2019 (compared to $66 now), with WTI $5 a barrel lower. Industrial commodities continue to be driven by China which means, given our view expressed above, that we may see further weakness short-term, with a possible rebound in H2 (Chart 18). Chart 17Oil Supply/Demand Is Tight
Oil Supply/Demand Is Tight
Oil Supply/Demand Is Tight
Chart 18When Will Metal Prices Bottom?
Chinese Slowdown Will Weigh On Metal Prices
Chinese Slowdown Will Weigh On Metal Prices
Garry Evans Chief Global Asset Allocation Strategist garry@bcaresearch.com GAA Asset Allocation
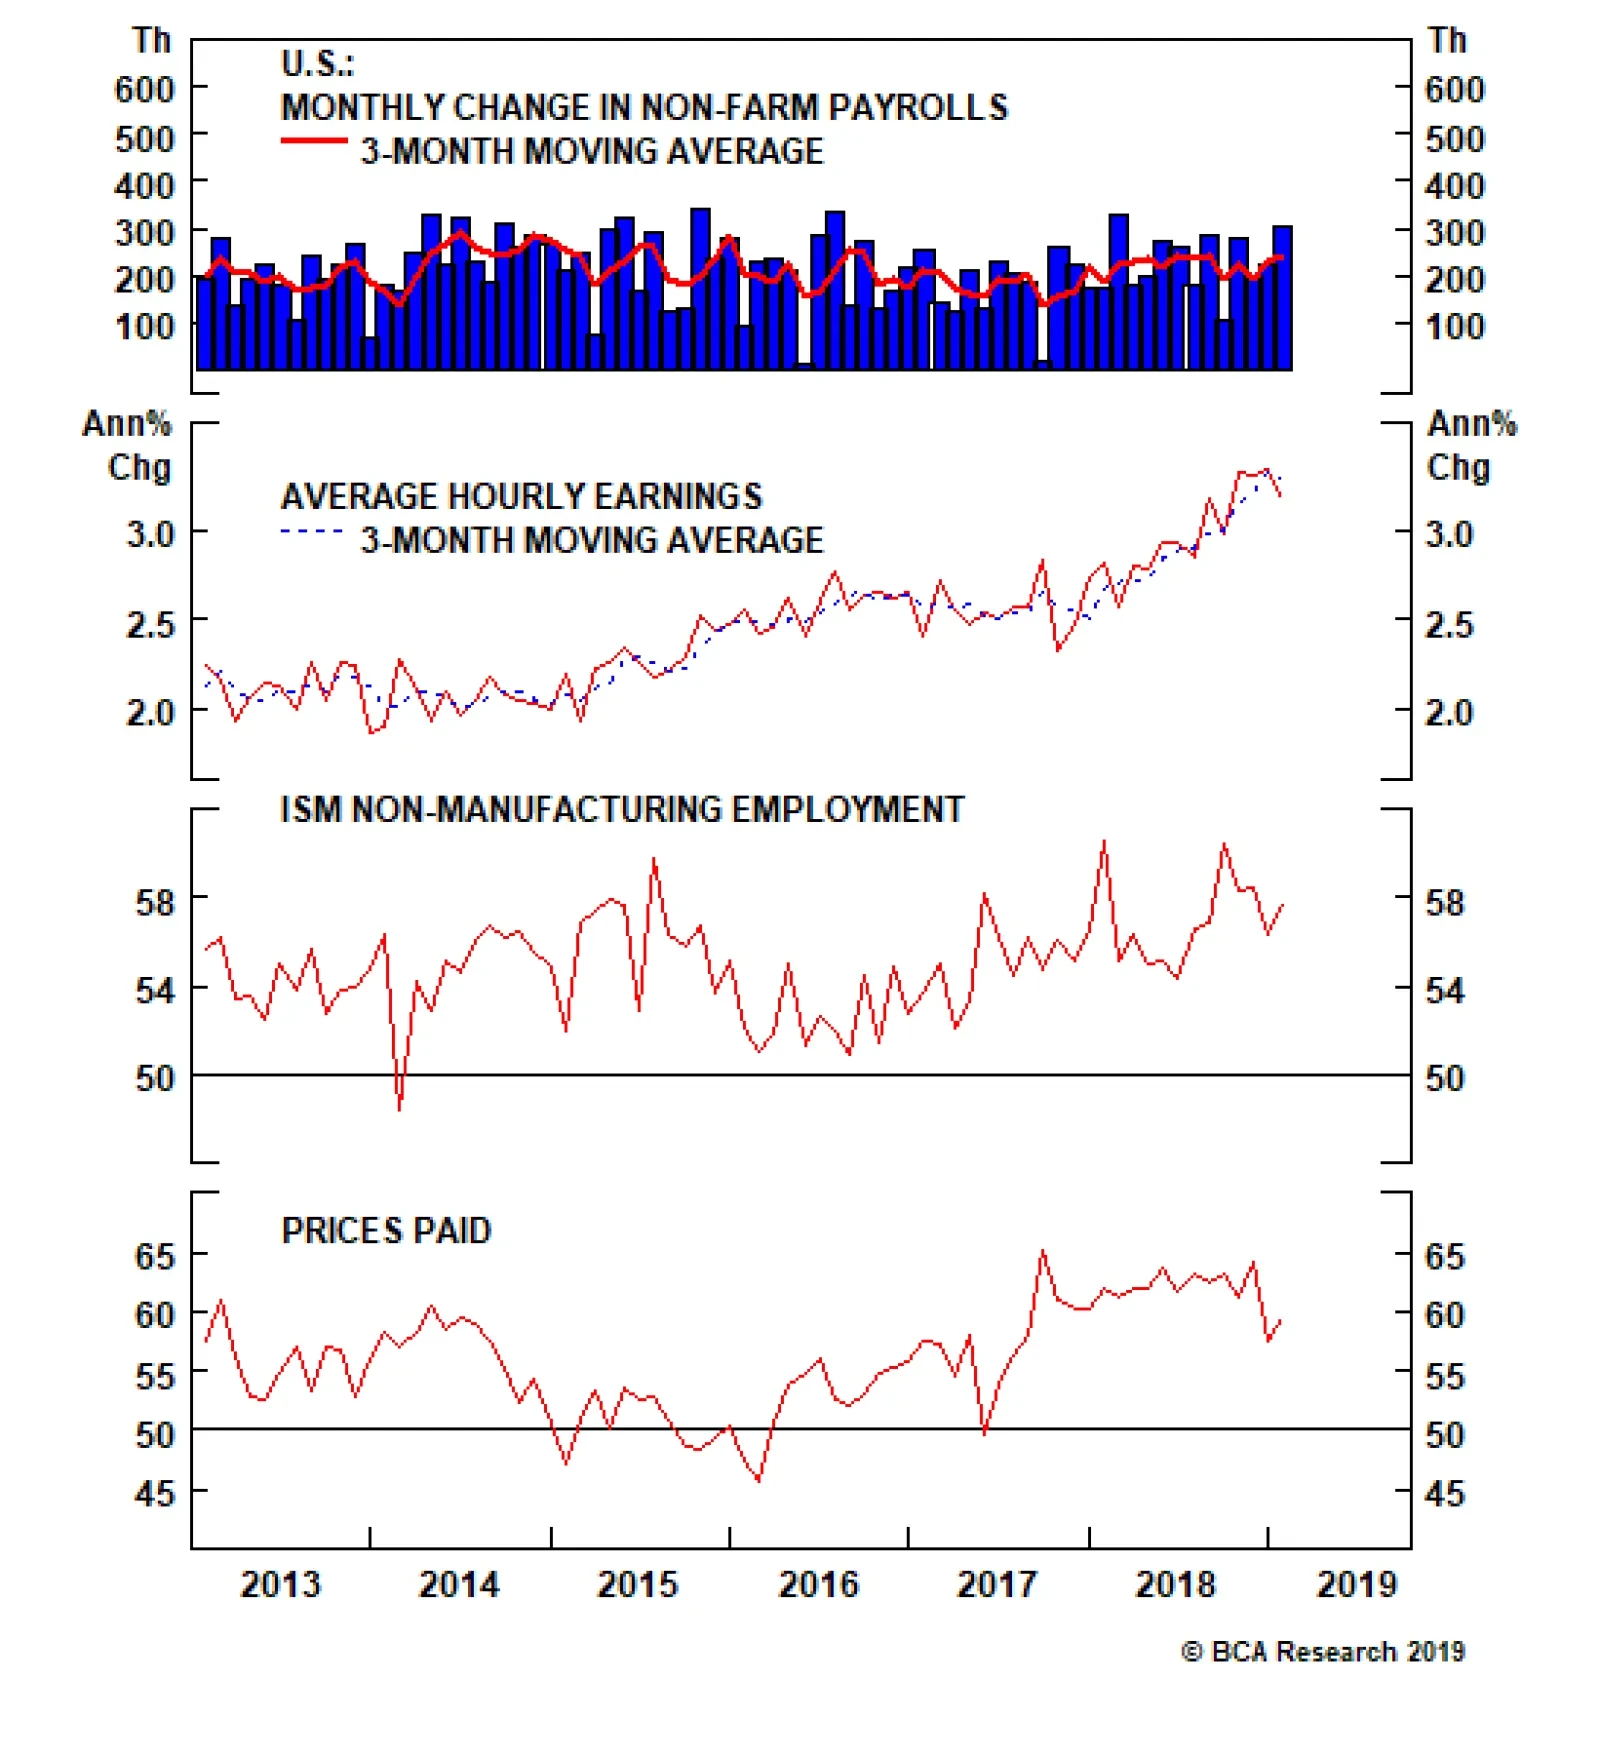
In the U.S., the employment report on Friday will be closely watched as the labor market has so far remained the key bright spot in the U.S. economy. If job growth stays robust and wages reverse last month’s small decline, this will indicate that the…
Highlights Investors are currently too pessimistic on Europe’s growth prospects. In fact, European growth will soon bottom. European growth and inflation are also set to improve relative to the U.S. This should give investors an opportunity to reassess the long-term outlook for European Central Bank policy relative to the Fed. Global growth dynamics are also moving in an increasingly dollar-bearish direction, which should create a tailwind for the euro. Based on the pricing of European assets relative to the U.S., there is scope to see more capital flows into the euro area, implying that more euro buying is forthcoming. The entire European currency complex is a buy relative to the dollar; while the NOK, the SEK, and even the GBP could outperform the euro, the CHF will underperform. EUR/JPY also has upside. Feature The case to sell the euro is easy to make. European growth has been very poor: PMIs, industrial production and even German exports are all pointing to a contraction in output; and economic surprises are testing levels recorded during the euro area crisis. Most importantly, this economic retrenchment is particularly sharp when compared to the U.S., which suggests that real interest rate differentials should continue to hurt EUR/USD (Chart 1). Chart 1Selling The Euro Seems So Easy...
Selling The Euro Seems So Easy...
Selling The Euro Seems So Easy...
The problem with this narrative is that investors are already well aware of Europe’s woes. Could Europe instead recover and the euro rebound against the dollar? After all, in the past, when investor pessimism towards Europe experienced as pronounced a dip as the one just witnessed, EUR/USD invariably rebounded soon after (Chart 2). Chart 2...But Maybe We Should Look The Other Way
...But Maybe We Should Look The Other Way
...But Maybe We Should Look The Other Way
In this piece, we explore what could go right for the euro, and argue that the euro is indeed attractive at current levels. European Growth Has Hit A Nadir It is safe to say that the euro area is in a funk today: European real GDP growth dipped to a 1.1% annual rate in the fourth quarter of 2018, while industrial production has plunged by 3.9% on a year-on-year basis. But the markets warned us this would happen: The euro has fallen 9% from its February 2018 top, German bund yields are again flirting with the 0.1% level and European banks plunged by more than 40% between January and December last year. Going forward, for European yields to remain as depressed as they are, for the euro to fall again by a similar margin, or for domestic plays to suffer large declines, European growth will have to slow even further. We are not expecting such a scenario. Instead, we expect European growth to recover significantly this year. First, when it comes to Germany, the locomotive of Europe, the shock from the implementation of the new WLTP auto emission standards is passing: Automobile production is stabilizing, capex is accelerating and inventories have been pared down. Moreover, the slowdown in foreign demand has already percolated through the domestic economy, as domestic manufacturing orders are already experiencing one of their sharpest declines since the Great Financial Crisis (Chart 3, top panel). Chart 3European Growth Is Set To Rebound
European Growth Is Set To Rebound
European Growth Is Set To Rebound
Another source of optimism comes from the credit market. As the middle panel of Chart 3 illustrates, the European 12-month credit impulse has begun to bottom. This points to stronger euro area-wide domestic demand. Moreover, the Chinese credit and fiscal impulse is also bottoming, suggesting the drag from foreign demand could be dissipating (Chart 3, bottom panel). When looking at other specific trouble spots, Italy first springs to mind. In our view, the most recent deceleration in Italy was mainly a consequence of the tightening in financial conditions that resulted from the surge in Italian yields following the budget standoff between Rome and Brussels. However, the Lega Nord / Five Star Movement coalition has folded and is more or less acquiescing to the EU’s demands. Moreover, the rising probability that the European Central Bank will continue to provide long-term liquidity to the eurozone banking system via some form of new LTRO should diminish the funding risk to the Italian banking system, and thus, the risks to Rome’s fiscal sustainability. This implies that the decline in Italian borrowing costs could deepen (Chart 4), further easing Italian financial conditions and improving the growth outlook in the euro area’s third-largest economy. Chart 4Easing Financial Conditions In Italy
Easing Financial Conditions In Italy
Easing Financial Conditions In Italy
France, too, has had its fair share of problems, though it is interesting that its industrial sector is not suffering as much as Germany’s, as highlighted by a French manufacturing PMI above the 50 boom/bust line. Instead, the French service sector is the one contracting (Chart 5). This bifurcation is likely to be a byproduct of the gilets jaunes protests that have lasted since November 2018 and affected retail trade. However, the intensity of the protests is declining and the French population is getting used to this. As a result, we are seeing a rebound in French household confidence, which implies that consumption, the main engine of French growth, is likely to perk up. Chart 5Fade The Gilets Jaunes, Paris In Spring Is Beautiful
Fade The Gilets Jaunes, Paris In Spring Is Beautiful
Fade The Gilets Jaunes, Paris In Spring Is Beautiful
Finally, euro area fiscal policy is set to be loosened this year, with the fiscal thrust moving from 0.05% of GDP to 0.4% of GDP (Chart 6). The response of French President Emmanuel Macron to the gilets jaunes protests could even make the fiscal policy support slightly bigger this year. Chart 6Positive Fiscal Thrust In 2019
Positive Fiscal Thrust In 2019
Positive Fiscal Thrust In 2019
Ultimately, this combination of factors suggests that the large dip in European industrial production is likely to prove transitory, and that European activity will revert back toward the levels implied by the Belgian Business Confidence Index, which has historically been a good leading indicator of European growth (Chart 7). Chart 7European IP To Follow Brussels' Mood
European IP To Follow Brussels' Mood
European IP To Follow Brussels' Mood
Bottom Line: The deterioration in European growth has captured the imagination of investors. However, the performance of European assets last year forewarned that growth would decelerate meaningfully. What matters now is how growth will evolve. Developments from Germany, France, Italy, the credit channel and the fiscal front all suggest that European activity will perk up soon. It’s All Relative While getting a sense of European growth is important when making a call on EUR/USD, economic trends must also be considered relative to the U.S. Surprisingly, despite notorious European growth underperformance, rays of hope are emerging. A major structural negative for EUR/USD has abated: The European debt crisis is behind us, and the aggregate European banking sector has been getting healthier, albeit slowly. This means that the euro area credit growth is not declining anymore against that of the U.S. This is a very long-term force that dictates multi-year cycles in the EUR/USD. As Chart 8 shows, it will be difficult for EUR/USD to move below 1.10 so long as the broad trend in the relative credit growth does not weaken anew. Chart 8Credit Dynamics Suggest That The Worst Is Over For EUR/USD
Credit Dynamics Suggest That The Worst Is Over For EUR/USD
Credit Dynamics Suggest That The Worst Is Over For EUR/USD
More immediately, the euro area leading economic indicator relative to the U.S. is forming a bottom (Chart 9). Since the U.S. is not benefiting from as large a fiscal boost as in 2018, and financial as well as monetary conditions have tightened there relative to Europe, this suggests the improvement in the euro area relative LEI could continue this year. Chart 9Bottoming European LEI Versus U.S.
Bottoming European LEI Versus U.S.
Bottoming European LEI Versus U.S.
Relative labor market slack is also evolving in a euro-friendly fashion. From 2013 to 2018, the euro area suffered from greater labor market slack than the U.S., courtesy of a double-dip recession and generally more-moribund growth. However, thanks to a 4.2-percentage-point fall in the European unemployment rate since 2013 to 7.9%, the euro area unemployment gap has not only closed, it is also below that of the U.S. Historically, when the U.S. unemployment gap leapfrogs that of Europe, EUR/USD tends to appreciate (Chart 10). Chart 10Less Slack Leads To A Stronger EUR/USD
Less Slack Leads To A Stronger EUR/USD
Less Slack Leads To A Stronger EUR/USD
Relative slack does not only have value in itself, it also matters for relative inflation trends, which have been a crucial determinant of EUR/USD. As Chart 11 illustrates, EUR/USD tends to follow how euro area core CPI evolves relative to the U.S. After sharply falling last year, European relative core inflation is trying to rebound, which at a minimum suggests that EUR/USD has limited downside. Moreover, EUR/USD has correlated positively with German market-based inflation expectations (Chart 11, bottom panel). This suggests that actual relative inflation as well as euro area inflation expectations play a key role in determining perceptions among investors of how ECB policy will evolve relative to the Federal Reserve. Chart 11EUR/USD Trades Off Of Inflation Dynamics
EUR/USD Trades Off Of Inflation Dynamics
EUR/USD Trades Off Of Inflation Dynamics
The recent euro decline has matched the decline in inflation expectations. However, inflation expectations have been much weaker than implied by the level of wage growth in Europe (Chart 12). This suggests that European inflation breakevens have scope to improve, a positive for the euro. Moreover, European wage growth is not only picking up steam in isolation, it is also rising relative to the U.S., which highlights that European inflation should not just stabilize vis-à-vis the U.S., but also accelerate. Chart 12European Wages Point To Rising Inflation Expectations
European Wages Point To Rising Inflation Expectations
European Wages Point To Rising Inflation Expectations
This case is made even more saliently by looking at relative financial conditions. Due to the tightening in U.S. financial conditions compared to the euro area, European headline and core inflation is set to accelerate relative to the U.S. (Chart 13). Again, this reinforces the case that maybe the euro has upside this year. Chart 13Relative Euro Area Inflation Will Rise Thanks To Easier FCI
Relative Euro Area Inflation Will Rise Thanks To Easier FCI
Relative Euro Area Inflation Will Rise Thanks To Easier FCI
Ultimately, for the euro to rise, investors will have to begin pricing in some switch in policy spreads between the ECB and the Fed. In the past, we showed that short-term policy expectations are important, but long-term ones can be even more relevant, especially when a central bank is well along the path of lifting rates, as the Fed is, while the other remains at maximum accommodation, like the ECB is today.1 Currently, investors expect euro area short rates to be only 0.5% 5-years from now (Chart 14, top panel). The spread between the eurozone and U.S. 5-year forward 1-month OIS rates remains near all-time lows, which explains the weakness in the euro. Now that European policy is much more accommodative than the U.S.’s, there’s scope for investors to upgrade the path of long-term euro area rates relative to the U.S. This would be bullish for the euro (Chart 14, bottom panel). Recovering relative credit flows and improving relative slack and inflation dynamics could catalyze this change. Chart 14The ECB Is Never Raising Rates
The ECB Is Never Raising Rates
The ECB Is Never Raising Rates
Bottom Line: To make the euro an attractive buy, European growth and inflation conditions cannot just increase, they need to improve relative to the U.S. Since long-term interest rate expectations are very depressed in Europe relative to the U.S., a small improvement in the relative growth profile could be enough to catalyze a repricing of the ECB vis-à-vis the Fed, creating a powerful tailwind behind the euro. Nothing Happens In A Vacuum Ultimately, exchange rates, like other prices in the economy, do not only respond to domestic determinants but are also influenced by much larger, global forces. This is because those global trends percolate through domestic economies, resulting in changing relative expected returns that drive money across borders, leading to currency movements. In the case of the euro, global growth matters a lot, because European growth is much more sensitive to global economic fluctuations than U.S. growth is. This is particularly true if shocks emanate from emerging markets (Chart 15). Today, global cyclical variables are increasingly pointing toward an end to the global growth slowdown. A stabilization and reacceleration in global activity would support the euro.
Chart 15
First, Chinese monetary conditions have begun to ease, which historically tends to be linked with improvements in European growth relative to the U.S. (Chart 16). Questions remain surrounding this point: How durable will the rebound in Chinese credit be? By how much will Chinese policymakers nurture this bounce? And will this jump be large enough to lift economic activity in the Middle Kingdom? Nonetheless, a reflationary wind from China has begun to blow, and since investors have already discounted much bad news out of Europe, only small improvements could turn the euro around. Chart 16If China Is Really Stimulating, Europe Will Rip A Greater Dividend
If China Is Really Stimulating, Europe Will Rip A Greater Dividend
If China Is Really Stimulating, Europe Will Rip A Greater Dividend
Second, as Chart 17 shows, our Nowcast for global industrial activity has decisively stepped down. Yet, the countercyclical dollar has been flat since October 2018. Historically, the performance of EM carry trades funded in yen tends to lead global growth. Currently the performance of these strategies is stabilizing. If EM carry trades funded in yen can rally further, this will spell trouble for the greenback, helping the euro – the anti-dollar – in the process. Chart 17An Early Positive For Global Growth
An Early Positive For Global Growth
An Early Positive For Global Growth
Third, EUR/USD tends to correlate with the relative performance of global cyclical equities (Chart 18). The stabilization in these sectors since 2015 suggests it will be difficult for the euro to fall further from current levels. In fact, if EM carry trades can rebound more, cyclicals have additional scope to outperform, and the euro could rally. Chart 18Cyclical Stocks Pointing To No Real Downside In EUR/USD
Cyclical Stocks Pointing To No Real Downside In EUR/USD
Cyclical Stocks Pointing To No Real Downside In EUR/USD
Fourth, the prospects for the semiconductor sector are improving. Demand for semis is highly pro-cyclical, and the U.S. Chip Stock Timing Model developed by our U.S. Equity Strategy service colleagues is currently sending a bullish signal.2 Since such developments link to improving global growth prospects, they are also associated with a stronger EUR/USD (Chart 19). This is also consistent with a generally weaker dollar and stronger Asian currencies. Chart 19The Outlook For Semiconductors Point Toward A Stronger Euro And A Weaker Dollar
The Outlook For Semiconductors Point Toward A Stronger Euro And A Weaker Dollar
The Outlook For Semiconductors Point Toward A Stronger Euro And A Weaker Dollar
Finally, the breakout in copper prices, the stabilization in the CRB Raw Industrials Index and the rally in gold prices all support an improving global growth outlook that could lift EUR/USD. Bottom Line: Various indicators, such as Chinese monetary conditions, EM carry trades, semiconductor demand determinants and commodity prices are suggesting that global growth may soon bottom. Such a development should hurt the countercyclical dollar, amounting to a macro tailwind for EUR/USD. The Bad News Is Priced In Ultimately, the capacity of EUR/USD to rally rests on how much investors upgrade their outlook for Europe. It is therefore crucial to get a sense of exactly how uninspiring Europe currently is to global market participants. There is no better gauge of relative economic pessimism than the price of euro area financial assets relative to U.S. ones. Essentially, money talks. On this front, markets already seem to have internalized the known bad news from Europe, and there is scope for a contrarian rally in the euro, especially if, as we expect, European economic activity improves. First, on a 12-month forward P/E ratio basis, euro area equities are trading at the kind of deep discount to U.S. stocks normally symptomatic of a trough in relative sentiment toward Europe. Such a discount is often followed by a rally in EUR/USD (Chart 20). Chart 20Stock Valuations: Investors Do Not Like Europe
Stock Valuations: Investors Do Not Like Europe
Stock Valuations: Investors Do Not Like Europe
Second, retailers’ equities can often give a more focused assessment of how investors perceive the comparative outlook for domestic demand between two nations. Currently, euro area retailers trade at a 16-year low versus their U.S. counterparts (Chart 21). Investors are therefore much more ebullient about the prospects for U.S. domestic demand than in Europe. Interestingly, the euro’s gyrations since 2016 have tracked the direction of the relative performance of retailers but have diverged in terms of levels. This suggests some underlying support for the currency. Chart 21Can European Domestic Demand Really Validate Such Pessimistic Expectations?
Can European Domestic Demand Really Validate Such Pessimistic Expectations?
Can European Domestic Demand Really Validate Such Pessimistic Expectations?
Third, the relative stock-to-bond ratio also often provides a good read on investors’ comparative economic euphoria/pessimism towards two nations. In 2018, the annual performance of the euro area stock-to-bond ratio relative to the U.S. collapsed to levels not recorded since the euro area crisis was at its apex (Chart 22). This further confirms that investors were massively depressed on European growth prospects relative to the U.S. While this indicator is rebounding, it is still in negative territory, implying that market participants still have room to upgrade their assessment of the euro area relative to the U.S. Historically, this kind of setup has been associated with a rebound in the EUR/USD. Chart 22The Stock-To-Bond Ratio Points To Some Upside Potential
The Stock-To-Bond Ratio Points To Some Upside Potential
The Stock-To-Bond Ratio Points To Some Upside Potential
Fourth, European net earnings revisions relative to the U.S. have also hit bombed-out levels and are in the process of improving. Since earnings are tightly linked to global growth and reflect the same information that informs capital flows into a country (Chart 23), sell-side analysts becoming more positive on Europe at the margin could indicate that investors are in the process of re-assessing whether to buy European assets. A decision to do so would support EUR/USD. Chart 23When The Sell-Side Move From Deeply To Mildly Bearish, EUR/USD Rallies
When The Sell-Side Move From Deeply To Mildly Bearish, EUR/USD Rallies
When The Sell-Side Move From Deeply To Mildly Bearish, EUR/USD Rallies
Bottom Line: Financial market pricing suggests that investors are displaying deep pessimism toward the euro area’s relative growth prospects. The euro could be a contrarian buy. Most importantly, there are early signs that this growth pricing is starting to move in favor of Europe. If our economic view on Europe and global growth is correct, this trend has further to go, implying that more capital could move into Europe, creating a potent tailwind for EUR/USD. What Else? Three additional factors need to be considered: Currency valuations, balance-of-payment dynamics, and technicals. First, while it is not as cheap as it once was, the real trade-weighted euro is still trading below its historical average (Chart 24). Purchasing-power considerations can rarely be used as a timing tool, but our confidence in the euro’s upside would be greatly dented if the euro were a very expensive currency. It is not even mildly pricey. Chart 24Euro Valuations: No Headwinds There
Euro Valuations: No Headwinds There
Euro Valuations: No Headwinds There
Second, balance-of-payment considerations have become increasingly euro-positive. The euro area runs a current account surplus of 3.3% of GDP, and despite large FDI outflows – a natural consequence of being a savings-rich economy – the basic balance of payments remains in surplus. Moreover, as fixed-income outflows have been dissipating, the aggregate portfolio flows into Europe have also been improving (Chart 25). The end of the ECB’s Asset Purchase Program should solidify this trend. Chart 25The Euro Area Balance Of Payments Is Increasingly Favorable
The Euro Area Balance Of Payments Is Increasingly Favorable
The Euro Area Balance Of Payments Is Increasingly Favorable
Finally, technical oscillators are behaving increasingly well. As Chart 26 shows, not only does our Intermediate-Term Indicator remains oversold, but also, it is has begun to form a positive divergence with the price of EUR/USD. If the economic outlook is becoming more bullish, such a technical setup can often be translated into significant gains. Chart 26EUR/USD: Oversold And A Positive Divergence Is Forming
EUR/USD: Oversold And A Positive Divergence Is Forming
EUR/USD: Oversold And A Positive Divergence Is Forming
Bottom Line: The euro’s valuation is not as attractive as it once was, but it remains cheap. Moreover, the euro area’s balance-of-payment dynamics and the EUR/USD’s technical setup both suggest the timing is increasingly ripe to buy the euro against the dollar. Investment Conclusions A trough in European growth, improving growth and inflation prospects relative to the U.S., green shoots for global growth and deep pessimism toward Europe relative to the U.S. all argue that the timing is right to bet on a euro rebound. At this point, the durability of the euro rebound remains unclear. Investors are under-appreciating the ability of the Fed to raise rates this year, which could help the dollar. On the other hand, they seem even more sanguine toward the ECB ever lifting rates. Ultimately, the capacity of the euro to rebound on a long-term basis against the dollar will be constrained by global growth. This means that China will continue to play a center-stage role for this crucial FX pair. At this point, it is unclear how determined Chinese policymakers are to reflate their economy. Thus, we recommend investors monitor Chinese policy to gauge how long to stay in the euro. For the time being, enough pieces are falling into place to warrant buying EUR/USD for three to six months. However, if the Chinese credit impulse can continue on its recent rebound, the durability of a euro rally could be extended, implying that the euro may be in the process of forming a long-term bottom against the dollar. A strengthening euro should support the entire European currency complex against the dollar. In fact, the NOK, the SEK and the GBP may even outperform the EUR. The NOK is being boosted by rising oil prices, a more hawkish central bank, better valuations and an even healthier balance of payments. The SEK is also supported by a Riksbank that is slightly more hawkish than the ECB, and better valuations; it also benefits from a Swedish economy that is even more pro-cyclical than the euro area’s. The GBP also benefits from a greater valuation discount than the euro, and political developments in the U.K. are beginning to move toward a more clear-cut positive outcome on the Brexit front.3 The countercyclical and expensive CHF will prove the European laggard. Finally, EUR/JPY is also set to continue its rebound that began on January 4th. In fact, it may be one of the best vehicles to express a euro-bullish view because it is less sensitive to what the Fed does than EUR/USD is. Rising bond yields are an unmitigated positive for EUR/JPY, and BCA firmly believes that U.S. Treasury yields have upside, whether or not the Fed goes back to lifting rates. The Fed will mostly impact whether it is the real or inflation component that lifts Treasury yields. Bottom Line: The entire European currency complex is set to rise along with the euro against the greenback. In fact, the NOK, the SEK and the GBP are likely to outperform the euro, while the CHF should underperform. EUR/JPY may in fact offer the best risk-adjusted returns to play a euro rebound. While it is clear that at this moment that buying the euro makes sense, the principal risk lies around how long this rally will last. We are increasingly convinced that the euro has made a low for the cycle and that its long-term outlook is looking increasingly bright. Mathieu Savary, Vice President Foreign Exchange Strategy mathieu@bcaresearch.com Footnotes 1 Please see the EUR/USD: Focus On The Western Shores Of The Atlantic section of the Foreign Exchange Strategy Weekly Report, titled “Canaries In The Coal Mine Alert: EM/JPY Carry Trades”, dated December 1, 2017, available at fes.bcaresearch.com 2 Please see U.S. Equity Strategy Weekly Report, titled “Reflationary Or Recessionary”, dated February 25, 2019, available at uses.bcaresearch.com 3 Please see European Investment Strategy Weekly Report, titled “Why A Catastrophic No-Deal Might Be Good… For The EU”, dated February 28, 2019, available at eis.bcaresearch.com Trades & Forecasts Forecast Summary Core Portfolio Tactical Trades Closed Trades
Highlights Global growth is still slowing. Having rallied since the start of the year, global stocks will likely enter a “dead zone” over the next six-to-eight weeks as investors nervously await the proverbial green shoots to sprout. We think they will appear in the second quarter, setting the scene for a reacceleration in global growth in the second half of the year, and an accompanying rally in global risk assets. Investors should overweight stocks and spread product while underweighting safe government bonds over a 12-month horizon. The U.S. dollar will strengthen a bit over the next few months, but should start to weaken in the summer as the global economy catches fire. Stronger global growth and a weaker dollar in the back half of the year will benefit EM assets and European stocks. Feature I skate to where the puck is going to be, not to where it has been. — Wayne Gretzky How To Be A Good Macro Strategist To paraphrase Gretzky, a mediocre macro strategist draws conclusions based solely on incoming data. A good macro strategist, in contrast, tries to figure out where the data is heading. How can one predict how the economic data will evolve? Examining forward-looking indicators is helpful, but it is not enough. One also has to understand why the data is evolving the way it is. If one knows this, one can then assess whether the forces either hurting or helping growth will diminish, intensify, or remain the same. What Accounts For the Growth Slowdown? There is little mystery as to why global growth slowed in 2018. Chinese credit growth fell steadily over the course of the year, which generated a negative credit impulse. Unlike in the past, China is now the most important driver of global credit flows (Chart 1). Chart 1Global Credit Flows Are Increasingly Driven By China
Global Credit Flows Are Increasingly Driven By China
Global Credit Flows Are Increasingly Driven By China
Meanwhile, the global economy was rocked by rising oil prices. Brent rose from $55/bbl on October 5, 2017 to $85/bbl on October 4, 2018. Government bond yields also increased, with the 10-year U.S. Treasury yield rising from 2.05% on September 7, 2017 to 3.23% on October 5, 2018 (Chart 2). Chart 2Rising Oil Prices And Bond Yields Contributed To Slower Global Growth Last Year
Rising Oil Prices And Bond Yields Contributed To Slower Global Growth Last Year
Rising Oil Prices And Bond Yields Contributed To Slower Global Growth Last Year
A mediocre macro strategist draws conclusions based solely on incoming data. A good macro strategist, in contrast, tries to figure out where the data is heading. In an ironic twist, Jay Powell’s ill-timed comment that rates were “a long way” from neutral marked the peak in bond yields. Unfortunately, the subsequent decline in yields was accompanied by a vicious stock market correction and a widening in credit spreads. This led to an overall tightening in financial conditions, which further hurt growth (Chart 3). Chart 3Financial Conditions Tightened In 2018, Especially After Powell's Hawkish Comments
Financial Conditions Tightened In 2018, Especially After Powell's Hawkish Comments
Financial Conditions Tightened In 2018, Especially After Powell's Hawkish Comments
The critical point is that all of these negative forces are behind us: Financial conditions have eased significantly over the past two months; oil prices have rebounded, but are still well below their 2018 highs; and as we explain later on, Chinese growth is likely to bottom by the middle of this year. This means that global growth should start to improve over the coming months. The United States: Better News Ahead The latest U.S. economic data has been weak, with this morning’s disappointing ISM manufacturing print being the latest example. The New York Fed’s GDP Nowcast is pointing to annualized growth of 0.9% in the first quarter. While there is no doubt that underlying growth has decelerated, data distortions have probably also contributed to the perceived slowdown. For instance, the dismal December retail sales report reduced the base for consumer spending going into 2019, thus shaving about 0.4 percentage points off Q1 growth. The drop in real personal consumption expenditures (PCE) cut the New York Fed’s Q1 growth estimate by a further 0.15 percentage points. We suspect that much of the weakness in December retail sales and PCE was linked to the government shutdown. The closure caused some of the surveys used to compile these reports to be postponed until January, which is historically the weakest month for retail sales. The Johnson Redbook Index – which covers 80% of the retail sales surveyed by the Department of Commerce – as well as the sales figures from Amazon and Walmart all point to strong spending during the holiday season (Chart 4). Chart 4The December U.S. Retail Sales Report Was Probably A Fluke
The December U.S. Retail Sales Report Was Probably A Fluke
The December U.S. Retail Sales Report Was Probably A Fluke
Fundamentally, U.S. consumers are in good shape (Chart 5). As a share of disposable income, household debt is over 30 percentage points lower than it was in 2007. The savings rate stands at an elevated level, which gives households the wherewithal to increase spending. Job openings hit another record high, while wage growth continues to trend upwards. Fundamentally, U.S. consumers are in good shape. Chart 5U.S. Consumer Fundamentals Are Solid
U.S. Consumer Fundamentals Are Solid
U.S. Consumer Fundamentals Are Solid
The housing market should improve. Rising mortgage rates weighed on housing last year. However, rates have been declining for several months now, which augurs well for home sales and construction over the next six months (Chart 6). Chart 6Mortgage Rates Will Not Be A Headwind For U.S. Housing Activity Over The Next 6 Months
Mortgage Rates Will Not Be A Headwind For U.S. Housing Activity Over The Next 6 Months
Mortgage Rates Will Not Be A Headwind For U.S. Housing Activity Over The Next 6 Months
While capex intention surveys have come off their highs, they still point to reasonably solid expansion plans (Chart 7). Rising labor costs and high levels of capacity utilization will induce firms to invest in more capital equipment, which should support business spending. Chart 7U.S. Capex Plans Have Come Off Their Highs, But Remain Solid
U.S. Capex Plans Have Come Off Their Highs, But Remain Solid
U.S. Capex Plans Have Come Off Their Highs, But Remain Solid
Government expenditures should also recover. By most estimates, the shutdown shaved one percentage point from Q1 growth. This is likely to be completely reversed in the second quarter. The End Of The Chinese Deleveraging Campaign? The popular narrative about weaker Chinese growth has focused on the trade war. While trade uncertainty undoubtedly hurt growth last year – and has continued to weigh on growth so far this year – most of the weakness in the Chinese economy can be traced to the deleveraging campaign which started in 2017, long before the surge in trade flow angst. Fixed investment spending in China is generally financed through credit markets. Chart 8 shows that the contribution of investment spending to GDP growth has declined in tandem with decelerating credit growth. Most of the weakness in the Chinese economy can be traced to the deleveraging campaign which started in 2017, long before the surge in trade flow angst. Chart 8China: Deleveraging Means Less Investment-Led Growth
China: Deleveraging Means Less Investment-Led Growth
China: Deleveraging Means Less Investment-Led Growth
Chinese credit growth has typically reaccelerated whenever it has dipped towards trend nominal GDP growth. We may have already reached this point (Chart 9). New credit formation came in well above expectations in January. Given possible distortions caused by the timing of the Chinese lunar new year, investors should wait until the February data is released in mid-March before drawing any firm conclusions. Nevertheless, it is starting to look increasingly likely that credit growth has bottomed. The 6-month credit impulse has already surged (Chart 10). The 12-month impulse should also begin moving up provided that month-over-month credit growth simply maintains its recent trend (Chart 11). Chart 9Historically, China Has Scaled Back On Deleveraging When Credit Growth Has Fallen Close To Nominal GDP Growth
Historically, China Has Scaled Back On Deleveraging When Credit Growth Has Fallen Close To Nominal GDP Growth
Historically, China Has Scaled Back On Deleveraging When Credit Growth Has Fallen Close To Nominal GDP Growth
Chart 10A Rebound In The Chinese 6-Month Credit Impulse
A Rebound In The Chinese 6-Month Credit Impulse
A Rebound In The Chinese 6-Month Credit Impulse
Chart 11The 12-Month Impulse Is Set To Turn Up
The 12-Month Impulse Is Set To Turn Up
The 12-Month Impulse Is Set To Turn Up
On the trade front, President Trump’s decision to delay the implementation of tariffs on $200 billion in Chinese imports is a step in the right direction. Nevertheless, gauging whether the trade war will continue to de-escalate is extraordinarily difficult. There is no major constituency within the Republican Party campaigning for protectionism. It ultimately boils down to what one man – Trump – wants. Our best guess is that President Trump will try to score a few political points by “declaring victory” – deservedly or not – in his battle with China in order to pivot to more pressing domestic issues such as immigration. However, there can be no assurance of this, which is why China’s leaders are likely to prioritize growth over deleveraging, at least for the time being. They know full well that the only way they can credibly threaten to walk away from the negotiating table is if their economy is humming along. Europe: From Headwinds To Tailwinds? Slower global growth, higher oil prices, and a spike in Italian bonds yields all contributed to the poor performance of the European economy last year. Economic activity was further hampered by a decline in German automobile production following the introduction of more stringent emission standards. The good news is that these headwinds are set to reverse course. Italian bond yields are well off their highs, as are oil prices (Chart 12). German automobile production is recovering (Chart 13). In addition, the European Commission expects the euro area fiscal thrust to reach 0.40% of GDP this year, up from 0.05% of GDP last year (Chart 14). This should add about half a percentage point to growth. Finally, if our expectation that Chinese growth will bottom out by mid-year proves correct, European exports should benefit. If neither the political establishment nor the general public favor Brexit, it will not happen. Chart 12Headwind No More (I): Italian Bond Yields
Headwind No More (I): Italian Bond Yields
Headwind No More (I): Italian Bond Yields
Chart 13Headwind No More (II): German Auto Sector
Headwind No More (II): German Auto Sector
Headwind No More (II): German Auto Sector
Chart 14The Euro Area Will Benefit From A Modest Amount Of Fiscal Easing This Year
The Euro Area Will Benefit From A Modest Amount Of Fiscal Easing This Year
The Euro Area Will Benefit From A Modest Amount Of Fiscal Easing This Year
Brexit still remains a risk, but a receding one. We have consistently argued that the political establishment on both sides of the British channel will not accept anything resembling a hard Brexit. As was the case with the EU treaty referendums involving Denmark and Ireland in the 1990s, the European political elites will insist on a “No fair! Let’s play again! Best two-out-of-three?” do-overs until they get the result they want. Theresa May’s efforts to cobble together a parliamentary majority that precludes a hard Brexit, along with the Labor Party’s increasing willingness to pursue a second vote, is consistent with our thesis. Fortunately for the “remain” side, public opinion is shifting in favor of staying in the EU (Chart 15). Focusing on the minutiae of various timetables, rules, and regulations is largely a waste of time. If neither the political establishment nor the general public favor Brexit, it will not happen. We are short EUR/GBP, a trade recommendation that has gained 5.2% since we initiated it. We continue to see upside for the pound. Chart 15The ''Remain'' Side Would Likely Win Another Referendum
The ''Remain'' Side Would Likely Win Another Referendum
The ''Remain'' Side Would Likely Win Another Referendum
Investment Conclusions Global growth is still slowing. Having rallied since the start of the year, global stocks will likely enter a “dead zone” for the next six-to-eight weeks as investors nervously await the proverbial green shoots to sprout. We think they will appear in the second quarter, setting the scene for a reacceleration in global growth in the second half of the year, and an accompanying rally in global risk assets. The dollar is a countercyclical currency, meaning that it moves in the opposite direction of the global business cycle (Chart 16). The greenback will strengthen a bit over the next few months, but should start to weaken in the summer as the global economy catches fire. Chart 16The Dollar Is A Countercyclical Currency
The Dollar Is A Countercyclical Currency
The Dollar Is A Countercyclical Currency
We sold our put on the EEM ETF for a gain of 104% on Jan 3rd, and are now outright long EM equities. We do not have a strong view on EM versus DM equities at the moment, but expect to shift EM to overweight once we see more confirmatory evidence that Chinese growth is stabilizing. Having rallied since the start of the year, global stocks will likely enter a “dead zone” for the next six-to-eight weeks as investors nervously await the proverbial green shoots to sprout. In conjunction with our expected upgrade on EM assets, we will move European equities to overweight. Stronger global growth will benefit European multinational exporters, while brisker domestic growth should allow the market to price in a few more ECB rate hikes starting in 2020. The latter will lead to a somewhat steeper yield curve which, along with rising demand for credit, should boost financial sector earnings (Chart 17). This will give European bank stocks a welcome boost. Chart 17Stronger Euro Area Credit Growth Will Boost Bank Earnings
Stronger Euro Area Credit Growth Will Boost Bank Earnings
Stronger Euro Area Credit Growth Will Boost Bank Earnings
Japanese equities will also benefit from faster global growth, but domestic demand will suffer from the government’s ill-advised plan to raise the sales tax in October. As such, we do not anticipate upgrading Japanese stocks. We also expect the yen to come under some pressure as the BoJ is forced to maintain its ultra-accommodative monetary policy stance, while bond yields elsewhere move modestly higher. Peter Berezin Chief Global Investment Strategist peterb@bcaresearch.com Strategy & Market Trends* MacroQuant Model And Current Subjective Scores
Chart 18
Tactical Trades Strategic Recommendations Closed Trades
Highlights Global growth is still slowing. Having rallied since the start of the year, global stocks will likely enter a “dead zone” over the next six-to-eight weeks as investors nervously await the proverbial green shoots to sprout. We think they will appear in the second quarter, setting the scene for a reacceleration in global growth in the second half of the year, and an accompanying rally in global risk assets. Investors should overweight stocks and spread product while underweighting safe government bonds over a 12-month horizon. The U.S. dollar will strengthen a bit over the next few months, but should start to weaken in the summer as the global economy catches fire. Stronger global growth and a weaker dollar in the back half of the year will benefit EM assets and European stocks. Feature I skate to where the puck is going to be, not to where it has been. — Wayne Gretzky Gretzky's Doctrine To paraphrase Gretzky, a mediocre macro strategist draws conclusions based solely on incoming data. A good macro strategist, in contrast, tries to figure out where the data is heading. How can one predict how the economic data will evolve? Examining forward-looking indicators is helpful, but it is not enough. One also has to understand why the data is evolving the way it is. If one knows this, one can then assess whether the forces either hurting or helping growth will diminish, intensify, or remain the same. What Accounts For The Growth Slowdown? There is little mystery as to why global growth slowed in 2018. Chinese credit growth fell steadily over the course of the year, which generated a negative credit impulse. Unlike in the past, China is now the most important driver of global credit flows (Chart I-1).
Image
Meanwhile, the global economy was rocked by rising oil prices. Brent rose from $55/bbl on October 5, 2017 to $85/bbl on October 4, 2018. Government bond yields also increased, with the 10-year U.S. Treasury yield rising from 2.05% on September 7, 2017 to 3.23% on October 5, 2018 (Chart I-2).
Image
In an ironic twist, Jay Powell’s ill-timed comment that rates were “a long way” from neutral marked the peak in bond yields. Unfortunately, the subsequent decline in yields was accompanied by a vicious stock market correction and a widening in credit spreads. This led to an overall tightening in financial conditions, which further hurt growth (Chart I-3).
Image
The critical point is that all of these negative forces are behind us: Financial conditions have eased significantly over the past two months; oil prices have rebounded, but are still well below their 2018 highs; and as we explain later on, Chinese growth is likely to bottom by the middle of this year. This means that global growth should start to improve over the coming months. The United States: Better News Ahead The latest U.S. economic data has been weak, with this morning’s disappointing ISM manufacturing print being the latest example. The New York Fed’s GDP Nowcast is pointing to annualized growth of 0.9% in the first quarter. While there is no doubt that underlying growth has decelerated, data distortions have probably also contributed to the perceived slowdown. For instance, the dismal December retail sales report reduced the base for consumer spending going into 2019, thus shaving about 0.4 percentage points off Q1 growth. The drop in real personal consumption expenditures (PCE) cut the New York Fed’s Q1 growth estimate by a further 0.15 percentage points. We suspect that much of the weakness in December retail sales and PCE was linked to the government shutdown. The closure caused some of the surveys used to compile these reports to be postponed until January, which is historically the weakest month for retail sales. The Johnson Redbook Index – which covers 80% of the retail sales surveyed by the Department of Commerce – as well as the sales figures from Amazon and Walmart all point to strong spending during the holiday season (Chart I-4).
Image
Fundamentally, U.S. consumers are in good shape (Chart I-5). As a share of disposable income, household debt is over 30 percentage points lower than it was in 2007. The savings rate stands at an elevated level, which gives households the wherewithal to increase spending. Job openings hit another record high, while wage growth continues to trend upwards.
Image
The housing market should improve. Rising mortgage rates weighed on housing last year. However, rates have been declining for several months now, which augurs well for home sales and construction over the next six months (Chart I-6).
Image
While capex intention surveys have come off their highs, they still point to reasonably solid expansion plans (Chart I-7). Rising labor costs and high levels of capacity utilization will induce firms to invest in more capital equipment, which should support business spending.
Image
Government expenditures should also recover. By most estimates, the shutdown shaved one percentage point from Q1 growth. This is likely to be completely reversed in the second quarter. The End Of The Chinese Deleveraging Campaign? The popular narrative about weaker Chinese growth has focused on the trade war. While trade uncertainty undoubtedly hurt growth last year – and has continued to weigh on growth so far this year – most of the weakness in the Chinese economy can be traced to the deleveraging campaign which started in 2017, long before the surge in trade flow angst. Fixed investment spending in China is generally financed through credit markets. Chart I-8 shows that the contribution of investment spending to GDP growth has declined in tandem with decelerating credit growth.
Image
Chinese credit growth has typically reaccelerated whenever it has dipped towards trend nominal GDP growth. We may have already reached this point (Chart I-9). New credit formation came in well above expectations in January. Given possible distortions caused by the timing of the Chinese lunar new year, investors should wait until the February data is released in mid-March before drawing any firm conclusions. Nevertheless, it is starting to look increasingly likely that credit growth has bottomed. The 6-month credit impulse has already surged (Chart I-10). The 12-month impulse should also begin moving up provided that month-over-month credit growth simply maintains its recent trend (Chart I-11).
Image
Image
Image
On the trade front, President Trump’s decision to delay the implementation of tariffs on $200 billion in Chinese imports is a step in the right direction. Nevertheless, gauging whether the trade war will continue to de-escalate is extraordinarily difficult. There is no major constituency within the Republican Party campaigning for protectionism. It ultimately boils down to what one man – Trump – wants. Our best guess is that President Trump will try to score a few political points by “declaring victory” – deservedly or not – in his battle with China in order to pivot to more pressing domestic issues such as immigration. However, there can be no assurance of this, which is why China’s leaders are likely to prioritize growth over deleveraging, at least for the time being. They know full well that the only way they can credibly threaten to walk away from the negotiating table is if their economy is humming along. Europe: From Headwinds To Tailwinds? Slower global growth, higher oil prices, and a spike in Italian bonds yields all contributed to the poor performance of the European economy last year. Economic activity was further hampered by a decline in German automobile production following the introduction of more stringent emission standards. The good news is that these headwinds are set to reverse course. Italian bond yields are well off their highs, as are oil prices (Chart I-12). German automobile production is recovering (Chart I-13). In addition, the European Commission expects the euro area fiscal thrust to reach 0.40% of GDP this year, up from 0.05% of GDP last year (Chart I-14). This should add about half a percentage point to growth. Finally, if our expectation that Chinese growth will bottom out by mid-year proves correct, European exports should benefit.
Image
Image
Image
Brexit still remains a risk, but a receding one. The political establishment on both sides of the British channel will not accept anything resembling a hard Brexit. As was the case with the EU treaty referendums involving Denmark and Ireland in the 1990s, the European political elites will insist on a “No fair! Let’s play again! Best two-out-of-three?” do-overs until they get the result they want. Theresa May’s efforts to cobble together a parliamentary majority that precludes a hard Brexit, along with the Labor Party’s increasing willingness to pursue a second vote, is consistent with our thesis. Fortunately for the “remain” side, public opinion is shifting in favor of staying in the EU (Chart I-15). Focusing on the minutiae of various timetables, rules, and regulations is largely a waste of time. If neither the political establishment nor the general public favor Brexit, it will not happen.
Image
Investment Conclusions Global growth is still slowing. Having rallied since the start of the year, global stocks will likely enter a “dead zone” for the next six-to-eight weeks as investors nervously await the proverbial green shoots to sprout. We think they will appear in the second quarter, setting the scene for a reacceleration in global growth in the second half of the year, and an accompanying rally in global risk assets. The dollar is a countercyclical currency, meaning that it moves in the opposite direction of the global business cycle (Chart I-16). The greenback will strengthen a bit over the next few months, but should start to weaken in the summer as the global economy catches fire.
Image
We do not have a strong view on EM versus DM equities at the moment, but expect to shift EM to overweight once we see more confirmatory evidence that Chinese growth is stabilizing. In conjunction with our expected upgrade on EM assets, we will move European equities to overweight. Stronger global growth will benefit European multinational exporters, while brisker domestic growth should allow the market to price in a few more ECB rate hikes starting in 2020. The latter will lead to a somewhat steeper yield curve which, along with rising demand for credit, should boost financial sector earnings (Chart I-17). This will give European bank stocks a welcome boost.
Image
Japanese equities will also benefit from faster global growth, but domestic demand will suffer from the government’s ill-advised plan to raise the sales tax in October. As such, we do not anticipate upgrading Japanese stocks. We also expect the yen to come under some pressure as the BoJ is forced to maintain its ultra-accommodative monetary policy stance, while bond yields elsewhere move modestly higher. Peter Berezin Chief Global Investment Strategist March 1, 2019 Next Report: March 28, 2019 II. Troubling Implications Of Global Demographic Trends Developed economies are challenged by two powerful and related demographic trends: declining growth in working-age populations, and a rapidly-aging population structure. Working-age populations are in absolute decline in Japan and much of Europe and growth is slowing sharply in the U.S. An offsetting acceleration in productivity growth is unlikely, implying a marked deceleration in economic growth potential. The combination of slower growth in the number of taxpayers and rising numbers of retirees is toxic for government finances. Future generations face sharply rising debt burdens and increased taxes to pay for entitlements. The correlation between aging and asset prices is inconclusive but common sense suggests it is more likely to be bearish than bullish. Population growth remains rapid throughout most of the developing world, China being a notable exception. It is especially strong in Africa, a region that has historically faced economic mismanagement and thus poor economic prospects for most of its inhabitants. Migration from the emerging to developed world is a logical solution to global demographic trends, but faces a backlash in many countries for both economic and cultural reasons. These tensions are likely to increase. Making accurate economic and market forecasts is daunting because there are so many moving parts and unanticipated events are inevitable. Quantitative models are destined to fail because of the unpredictability of human behavior and random shocks. Demographic forecasts are a lot easier, at least over the short-to-medium term. If you want to know how many 70-year olds there will be in 10 years’ time, then count how many 60-year olds there are today and adjust by the mortality rate for that age group. Demographic trends are very incremental from year to year and their impact is swamped by economic, political and financial events. Thus, it rarely makes sense to blame demographics for cyclical swings in the economy or markets. In some respects, demographics can be likened to glaciers. You will quickly get bored standing by a glacier to watch it move. But, over long time periods, glaciers cover enormous distances and can completely reshape the landscape. Similarly, over the timespan of one or more generations, demographics can have powerful effects on economies and societies. Some important demographic trends have been going on for long enough that their effects are visible. The most common concern about global demographics has tended to be overpopulation and pressure on resources and the environment. And this is hardly new. In 1798, Thomas Malthus published his “Essay on The Principles of Population” in which he argued that population growth would outstrip food supply, leading to a very miserable outcome. Of course, what he missed was the revolution in agricultural techniques that meant food supply kept up with population growth. In 1972, a group of experts calling themselves The Club of Rome published a report titled “The Limits to Growth” which argued that a rising world population would outstrip the supply of natural resources, putting a limit to economic growth. Again, that report underestimated the ability of technology to solve the problem of scarcity, although many still believe the essence of the report has yet to be proved wrong. Phenomena such as climate change and rising numbers of animal species facing extinction are seen as supporting the thesis that the world’s population is putting unsustainable demands on the planet. Rather than get into that debate, this report will focus on three particular big-picture problems associated with demographic trends: Declining working-age populations in most major industrialized economies during the next several decades. Population aging throughout the developed world. Continued rapid population growth in many of the world’s poorest and most troubled countries. According to the UN’s latest projections, the world’s population will increase from around 7.5 billion today to almost 10 billion by 2050.1 The population growth rate peaked in the 1970s and is expected to slow sharply over the next several decades (Chart II-1). Despite slower percentage growth rates, the population keeps going up steadily because one percent of the 1970 global population was about 3.7 million, while one percent of the current population is about 7.5 million.
Image
But here is an important point: virtually all future growth in the global population will come from the developing world (Chart II-2). The population of the developed world is expected to be broadly flat over the period to 2050, and this has some significant economic implications.
Image
Let’s first look at why population growth has stagnated in the developed world. Population growth is a function of three things: the birth rate, the death rate and net migration. Obviously, if there are more births than deaths then there will be a natural increase in the population and net migration will either add or subtract to that. Over time, there have been major changes in some of these drivers. In the developed world, a stable population requires that, on average, there are 2.1 children born for every woman. The fact that it is not exactly 2 accounts for infant mortality and because there are slightly more males than females born. The replacement-level fertility rate needs to be higher than 2.1 in the developing world because of higher infant mortality rates. After WWII, the fertility rate throughout most of the developed world was well above 2.1 as soldiers returned home and the baby boom generation was born. But, by the end of the 1970s, the rate had dropped below the replacement level in most countries and currently is a lowly 1.5 in Japan, Germany and Italy (Table II-1). It has stayed higher in the U.S. but even there it has dipped below the critical 2.1 level. This trend has reflected lot of factors including more widespread use of birth control and more women entering the labor force.
Image
In the developed world, the birth rate is expected to drop below the death rate in the next ten years (Chart II-3). That means there will be a natural decrease in the population. In the case of Japan, Germany, Italy and Portugal that change already occurred between 2005 and 2010. In the U.S., the UN expects birth rates to stay just above death rates in the period to 2050, but the gap narrows sharply. Births exceed deaths throughout most of the developing world meaning that populations continue to grow. Notable exceptions to this are Eastern Europe where populations are already in sharp decline and China, where deaths begin to exceed births in the 2030s.
Image
Although life expectancy is rising, death rates in the developed world will rise simply because the rapidly growing number of old people more than offsets the impact of longer lifespans. Of course, the population of a country can also be boosted by immigration, and that has been true for much of the developed world. In Canada and most of Europe, net migration already is the dominant source of overall population growth and it will become so in the U.S. in the coming decades, based on current trends (Chart II-4).
Image
This is the background to the first key issue addressed in this report: the declining trend in the growth of the working-age population in the developed world. Slowing Growth In Working-Age Populations An economy’s growth potential depends on only two things: the number of people working and their productivity. If the labor force grows at 1% a year and productivity also increases by 1%, then the economy’s trend growth rate is 2%. In the short-run, the economy may grow faster or slower than that, depending on issues like fiscal and monetary policy, oil prices etc. Over the long run, growth is constrained by people and productivity. The potential labor force is generally regarded to be the people aged 15 to 64. The growth trend in this age segment has slowed sharply in recent years in the major economies and is set to weaken further in the years ahead (Chart II-5). The problem is most severe in Japan and Europe where the working-age population is already declining. In the case of the U.S., growth in this age cohort slows from an average 1.5% a year in the 1960s and 1970s to a projected pace of less than 0.5% in the coming decades.
Image
While this generally is not a problem faced by the developing world, a notable exception is China, now reaping the consequences of its one-child policy. Its working-age population is set to decline steadily in the years ahead. Thus, it is inevitable that Chinese growth also will slow in the absence of an acceleration of productivity growth The slowing trend in the working-age population could be offset if we could get more 15-64 year olds to join the labor force, or get more older people to stay working. In the U.S., almost 85% of male 15-64 year olds were either employed or were wanting a job in the mid-1990s. This has since dropped to below 80% - a marked divergence from the trend in most other countries (Chart II-6). And the female participation rate in the U.S. also is below that of other countries.
Image
The reason for the decline in U.S. labor participation rates for prime-aged adults is unclear. Explanations include increased levels of people in full-time education, in prison, or claiming disability. A breakdown of male participation rates by age shows particularly sharp drops in the 15-19 and 20-24 age groups, though the key 20-54 age category also is far below earlier peaks (Chart II-7). The U.S. participation rate has recently picked up but it seems doubtful that it will return to earlier highs.
Image
Other solutions to the problem would be getting more people aged 65 and above to stay in the labor force, and/or faster growth in productivity. The former probably will require changes to the retirement age and we will return to that issue shortly. There always are hopes for faster productivity growth, but recent data have remained disappointing for most developed economies (Chart II-8). New technologies hold out some hope but this is a contentious topic.
Image
On a positive note, the shrinking growth of the working-age population may be easier to live with in a world of robotization and artificial intelligence where machines are expected to take over many jobs. That would support a more optimistic view of productivity but it remains to be seen how powerful the impact will be. Another important problem related to the slowing growth of the working-age population relates to fiscal burdens. In 1980, the level of government debt per taxpayer (ages 20-64) was around $58,000 in the U.S. in today’s money and this is on track for $104,000 by 2020 (Chart II-9). But this pales in comparison to Japan where it rises from $9,000 to $170,000 over the same period. Canada looks more favorable, rising from $23,000 in 1980 to $68,000 in 2020. These burdens will keep rising beyond 2020 until governments start running budget surpluses. Our children and grandchildren will bear the burden of this and won’t thank us for allowing the debt to build up in the first place.
Image
There will be a large transfer of privately-held assets from the baby boomers to the next generation, but the ownership of this wealth is heavily skewed. According to one study, the top 1% owned 40% of U.S. wealth in 2016, while the bottom 90% owned 20%.2 And it seems likely that this pool of wealth will erode over time, providing a smaller cushion to the following generation. This leads in to the next topic – aging populations. Aging Populations In The Developed World The inevitable result of the combination of increased life expectancy and declining birth rates has been a marked aging of populations throughout the developed world. Between 2000 and 2050, the developed world will see the number of those aged 65 and over more than double while the numbers in other age groups are projected to show little change (Chart II-10).
Image
As long as the growing numbers of those aged 65 and above are in decent health, then life is quite good. Fifty years ago in the U.S., poverty rates were very high for those of retirement age compared to the young (i.e. under 18). But that has changed as the baby boomer generation made sure that they voted for increased entitlement programs. Now poverty rates for the 65+ group are far below those of the young (Chart II-11). At the same time, real incomes for those 65 and older have significantly outperformed those of younger age groups.
Image
A major problem is that aging baby boomers are expensive because of the cost of pensions and medical care. As would be expected, health care costs rise dramatically with age. For those aged 44 and under, health care costs in the U.S. averaged around $2,000 per person in 2015. For those 65 and over, it was more than $11,000 per person. And per capita spending doubles between the ages of 70 and 90. So here we have the problem: a growing number of expensive older people supported by a shrinking number of taxpayers. This is illustrated by the ratio of the number of people between 20 and 64 divided by those 65 and older. In other words, the number of taxpayers supporting each retiree (Chart II-12).
Image
In 1980, there were five taxpayers for every retiree in the U.S., four in W. Europe and seven in Japan. These ratios have since dropped sharply, and in the next few decades will be down to 2.5 in the U.S., 1.8 in Europe and 1.3 in Japan. For each young Japanese taxpayer, it will be like having the cost of a retiree deducted from their paycheck. Throughout the developed world, the baby boomers’ children and grandchildren face a growing burden of entitlements. Some of the statistics related to Japan’s demographics are dramatic. In the first half of the 1980s there were more than twice as many births as deaths (Chart II-13). They become equal around ten years ago and in another ten years deaths are projected to exceed births by around three million a year. In 1990, the number of people aged four and under was more than double the number aged 80 and above. Now the situation is reversed with those aged 80 years and above more than double those four and under. That is why sales of adult diapers reportedly exceed those of baby diapers – very depressing!3
Image
What’s the solution to aging populations? An obvious one is for people to retire later. When pension systems were set up, life expectancy at birth was below the age pensions were granted - typically around 65. In other words, not many people were expected to live long enough to get a government pension. And the lucky ones who did live long enough were not expected to be around to receive a pension for more than a few years. By 1950, those males who had reached the age of 65 were expected, on average, to live another 11 to 13 years in the major developed countries (Table II-2). This rose to 16-18 years by 2000 and is expected to reach 22-23 years by 2050. Governments have made a huge error in failing to raise the retirement age as life expectancy increased. Pension systems were never designed to allow people to receive government pensions for more than 20 years.
Image
Some countries have raised the retirement age for pensions, but progress on this front is painfully slow. Other solutions would be to raise pension contributions or to means-test benefits. Not surprisingly, governments are reluctant to take such unpopular actions. At some point, they will have no choice, but that awaits pressures from the financial markets. Currently, not many people aged over 65 remain in the workforce. The participation rate for men is less than 10% in Europe and less than 25% in the U.S. And it is a lot lower for women (Chart II-14). The rate in Japan is much higher reflecting the fact that it is at the leading edge of aging. Participation rates are moving higher in Europe and the U.S. and further increases are likely in the years ahead if Japan’s experience is anything to go by.
Image
Having people staying in the workforce for longer will help offset the decline in prime-age workers, but there is a downside. While it is a contentious topic, many studies point to a negative correlation between age and productivity after the age of 50. As we age, there is some decline in cognitive abilities and older people may be less willing or able to adapt to new technologies and working practices. These would only be partly offset by the benefits of experience that comes with age. Therefore, an aging workforce is not one where one would expect productivity growth to accelerate, other things being equal. An IMF study concluded that a 1% increase in the labor force share of the 55-64 age cohort in Europe could reduce the growth in total factor productivity by 0.2% a year over the next 20 years.4 Another study published by the NBER paper estimated that aging will reduce the U.S. economic growth rate by 1.2% a year this decade and 0.6% a year next decade.5 Other studies are less gloomy but it would be hard to argue that aging is actually good for productivity. Another aging-related issue is the implications for asset prices. It is generally believed that aging will be bad for asset prices as people move from their high-saving years to a period where they will be liquidating assets to supplement their incomes. This is supported by a loose correlation between the percentage of the labor force between 35 and 64 (the higher-saving years) and stock market capitalization as a percent of GDP (Chart II-15). However, other studies cast doubts on this relationship.6
Image
One might think real estate is even more vulnerable than stocks to aging. However, in late 1988, two high-profile economists (Greg Mankiw and David Weil) published a report arguing that real house prices would fall substantially over the next two decades as the baby boom generation aged.7 That forecast was catastrophically wrong. Of course, that does not mean that the more dramatic aging occurring over the next couple of decades will not have a major negative impact on home prices. Numerous studies have been carried out on the relationship between demographics and asset prices and the conclusions are all over the place.8 Time and space constraints prevent a more in-depth discussion of this topic. Nonetheless, common sense would suggest that aging is more likely to be bearish than bullish for asset prices. Thus far, we have addressed two demographic challenges facing the developed world: slowing growth in the number of working-age people and a marked aging of the population. Much of the developing world has the opposite issue: continued rapid population growth and large numbers of young people. This is my third topic. Rapid Population Growth In The Developing World We already noted that nearly all future growth in global population will occur in the developing world, China being a notable exception. With birth rates remaining far above death rates, emerging countries will not have the aging problem of the developed world and this has some positives and negatives. On the positive side, a rapidly-growing young population creates the potential for strong economic growth – the opposite of the situation in advanced economies. But this assumes that the institutional and political framework is conducive to growth. Unfortunately, the history of many developing countries is that corrupt and incompetent governments prevent economies from ever reaching their potential. This means there will be a growing pool of young people likely facing a dim economic future. In some cases, these young people could be an excellent recruiting ground for extremist groups. It is unfortunate that there is particularly rapid population growth in some of the most troubled countries in the world. The Institute for Economics and Peace ranks countries by whether they are safe or dangerous.9 According to their ranking, the eight most dangerous countries in the world will see their population grow at a much faster pace than the developing world as a whole (Chart II-16).
Image
Some individual country comparisons are striking. The UN’s projections show that Nigeria’s population will exceed that of the U.S. by 2050, The Democratic Republic of Congo’s population will match that of Japan by 2030 and by 2050 will be 80% larger (Chart II-17A and B). Similarly, Afghanistan will overtake Italy in the 2040s. Most incredibly, Africa’s overall population surpassed that of the whole of Europe in the second half of the 1990s and is projected to be 3.5 times larger by 2050. That suggests that the numbers seeking to migrate from Africa to Europe will increase dramatically in the next couple of decades. Controlling these flows will become an increasing challenge for countries in Southern Europe.
Image
Image
Migration is the logical solution to declining working-age populations in the developed world and expanding young populations in the developing world. However, there currently is a backlash against immigration in many developed countries. Anti-immigration political parties are gaining strength in many European countries and immigration was a major factor influencing the Brexit vote in the U.K. And it is a hot-button political issue in the U.S. Concerns about immigration are twofold: competition for employment and potential cultural change. Employment fears have coincided with a long period of severely depressed wages for low-skill workers in many developed economies and immigration is an easy target for blame. Meanwhile, the cultural challenge of absorbing large numbers of immigrants clearly has fueled increased nationalist sentiment in a number of countries. In the U.S., projections by the Bureau of the Census show that the non-Hispanic white population will fall below 50% of the total by 2045. That has implications for voting patterns and lies behind some of the concerns about high levels of immigration. There is no simple solution to this controversial issue and an in-depth discussion is beyond the scope of this article. Conclusions We have only touched on some aspects of demographic trends. It is a huge topic and has many other implications. For example, the political and cultural views of each generation are shaped by the environment they grow up in and this changes over time. This year, the number of millennials (those born from the early 1980s to the mid-1990s) in the U.S. is expected to surpass those of baby boomers and that will have important political and social implications. Again, that is beyond the scope of this report. The demographic trends we have discussed will pose serious challenges to policymakers. In the developed world, the baby boom generation has accumulated huge amounts of government debt, partly to fund generous entitlement programs and did not have enough children to ease the burdens on future generations. The young have good reason to feel frustrated by the actions of their elders (see cartoon).
Image
In the developing world, the challenge will be to provide economic opportunities for a growing pool of young people. The biggest problems will be in Africa, a continent where economic success stories have been few and far between in the past. Failure to deal with this will have troubling implications for geopolitical stability. Martin H. Barnes Senior Vice President Economic Advisor III. Indicators And Reference Charts Our tactical equity upgrade is beginning to pay off, and an increasing proportion of our proprietary indicators is confirming that stocks have more upside over the next few quarters. Our Willingness-to-Pay (WTP) indicator for the U.S. has stopped falling. This pattern is also evident in both Europe and Japan. The WTP indicators track flows, and thus provide information on what investors are actually doing, as opposed to sentiment indexes that track how investors are feeling. After clearly pulling funds out of the equity markets, investors are beginning to tip their toes back in. Our Revealed Preference Indicator (RPI) has clearly shifted back into stocks. The RPI combines the idea of market momentum with valuation and policy measures. It provides a powerful bullish signal if positive market momentum lines up with constructive signals from the policy and valuation measures. Conversely, if constructive market momentum is not supported by valuation and policy, investors should lean against the market trend. According to BCA’s composite valuation indicator, the U.S. stock market remains overvalued from a long-term perspective, despite the dip in multiples since last fall. It is a composite of 11 different valuation measures. Moreover, our Monetary Indicator has shifted out of negative territory for stocks, and is now decisively in stimulative territory. The Fed pause, along with some dovish-sounding commentaries have improved the monetary backdrop by removing expected rate hikes from the money market curve. Our Composite Technical indicator for stocks broke down in December, providing a clear ‘sell’ signal, and has not yet delivered a ‘buy’. However, if the recent improvement in this indicator can continue, the S&P 500 will likely be able to punch above the 2800 level. The 10-year Treasury yield is in the neutral range according to our valuation model. Bonds are not overbought, but they have now fully worked out their previously deeply-oversold conditions. The Adrian, Crump & Moench formulation of the 10-year term premium remains close to its 2016 nadir, suggesting that yields are unsustainably low. Our bond-bearish bias is consistent with the view that the Fed rate hike cycle is not over. The U.S. dollar is still very expensive on a PPP basis. Our Composite Technical Indicator is not as overbought as it once was, but it is far from having reached oversold levels either. This combination suggests that the greenback could experience further downside over the coming month. It remains to be seen if this wave of depreciation will mark the beginning of the cyclical bear market required to correct the dollar’s overvaluation. EQUITIES:
Image
Image
Image
Image
Image
Image
Image
Image
FIXED INCOME:
Image
Image
Image
Image
Image
Image
Image
CURRENCIES:
Image
Image
Image
Image
Image
Image
Image
COMMODITIES:
Image
Image
Image
Image
Image
ECONOMY:
Image
Image
Image
Image
Image
Image
Image
Image
Image
Image
Image
Mark McClellan Senior Vice President The Bank Credit Analyst Footnotes 1 Most of the data referred to in this report comes from the medium variant projections from the United Nation’s World Population Prospects report, 2017 revision. There is an excellent online database tool that allows users to access numerous demographic series for every country and region in the world. This can be found at https://population.un.org/wpp/DataQuery/ 2 Edward N. Wolff, Household Wealth Trends in the United States, 1962 to 2016. NBER Working Paper 24085, November 2017. Available at: https://www.nber.org/papers/w24085. 3 This is not a joke: https://www.businessinsider.com/signs-japan-demographic-time-bomb-2017-3 4 The Impact of Workforce Aging on European Productivity. IMF Working Paper, December 2016. Available at: https://www.imf.org/en/Publications/WP/Issues/2016/12/31/The-Impact-of-Workforce-Aging-on-European-Productivity-44450 5 The Effect of Population Aging on Economic Growth, the Labor Force and Productivity. NBER Working Paper 22452, July 2016. Available at https://www.nber.org/papers/w22452.pdf 6 For example, see “Will Grandpa Sink The Stock Market?”, The Bank Credit Analyst, September 2014. 7 The Baby Boom, The Bay Bust, and the Housing Market. NBER Working Paper 2794. Available at: https://www.nber.org/papers/w2794 8 For those interested in this topic, we recommend the following paper: Demographics and Asset Markets: A Survey of the Literature. Available at: https://pdfs.semanticscholar.org/912a/5d6d196c3405e37b3a50d797cbf65a27ba44.pdf 9 Global Peace Index, 2018. Available at: http://visionofhumanity.org/app/uploads/2018/06/Global-Peace-Index-2018-2.pdf. According to this index, the eight least-safe countries are (starting with the most dangerous): Syria, Afghanistan, South Sudan, Iraq, Somalia, Yemen, Libya, and Democratic Republic of the Congo. EQUITIES:FIXED INCOME:CURRENCIES:COMMODITIES:ECONOMY:
Highlights The global shipping-fuels market will tighten as UN-mandated fuel standards kick in next year. This will keep ship fuels, known as bunkers, and other distillate prices – e.g., diesel and jet fuel – elevated relative to other refined products like gasoline. In turn, this will boost demand for lighter, sweeter crudes – particularly Brent and similar grades – that allow refiners to raise distillate yields, as they scramble to meet higher demand for low-sulfur ship-fuel next year. After pipeline expansions in the Permian Basin come on line later this year, WTI exports should provide the marginal light-sweet barrel refiners will need to raise distillate output next year. Light-sweet exports from the U.S. will find a ready home in the Atlantic Basin and Asia, as demand for shipping fuels – along with other distillates– rises. Still, the ramp in WTI exports from the U.S. will be hampered by a lack of deep-water ports that can accommodate very large crude carriers (VLCCs) used to ship crude oil globally. As a result, we expect the light-sweet crude market ex-U.S. to tighten. Given this expectation, we are extending our long July 2019 Brent vs. short July 2020 Brent recommendation – up 240.2% since inception January 3 – to long 2H19 Brent vs. short 2H20 Brent. Highlights Energy: Overweight. In line with our expectation, OPEC is showing no sign of agreeing to raise production less than two months after initiating output cuts to drain inventories. Separately, Muhammadu Buhari was re-elected for a second four-year term as Nigeria’s president. The main opposition party rejected the results, following record-low voter turnout, after elections were unexpectedly delayed by one week, according to the BBC. Base Metals/Bulks: Neutral. The prompt March copper contract on the CME’s COMEX is attempting to fill a gap just above $2.95/lb, which opened in July 2018 as U.S. – China trade tensions rose. Positive signals from Sino – U.S. trade talks are supporting prices. Precious Metals: Neutral. Palladium traded to a record high of $1,536.50/oz Monday, pushing it more than $200/oz over gold. Platinum prices also rallied, as South African miners were notified by labor unions of intended strikes next week. Russia’s leading producer, Norilsk Nickel, which accounts for 40% of global palladium production, expects an 800k-ounce physical deficit in 2019, according to Reuters. Ags/Softs: Underweight. U.S. President Donald Trump said he would delay increasing U.S. tariffs on Chinese imports. Trump also said he expects to meet China’s President Xi Jinping to conclude the trade deal they’ve been negotiating if both sides continue to make progress. Feature Maritime shipping represents ~ 80% of international trade, and is responsible for roughly 90% of the total sulfur emissions from the transportation sector. In 2008, the UN’s International Maritime Organization (IMO) adopted a new regulation to reduce the cap for sulfur content of ships’ fuel oil – known as bunker fuel – to 3.5% from 4.5% in 2012, and to 0.5% from 3.5% in 2020 (Chart 1).1 Chart of the WeekReducing Marine Sulfur Pollution Requires Higher-Priced Low-Sulfur Fuels
Reducing Marine Sulfur Pollution Requires Higher-Priced Low-Sulfur Fuels
Reducing Marine Sulfur Pollution Requires Higher-Priced Low-Sulfur Fuels
Around 50% of the cost of shipping is fuel costs. This amounts to more than 4mm b/d of bunker fuel (~ 3.5mm b/d of High-Sulfur Fuel Oil, or HSFO, and ~ 0.8mm b/d of marine gasoil, known as MGO). Hence, the IMO 2020 regs threaten demand of ~ 3.5mm b/d of HSFO. As the January 1, 2020, IMO deadline approaches, uncertainty surrounding the new regs remains elevated. On the demand side, shippers have the option to install abatement technology (i.e., scrubbers); burn IMO 2020-compliant fuels like MGO; use liquefied natural gas (LNG) as a fuel on ships; or do nothing, i.e., not comply with the regulation. Refiners on the supply side have to adjust via a combination of increasing MGO and Low-Sulfur Fuel Oil (LSFO) production; modifying their crude slates, which will favor lighter, sweeter crudes like Brent and WTI; building additional refining capacity; or running their units harder – i.e., increase refinery utilization rates – to produce more fuel. Demand for bunkers is the only part of the HSFO market that is growing. IMO 2020 removes the all-important shipping consumer of residual fuel oil, which will have a major impact on simple refineries, and will force a dramatic reconfiguration of the shipping and refining industries. To date, shippers and refiners have been slow to implement required changes as market participants have an incentive to move last.2 We agree with a recent McKinsey analysis, which notes the simplest solution for shippers is to switch to MGO.3 We also could see an uptick in demand for LSFO with sulfur content below the 0.5% limit for blending purposes. This would push demand for the lower-sulfur fuels and prices up. It also would pressure HSFO prices lower over the short term, to the point where this fuel can compete in the utility sector as a fuel, or in the refining sector as a charging stock for complex refiners. The IEA expects MGO consumption to rise from 0.8mm b/d to 1.7mm b/d in 2020.4 Complex Refiners, Light-Sweet Crude Producers Benefit Moving to LSFO and MGO shifts the burden of IMO 2020 to the refining market. According to the IEA, around 80% of the sulfur content in crude is removed from the final product. Once IMO 2020 is implemented, this will rise to 90%. In the lead-up to the IMO 2020 deadline, refiners are adjusting their crude slates to minimize residual fuel and maximize distillate output. As a result, demand for light-sweet crudes like Brent and WTI – the crude being produced in ever-rising quantities in the U.S. shales – will increase. At the same time, heavier crudes exported by Venezuela and GCC states will see demand fall, which means the spread between these crudes will favor the lighter, sweeter barrel, all else equal.5 Simple refineries incapable of cracking the complex heavy-sour crudes favored by U.S. Gulf Coast refiners will either have to upgrade, close, or use low-sulfur crude as a charging-stock input. According to McKinsey, the switch to marine gasoil will lead to an increase of 1.5mm b/d of distillate demand. This represents ~ 2.2 to 2.7mm b/d of increased demand for light-sweet oil. The IEA estimates diesel prices could rise by 20 – 30%, as a result.6 This increased demand for low-sulfur bunkers – MGO in particular –will keep prices for distillates generally well supported over the next year or so at the expense of HSFO. S&P Global Platts reported this week the first physical trade for U.S. Gulf Coast 0.5% MGO was done in its official trading window at $67.70/bbl, a $3.75/bbl premium to HSFO.7 IMO 2020 will keep distillates the star performers for refiners. Distillate crack spreads – most visible in the ultra-low-sulfur diesel (ULSD) cracks employing the CME’s NY Harbor ULSD futures vs. WTI and Brent – recently were trading $16/bbl over gasoline cracks using the Exchange’s RBOB futures (Charts 2A and 2B). We expect these cracks to remain wide, to incentivize more distillate-production capacity. Chart 2ABrent Diesel And Gasoline Cracks Likely Trade > $14/bbl Wide
Brent Diesel and Gasoline Cracks Likely Trade Greater Than $14/bbl Wide
Brent Diesel and Gasoline Cracks Likely Trade Greater Than $14/bbl Wide
Chart 2BBrent Diesel Cracks Will Remain Elevated Following IMO 2020
Brent Diesel Cracks Will Remain Elevated Following IMO 2020
Brent Diesel Cracks Will Remain Elevated Following IMO 2020
Prices for other distillates also will be supported by IMO 2020 – e.g., jet fuel – over the coming year, given the high correlation of products within this cut of the barrel. These distillate prices also are highly correlated with Brent and WTI prices, as can be seen in Chart 3, and in Tables 1 and 2. These high correlations likely will persist as IMO 2020 is implemented, and hedgers seek out liquid markets in which to shed their price risk.8 Chart 3Global Distillate Prices Will Be Supported by IMO 2020
Global Distillate Prices Will Be Supported by IMO 2020
Global Distillate Prices Will Be Supported by IMO 2020
Table 1Distillate Fuels’ Correlations Remain High Around The World
IMO 2020: The Greening Of The Ship-Fuel Market
IMO 2020: The Greening Of The Ship-Fuel Market
Table 2Percent Changes In Distillates Also Are Highly Correlated
IMO 2020: The Greening Of The Ship-Fuel Market
IMO 2020: The Greening Of The Ship-Fuel Market
Baker & O’Brien, an energy consultancy based in Dallas, Texas, expects a number of factors – ranging from non-compliance with IMO 2020; increased use of scrubbers to capture sulfur-oxide emissions; blending to make IMO 2020-compliant marine fuel; upgrades by refiners and changes in their crude slates – will lead to lower prices once the market adjusts to the new regs.9 We do not disagree, but the timing on this likely hinges on how quickly U.S. light-sweet crude oil exports ramp up. Investment Implications WTI exports – actually LTO exports from U.S. shales – will provide the marginal light-sweet barrel refiners will need to raise distillate output next year. As a result, LTO exports from the U.S. will find a ready home in the Atlantic Basin and Asia, as demand for low-sulfur shipping fuels increases. However, this will not happen overnight. At present WTI exports from the U.S. are hampered by a lack of deep-water ports that can accommodate the VLCCs used to ship crude oil. The 2mm b/d of expanded pipeline capacity out of the Permian by the end of this year will move the U.S. crude-oil bottleneck from the Permian to the U.S. Gulf.10 So, as refiners prepare this year for the IMO 2020 regs effective January 1, 2020, the light-sweet crude market ex-U.S. – particularly Brent– will tighten. This already is visible in the backwardation we were expecting at the beginning of this year, when we recommended getting long July 2019 Brent vs. short July 2020 Brent, which is up 240.2% since inception on January 3. Given our expectation for a tighter light-sweet crude market ex-U.S., we are liquidating our existing Brent 2019 long position vs. a short position in July 2020 at tonight’s close, and replacing it with a long 2H19 Brent vs. a short 2H20 Brent position.11 Bottom Line: The implementation of IMO 2020 will tighten marine fuels markets globally, as refiners increase their demand for light-sweet crude oil and shippers most likely increase their demand for MGO and lower-sulfur fuels generally. Robert P. Ryan, Senior Vice President Commodity & Energy Strategy rryan@bcaresearch.com Hugo Bélanger, Senior Analyst Commodity & Energy Strategy HugoB@bcaresearch.com Footnotes 1 The regulation is part of Annex VI to the International Convention for the Prevention of Pollution from Ships (MARPOL). Following the adoption of the regulation in 2008, a provision was kept in order to review the compliant fuel availability and possibly push the implementation to 2025. In October 2016, the IMO’s Marine Environment Protection Committee confirmed the final implementation date (January 1, 2020) following a positive assessment of the availability for shippers of compliant fuels. Any amendment to MARPOL needs to be circulated for a minimum of six months, and can only be implemented 16 months after adoption, therefore, no legal amendment to the current January 2020 date are possible. Please see https://www.iea.org/etp/tracking2017/internationalshipping/ 2 The slow response by refiners can be explained by: (1) the fact that a switch to LSFO or MGO prior to the actual deadline would lead to a financial loss due to the current high price of LSFO and MGO vs. HSFO; (2) abatement technology requires large upfront investments (i.e. capital cost of new processing units, storage tanks, loss of revenue from laying ships in dry dock while they are retrofitted, and a permanent loss of deck space and loading capacity to the new equipment); and (3) the unpredictability of fuel prices and the endogenous relationship between other shippers and the behavior of prices. In other words, trying to get out in front of the official implementation of IMO 2020 leads to unnecessary financial burdens and to competitive disadvantage. Please see Halff, Antoine, Lara Younes, Tim Boersma (2019), “The Likely Implications of the new IMO standards on the shipping industry.” Energy Policy, 126: 277 - 286. 3 Please see “IMO 2020 and the outlook for marine fuels,” published by McKinsey & Company, September 2018. S&P Global Platts reaches a similar conclusion in a report entitled “Turning tides, the future of fuel oil after IMO 2020,” which was released this month. Platts notes, “The IMO’s lower sulphur cap is set to take away the bulk of marine fuel oil demand from the start of next year. Most ship owners and operators will switch to burning new low-sulfur bunker blends, translating into an almost overnight shift of 3 million b/d of demand.” 4 The IEA expects 30% of the current HSFO bunker demand will switch to marine gasoil (MGO), 30% of the HSFO bunker demand will switch to the new ultra low 0.5% sulphur fuel (ULSFO), and 40% of HSFO bunker demand will remain.) In the IEA’s modeling, this could push prices up by as much as 30%. Please see “Oil 2018: Analysis and forecasts to 2023” published by the IEA. It is available at iea.org 5 Please see “IMO 2020 and the Brent – Dubai Spread,” published by The Oxford Institute For Energy Studies in September 2018. Of course, reducing the export of heavy-sour crudes, as has been done by the Gulf Arab members of OPEC will keep the Brent – Dubai spread tighter than pure economics would dictate. 6 Please see sources in footnotes 3 and 4. 7 This trade was done in the Platts Market on Close assessment. Please see “USGC Marine Fuel 0.5% has first physical trade in Platts MOC process,” published by S&P Global Platts February 26, 2019. 8 These are short-term correlations, which use daily data from 2017 to now. We present correlations in levels and in percent-changes, given these are cointegrated variables. Please see section 3.3 of “Correlation, regression, and cointegration of nonstationary economic time series,” by Soren Johansen, published November 6, 2007, by the Center for Research in Econometric Analysis of Time Series at the University of Aarhus. 9 Please see “The Thunder Rolls – IMO 2020 And The Need For Increased Global Oil Refinery Runs (Part 3)” published by Baker & O’Brien, December 11, 2018. 10 An additional 1mm b/d of new takeaway is scheduled for 1H21, following a final investment decision from an Exxon-led group that will move Permian Basin LTO to the U.S. Gulf. This came one day after Exxon FID’d a 250k b/d buildout of its Beaumont refinery in Houston, which will increase capacity by more than 65%, Natural Gas Intelligence reported January 30. 11 Please see EIA’s This Week in Petroleum report titled “Upcoming changes in marine fuel sulfur limits will affect crude oil and petroleum product markets,” published January 16, 2019. Investment Views and Themes Recommendations Strategic Recommendations Tactical Trades Commodity Prices and Plays Reference Table Trades Closed in Summary of Closed Trades
Image
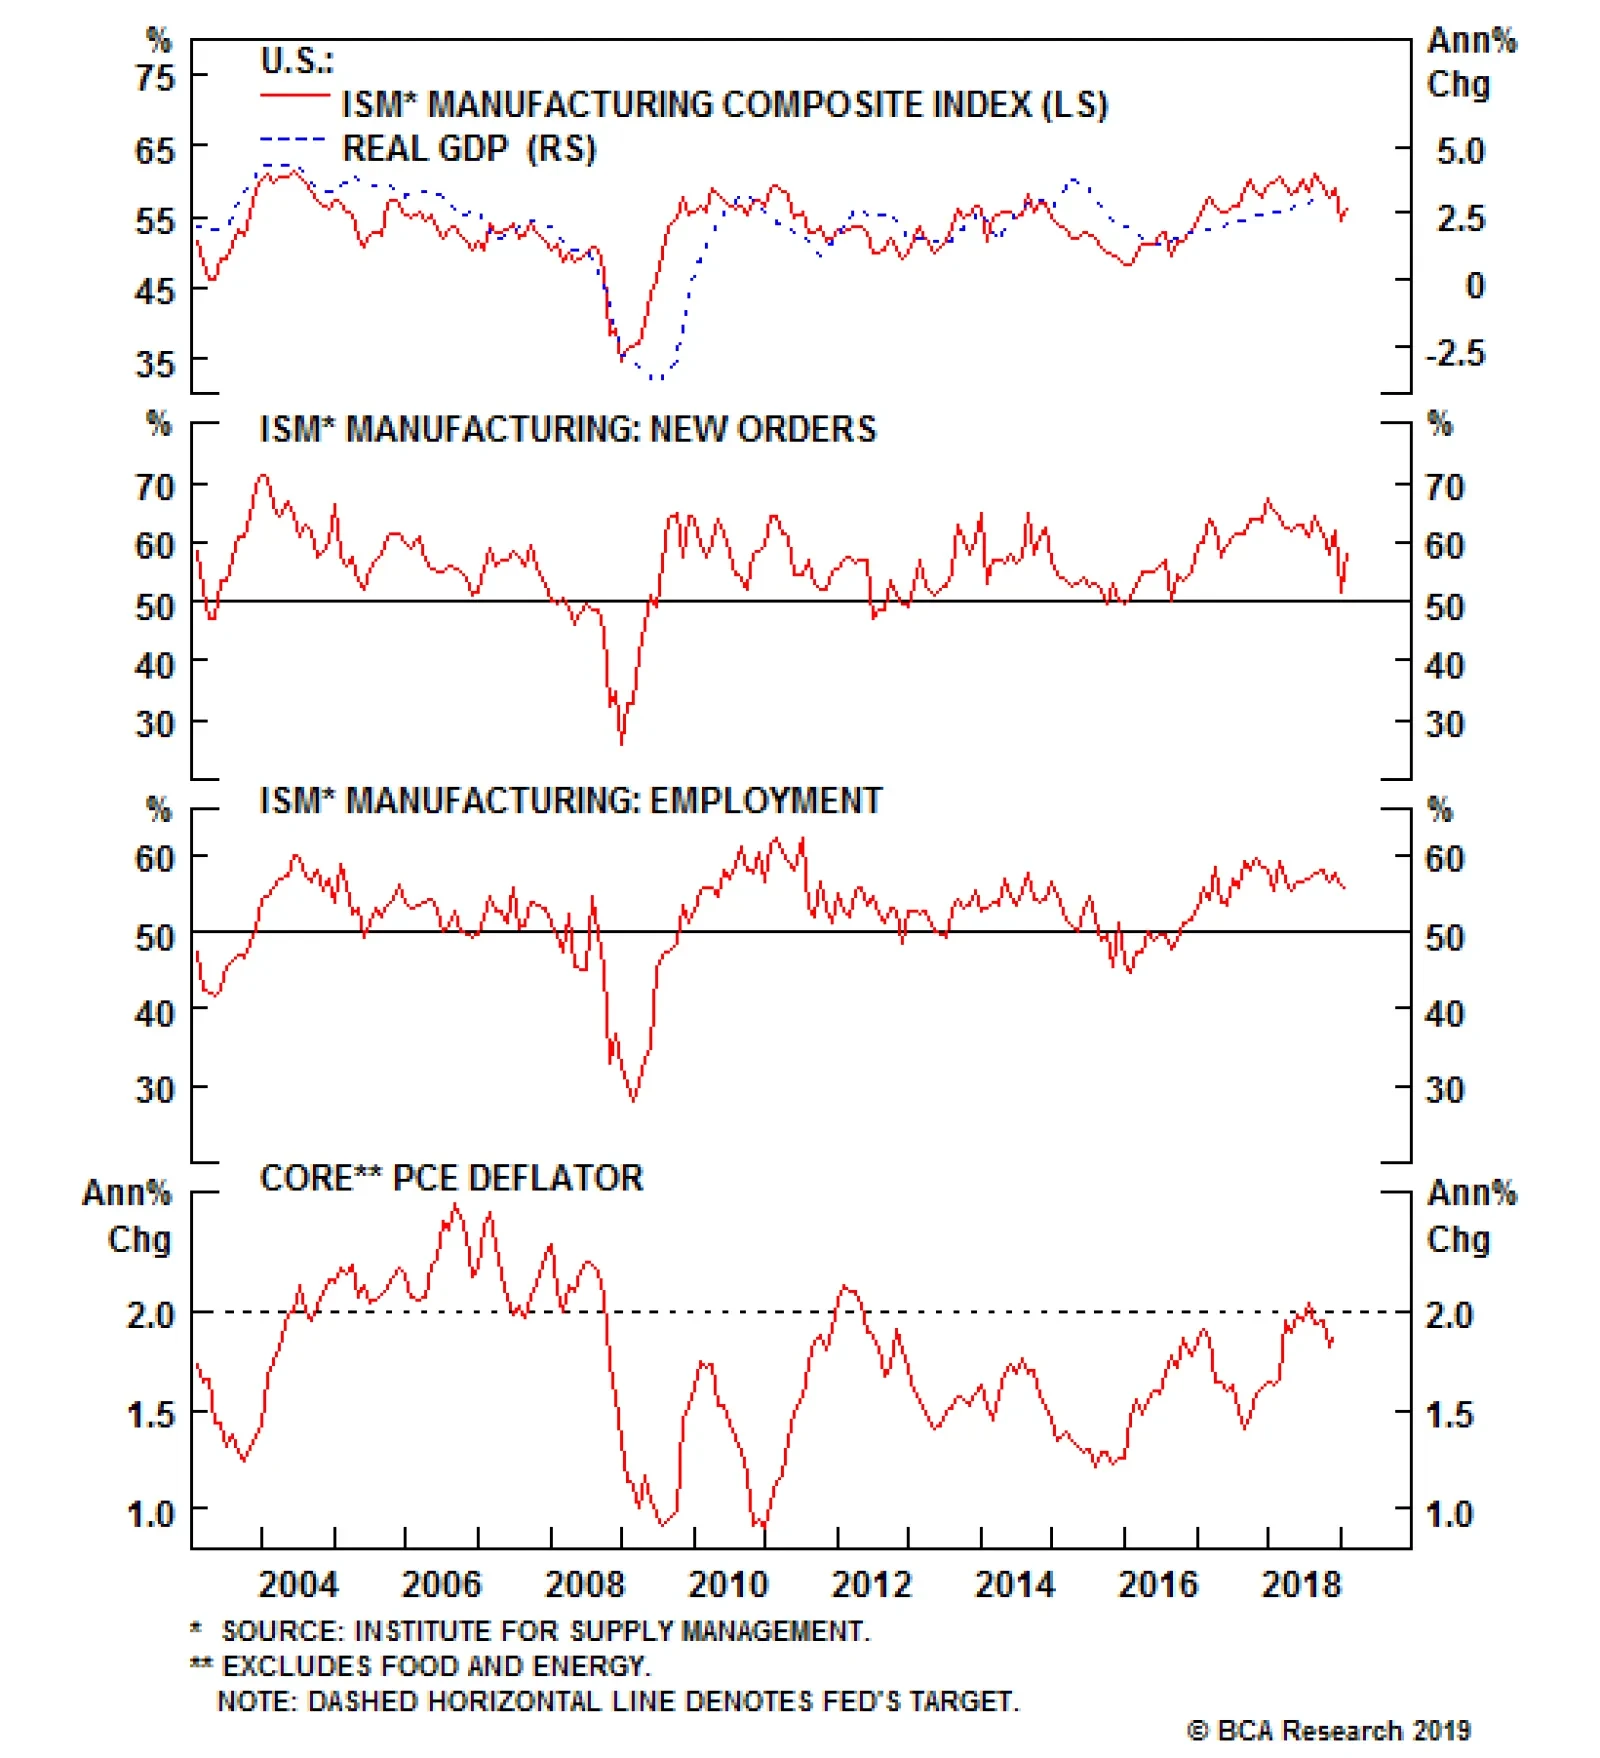
In the backend of the week, the U.S. economic calendar will be very heavy. The Q4 GDP number comes out on Thursday, giving us a sense of how much damage the tightening in financial conditions last fall and the global activity slowdown inflicted on the U.S.…
Highlights It may seem self-evident that most governments are overly indebted, but both theory and evidence suggest otherwise. Higher debt today does not require higher taxes tomorrow if the growth rate of the economy exceeds the interest rate on government bonds. Not only is that currently the case, but it has been the norm for most of history. Unlike private firms or households, governments can choose the interest rate at which they borrow, provided that they issue debt in their own currencies. Ultimately, inflation is the only constraint to how large fiscal deficits can get. Today, most governments would welcome higher inflation. There are increasing signs China is abandoning its deleveraging campaign. Fiscal policy will remain highly accommodative in the U.S. and will turn somewhat more stimulative in Europe. Remain overweight global equities/underweight bonds. We do not have a strong regional equity preference at the moment, but expect to turn more bullish on EM versus DM by the middle of this year. Feature A Fiscal Non-Problem? Debt levels in advanced economies are higher today than they were on the eve of the Global Financial Crisis. Rising private debt accounts for some of this increase, but the lion’s share has occurred in government debt (Chart 1). Chart 1Global Debt Levels Have Risen, Especially In The Public Sector
Global Debt Levels Have Risen, Especially In The Public Sector
Global Debt Levels Have Risen, Especially In The Public Sector
Not surprisingly, rising public debt levels have elicited plenty of consternation. While there has been a lively debate about how fast governments should tighten their belts, few have disputed the seemingly self-evident opinion that some degree of “fiscal consolidation” is warranted. Given this consensus view, one would think that the economic case for public debt levels being too high is airtight. It’s not. Far from it. Debt Sustainability, Quantified Start with the classic condition for debt sustainability, which specifies the primary fiscal balance (i.e., the overall balance excluding interest payments) necessary to maintain a constant debt-to-GDP ratio (See Box 1 for a derivation of this equation).
Image
An increase in the economy’s growth rate (g), or a decrease in real interest rates (r), would allow the government to loosen the primary fiscal balance without causing the debt-to-GDP ratio to increase (Chart 2).1 If the government were to ease fiscal policy beyond that point, debt would rise in relation to GDP. But by how much? It is tempting to assume that the debt-to-GDP ratio would then begin to increase exponentially. However, that is only true if the interest rate is higher than the growth rate of the economy. If the opposite were true, the debt-to-GDP ratio would rise initially but then flatten out at a higher level.2
Chart 2
A Fiscal Free Lunch The last point is worth emphasizing. As long as the interest rate is below the economic growth rate, then any primary fiscal balance – even a permanent deficit of 20%, or even 30% of GDP – would be consistent with a stable long-term debt-to-GDP ratio. In such a setting, the government could just indefinitely rollover the existing stock of debt, while issuing enough new debt to cover interest payments. No additional taxes would be necessary. In fact, stabilizing the debt-to-GDP ratio becomes easier the higher it rises. Chart 3 shows this point analytically.
Chart 3
Ah, one might say: If the government issues a lot of debt, then interest rates would rise, and before we know it, we are back in a world where the borrowing rate is above the economy’s growth rate, at which point the debt dynamics go haywire. Now, that sounds like a sensible statement, but it is actually quite misleading. As long as a government is able to issue its own currency, it can always create money to pay for whatever it purchases. If people want to turn around and use that money to buy bonds, they are welcome to do so, but the government is under no obligation to pay them the interest rate that they want. If they do not wish to hold cash, they can always use the cash to buy goods and services or exchange it for foreign currency. As long as a government is able to issue its own currency, it can always create money to pay for whatever it purchases. Wouldn’t that cause inflation and currency devaluation? Yes, it might, and that’s the real constraint: What limits the ability of governments with printing presses to run large deficits is not the inability to finance them. Rather, it is the risk that their citizens will treat their currencies as hot potatoes, rushing to exchange them for goods and services out of fear that rising prices will erode the purchasing power of their cash holdings. When Is Saving Desirable? The reason governments pay interest on bonds is because they want people to save more. However, more savings is not necessarily a good thing. This is obviously the case when an economy is depressed, but it may even be true when an economy is at full employment. Just like someone can work so much that they have no time left over for leisure, or buy a house so big that they spend all their time maintaining it, it is possible for an economy to save too much, leading to an excess of capital accumulation. Under such circumstances, steady-state consumption will be permanently depressed because so much of the economy’s resources are going towards replenishing the depreciation of the economy’s capital stock. Economists have a name for this condition: “dynamic inefficiency.” What determines whether an economy is dynamically inefficient? As it turns out, the answer is the same as the one that determines whether debt ratios are on an explosive path or not: The difference between the interest rate and the economy’s growth rate. Economies where interest rates are below the growth rate will tend to suffer from excess savings. In that case, government deficits, to the extent that they soak up national savings, may increase national welfare. r < g Has Been The Norm Today, the U.S. 10-year Treasury yield stands at 2.69%, compared to the OECD’s projection of nominal GDP growth of 3.8% over the next decade. The gap between projected growth and bond yields is even greater in other major economies (Chart 4).
Chart 4
Granted, equilibrium real rates are likely to rise over the next few years as spare capacity is absorbed. Structural factors might also push up real rates over time. Most notably, the retirement of baby boomers could significantly curb income growth, leading to a decline in national savings. Chart 5 shows that the ratio of workers-to-consumers globally is in the process of peaking after a three-decade long ascent. Economic growth could also fall if cognitive abilities continue to deteriorate, a worrying trend we discussed in a recent Special Report.3 Chart 5The Global Worker-To-Consumer Ratio Has Peaked
The Global Worker-To-Consumer Ratio Has Peaked
The Global Worker-To-Consumer Ratio Has Peaked
It may take a while before real rates rise above GDP growth. Still, it may take a while before real rates rise above GDP growth. As Olivier Blanchard, the former chief economist at the IMF, noted in his Presidential Address to the American Economics Association earlier this year, periods in U.S. history where GDP growth exceeds interest rates have been the rule rather than the exception (Chart 6).4 The same has been true for most other economies.5 Chart 6GDP Growth Above Interest Rates: Historically, The Rule, Not The Exception
GDP Growth Above Interest Rates: Historically, The Rule, Not The Exception
GDP Growth Above Interest Rates: Historically, The Rule, Not The Exception
What’s Next For Fiscal Policy? Austerity fatigue has set in. In the U.S., fiscally conservative Republicans, if they ever really existed, are a dying breed. Trump’s big budget deficits and his “I love debt” mantra are the waves of the future. For their part, the Democrats are shifting to the left, with the “Green New Deal” proposal being the latest manifestation. The case for fiscal stimulus is stronger in the euro area than for the United States. The European Commission expects the euro area to see a positive fiscal thrust of 0.40% of GDP this year, up from a thrust of 0.05% of GDP last year (Chart 7). This should help support growth. Chart 7The Euro Area Will Benefit From A Modest Amount Of Fiscal Easing This Year
The Euro Area Will Benefit From A Modest Amount Of Fiscal Easing This Year
The Euro Area Will Benefit From A Modest Amount Of Fiscal Easing This Year
Additional fiscal easing would be feasible. This is clearly true in Germany, but even in Italy, the cyclically-adjusted government primary surplus is larger than what is necessary to stabilize the debt ratio.6 Unfortunately, the situation in southern Europe is greatly complicated by the ECB’s inability to act as an unconditional lender of last resort to individual sovereign borrowers. When a government cannot print its own currency, its debt markets can be subject to multiple equilibria. Under such circumstances, a vicious spiral can develop where rising bond yields lead investors to assign a higher default risk, thus leading to even higher yields (Chart 8).
Chart 8
Mario Draghi’s now-famous “whatever it takes” pledge has gone a long way towards reassuring bond investors. Nevertheless, given the political constraints the ECB faces, it is doubtful that Italy or other indebted economies in the euro area will be able to pursue large-scale stimulus. Instead, the ECB will keep interest rates at exceptionally low levels. A new round of TLTROs is also looking increasingly likely, which should protect against a rise in bank funding costs and a potential credit crunch. Our European team believes that a TLTRO extension would be particularly helpful to Italian banks. Even in Italy, the cyclically-adjusted government primary surplus is larger than what is necessary to stabilize the debt ratio. Despite having one of the highest sovereign debt ratios in the world, Japan faces no pressing need to tighten fiscal policy. Instead of raising the sales tax this October, the government should be cutting it. A loosening of fiscal policy would actually improve debt sustainability if, as is likely, a larger budget deficit leads to somewhat higher inflation (and thus, lower real borrowing rates) and, at least temporarily, faster GDP growth. We expect the Abe government to counteract at least part of the sales tax increase with new fiscal measures, and ultimately to abandon plans for further fiscal tightening over the next few years. In the EM space, Brazil, Turkey, and South Africa are among a handful of economies with vulnerable fiscal positions. They all have borrowing rates that exceed the growth rate of the economy, cyclically-adjusted primary budget deficits, and above-average levels of sovereign debt (Chart 9).
Chart 9
In contrast, China stands out as having the biggest positive gap between projected GDP growth and sovereign borrowing rates of any major economy. The problem is that the main borrowers have been state-owned companies and local governments, neither of which are backstopped by the state. Not officially, anyway. Unofficially, the government has been extremely reluctant to allow large-scale defaults anywhere in the economy. Despite all the rhetoric about market-based reforms, they are unlikely to start now. Historically, the Chinese government has allowed credit growth to reaccelerate whenever it has fallen towards nominal GDP growth. As we recently argued in a report entitled “China’s Savings Problem,” China needs more debt to sustain aggregate demand.7 Historically, the government has allowed credit growth to reaccelerate whenever it has fallen towards nominal GDP growth (Chart 10). The stronger-than-expected jump in credit origination in January suggests that we are approaching such an inflection point. Chart 10Historically, China Has Scaled Back On Deleveraging When Credit Growth Has Fallen Close To Nominal GDP Growth
Historically, China Has Scaled Back On Deleveraging When Credit Growth Has Fallen Close To Nominal GDP Growth
Historically, China Has Scaled Back On Deleveraging When Credit Growth Has Fallen Close To Nominal GDP Growth
Investment Conclusions The consensus economic view is that deflation is a much harder problem to overcome than inflation. When dealing with inflation, all you have to do is raise interest rates and eventually the economy will cool down. With deflation, however, a central bank could very quickly find itself up against the zero lower bound constraint on interest rates, unable to ease policy any further via conventional means. While this standard argument is correct, it takes a very monetary policy-centric view of macroeconomic policy. When interest rates are low, fiscal policy becomes very potent. Indeed, the whole notion that deflation is a bigger problem than inflation is rather peculiar. Just as it is easier to consume resources than to produce them, it should be easier to get people to spend than to save. People like to spend. And even if they didn’t, governments could go out and buy goods and services directly. Looking out, our bet is that policymakers will increasingly lean towards the ever-more fiscal stimulus. If structural trends end up causing the so-called neutral rate of interest to rise – the rate of interest that is necessary to avoid overheating – policymakers will have no choice but to eventually raise rates and tighten fiscal policy (Box 2). However, they will only do so begrudgingly. The result, at least temporarily, will be higher inflation. Fixed-income investors should maintain below benchmark duration exposure over both a cyclical and structural horizon. Reflationary policies that increase nominal GDP growth will help support equities, at least over the next 12 months. Chart 11 shows that corporate earnings tend to accelerate whenever nominal GDP growth rises. We upgraded global equities to overweight following the December FOMC meeting selloff. While our enthusiasm for stocks has waned with the year-to-date rally, we are sticking with our bullish bias. Chart 11Earnings And Nominal GDP Growth Tend To Move In Lock-Step
Earnings And Nominal GDP Growth Tend To Move In Lock-Step
Earnings And Nominal GDP Growth Tend To Move In Lock-Step
A reacceleration in Chinese credit growth will put a bottom under both Chinese and global growth by the middle of this year. As a countercyclical currency, the dollar will likely come under pressure in the second half of this year. Until then, we expect the greenback to be flat-to-modestly stronger. The combination of faster global growth and a weaker dollar later this year will be manna from heaven for emerging markets. We closed our put on the EEM ETF for a gain of 104% on Jan 3rd, and are now outright long EM equities. I do not have a strong view on the relative performance of EM versus DM at the moment, but expect to shift EM equities to overweight by this summer.8 Peter Berezin, Chief Global Strategist Global Investment Strategy peterb@bcaresearch.com Box 1 The Arithmetic Of Debt Sustainability
Image
Box 2 Debt Sustainability And Full Employment: The Role Of Fiscal And Monetary Policy
Image
Policymakers should strive to stabilize the ratio of debt-to-GDP over the long haul, while also ensuring that the economy stays near full employment. The accompanying chart shows the tradeoffs involved. The DD schedule depicts the combination of the primary fiscal balance and the gap between the borrowing rate and GDP growth (r minus g) that is consistent with a stable debt-to-GDP ratio. In line with the debt sustainability equation derived in Box 1, the slope of the DD schedule is simply equal to the debt/GDP ratio. Any point below the DD schedule is one where the debt-to-GDP ratio is rising, while any point above is one where the ratio is falling. The EE schedule depicts the combination of the primary fiscal balance and r - g that keeps the economy at full employment. The schedule is downward-sloping because an increase in the primary fiscal balance implies a tightening of fiscal policy, and hence requires an offsetting decline in interest rates. Any point above the EE schedule is one where the economy is operating at less than full employment. Any point below the EE schedule is one where the economy is operating beyond full employment and hence overheating. Suppose there is a structural shift in the economy that causes the neutral rate of interest – the rate of interest consistent with full employment and stable inflation – to increase. In that case, the EE schedule would shift to the right: For any level of the fiscal primary balance, the economy would need a higher interest rate to avoid overheating. The arrows show three possible “transition paths” to a new equilibrium. Scenario #1 is one where policymakers raise rates quickly but are slow to tighten fiscal policy. This results in a higher debt-to-GDP ratio. Scenario #2 is one where policymakers tighten fiscal policy quickly but are slow to raise rates. This results in a lower debt-to-GDP ratio. Scenario #3 is one where the government drags its feet in both raising rates and tightening fiscal policy. As the economy overheats, real rates actually decline, sending the arrow initially to the left. This effectively allows policymakers to inflate away the debt, leading to a lower debt-to-GDP ratio. Note: In Scenario #2, and especially in Scenario #3, the DD line will become flatter (not shown on the chart to avoid clutter). Consequently, the final equilibrium will be one where real rates are somewhat higher, but the primary fiscal balance is somewhat lower, than in Scenario #1. Footnotes 1 One can equally define the interest rate and GDP growth rate in nominal terms (see Box 1 for details). 2 Japan is a good example of this point. The primary budget deficit averaged 5% of GDP between 1993 and 2010, a period when government net debt rose from 20% of GDP to 142% of GDP. Since then, Japan’s primary deficit has averaged 5.1% of GDP, but net debt has risen to only 156% of GDP (and has been largely stable for the past two years). 3 Please see Global Investment Strategy Special Report, “The Most Important Trend In The World Has Reversed And Nobody Knows Why,” dated February 1, 2019. 4 Olivier Blanchard, “Public Debt And Low Interest Rates,” Peterson Institute for International Economics and MIT American Economic Association (AEA) Presidential Address, (January 2019). 5 Paolo Mauro, Rafael Romeu, Ariel Binder, and Asad Zaman, “A Modern History Of Fiscal Prudence And Profligacy,” IMF Working Paper, (January 2013). 6 The Italian 10-year bond yield is 2.83% while nominal GDP growth is 2.64%. Multiplying the difference by net debt of 118% of GDP results in a required primary surplus of .22% of GDP that is necessary to stabilize the debt-to-GDP ratio. This is lower than the IMF’s 2018 estimate of cyclically-adjusted government primary surplus of 2.14%. 7 Please see Global Investment Strategy Weekly Report, “China’s Savings Problem,” dated January 25, 2019. 8 Please note that my colleague, Arthur Budaghyan, BCA’s Chief EM strategist, remains bearish on both EM and DM equities and expects EM to underperform DM over the coming months. Strategy & Market Trends MacroQuant Model And Current Subjective Scores
Chart 12
Tactical Trades Strategic Recommendations Closed Trades
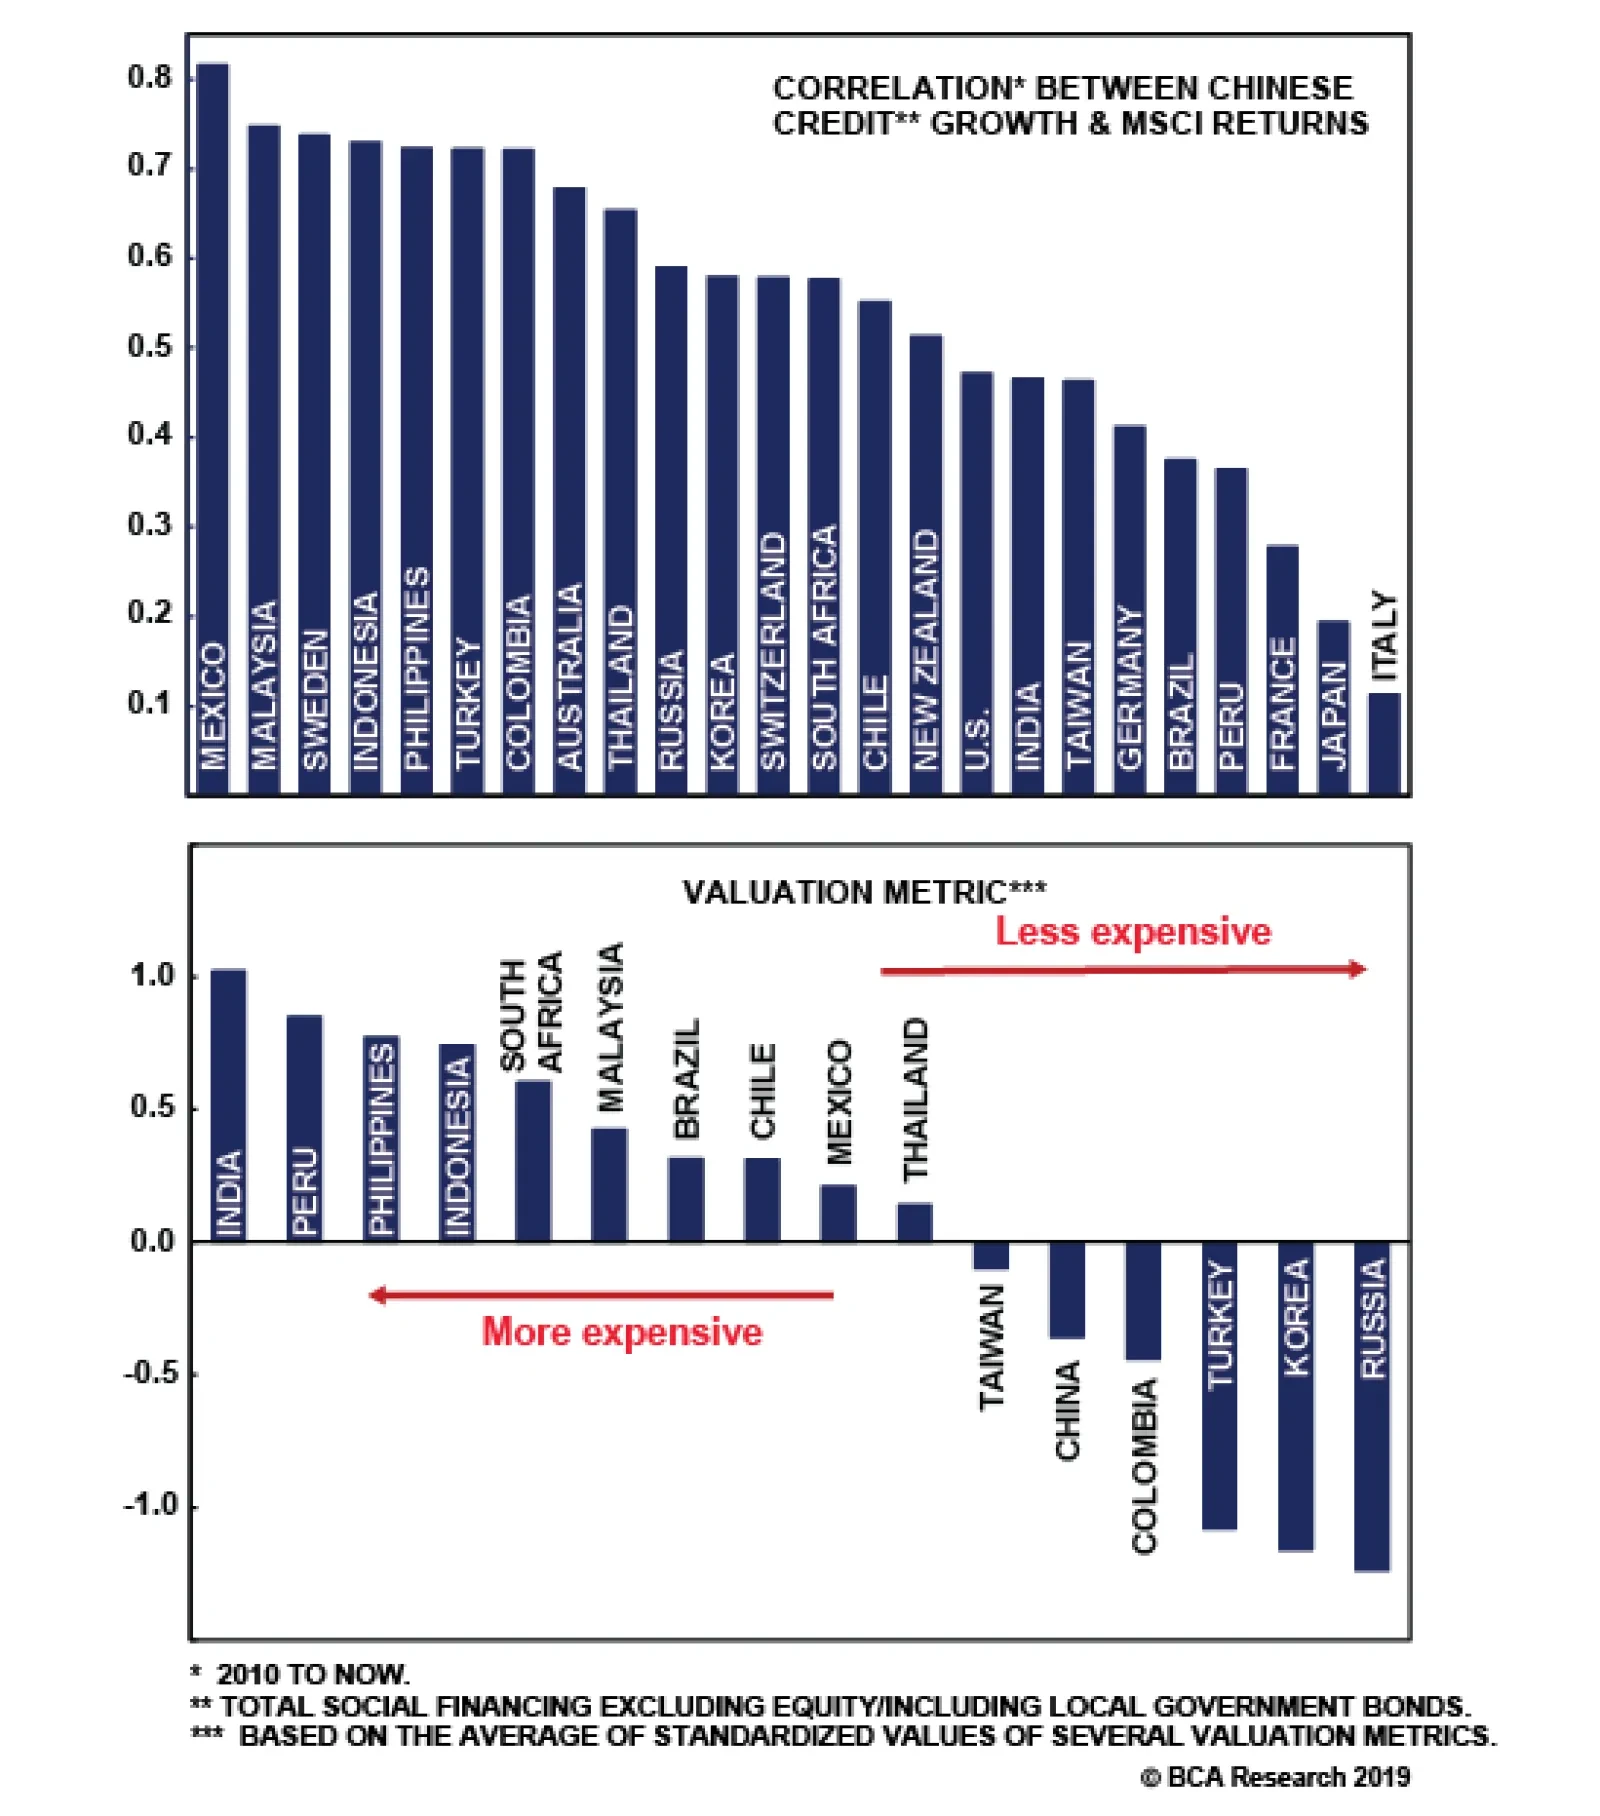
Our Geopolitical Strategy service examines the relationship between Chinese credit and MSCI equity returns of various countries. We find that Malaysian, Australian, South Korean, and Indonesian equities are the most highly correlated with Chinese…
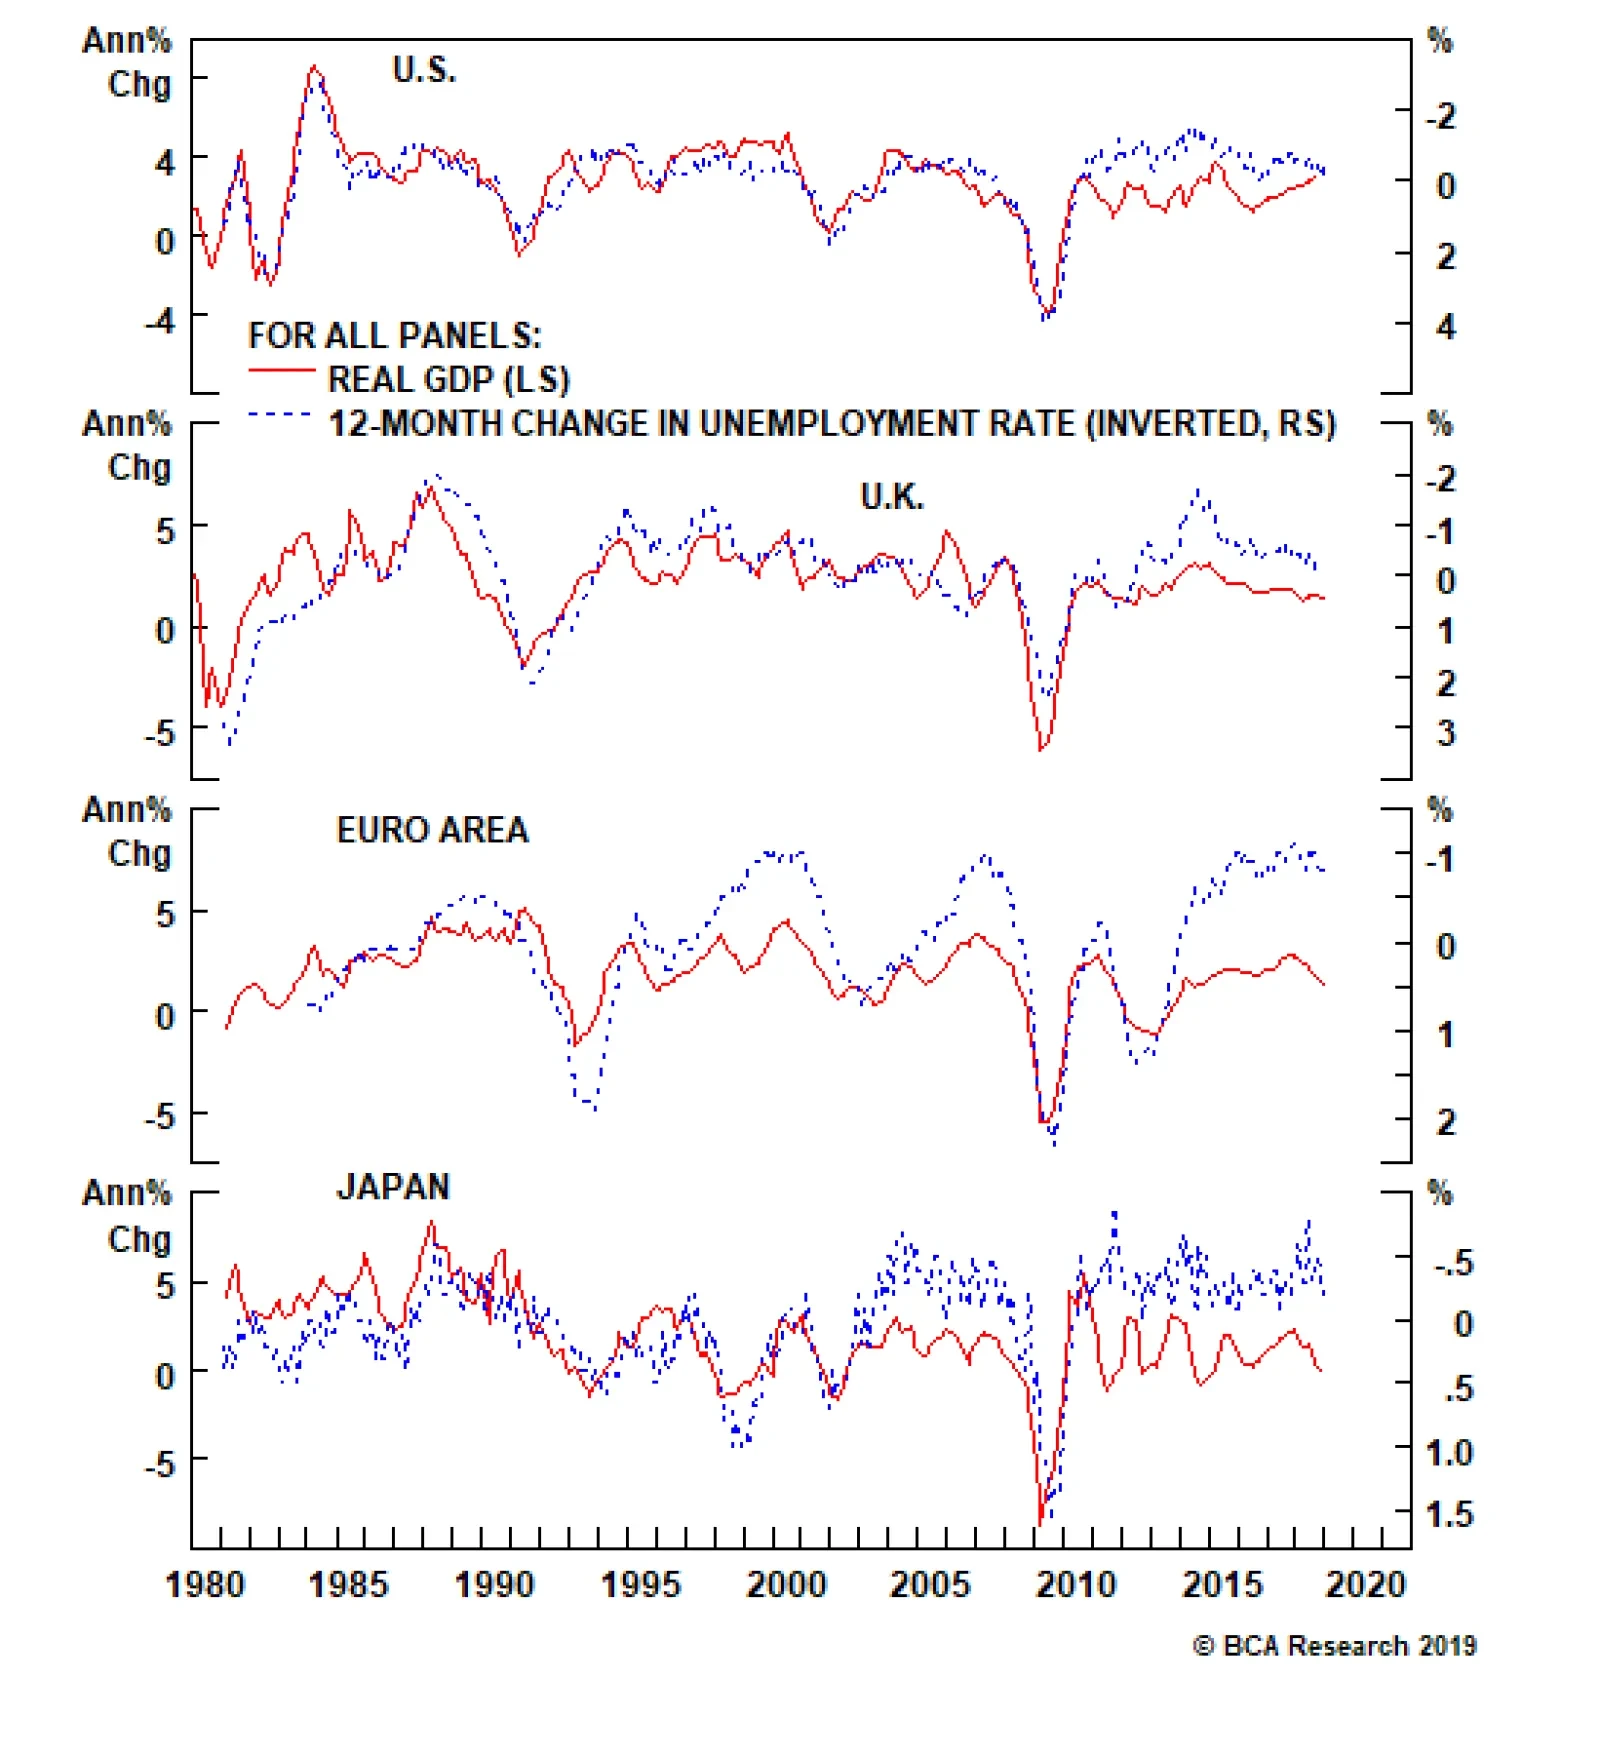
The above chart shows annual real GDP growth (the percentage change over four quarters) versus the change in the unemployment rate over twelve months for the major developed economies dating back to 1980. There is a reasonably strong relationship between the…