Global
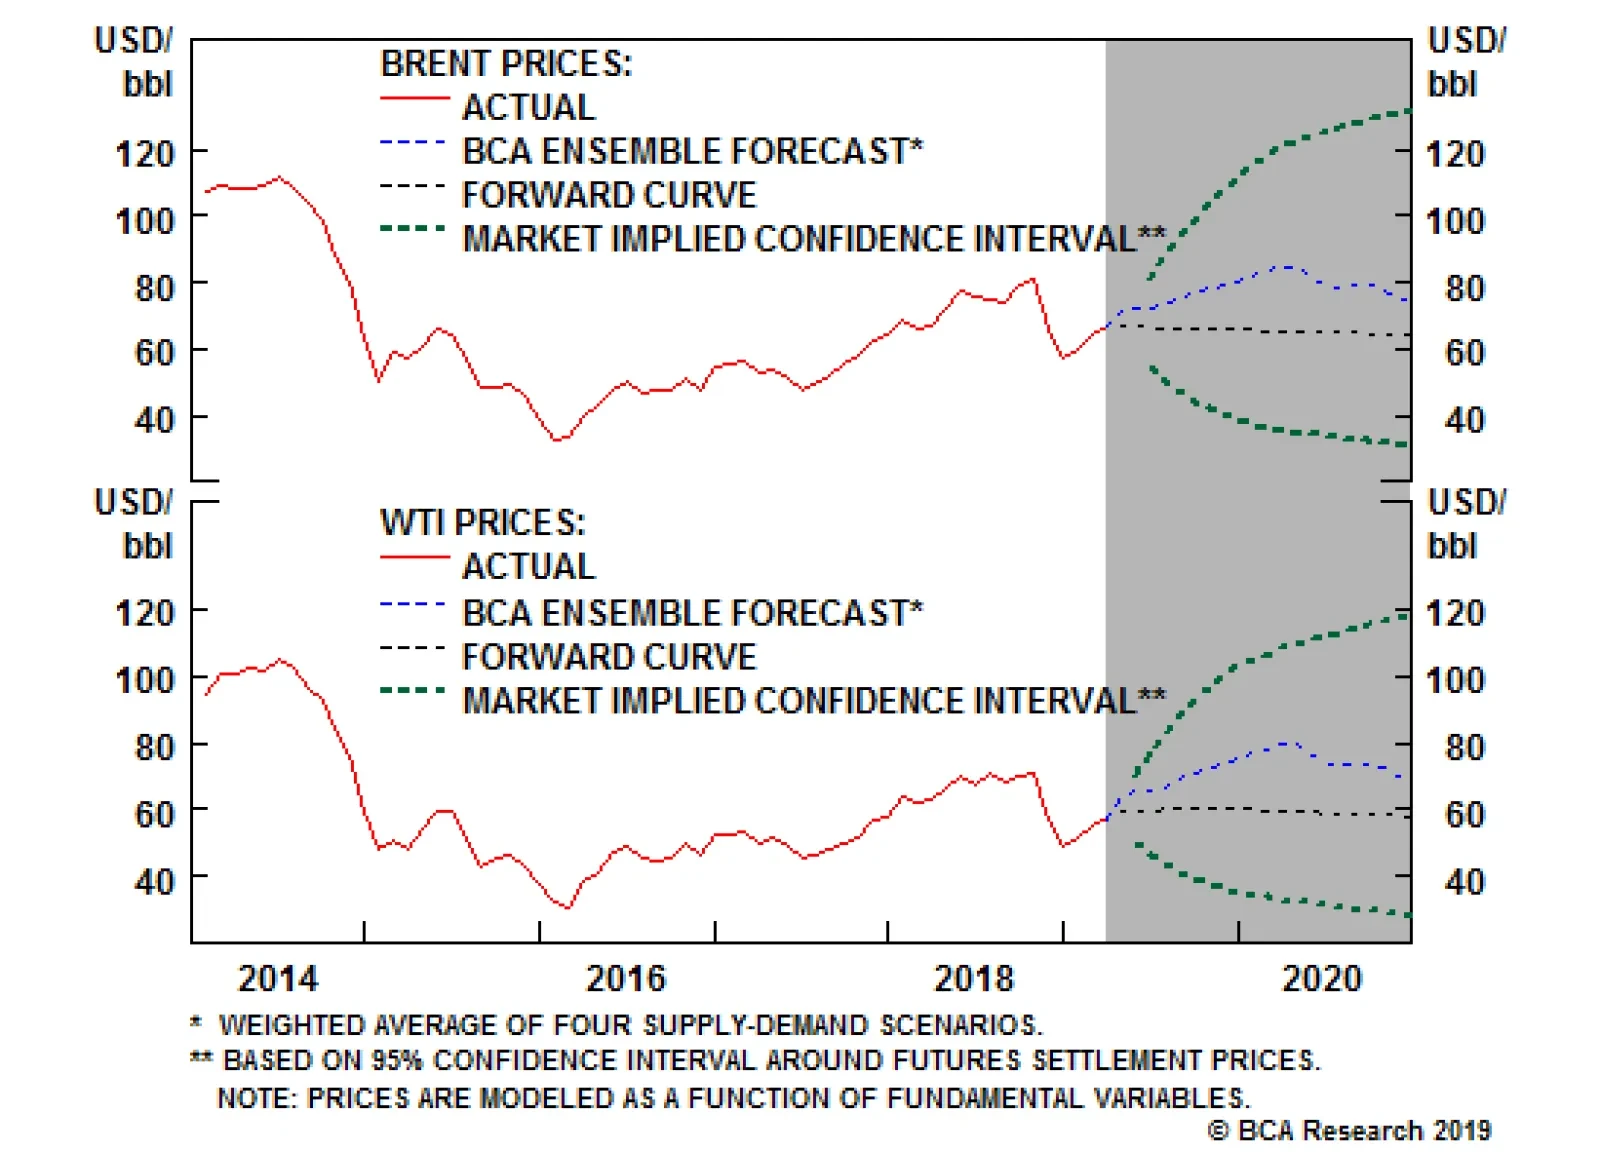
Our Commodity & Energy Strategy team’s 2019 and 2020 Brent price forecasts remain at $75 and $80/bbl. Delays in building out U.S. Gulf deepwater-harbor capacity next year will keep exports constrained. This will back production up behind the pipe in the…
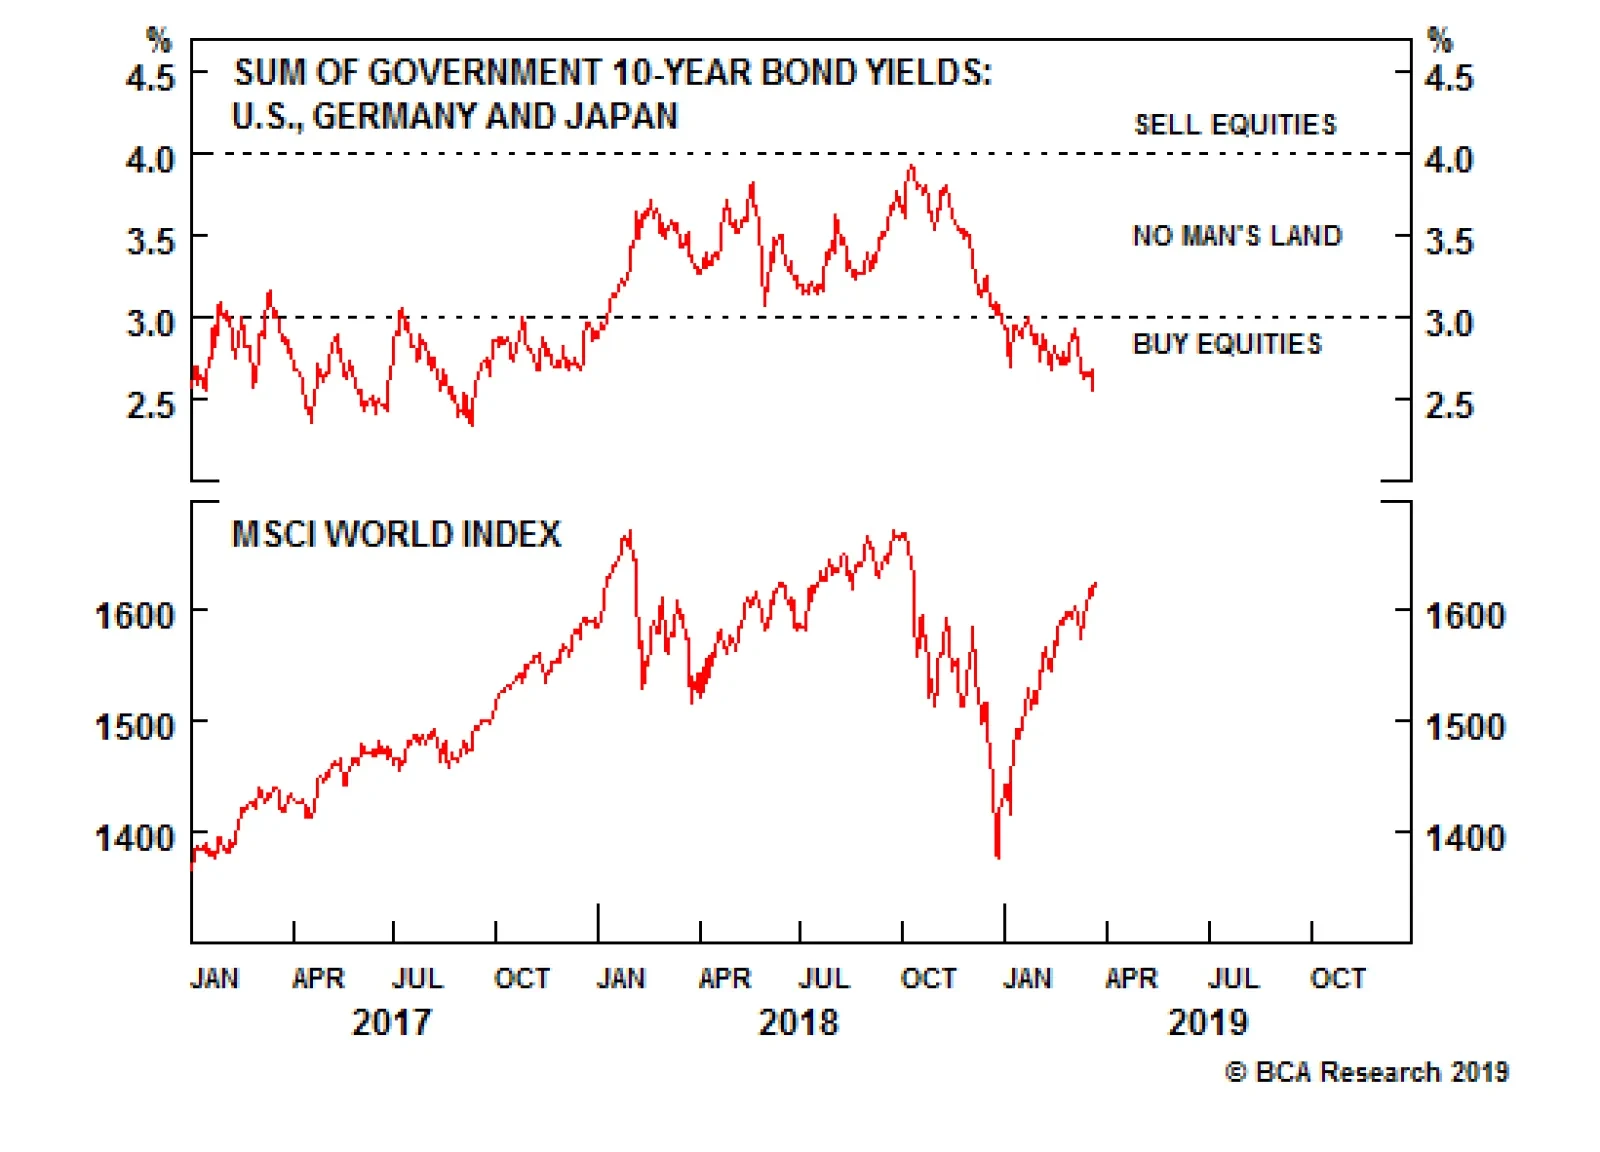
Our European Investment Strategy team proposed "Rule of Four" last year (see prior Insight). It has lately updated its analysis suggesting the following: 1. When the sum of U.S., German and Japanese 10-year bond yields is near 4…

Dear Client, I had the pleasure of visiting clients in Seattle, Anchorage, and Juneau last week. In this week’s report, I address some of the questions that routinely came up during our meetings. Among other things, the topics discussed include our optimistic global growth outlook, waning dollar bullishness, implications of a more dovish Fed on the business cycle, and where we think equities are headed. Next week we will be publishing our Quarterly Strategy Outlook, which will provide a detailed discussion of our key global macro and investment views. Best regards, Peter Berezin, Chief Global Strategist Feature Q: You have predicted that global growth will stabilize in the second quarter and then accelerate in the second half of the year. Are you seeing much evidence in support of this view? A: We are seeing signs of green shoots, but they are still fairly tentative. Current activity indicators appear to have stabilized (Chart 1). The global manufacturing PMI edged lower in February, but the services component increased. Consumer confidence has risen, although that may simply reflect the rebound in global equities. Chart 1Global Growth Appears To Have Stabilized
Global Growth Appears To Have Stabilized
Global Growth Appears To Have Stabilized
The data on international trade has been quite soft. That said, the weekly Harpex shipping index, which measures global container shipping activity, has improved. The Baltic Dry Index has also shown some signs of bottoming (Chart 2). Chart 2Shipping Data Pointing To A Recent Pickup In Global Trade
Shipping Data Pointing To A Recent Pickup In Global Trade
Shipping Data Pointing To A Recent Pickup In Global Trade
The diffusion index of our global leading economic indicator, which tracks the share of countries with rising LEIs, has also moved higher (Chart 3). It generally leads the global LEI. The fact that global financial conditions have eased significantly since the start of the year is also an encouraging sign. Chart 3The Uptick In The LEI Diffusion Index Suggests Global Growth Will Firm Up
The Uptick In The LEI Diffusion Index Suggests Global Growth Will Firm Up
The Uptick In The LEI Diffusion Index Suggests Global Growth Will Firm Up
Q: What’s your take on the most recent Chinese economic data? A: It has been generally soft, but not abysmal. Manufacturing output continues to decelerate. Retail sales remain lackluster, with auto sales showing little evidence of improvement. Property prices are still rising, but floor space sold has begun to contract. Fixed-asset investment has held up so far this year. However, this is mainly due to a pickup in spending among state-owned companies. Both exports and imports contracted in February. In a rather unusual step, the government announced last week that exports increased by nearly 40% in the first nine days of March compared with the same period last year.1 Electricity production has also apparently rebounded. We would not place a huge weight on these statements, as the data probably has been skewed by the timing of the lunar new year, but it does seem that economic momentum may be starting to turn the corner. We are seeing signs of green shoots, but they are still fairly tentative. There is little doubt that the government is trying to jumpstart growth. Household and business taxes have been cut. The PBOC has reduced reserve requirements by 350 bps over the past year. Interbank rates have dropped. Despite the fact that the February credit data fell short of expectations, the six-month credit impulse has turned decisively higher. The Chinese credit impulse leads imports by about six-to-nine months (Chart 4). This bodes well for global trade in the second half of the year. Chart 4Global Trade Will Benefit From A Chinese Reflationary Impulse
Global Trade Will Benefit From A Chinese Reflationary Impulse
Global Trade Will Benefit From A Chinese Reflationary Impulse
Q: Given that Chinese debt levels are already quite high, by how much more can they realistically increase? A: We do not expect credit growth to rise by as much as it did in 2009 or 2016. However, this is because the economy is in better shape, not because there is some intrinsic constraint to increasing debt from current levels. China’s elevated savings rate has kept interest rates well below trend nominal GDP growth, which is the key determinant of debt sustainability (Chart 5).2 As long as the government maintains an implicit guarantee on most local and corporate debt, as it is currently doing, default risk will remain minimal. Chart 5China's High Savings Rate Has Kept Interest Rates Well Below Trend Nominal GDP Growth
China's High Savings Rate Has Kept Interest Rates Well Below Trend Nominal GDP Growth
China's High Savings Rate Has Kept Interest Rates Well Below Trend Nominal GDP Growth
In any case, given that debt now stands at 240% of GDP, a mere one percentage-point increase in credit growth would still produce a hefty 2.4% of GDP in credit stimulus. In this sense, China may be better off with a higher debt-to-GDP ratio since in steady state this will allow for a larger flow of credit-financed stimulus into the economy. Q: A revival in Chinese growth would presumably help Europe? A: Yes. Our conversations with clients revealed an ongoing negative bias towards Europe among investors (Chart 6). This is echoed in the latest BofA Merrill Lynch Global Fund Manager Survey which, for the first time in history, identified “short European equities” as the most crowded trade. Chart 6European Equities: Unloved And Unwanted
European Equities: Unloved And Unwanted
European Equities: Unloved And Unwanted
We think that such deep pessimism about Europe is largely unwarranted. Faster global growth will help the European export sector later this year, while domestic demand will benefit from more accommodative fiscal policy and lower bond yields, especially in Italy. The ECB will not raise rates this year even if growth speeds up, but the market will probably price in a few more rate hikes in 2020 and beyond. This will allow for a modest re-steepening in the yield curves in core European bond markets, which should be positive for long-suffering bank profits. Political risk remains a concern. The Brexit saga has reached the farcical stage where: 1) The U.K. has voted to leave the EU; but 2) Parliament has voted to stay in the EU unless it reaches a satisfactory deal with Brussels; while 3) rejecting the only deal with Brussels that was on offer. Given that most British voters no longer want Brexit (Chart 7), we think that the government will kick the proverbial can down the road until a second referendum is announced or a “soft Brexit” deal is formulated. Either outcome would be welcomed by markets. Chart 7U.K.: In The Case Of A Do-Over, The Remain Side Would Likely Win
U.K.: In The Case Of A Do-Over, The Remain Side Would Likely Win
U.K.: In The Case Of A Do-Over, The Remain Side Would Likely Win
Q: You seem less bullish on the U.S. dollar than you were last year? A: That is correct. As we discussed last week, the dollar is a countercyclical currency, meaning that it tends to move in the opposite direction of global growth (Chart 8). If global growth strengthens later this year, the trade-weighted dollar will probably weaken. Chart 8The Dollar Is A Countercyclical Currency
The Dollar Is A Countercyclical Currency
The Dollar Is A Countercyclical Currency
Moreover, as this week’s FOMC meeting highlighted, the Fed’s reaction function has shifted in a more dovish direction. The median Fed dot now foresees no rate hikes this year and only one rate hike in 2020. In contrast, the December Summary of Economic Projections envisioned two rate hikes this year and one next year. The dollar is a countercyclical currency, meaning that it tends to move in the opposite direction of global growth. In a far cry from his October “rates are far from neutral” comment, Jay Powell stressed during this week's post-FOMC meeting press conference that the fed funds rate is currently in the “broad range of estimates of neutral.” While we would not rule out the possibility that the FOMC will raise rates at some point later this year, we now expect a more gradual pace of rate tightening than we had earlier envisioned. Q: Does a more dovish Fed imply that the economic expansion has even further to run? A: Yes. Expansions tend to end when monetary policy turns restrictive. We had previously thought that this point could be reached in late-2020, but it is now starting to look as though it will occur later than that. Broadly speaking, we see the Fed tightening cycle unfolding in two stages. In the first stage, which is the one we are in today, the Fed will raise rates in baby steps in response to better-than-expected growth and falling unemployment. In the second stage, the Fed will hike rates more aggressively as inflation starts to accelerate. Risk assets will be able to digest the first stage, but not the second. The good news is that most of our favorite indicators are not yet pointing to a major inflationary upswing (Chart 9): Despite higher tariffs, consumer import price inflation has slowed; core intermediate producer price inflation has decelerated; the prices paid components of the ISM and regional Fed surveys have plunged; inflation surprise indices have rolled over; and both survey and market-based measures of inflation expectations remain below where they were last summer. In keeping with these developments, BCA’s propriety Inflation Pipeline Indicator has fallen to a two-and-a-half-year low. Chart 9No Signs Of An Imminent Major Inflationary Upswing In The U.S. ...
No Signs Of An Imminent Major Inflationary Upswing In The U.S. ...
No Signs Of An Imminent Major Inflationary Upswing In The U.S. ...
Wage growth has accelerated, but productivity growth has increased by even more. Unit labor cost inflation has actually been coming down since the middle of last year. Unit labor costs lead core CPI inflation by about 12 months (Chart 10). This implies that consumer price inflation is unlikely to reach uncomfortably high levels at least until the second half of next year. Chart 10... And Decelerating Unit Labor Costs Will Dampen Inflationary Pressures For The Time Being
... And Decelerating Unit Labor Costs Will Dampen Inflationary Pressures For The Time Being
... And Decelerating Unit Labor Costs Will Dampen Inflationary Pressures For The Time Being
Beyond then, the risks are high that inflation will move up as the economy continues to overheat. This could force the Fed to start raising rates aggressively late next year, a course of action that will push up the dollar and cause equities and spread product to sell off. The resulting tightening in financial conditions will probably plunge the U.S. and the rest of the world into recession in 2021. Q: So stay overweight stocks for now, but consider selling at some point next year? A: Correct. The MSCI All-Country World Index (ACWI) has risen by over 14% since we upgraded it in December after having moved to the sidelines six months earlier. Given this run-up, we are not as bullish now as we were at the start of the year. Most of our favorite indicators are not yet pointing to a major inflationary upswing. Nevertheless, the path of least resistance for equities remains to the upside. While the forward P/E ratio for the MSCI ACWI has returned to where it was last September, analyst earnings expectations are currently much more conservative: Bottom-up estimates foresee EPS rising by 4.1% in the U.S. and 5.3% in the rest of the world in 2019 (Chart 11). The combination of faster growth, easier financial conditions, and ongoing corporate buybacks implies some upside to those estimates. Chart 11Analyst Expectations Are Quite Muted
Analyst Expectations Are Quite Muted
Analyst Expectations Are Quite Muted
Moreover, real yields have fallen over the past five months – the 10-year U.S. TIPS yield is 48 basis points below its Q4 average, for example. A simple dividend discount model would suggest that global equities are about 10%-to-15% cheaper than they were prior to last year’s autumn selloff. The path of least resistance for equities remains to the upside. Q: Aren’t you worried that rising labor costs will push down profit margins even if GDP growth accelerates? A: Not really. As noted above, productivity growth has picked up. Whether this is the start of a new trend remains to be seen, but at least for now, it is dampening unit labor costs. Historically, real unit labor costs – nominal unit labor costs divided by the corporate price deflator – have tracked economy-wide profit margins very closely (Chart 12). Chart 12Real U.S. Unit Labor Costs Historically Have Tracked Economy-Wide Profit Margins Very Closely
Real U.S. Unit Labor Costs Historically Have Tracked Economy-Wide Profit Margins Very Closely
Real U.S. Unit Labor Costs Historically Have Tracked Economy-Wide Profit Margins Very Closely
In practice, it is very rare for earnings to contract outside of recessions (Chart 13). This is why recessions and equity bear markets generally overlap (Chart 14). With the next recession still two years away, it is too early to turn defensive. Indeed, as Table 1 shows, the second-to-last year of business-cycle expansions is often the most lucrative for stock market investors. Chart 13Earnings Rarely Contract Outside Of Recessions
Earnings Rarely Contract Outside Of Recessions
Earnings Rarely Contract Outside Of Recessions
Chart 14Recessions And Bear Markets Usually Overlap
Recessions And Bear Markets Usually Overlap
Recessions And Bear Markets Usually Overlap
Table 1Too Soon To Get Out
Questions From The Road
Questions From The Road
Q: What do you recommend in terms of regional equity allocation? A: If global growth accelerates later this year and the dollar weakens, this will create an excellent environment for international stocks – EM and Europe in particular. Investors should prepare to overweight those regions at the expense of the United States (currency unhedged). Peter Berezin, Chief Global Strategist Global Investment Strategy peterb@bcaresearch.com Footnotes 1 Elaine Chan, “China spreading ‘positive news’ of strong export rebound in early March after February plunge,” South China Morning Post, March 11, 2019. 2 Please see Global Investment Strategy Weekly Report, “Is There Really Too Much Government Debt In The World?” dated February 22, 2019. Strategy & Market Trends MacroQuant Model And Current Subjective Scores
Chart 15
Tactical Trades Strategic Recommendations Closed Trades
Highlights Venezuela’s oil production likely fell ~ 500k b/d last week in the wake of nationwide power outages, reducing total output to ~ 500k b/d. However, neither OPEC 2.0 nor U.S. President Donald Trump drew much attention to it. During an industry gathering in Houston last week, an administration official conceded events in Venezuela could affect whether U.S. waivers on its Iranian oil-export sanctions are extended beyond May 4, but that was pretty much it.1 This is consistent with the thesis we laid out last month, which reflects our view OPEC 2.0 is evolving a more flexible production strategy that allows it to adjust production quickly in response to exogenous events over which it has little control; chiefly, U.S. foreign, trade and monetary policy.2 This will result in higher prices, satisfying the sometimes-conflicting goals of OPEC 2.0’s leadership – i.e., KSA’s budgetary need for prices closer to $80/bbl, and Russian producers’ need to increase revenue through higher volumes. Given this backdrop, our updated balances and price forecasts remain largely unchanged, with minor adjustments to the overall supply side and no change on the demand side. We continue to expect Brent to average $75/bbl this year. For 2020, we continue to expect Brent to average $80/bbl – higher U.S. shale output will be offset by delays in building out deepwater export facilities in the U.S. Gulf for most of the year. We expect WTI to trade $7 and $5/bbl lower in 2019 and 2020, respectively. The balance of price risk remains to the upside, as policy risk – i.e., a miscalculation on all sides – is elevated. Highlights Energy: Overweight. We are closing our 2020 long WTI vs. short Brent position at tonight’s close, given delays in the buildout of deepwater-harbor capacity in the U.S. Gulf caused by additional environmental assessments. This likely will push the spread out to $5/bbl+, vs. our target of $3.25/bbl. Base Metals: Neutral. Copper got another endorsement from Fitch Solutions, which is predicting LME prices will average $6,900 and $7,100/MT this year and next, on the back of lower inventories and improving supply-demand fundamentals. We remain long copper, which is up 2.7% since we recommended it on March 7. Precious Metals: Neutral. Our colleagues at BCA Research’s Global Investment Strategy expect the USD to weaken in 2H19, which, all else equal, will support gold and precious metals.3 Our long gold portfolio hedge is up 6.3% since inception on May 4, 2017. Agriculture: Underweight. Grain markets likely will trade sideways ahead of the USDA’s Prospective Plantings survey of farmer intentions next Friday. Feature The sudden loss of Venezuelan output – and exports – was barely noticed in price action over the past week. U.S. foreign and trade policy will continue to keep oil supply and demand uncertainty elevated, particularly as sanctions against Venezuela play out against the backdrop of a collapsing infrastructure. Last week’s nationwide power outage likely caused crude oil production to drop 500k b/d from ~ 1mm b/d previously.4 The sudden loss of Venezuelan output – and exports – was barely noticed in price action over the past week. Global inventories remain swollen (Chart 1), and OPEC 2.0’s spare capacity is increasing as it cuts production (Chart 2). This allows Venezuelan production losses to be covered with little or no disruption to supply or demand, and little or no increase in the level of agita in oil markets. Chart of the WeekOECD Inventories Still High, But Continue to Drain
OECD Inventories Still High, But Continue to Drain
OECD Inventories Still High, But Continue to Drain
Chart 2
That cushion allows the U.S. to continue to prosecute its sanctions strategy against Venezuela and Iran. But it does not give the U.S. carte blanche to pursue regime change in both countries at the same time. As we noted in our New Political Economy of Oil report last month, OPEC 2.0 possibly could cover the loss of 500k b/d of Venezuelan exports and maybe up to 1.5mm b/d of Iranian exports.5 We continue to expect waivers on the Iran sanctions to be extended, although Trump administration officials remain guarded in terms of providing markets any forward guidance. However, it would tighten the heavy-sour market even more than it is now.6 And, full-on sanctions campaigns conducted simultaneously on Venezuela and Iran following the expiration of U.S. waivers on export sanctions against the latter would leave spare capacity dangerously thin, and push the risk premium in oil prices up sharply, given the volumes Iran already is supplying (Chart 3, Table 1).
Chart 3
Table 1Iran Exports By Country 2018 (‘000 b/d)
OPEC 2.0: Oil's Price Fulcrum
OPEC 2.0: Oil's Price Fulcrum
We continue to expect waivers on the Iran sanctions to be extended, although Trump administration officials remain guarded in terms of providing markets any forward guidance. The most that’s been offered came last week in Houston at an industry convention, where Brian Hook, special representative for Iran at the U.S. State Department, indicated the U.S. administration is aware of the supply-side pressure associated with its campaigns against Venezuela and Iran. However, he offered nothing definitive one way or another, so markets will continue to assign a non-zero probability that waivers will not be extended.7 Oil Supply Expectations Remain Stable For our part, we believe waivers on the U.S. Iranian export sanctions will be extended out of necessity. While more than 2mm b/d of Venezuelan and Iranian production can be offset by increased OPEC 2.0 spare capacity – now running ~ 2.1mm b/d based on U.S. EIA estimates – it is not sufficient to cover any additional losses due to unplanned outage of the sort seen in May 2016, when 1mm b/d of Canadian oil production was lost to wildfires. These are real risks, not abstractions meant to illustrate a point.8 For 2H19, our base case now assumes OPEC 2.0’s production rises by ~ 0.5mm b/d vs. 1H19 production of 44.5mm b/d. This will smooth out the loss of Venezuelan output as it falls to 500k b/d by the end of this year, vs. the 650k b/d we expected last month. We also expect Iranian production to remain close to the 3mm b/d it will average in 1H19, likely increasing as global storage levels fall and waivers are exercised (much like a call option). News reports suggest KSA continues to advocate the extension of production cuts by OPEC 2.0 to year end. However, if the coalition’s goal is to keep Brent prices close to $75/bbl this year, and closer to $80/bbl next year – the assumptions we’re working with – OPEC 2.0 likely will have to raise production by 0.5mm b/d in 2H19 and 0.72mm b/d next year. Maintaining production cuts into 2H19 risks sending prices significantly higher, in our estimation. Globally, the big driver of growth on the supply side continues to be U.S. shales, which we now expect to increase 1.2mm b/d in 2019 and 0.9mm b/d next year, a small increase of ~ 60k b/d versus our estimates last month.9 While it is true the Permian bottleneck will be cleared by the end of this year – adding some 2mm b/d of new takeaway capacity – export capacity will remain challenged by new delays to the build-out of deepwater-harbor capacity in the U.S. Gulf well into 2020, following requests of Carlyle Group and Trafigura AG to provide additional information in environmental filings to regulators before work begins.10 This will push the Permian bottleneck from the basin to the U.S. Gulf refining market. On the back of this development, we are closing our 2020 long WTI vs. short Brent recommendation at tonight’s close, given these delays likely push the deep-water expansion in the Gulf to 4Q20 or later. Oil Demand Also Remains Stable Oil demand will continue to be supported by the easing of monetary policy in DM and EM economies to offset a slowdown in global growth. In addition, we expect China’s credit cycle to bottom in 1Q19, which will be supportive of oil demand there and in EMs generally (Chart 4). We continue to expect the Sino – U.S. trade war to be resolved in 1H19, as both presidents Trump and Xi need to get a deal done to satisfy domestic audiences – i.e., U.S. elections next year and the upcoming 100th anniversary of the Chinese Communist Party in 2021, respectively. Chart 4EM Growth Will Lift In 2H19
EM Growth Will Lift In 2H19
EM Growth Will Lift In 2H19
During the second half of this year, we expect a more significant pick-up in China’s credit cycle, which will set the stage for a year-end rally in commodities generally – oil and base metals in particular. We also expect global demand to get a lift from a weaker USD beginning in 2H19 and extending to the end of 2020.11 We expect demand growth of 1.5mm b/d this year and 1.6mm b/d next year, slightly more than the EIA and IEA. We expect EM to account for 53.7mm b/d of growth this year and 55mm b/d next year. Total global demand will average 101.8mm b/d and 103.4mm b/d in 2019 and 2020. U.S. policy is keeping the supply- and demand-side uncertainty elevated, but OPEC 2.0’s hand has been strengthened by the fact that it is, more than ever, the fulcrum of the oil market. OPEC 2.0’s Balancing Strategy U.S. policy is keeping the supply- and demand-side uncertainty elevated, but OPEC 2.0’s hand has been strengthened by the fact that it is, more than ever, the fulcrum of the oil market: It can balance shortfalls out of spare capacity – boosted some by its production cuts – and it can reduce unintended inventory accumulation via its demonstrated ability to cut output rapidly. Our 2019 and 2020 Brent price forecasts remain at $75 and $80/bbl (Chart 5). Delays in building out U.S. Gulf deepwater-harbor capacity next year will keep exports constrained. This will back production up behind the pipe in the Permian Basin next year, and keep inventories fuller than they otherwise would be. And it means Brent markets will remain tighter than we previously expected in 2020, as WTI won’t be exported in the volumes needed to tighten the Brent - WTI spread as much as we previously expected. For 2019, we expect WTI to trade $7/bbl under Brent, and $5/bbl under in 2020 (vs. our earlier expectation of $3.25/bbl), on the back of these delays. This compels us to liquidate our long WTI vs. Brent recommendation in 2020 at tonight’s close. Chart 5OPEC 2.0 Output Hike Needed To Keep Market Balanced in 2H19
OPEC 2.0 Output Hike Needed To Keep Market Balanced in 2H19
OPEC 2.0 Output Hike Needed To Keep Market Balanced in 2H19
OPEC 2.0’s position as the fulcrum effectively means it can balance the market to achieve its price goals (Chart 6, Table 2). This does not drive our forecast, but it does line up with what we would expect an economically rational agent to do. Chart 6Our Ensemble Forecasts Remain Fairly Stable
Our Ensemble Forecasts Remain Fairly Stable
Our Ensemble Forecasts Remain Fairly Stable
Table 2BCA Global Oil Supply - Demand Balances (MMb/d, Base Case Balances)
OPEC 2.0: Oil's Price Fulcrum
OPEC 2.0: Oil's Price Fulcrum
We believe OPEC 2.0 is succeeding in evolving a strategy that allows it sufficient flexibility to respond to exogenous forces affecting oil prices, which are, for the most part, out of its control. Bottom Line: Policy uncertainty is elevated, but we believe OPEC 2.0 is succeeding in evolving a strategy that allows it sufficient flexibility to respond to exogenous forces affecting oil prices, which are, for the most part, out of its control – i.e., U.S. foreign, trade and monetary policy.12 As such, we believe it will adjust output to achieve price targets, which, despite the sometimes-public disagreements between KSA and Russia, are closer to our forecast levels of $75 and $80/bbl for Brent this year and next than not. Robert P. Ryan Chief Commodity & Energy Strategist rryan@bcaresearch.com Hugo Bélanger, Senior Analyst Commodity & Energy Strategy HugoB@bcaresearch.com Footnotes 1 OPEC 2.0 is the name we coined for the OPEC/non-OPEC producer coalition led by the Kingdom of Saudi Arabia (KSA) and Russia. U.S. waivers were granted by the Trump administration just before the sanctions against Iranian oil exports went into effect November 4; these waivers expire May 4, 2019. 2 Please see “The New Political Economy of Oil,” published by BCA Research’s Commodity & Energy Strategy February 21, 2019. It is available at ces.bcaresearch.com. 3 Please see “What’s Next For The Dollar,” published by BCA Research’s Global Investment Strategy published March 15, 2019. It is available at gis.bcaresearch.com. 4 In its March 2019 Oil Market Report, the IEA notes, “The electricity crisis in Venezuela has paralysed most of the country for significant periods of time. Although there are signs that the situation is improving, the degradation of the power system is such that we cannot be sure if the fixes are durable. Until recently, Venezuela’s oil production had stabilised at around 1.2 mb/d. During the past week, industry operations were seriously disrupted and ongoing losses on a significant scale could present a challenge to the market.” We await better data to assess the full extent of the production lost in Venezuela. 5 Please see “The New Political Economy of Oil,” published by BCA Research’s Commodity & Energy Strategy February 21, 2019. It is available at ces.bcaresearch.com. 6 Please see “Oil Price Diffs: Global Convergence,” published by BCA Research’s Commodity & Energy Strategy March 7, 2019. It is available at ces.bcaresearch.com. 7 Please see “CERAWeek: US waivers for Iran oil imports may hinge on Venezuela sanctions impact: State official,” published by S&P Global Platts March 13, 2019. 8 We treat these waivers as quasi call options on Iranian crude oil in our analysis. As inventories draw, importers holding waivers can be expected to exercise their option and lift more crude from Iran without running afoul of U.S. sanctions. 9 We approximate our shale production based on the big 5 basins (Anadarko, Bakken, Permian, Eagle Ford and Niobrara). 10 Please see “US Suspends Review On Trafigura Oil-Port Project” published by Hart Energy March 18, 2019. See also “Exclusive: Environmental review could delay Carlyle deepwater oil export project up to 18 months,” published by reuters.com March 14, 2019. 11 See footnote 3 above. 12 A perfect example of this can be seen OPEC 2.0’s decision to move its ministerial meeting to June: A decision from the U.S. on whether to extend waivers on the Iranian sanctions will come May 4, right around the time OPEC 2.0 member states are deciding on export schedules. If waivers are extended, member states can maintain production discipline or add volumes to the market as needed; if sanctions are re-imposed in full, they can increase production as needed. Investment Views and Themes Recommendations Strategic Recommendations Tactical Trades Commodity Prices and Plays Reference Table Trades Closed in 2019 Summary of Closed Trades
Image
Highlights Investors should use the following dynamic for tactical asset allocation: 1. Sum the 10-year yields on the T-bond, German bund, and JGB. 2. When the sum is near 4 percent, it is prudent to de-risk portfolios and sit aside, at least for a while. It is a good level to buy a mixed portfolio of high-quality 10-year government bonds. 3. Just below this level, a sum in the 3-4 percent range defines a kind of ‘no man’s land’ in which equities drift sideways. 4. When the sum is near 3 percent, the seemingly rich valuations of equities versus bonds is fully justified. And it is appropriate to redeploy tactically from bonds to equities (Chart of the Week). 5. Use the 65-day fractal dimension to pinpoint the precise transition points between asset-classes: as for example, successfully achieved for the DAX versus German bunds. Right now, with the sum near 3 percent, it is still appropriate to be overweight equities versus bonds, and our preferred expression is overweight the DAX versus the German long bund. Feature Chart of the WeekThe Rule Of 4 Becomes The Rule Of 3
The Rule Of 4 Becomes The Rule Of 3
The Rule Of 4 Becomes The Rule Of 3
The global long bond yield recently hit a two-year low (Chart I-2). This is the direct result of central banks’ pivot to dovish – a commitment to keep policy rates at current levels, rather than to hike, for the foreseeable future. Chart I-2The Global Long Bond Yield Recently Hit A Two-Year Low
The Global Long Bond Yield Recently Hit A Two-Year Low
The Global Long Bond Yield Recently Hit A Two-Year Low
One consequence is that high-quality bonds have become riskier. Consider a German bund or a JGB which is yielding zero percent. The short-term potential for capital appreciation – nominal or real – has almost vanished, while the potential for vicious losses has increased dramatically. The technical term for this negative asymmetry is negative skew. Years of research in a field of behavioural economics called Prospect Theory concludes that negative skew is the metric that best encapsulates investment risk. The Correct Way Of Thinking About Investment Risk A great misunderstanding of finance is to equate risk with volatility. Risky assets, such as equities, are risky not because they are volatile in the conventional sense. After all, who minds when their asset price goes up sharply? Risky assets are risky because they have the propensity to experience much larger short-term losses than short-term gains – captured in the saying: equities climb up the stairs on the way up, but they jump out of the window on the way down. High-quality bonds have become riskier. Another great misunderstanding of finance is the idea that bonds offer a diversification benefit and, therefore, that investors should accept a lower return from them. This argument is also flawed. The bond market is bigger than the equity market, and just as bonds are a diversifier for equity investments, equities are a diversifier for bond investments. Indeed, equities have protected bond investors during vicious sell-offs in the bond market such as after Trump’s shock victory in 2016. So we could equally argue that equities offer a diversification benefit. In fact, the correct way of thinking about investment risk is as follows: An investment’s risk depends on the negative asymmetry of its short-term returns. At very low bond yields, bond returns develop the same negative asymmetry as equity returns (Chart I-3). This means that equities lose their excess riskiness versus bonds, requiring equity valuations to experience a phase transition sharply higher (Chart I-4). But when bond yields normalize, equities regain their excess riskiness versus bonds – and their valuations must suffer a phase transition sharply lower. The phase transition in equity valuations is most pronounced when the global 10-year bond yield goes up or down through 2 percent (Chart I-5).
Chart I-3
Chart I-4
Chart I-5
This dynamic proved to be the biggest driver of asset allocation in 2018, and is likely to be a big driver in 2019 too. Essentially, higher bond yields can suddenly and viciously undermine the valuation support of equities, triggering a plunge in the stock market and other risk-assets which threatens a disinflationary impulse. The unsurprising response from central banks is to pivot back to dovish, pulling back bond yields to previous lows. These lower bond yields then push up equity (and other risk-asset) valuations back to previous highs. An investment’s risk depends on the negative asymmetry of its short-term returns. The good news is that record high valuations of risk-assets are fully justified if bond yields remain at current levels or decline further. But the longer-term danger is that these rich valuations are hyper-sensitive to rising bond yields. The Bubble In Everything The current episode of elevated risk-asset valuations is not unprecedented, but there is a crucial difference. Previous episodes of elevated risk-asset valuations tended to be localised, either by geography or sector: 1990 was focussed in Japan; 2000 was focussed in the dot com related sectors; 2008 was focussed in the U.S. mortgage and credit markets. Extraordinary monetary policy has boosted the valuations of all risk-assets across all geographies and all asset-classes. By comparison, the post-2008 global experiment with quantitative easing, and zero and negative interest rate policy has boosted the valuations of all risk-assets across all geographies and all asset-classes – equities (Chart I-6), credit (Chart I-7), and real estate (Chart I-8). This makes it considerably more dangerous, because we estimate that the total value of global risk-assets including real estate is $400 trillion, equal to about five times the size of the global economy.1 Chart I-6Equities Remain Richly Valued
Equities Remain Richly Valued
Equities Remain Richly Valued
Chart I-7Credit Remains Richly Valued
Credit Remains Richly Valued
Credit Remains Richly Valued
Chart I-8The EM Real Estate Boom Happened After 2008
The EM Real Estate Boom Happened After 2008
The EM Real Estate Boom Happened After 2008
Let’s say you had a risk-asset that was priced to generate 5 percent a year over the next decade. Now imagine that the valuation boost from ultra-accommodative monetary policy capitalises all of those future returns to today. For those future returns to drop to zero, today’s price must surge by 63 percent.2 If you were prudent, you might amortise today’s windfall to generate the original 5 percent a year over the next decade. But if you were imprudent, you might spend a large amount of the windfall today. The total value of global risk-assets equals five times the size of the global economy. Now let’s imagine a valuation derating moves the risk-asset’s returns back to the future. For those that had prudently amortised the original windfall, nothing has really changed and future spending patterns would not be impacted. But not everybody is prudent. For those that had imprudently spent the original windfall, future spending would inevitably suffer a nasty recession. The Rule Of 4 Becomes The Rule Of 3 How can we sense the crucial 2 percent level in the global 10-year bond yield? The answer is that it broadly equates to when the sum of the 10-year yields on the T-bond, German bund and JGB is at a 4 percent level (Chart I-9). This is the genesis of our very successful ‘Rule of 4’. In 2019, just as in 2018, investors should use the following dynamic for tactical asset allocation. The rule of 4 identifies when the global 10-year bond yield is at 2 percent. Chart I-9When The Sum Of 10-Year Yields On The T-Bond, Bund, And JGB Equals 4 Percent, The Global 10-Year Yield Equals 2 Percent
When The Sum Of 10-Year Yields On The T-Bond, Bund, And JGB Equals 4 Percent, The Global 10-Year Yield Equals 2 Percent
When The Sum Of 10-Year Yields On The T-Bond, Bund, And JGB Equals 4 Percent, The Global 10-Year Yield Equals 2 Percent
Sum the 10-year yields on the T-bond, German bund, and JGB. When the sum is near 4 percent, it is prudent to de-risk portfolios and sit aside, at least for a while. It is a good level to buy a mixed portfolio of high-quality 10-year government bonds. Just below this level, a sum in the 3-4 percent range defines a kind of ‘no man’s land’ in which equities drift sideways. When the sum is near 3 percent, the seemingly rich valuations of equities versus bonds is fully justified. And it is appropriate to redeploy tactically from bonds to equities. Use the 65-day fractal dimension to pinpoint the precise transition points between asset-classes: as for example, successfully achieved for the DAX versus German bunds (Chart I-10). Overweight equities versus bonds. With the sum of the three 10-year yields now near 3 percent, the rule of 4 has, in a sense, become the rule of 3. It is still appropriate to be tactically overweight equities versus bonds, and our preferred expression is to overweight the DAX versus the German long bund. Chart I-10Use The 65-Day Fractal Dimension To Pinpoint The Precise Transition Points Between Asset-Classes
Use The 65-Day Fractal Dimension To Pinpoint The Precise Transition Points Between Asset-Classes
Use The 65-Day Fractal Dimension To Pinpoint The Precise Transition Points Between Asset-Classes
Dhaval Joshi, Chief European Investment Strategist dhaval@bcaresearch.com Footnotes 1 Please see the European Investment Strategy Weekly Report “Trapped: Have Equities Trapped Bonds?”, September 13, 2018 available at eis.bcaresearch.com. 2 5 percent compounded over ten years.
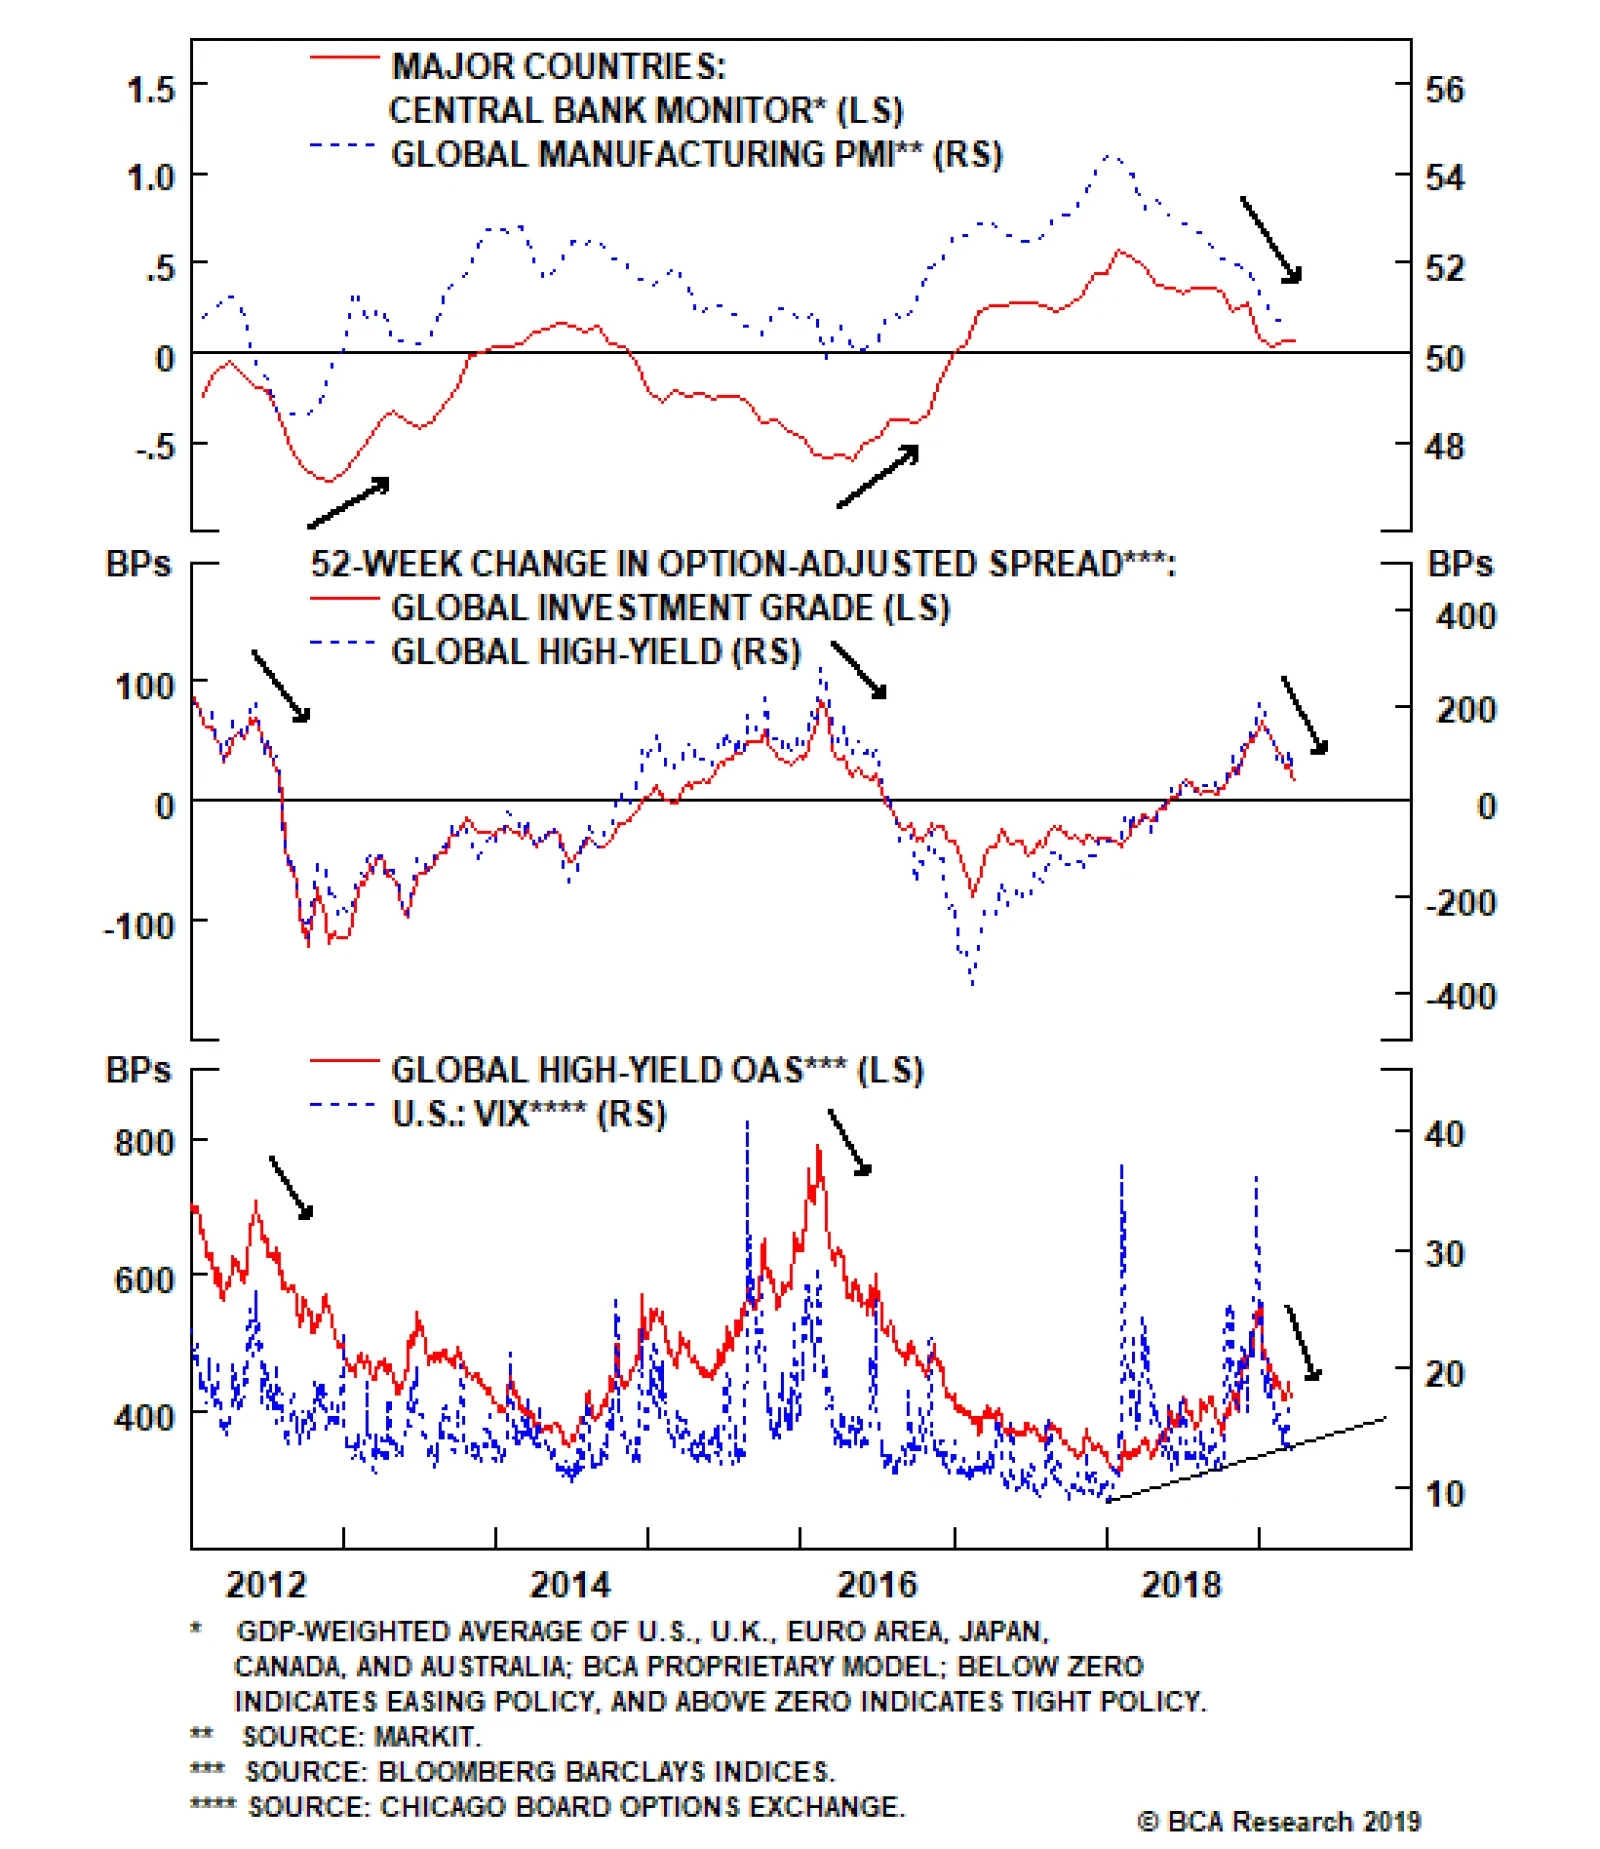
The recent dovish pivot in global central bank rate guidance supports the outperformance of risk assets by removing the threat of higher global bond yields at a time of slowing growth. The result has been sharp rallies in global equity and credit markets,…
Highlights Global Spread Product: The current low-volatility backdrop, triggered by more dovish central banks, will be maintained until there is more decisive evidence that global growth is rebounding. That will not occur until the latter half of 2019, thus keeping the window for corporate credit outperformance open for a few more months. Stay overweight global corporates versus governments, favoring the U.S. Canada: Much weaker-than-expected Canadian economic growth has surprised the Bank of Canada. Rate hikes are now off the table for at least the rest of 2019, and possibly longer. Upgrade Canadian government debt to neutral (3 out of 5) in global currency-hedged government bond portfolios. Feature Stick With A Tactical Overweight To Global Corporates We’ve dedicated our last few Weekly Reports to analyzing the outlook for government bond yields in the developed markets (DM), in light of the recent dovish shift in the policy stance of central banks. We concluded that yields had fully discounted a slower global growth backdrop, through lower inflation expectations and the pricing out of future interest rate hikes. Further declines in bond yields would require a deeper deceleration of activity than we are expecting, thus maintaining a below-benchmark medium-term duration stance is appropriate. That dovish shift by policymakers also took away a major roadblock for risk assets, namely the threat of a continued policy-induced rise in global yields at a time of slowing growth. The result has been sharp rallies in global equity and credit markets, with declining volatility (Chart of the Week). Chart of the WeekSlowing Growth Isn’t Always Bad For Risk Assets
Slowing Growth Isn't Always Bad For Risk Assets
Slowing Growth Isn't Always Bad For Risk Assets
We upgraded global corporate debt, and downgraded global government bonds, on a tactical basis back on January 15 of this year.1 Since then, credit spreads have declined substantially across both DM and emerging markets (EM), most notably in Europe (Chart 2). Within our upgrade to overall global credit, we maintained a relative bias towards U.S. corporates versus non-U.S. equivalents, based on our expectation of relatively faster economic growth in the U.S. In our model bond portfolio, that meant moving U.S. corporates to an above-benchmark weighting, while reducing the size of the underweight in EM debt and only raising European credit to a neutral allocation.
Chart 2
Looking at the performance of each of the major credit markets in excess return terms (versus duration-matched government bonds) since January 15, currency-hedged into U.S. dollars, there have not been huge differences between U.S. and non-U.S. returns. The exception is European high-yield which had an excess return of 4.4%, but only represents 0.8% of our custom benchmark index for our model portfolio (and where we are not underweight). Excess returns for investment grade and high-yield corporates in the U.S. have averaged 2.3%, compared to 2.2% for EM credit (averaging hard currency sovereign and corporate debt). We see the global “risk-on” dynamic continuing in next few months, fueled by benign monetary policies, thus we are sticking with our current overweight allocation to global corporates. With the benefit of hindsight, we know that the decision to upgrade overall global corporate debt versus government bonds has been far more important than adjusting any regional credit allocations. We see that global “risk-on” dynamic continuing in next few months, fueled by benign monetary policies, thus we are sticking with our current allocations to global corporates. Our cue to reverse our tactical overweight stance on corporates will come from the U.S. Any additional spread tightening and easing of overall financial conditions will keep U.S. economic growth above trend and eventually force the Fed to become more hawkish in the second half of 2019. This will turn global monetary policy from a tailwind for corporate credit to a headwind, justifying a downgrade of corporate allocations. In the meantime, we recommend continuing to earn carry in a policy-induced low volatility environment. Bottom Line: The current low-volatility backdrop, triggered by more dovish central banks, will be maintained until there is more decisive evidence that global growth is rebounding. That will not occur until the latter half of 2019, thus keeping the window for corporate credit outperformance open for a few more months. Stay overweight global corporates versus governments, favoring the U.S. Canada: Upgrade To Neutral Canadian government bonds have been clawing back much of the relative underperformance that occurred in 2017 and 2018 while the Bank of Canada (BoC) was delivering multiple rate hikes. The spread between the yields on the Bloomberg Barclays Canada Treasury index and the overall Global Treasury index has narrowed by -40bps since October 2018, after widening 69bps between May 2017 and October 2018 (Chart 3). Expressed as a relative return (duration-matched and currency-hedged into U.S. dollars), Canadian government debt has lagged the Global Treasury index by -232bps since May 2017. Chart 3Canadian Bonds No Longer Underperforming
Canadian Bonds No Longer Underperforming
Canadian Bonds No Longer Underperforming
That underperformance was driven by the combination of a strong Canadian economy, accelerating inflation and tightening monetary policy. The year-over-year pace of real GDP growth reached 3.8% in mid-2017 and stayed above-trend for the following year. The unemployment rate fell to 5.8%, while core inflation accelerated back to the midpoint of the BoC’s 1-3% target band, alongside faster wage growth. The BoC – devotees of the Phillips Curve, like virtually every other DM central bank – took the message from the combination of tight labor markets and rising inflation and embarked on the long march away from a near-zero (0.5%) policy rate back in July 2017. Now, after 20 months and 125bps of rate hikes, Canada’s economy is weakening sharply. Real GDP only grew at a paltry 0.4% annualized pace in the 4th quarter of 2018, dragging the year-over-year pace to 1.6%. Inflation has followed suit, with headline CPI inflation falling from an early 2018 peak of 3% to 1.4% and the BOC’s median CPI index now growing at only a 1.8% pace. The most concerning part for the BoC is that the economy could be decelerating this rapidly with a policy rate of only 1.75%, which is well below the central bank’s estimated 2.5-3.5% range for the neutral rate. Our own BoC Monitor has rapidly fallen towards the zero line, indicating no pressure to either tighten or ease monetary policy (Chart 4). The more recent rapid decline in the BoC Monitor has been driven by the inflation-focused components of the indicator, while the growth-focused elements have been steadily drifting lower since that 2017 peak in real GDP growth. Chart 4Is The BoC Done, Well South Of Neutral?
Is The BoC Done, Well South Of Neutral?
Is The BoC Done, Well South Of Neutral?
The BoC has been stunned by that shockingly weak Q4/2018 growth outturn. In the official policy statement released following the March 6 BoC meeting, the central bank’s Governing Council was forthright about how the growth uncertainty has put future rate hikes in question: “Governing Council judges that the outlook continues to warrant a policy interest rate that is below its neutral range. Given the mixed picture that the data present, it will take time to gauge the persistence of below-potential growth and the implications for the future inflation outlook. With increased uncertainty about the timing of future rate increases, Governing Council will be watching closely developments in household spending, oil markets and global trade policy.” Rising interest rates may be the big reason why growth has slowed so dramatically in Canada. The BoC’s economic projections for 2019 had already factored in some slowing global growth, as well a hit to business confidence and capital spending from global trade conflicts and last year’s decline in energy prices (a big deal for Canada’s huge oil industry). BoC officials, including Governor Stephen Poloz, have noted that a resolution of the U.S.-China trade tensions could therefore be a positive for the Canadian economy by removing a critical drag on Canadian business confidence and export demand. Yet when looking at the contribution to Canadian real GDP growth from the main components, there have been large drags on growth from consumer spending, capital spending and housing (Chart 5). That suggests that there is something more fundamental than just a series of external shocks at work here. Chart 5Broad-Based Weakness In Canadian Domestic Demand
Broad-Based Weakness In Canadian Domestic Demand
Broad-Based Weakness In Canadian Domestic Demand
A look at the more interest-sensitive components of the Canadian economy suggests that rising interest rates may be a big reason why growth has slowed so dramatically. Consumer Durables Real consumer spending growth has plunged from a 4% pace in 2018 to 1.3% in Q4/2018, driven by a collapse in demand for consumer durables which contracted -1.2% year-over-year terms (Chart 6). Car sales plunged 7.5% on a year-over-year basis in Q4, suggesting that rising interest rates on auto loans may have been a major factor driving the weakness in durables spending. Softer incomes have also played a role, with wage growth rolling over even with the majority of evidence pointing to a very tight Canadian labor market that is getting even tighter (third panel). The fact that the drop was so focused on durables, however, suggests that higher interest rates were the more likely reason for the plunge in overall consumer spending. Chart 6Weak Canadian Consumption Concentrated In Durables
Weak Canadian Consumption Concentrated In Durables
Weak Canadian Consumption Concentrated In Durables
Housing The overheated Canadian housing market has endured the double-whammy of rising mortgage interest rates and increasing macro-prudential changes to mortgage lending. House prices in the hottest Toronto and Vancouver markets – which should be most impacted by the changes in mortgage regulations – have stopped increasing, helping bring the growth in national house prices to only 1.9% (Chart 7). Yet the sharp deceleration of mortgage credit growth, alongside a contraction in housing starts and overall residential investment, suggests that higher mortgage rates could be the bigger driver of the housing weakness. Chart 7Some Long-Needed Cooling Of Canadian Housing
Some Long-Needed Cooling Of Canadian Housing
Some Long-Needed Cooling Of Canadian Housing
The BoC has noted that it is difficult to disentangle the impact of regulatory changes in Canadian mortgages from that of rising interest rates. Yet the impact of higher mortgage rates on Canadian consumer spending power can be seen in the rising debt service ratio for Canadian households. As of Q4/2018, Canadians must now pay 14.5% of their household income to service their debts, an 0.53 percentage point increase over the past two years (Chart 8). For highly indebted Canadian households, who have mortgage debt equal to 107% of disposable income, even a modest pickup in mortgage rates can have a big impact on spending power through higher interest costs. Chart 8Leveraged Canadian Consumers Pinched By Higher Rates
Leveraged Canadian Consumers Pinched By Higher Rates
Leveraged Canadian Consumers Pinched By Higher Rates
Does the fact that consumer spending has fallen so rapidly mean that the interest sensitivity of the Canadian economy is far greater than the BoC has assumed? If so, then the neutral range of 2.5-3.5% for the BoC policy rate may be too high, and the central bank could be closer to, if not already at, the end of its hiking cycle. The low level of the household savings rate – currently only 1.1%, a product of the housing bubble and the associated wealth effects on spending activity – makes Canadian consumers even more vulnerable to rate increases that diminish their spending power. For highly indebted Canadian households, even a modest pickup in mortgage rates can have a big impact on spending power through higher interest costs. Capital Spending Canadian companies have seen a steady decline in corporate profit growth over the past couple of years, decelerating from a 23% pace in 2017 to 2% late in 2018 on a top-down basis. Yet even allowing for that, the -8% contraction in year-over-year real non-residential investment spending in Q4/2018 is a shock. Particularly since the BoC’s Senior Loan Officer Survey showed that credit conditions have been easing, and our own Canadian Corporate Health Monitor is flashing that Canadian companies are in solid financial condition (Chart 9). Chart 9An Unusually Sharp Fall In Canadian Capex
An Unusually Sharp Fall In Canadian Capex
An Unusually Sharp Fall In Canadian Capex
Business surveys from the BoC and the Conference Board did both show a sharp plunge in confidence and future sales expectations (bottom panel). This suggests that worries about global trade tensions and diminished trade activity may have weighed on Canadian business confidence and capital spending – especially coming alongside a big drop in oil prices as was seen last year, which hinders the ability of Canadian energy producers to ramp up investment. Canadian exports accelerated over the final half of 2018 while business confidence was falling. However, oil prices have now stabilized and, more importantly, Canadian exports accelerated over the final half of 2018 while business confidence was falling (Chart 10). That acceleration was seen for both energy and non-energy exports, but was also heavily concentrated in exports to China, which are now growing 24% on a year-over-year basis (a pace that is wildly at odds with the overall growth in Chinese imports, suggesting that Canadian exporters have increased their market share in China). Chart 10Should Canadian Companies Be Worried About Global Trade?
Should Canadian Companies Be Worried About Global Trade?
Should Canadian Companies Be Worried About Global Trade?
Could higher corporate borrowing rates, rather than worries about plunging export demand, be the true reason why Canadian companies have so drastically cut back on capital spending? It is no surprise that the BoC has chosen to take a pause on its rate hiking cycle, given all those conflicting messages from the Canadian economic data. The growth slump could be related to global trade uncertainty, or regulatory changes in the housing market, or past declines in oil prices, or previous interest rate increases. Or all of the above. The BoC can also take some time before considering its next interest rate move given cooling inflation and wage growth (Chart 11). The central bank has reduced its estimate of the Canadian output gap to -0.5%, based off the downside surprises already seen in Canadian economic growth. A closed output gap, combined with accelerating inflation, was the main argument the BoC had been using to justify its interest rate increases over the past two years. Now, neither of those conditions is currently in place, and the BoC can take its time to assess the underlying trend of economic growth without having to worry about above-target inflation. Chart 11Slowing Inflation = More Dovish BoC
Slowing Inflation = More Dovish BoC
Slowing Inflation = More Dovish BoC
The Governing Council next meets in April, when a new Monetary Policy Report and updated economic projections will be published. The 2019 growth and inflation forecasts will surely be downgraded, perhaps heavily as the European Central Bank just did in response to the sharp growth slowdown in Europe – which led to a new round of monetary easing measures. What will be more interesting from the point of view of Canadian bond investors will be the Bank’s assessment of the size of Canada’s output gap, the pace of trend growth and, perhaps, even the appropriate neutral range for the BoC policy rate. The lowering of any of those three elements would be supportive of Canadian bond yields staying lower for longer. We have maintained an underweight in Canadian government bonds since July 2017, based on our view that the BoC would follow in the Fed’s footsteps and attempt to normalize interest rates. A strong economy and rising inflation would allow them to do that. Now, both the Fed and BoC are on hold, with small probabilities of rate cuts now priced into Overnight Index Swap (OIS) curves (Chart 12). Chart 12BoC Now Less Likely To Follow The Fed
BoC Now Less Likely To Follow The Fed
BoC Now Less Likely To Follow The Fed
Given the BCA view that Fed rate hikes will resume later this year on the back of a rebound in U.S. and global growth, we had been sticking with the bearish view on Canadian government bonds as well. Yet given the stunning drop in Canadian growth that startled the BoC, the odds now favor the BoC staying on hold for longer, even once the Fed begins to hike again. This would also provide additional easing of Canadian financial conditions through a soft Canadian dollar (bottom two panels). We are upgrading our recommended allocation to Canadian bonds to neutral(3 out of 5) this week from underweight (2 out of 5). In light of this uncertainty over the BoC’s next move given the weak economy, the underlying rationale for our underweight Canada position is no longer applicable. Thus, we are upgrading our recommended allocation to Canadian bonds to neutral (3 out of 5) this week from underweight (2 out of 5). The excess return of Canadian government bonds versus the Global Treasury index since we went to underweight back in July 2017 was -0.83%, so our bearish recommendation did generate positive alpha. In our model bond portfolio, we are funding that additional Canadian allocation from a reduction of the overweight in Japanese government bonds. We are also closing our tactical trade of being long 10-year Canadian Real Return Bonds versus nominal 10-year government debt, at a loss as 10-year inflation breakevens are now 1.6%, or 16bps below the entry level on our trade (Chart 13). Chart 13Upgrade Canadian Government Bonds To Neutral
Upgrade Canadian Government Bonds To Neutral
Upgrade Canadian Government Bonds To Neutral
We will contemplate any additional changes to our Canadian allocation after the releases of the latest BoC Business Outlook Survey and Senior Loan Officer Survey on April 15 and the new BoC Monetary Policy Report and economic projections at the April 24 monetary policy meeting. Bottom Line: Much weaker-than-expected Canadian economic growth has surprised the Bank of Canada. Rate hikes are now off the table for at least the rest of 2019, and possibly longer. Upgrade Canadian government debt to neutral (3 out of 5) in global currency-hedged government bond portfolios. Robert Robis, CFA, Chief Fixed Income Strategist rrobis@bcaresearch.com Footnotes 1 Please see BCA Global Fixed Income Strategy Weekly Report, “Enough With The Gloom: Upgrade Global Corporates On A Tactical Basis”, dated January 15th 2019, available at gfis.bcarsearch.com. Recommendations The GFIS Recommended Portfolio Vs. The Custom Benchmark Index
March Calmness
March Calmness
Duration Regional Allocation Spread Product Tactical Trades Yields & Returns Global Bond Yields Historical Returns
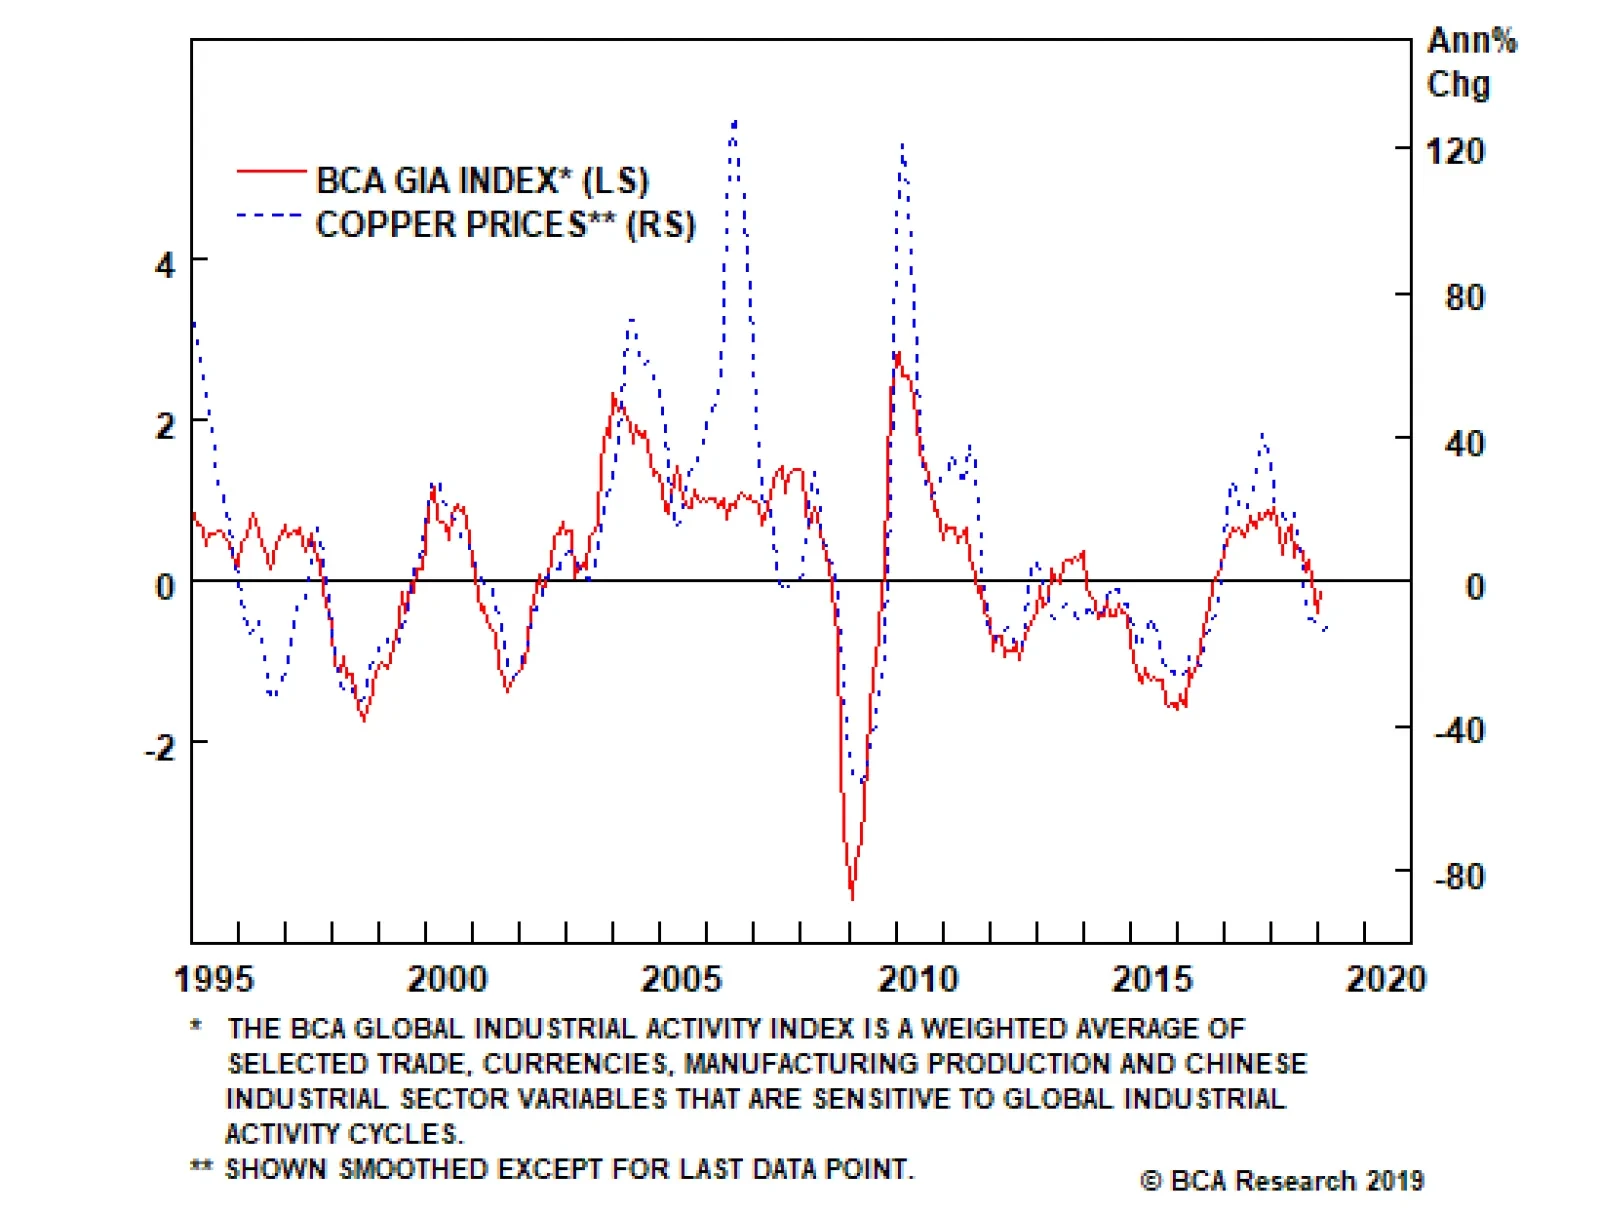
Our Commodity & Energy Strategy service measures China’s aggregate credit using bank and non-bank claims on non-financial enterprises, households, local and central governments, and non-bank financial institutions. This corresponds to adding outstanding…
We continue to expect copper prices to increase in the near term, as China’s credit cycle bottoms and DM central banks soften their monetary-policy stance. Fiscal and monetary stimulus in China also will be supportive of base metals prices going forward. The evolution of the Sino - U.S. trade negotiations remains a risk to our view, given how important the outcome of these talks will be for investors’ expectations and sentiment. Markets appear to be discounting a positive outcome. Anything that scuppers these talks – or results in a no-deal outcome – will be a negative for base metals, copper in particular. Our tactical long copper position is up by 1.2% since we initiated it last week. Highlights Energy: Overweight. Russian oil companies are expected to keep production lower until July, when the current OPEC 2.0 production-cutting agreement now in place expires. We expect the deal will be extended to year-end.1 Separately, the risk of a complete shutdown in Venezuela’s oil industry rose significantly, as a power failure in most of the country all but eliminated potable water supplies and significantly reduced oil exports. Base Metals/Bulks: Neutral. High-grade iron-ore prices got a boost this week as Vale was ordered to temporarily suspend exports from its primary port at Guaiba Island terminal in Rio de Janeiro state, according to Metal Bulletin’s Fastmarkets.2 The price-reporting agency’s 62% Fe Iron Ore Index rose $1.46/MT at $85.25/MT Tuesday. Precious Metals: Neutral. Spot gold is back above $1,300/oz, on the back of monetary policy easing among important central banks. This also is supporting base metals globally (see below). Ags/Softs: Underweight. Grain markets continue to drift sideways, awaiting definitive news re Sino - U.S. trade talks, specifically when presidents Xi and Trump will meet to finalize a deal (see below). Separately, wheat and corn inventories are expected to rise on the back of higher supplies and lower exports, the USDA forecast in its latest world supply-demand estimates. Feature Recent data releases confirm our view that global growth will remain weak in 1Q19 and early 2Q19. This will continue to put downward pressure on cyclical commodities – chiefly base metals and oil (Chart of the Week). Chart of the WeekGlobal Growth Slows In 1Q19
Global Growth Slows In 1Q19
Global Growth Slows In 1Q19
The persistence of the slowdown provoked major central banks to adopt a dovish stance in the short-term. This is easily seen in the recent actions by the U.S. Fed, the European Central Bank (ECB), the Bank of Canada (BoC) and the Reserve Bank of Australia (RBA), all of which have communicated a pause in their rate normalization policies.3 At the moment, the frail global growth is partly balanced by expectations of a positive outcome re the ongoing Sino - U.S. trade negotiations (Chart 2). In the coming months, we expect the effect of accommodative DM monetary policy combined with an expansion in China’s credit (more on this below) and fiscal stimulus – i.e., tax cuts announced earlier this month amounting to almost $300 billion (~ 2 trillion RMB) meant to support policymakers’ GDP growth targets – will go a long way toward reversing the earlier contraction. The effect of these policy decisions will be apparent in 2H19. Chart 2China Growth To Hook Higher
China Growth To Hook Higher
China Growth To Hook Higher
China’s Credit Cycle Bottomed In December 2018 The evolution of China’s credit cycle remains a central pillar to our view commodity demand growth in 2H19 will surpass consensus expectations. The massive growth reported in China’s January credit statistics revived investors’ expectations that China’s banks will re-open the credit valves as they did in 2016.4 In our view, this number does signal a bottom in China’s credit cycle, and implies Chinese – and indirectly EM – growth will bottom sometime this year. However, we still are not expecting a complete blowout credit expansion this year. We continue to believe Chinese policymakers will focus on stabilizing credit in 1H19 with moderate increases in supply, and start increasing stimulus in 2H19 or 2020 in order to maximize its effect later in 2020 ahead of the 100th anniversary of the founding of the Chinese Communist Party (CCP) in 2021. The soft February credit number released this week supports this argument.5 China’s Credit Cycle Matters For Base Metals Demand The relationship between China’s credit cycles and base metal prices endures and remains robust. We measure China’s aggregate credit using bank and non-bank claims on non-financial enterprises, households, local and central governments, and non-bank financial institutions. This corresponds to adding outstanding central and local government bonds to China’s Total Social Financing (TSF).6 The annual change in aggregate credit – or its impulses – do not perfectly capture the cycles in global base metal demand. These variables provide interesting signals about the direction and magnitude of movements in credit, however, they do not track base metals’ price cycles accurately and consistently (Chart 3). Chart 3Metals Price Cycles Don't Track Changed In China's Credit
Metals Price Cycles Don't Track Changed In China's Credit
Metals Price Cycles Don't Track Changed In China's Credit
To decompose this variable into its trend and cycle, we use a proxy of the credit cycle constructed using the Hodrick-Prescott and Hamilton filters, and the standardized 12-month credit impulse (Chart 4).7 Chart 4China's Credit Cycle Proxy
China's Credit Cycle Proxy
China's Credit Cycle Proxy
We find that our credit cycle proxy Granger causes base metal prices, import volume and industrial activity (Table 1).8 On average, it leads these variables by 4-6 months (Chart 5). Hence, we believe our credit cycle proxy provides valuable information about future commodity demand in China. Table 1China Credit Cycle Correlations
Bottoming Of China's Credit Cycle Bullish For Copper Over Near Term
Bottoming Of China's Credit Cycle Bullish For Copper Over Near Term
Chart 5
In fact, when regressing copper prices and the LMEX against it, we found that 60% and 58% of the variation in copper prices and the LMEX, can be explained by the linear relationship with our China credit cycle proxy, respectively (Chart 6). Chart 6China's Credit Cycle and Metals Prices
China's Credit Cycle and Metals Prices
China's Credit Cycle and Metals Prices
Given the leading property of China’s credit cycles with respect to industrial activity and metal prices, we included this new proxy in our Global Industrial Activity (GIA) index.9 This improves the correlation of our index with copper prices (Chart 7). Chart 7Credit Cycle Improves BCA's GIA
Credit Cycle Improves BCA's GIA
Credit Cycle Improves BCA's GIA
Currently, our models suggest copper prices should increase in the coming months as China’s credit cycle bottoms and DM central banks soften their monetary policy stance. The evolution of the China-U.S. trade negotiations remains a risk to our view as the outcome will weigh on investors’ expectations and sentiment. China’s Vs. DMs’ Credit Cycles Between 2009 and 2014, China’s credit cycle lagged the U.S. and EU’s broad money cycles (Chart 8). This counter-cyclicality is partly explained by its elevated level of exports to the U.S. and of hard goods to Europe. When the global economic cycle works in China’s favor – i.e., when the Fed and ECB are accommodative or fiscal stimulus is deployed in either or both regions – China’s exports rise as U.S. and EU aggregate demand increases. This typically reduces the need for endogenous fiscal or monetary stimulus within China. Chart 8China's Credit Cycle Lags U.S., EU Money Cycles
China's Credit Cycle Lags U.S., EU Money Cycles
China's Credit Cycle Lags U.S., EU Money Cycles
On the other hand, when the global economic cycle contracts and fiscal and monetary policy ex China becomes a headwind, Chinese policymakers typically need to deploy fiscal and monetary policy to keep growth going, or at least avoid a contraction in their economy. Between 2016 and 2017, DM and China credit cycles aligned and increased simultaneously. Taking into account the 4-to-6-month lag between the time credit supply is increased and commodity demand rises, this created bullish conditions for metals and oil from 2H16 to 1H18, pushing copper prices up by 60%. In 2018, both regions’ cycles rolled over. Base metals markets currently are experiencing the consequences of this contraction in credit availability and tightening of financial conditions generally. Going forward, we expect China will step in to raise domestic demand and offset the impact of the decline in credit availability elsewhere, which is affecting demand for its exports in the short-term. In the medium-term, the U.S. and EU, along with India, do not appear to be inclined to absorb Chinese exports to the extent they did in the past, which means the pivot to domestically generated growth through consumer- and services-led demand is the most viable alternative Chinese policymakers have to keep growth on target. Bottom Line: The dovish turn of major DM central banks combined with a bottoming of China’s credit cycle will support cyclical commodities at the margin in the coming months. During the second half of this year, we expect a more significant pick up in China’s credit, setting the stage for a year-end rally in base metal prices. As a consequence, the impact of China’s credit growth on base metals demand could diminish compared to previous stimulus targeting industrial demand. Hugo Bélanger, Senior Analyst Commodity & Energy Strategy HugoB@bcaresearch.com Robert P. Ryan, Chief Commodity & Energy Strategist rryan@bcaresearch.com Footnotes 1 Please see “Russia’s oil companies ready to cut output until July: TASS,” published by reuters.com March 12, 2019. 2 Please see Fastmarkets MB’s Daily Steel, March 12, 2019. 3 Please see “Pervasive Uncertainty, Persuasive Central Banks,” published by BCA Research’s Global Fixed Income Strategy March 12, 2019. It is available at gfis.bcaresearch.com. 4 Please see “China Macro And Market Review,” published by BCA Research’s China Investment Strategy March 13, 2019. It is available at cis.bcaresearch.com. 5 See footnote 4 above. 6 For more details please see “EM: A Sustainable Rally Or A False Start?” published by BCA Research’s Emerging Market Strategy March 7, 2019. It is available at ems.bcaresearch.com. 7 Hamilton notes the HP filter can be problematic. In general, we agree with critics of the filter (i.e. it results in spurious dynamics that are unrelated with the true data-generating process, it has an end-point bias which affects its real-time properties, and it is highly dependent on the parameter selection). However, there are some arguments in support of using the HP filter to proxy the credit cycle. First, as long as there are no clear theoretical foundation for an accurate measurement of the credit cycle, empirical validation should remain the number one criteria by which one selects its proxy. Second, credit cycles vary in duration and this weakens the ability to construct a reliable proxy. The usual parameter used with the HP filter favors short-term cycles (i.e. ~ 2 years) while the Hamilton filter focuses on medium-term cycles (i.e. ~ 5 years). Therefore, both can convey useful information. Third, China’s aggregate credit variable in level has a quasi-linear trend and is roughly approximated by a trend-stationary process with breaks in the trend and constant. Such a process should converge in limit when decomposed using the HP filter. Please see James D. Hamilton (2018), “Why You Should Never Use the Hodrick-Prescott Filter,” The Review of Economics and Statistics, vol 100(5), pages 831-843. and Phillips, Peter C. B. and Jin, Sainan (2015), “Business Cycles, Trend Elimination, and the HP filter,” Cowles Foundation Discussion Paper No. 2005. 8 Granger causality refers to a statistical technique developed by Clive Granger, the 2003 Nobel Laureate in Economics, which is used to determine whether one variable can be said to have caused (or predicted) another variable, given the past performance of each. Using standard econometric techniques, Granger showed one variable can be shown to have “caused” another, and that two-way causality also can be demonstrated (i.e., a feedback loop between the variables can exist based on the historical performance of each). 9 Please see “Oil, Copper Demand Worries Are Overdone,” published by BCA Research’s Commodity & Energy Strategy February 14, 2019. It is available at ces.bcaresearch.com. Investment Views and Themes Recommendations Strategic Recommendations Tactical Trades Commodity Prices and Plays Reference Table Trades Closed in 2019 Summary of Trades
Image
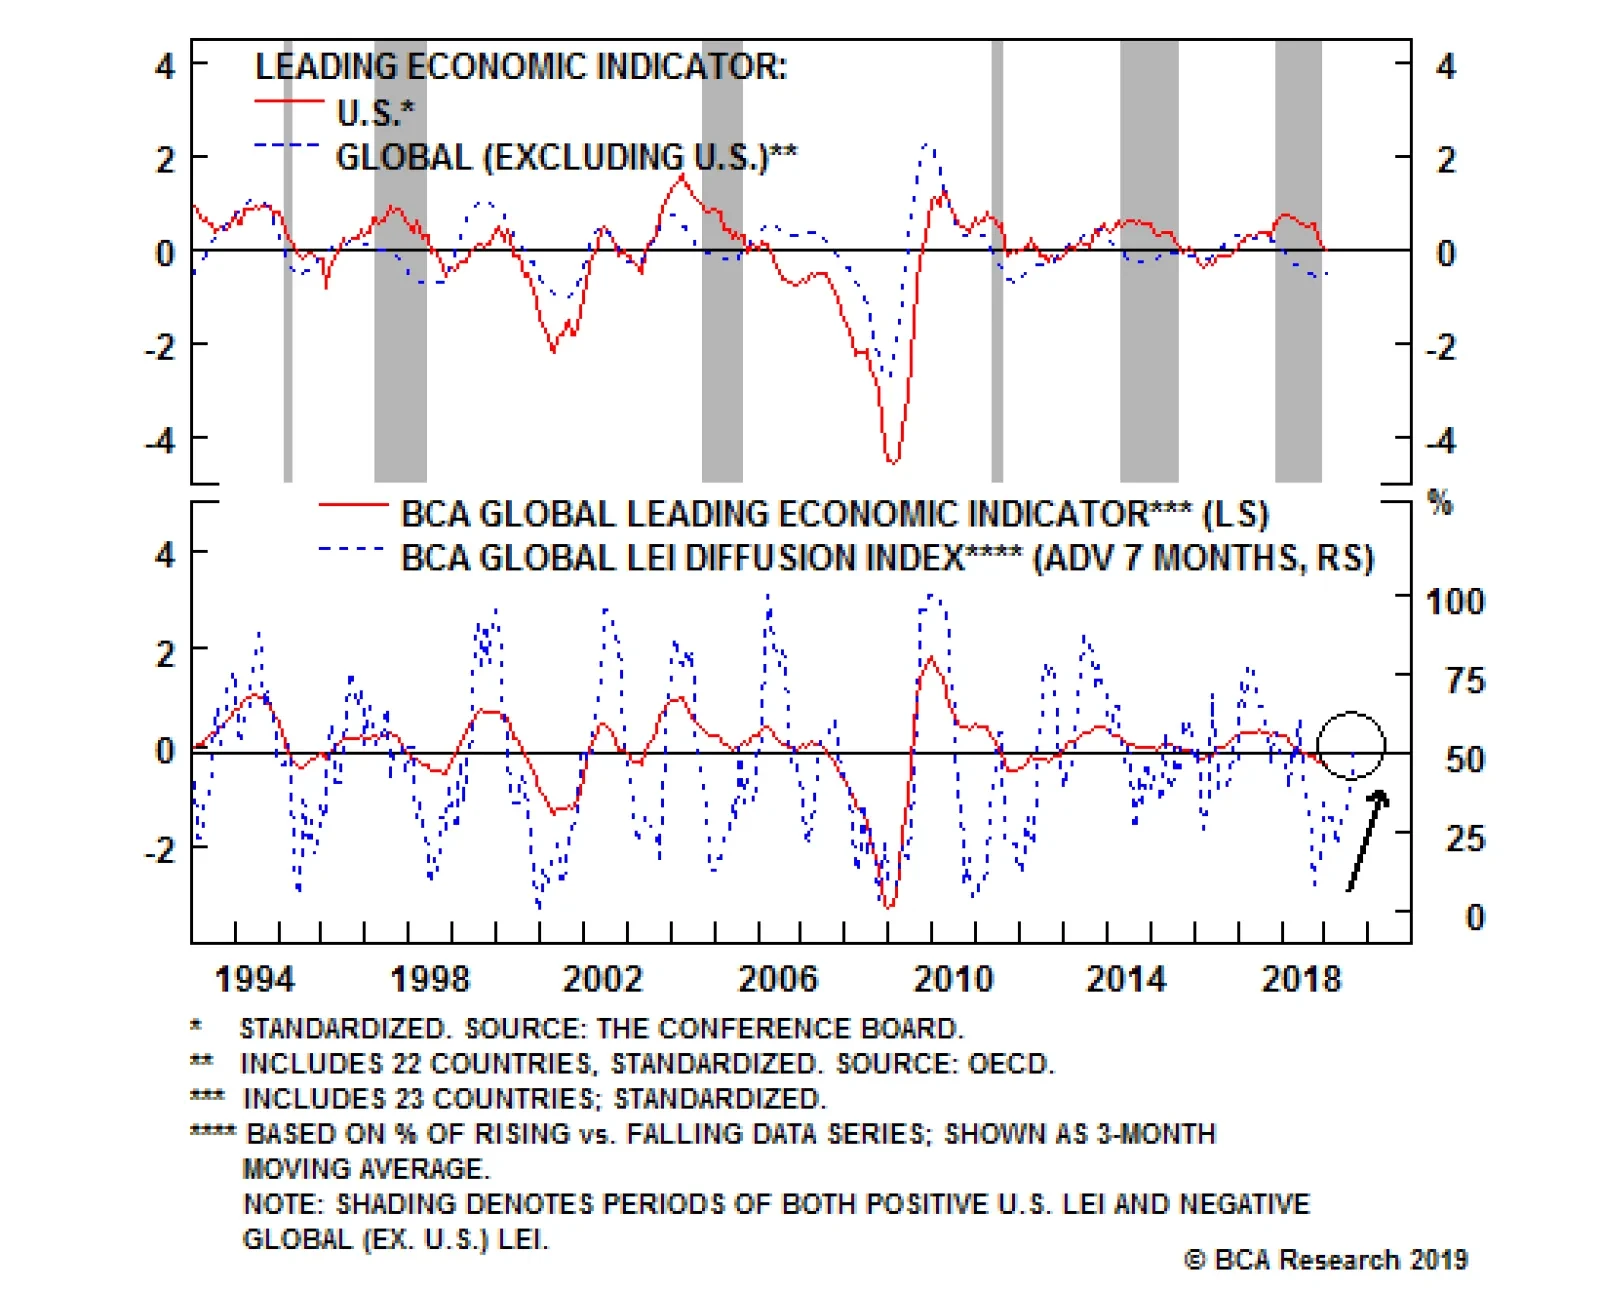
Since 1994 the Global (ex. U.S.) Leading Economic Indicator (LEI) has contracted relative to its 12-month trend six times. In all six episodes it eventually dragged the U.S. LEI down with it. The U.S. economy cannot remain an oasis of prosperity when the rest…