Global
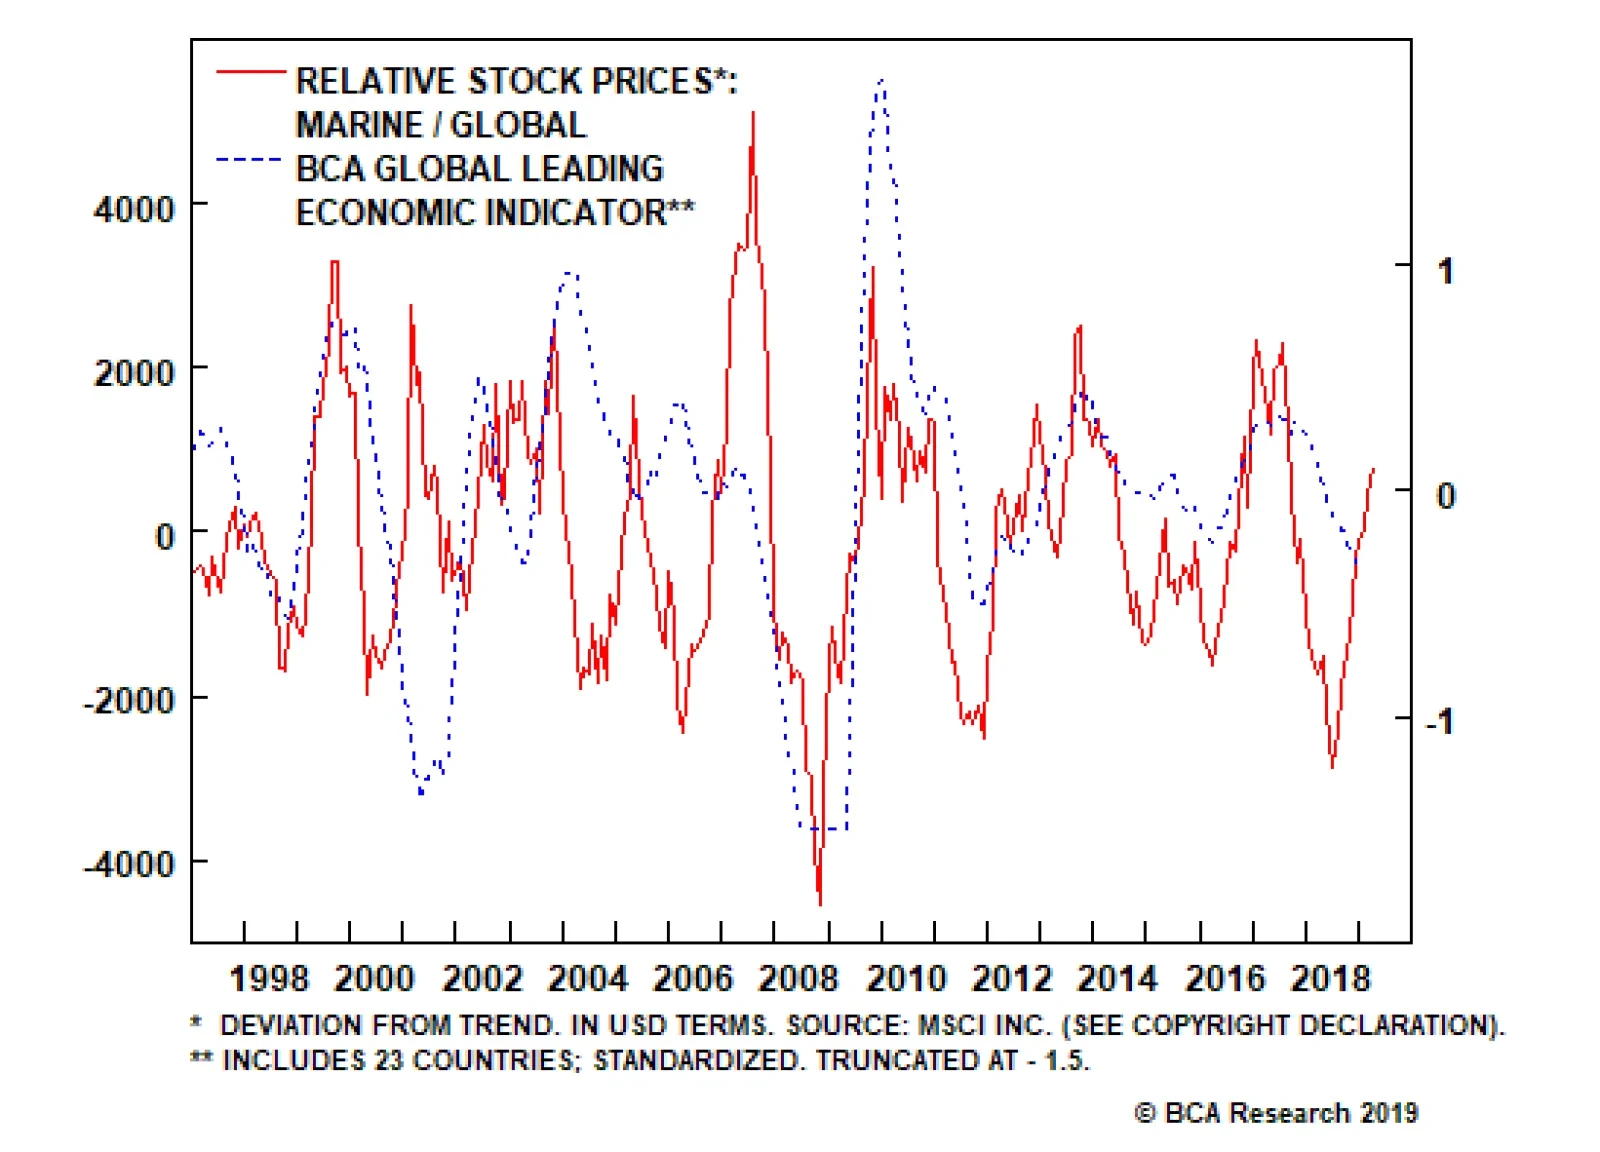
Railway stocks may still give us a read on the state of the U.S. economy, but they are too localized to provide a genuine read on the global economy. The stocks of companies shipping goods across the world better fit this role in today’s globalized…
Fears over slowing global growth, persistent geopolitical uncertainty and underwhelming inflation have put policymakers on a more cautious footing. Our Global Fixed Income Strategy team’s measure of 10-year government bond yields in the largest developed…
The Outlook For Financial Conditions & Global Growth
…

Highlights Duration: None of the economic indicators that have reliably signaled peak interest rates in prior cycles are sending a signal at the moment. This leads to the inevitable conclusion that further Fed rate hikes are likely at some point before the end of the cycle. With the Fed now projecting an essentially flat path for interest rates, the next surprise from the Federal Reserve will probably be a hawkish one. Fed: The Fed is currently waging a war on two fronts. It wants to keep interest rates low enough to send inflation expectations higher, back to levels consistent with its 2% target. But it also wants to avoid excessively easy financial conditions that could threaten the sustainability of the economic recovery. We expect that easier financial conditions will cause the Fed to shift back toward a tightening bias near the end of this year. Yield Curve: Inversion of the 3-month/10-year Treasury slope is cause for concern, if it persists. But we expect it to reverse in the coming months as global growth recovers and the Fed remains accommodative. Eventually, after financial conditions have eased sufficiently, the Fed’s next move will be a hawkish surprise. Investors can profit from this move by entering positive carry yield curve trades: short the 5-year or 7-year bullet and go long a duration-matched barbell. Feature The Last Dovish Surprise Or The Beginning Of The End? Treasury yields moved sharply lower following last week’s Fed meeting, as FOMC participants made larger-than-anticipated downward revisions to their interest rate projections. As of last December, 11 out of 17 Fed members expected to lift rates at least twice in 2019. Now, 11 out of 17 expect to keep rates flat (Chart 1). Chart 1Fed Sees No Hikes This Year
Fed Sees No Hikes This Year
Fed Sees No Hikes This Year
Judging from the bond market’s reaction, the Fed clearly managed to deliver a dovish surprise at last week’s meeting. Now, the relevant question for investors becomes whether that dovish surprise can be repeated. With the Fed signaling an essentially flat path for interest rates, a dovish surprise from these levels would involve the suggestion of rate cuts. History tells us that rate cuts are only likely to occur if the economy is headed into recession, an event that still seems relatively far off. As such, we expect that the next surprise from the Fed will be a hawkish one, and that the next large move in Treasury yields will be higher. Our conviction that the economy is not yet close to recession comes from our analysis of economic markers that have reliably signaled peak interest rates in past cycles.1 For example, one such marker is when year-over-year nominal GDP growth falls below the 10-year Treasury yield (Chart 2). At present, year-over-year nominal GDP growth is running at 5.3%. That growth rate is bound to slow during the next few quarters, but it would need to slow a lot before it falls below the current 10-year Treasury yield of 2.40%. Chart 2GDP Growth Suggests That Monetary Policy Remains Accommodative
GDP Growth Suggests That Monetary Policy Remains Accommodative
GDP Growth Suggests That Monetary Policy Remains Accommodative
The New York Fed’s GDP Nowcast projects that real GDP growth will be 1.29% in the first quarter. Incorporating 2% inflation, that is roughly 3.3% in nominal terms. If Q1 turns out to be the trough in growth for the year, it suggests that interest rates still have considerable room to rise before the economic recovery ends. Second, we have observed that peak interest rates tend to coincide with material declines in the 12-month moving averages of single-family housing starts and new home sales. While the housing data weakened somewhat in 2018, the data have rebounded sharply since mortgage rates fell near the end of last year. Housing starts have already jumped back above their 12-month moving average, as has the weekly Mortgage Application Purchase index (Chart 3). Chart 3Housing & Employment Support Higher Rates
Housing & Employment Support Higher Rates
Housing & Employment Support Higher Rates
Finally, we have noted that peak interest rates tend to coincide with an uptrend in initial jobless claims. Much like with housing, the initial claims data sent a warning near the end of last year. But that tentative increase in claims has already reversed course (Chart 3, bottom panel). None of those historically reliable indicators suggest that we have reached peak interest rates for the cycle. We will continue to keep a close eye on nominal GDP growth, the housing data and initial jobless claims. But all in all, none of those historically reliable indicators suggest that we have reached peak interest rates for the cycle. This leads to the inevitable conclusion that further Fed rate hikes are likely at some point and that the next surprise from the Federal Reserve will probably be a hawkish one. Given this skewed risk/reward trade-off, we recommend that investors maintain below-benchmark duration in U.S. bond portfolios on the view that the next large move in Treasury yields will be higher. The difficult part is timing when that move will occur. In the remainder of this report we provide some thoughts on how to think about that timing, and also some trade ideas that should be profitable in the meantime. The New Battleground: Inflation Expectations Vs. Financial Conditions Recent remarks from Fed Chairman Jerome Powell and other FOMC participants have made it clear that an important rationale for the Fed’s pause is a desire to re-anchor inflation expectations at a level closer to the Fed’s target. For example, here is Chairman Powell from last week’s press conference: So, if inflation expectations are below two percent, they’re always going to be pulling inflation down, and we’re going to be paddling upstream and trying to, you know, keep inflation at two percent … And here is what the Chairman said about inflation expectations in his recent congressional testimony: In our thinking, inflation expectations are now the most important driver of actual inflation. With that in mind, consider that long-maturity TIPS breakeven inflation rates have been below “well anchored” levels for pretty much the entire post-crisis period, as have long-term inflation expectations from the University of Michigan Consumer survey (Chart 4). Chart 4The Fed Wants Higher Inflation Expectations
The Fed Wants Higher Inflation Expectations
The Fed Wants Higher Inflation Expectations
The Fed has clearly made the re-anchoring of inflation expectations a priority, meaning that we should monitor TIPS breakeven inflation rates and survey measures of inflation expectations to assess when rate hikes might re-start. However, we don’t think that higher inflation expectations are absolutely necessary before the Fed resumes hiking. Consider what Fed officials were saying as recently as December: Governor Lael Brainard on December 7, 2018:2 The last several times resource utilization approached levels similar to today, signs of overheating showed up in financial-sector imbalances rather than in accelerating inflation. Chairman Powell on June 20, 2018:3 Indeed, the fact that the two most recent U.S. recessions stemmed principally from financial imbalances, not high inflation, highlights the importance of closely monitoring financial conditions. In other words, until recently the Fed seemed more concerned with financial conditions than with inflation expectations. What changed? Quite simply, financial markets sold off and financial conditions no longer appear excessively easy (Chart 5). Chart 5The Fed Doesn’t Want An Asset Bubble
The Fed Doesn’t Want An Asset Bubble
The Fed Doesn’t Want An Asset Bubble
The Financial Conditions component of our Fed Monitor remains “easier” than its historical average, but shows that conditions have tightened significantly since last October (Chart 5, top panel). Junk spreads have widened since last October (Chart 5, panel 2), as has the excess corporate bond risk premium after accounting for expected default risk (Chart 5, panel 3). 4 The S&P 500’s 12-month forward Price/Earnings ratio is down to 16.5, from 17 last October and a 2018 peak of 18.8 (Chart 5, bottom panel). If financial markets rally during the next few months, then it is quite possible that financial conditions will once again force the Fed’s hand. In essence, financial asset valuations appear somewhat reasonable and are not an immediate cause for concern. This means that the Fed can turn its attention toward trying to drive inflation expectations higher. However, if financial markets rally during the next few months, then it is quite possible that financial conditions will once again force the Fed’s hand. The Outlook For Financial Conditions & Global Growth The Fed’s dovish policy shift should support a rally in risk assets in the coming months, though such a rally may also require evidence of improvement in global growth. Right now that evidence is scant. March Flash PMIs for the U.S. and Eurozone both fell last week, while Japan’s stayed flat below the 50 boom/bust line. This means that the Global Manufacturing PMI’s downtrend will almost certainly continue when the final March data are released next week (Chart 6). Chart 6Global Growth Is Weak ...
Global Growth Is Weak ...
Global Growth Is Weak ...
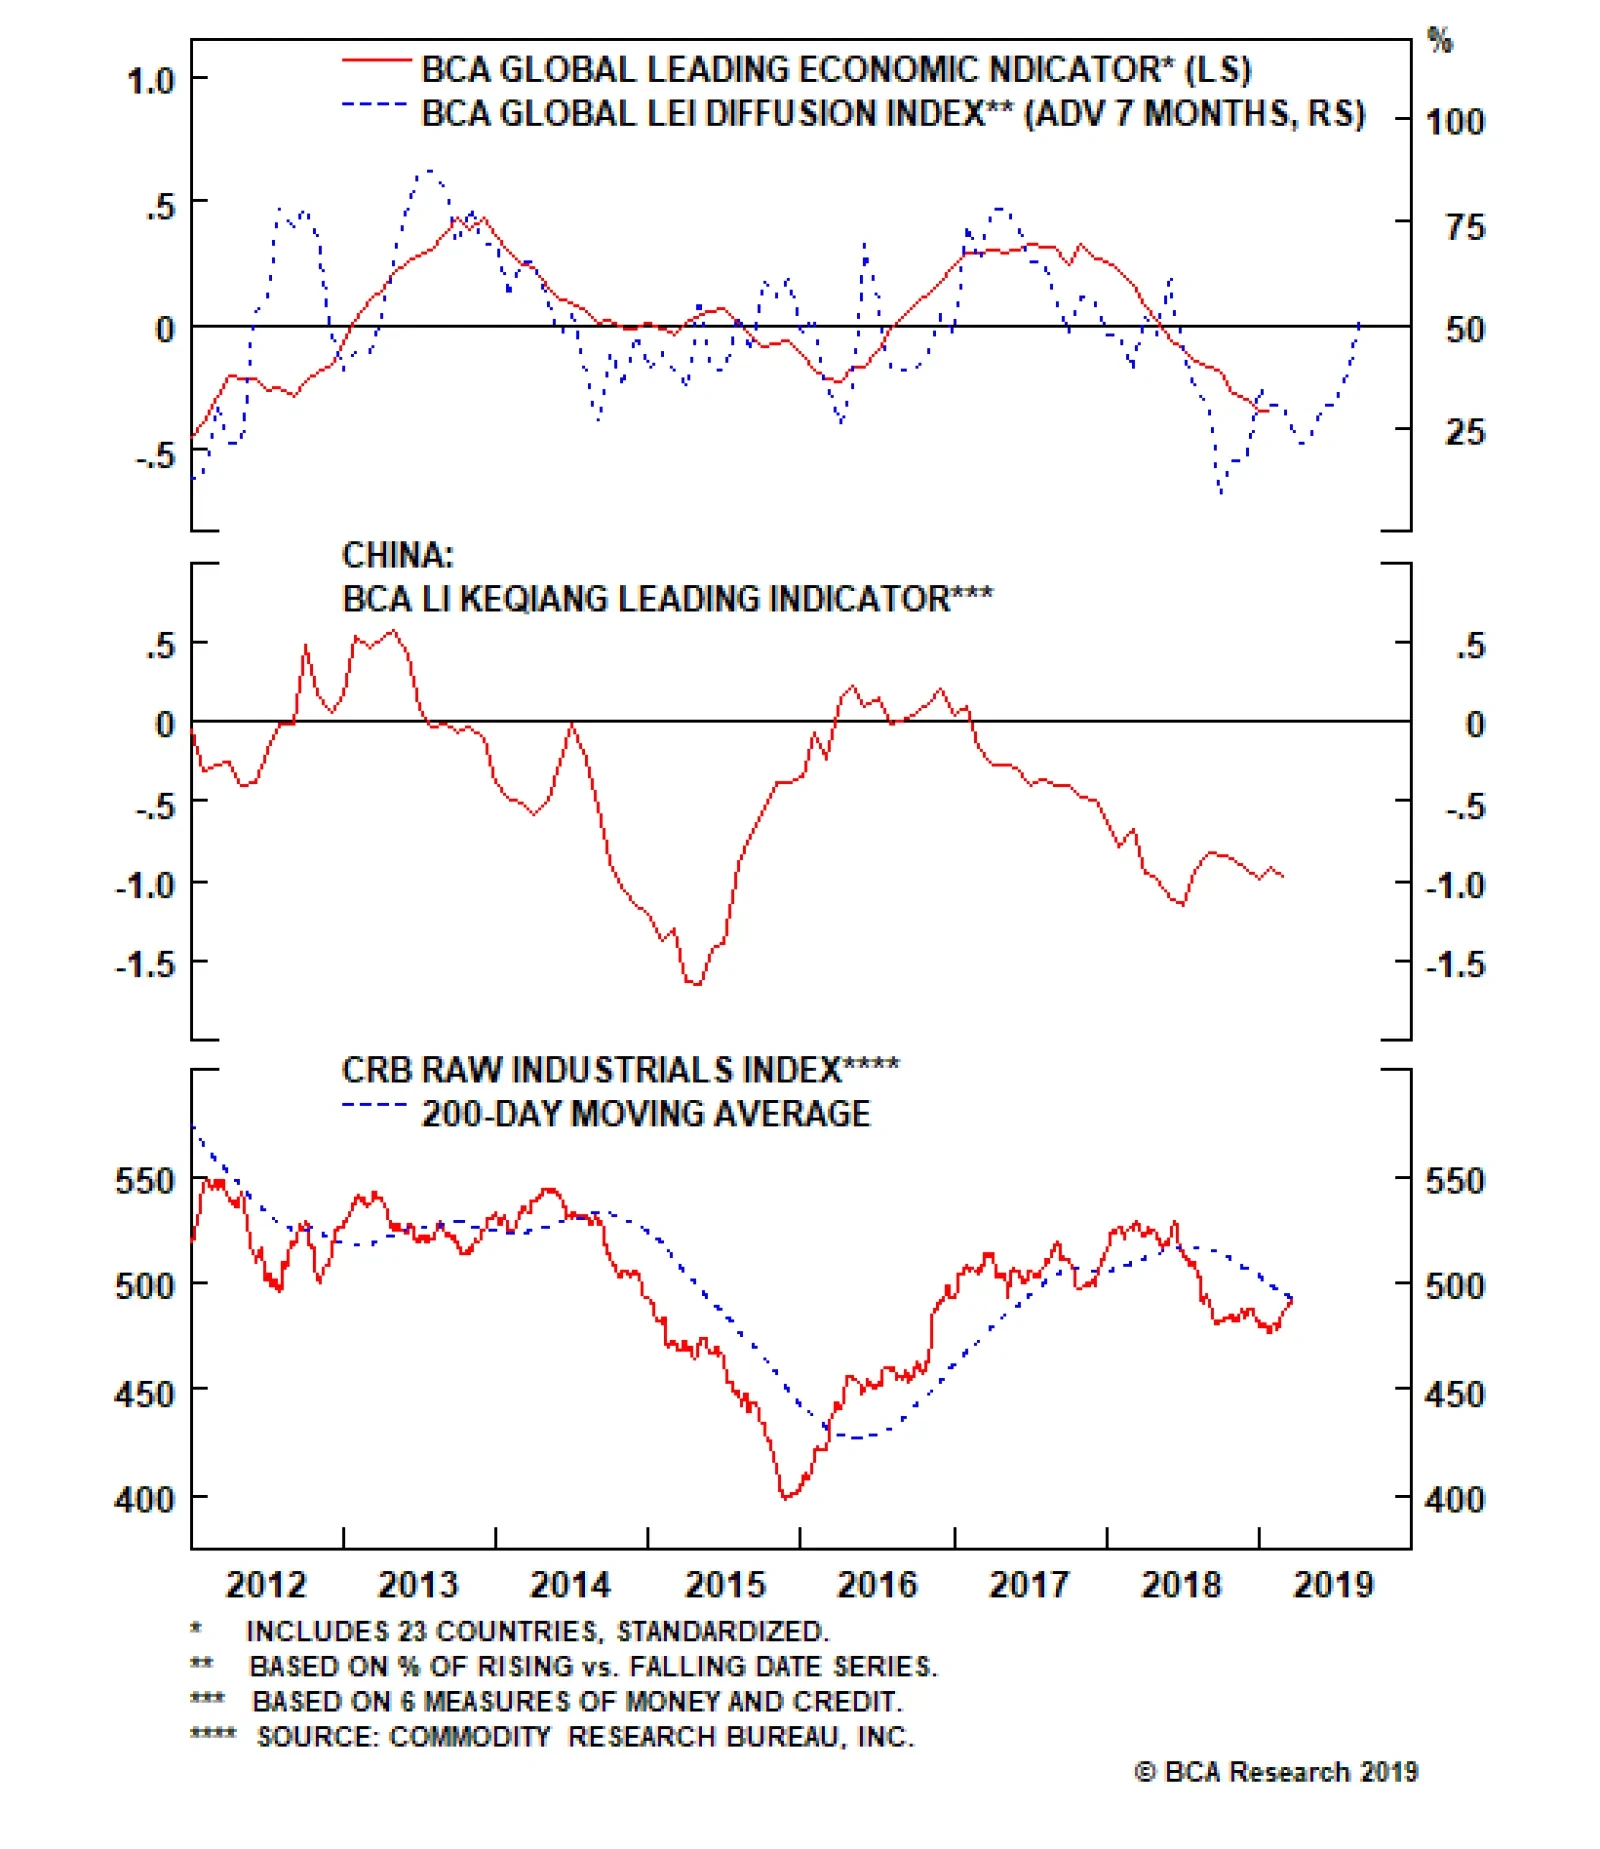
However, while the coincident PMI data continue to soften, we have recently noticed some green shoots in leading global growth indicators (Chart 7). Chart 7... But Leading Indicators Are Improving
... But Leading Indicators Are Improving
... But Leading Indicators Are Improving
First, our Global Leading Economic Indicator (LEI) Diffusion Index has moved above 50%, meaning that a majority of countries are seeing improvement in their LEIs for the first time since early 2018 (Chart 7, top panel). Second, our China Investment Strategy service’s Li Keqiang Leading Indicator – a composite of six indicators of Chinese money and credit growth – has stabilized. While a 2016-style surge in credit growth is unlikely, even a stabilization in this leading indicator will help prop up global growth in 2019 (Chart 7, panel 2). We do not think that 3-month/10-year curve inversion will last very long. Finally, the CRB Raw Industrials index has rebounded smartly during the past few weeks, and is now threatening to break above its 200-day moving average (Chart 7, bottom panel). Investment Implications The Fed is currently waging a war on two fronts. It wants to keep interest rates low enough to send inflation expectations higher, back to levels consistent with its 2% target. But it also wants to avoid excessively easy financial conditions that could threaten the sustainability of the economic recovery. Asset prices are not extended at the moment, so the Fed can maintain an accommodative policy focused on driving inflation expectations higher. However, at some point the combination of accommodative policy and improving global growth will cause the Fed’s attention to turn back toward financial conditions. That will put rate hikes back on the table and send Treasury yields higher. Timing when that shift will occur is difficult, which is why we recommend that investors enter positive carry yield curve trades to boost returns while we await a hawkish surprise from the Fed later this year (see next section). What The Yield Curve Is Telling Us The Fed’s dovish surprise sent Treasury yields lower last week and also led to significant changes in the shape of the yield curve. In particular, investors have focused on the fact that the 10-year yield is now below the 3-month T-bill rate. That focus is not surprising, given that curve inversion has been a reliable leading indicator of recession in past cycles. We use the 2-year/10-year and 3-year/10-year slopes in our research into the phases of the cycle (Chart 8), and while both of those slopes remain positive – consistent with a “Phase 2” environment – we will keep a close eye on the 3-month/10-year slope in the coming weeks.5 Historically, inversion of the different curve segments has occurred at around the same time. Chart 8Still In Phase 2
Still In Phase 2
Still In Phase 2
Given that the Fed has already signaled a much more dovish policy stance and that global growth is likely to improve later this year, we do not think that 3-month/10-year curve inversion will last very long. However, if we are wrong and the 2-year/10-year and 3-year/10-year slopes are eventually pulled down into negative territory, then we may have to re-visit some of our asset allocation positions. But for now, we find the 5-year and 7-year maturities to be the most interesting points on the yield curve (Chart 9). In fact, the 5-year and 7-year yields are so low that investors can earn more yield by entering duration-matched barbells consisting of the long and short ends of the curve. For example, the 5-year Treasury note offers a lower yield than a duration-matched barbell consisting of the 2-year and 10-year notes. Similarly, the 7-year note offers less yield than a duration-matched barbell consisting of the 2-year note and 30-year bond (Chart 10).
Chart 9
Chart 10Barbells Are Positive Carry
Barbells Are Positive Carry
Barbells Are Positive Carry
Further, we have also observed that the 5-year and 7-year yields are most sensitive to changes in 12-month rate hike expectations. Chart 11 shows that when our 12-month discounter rises, the yield curve tends to steepen out to the 7-year maturity, and flatten thereafter. This means that the 5-year and 7-year yields have the most upside when rate hikes are eventually priced back into the curve. Chart 11Yield Curve Correlations
Yield Curve Correlations
Yield Curve Correlations
Taken together, positive carry in the barbells and the sensitivity of 5-year and 7-year yields to 12-month rate expectations mean that investors should enter short positions in the 5-year or 7-year notes today, offset by long positions in duration-matched barbells (eg. the 2/10 or 2/30). These trades will earn significant capital gains when the Fed ultimately delivers a hawkish surprise, sending the 5-year and 7-year yields higher, and will also earn positive carry in the meantime, while we wait for financial conditions to ease enough to shift the Fed’s reaction function. We have also observed that the 5-year and 7-year yields are most sensitive to changes in 12-month rate hike expectations. These long barbell / short 5-year or 7-year bullet positions will only lose money if the market prices-in further rate cuts going forward. With the market already priced for 32 bps of cuts during the next 12 months, a further decline would be consistent with economic recession. This remains the least likely scenario. Bottom Line: Inversion of the 3-month/10-year Treasury slope is cause for concern, if it persists. But we expect it to reverse in the coming months as global growth recovers and the Fed remains accommodative. Eventually, after financial conditions have eased sufficiently, the Fed’s next move will be a hawkish surprise. Investors can profit from this move by entering positive carry yield curve trades: short the 5-year or 7-year bullet and go long a duration-matched barbell. Ryan Swift, U.S. Bond Strategist rswift@bcaresearch.com Footnotes 1 Please see U.S. Bond Strategy Weekly Report, “Running Room,” dated January 29, 2019, available at usbs.bcaresearch.com 2 https://www.federalreserve.gov/newsevents/speech/brainard20181207a.htm 3 https://www.federalreserve.gov/newsevents/speech/powell20180620a.htm 4 The Gilchrist and Zakrajsek (GZ) Excess Bond Premium is a measure of the excess spread available in a sample of nonfinancial corporate bonds, after removing a bottom-up estimate of expected default losses for each security. Default losses are estimated based on the Merton Default model, using each firm’s market value of equity and face value of debt. https://www.federalreserve.gov/econresdata/notes/feds-notes/2016/files/… 5 Our research into the different phases of the cycle based on the slope of the yield curve can be found in U.S. Bond Strategy Special Report, “2019 Key Views: Implications For U.S. Fixed Income,” dated December 18, 2018, available at usbs.bcaresearch.com Fixed Income Sector Performance Recommended Portfolio Specification
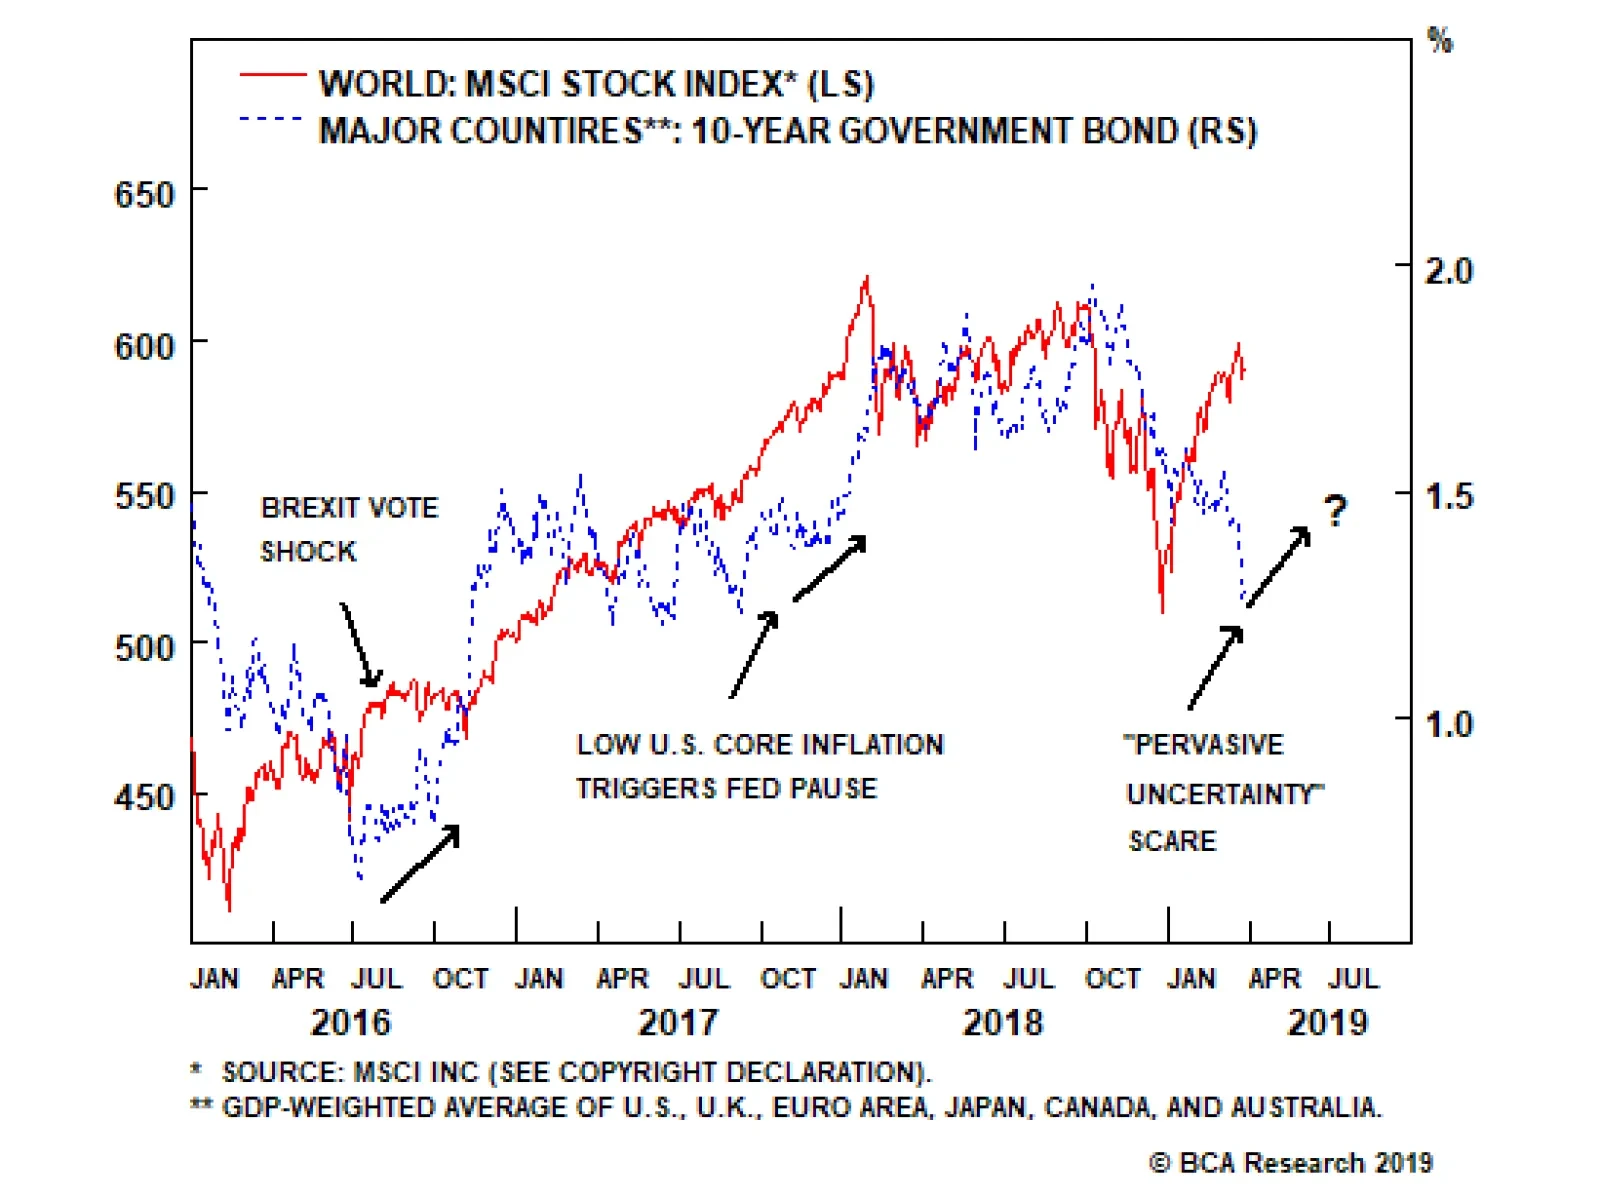
Highlights Dovish Central Banks: Central bankers have successfully talked down bond yields, in an effort to prevent an even deeper pullback in global growth. Government bonds now look overvalued relative to likely outcomes on growth and inflation over the next year. A moderate below-benchmark medium-term duration exposure is warranted on a risk/reward basis, as the next large yield move from current levels is more likely up than down. U.S. Treasuries: The Fed is now signaling no more rate hikes for the rest of 2019, but this newly dovish language merely brings their own interest rate forecasts closer to current market pricing. Lower bond yields and easier financial conditions will help underwrite a recovery in U.S. growth, just as a stabilization of the global economy is starting to materialize. The current downturn in Treasury yields, which is looking technically stretched, should soon begin to bottom out. Feature Another Panic Hits Global Bond Markets The message from central banks to the financial markets is now very loud and clear – global monetary policy is firmly on hold for at least the rest of 2019. Fears over slowing global growth, persistent geopolitical uncertainty and underwhelming inflation have put policymakers on a more cautious footing. The messaging from central banks has become highly synchronized, with even the same buzz words (“patience”, “uncertainty”, “data dependent”) being bandied about in speeches and policy statements. Bond yields have responded to the dovish forward guidance in recent weeks from the Fed, the European Central Bank, the Bank of England, the Bank of Japan and others. Our “Major Countries” measure of 10-year government bond yields in the largest developed economies has fallen to 1.3%, the lowest level since May 2017. The 10-year U.S. Treasury yield now sits at 2.40%, below the fed funds rate and triggering investor angst over the traditionally negative economic message of an inverted yield curve. Global equity markets, however, seem less concerned. The MSCI World Equity Index is only 5% from the 2018 highs after rallying 16% so far from the late 2018 low. This gap between robust equity prices and depressed bond yields is unusual, but not unprecedented. Similar divergences have occurred as recently as 2016 and 2017 (Chart of the Week). During those episodes, central banks responded to uncertainty (the July 2016 Brexit vote followed by currency volatility in China) or sluggish inflation readings (the unexpected 2017 dip in U.S. core inflation) by shifting to an easier monetary stance. This was largely done through delayed interest rate hikes or more dovish forward guidance, with the result being lower bond yields, diminished market volatility and easier financial conditions. Better global growth and more stable inflation expectations soon followed. Chart of the WeekWill Bonds Lose This Battle Once Again?
Will Bonds Lose This Battle Once Again?
Will Bonds Lose This Battle Once Again?
With tentative signs emerging that global growth momentum is bottoming out, the next major move in global bond yields is likely up. Those prior gaps between low bond yields and high stock prices were eventually resolved through higher yields – an outcome that we think will be repeated in the current episode. Already, bond markets have aggressively repriced expectations of future monetary policy with even some rate cuts now discounted in the U.S., Canada and Australia. With tentative signs emerging that global growth momentum will soon bottom out and recover in the latter half of 2019 (Chart 2), the next major move in global bond yields is likely up, not down. Chart 2Global Bond Yields Are Too Pessimistically Priced
Global Bond Yields Are Too Pessimistically Priced
Global Bond Yields Are Too Pessimistically Priced
The decline in yields over the past few months has obviously challenged our recommended strategic below-benchmark global duration stance. The two primary factors that drive our medium-term duration calls on any country can be summed up by the following questions: Do we expect greater or fewer rate hikes than are discounted in money market curves? Do we expect bond yields to rise above or below the current pricing in forward yield curves? In aggregate, we do not expect the major central banks to deliver more monetary easing than is currently priced according to our 12-month discounters, although we think that is most likely in the U.S. where the market is pricing in -21bps of cuts over the next year. Also, the 12-month-ahead forwards for 10-year bond yields in the U.S. (2.51%), Canada (1.69%), Germany (0.13%), Japan (0.02%), U.K. (1.16%) and Australia (1.82%) are not particularly high. Although, once again, we have the greatest confidence that those yield levels will be surpassed in the U.S. The timetable to generate a positive payoff by positioning for higher yields has been stretched out by the renewed dovishness of central banks. By switching their focus from tight labor markets and accelerating wage growth to slowing economies and softening inflation expectations, policymakers are creating a backdrop of lower volatility and more market-friendly stock/bond correlations (Chart 3). Chart 3Stock/Bond Yield Correlation Negative Once Again
Stock/Bond Yield Correlation Negative Once Again
Stock/Bond Yield Correlation Negative Once Again
The goal is to underwrite additional rallies in risk assets to ease financial conditions and stimulate economic activity. This will eventually sow the seeds for a return to a more hawkish bias, but the timing of that switch is uncertain and will most likely coincide with some evidence of faster Chinese economic growth and an end to the downturn in global trade activity – an outcome that is unlikely to occur until the latter half of 2019. Bottom Line: Central bankers have successfully talked down bond yields, in an effort to prevent an even deeper pullback in global growth. Government bonds now look overvalued relative to likely outcomes on growth and inflation over the next year. A moderate below-benchmark medium-term duration exposure is warranted on a risk/reward basis, as the next large yield move from current levels is more likely up than down. The Fed’s more dovish forward guidance only brought the Fed’s rate forecasts down closer to current market pricing. U.S. Treasury Yields Should Soon Bottom Out U.S. Treasury yields moved sharply lower following last week’s Fed meeting, as the FOMC delivered a dovish surprise with its new set of interest rate projections. As of last December, 11 out of 17 Fed members expected to lift rates at least twice in 2019. Now, 11 out of 17 expect to keep rates flat. This was enough to lower the median “dot” by 50bps for 2019, essentially forecasting an unchanged funds rate this year with only one hike expected in 2020. While these are significant dovish changes to the Fed’s forward guidance, it only brought the Fed’s forecasts down to current market pricing on interest rate expectations (Chart 4). Yet bond yields fell sharply in response, tipping the Treasury curve into inversion. The cautious language from Fed Chairman Powell in the post-meeting press conference, which included a reference to Japan-style deflation risks as a threat if the Fed ignored the message from below-target U.S. inflation expectations, likely helped fuel the bullishness of Treasury market participants. Chart 4Fed Is Just Catching Up To Market Pricing
Fed Is Just Catching Up To Market Pricing
Fed Is Just Catching Up To Market Pricing
It seems clear that the arguments of the more dovish members of the FOMC (John Williams, Richard Clarida, James Bullard, Neil Kashkari) have won over the more pragmatic members of the committee, including Jay Powell. Yet our own Fed Monitor is still not suggesting that rate cuts are necessary (Chart 5), although the growth component of the Monitor is tracking the last downturn seen in 2014/15. More importantly, the inflation elements of the Monitor are not pointing to a need for easier policy, while financial conditions are still in the “tighter money required” zone. Chart 5Markets Pricing In Fed Easing That Is Not Required
Markets Pricing In Fed Easing That Is Not Required
Markets Pricing In Fed Easing That Is Not Required
The Fed is likely to ignore the risks to financial stability stemming from the new dovish slant to its monetary policy, as financial conditions have not yet fully unwound the tightening seen in the risk asset selloff in late 2018. Does that mean that the Fed wants to see U.S. equities hit new highs and U.S. corporate credit spreads return to previous lows? If that means a deeper U.S. economic slowdown can be avoided, the answer is most likely “yes”. They can always return to targeting overvalued asset markets if and when the U.S. and global economy is on more stable footing. In terms of the U.S. economic outlook, we think the current concerns over the recession risks stemming from an inverted Treasury curve are overstated. In a Special Report we published last July, we looked at the relationship between monetary policy, yield curves and economic growth and came to the following conclusions:1 Curve inversion, on a sustained basis, occurs when the Fed lifts the real (inflation-adjusted) funds rate above the neutral rate of interest, “r-star” (Chart 6); Chart 6Too Soon For Sustained U.S. Treasury Curve Inversion
Too Soon For Sustained U.S. Treasury Curve Inversion
Too Soon For Sustained U.S. Treasury Curve Inversion
Once the Treasury yield curve does invert on a sustained basis, a recession starts seventeen months later, on average; Curve inversion, on a sustained basis, occurs when the Fed lifts the real funds rate above the neutral rate of interest, “r-star” At the moment, the Fed has paused its rate hiking cycle with a real funds rate that is just shy of the Williams-Laubach estimate of r-star, which is 0.5%. Considering that the “Williams” in “Williams-Laubach” is the current president of the New York Fed and Number Two on the FOMC, we should not be surprised that the Fed chose to pause now! The more important point is that it seems too early to look for a classic late-cycle Treasury curve inversion with the Fed on hold – unless, of course, U.S. inflation falls and pushes the real fed funds rate above r-star. That would require a much sharper slowing of U.S. growth to a below-potential pace that is not indicated by current data. Reliable cyclical indicators like the ISM Manufacturing index have fallen from the heady 2018 peaks, but remain at levels consistent at least trend U.S. economic growth (Chart 7). Additionally, the Conference Board’s leading economic indicator, as well as our own models for U.S. employment and capital spending growth, are suggesting that only some cooling of U.S. growth should be expected in the next few quarters (Chart 8), but not to a below-potential pace (i.e. significantly less than 2%). Chart 7UST Yields Should Soon Stabilize
UST Yields Should Soon Stabilize
UST Yields Should Soon Stabilize
Chart 8A Big U.S. Slowdown In 2019 Is Unlikely
A Big U.S. Slowdown In 2019 Is Unlikely
A Big U.S. Slowdown In 2019 Is Unlikely
So how much lower can Treasury yields go in this current rally? Looking at the individual valuation components of yields, the answer is “not much”. The real component of Treasury yields has already fallen sharply since the 2018 peak, and is now approaching 2017 resistance levels. At the same time, 10-year inflation expectations are drifting higher and are now around 25bps below the highs seen in 2018 (Chart 9). At best, we can see real yields and inflation expectations fully offsetting each other and keeping yields unchanged. The more likely outcome, however, is that inflation expectations continue to move higher while real yields stabilize as the U.S. economy moves away from the Q1 growth slowdown, meaning that we are close to the floor in yields now. Chart 9Inflation Expectations Will Lead UST Yields Higher
Inflation Expectations Will Lead UST Yields Higher
Inflation Expectations Will Lead UST Yields Higher
How much lower can Treasury yields go in this current rally? Looking at the individual valuation components of yields, the answer is “not much”. The current downturn in Treasury yields is already looking stretched from a technical perspective (Chart 10). The 26-week total return of the Bloomberg Barclays U.S. Treasury index is now approaching the highs seen during all previous Treasury rallies since the Fed ended its QE program in 2014. The same signal comes from the size of the deviation of the 10-year Treasury yield below its 200-day moving average. Duration positioning is quite long, as well, according to the J.P. Morgan client survey. Chart 10UST Rally Looking Stretched In The Near-Term
UST Rally Looking Stretched In The Near-Term
UST Rally Looking Stretched In The Near-Term
Not all the technical indicators are as stretched, as the Market Vane Treasury sentiment survey remains depressed and net speculative positioning on 10-year Treasury futures is only neutral (after a very large short position was covered). On balance, however, the indicators suggest that the current Treasury rally is looking over-extended. One other factor to consider is global growth. Much of the current decline in Treasury yields is a result of the prolonged weakness in non-U.S. growth that has pulled down all global bond yields. Yet according to the latest readings from cyclical indicators like the ZEW survey, expectations of future economic growth are now bottoming out, even as current growth continues to slow (Chart 11). This bodes well for a potential bottoming of global growth momentum that could put a floor underneath bond yields. Chart 11Early Signs Of Growth Stabilization?
Early Signs Of Growth Stabilization?
Early Signs Of Growth Stabilization?
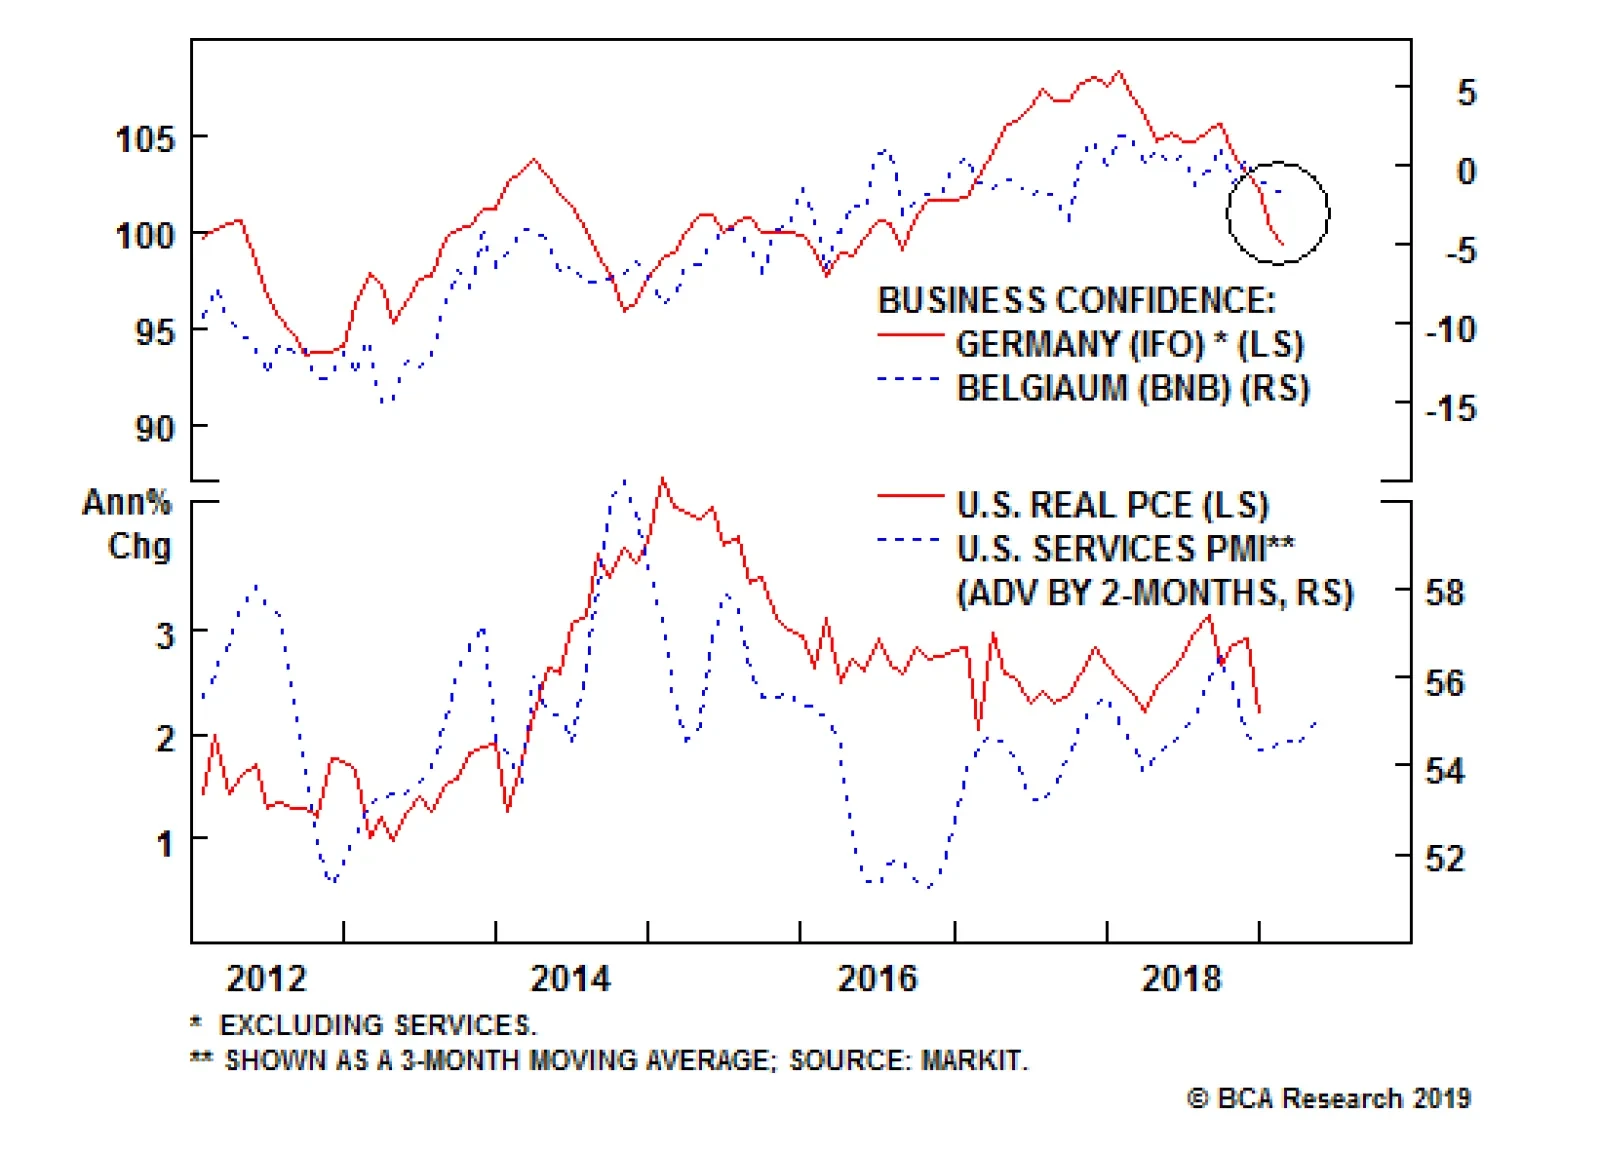
One final note – any signs of stabilization of European growth could also help global bond yields find a floor. Not only are the ZEW surveys in Europe starting to bottom out, the widely-followed German IFO survey is also starting to show modest improvement. If these trends continue, that would help end the drag on global yields from weakening European growth which has pulled German Bunds back to the 0% level (Chart 12). Chart 12Bunds & JGBs Have Been A Drag On Global Yields
Bunds & JGBs Have Been A Drag On Global Yields
Bunds & JGBs Have Been A Drag On Global Yields
Any signs of stabilization in European growth could also help global bond yields find a floor. Bottom Line: The Fed is now signaling no more rate hikes for the rest of 2019, but this newly dovish language merely brings their own interest rate forecasts closer to current market pricing. Lower bond yields and easier financial conditions will help underwrite a recovery in U.S. growth, just as a stabilization of the global economy is starting to materialize. The current downturn in Treasury yields, which is looking technically stretched, should soon begin to bottom out. Robert Robis, CFA, Chief Fixed Income Strategist rrobis@bcaresearch.com Footnotes 1 Please see BCA Global Fixed Income Strategy/U.S. Bond Strategy Special Report, “Three Frequently Asked Questions About Global Yield Curves”, dated July 31st, 2018, available at gfis.bcaresearch.com and usbs.bcaresearch.com. Recommendations The GFIS Recommended Portfolio Vs. The Custom Benchmark Index
Forward Guidance On Steroids
Forward Guidance On Steroids
Duration Regional Allocation Spread Product Tactical Trades Yields & Returns Global Bond Yields Historical Returns
Chinese manufacturing output continues to decelerate. Retail sales remain lackluster, with auto sales showing little evidence of improvement. Property prices are still rising, but floor space sold has begun to contract. Fixed-asset investment has held up so…
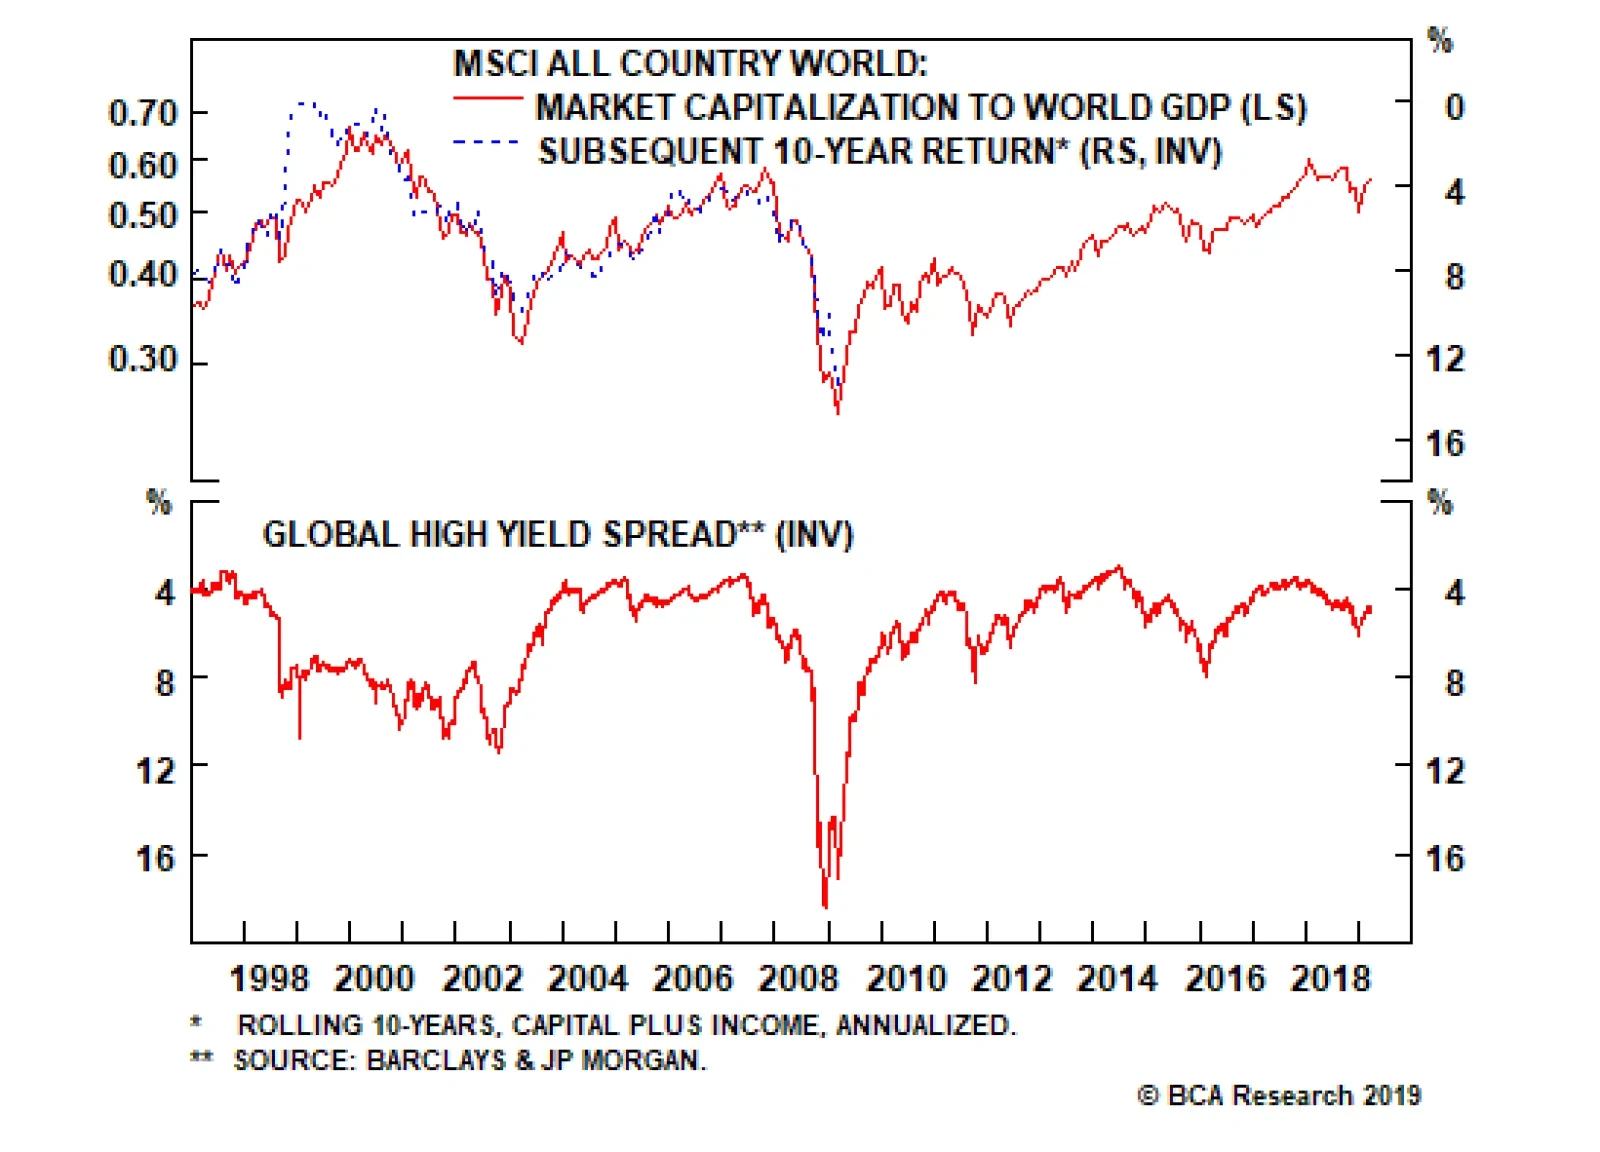
Previous episodes of elevated risk-asset valuations tended to be localized, either by geography or sector: 1990 was focused in Japan; 2000 was focused in the dot com related sectors; 2008 was focused in the U.S. mortgage and credit markets. By comparison,…
Highlights The FOMC managed to surprise investors at its March meeting after all, … : Everyone knew the Fed wasn’t going to hike rates last Wednesday, but the scope of the downward revision in the median dots was unexpected. … as it turns out that the median FOMC participant sees the pause as a lengthy hiatus: Not only does the median voter expect no rate hikes this year, s/he only expects one more in the entire tightening cycle. Rate-hike expectations have dwindled from three to a lonely one. The motivation for the Fed’s pivot is hardly crystal clear, … : The Fed may have turned more dovish because it fears the U.S. is losing momentum or that key major economies may be on the verge of a recession, it succumbed to pressure from the White House or financial markets, and/or it fears being unable to counter the next downturn. … but it looks to us like it has simply decided it can no longer stomach too-low inflation expectations: The zero lower bound will likely come into play when the next recession arrives, and higher inflation expectations will increase the Fed’s maneuverability by giving it the scope to reduce real rates more easily. Feature Wednesday’s FOMC meeting formalized the Fed’s turn to “patient” monetary policy. The dots revealed that the median FOMC participant’s estimates of the appropriate fed funds rate at year-end 2019 and 2020 are now 50 basis points lower than they were at the December meeting. At that meeting, the median participant expected the fed funds rate would be 2⅞% at the end of 2019, and 3⅛% at the end of 2020; the median participant now sees 2⅜% at the end of this year, the midpoint of the current 2.25 – 2.5% range, with a final hike to 2⅝% sometime in 2020. Uber-dovish St. Louis Fed President Bullard crowed in early January that the committee was starting to see things his way, and it seems that he was right. While presumably only Minneapolis President Kashkari voted with Bullard for no 2019 hikes in December, nine more participants came over to his side in the ensuing three months. The shift on the FOMC can be boiled down as follows: in December, two voters called for no hikes in 2019, and eleven called for a minimum of two hikes; in March, eleven voters called for no hikes, and two called for just two (Chart 1). The migration of nine out of seventeen voters from two or three hikes to zero hikes lopped 50 basis points off the FOMC’s median year-end projections through 2021, and has pushed our equilibrium fed funds rate model even further away from the consensus. What happened, and what does it mean for our S&P 500, Treasury and spread-product views?
Chart 1
What Made The Fed More Patient? Our real-time view of the Fed’s turn to patience in early January was that it was a logical response to the sharp, sudden tightening of financial conditions imposed by the fourth-quarter sell-off in stocks and corporate bonds (Chart 2). We didn’t create a regression model to try to put a precise number on what the tightening in financial conditions meant, but it seemed fair to assume that it equated to at least one 25-basis-point hike in the fed funds rate. If that was as conservative an estimate as we thought, the Fed’s only rational course was to step aside, given that the financial markets had already done a quarter or two of its work for it. Chart 2Markets Tightened For The Fed In 4Q
Markets Tightened For The Fed In 4Q
Markets Tightened For The Fed In 4Q
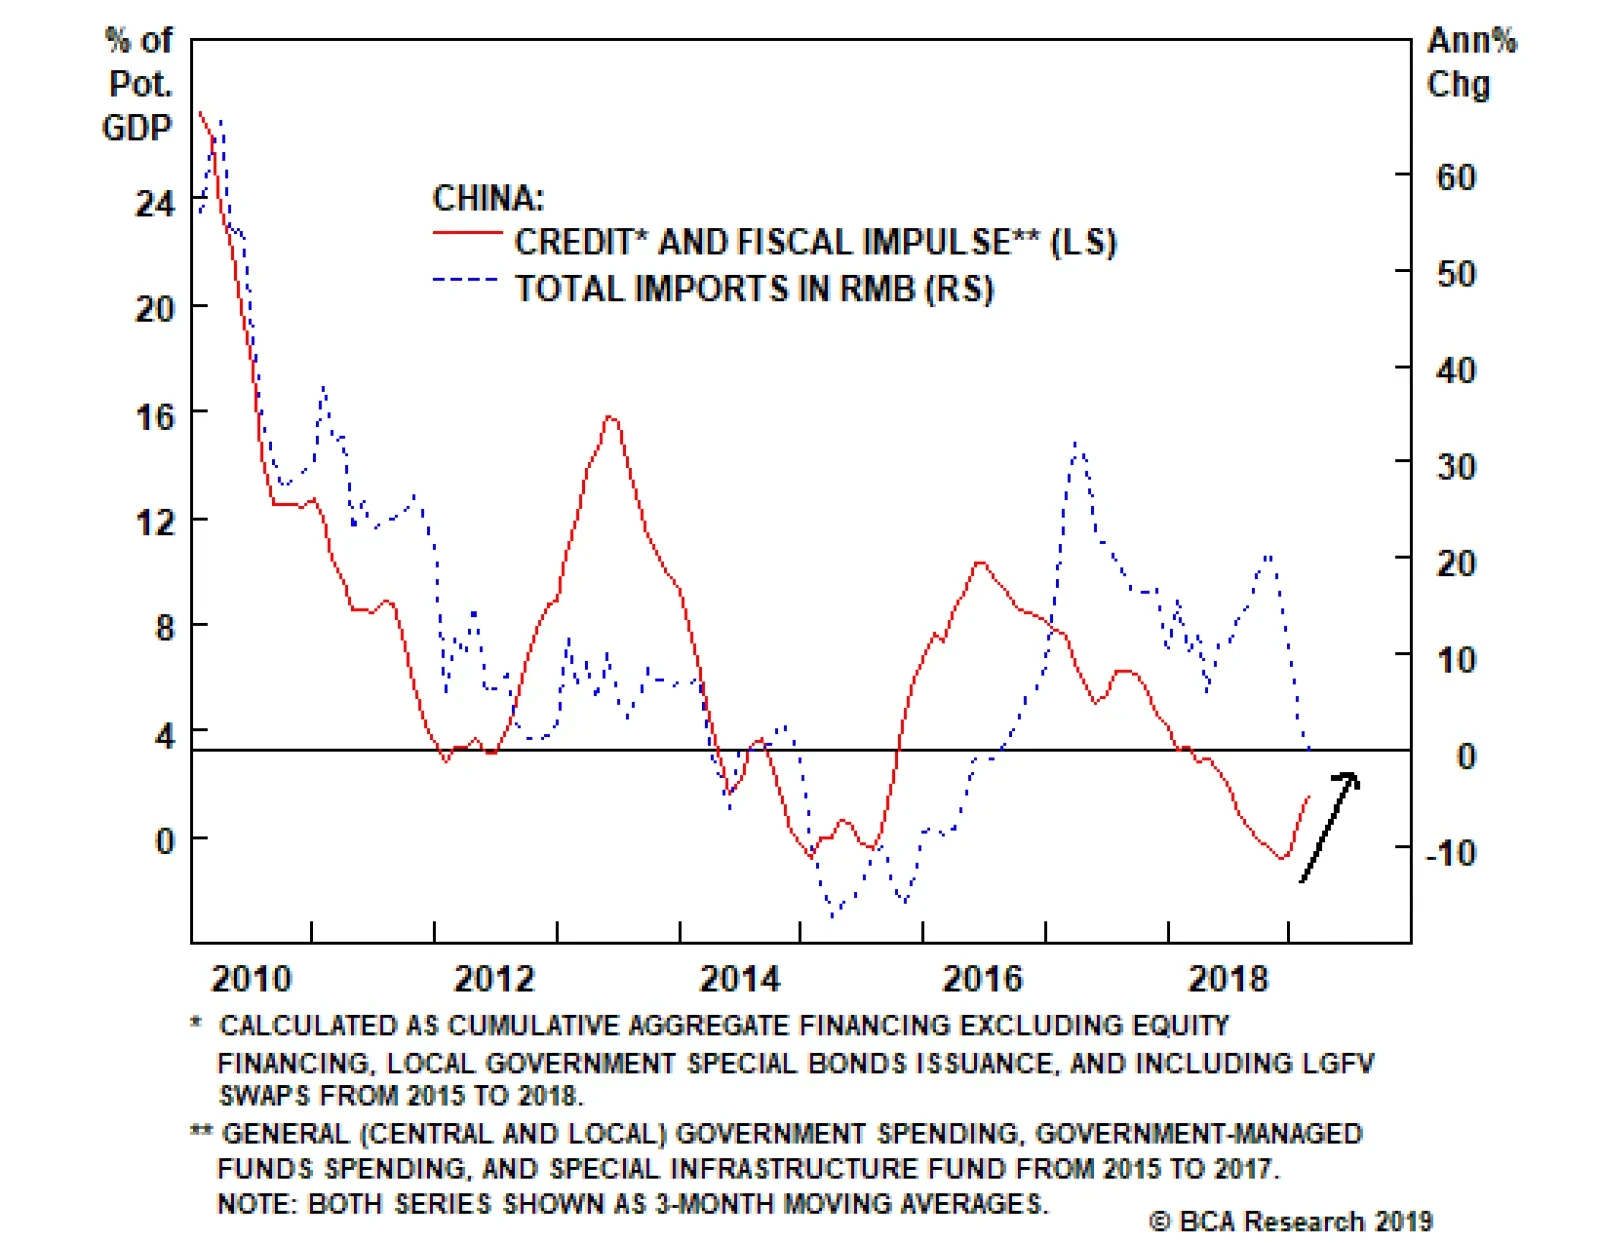
Slowing momentum in the rest of the world offered another reason for backing off. Chinese deceleration that began with domestic policymakers’ deleveraging drive has been exacerbated by the ongoing trade spat with the U.S. (Chart 3). Chinese imports are the most direct channel by which China impacts the rest of the world, and global trade has slid as China has decelerated (Chart 4). The first contraction in global export volumes since the global manufacturing slump in early 2016 has dragged on Europe, which took its 2018 cue from a soft China, rather than a robust U.S. Chart 3Deleveraging Started China's Slump ...
Deleveraging Started China's Slump ...
Deleveraging Started China's Slump ...
Chart 4... Which Was Felt Around The World
... Which Was Felt Around The World
... Which Was Felt Around The World
Within the U.S., ongoing data releases have fostered the notion that the Fed can well afford to be patient. Despite booming payroll expansion in December and January, which created 538,000 net new jobs, the unemployment rate ticked up to 4% from 3.7%.1 The data raised the possibility that there may be more labor market slack than previously estimated. Headline inflation is hardly alarming, though core measures that back out oil’s drag are hanging around the Fed’s 2% target (Chart 5). Chart 5Core Inflation Is Near Target, But Oil Has Weighed On Headline Inflation
Core Inflation Is Near Target, But Oil Has Weighed On Headline Inflation
Core Inflation Is Near Target, But Oil Has Weighed On Headline Inflation
Is The Phillips Curve Dead? Is it possible that the Fed could turn away from rate hikes when the unemployment rate is a tenth of a point above its lowest level since 1969? Does the Fed really think the Phillips Curve is so flat that even 50-year lows in unemployment aren’t going to boost wages? Has it abandoned the idea that inflation and the unemployment rate are inversely related once the economy reaches full employment? We don’t think so; as we argued in our recent Special Report on the Phillips Curve,2 we are convinced that the Fed’s belief in the relationship between unemployment and inflation remains intact. Every mainstream macroeconomic inflation model incorporates an inverse relationship with the unemployment rate. We fully accept that the Phillips Curve is kinked, and that the point where it inflects is dependent on estimates of the unobservable natural rate of unemployment (NAIRU), but the economics profession has no widely accepted model that does not take as given the notion that sub-NAIRU unemployment is inflationary. Until the profession develops an alternative framework that achieves wide acceptance, the Phillips Curve will continue to be a keystone element of central bank policy. The path from higher wages to higher consumer prices may be indirect and uncertain, but the link between the unemployment gap and annual wage gains is alive and well, even in the post-Volcker, low-inflation era (Chart 6). Chart 6Wages Rise When Workers Are Hard To Find
Wages Rise When Workers Are Hard To Find
Wages Rise When Workers Are Hard To Find
What Might The Fed See That We Don’t? We have been, and remain, constructive on the U.S. economy. The delayed December retail sales release was lousy, and the uninspiring advance January figure led the Atlanta Fed to knock nearly 40 basis points off of its estimate of consumption’s contribution to first-quarter GDP, but it seems incompatible with a roaring job market, rising wages, and an elevated household savings rate. First-quarter growth projects to be sickly, but it has been for the last few years, and the Atlanta Fed’s GDP Now model projects that real final domestic demand grew by 1.3%, in spite of the government shutdown. The FOMC seemed to err on the side of caution in trimming its growth estimates by 20 and 10 basis points (“bps”) for 2019 and 2020, respectively, and revising its unemployment rate projections 20 bps higher for both years. The global economy has surely slowed; ex-the U.S., its biggest constituents decelerated for nearly all of 2018, as Chair Powell noted. He also noted, however, that Chinese policy makers have taken several steps to support activity. That will help the rest of the world, including Europe, as an accelerating fiscal and credit impulse boosts Chinese imports (Chart 7). Brexit remains a risk the Fed would be irresponsible not to plan for, but given that a do-over referendum would probably lead to the U.K. remaining in the E.U. (Chart 8), it is a risk that may well not come to pass. Chart 7Chinese Policymakers Want To Boost Growth
Chinese Policymakers Want To Boost Growth
Chinese Policymakers Want To Boost Growth
Chart 8Let's Call The Whole Thing Off
Let's Call The Whole Thing Off
Let's Call The Whole Thing Off
We do not think that the Fed changed course based on White House pressure. As we have noted before, White House-Fed conflict is nothing new, and while the Arthur Burns-led Fed knuckled under during Nixon’s re-election campaign, pressure from the Johnson, Reagan and G.H.W. Bush Administrations all came to naught. We also do not think that the Fed took its cue from investors, even if its 2019 policy rate outlook now closely resembles the money market’s (Chart 9). If it is wary of inverting the yield curve, however, it may want to see long yields rise before it hikes again.3 Chart 9Seeing It The Markets' Way (At Least For 2019)
Seeing It The Markets' Way (At Least For 2019)
Seeing It The Markets' Way (At Least For 2019)
Don’t Fence Me In Q: [B]elow-target inflation is a … phenomenon … across advanced economies, and I’d … like to … hear your thoughts about what kind of challenges that poses to policy makers like yourself and the global economy in general. Chair Powell: It’s a major challenge. It’s one of the major challenges of our time, really, to have … downward pressure on inflation[.] It gives central banks less room … to respond to downturns[.] [I]f inflation expectations are below two percent, they’re always going to be pulling inflation down, and we’re going to be paddling upstream and trying to … keep inflation at two percent, which gives us some room to cut, … when it’s time to cut rates when the economy weakens. … It’s … one of the things we’re looking into as part of our strategic monetary policy review this year. The proximity to the zero lower bound calls for more creative thinking about ways we can … uphold the credibility of our inflation target, and … we’re open-minded about ways we can do that. Our best guess is that the Fed has become frustrated by moribund inflation expectations ten years into a recovery. Now that it sees the potential for a recession in the not-so-distant future, it would prefer not to have to confront it with the zero lower interest-rate bound tying one hand behind its back. It would be reasonable if it would also prefer not to have to rely too heavily on asset purchases, given all the headaches that even a modest shrinking of the balance sheet has occasioned. The Fed’s ongoing monetary policy review may therefore turn out to be more than an academic exercise. It might be awfully nice to have strategies aiming to reverse past misses of the inflation objective in place before the next recession arrives. Those strategies would provide the Fed with more flexibility to reduce real interest rates via moves in the fed funds rate. Powell discussed the potential appeal of these sorts of strategies at Stanford University just a week and a half before the FOMC meeting,4 and despite all the times they’ve been bandied about, they just might come to something this time around. Investment Implications The Fed has made a significant pivot since October’s “long way from neutral,” and December’s post-FOMC press conference, when the chair seemed to be disconnected from the markets’ agita. We don’t think a 2019 rate hike is completely out of the question, but there is no doubt that the Fed’s reaction function has changed. We don’t yet see a reason to revise our terminal rate estimate down from 3.25%-3.5%, even if it’s evident that it will take a good bit longer for the Fed to get there than we initially expected. It seems to be more willing to let inflation get ahead of it – it may end up actively encouraging inflation to do so – before it completes its meandering journey to the terminal rate. Allowing the economy to run a little hotter should be equity-friendly. It’s hard to get earnings contraction without a recession, and recessions don’t occur when monetary policy is accommodative. If the Fed requires more evidence of improvement before it resumes hiking rates, the economy and corporate earnings should be able to build up more momentum than they otherwise would. The Fed’s newfound patience should also be spread-product-friendly, as borrowers become better credits as an expansion rolls along. The Treasury outlook is more nuanced. Yields fell as the Fed committed to remaining on hold for longer, but the Fed now seems to have exhausted its capacity for dovish surprises. Short of a recession or near-recession, it’s hard to see how yields can go much lower. Given markets’ seeming conviction that inflation is as dead as a doornail, however, Treasury bond yields may do no more than drift higher at the margin until the Fed’s efforts to put a floor underneath inflation expectations begin to bear some fruit. We still think risk-friendly positioning makes sense, and we reiterate our equity and spread-product overweights, our Treasuries underweight, and our below-benchmark-duration recommendation. Doug Peta, CFA Chief U.S. Investment Strategist dougp@bcaresearch.com Footnotes 1 At the other end of the spectrum, the unemployment rate fell two ticks in February, to 3.8%, despite a meager net increase of 20,000 jobs. Short-term disconnects can be explained by the fact that the unemployment rate (household) and net payrolls additions (business establishments) are calculated from separate surveys, but no one knows exactly how many people who aren’t working are available to work when they decide the time is ripe. 2 Please see the February 26, 2019 U.S. Investment Strategy Special Report, “The Phillips Curve: Science Or Superstition?” Available at usis.bcaresearch.com. 3 The Fed may not care a whit about the yield curve, but may simply want to hold its fire until it is convinced that the economy requires less accommodation so as not to overheat, which would get it to the same place: not hiking until long yields begin to price in the potential for overheating. 4 Please see the March 18, 2019 U.S. Investment Strategy Weekly Report, “Kinder, Gentler Central Banking.” Available at usis.bcaresearch.com.
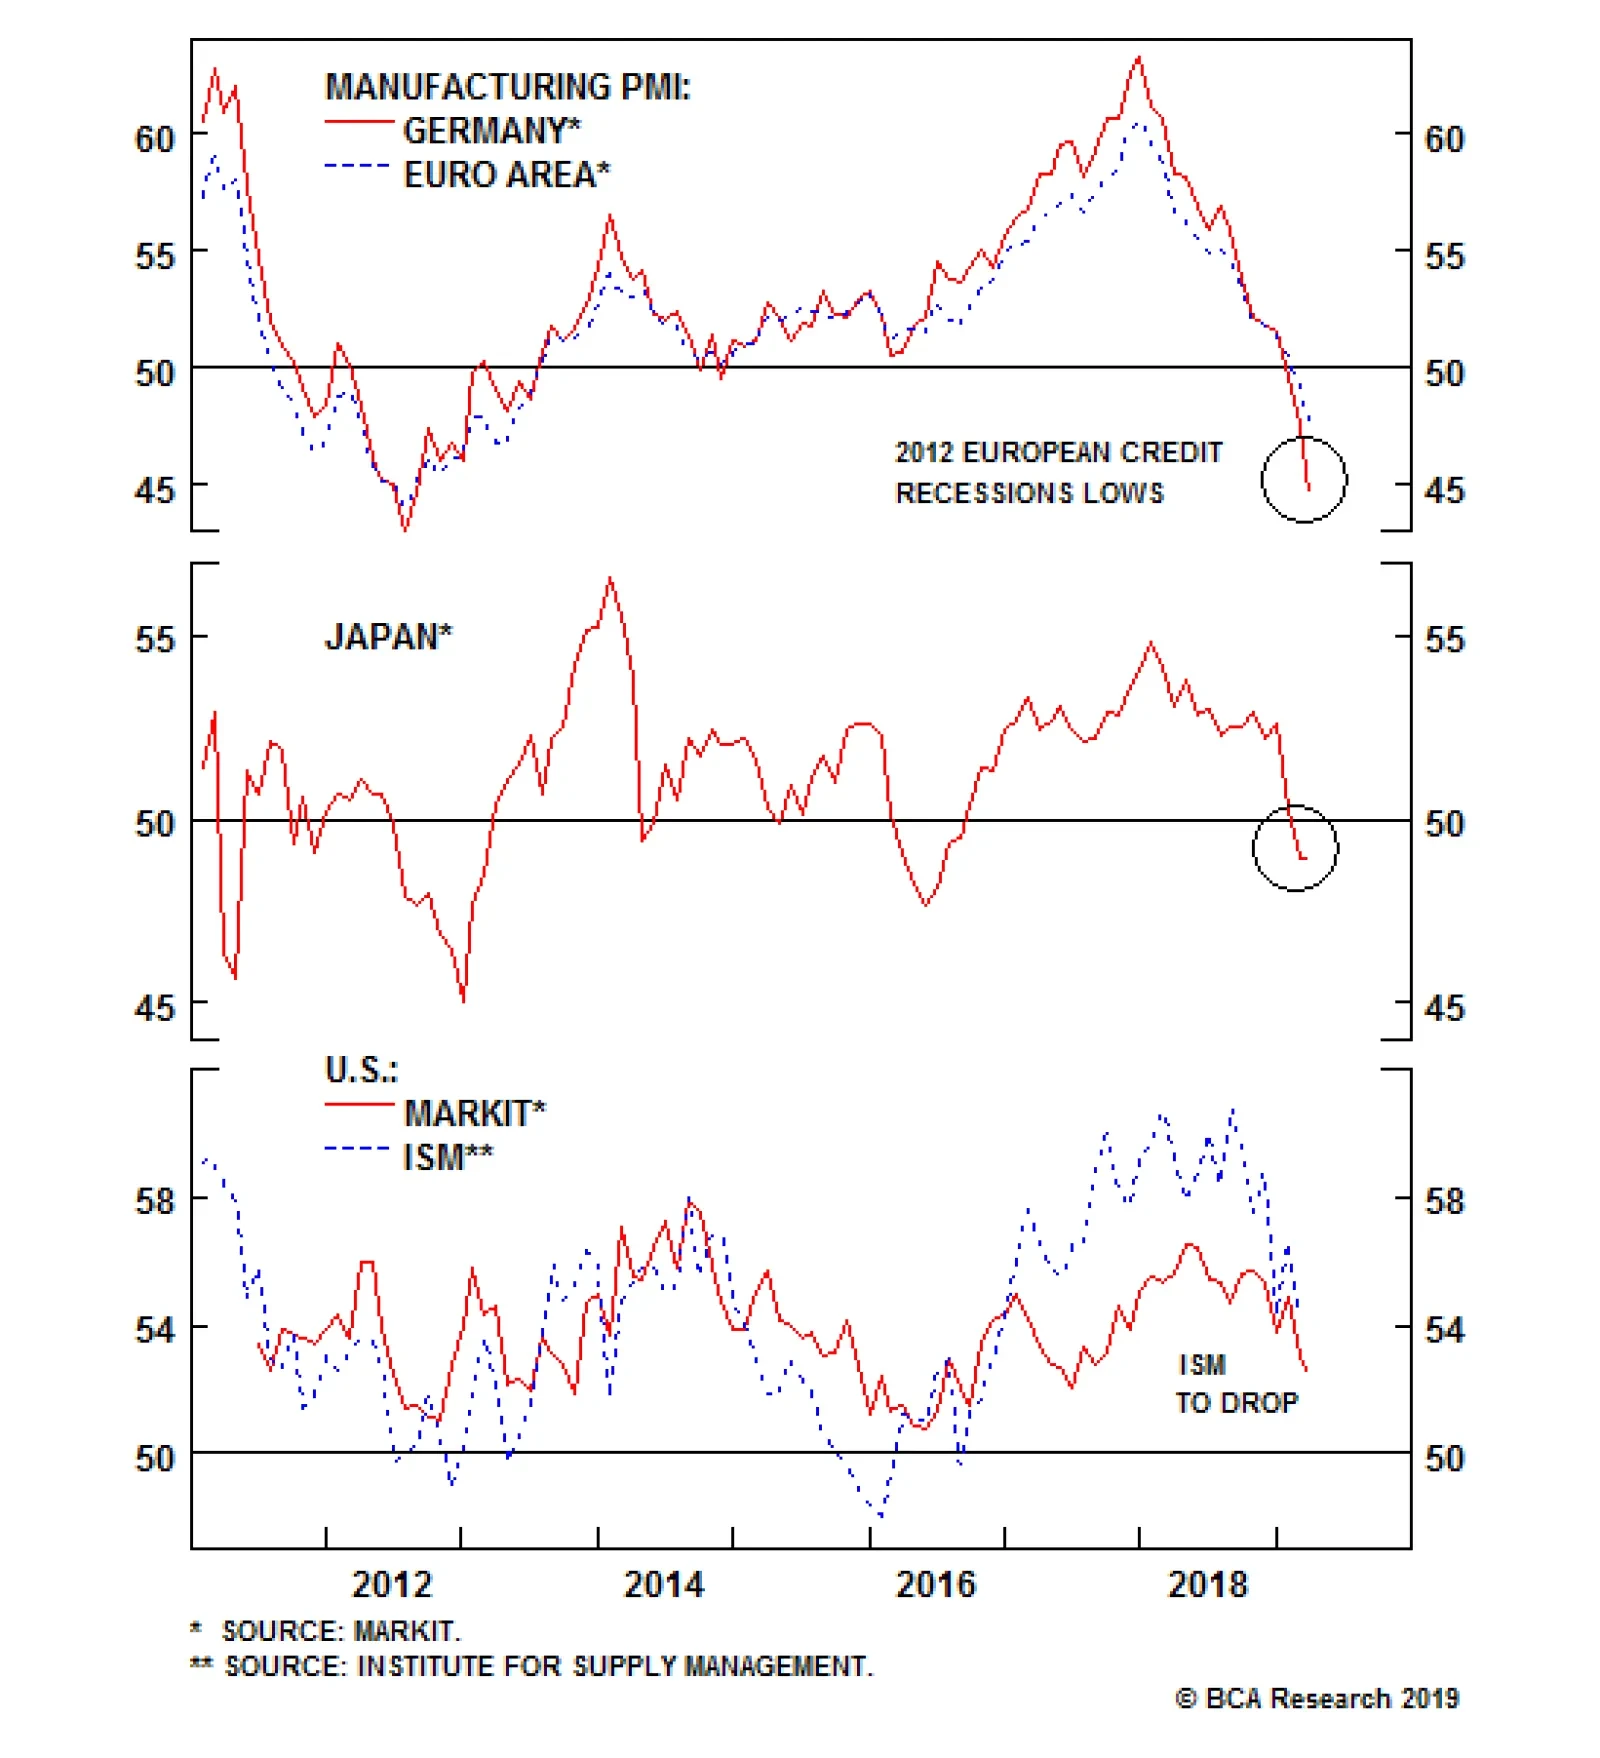
The Flash manufacturing PMI from Europe and Japan were very weak. Germany’s manufacturing PMI dropped to 44.7 and the overall euro area declined to 47.6. Notably, the new manufacturing orders sub-component in Germany plunged to an August 2012 low and…
In the U.S, there are several speeches by various Fed officials next week. Market participants will be looking for clues to understand the Fed’s new thinking after the changes earlier this week. Besides, there are a number of data releases to watch for: the…