Global
From an economic calendar perspective, Tuesday and Wednesday will be the most important days for the U.S. On Tuesday, the NFIB small business confidence and the JOLTS numbers will come out. Moreover, FOMC Vice-Chair Richard Clarida makes an address. On…
A Fed willingly falling behind the curve may fan speculative flames this year, but it doesn’t mean that policy will stay easy forever. On the contrary, the inevitable rise in inflation will push rates higher down the road and the unavoidable recession will…
This view is reinforced by the fact that buy-side analysts and investors alike have aggressively curtailed their expectations for EPS growth this year, to 3.9% for the U.S. and 4.9% outside the U.S. Yet, our profit model suggests that U.S. EPS growth is…
Data from the International Monetary Fund (IMF) shows that the global allocation of foreign exchange reserves towards the U.S. dollar peaked at about 72% in the early 2000s and has been in a downtrend since. Meanwhile, allocation to other currencies, notably…
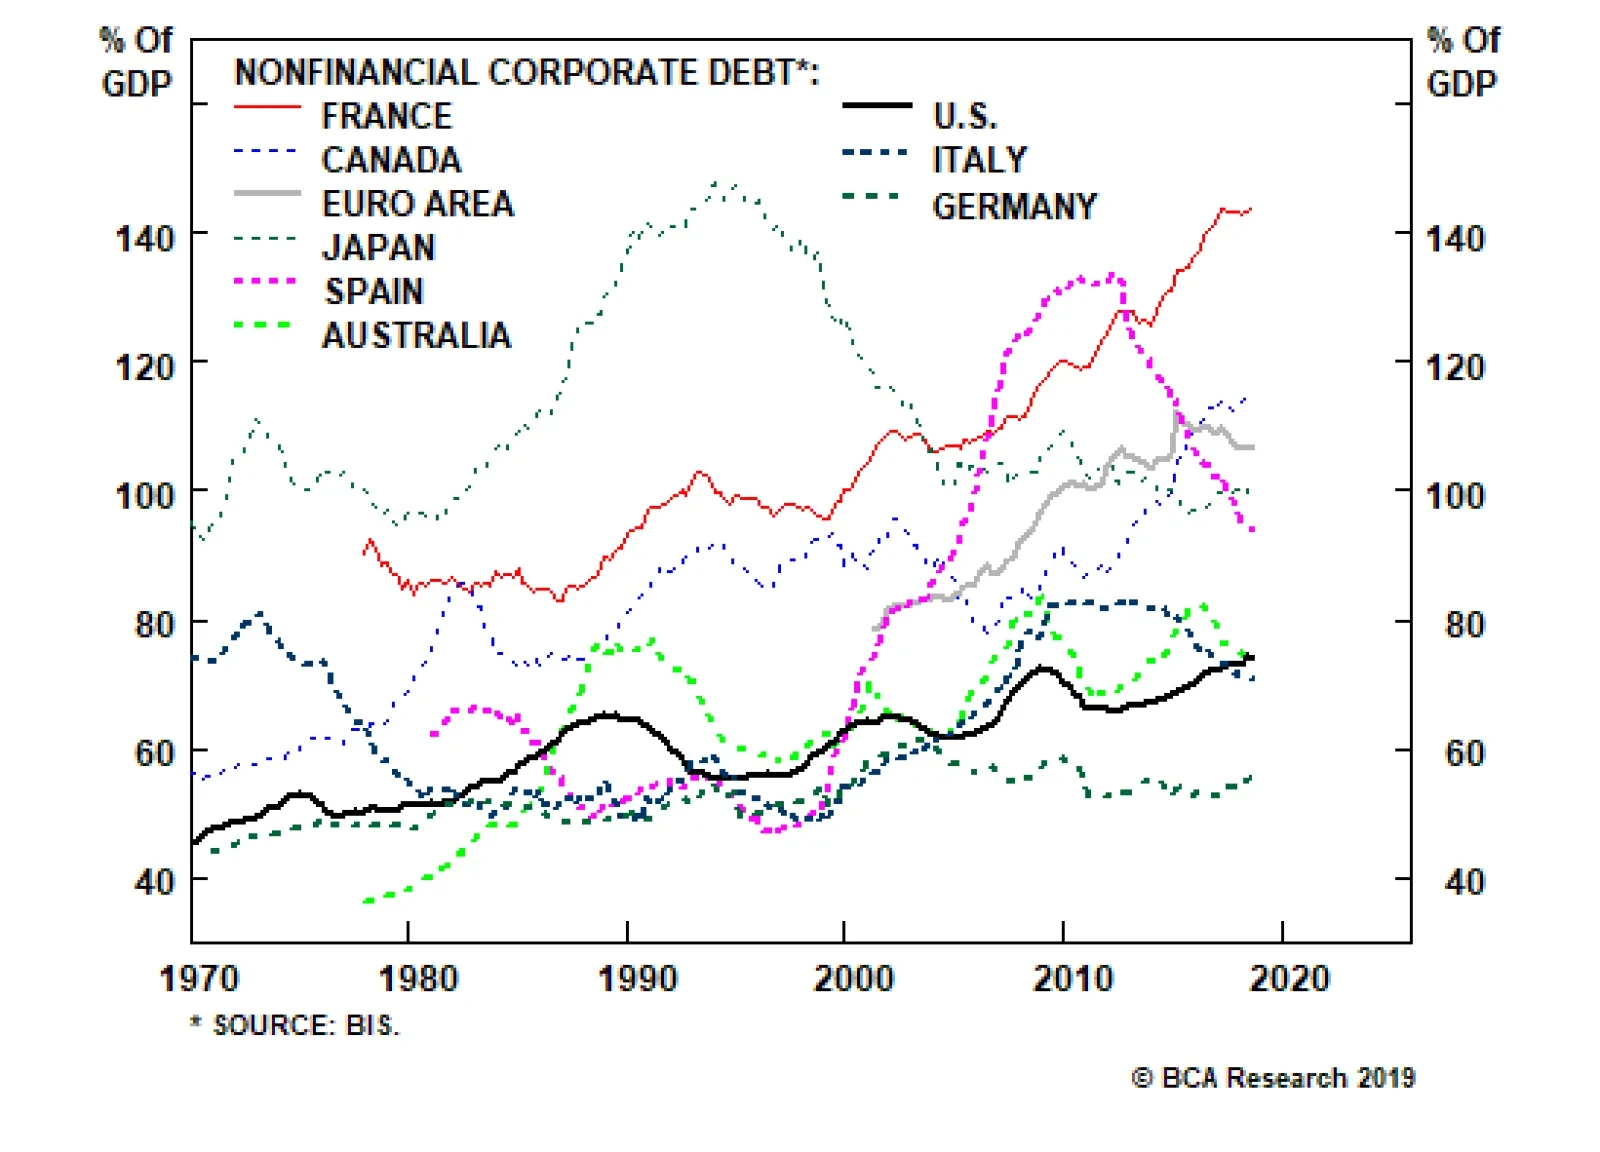
Relative to other countries, U.S. corporate debt is quite low. At 143% of GDP, corporate debt in France is twice that of the United States. This is not to suggest that everything is fine in the French corporate sector; but the fact is that France has not had…

Highlights U.S. growth remains robust, despite some temporary softness in recent months. Ex U.S., growth continues to fall but, with China probably now ramping up monetary stimulus, should bottom in the second half. Central banks everywhere have turned more dovish, partly in an attempt to push up inflation expectations. The combination of resilient growth and easier monetary policy should be good for global equities. We remain overweight equities versus bonds. Bond yields have fallen sharply everywhere. However, with U.S. inflation still trending up, and central banks unlikely to turn any more dovish this year, yields are unlikely to fall much further in 2019. We recommend a slight underweight on duration. We remain overweight U.S. equities, but are on watch to upgrade the euro zone and Emerging Markets when we have stronger conviction about China’s stimulus. Given structural headwinds in both Europe and EM, this would probably be only a tactical upgrade. We have been tilting our equity sector recommendations in a more cyclical direction, last month raising Industrials and Energy to overweight. We also prefer credit over government bonds within the fixed-income category, though we warn that spreads will not fall much further given weak corporate fundamentals. Feature Recommended Allocation
Quarterly - April 2019
Quarterly - April 2019
Overview Don’t Fight The Doves The performance of risk assets essentially comes down to a battle between growth and monetary policy/interest rates. Last September, despite the fact that global economic growth was clearly slowing, the Fed sounded hawkish; this triggered an 18% drop in global equities in Q4. But, since late last year, all major developed central banks have turned more dovish, culminating in March’s decision of the ECB to push back its guidance for its first rate hike, and the FOMC’s wiping out its two planned hikes for 2019. But, at the same time, U.S. economic growth is showing resilience, and we see the first “green shoots” of a cyclical pickup in growth outside the U.S. This is an environment in which risk assets should continue to perform well. Why did the Fed back off? The most likely explanation is that it wants to give itself more room to act come the next recession. Inflation expectations have become unanchored, with 10-year breakevens over the past decade steadily below a level that would be consistent with the Fed achieving its 2% core PCE inflation target in the long run. In the period since the Fed formally introduced this (supposedly “symmetrical”) target in 2012, it has exceeded it in only four months (Chart 1). Around recessions over the past 50 years, the Fed has on average cut rates by 655 basis points (Table 1). It sees little risk, therefore, in letting the economy “run a little hot” and allowing inflation to rise somewhat above 2%. This would reanchor expectations, and eventually get nominal short- and long-term rates higher before the next recession. Chart 1Market Doesn’t Believe The Fed’s Target
Market Doesn't Believe The Fed's Target
Market Doesn't Believe The Fed's Target
Table 1Fed Won’t Be Able To Cut This Much Next Time
Quarterly - April 2019
Quarterly - April 2019
Chart 2Financial Conditions Now Much Easier
Financial Conditions Now Much Easier
Financial Conditions Now Much Easier
Chart 3Housing Market Bottoming Out
Housing Market Bottoming Out
Housing Market Bottoming Out
Meanwhile, U.S. growth seems to be stabilizing at a decent level after signs of weakness late last year caused by tighter financial conditions, a slowdown elsewhere in the world, and the six-week government shutdown. An easing of financial conditions since the beginning of the year should help to keep U.S. GDP growth above trend at around 2.0-2.5% this year (Chart 2). Most notably, interest-rate sensitive areas of the economy that were under pressure last year, especially housing, are showing signs of bottoming (Chart 3). Consumption also should be robust, given strong wage growth, consumer confidence close to historic record high levels, and amid no signs of a deterioration in the labor market (Chart 4). Chart 4No Signs Of Weaker Labor Market
No Signs Of Weaker Labor Market
No Signs Of Weaker Labor Market
Chart 5Some 'Green Shoots' For Global Growth
Some "Green Shoots" For Global Growth
Some "Green Shoots" For Global Growth
A key question for us over the next few months will be when to shift allocations to more cyclical, higher-beta equity markets such as the euro area and Emerging Markets. These have underperformed year-to-date despite the strong risk-on market. China’s nascent reflationary stimulus will decide the timing and level of conviction of this shift. As we explain in detail on page 6, we think the jury is still out on whether China is injecting liquidity on anything like the same scale as it did in 2016. Even if it is, historically it has taken six to 12 months before the effect showed through via a rebound in global trade, commodity prices, and other China-related indicators. The first early signs of a bottoming are emerging: Chinese fixed-asset investment and the Caixin Manufacturing PMI beat expectations last month, the German ZEW Expectations indicator has started to recover, and the diffusion index of the Global Leading Economic Indicator (which often leads the LEI itself by a few months) has picked up (Chart 5). We are on watch to shift our allocation1 but, given the long-term structural headwinds against both Europe and EM, we need to be more convinced about the strength of Chinese stimulus before doing so. The seeds of recession are sown in expansions. Eventually, we see the newly dovish Fed falling behind the curve. The Fed Funds Rate is still below the range of estimates of the neutral rate – hard though this is to estimate in real time (Chart 6). If the economy remains as strong as we expect, sometime next year inflation could begin rising to uncomfortable levels (and asset bubbles start to be of concern), which would push the Fed back into hiking mode. Given that the market is pricing in Fed rate cuts, not hikes, and that the Fed can hardly sound any more dovish than it does now without moving to an outright easing path, it seems to us that long-term rates are very unlikely to fall from here (Chart 7). Chart 6Fed Still Below Neutral
Fed Still Below Neutral
Fed Still Below Neutral
Chart 7Can The Fed Get Any More Dovish Than This?
Can The Fed Get Any More Dovish Than This?
Can The Fed Get Any More Dovish Than This?
In this environment, therefore, we continue to expect global equities to outperform bonds over the next 12 months. However, a recession is possible in 2021 triggered by the Fed late next year needing to put its foot abruptly on the brake. What Our Clients Are Asking Chart 8Ex-U.S. Equities Driven By China Stimulus
Ex US Equities Driven By China Stimilus
Ex US Equities Driven By China Stimilus
When Is The Time To Switch Allocations To Europe And EM? It is slightly surprising that the 12% rally in global equities this year has been led by the low-beta U.S., up 13%, rather than Europe (up 9%) or emerging markets (up 9% - and much less if the strong Chinese market is excluded). Is it time to switch to these underperforming, more cyclical markets? Our answer is, not yet. Global growth ex-U.S. continues to weaken. It is likely to bottom sometime in the second half, as a result of Chinese growth stabilizing. However, the jury is still out on whether the increase in Chinese credit creation in January was a one-off, or major policy reversal. Even if it is the latter, a revival in global growth (and cyclical markets) has typically lagged Chinese stimulus by 6-12 months (Chart 8, panel 1). There are also significant structural headwinds for both the euro zone and Emerging Markets which make us reluctant to overweight them unless there are clear cyclical reasons to do so. Both have lagged global equities fairly consistently since the Global Financial Crisis, with only brief outperformance during periods of economic acceleration, such as in 2016 and 2012 (panel 2). The euro zone remains challenged by its banking system. Loan growth has been stagnant for years, and banks remain undercapitalized relative to their U.S. peers, and highly fragmented (panels 3 and 4). Emerging markets are hampered by their high level of foreign-currency debt (which makes them highly sensitive to U.S. financial conditions), dependence on China, and lack of structural reform. We could see ourselves shifting our recommendation from the U.S. to the euro area and EM, and becoming outright bearish on the U.S. dollar (a counter-cyclical currency), over the coming months if we find confirmation of a bottoming of global cyclical growth and become more confident in the size of China’s stimulus. But given the structural headwinds, and the steady underperformance of these markets, we need stronger evidence first. Chart 9Oil, Positioning, And Housing
Oil, Positioning, And Housing
Oil, Positioning, And Housing
Why Is The 10-Year Bond Yield So Depressed? Despite U.S. equities rallying back to within 4% of a record high, the U.S. Treasury bond yield has fallen further this year (Chart 9, panel 1). Moreover, the 3-month/10-year yield curve has briefly inverted. Besides the Fed’s recent more dovish turn, what has depressed bond yields? We would pin the cause on the following factors: Dampened inflation expectations: Over the past few years the 10-year yield has been closely correlated with the oil price via inflation expectations. A temporary supply shock in Q4 caused oil prices to decline sharply. But tighter supply this year should allow the oil price to recover further. This should cause a rise in inflation expectation (panel 2). Trade positioning: Late last year, speculative short positions in government bonds were at their highest levels since 2015. However, the Q4 equity selloff pushed investors to cover their positions; these are now close to neutral (panel 3). Home Sales: Housing data has been weak over the past few quarters, with both existing and new home sales declining. But there are now signs of recovery: mortgage applications have started to pick up, which should in turn push home sales higher (panel 4). This should also allow for a rise in bond yields. Our key take-away from March’s FOMC meeting, when the tone turned decidedly dovish, is that the Fed is focusing on re-anchoring inflation expectations, which should push nominal yields higher. We think the market is very pessimistic by pricing in 42 and 56 bps of rate cuts over the next 12 and 24 months respectively. It would take a significant further weakening of economic data to make the Fed’s stance turn even more dovish and for nominal yields to fall even further. How Will U.S. Corporate Bonds Perform In The Next Recession? Historically high levels of U.S. corporate debt, as well as declining credit quality in the investment-grade space, have started to worry investors (Chart 10). Specifically, investors are worried that, when the next default cycle comes, a large portion of investment-grade debt will be downgraded to junk, forcing fund managers who are constrained to hold certain credit qualities to sell. These worries seem to be justified. Investment-grade bonds of lower credit quality tend to experience large increases in migration to junk status during credit recessions (Chart 11). Given the current composition of the U.S. investment-grade corporate bond universe, a credit recession would imply a downgrade to junk status of 4.6% of the index if we assume similar behavior to previous recessions. Depending on the speed of the selloff, such a downgrade could also have grave consequence for liquidity. According to the Securities Industry and Financial Markets Association (SIFMA), average daily turnover in the U.S. corporate bond market was 0.34% in 2018. Thus, it is not hard to envision a situation where forced selling could surpass normal levels of liquidity. However, it is hard to tell what would be the effect of such a fire-sale on credit spreads, given that they tend to widen in recessions regardless. While this asset class could perform poorly in the next recession, we don’t expect that its weakness will translate to the real economy. Leveraged institutions such as banks hold just 18% of corporate credit. Furthermore, despite being at all-time highs, U.S. nonfinancial corporate debt to GDP is still at a much healthier level than in other countries (Chart 12). Chart 10Declining Quality In Investment Grade
Declining Quality In Investment Grade
Declining Quality In Investment Grade
Chart 11
Chart 12U.S. Corporate Debt Levels Are Healthy Relative To The Rest Of The World
U.S. Corporate Debt Levels Are Healthy Relative To The Rest Of The World
U.S. Corporate Debt Levels Are Healthy Relative To The Rest Of The World
Chart 13A Value Rebound?
A Value Rebound
A Value Rebound
Chart 14
Is It Time To Favor Value Over Growth Again? Since it peaked in May 2007, the ratio of global value to growth has attempted to rebound several times amid a sustained downtrend (Chart 13). Due to the cyclical nature and the neutral relative valuation of the value/growth indexes, we have preferred to use sector positioning (cyclicals vs. defensives) to implement a value/growth style tilt in our global portfolio since March 20162 (Chart 13, panel 1). Lately, we have received many requests on the topic of the value-versus-growth-ratio. After reaching a historical low in August 2018, the value/growth ratio slightly rebounded in Q4 2018 before reversing some of its gains so far this year. Additionally, the value/growth valuation gap as measured by both price-to-book and forward P/E has reached a historically low level (Chart 13, panel 4). As we have often noted, the sector composition of both the value and growth indexes changes over time.2 Chart 14 shows the current sector weights of S&P Pure Value and Pure Growth Indexes.3 It’s clear that now a bet on Pure Value versus Pure Growth is essentially a bet on Financials (which account for 35% of the Pure Value index) versus Tech and Healthcare (which together account for 38% of the Pure Growth index) - see also Chart 13, panel 2. Given the cyclical nature of the value/growth ratio and also the sector concentration, it’s not surprising that the value/growth play is also a play on euro area versus U.S. equities (Chart 13, panel 3). Currently, we are neutral on Financials and Tech, while overweight Healthcare in our global sector portfolio, and we are putting the euro area on an upgrade watch (see page 14). Therefore, maintaining a neutral stance between value and growth is in line with our sector and country views. However, a close watch for a possible upgrade of value is also warranted given the extreme valuation measures. Global Economy Overview: U.S. growth has slowed recently, though it remains more robust than in the more cyclical economies in Europe and emerging markets. Central banks almost everywhere have recently turned dovish. However, China’s increased monetary stimulus should help global growth bottom out in H2. This could lead the Fed and central banks in other healthy economies to return to a rate-hiking path. U.S.: The U.S. economy has been weak in recent months. The Citigroup Economic Surprise Index (Chart 15, panel 1) has collapsed, and the Fed NowCasts point to only 1.3-1.7% QoQ annualized GDP growth in Q1 (compared to 2.2% in Q4). But the slowdown is mostly due to the six-week government shutdown (which probably took 1% off growth), some seasonal adjustment oddities (which leave Q1 as the weakest quarter almost every year), and tighter financial conditions in H2 2018 which have now largely reversed. The manufacturing and non-manufacturing ISMs in February were still healthy at 54.2 and 59.7 respectively. Consumption (propelled by strong employment growth and accelerating wages) and capex remain strong (panel 3). BCA expects GDP growth in 2019 to be around 2.0-2.5%, still above trend. Euro Area: The European economy continues to slow, driven by weak exports to emerging markets, troubles in the banking sector, and political uncertainty. Q4 GDP growth was only 0.8% QoQ annualized, and the manufacturing PMI has fallen to 47.6 (with Germany as low as 44.7). But there are some early signs of an improvement. The ZEW Expectations index for Germany has bottomed (Chart 16, panel 1), fiscal policy should boost euro area growth this year by around 0.5 percentage points, and wage growth has begun to accelerate. The key remains Chinese stimulus, whose positive effects should help European exports recover sometime in H2. Chart 15U.S. Growth Slowing But Still Robust
U.S. Growth Slowing But Still Robust
U.S. Growth Slowing But Still Robust
Chart 16Signs Of Bottoming In Global Ex-U.S.?
Signs Of Bottoming In Global Ex-U.S.?
Signs Of Bottoming In Global Ex-U.S.?
Japan: Japan also remains highly dependent on a Chinese stimulus. Machine tool orders (the best indicator of capex demand from China) fell by 29% YoY in February. Despite stronger wage growth, now 1.2% YoY, inflation shows no signs of moving up towards the Bank of Japan’s target of 2%: ex energy and food CPI inflation is still only 0.4%. The biggest risk in 2019 is October’s planned consumption tax hike from 8% to 10%. Prime Minister Abe has said that he will cancel this only in the event of a shock on the scale of Lehman Brothers’ bankruptcy. The government has put in place measures to soften the impact (most notably a 5% rebate on purchases at small retailers after October 1 paid for electronically), but consumption is still likely to fall significantly. Emerging Markets: China seems to have ramped up its monetary stimulus, with total social financing in January and February combined up 12% over the same months last year. Recent data have shown signs of a stabilization of growth: the manufacturing PMI rebounded to 49.9 in February from 48.3, and fixed-asset investment beat expectations at 6.1% YoY in January and February combined. Nonetheless, the size of liquidity injection is likely to be smaller than in previous episodes such as 2016, since Premier Li Keqiang and the PBOC have warned of the risk of excessive speculation. Elsewhere, some emerging economies (notably Brazil and Mexico) have showed signs of recovery after last year’s deterioration, whereas others (such as South Africa, Indonesia, and Poland) continue to suffer. Interest rates: Central banks worldwide have generally turned more dovish in recent months, with the Fed and ECB both moving to signal no rate hikes this year. This has pushed down long-term rates globally, with 10-year bond yields falling below 0% again in Germany and Japan. However, with global growth likely to bottom over the next few months, rates may not stay at current depressed levels. U.S. inflation, in particular, continues to trend up, and the Fed’s target PCE inflation measure is likely to exceed 2% over coming months. We see the Fed turning more hawkish by year-end, and long rates globally more likely to rise than fall from current levels. Global Equities Chart 17Watch Earnings
Watch Earnings
Watch Earnings
Remain Cautiously Optimistic: We added risk in our January Portfolio Update4 by putting cash back to work in global equities, and then in the March Portfolio Update5 we reduced the underweight in EM equities and increased the tilt to cyclicals at the expense of defensives, to hedge against a continuing acceleration in Chinese credit growth. All these came after our risk reduction in July 2018.6 GAA’s portfolio approach has always been to take risks where they are most likely to be rewarded. BCA’s macro view is that global economic growth data is likely to be on the weak side in the coming months, but will pick up in the second half. This implies that equities are likely to rally again after a period of congestion within a trading range, supporting a cautiously optimistic portfolio allocation for the next 9-12 months. At the asset-class level, our positioning of overweight equities versus bonds while neutral on cash, reflects the “optimistic” side of our allocation. However, the rebound in global equities since the December sell-off has been driven completely by a valuation re-rating, while earnings growth has been revised down sharply. (Chart 17). As such, within global equities, our preference for low-beta countries (favoring DM versus EM, and favoring the U.S over the rest of DM) reflects the “cautious” aspect of our allocation. Our macro view hinges largely on what happens to China. There are signs that China may have abandoned its focus on deleveraging, yet it is too early to tell if it has switched back to a reflationary path. Therefore, our global equity sector overlay has a slight cyclical tilt by overweighting Industrials and Energy, which are among the main beneficiaries of Chinese reflationary policies or a positive resolution to U.S.-China trade negotiations. Chart 18Warming Up To The Euro Area
Warming Up To The Euro Area
Warming Up To The Euro Area
Euro Area Equities: On Upgrade Watch We have favored U.S. equities relative to the euro area since July 2018.7 Since then, the U.S. has outperformed the euro area by 11% in USD terms and by 8% in local currency terms, with the difference being attributed to the weakness of the euro versus the U.S. dollar. Given BCA’s view on the global economy and the U.S. dollar, however, we are watching closely to switch our recommendation between the U.S. and euro area equities, for the following reasons: First, as shown in Chart 18, panel 1, the relative performance between the euro area and the U.S. is highly correlated with the EUR/USD exchange rate. BCA believes that the U.S. dollar is set for a period of weakness starting in the second half of the year,8 which bodes well for the outperformance of euro area equities. Second, relative earnings growth between the euro area and the U.S. is driven by the underlying strength of the economies, as represented by PMIs (panel 2). Both the relative earnings growth and relative PMI have stopped falling and have begun to bottom in favor of the euro area; Third, even though the euro area’s beta has been declining while that of the U.S. has increased, euro area beta is still higher than that in the U.S., making it more of a beneficiary of a global growth recovery; However, the relative valuation of euro area equities to their U.S. counterparts is now neutral not at the extreme level which historically has been a good entry-point into eurozone equities (panel 4). Chart 19Becoming Less Defensive
Becoming Less Defensive
Becoming Less Defensive
Global Sector Allocation: Gradually Becoming Less Defensive GAA’s sector portfolio took profits on its pro-cyclical positioning and went defensive in July 20189 and remained so until the March Monthly update10 when we upgraded Energy and Industrials to overweight from neutral, while downgrading Consumer Staples two notches to underweight from overweight (Chart 19). The upgrade of Industrials was mainly a hedge against further acceleration in China’s credit growth. But why did we upgrade Energy to overweight yet maintained an underweight in Materials? Long-term GAA clients know that, in terms of global sector allocation, we have structurally favored the oil-related Energy sector to the metals-related Materials sector since October 2016, because oil supply/demand is more global in nature while the supply/demand of metals, especially industrial metals, is closely linked to China (see also the Commodity section of this Quarterly on page 18). From a cyclical perspective, the relative performance of the two sectors has historically closely correlated with the relative prices of oil and metals, as shown in panel 2. This is not surprising because changes in forward earnings for the two sectors are also closely linked to change in the corresponding commodity prices (panels 3 and 4). BCA’s Commodity and Energy Strategy service has an overweight rating on oil and a neutral stance on metals, implying that the growth in the oil price will outpace that of metal prices, which suggests that the Energy sector will outperform the Materials sector (panel 2). Government Bonds Maintain Slight Underweight On Duration. Global equities have recovered 16% since reaching the low of 2018 on December 24, yet the global bond yield has decreased by 21 bps over the same period. While the directional movement of bond yields is somewhat puzzling given such strong performance in equities (see page 7 for some explanations), it’s evident that the bond markets have been driven by the recent weakness in global growth (Chart 20, panel 3), and are pricing out any expectation of rate hikes over the coming year in major developed economies. Given the surprisingly dovish tone at the March FOMC meeting and BCA’s House View that global economic growth will rebound in the second half, bond yields are now highly exposed to any hawkish shift in central bank policies and any recovery in inflation expectations. As such, it’s still appropriate to maintain a slight underweight on duration over the next 9-12 months. Favor Linkers Vs. Nominal Bonds. Depressed inflation expectations have been one reason why global bond yields have decoupled from equities. However, the crude oil price, which closely correlates with inflation expectations, has stabilized. BCA’s Commodity & Energy Strategy service expects Brent crude to end 2019 at US$75 per barrel (Chart 21). This implies a significant rise in inflation expectations in the second half of the year, supporting our preference for inflation-linked bonds over nominal bonds. However, TIPS are no longer cheap. For those who have not already moved to overweight TIPS, we suggest “buying TIPS on dips”. Inflation-linked bonds (ILBs) in Australia and Japan are also still very attractive versus their respective nominal bonds. Overweighting ILBs in those two markets also fits well with our macro themes. Chart 20Rates: Likely More Upside Risk
Rates: Likely More Upside Risk
Rates: Likely More Upside Risk
Chart 21Favor Inflation Linkers
Favor Inflation Linkers
Favor Inflation Linkers
Corporate Bonds Chart 22Tactical Upside Remains For Credit
Tactical Upside Remains For Credit
Tactical Upside Remains For Credit
In February, we raised credit to overweight within a fixed-income portfolio while underweighting government bonds. So far, this has proven to be the right decision, as corporate bonds have generated excess returns of 90 basis points over duration-matched Treasuries. We based our positioning on the mounting evidence that global growth is turning up: credit impulses are starting to rebound in several major economies, monetary conditions have eased, and our diffusion index of global leading indicators has rebounded sharply, indicating that there remains tactical upside for global credit (Chart 22– panel 1 and 2). When will we close our tactical overweight? Our U.S. Bond Strategy Service has set a target for spreads of U.S. corporate bonds with different credit ratings. According to their targets, which denote the median spread typical of late-cycle environments, there is still some room for further spread compression in non-AAA credits (Chart 22 – panel 3 and 4). However, the upside is limited and, if spreads keep tightening, we will probably close our position by the end of Q2. On a cyclical horizon, the fundamentals of corporate health are still a headwind, with both the interest-coverage and liquidity ratio for U.S. investment-grade corporates standing near 10-year lows.11 Moreover, we expect these ratios to deteriorate further, as corporate profits will likely come under pressure due to increasing wage growth. Finally, we expect that the Fed will turn more hawkish by the end of 2019, turning monetary policy from a tailwind to a headwind. Thus, we recommend investors to remain overweight, but be ready to turn bearish in the back end of the year. Commodities Chart 23Prefer Oil, Watch Metals
Prefer Oil, Watch Metals
Prefer Oil, Watch Metals
Energy (Overweight): Stable demand, declining Venezuelan production due to U.S. sanctions, instability and possible outages in Libya, Iraq, and Nigeria, alongside the GCC’s commitment to cut output through year-end, should support oil prices and allow further upside (Chart 23, panels 1 & 2). While U.S. crude production is on the rise, bottlenecks in its export capabilities should limit market oversupply. Crude supply shocks should outweigh any slowdown in demand, specifically from emerging markets. BCA’s energy strategists expect Brent to average $75 and $80 throughout 2019 and 2020 respectively, and for the gap between WTI and Brent to narrow significantly. Industrial Metals (Neutral): China, the world’s largest consumer, still plays a big role in the direction of industrial metals. Year-to-date, metals prices have been supported partly by a more stable dollar. For now, we maintain a neutral stance until we see confirmation that Chinese stimulus will trigger further upside to metal prices perhaps in the second half. However, a lack of sustained Chinese demand, alongside weaker global growth over the next few months, would weigh down on metal prices (panel 3). Precious Metals (Neutral): Gold has reversed its downslide and rallied by over 10% from its Q4 2018 low. With the market pricing out any Fed rate hikes this year, rising inflation expectations, a weaker USD by year-end, and lower real rates should help gold outperform other commodities in this late-cycle phase. We recommend an allocation to gold as an inflation hedge, as well as a hedge against geopolitical risks (panel 4). Currencies Chart 24The End Of The Dollar Bull Market
The End Of The Dollar Bull Market
The End Of The Dollar Bull Market
U.S. Dollar: Our bullish stance on the dollar has proven to be correct, as the trade-weighted dollar has appreciated by 5% in the past 12-months thanks to the slowdown in global growth. However, the two reasons for the growth slowdown – Fed tightening and Chinese deleveraging – have started to ease. On March 20 the Fed revised its forward guidance to no rate hikes in 2019 and only one rate hike in 2020. Meanwhile, Chinese total social financing relative to GDP has bottomed, indicating that Chinese authorities have opted for a pause in their deleveraging campaign (Chart 24, panel 1). These developments will likely boost global growth and hurt the countercyclical greenback. Therefore, we recommend investors to slowly shift to a cyclical underweight on the dollar. Euro: Most of the factors that dragged the euro down last year are fading: political risk in Italy has eased, fiscal policy is moving from a headwind to a tailwind, and the relative LEI between the EU and the US has started to pick up (panel 2). Moreover, we see little scope for euro area monetary policy to turn any more dovish versus the U.S., since forward rate expectations currently stand near 2014 lows (panel 3). Thus, we expect the euro to be one of the best performing currencies this year. Yen: Easy monetary policy by global central banks will boost asset prices and reduce volatility, creating a risk-on environment that is typically negative for the yen (panel 4). Moreover, the IMF still projects Japan to have a negative fiscal drag of 0.7% this year, which will force the BoJ to prolong its yield curve control regime. As a result, we expect the yen to be one of the worst performing currencies this year. Alternatives Intro: Investors’ allocation to alternatives is on the rise as we get closer to the end of the business cycle along with increasing realized volatility in traditional assets. In the alternatives assets space, we recommend thinking about allocations through three buckets: 1) return enhancers, means of outperforming traditional equity, fixed income, and mixed-asset strategies; 2) inflation hedges, means of preserving capital throughout periods of elevated inflation; and 3) volatility dampeners, means of reducing drawdowns and portfolio volatility during periods of market drawdowns. Return Enhancers: In our July and October 2018 Quarterly reports, we recommended investors trim back on PE allocations and reallocate towards hedge funds. Growing competition in the PE space has pushed up multiples. Given where the business cycle currently is, we favor macro hedge funds, as they tend to outperform in this sort of environment as well as in downturns and recessions (Chart 25, panel 1). Inflation Hedges: In our July 2018 Quarterly, we recommended investors pare back their real estate allocations, given the backdrop of a slowdown/sideways trend in the sector, and specifically within the retail segment. Given that the end of the current cycle is likely to be accompanied by elevated levels of inflation, we recommend clients to modestly allocate to commodity futures on the likelihood of a softer dollar and rising energy prices (panel 2). Volatility Dampeners: We continue to recommend both farmland and timberland since they have lower volatility than other traditional and alternative asset classes (panel 3). While timberland is more impacted by economic growth via the housing market, farmland has a near-zero correlation with economic growth. We do not favor structured products due to their unattractive valuations. Chart 25Prefer Hedge Funds Over Private Equity
Prefer Hedge Funds Over Private Equity
Prefer Hedge Funds Over Private Equity
Risks To Our View Our economic outlook is quite sanguine. What would undermine this scenario? Many investors have become nervous about the inversion of the U.S. yield curve. And we have shown in the past that an inversion of the 3-month/10-year yield curve has been a reliable indicator of recessions 12-18 months ahead.12 Its inversion in March, then, is a concern. But note that the indicator works only using a three-month moving average (Chart 26); the curve often inverted for a brief period without signaling recession. We expect long-term rates to rise from here, steepening the curve. But a prolongation of the current inversion would clearly be a worrying signal. The direction of China continues to play a key role in defining the macro picture. Our current allocation is based on the view that China is doing some monetary and fiscal stimulus but that, at the current pace, it will be much smaller than in 2016 (Chart 27). The weak response of money supply growth suggests, as Premier Li Keqiang has complained, that the liquidity is mostly going into speculation (note that A-shares have risen by 20% this year) rather than into the real economy. The March Total Social Financing data, released in mid-April, will give a better read of the degree of the reflation. If it is bigger than we expect, this would suggest a quicker shift into euro area and Emerging Market equities than we currently advocate. The U.S. dollar remains a key driver of asset allocation. The dollar is a counter-cyclical currency and, with global growth slowing, has continued to appreciate moderately this year (Chart 28). We see a weakening of the dollar later this year, when global growth picks up. But if this were to happen more quickly or dramatically than we expect – not impossible given the currency’s over-valuation and crowded long-dollar positions – EM stocks and commodity prices, given their strong inverse correlation with the dollar, could bounce sharply. Chart 26Yield Curve Inversion
Yield Curve Inversion
Yield Curve Inversion
Chart 27How Much Is China Reflating?
How Much Is China Reflating?
How Much Is China Reflating?
Chart 28Dollar Is Counter-Cyclical
Dollar Is Counter-Cyclical
Dollar Is Counter-Cyclical
Garry Evans, Chief Global Asset Allocation Strategist garry@bcaresearch.com Xiaoli Tang, Associate Vice President xiaolit@bcaresearch.com Juan Manuel Correa Ossa, Senior Analyst juanc@bcaresearch.com Amr Hanafy, Research Associate amrh@bcaresearch.com Footnotes 1 Please see the Equities Section of this Quarterly on page 14 for more details. 2 Please see Global Asset Allocation “GAA Quarterly,” dated March 31, 2016 available at gaa.bcaresearch.com 3 Please see https://us.spindices.com/documents/methodologies/methodology-sp-us-style.pdf 4 Please see Global Asset Allocation “Monthly - January 2019,” dated January 2, 2019 available at gaa.bcaresearch.com 5 Please see Global Asset Allocation “Monthly - March 2019,” dated March 1, 2019 available at gaa.bcaresearch.com 6 Please see Global Asset Allocation “Quarterly - July 2018,” dated July 2, 2018 available at gaa.bcaresearch.com 7 Please see Global Asset Allocation “Quarterly - July 2018,” dated July 2, 2018 available at gaa.bcaresearch.com 8 Please see Global Investment Strategy Weekly Report, “What’s Next For The Dollar?” dated March 15, 2019 available at gis. bcaresearch.com 9 Please see Global Asset Allocation “Quarterly - July 2018,” dated July 2, 2018 available at gaa.bcaresearch.com 10 Please see Global Asset Allocation “Monthly Portfolio Update,” dated March 1, 2019 available at gaa.bcaresearch.com 11 Based on BCA’s Global Fixed Income Strategy’s bottom-up health monitor. 12 Please see Global Asset Allocation Special Report, “Can Asset Allocators Rely On Yield Curves?” dated June 15, 2018 available at gaa.bcaresearch.com GAA Asset Allocation
Next week will be a busy one. In the U.S., both the retail sales for February as well as the March ISM manufacturing number will hit the press on Monday. Retail sales will be closely scrutinized for signs that aftershocks of the poor December number continue…
Highlights Currency markets continue to fight a tug-of-war between deteriorating global growth and easing global financial conditions. Meanwhile, history suggests that the trade-weighted dollar should have been 10-15% higher, based on portfolio flows and interest rate differentials. The more-muted bounce is a cause for concern. As the battle unfolds, likely winners in the interim will be safe-haven currencies such as the yen. Watch the gold-to-bond ratio for cues on where the balance of forces are shifting, with a rising ratio negative for the dollar. We expect a day of reckoning to eventually arrive for the U.S. dollar, once investors shift their focus towards the rising twin deficits, de-dollarization of the global economy and low expected returns for U.S. assets. Feature The recent calm in developed currency markets seems very eerie, given the storm that has gripped global financial markets over the past week. Dismal manufacturing PMI readings from Europe and Japan last week sent equity markets into a tailspin. The closely watched U.S. 10-year versus 3-month spread inverted, triggering panic selling among investors who favor this spread as their most reliable recession indicator. Equity markets in Asia are off the year’s highs, while regional bond yields are holding close to trading lows. Outside of oil, commodity markets have also been soft. Despite these moves, the trade-weighted dollar has been relatively stable. Over the last few months, most currency pairs have been narrowly trading towards the apex of very tight wedge formations. This has severely dampened volatility (Chart 1). Over the longer term, the stability of these crosses relative to gold has spooky echoes of a fixed exchange rate regime a la Bretton Woods (Chart 2). Chart 1An Eerie Calm In Currency Markets
An Eerie Calm In Currency Markets
An Eerie Calm In Currency Markets
Chart 2Fixed Exchange Rates Versus Gold?
Fixed Exchange Rates Versus Gold?
Fixed Exchange Rates Versus Gold?
In physics, centripetal systems tend to stay in equilibrium, while centrifugal forces can explode in spectacular fashion. In the post-Bretton Woods world, it has been very rare for periods of extended currency stability to persist. This means constantly monitoring both the trend and magnitude of imbalances between economies to gauge where the pressure points are, and in what direction the corresponding exchange rates might eventually give way. The balance of forces driving the dollar outlook seems like a natural starting point for this exercise. Global Liquidity And The Dollar Judging by most measures of relative trends, the dollar should be soaring right now. The March Markit manufacturing PMI releases last week showed that while both Japan and the euro area remain in contraction territory, the U.S. reading of 52.5 puts it solidly above the rest of the world. It is true that the momentum of this leadership has been rolling over recently, but historically such large growth divergences between the U.S. and the rest of the world have generated anywhere from 10-15% rallies in the greenback over a period of six months (Chart 3). So far, the DXY dollar index is up 1.9% since October. Every time this measure has severely contracted in the past, the shortage of dollars has triggered a blowup somewhere. Until the U.S. Federal Reserve’s recent volte-face on monetary policy, relative yields also favored the greenback. The 2-year swap differential between the U.S. and the rest of the world pinned the DXY dollar index at 105, or 8% above current levels (Chart 4). Meanwhile, relative policy rates also suggest the broad trade-weighted dollar should be 6% higher. And even today, unless the Fed moves towards outright rate cuts, the dovish shift by other central banks around the world remains an immediate tailwind for the U.S. dollar. Chart 3USD Should Be Higher Based On Growth Divergences
USD Should Be Higher Based On Growth Divergences
USD Should Be Higher Based On Growth Divergences
Chart 4USD Should Be Higher Based On Swap Differentials
USD Should Be Higher Based On Swap Differentials
USD Should Be Higher Based On Swap Differentials
Internationally, the Fed’s tapering of asset purchases has been a net drain on dollar liquidity, despite a widening U.S. current account deficit. The Fed’s balance sheet peaked a nudge above US$4.5 trillion in early 2015 and has been falling ever since. This has triggered a severe contraction in the U.S. monetary base (Chart 5), and severely curtailed commercial banks’ excess reserves, which are now contracting by over 20% on a year-on-year basis. One of BCA’s favorite key measures of international liquidity is foreign central bank reserves deposited at the Fed. This is contracting at its worst pace in over 40 years. Every time this measure has severely contracted in the past, the shortage of dollars has triggered a blowup somewhere, typically among countries running twin deficits. Chart 5A Liquidity Squeeze Of Dollars
A Liquidity Squeeze Of Dollars
A Liquidity Squeeze Of Dollars
To cap it off, last year’s change in the U.S. tax code to allow for repatriation of offshore cash helped the dollar, but not to the extent that might have been expected. On a rolling 12-month basis, the U.S. has repatriated back a net of about $US400 billion in assets, or close to 2% of GDP. Historically, this is a very huge sum that would have had the potential to set the greenback on fire – circa 10% higher (Chart 6). Chart 6USD Should Be Higher On Repatriation Flows
USD Should Be Higher On Repatriation Flows
USD Should Be Higher On Repatriation Flows
Dollar liquidity shortages tend to be vicious due to their ability to trigger negative feedback loops. As the velocity of international U.S. dollars rises, offshore dollar rates begin to rise, lifting the cost of capital for borrowing countries. Debt repayment replaces capital spending and consumption once this reaches a critical threshold. The drop in output, prices, or a combination of the two, only exacerbates the debt-deflation problem. The bottom line is that looking at historical trends, the dollar should be much higher than current levels. Practical investors recognize the need to pay heed to correlation shifts. Either our favorite liquidity indicators have stopped working outright or more realistically other forces are at play, explaining the relative stability in the greenback. A Counter-Cyclical Currency The first possibility is that the recent stability in the U.S. dollar has been in anticipation of better economic data in the second half of this year. We have shown many times in the past that the greenback is a countercyclical currency that tends to do poorly when global economic momentum picks up. Many investors are now fixated on China – specifically, whether the latest credit injection will be sufficient to turn around the Chinese economy, let alone the rest of the world. Meanwhile, as the U.S.-China trade talks progress, it will likely include a currency clause to prevent depreciation of the RMB versus the dollar. In reality, there is still scant evidence to support a bottoming in global growth, making it difficult to loop this back to dollar stability. In reality, there is still scant evidence to support a bottoming in global growth, making it difficult to loop this back to dollar stability. Typical reflation indicators such as commodity prices, emerging market currencies and industrial share prices are off their lows but rolling over. March export data remained weak globally, even though compositionally there were some green shoots. Exports to China from Singapore jumped by 34% year-on-year, and those to emerging markets by 22% year-on-year. Japanese machine tool orders from China also showed some stabilization. Historically, these are necessary but not sufficient conditions to gauge whether we are entering a bottoming process (Chart 7). Another contradiction is at play: If the dollar rally is being held back by prospects of improvement in global growth, then gold should fare poorly and most currencies should be outperforming both gold and the greenback. Until yesterday’s sell off in gold, this was not the case. Suggesting some other explanation might be tempering the U.S. dollar’s rise. Chart 7Tentative Green Shoots In Global Trade?
Tentative Green Shoots In Global Trade?
Tentative Green Shoots In Global Trade?
Regime Shift? While U.S. residents have been repatriating capital domestically, foreign investors have been fleeing U.S. capital markets at among the fastest pace in recent years. On a rolling 12-month total basis, the U.S. saw an exodus of about US$200 billion in equity from foreigners, the largest on record (Chart 8). In aggregate, both foreign official and private long-term portfolio investment into the U.S. has been rolling over, with investor interest limited only to agency and corporate bonds. Foreigners are still net buyers of about $450 billion in U.S. securities, but the downtrend in purchases in recent years is evident. Interestingly, gold has also outperformed Treasurys over this period. The U.S. dollar remains the reserve currency of the world today, but that exorbitant privilege is clearly fraying on the edges. Vis-à-vis official flows, China has risen within the ranks to be the number one contributor to the U.S. trade deficit. At the same time, Beijing has been destocking its holding of Treasurys, if only as retaliation against past U.S. policies, or perhaps to make room for the internationalization of the RMB (Chart 9). In a broader sense, the fall in dollar deposits at the Fed might just represent an underlying shift in the global economy away from dollars and towards a more diversified basket of currencies. This makes sense, given a growing proportion of trading – be it in crude, natural gas, bulk commodities or even softs – is being done outside U.S. exchanges. Chart 8Foreigners Are Dumping U.S. Equities
Foreigners Are Dumping U.S. Equities
Foreigners Are Dumping U.S. Equities
Chart 9China Has Stopped Recycling Surpluses Into Treasurys
China Has Stopped Recycling Surpluses Into Treasurys
China Has Stopped Recycling Surpluses Into Treasurys
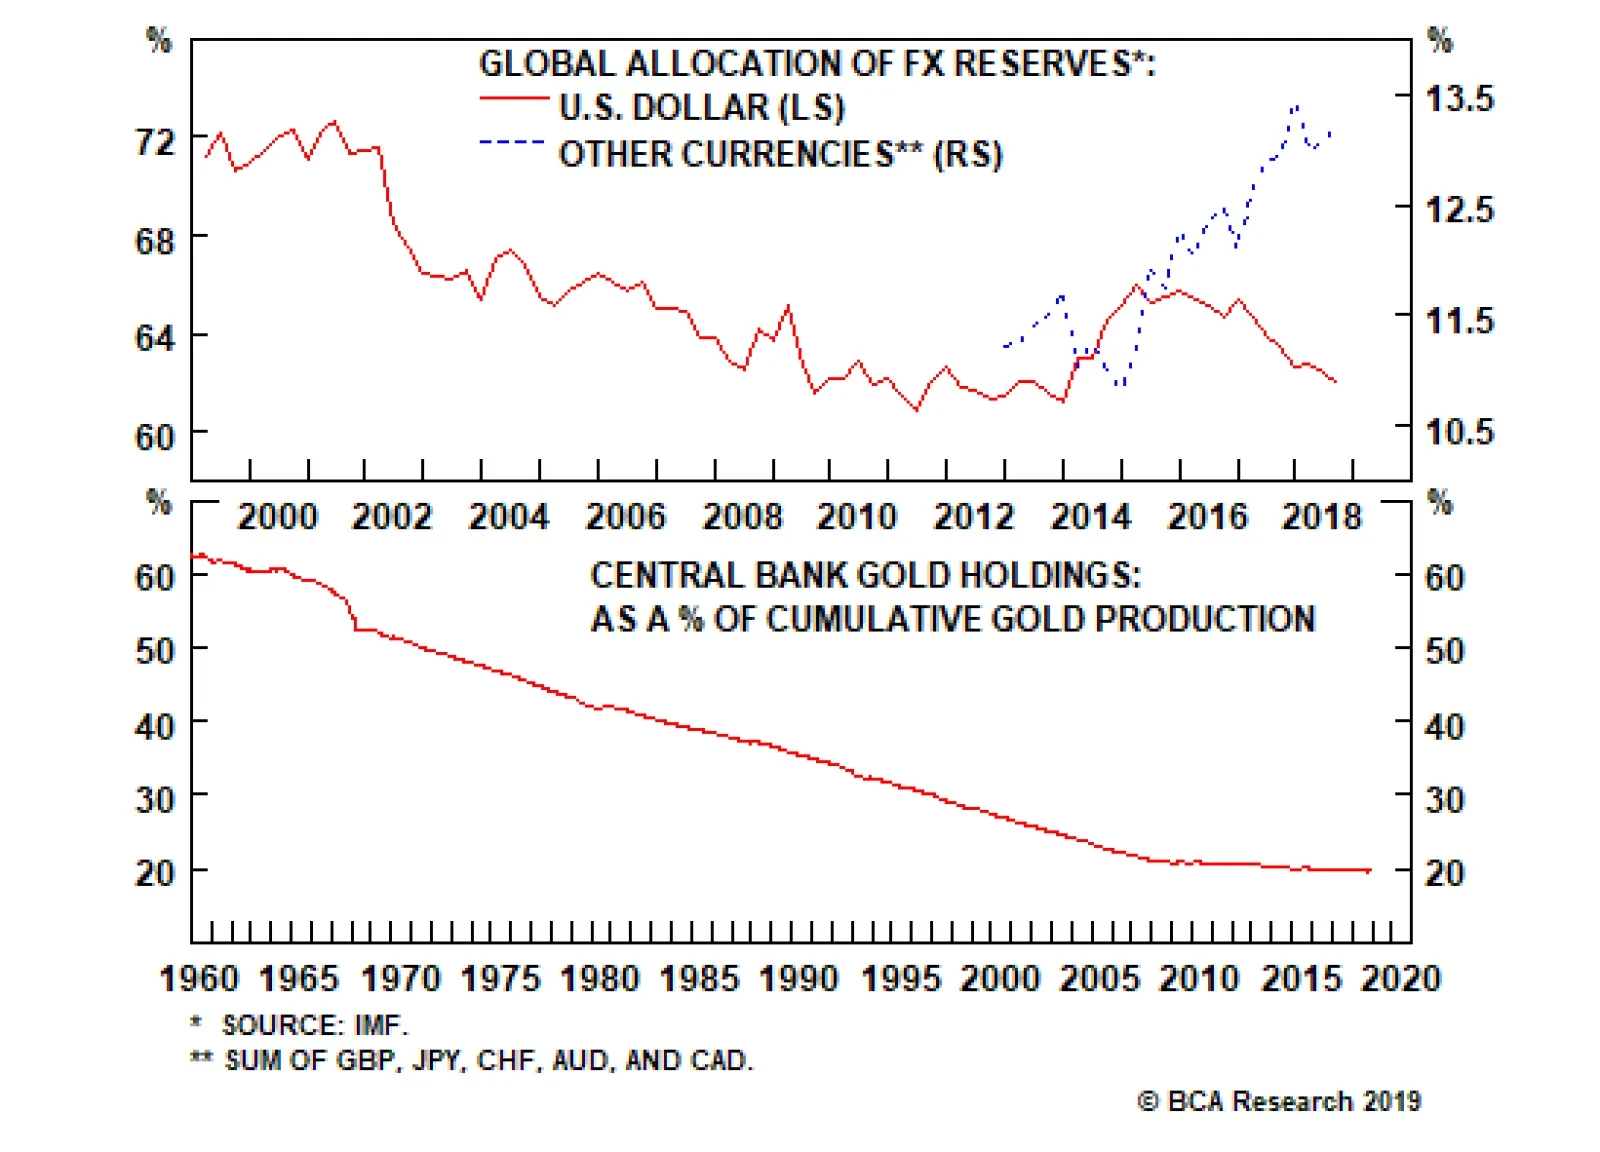
Data from the International Monetary Fund (IMF) shows that the global allocation of foreign exchange reserves towards the U.S. dollar peaked at about 72% in the early 2000s and has been in a downtrend since. Meanwhile, allocation to other currencies, notably the British pound, Swiss franc and the yen have been surging (Chart 10). At the same time, foreign central banks have been amassing tremendous gold reserves, notably Russia and China, almost to the tune of the total annual output of the yellow metal (Chart 11). This further helps explain why the dollar may not be as strong as it should be. It also explains the stability of these currency pairs relative to the price of gold. Chart 10The World Is Diversifying Away From Dollars
The World Is Diversifying Away From Dollars
The World Is Diversifying Away From Dollars
Chart 11Central Banks Are Absorbing Most Gold Production
Central Banks Are Absorbing Most Gold Production
Central Banks Are Absorbing Most Gold Production
The U.S. dollar remains the reserve currency of the world today, but that exorbitant privilege is clearly fraying on the edges as the balance-of-payments dynamics are heading in the wrong direction. Over the next five years, the U.S. Congressional Budget Office (CBO) estimates that the U.S. budget deficit will swell to 4.5% of GDP. Assuming the current account deficit widens a bit then stabilizes, this will pin the twin deficits at 8.1% of GDP. This assumes no recession, which would have the potential to swell the deficit even further (Chart 12). Chart 12A Twin Deficit Cliff For The Dollar
A Twin Deficit Cliff For The Dollar
A Twin Deficit Cliff For The Dollar
The U.S. saw its twin deficits swell to almost 13% of GDP following the financial crisis, but the difference then was that in the wake of the commodity boom the dollar was cheap (and commodity currencies overvalued). The subsequent shale revolution also greatly cushioned the U.S. trade deficit. Shale productivity remains robust and U.S. output will continue to rise, but the low-hanging fruit has already been plucked. For one reason or another, foreign central banks are diversifying out of dollars. If due to the changing landscape in trade, this is set to continue. If it is an excuse to shy away from the rapidly rising U.S. twin deficits, this will continue as well. And if the U.S. dollar cannot sufficiently rally on “good news,” expect it to sink when the bad news eventually starts rolling in. That said, the timing remains uncertain. Private Capital Flows Foreign official flows might have been fleeing the U.S. dollar because it has lost some luster as a reserve currency, but private capital will begin stampeding toward the exits when the return on invested capital (ROIC) for U.S. assets falls below their cost of capital. For investors with a long horizon, this may already be happening. Take 10-year government bonds for example. For the Japanese or German investor, borrowing in local currency and investing in the U.S. might seem like the logical course of action given negative domestic rates and a 10-year Treasury yield of 2.4%. However, this positive carry suddenly evaporates when one factors in hedging costs (Chart 13). Chart 13JGBs More Attractive Than Hedged Treasuries
JGBs More Attractive Than Hedged Treasuries
JGBs More Attractive Than Hedged Treasuries
During bull markets, countries that have negative interest rates are subject to powerful outflows from carry trades. The impact of these are difficult to measure, but it is fair to assume that periods of low hedging costs (which tend to correspond to periods of lower volatility) can be powerful catalysts. As markets get volatile and these trades get unwound, unhedged trades become victim to short-covering flows. With many yield curves around the world inverting, the danger is that the frequency of this short-covering implicitly rises, since long-bond returns are falling short of spot rates. One winner as volatility starts to rise is the yen. Investors should consider initiating short USD/JPY positions today as a hedge. Outside the fixed-income space, what matters is that relative ROICs are higher than the cost of capital. Both are difficult to measure for many emerging or even developed economies across asset classes. However, for the equity market, a good starting point has always been valuations as exchange rates tend to move to equalize returns across countries. The forward P/E on the MSCI U.S., Europe and Japan indexes is 16.5x, 12.6x and 12.3x. The skew towards the U.S. is because market participants expect U.S. profits to keep outperforming, the U.S. currency to keep appreciating, or a combination of the two. However, empirically, current U.S. valuations suggest future earning streams have already been fully capitalized today (Chart 14). Chart 14AReturn On Capital Could Be Lowest In The U.S. (1)
Return On Capital Could Be Lowest In The U.S. (1)
Return On Capital Could Be Lowest In The U.S. (1)
Chart 14BReturn On Capital Could Be Lowest In The U.S. (2)
Return On Capital Could Be Lowest In The U.S. (2)
Return On Capital Could Be Lowest In The U.S. (2)
Chart 14CReturn On Capital Could Be Lowest In The U.S. (3)
Return On Capital Could Be Lowest In The U.S. (3)
Return On Capital Could Be Lowest In The U.S. (3)
The expected 10-year annualized return for MSCI U.S. is 3.1%, versus 5.5% for MSCI Europe and 9.6% for MSCI Japan. If we assume the U.S. dollar is overvalued, as some models suggest, this will further erode future U.S. returns. Net equity portfolio flows into the U.S. are already negative, as shown in a previous chart. This means the day of reckoning for the U.S. dollar may not be far off when current tailwinds eventually fade. Chester Ntonifor, Foreign Exchange Strategist chestern@bcaresearch.com Trades & Forecasts Forecast Summary Core Portfolio Tactical Trades Closed Trades
Highlights Global equities and other risk assets will trade sideways with elevated volatility over the coming weeks before grinding higher for the remainder of the year, as global growth finally accelerates after a series of false starts. We now see the Fed raising rates more slowly than we had previously envisioned, but ultimately having to scramble to hike rates in order to quell inflation. The fed funds rate will probably plateau at 4% in 2021, implying nine quarter-point hikes more than the market is currently discounting. Over a 12-month horizon, investors should overweight global equities, underweight government bonds, and maintain a neutral allocation to cash. The dollar will peak in the second quarter and then weaken over the remainder of the year and into 2020, before starting to strengthen again late next year. Investors should prepare to temporarily upgrade EM and European stocks over the coming weeks, while increasing exposure to cyclical equity sectors. Industrial metals and oil will strengthen over the course of the year. Gold should be bought on any dip. Investors should begin to de-risk their portfolios in late-2020 in anticipation of a recession in 2021.
Chart 001
Feature Here We Go Again? After having become more defensive last June, we turned bullish on stocks following the December post-FOMC meeting plunge. As stocks continued to rebound, we tempered our optimism. In the beginning of March, we wrote that “having rallied since the start of the year, global stocks will likely enter a ‘dead zone’ over the next six-to-eight weeks as investors nervously await the proverbial green shoots to sprout.”1 Last Friday’s release of disappointing European PMI data poured some herbicide on the green shoots thesis. Germany’s manufacturing PMI hit a six-year low, with the new orders component registering the weakest reading since the Great Recession. This took the 10-year German bund yield into negative territory for the first time since 2016. The U.S. 10-year Treasury yield also fell to a 15-month low, causing the 3-month/10-year curve to invert. Historically, an inverted yield curve has been a reliable predictor of U.S. recessions (Chart 1). Chart 1Yield Curve Inversions, Recessions, And The Term Premium
Yield Curve Inversions, Recessions, And The Term Premium
Yield Curve Inversions, Recessions, And The Term Premium
President Trump’s decision to appoint TV commentator Stephen Moore to the Fed’s Board of Governors did not help matters. Recommended by fellow supply-side “economist” Larry Kudlow, Moore is best known for dismissing concerns over the state of the housing market in 2007, his spot-on 2010 prediction that QE would cause hyperinflation, and his belief that the Trump tax cuts would lead to a smaller budget deficit. Global Growth Will Accelerate In The Second Half Of The Year Given all these worrisome developments, is it time to turn cyclically bearish on the economic outlook and risk assets again? We do not think so. While the next few weeks could be challenging for equities – a risk that our MacroQuant model is currently flagging – sentiment should improve as global growth finally accelerates after a series of false starts. Indeed, some positive signs are already visible: The diffusion index of our global leading economic indicator, which tracks the share of countries with rising LEIs, has moved higher (Chart 2). It leads the global LEI. Service sector PMIs have also generally improved, suggesting that the weakness in global growth remains concentrated in trade and manufacturing. And even on the trade front, a few forward-looking indicators such as the Baltic Dry Index and the weekly Harpex shipping index, which measures global container shipping activity, have bounced off their lows. We would downplay the signal from the yield curve, as it currently is severely distorted by a negative term premium. If the 10-year Treasury term premium were back to where it was in 2004, the 3-month/10-year slope would be more than 200 bps steeper, and nobody would be talking about this issue. In fact, given today’s term premium, the curve would have almost certainly inverted in 1995. Anyone who got out of stocks back then would have missed out on one of the greatest bull markets in history. It should also go without saying that some of the decline in the U.S. 10-year yield reflects a positive development: The Fed has turned more dovish! If one looks at the 10-year/30-year portion of the yield curve, it has actually steepened. This is a sign that the market is seeing the Fed’s actions as being reflationary in nature. There is no clear causal mechanism by which an inverted yield curve slows economic activity, apart from it potentially becoming a self-fulfilling prophecy where the yield-curve inversion scares investors, thereby leading to a tightening in financial conditions (Chart 3). Such “doom loops” are conceptually possible, but as we discussed earlier this year, they are unlikely to occur in the current environment.2 At any rate, financial conditions have eased since the start of the year. This should boost growth in the coming months. Chart 2Global Growth May Be ##br##Starting To Stabilize
Global Growth May Be Starting To Stabilize
Global Growth May Be Starting To Stabilize
Chart 3Easier Financial Conditions Since The Start Of The Year Bode Well For Global Growth
Easier Financial Conditions Since The Start Of The Year Bode Well For Global Growth
Easier Financial Conditions Since The Start Of The Year Bode Well For Global Growth
Chinese Credit Growth Set To Rise Global growth has been weighed down by a slowing Chinese economy. Last year’s deleveraging campaign led to a significant deceleration in investment spending, which had negative repercussions for capital equipment and commodity producers all over the world (Chart 4). Historically, China has loosened the reins on the financial sector whenever credit growth has fallen towards nominal GDP growth (Chart 5). It appears we have reached this point. Despite a weak seasonally-distorted February print, credit growth has finally accelerated on a year-over-year basis. Chart 4China: The Deleveraging Campaign Had Adverse Effects On Investment Spending
China: The Deleveraging Campaign Had Adverse Effects On Investment Spending
China: The Deleveraging Campaign Had Adverse Effects On Investment Spending
Chart 5Historically, China Has Scaled Back On Deleveraging When Credit Growth Has Fallen Close To Nominal GDP Growth
Historically, China Has Scaled Back On Deleveraging When Credit Growth Has Fallen Close To Nominal GDP Growth
Historically, China Has Scaled Back On Deleveraging When Credit Growth Has Fallen Close To Nominal GDP Growth
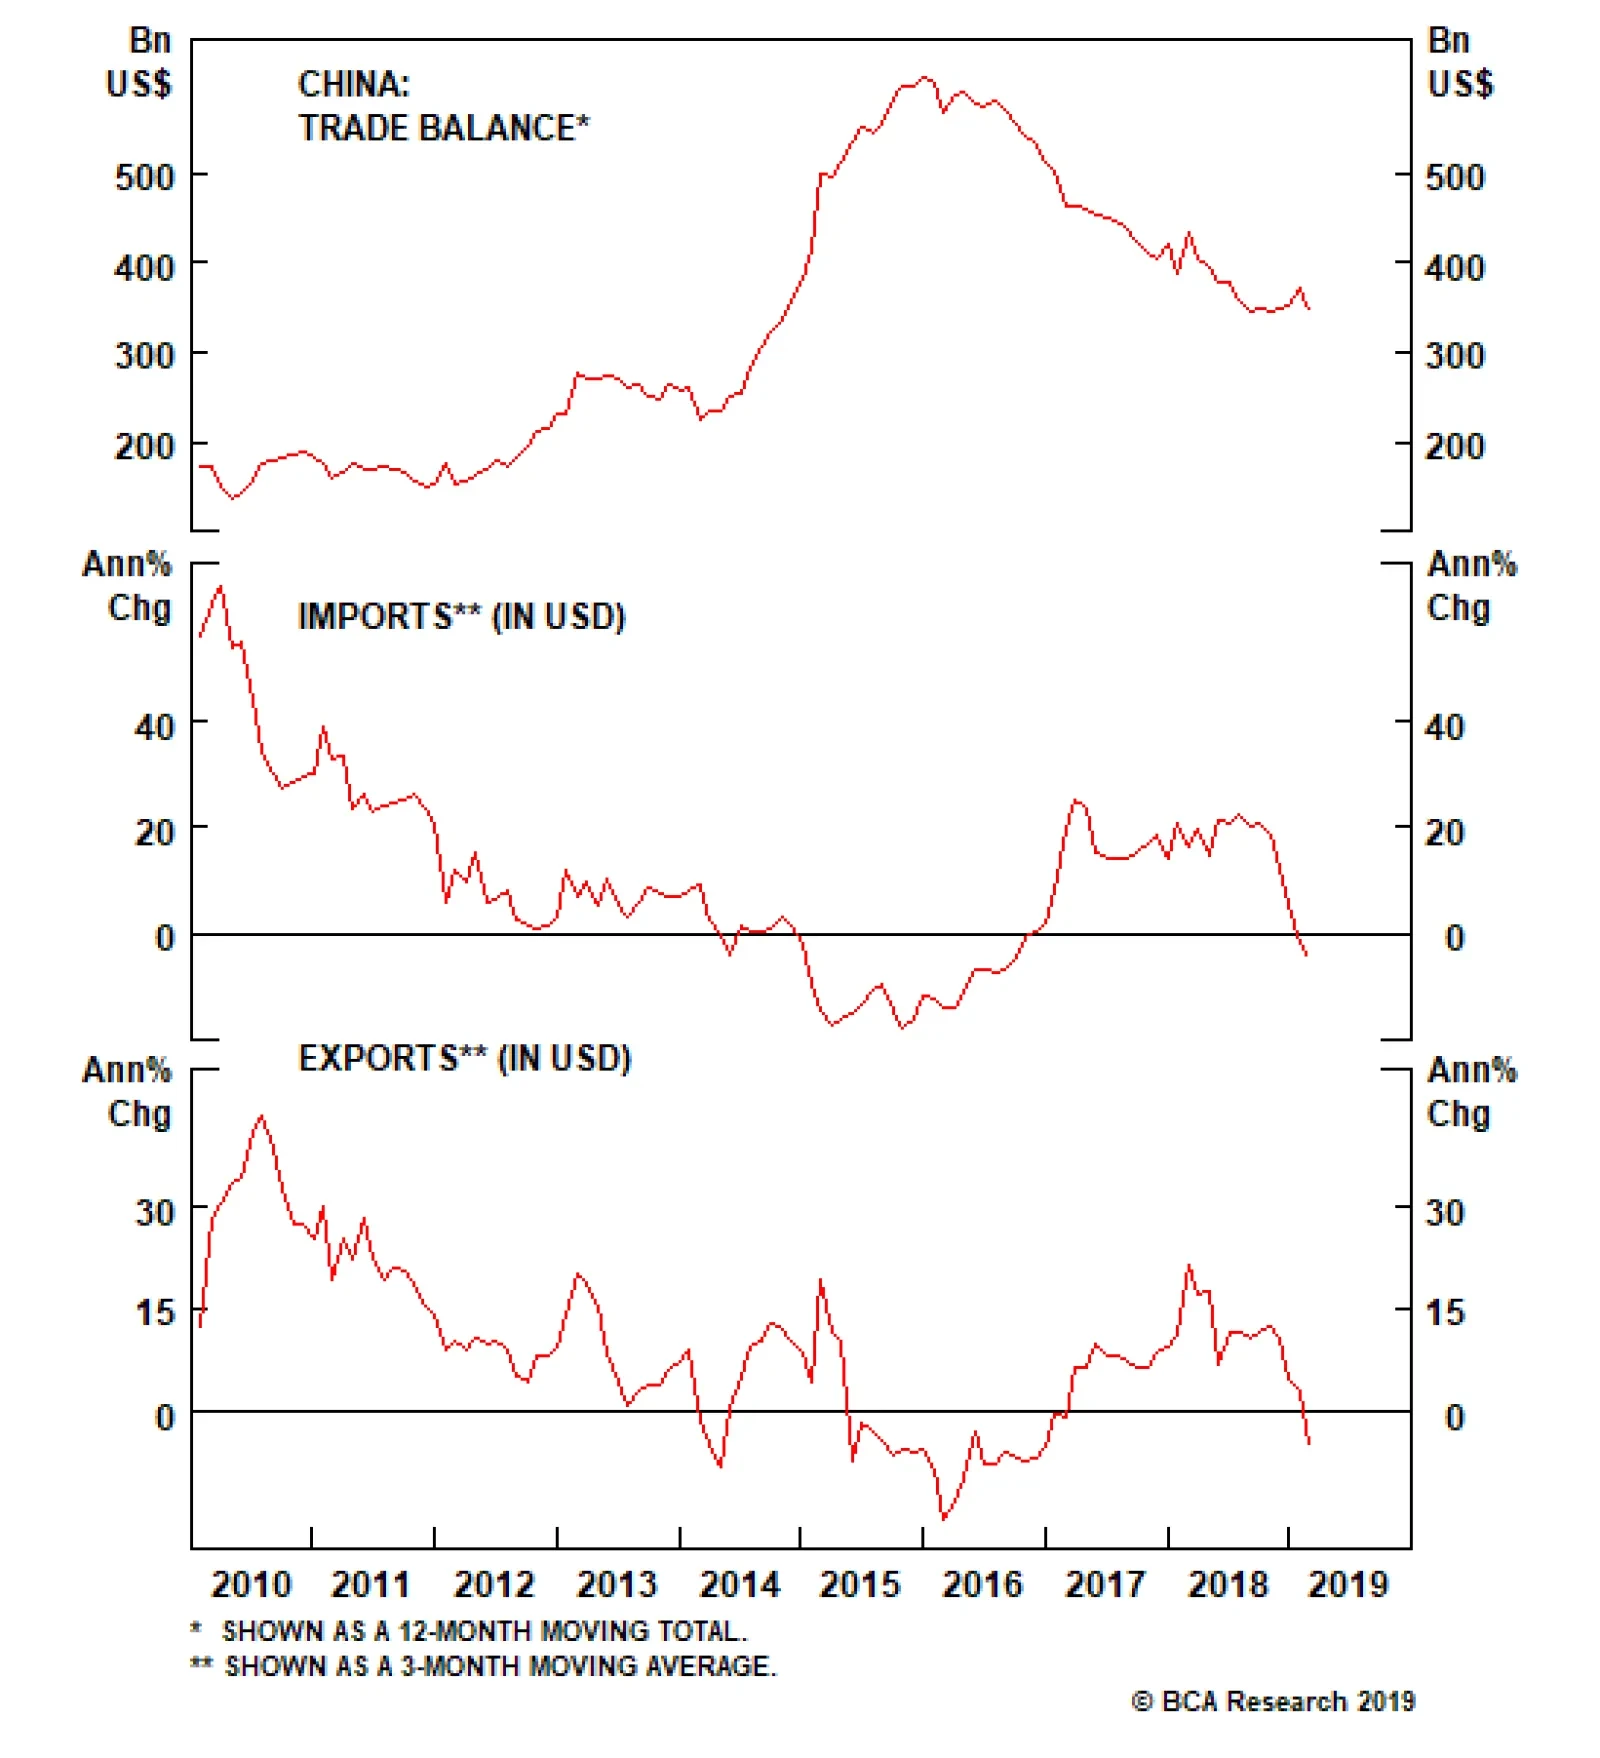
We do not expect Chinese credit growth to rise as much as in past releveraging cycles. However, this is because the economy is in better shape, not because there is some intrinsic constraint to increasing debt from current levels. China’s elevated savings rate has kept interest rates well below trend nominal GDP growth, which is the key determinant of debt sustainability (Chart 6).3 As long as the central government maintains an implicit guarantee on most local and corporate debt, as it is currently doing, default risk will remain minimal. In any case, given that total debt stands at 240% of GDP, even a one percentage-point increase in credit growth would generate a hefty 2.4% of GDP in credit stimulus. The Chinese credit impulse leads imports by about six-to-nine months (Chart 7). This bodes well for global trade in the second half of the year. Chart 6China's High Savings Rate Has Kept Interest Rates Well Below Trend Nominal GDP Growth
China's High Savings Rate Has Kept Interest Rates Well Below Trend Nominal GDP Growth
China's High Savings Rate Has Kept Interest Rates Well Below Trend Nominal GDP Growth
Chart 7Global Trade Will Benefit From A Chinese Reflationary Impulse
Global Trade Will Benefit From A Chinese Reflationary Impulse
Global Trade Will Benefit From A Chinese Reflationary Impulse
A Lull In The Trade War? A de-escalation in the trade war would help matters. As a self-professed master negotiator, Donald Trump needs to secure a deal with China before next year‘s presidential election, while also convincing American voters that the agreement was concluded on favorable terms for the United States. Reaching a deal with China early on in his term would have been risky for Trump if it had failed to bring down the bilateral trade deficit – an entirely likely outcome given how pro-cyclical U.S. fiscal policy is. At this point, however, Trump could crow about making a great deal with China while reassuring voters that the product of his brilliance will be realized only after he has been re-elected. Thus, the likelihood that Trump will seek to strike a deal has risen. For their part, the Chinese want as much negotiating leverage as they can muster. This means being able to convincingly demonstrate that their economy is strong enough to handle the repercussions from turning down a trade deal that fails to serve their interests. Since the credit cycle is the dominant driver of Chinese growth, this requires putting the deleveraging campaign on the backburner. Faster Global Growth And Stronger Domestic Demand Will Benefit Europe Stronger Chinese growth will help the European export sector later this year. The export component of the Chinese Caixin PMI has moved up from its lows. It leads the euro area PMI by about three months. Meanwhile, euro area domestic demand will benefit from a more accommodative fiscal policy and lower bond yields. The decline in bond yields will be especially helpful to Italy. The spike in yields and loss of business confidence following the election of a populist government last March plunged the economy into recession (Chart 8). Now that the 10-year BTP yield has fallen more than 100 bps from its highs, the Italian economy should start to perk up. The ECB will not raise rates this year even if domestic growth speeds up, but the market will probably price in a few rate hikes in 2020 and beyond. This will allow for a modest re-steepening of yield curves in core European bond markets, which should be positive for long-suffering bank profits. Brexit remains a concern. The ongoing saga has reached the farcical stage where: 1) The U.K. has voted to leave the EU; but 2) Parliament has voted to stay in the EU unless it reaches a satisfactory deal with Brussels; while 3) rejecting the only deal with Brussels that was on offer. Given that most British voters no longer want Brexit (Chart 9), we think that the government will kick the proverbial can down the road until a second referendum is announced or a “soft Brexit” deal is formulated. Either outcome would be welcomed by markets. Chart 8Italian Bond Yields Are A Headwind No More
Italian Bond Yields Are A Headwind No More
Italian Bond Yields Are A Headwind No More
Chart 9U.K.: In The Case Of A Do-Over, The Remain Side Would Likely Win
U.K.: In The Case Of A Do-Over, The Remain Side Would Likely Win
U.K.: In The Case Of A Do-Over, The Remain Side Would Likely Win
What Will The Fed Do?
Chart 10
Last year’s “Christmas Crash” clearly shifted the Fed’s reaction function in a more dovish direction. We do not expect Jay Powell to raise rates over the next few months, but a reacceleration in global growth is likely to prompt the Fed to tighten anew in December. The Fed will continue raising rates once per quarter in 2020, before accelerating the pace of tightening in 2021 in response to rising inflation. In all, we see the fed funds rate increasing to around 4% by the end of this cycle. This represents nine quarter-point hikes more than the market is currently discounting (Chart 10). We were stopped out of our short fed funds futures trade, but we recommend that clients short the June-2021 fed funds futures or a similar instrument. The U.S. Economy: Great Again Fundamentally, the U.S. economy is on solid ground and can handle higher interest rates. Unlike a decade ago, the housing market is in good shape (Chart 11). The homeowner vacancy rate stands near a record low. Judging by FICO scores, the quality of mortgage lending remains high. The labor market is also firm, with job openings hitting another record high in February (Chart 12). The combination of a healthy housing and labor market is invariably good for consumers. Chart 11U.S. Housing Fundamentals Are Solid
U.S. Housing Fundamentals Are Solid
U.S. Housing Fundamentals Are Solid
Chart 12The U.S. Labor Market Is Firm
The U.S. Labor Market Is Firm
The U.S. Labor Market Is Firm
Chart 13
The personal savings rate currently stands at 7.6%, notably higher than one would expect based on the ratio of household net worth-to-disposable income (Chart 13). A decline in the savings rate would allow consumer spending to increase more quickly than income. With the latter being propped up by rising wages, this will be bullish for consumption. Capital spending intentions have dipped over the past few months, but remain elevated by historic standards (Chart 14). The real nonresidential capital stock has grown by an average of only 1.7% since the start of the recovery, down from 3% in the pre-recession period (Chart 15). A cyclical upswing in productivity growth, rising labor costs, and low levels of spare capacity should all motivate businesses to invest in new plant and equipment. Chart 14Capital Spending Intentions Have Softened, But Remain Elevated
Capital Spending Intentions Have Softened, But Remain Elevated
Capital Spending Intentions Have Softened, But Remain Elevated
Chart 15There Is Room For More U.S. Capital Investment
There Is Room For More U.S. Capital Investment
There Is Room For More U.S. Capital Investment
Corporate Debt: How Much Of A Risk? Chart 16U.S. Corporate Debt Is Not Extreme By Global Standards
U.S. Corporate Debt Is Not Extreme By Global Standards
U.S. Corporate Debt Is Not Extreme By Global Standards
Corporate debt levels have increased significantly in recent years, while underwriting standards have deteriorated, as evidenced by the proliferation of covenant-lite loans. Nevertheless, the situation is far from dire. Relative to other countries, U.S. corporate debt is quite low (Chart 16). At 143% of GDP, corporate debt in France is twice that of the United States. This is not to suggest that everything is fine in the French corporate sector; but the fact is that France has not had a corporate debt crisis. This signals that the U.S. is not at imminent risk of one either. Netting out cash, U.S. corporate debt as a share of GDP is at the same level it was in 1989, a year in which the fed funds rate was close to nine percent. The ratio of corporate net debt-to-EBITD remains reasonably low. The interest coverage ratio is above its historic average. In addition, corporate assets have also risen quite briskly over the past few years, which has kept the corporate debt-to-asset ratio broadly stable (Chart 17). The corporate sector financial balance – the difference between corporate income and spending – is still in positive territory at 1% of GDP. Every recession in the past 50 years began when the corporate sector financial balance was in deficit (Chart 18). Chart 17U.S. Corporate Debt: How High?
U.S. Corporate Debt: How High?
U.S. Corporate Debt: How High?
Chart 18Corporate Sector Financial Balance Still In Surplus
Corporate Sector Financial Balance Still In Surplus
Corporate Sector Financial Balance Still In Surplus
Unlike mortgages, which are often held by leveraged institutions, most corporate debt is held by unleveraged players such as pension funds, insurance companies, mutual funds, and ETFs. Bank loans account for only 18% of nonfinancial corporate sector debt, down from 40% in 1980 (Chart 19). The share of leveraged loans held by banks has declined from about 25% a decade ago to less than 10% today. Moreover, banks today hold much more high-quality capital than in the past (Chart 20). This makes corporate debt less systemically important for the economy. Chart 19Banks Have Reduced Their Exposure To The Corporate Sector
Banks Have Reduced Their Exposure To The Corporate Sector
Banks Have Reduced Their Exposure To The Corporate Sector
Chart 20U.S. Banks Are Well Capitalized
U.S. Banks Are Well Capitalized
U.S. Banks Are Well Capitalized
One of the reasons we turned more bullish on risk assets in December was because stocks had plunged and corporate spreads widened without much follow-through in financial stress indices. For example, the infamous TED spread barely budged (Chart 21). Chart 21TED Spreads Are Well Behaved, Indicating No Major Signs Of Financial Stress
TED Spreads Are Well Behaved, Indicating No Major Signs Of Financial Stress
TED Spreads Are Well Behaved, Indicating No Major Signs Of Financial Stress
Everyone Agrees With Larry Given the lack of major imbalances in the U.S. economy, why do investors believe that the Fed cannot raise rates further even though the Fed funds rate in real terms is barely above zero? The answer is that investors appear to have bought into Larry Summers’ secular stagnation thesis, which posits that the neutral rate of interest is much lower today than it was in the past. We have some sympathy for this thesis, but it is important to remember that it is a theory about the long-term determinants of interest rates such as productivity and demographic trends. The theory says little about the cyclical drivers of interest rates, including the amount of spare capacity in the economy, the stance of fiscal policy, credit growth, and wage trends. Earlier this decade, when we were still very bullish on bonds, one could have plausibly argued that the economy needed extremely low interest rates: The output gap was still large; the deleveraging cycle had just begun; home and equity prices were depressed; wage growth was anemic; and fiscal policy had turned restrictive after a brief burst of stimulus during the Great Recession. Far From Neutral? All of the forces mentioned above have either fully or partially reversed course over the past few years. Take fiscal policy as one example. The IMF estimates that the U.S. structural budget deficit averaged 3.3% of GDP in 2014-15. In 2019-20, the IMF reckons the deficit will average 5.6% of GDP. To what extent has easier fiscal policy raised the U.S. neutral rate of interest? Let us conservatively assume that every $1 of additional fiscal stimulus adds $1 to aggregate demand. In this case, fiscal policy has added 2.3% of GDP to aggregate demand over the past five years. Suppose that a one-percentage point increase in aggregate demand raises the neutral rate of interest by 1%, which is in line with the specification of the Taylor Rule that former Fed Chair Janet Yellen favored. This implies that fiscal policy alone has raised the neutral rate by over two percentage points. The discussion above suggests that cyclical factors may have pushed up the neutral rate considerably, even if long-term structural factors are still dragging it down. Since the Fed is supposed to set interest rates with an eye on what is appropriate for the economy over the next year or two, rates may end up staying too low for too long. This will cause the economy to overheat, eventually leading to a surge in inflation. The Inflation Boogeyman The good news is that none of our favorite indicators point to a major imminent inflationary upswing (Chart 22): Despite higher tariffs, consumer import price inflation has slowed; core intermediate producer price inflation has decelerated; the prices paid components of the ISM and regional Fed surveys have plunged; inflation surprise indices have rolled over; and both survey and market-based measures of inflation expectations remain below where they were last summer. In keeping with these developments, BCA’s proprietary Pipeline Inflation Indicator has fallen to a two-and-a-half-year low. Wage growth has accelerated, but productivity growth has increased by even more. As a result, unit labor cost inflation has been coming down since the middle of last year. Unit labor costs lead core CPI inflation by about 12 months (Chart 23). This implies that consumer price inflation is unlikely to reach uncomfortably high levels at least until the second half of next year. Chart 22No Symptoms of An Imminent Major Inflationary Upswing In The U.S. ...
No Symptoms of An Imminent Major Inflationary Upswing In The U.S. ...
No Symptoms of An Imminent Major Inflationary Upswing In The U.S. ...
Chart 23... And Decelerating Unit Labor Costs Will Dampen Inflationary Pressures For The Time Being
... And Decelerating Unit Labor Costs Will Dampen Inflationary Pressures For The Time Being
... And Decelerating Unit Labor Costs Will Dampen Inflationary Pressures For The Time Being
At that point, risks are high that inflation will move up. This could force the Fed to start raising rates aggressively in early-2021, a course of action that will push up the dollar and cause equities and spread product to sell off. The resulting tightening in financial conditions will probably plunge the U.S. and the rest of the world into recession in mid-to-late 2021. Stay Bullish Global Equities For Now, Turn Defensive Late Next Year Chart 24Analyst Expectations Are Quite Muted
Analyst Expectations Are Quite Muted
Analyst Expectations Are Quite Muted
The two-stage Fed tightening cycle discussed above – gradual rate hikes starting in December and continuing into 2020, and more aggressive hikes thereafter in response to rising inflation – shapes our investment views over the next few years. The Key Financial Market Forecasts Chart at the beginning of this publication provides a rough sketch of where we think the main asset classes are heading. We suspect that equities and other risk assets will be able to digest the first stage of rate tightening, albeit with heightened volatility around the time when the Fed starts preparing the market for another hike later this year. Unlike last September, earnings estimates are much more conservative. Bottom-up estimates foresee EPS rising by 3.9% in the U.S. and 5.4% in the rest of the world in 2019 (Chart 24). The combination of faster growth, easier financial conditions, and ongoing share buybacks implies some upside to these numbers. Perhaps more importantly, unlike in September, the Fed will only start hiking rates if the economy is performing well. Powell erred in saying that “rates were a long way from neutral” just when the U.S. economy was starting to slow. Had he uttered those words when U.S. growth was still accelerating, investors would have probably disregarded them. Jay Powell won’t make the same mistake again. Rather, he will make a different one: He will let the economy overheat to the point where the Fed finds itself clearly behind the curve and forced to scramble to catch up. The resulting stagflationary environment – where growth is slowing due to a shortage of available workers and inflation is on the upswing – will be toxic for equities and other risk assets. While it is difficult to be precise about timing, we recommend that investors maintain a modestly pro-risk stance over the next 12-to-18 months. However, they should pare back exposure to equities and spread product late next year before the Fed ramps up the pace of rate hikes. Prepare To Temporarily Upgrade International Stocks The U.S. stock market tends to be “low beta” compared to other bourses. If global growth accelerates in the second half of this year, international stocks will outperform their U.S. counterparts. We sold our put on the EEM ETF for a gain of 104% on Jan 3rd, and now recommend being outright long EM equities. We will be looking to upgrade both EM and European equities to overweight in the coming weeks in currency-unhedged terms once we see more confirmatory evidence of a global growth revival. We have mixed feeling about Japanese stocks. Stronger global growth will benefit Japanese multinationals, but firms focused on the domestic market may suffer if the government goes ahead and raises the sales tax in October. We would hold off upgrading Japanese stocks for the time being. At the global sector level, we pared back our defensive tilt earlier this year, after having turned more cautious last summer. We recommend that investors overweight energy and industrials. We are also warming up to financials and materials. The former will benefit from a steepening in yield curves later this year as well as from faster credit growth. The latter will gain from a more robust Chinese economy. We would maintain a neutral allocation to health care, info tech, and communication services. Real estate and utilities will both suffer once bond yields start moving higher. Classically defensive sectors such as consumer staples will also underperform. Global Bond Yields Likely To Rise Global bond yields are likely to rise over the next 12-to-18 months as growth surprises on the upside. Yields will continue rising into the first half of 2021 as inflation accelerates. Unlike in past risk-off episodes, Treasurys will not provide much of a safe haven in the lead up to the next recession. As noted above, one of the reasons that bond yields are so low today is because the term premium is very depressed. The cumulative effect of Fed bond purchases has probably depressed the term premium, but the bigger impact has stemmed from the fact that investors see Treasurys as an insurance policy against various macro risks. Investors are accustomed to thinking that when an economy slides into recession, equity prices will fall, the housing market will deteriorate, wage gains will recede, job prospects will worsen, but at least the value of their bond portfolio will go up! The problem with this reasoning is that it is only valid when the Fed is hiking rates in response to stronger growth. If the Fed is hiking rates because inflation is getting out of hand, Treasury yields could end up rising while stocks are falling. This was actually the norm between the late-1960s and early-2000s (Chart 25). Chart 25Treasury Yields Could Rise While Stocks Fall
Treasury Yields Could Rise While Stocks Fall
Treasury Yields Could Rise While Stocks Fall
If Treasurys lose their safe-haven status, the term premium will move higher. A vicious circle could develop where rising bond yields weaken the stock market, causing investors to flood out of both stocks and bonds and into cash, leading to even higher bond yields and lower equity prices. Investors should maintain a modest short duration stance towards Treasurys over the next 12 months, and then move to maximum underweight duration in mid-2020 as inflation starts to break out. Going long duration will only make sense once the Fed has raised interest rates into restrictive territory and the economy slides into recession. That is not likely to occur until the second half of 2021. Regionally, we favor European, Canadian, Australian, New Zealand, and especially Japanese government bonds over the next 12 months relative to U.S. Treasurys. The U.S. economy is at the greatest risk of overheating. In currency-hedged terms, the 10-year U.S. Treasury yield is among the lowest in the world (Table 1). Japanese 10-year bonds, for example, offer 2.72% in currency-hedged terms, while German bunds command 2.94%. Table 1Bond Markets Across The Developed World
Second Quarter 2019 Strategy Outlook: From Dead Zone To End Zone
Second Quarter 2019 Strategy Outlook: From Dead Zone To End Zone
The U.S. Dollar: Heading Towards A Soft Patch Gauging the outlook for the U.S. dollar is a bit tricky. Even though the Fed will only be raising rates gradually over the next 12 months, it will still hike more than what is discounted by markets. With most other central banks still sitting on the sidelines, short-term rate differentials are likely to move in favor of the greenback. That said, aside from Japan, stronger global growth will likely prompt investors to price in a few more rate hikes in other developed economies in 2020 and beyond. Consequently, long-term yield differentials may not widen by as much as short-term differentials. Perhaps more importantly, the U.S. dollar is a countercyclical currency, meaning that it moves in the opposite direction of global growth (Chart 26). This countercyclicality stems from the fact that the U.S. economy is more geared towards services than manufacturing compared with the rest of the world (Chart 27). As such, when global growth accelerates, capital tends to flow from the U.S. to the rest of the world, translating into more demand for foreign currency and less demand for dollars. Chart 26The Dollar Is A Countercyclical Currency
The Dollar Is A Countercyclical Currency
The Dollar Is A Countercyclical Currency
Chart 27The U.S. Is A Low-Beta Play On Global Growth
The U.S. Is A Low-Beta Play On Global Growth
The U.S. Is A Low-Beta Play On Global Growth
If global growth picks up in the back half of this year, the dollar will likely peak in the second quarter and weaken over the remainder of 2019 and into 2020. The dollar’s trajectory may thus follow a similar course to the one in 2017, a year in which the Fed raised rates four times, but the broad trade-weighted dollar nevertheless managed to weaken by 7%. Chart 28The Yen Is A Risk-Off Currency
The Yen Is A Risk-Off Currency
The Yen Is A Risk-Off Currency
As was the case in 2017, the euro will probably gain ground later this year against the U.S. dollar as will most EM and commodity currencies. However, just as the Japanese yen failed to participate in the rally that most currencies experienced against the dollar in 2017, it will struggle to gain much traction against the greenback. The yen is a “risk-off” currency and thus tends to fall whenever global risk assets rally (Chart 28). In addition, the yen will suffer if global bond yields move up relative to JGB yields later this year, as will likely be the case if the BoJ is forced to prolong its yield curve control regime in the face of tighter fiscal policy. We would go long EUR/JPY on any break below 123. After First Weakening, The Dollar Will Rally Again Late Next Year As the U.S. economy encounters ever more supply-side constraints in 2020, growth will slow and inflation will accelerate. The Fed will respond by hiking rates more quickly than inflation is rising. The resulting increase in real interest rates will put upward pressure on the dollar. In this stagflationary environment, equities will tumble and credit spreads will widen. Tighter U.S. financial conditions will reverberate around the world, causing global growth to decelerate even more than it would have otherwise. This will further turbocharge the dollar. The greenback will only peak once the Fed starts cutting rates in late-2021. Commodities: Getting More Bullish A weaker dollar later this year, along with stronger global growth led by a resurgent China, will be bullish for commodities. BCA’s commodity strategists recommend going long copper at current prices. They are also maintaining their bullish bias towards oil. They expect Brent to average $75/bbl this year and $80/bbl in 2020. Higher U.S. shale output will be offset by delays in building out deepwater export facilities, which will keep supply fairly tight. In past reports, we discussed the merits of buying gold as an inflation hedge. However, we held back from doing so because of our bullish dollar view. Now that we see the dollar peaking over the next few months, we would be buyers of gold on any break below $1275/ounce. Peter Berezin, Chief Global Strategist Global Investment Strategy peterb@bcaresearch.com Footnotes 1 Please see Global Investment Strategy Weekly Report, “Gretzky’s Doctrine,” dated March 1, 2019. 2 Please see Global Investment Strategy Weekly Report, “Low Odds Of An FCI Doom Loop,” dated January 4, 2019. 3 Please see Global Investment Strategy Weekly Report, “Is There Really Too Much Government Debt In The World?” dated February 22, 2019. Strategy & Market Trends MacroQuant Model And Current Subjective Scores
Chart 29
Tactical Trades Strategic Recommendations Closed Trades
Highlights Driven by its fear that deflation is a more intractable danger than inflation, the Federal Reserve has enshrined its pause for the remainder of 2019 in order to lift inflation expectations. Since the U.S. business cycle expansion is not over, the Federal Reserve’s plan to put policy on hold this year raises the odds that the economy will overheat. Global growth is set to bottom during the second quarter in response to easier financial conditions. Accommodative policy, rebounding global economic activity and a softening dollar will boost risk asset prices during the remainder of the year. Safe-haven bonds, including Treasurys, will underperform cash over the coming 12 to 18 months. The rally in risk assets will ultimately prove the last hurrah as the Fed will resume tightening later this year or in 2020, and a bear market lies down the road. Only investors with tactical investment horizons should aggressively play this rally. Those with longer investment horizons should use this rally to lighten up their exposure to risk. Feature Introduction Following the introduction of the word “patience” into the Federal Reserve’s lexicon, a move lower in the so-called Fed dots was to be anticipated. The FOMC now expects no rate increases in 2019 and only one hike in 2020. The interest rate market remains skeptical that the Fed will be able to deliver on its forecast. For now, the OIS curve is pricing in a 75% probability of a cut this year, and rates at 1.9% by the end of 2020. With the 10-year/3-month yield curve inverting last week and the U.S. Leading Economic Indicator still decelerating, it is no wonder that investors are betting on the Fed becoming ever more dovish (Chart I-1). BCA is inclined to take the Fed at its word – the next move will be a hike, not a cut. This call rests on our view of the business cycle: The fed funds rate is still somewhat below neutral, U.S. economic activity can expand further, and global growth is likely to trough soon. The current dovish inclination of global central banks will only nurture the cycle a little bit longer. Consequently, we continue to recommend a positive stance on stocks for the coming quarters, while keeping in mind that the cycle is long in the tooth, and that beyond this last climb lies a significant bear market. The U.S. Business Cycle Has Further To Run… The Fed remains data dependent, but this now means that depressed inflation expectations in the private sector need to be vanquished before the hiking can resume (Chart I-2). With the view that low realized inflation has curtailed expectations now common across major central banks, this implies that a temporary overshoot in actual core PCE will be tolerated in order to lift expectations. Chart I-1Worrisome Signs For Growth
Worrisome Signs For Growth
Worrisome Signs For Growth
Chart I-2The Fed Wants To Lift Inflation Expectations
The Fed Wants To Lift Inflation Expectations
The Fed Wants To Lift Inflation Expectations
Since consumer prices are a lagging variable, lifting both realized and anticipated inflation will only be possible if we move ever further along the business cycle, further pressuring the economy. Our base case remains that the risk of a recession is low in 2019, and is even receding in 2020. First, U.S. credit-dependent cyclical spending currently constitutes only 25.3% of potential GDP. As Chart I-3 illustrates, this is in line with its historical average, and well below the levels recorded near the end of previous business cycles. This suggests that the amount of vulnerability caused by misallocated capital is not yet in line with previous cycles. It also indicates that the share of output generated by the sectors most sensitive to higher rates is also low. Chart I-3U.S. Cyclical Spending: Limited Signs Of Vulnerability
U.S. Cyclical Spending: Limited Signs Of Vulnerability
U.S. Cyclical Spending: Limited Signs Of Vulnerability
Second, the consumer remains in good shape. Households have deleveraged, and debt-service payments relative to disposable income are still near multi-generational lows (Chart I-4). Moreover, thanks to a saving rate of 7.6%, consumer spending is likely to move in line or even outperform income growth. On this front, the outlook is also good. As Chart I-5 demonstrates, the link between wages and salaries relative to the employment-to-population ratio for prime-age workers – a measure of labor utilization unaffected by the demographic changes that have muddied the interpretation of the unemployment rate – is still as tight as it was 20 years ago. Thus, as long as the labor market does not suddenly collapse, wage growth will continue to accelerate, supporting household income and consumption. Chart I-4Household Balance Sheets Are Solid
Household Balance Sheets Are Solid
Household Balance Sheets Are Solid
Chart I-5
Third, at 0.4% of GDP, the fiscal thrust remains positive. In other words, fiscal policy will still add to GDP in 2019. Fourth, we do not see the traditional symptoms associated with a fed funds rate above neutral. After dipping sharply in the second half of 2018, mortgage for purchase applications are back near their cycle highs (Chart I-6). Moreover, the performance of homebuilders’ equities relative to the broad market has begun to rebound, which is inconsistent with a fed funds rate above neutral. Chart I-6Mortgage Applications Do Not Suggest Policy Is Tight
Mortgage Applications Do Not Suggest Policy Is Tight
Mortgage Applications Do Not Suggest Policy Is Tight
Fifth, there is scope for the contribution from housing sector activity to morph from a negative to a positive. A fed funds rate below neutral historically is correlated with an improving housing market. Rising mortgage rates from 3.8% to 4.6% depressed home sales and construction output, and the fall in mortgage rates over the past x month 4.3% should stimulate housing activity (Chart I-7). Chart I-7Residential Activity Will Rebound This Year
Residential Activity Will Rebound This Year
Residential Activity Will Rebound This Year
Bottom Line: U.S. first-quarter GDP growth will be dismal, but one quarter does not make a trend. The low degree of economic vulnerability in the U.S., and the likelihood that the fed funds rate will stay below neutral for a while suggest that growth should rebound to the 2-2.5% range and should remain above-trend for the remainder of 2019. … And Global Growth Will Soon Trough As the cliché goes, it is darkest before the dawn. This is a fitting description of the world economy outside the U.S. right now. Global trade is depressed, global PMIs are moribund and nothing feels good. But it is exactly when nothing is going well that one needs to wonder what may cause the outlook to turn for the better. Thankfully, green shoots are emerging. To begin with, central banks around the world have taken a more dovish slant. This dovish forward guidance is nurturing global activity via a significant easing in global financial conditions, which is undoing the severe brake-pumping imposed on global growth in the fourth quarter of 2018 (Chart I-8). Chart I-8Global Financial Conditions Are Easing
Global Financial Conditions Are Easing
Global Financial Conditions Are Easing
This more dovish forward guidance has helped our Financial Liquidity Index, which sharply deteriorated through 2009, rebound. Historically, this presages an improvement in the BCA Global Leading Economic Indicator (Chart I-9). Improving liquidity conditions have already been reflected in lower real rates around the globe, creating a reflationary impulse. EM financial conditions are responding positively, pointing to an upcoming pick-up in industrial activity, as measured by our Global Nowcast (Chart I-10). Chart I-9Improving Global Liquidity Backdrop
Improving Global Liquidity Backdrop
Improving Global Liquidity Backdrop
Chart I-10A Tailwind From EM?
A Tailwind From EM?
A Tailwind From EM?
Our Global LEI diffusion Index has begun to reflect some of these developments. After forming a trough in 2018, more than 50% of the countries in our Global LEI are currently experiencing a sequential improvement in their LEIs. We are now entering the normal lag after which a broadening growth impulse converts into aggregate activity moving higher (Chart I-11). Most interestingly, investors do not seem to be anticipating such a rebound. There is therefore room for growth surprises around the world. Chart I-11Scope For Growth Surprises
Scope For Growth Surprises
Scope For Growth Surprises
China has a role to play in this story, will likely morph from a headwind to global growth to a positive. Positive may be a strong word, but at the very least, we expect China to stop detracting from global growth. Premier Li-Keqiang recently put the accent on stability and preserving employment, suggesting Chinese policymakers are likely to de-emphasize deleveraging over the coming 12-18 months. For Chinese growth to improve, deleveraging does not even have to stop. As both theory and history have shown, a slower pace of deleveraging means that the credit impulse moves back into positive territory and growth re-accelerates, even if only temporarily (Chart I-12). Chart I-12Growth Can Improve Even If Deleveraging Continues
Growth Can Improve Even If Deleveraging Continues
Growth Can Improve Even If Deleveraging Continues
As a thought experiment, if Chinese leverage were to stabilize this year and nominal growth were to hit 8% – the lower bound of the real GDP target of 6-6.5% and inflation of 2% – the Chinese credit impulse would surge to more than 10% of GDP (Chart I-13)! We are not forecasting such a large rebound in the impulse, but this exercise clearly shows that if the Chinese authorities – who are cutting taxes and trying to ease credit conditions for small- and medium-sized enterprises – want to favor stability and employment for just one year, the impact on growth will be non-negligible, even if deleveraging continues. Since domestic demand responds to the credit impulse, and imports sport an elevated beta to domestic demand, Chinese imports are likely to soon morph from a negative to something more neutral – maybe even a small positive for the rest of the world. Chart I-13A Thought Experiment
A Thought Experiment
A Thought Experiment
Finally, as weak as Europe is right now, it will likely be an important source of positive surprises in the second half of the year. To begin with, Europe is much more sensitive to EM growth conditions than the U.S. (Chart I-14). In the same way as Europe felt the full force of the deceleration in global trade last year, it will benefit from any improvement in trade this year.
Chart I-14
A myriad of idiosyncratic shocks rammed through the euro area last year, worsening an already difficult situation. The new WLTP emission standards caused German auto production to collapse by nearly 20%. Nonetheless, as contracting domestic manufacturing orders and a large inventory pullback in the final quarter of last year suggest, the inventory overhang has been worked off (Chart I-15, top panel). Chart I-15Passing European Idiosyncratic Shocks
Passing European Idiosyncratic Shocks
Passing European Idiosyncratic Shocks
Just as critically, Italy’s technical recession should end soon. The country’s economic malaise reflected the tightening in financial conditions that followed the violent battle between Rome and Brussels early last year. Ultimately, Rome folded: The budget deficit is 2.3% of GDP, not above 6%, and threats of leaving the union have been abandoned. Consequently, financial conditions are easing. Italian bond auctions are massively oversubscribed this year, and rising bond prices are supporting the solvency of the Italian banking system. The last hurdle affecting Europe was the fact that funding stress in the Italian and Spanish banking systems have been directly addressed by the TLTRO-III announced three weeks ago by the European Central Bank. Spanish and Italian banks have to refinance EUR 425 billion of TLTRO-II this June, in a year where a sizeable amounts of European bank bonds also needs to be refinanced. This is simply too much. With the ECB again bankrolling Italian and Spanish financial institutions, funding stress in the periphery can decline. Consequently, the European credit impulse, which had formed a valley in 2018 Q1, can continue its ascent (Chart I-15, bottom panel). Bottom Line: Investors expect little from the global economy outside the U.S., yet easing liquidity and financial conditions, a temporary shift in Chinese policy preferences and passing idiosyncratic shocks in Europe all point to improvement in global economic activity. U.S. Inflation Expectations Will Allow The Fed To Resume Rate Hikes Above-potential growth in the U.S. and rebounding economic activity in the rest of the world are consistent with higher – not lower – U.S. inflation. First, rebounding global growth is normally associated with a weakening dollar (Chart I-16). This time will not be different, especially as U.S. equity valuations relative to global stocks suggest that investors are particularly pessimistic on non-U.S. growth. A weaker dollar will lift import prices, commodity prices, and goods prices, helping inflation move higher. Chart I-16The USD Is Counter-Cyclical
The USD Is Counter-Cyclical
The USD Is Counter-Cyclical
Second, the change in the velocity of the money of zero maturity in the U.S. is consistent with a further strengthening in core inflation (Chart I-17). Chart I-17The Fisher Equations Points To Gently Rising Inflation
The Fisher Equations Points To Gently Rising Inflation
The Fisher Equations Points To Gently Rising Inflation
Third, above-trend U.S. growth in the context of elevated capacity utilization is also consistent with rising inflation (Chart I-18). Chart I-18Elevated U.S. Capacity Utilization
Elevated U.S. Capacity Utilization
Elevated U.S. Capacity Utilization
If these three forces can cause core PCE inflation to move slightly above 2% in the second half of 2019, this will likely result in inflation expectations firming. Moreover, the combination of positive growth surprises around the world and easy monetary and liquidity conditions will prove supportive of asset prices globally, implying further easing in global and U.S. financial conditions. This set of circumstances will allow the Fed to shift its tone toward the end of 2019, in order to crystalize additional hikes in 2020. Additionally, we estimate the U.S. terminal policy rate to be around 3.25%. In fact, a longer-than-originally-anticipated Fed pause reinforces confidence in this assessment, even if it means that it will take longer to reach the terminal level than we previously thought. Bottom Line: Our growth outlook is consistent with robust inflation and improving inflation expectations. This means we disagree with interest rate markets and anticipate the Fed will resume its hiking campaign instead of cutting rates next year. Moreover, easier-for-longer policy also strengthens our view that the fed funds rate can end this cycle near 3.25%. Stay Positive On Risk Assets For Now… Most bear markets are linked to recessions. It follows that if the U.S. business cycle can be extended and the Fed remains on the easy side of neutral for longer, then the S&P 500 has more upside (Chart I-19). So do global equities. Chart I-19Low Bear-Market Risk
Low Bear-Market Risk
Low Bear-Market Risk
This view is reinforced by the fact that buy-side analysts and investors alike have aggressively curtailed their expectations for EPS growth this year, to 3.9% for the U.S. and 4.9% outside the U.S. Yet, our profit model suggests that U.S. EPS growth is likely to come in at around 8.1% this year. Earnings revisions are pro-cyclical. Hence, our expectation that the BCA global Leading Economic Indicator meaningfully revives in the second half of 2019 points toward analysts having ample room to revise global earnings higher in the second half of the year (Chart I-20). Chart I-20Global Profit Margins Will Improve If Growth Rebounds
Global Profit Margins Will Improve If Growth Rebounds
Global Profit Margins Will Improve If Growth Rebounds
Moreover, global valuations experienced a reset last year. Despite a rebound, the forward P/E ratio for the MSCI All-Country World Index remains in line with 2014 levels, 12.5% lower than at their apex last year. When looking at the U.S., our composite valuation index has also improved meaningfully (Chart I-21). This improvement in valuations increases the probability that a bottom in global growth will lift stock prices. Chart I-21Large Improvement In The Equity / Risk Reward Ratio
Large Improvement In The Equity / Risk Reward Ratio
Large Improvement In The Equity / Risk Reward Ratio
Our Monetary Indicator further reinforces this message. After being a headwind for stocks over the past eight quarters, now that the Fed has paused and is essentially guaranteeing low real rates for an extended period, this gauge is growing more supportive of further equity price gains (Chart I-22). Chart I-22Stock-Friendly Monetary Backdrop
Stock-Friendly Monetary Backdrop
Stock-Friendly Monetary Backdrop
A below-benchmark duration exposure for fixed-income portfolio still makes sense, even if the Fed has prolonged its pause. As per our U.S. Bond Strategy service’s “Golden Rule Of Treasury Investing,” if the Fed increases rates more than the market has priced in 12 months prior, Treasurys underperform cash (Chart I-23). Even if the Fed does nothing this year, it will still be more than the OIS curve is currently pricing in. Moreover, the dollar is likely to soften and the Fed is increasingly taking the risk of falling behind the realized inflation curve. This should create upside not only for inflation breakevens but also for term premia, which are depressed everywhere across the G-10. The yield curve should modestly steepen in this environment. It may take a bit more time than we originally expected, but safe-haven bond yields are trending higher, not lower. Chart I-23The Golden Rule Of Treasury Investing
The Golden Rule Of Treasury Investing
The Golden Rule Of Treasury Investing
Spread products are also likely to continue to do well. Easy monetary policy, a soft U.S. dollar, an ongoing U.S. business expansion, an upcoming rebound in global growth and rising asset values all point toward a delay of the inevitable wave of defaults. Corporate bonds may offer poor value and credit quality has deteriorated, but an end to the business cycle and a tighter Fed will be key to catalyzing these poor fundamentals. We are not there yet. The Brexit saga continues to have the potential to unsettle markets. Nonetheless, we would fade any broad market sell-off linked to poor British headlines. As Marko Papic writes in this month's Special Report, despite continued political uncertainty in Westminster this year, the risk of a no-deal Brexit is dwindling by the minute, and political logic suggests that there is a high probability that the U.K. will ultimately remain in the EU in two to three years. Bottom Line: After the reset in valuations and earning expectations last year, markets should continue their ascent. The Fed has showed that its “put” is alive and well. This will both favor risk-taking and extend the duration of the business cycle. If global growth can rebound in the second quarter, it will create fertile ground for strong asset prices over the bulk of 2019. Treasury yields will also exhibit upside, even if achieving these higher rates will take more time now. … But Beware What Lurks Below The benign outlook for this year masks that the rally in risk assets is living on borrowed time. A Fed willingly falling behind the curve may fan speculative flames this year, but it doesn’t mean that policy will stay easy forever. On the contrary, the inevitable rise in inflation will push rates higher down the road and the unavoidable recession will ultimately materialize, most likely somewhere around 2021. Since asset valuations will only grow more inflated between now and then, a bigger fall will ultimately ensue. Our Composite Valuation Indicator may currently be flashing a positive signal, but dynamics within its components already point to brewing trouble down the road (Chart I-24). First, the balance sheet group of indicators has showed no improvement. In other words, without last year’s rebound in profitability, stocks would not be as attractively valued as the overall indicator suggests. Chart I-24Disconcerting Internal Dynamics
Disconcerting Internal Dynamics
Disconcerting Internal Dynamics
Second, the interest rate group is currently flattering aggregate valuations. To remain supportive of higher returns ahead, this group depends on interest rates staying constrained. Here, the Fed will play a particularly perverse role. Its willingness to tolerate inflationary pressures right now means lower rates today at the price of a higher cost of capital tomorrow. Once it becomes obvious that the Fed is falling behind the curve – something more likely to happen once inflation expectations normalize – safe-haven yields will rise sharply. The interest rate group will suddenly look a lot less supportive than it does today. Third, the profit components of our valuation indicator may look healthy today, but this will not remain the case. At 31.7%, EBITD margins are currently extraordinary elevated. In fact, if the profit margins were to normalize to their historical average, the Shiller P/E would skyrocket to 40.3 from 29.9 today, implying the stock market may be just as expensive as it was at the start of 2000. For margins to remain wide, wages will have to stay depressed relative to selling prices (Chart I-25). However, the combination of an economy at full employment and the Fed goosing economic growth points to rising wages. Since the pass-through from wages to prices is below 100%, unless productivity rises more than labor costs, profitability will suffer and P/E ratios will start sending the same message as the price-to-sales ratio, a multiple that currently stands near record highs. Chart I-25Rising Wages Will Ultimately Hurt Profits
Rising Wages Will Ultimately Hurt Profits
Rising Wages Will Ultimately Hurt Profits
Valuations are not the only danger lurking for stocks: Spread products will morph from a tailwind to a headwind for equities. Whether or not it steepens a bit this year, the yield curve’s previous big flattening already points toward rising financial market volatility (Chart I-26). The Fed’s recent dovish tilt can keep the VIX and the MOVE compressed for a while longer. However, since inflation expectations will ultimately move higher, likely within a year or so, the Fed will once again tilt to the hawkish side, and volatility will follow its path of least resistance higher. Carry trades of all kinds will suffer, and spreads will widen. The deteriorating credit quality this cycle, with BBB and lower-rated issues constituting 60.1% of the corporate universe, could make this widening more violent than normal. This phenomenon will hurt stocks. Chart I-26Volatility Is A Coiled Spring
Volatility Is A Coiled Spring
Volatility Is A Coiled Spring
Finally, the improvement in global growth this year is likely to prove temporary. China may want to slow the pace of deleveraging this year, but pushing debt loads lower and reforming the economy remains Beijing’s number one priority on a multi-year horizon. China has created USD 26 trillion worth of yuan since 2008, making the Chinese money supply larger than the euro area’s and the U.S.’s together. As a result, China’s incremental output-to-capital ratio continues to trend lower, implying large misallocation of capital (Chart I-27). State-owned enterprises, the recipients of much of the credit created over the past 10 years, now generate lower RoAs than their cost of borrowing, an unmistakable sign of poorly allocated funds. Chart I-27The Biggest Threat To China's Long-Term Prosperity
The Biggest Threat To China's Long-Term Prosperity
The Biggest Threat To China's Long-Term Prosperity
Correcting this structural impediment will require the Chinese credit impulse to once again move back into negative territory. This means that unless Chinese policymakers abandon their efforts to prise the country off easy credit, Chinese growth will morph back into a headwind for the world somewhere in 2020, i.e. not so late as to encourage excesses, but not so early as to sharply slow the economy ahead of the Communist Party’s one-hundredth birthday in July 2021. In 2018, the global economy nearly ground to a halt after China had shifted from stimulus to policy tightening. The next time around, we doubt that a global recession will be avoided. The second half of 2020 may set up to be one tumultuous period. Bottom Line: In all likelihood, global risk assets should perform well this year, but we are living on borrowed time. In the background, equity valuations are deteriorating meaningfully, a phenomenon that will worsen once the Fed’s desired outcome comes to fruition: higher inflation. Wage pressures and higher interest rates will reveal how fully rotten stock valuations genuinely are. Compounding this effect, higher volatility and a resumption of China’s deleveraging efforts will likely achieve the coup de grace for stocks in the second half of 2020. Conclusion The FOMC wants to lift inflation expectations in order to defuse any lingering deflationary risk. Consequently, the Fed’s pause will last longer than we originally anticipated, but terminal rates are likely to climb higher than would have otherwise been the case. Before last week’s Fed meeting, the U.S. was already set to grow above trend. Now, the Fed will only extend the business cycle further, fanning greater inflationary pressures in the process. This potentially misguided reflationary impulse, which is echoed around the world, will contribute to a rebound in global growth that will become fully evident by the summer. Consequently, we expect risk assets to climb to new highs over the coming 12 months. Treasurys will likely underperform cash over that timeframe, as interest rate markets are currently too sanguine. Investors are facing a real dilemma. On one hand, the potential for elevated stock market returns is high over the coming 12 months. On the other, poor valuations will only grow more onerous, and the Fed will ultimately have to tighten policy even more following the on-hold period. Moreover, Chinese policymakers are unlikely to ignore the pressing danger created by misallocating capital for an extended period of time. Consequently, the outlook for long-term returns is deteriorating. As a result, we recommend more tactically minded investors to stay long stocks, with a growing preference for international equities that are both cheaper and more exposed to global growth than U.S. ones. However, longer-term asset allocators should use this period of strength to progressively move out of stocks and into safer alternatives. Mathieu Savary Vice President The Bank Credit Analyst March 28, 2019 Next Report: April 25, 2019 II. The State Of Brexit So What? It makes sense for long-term investors to buy the GBP. However, short-term investors should instead buy the 2-year call while selling 3-month ones. Why? The U.K. electorate is not staunchly Euroskeptic. In fact, Bregret has already set in. Volatility is the only sure bet over the tactical and strategic time horizons. The most likely scenario is that Theresa May either resigns and is replaced by a soft-Brexit Tory, or that she agrees to a long-term extension to give the U.K. time to call a new election. Brexit is unsustainable over the secular time horizon. Our low-conviction view is that in the long term, the U.K. will remain inside the European Union. The hour is late in the ongoing Brexit saga. The original deadline, once spoken of with religious reverence, will be tossed aside for one, potentially two, extensions. In this analysis, we attempt to consider the state of Brexit from multiple time horizons. First, we offer our tactical view, what will happen in the next several weeks and months. Second, we offer our strategic view, surveying the Brexit process to the end of the year. Third, we consider the secular view and attempt to answer the question of whether the U.K. will ever fully exit the EU. We then assign investment recommendations across the three time horizons. How Did We Get Here? In March 2016, three months ahead of the fateful June referendum, BCA’s Geopolitical Strategy and European Investment Strategy published a joint report on the topic that drew three conclusions: The probability of Brexit was understated by the market. “According to our modeling results, roughly 64% of Tory undecided voters would have to swing to the “Stay” camp in order to ensure that the vote crosses the 50% threshold in favour of continued EU membership … Conventional wisdom suggests that the probability of Brexit is around 30%, anchoring to the 1975 referendum results. Our own analysis of current polling data suggests that it is much closer to 50%, as in too close to call.” The biggest loser of Brexit, domestically, would be the Conservative Party. “The risk is that the British populace realizes that leaving the EU was a sub-optimal result and that little sovereignty was recovered. As such, there could be a backlash against the Tories in the next general election. In this scenario, the winner would not necessarily be UKIP, but rather the Jeremy Corbyn-led Labour Party – as close to the Michael Foot-led opposition in the early 1980s as any Labour Leadership.” The EU would survive, intact, with no further “exits.” “European integration is therefore a gambit for relevance by Europe’s declining powers. Brexit will not create centrifugal forces that tear the EU apart, and could in fact enhance the sinews that bind EU member states in a bid for 21st century geopolitical relevance.” Thus far, all three predictions have proven prescient. Not only was the probability of Brexit understated, but the electorate actually voted to exit the EU.1 The Conservative Party has wrapped itself into an intellectual pretzel trying to deliver on a referendum that the pro-Brexit Tories – a minority in the party – promised would not mean losing access to the Common Market. And the EU has not only seen no other “exits,” but has held firm and united in the negotiations with the U.K. while witnessing an increase in the support for its troubled currency union, both in the Euro Area in aggregate as well as in crisis-ridden Italy (Chart II-1). Chart II-1The Euro Area Stands Unified
The Euro Area Stands Unified
The Euro Area Stands Unified
The net assessment we conducted in 2016 correctly gauged what the Brexit referendum was about and what it was not about. Our view was that behind the angst lay factors too general to be laid at the feet of European integration. Decades of supply-side reforms combined with competition from emerging economies led to a sharp rise in U.K. income inequality (Chart II-2), the erosion of its manufacturing economy (Chart II-3), and the ballooning of the country’s financial sector (Chart II-4). As a result, the U.K.’s income inequality and social mobility were, in 2016 as today, much closer to those of its Anglo-Saxon peer America than to those of its continental European neighbors (Chart II-5). Chart II-2Brits Saw Inequality Surge
Brits Saw Inequality Surge
Brits Saw Inequality Surge
Chart II-3Manufacturing Jobs Collapsed
Manufacturing Jobs Collapsed
Manufacturing Jobs Collapsed
Chart II-4The Financial Bubble Burst
The Financial Bubble Burst
The Financial Bubble Burst
Chart II-5
The underlying economic angst has continued to influence British politics since Brexit. Campaigning on an anti-austerity platform in the summer of 2017, the Labour Party leader Jeremy Corbyn nearly won the general election, only underperforming the Conservative vote by 2% (Chart II-6). The election was supposed to politically recapitalize Theresa May and allow her to lead the U.K. out of the EU. But the failure to secure a single-party majority created the political math in the House of Commons that is today preventing the prime minister from executing on Brexit. There are simply not enough committed Brexiters in Westminster to deliver on the relatively hard Brexit – no access to the EU Common Market or customs union – that Prime Minister May has put on offer (Chart II-7).
Chart II-6
Chart II-7
The decision not to pursue a customs union arrangement with the EU is particularly disastrous. As our colleague Dhaval Joshi – Chief Strategist of BCA’s European Investment Strategy – has pointed out, remaining in the customs union would have protected the cross-border supply chains that are vital to many U.K. businesses and would have avoided a hard customs border on the island of Ireland.2 However, the slim margin of the Tory victory in 2017 has boosted the influence of the 20-to-40 hard-Brexiters in the party. They pushed Theresa May to the extreme, where a customs union arrangement – let alone access to the Common Market – became politically unpalatable. Had the British electorate genuinely wanted “Brexit über alles,” or the relatively hard Brexit on offer today, the margin of victory for Leave would have been greater. Furthermore, the electorate would not have come so close to giving the far-left Corbyn – who nonetheless supports the softest-of-soft Brexits – a majority in mid-2017. The slim margin of victory effectively tied May’s hands in her subsequent negotiations with both the EU and her own party. But there was more to the 2016 referendum than just general malaise centered on the economy and inequality. There were idiosyncratic events that provided tailwinds for the Leave campaign. Or, as we put it in 2016: Certainly, a number of ills have befallen the continent in quick succession: the euro area sovereign debt crisis, Russian military intervention in Ukraine, rampant migrant inflows from Africa and the Middle East, and terrorist attacks in France. It is no surprise that the U.K. populace wants to think twice about tying itself even more closely to a Europe apparently on the run from the Four Horsemen of the Apocalypse. The two issues we would particularly focus on were the migrant crisis and terrorist attacks in Europe. Data ahead of the referendum clearly gave credence to the view that the influx of migrants was raising “concerns about immigration and race.” This angst was primarily focused on EU migrants who came to the U.K. legally (Chart II-8), but the influx of millions of migrants into the EU in 2015 – peaking at 172,000 in the month of October – certainly bolstered the anxiety in the U.K. (Chart II-9).3 Chart II-8EU Migrants A Source Of Anxiety In 2016
EU Migrants A Source Of Anxiety In 2016
EU Migrants A Source Of Anxiety In 2016
Chart II-9The Refugee Crisis Boosted Brexit Vote
The Refugee Crisis Boosted Brexit Vote
The Refugee Crisis Boosted Brexit Vote
Terrorism was another concern. In the 18 months preceding the referendum, continental Europe experienced 13 deadly terror attacks. Two were particularly egregious: the November 2015 Paris terror attack that led to 130 deaths, and the March 2016 Brussels terror attack that led to 32 deaths. Both the migration and terror crises, however, were temporary and caused by idiosyncratic variables with short half-lives. BCA’s Geopolitical Strategy argued that both would eventually abate. The migration crisis would subside due to firming European attitudes towards asylum seekers and the exhaustion of the supply of migrants as the Syrian Civil War drew to its tragic close. The extremist Islamic terror attacks would dwindle due to the decrease in the marginal utility of terror that has been observed in previous waves of terrorism (Chart II-10). Neither forecast was popular with our client base, but both have been spot on. Chart II-10Fewer Attacks Due To Declining Marginal Utility Of Terror
Fewer Attacks Due To Declining Marginal Utility Of Terror
Fewer Attacks Due To Declining Marginal Utility Of Terror
The point is that the British electorate was never as Euroskeptic as the Euroskeptics cheering on Brexit thought. Support for EU integration has waxed and waned for decades (Chart II-11). Instead, a combination of macro-malaise caused by the general plight of the middle class – the same factors that have given tailwinds to populist policymakers across developed markets – and idiosyncratic crises in the middle of this decade created the context in which the public voted to leave the EU. Whatever the vote was for, we can say with a high degree of certainty that it was not in favor of the current deal on offer, a relatively hard Brexit. After all, the pro-Leave Tories almost universally campaigned in favor of remaining in the Common Market post-Brexit.4 Chart II-11Data Does Not Support Euroskeptic U.K.
Data Does Not Support Euroskeptic U.K.
Data Does Not Support Euroskeptic U.K.
Today, Bregret has clearly set in. Not only on the specific issue of whether the U.K. should leave the EU – where the gap between Bremorseful voters and committed Brexiters is now 8% (Chart II-12), a 12% swing since just after the referendum – but also on the more existential question of whether U.K. citizens feel European (Chart II-13). Chart II-12Bregret Has Set In...
Bregret Has Set In...
Bregret Has Set In...
Chart II-13...And Brits Feeling More European
...And Brits Feeling More European
...And Brits Feeling More European
The political reality of Bregret is the most important variable in predicting Brexit. Not only is it difficult for Prime Minister May to deliver her relatively hard Brexit in Westminster due to the mid-2017 electoral math, but it is especially the case when the electorate does not want it. Yes, the mid-2016 referendum is an expression of a democratic will that must be respected. But no policymaker wants to respect the referendum at the cost of disrespecting the current disposition of the median voter, which is revealed through polls. Doing so will cost them in the next election. Reviewing “how we got here” is essential in forecasting the tactical, strategic, and secular time horizons in the ongoing Brexit imbroglio. To this task we now turn. Bottom Line: The U.K. electorate is not staunchly Euroskeptic: data clearly support this fact. The Brexit referendum simply came at the right time for the Leave vote, as the secular forces of middle-class discontent combined with idiosyncratic crises of migration and terror. Three years following the referendum, the discontent remains unaddressed by British policymakers while the idiosyncratic crises have abated. As such, Bregret has set in, creating a new reality that U.K. policymakers must respond to if they want to retain political capital. Where Are We Going? The Tactical And Strategic Time Horizons The EU has offered a two-step delay to the Article 50 deadline of March 29. The first option is a delay until May 22, but only if Theresa May successfully passes her Brexit plan through Westminster. The second option is a delay until April 12. This would come in effect if the House of Commons rejects the deal on offer. The short time frame is supposed to pressure London to come up with the next steps, which the EU has inferred would either be to get out of the bloc without a deal or to plan for a long-term extension. Although there are no official conditions to awarding a long-term extension, it is clear that the EU only envisages three options: Renegotiate the terms of Brexit, to include either a customs union or full Common Market membership (a softer Brexit); Hold a general election to break the impasse; Hold another referendum. The EU is suggesting that it could deny the U.K. an extension if London does not come back with a plan. There are two reasons why we would call the EU’s bluff. First, it is likely an attempt to help May get the deal through the House of Commons by creating a sense of urgency. Second, the European Court of Justice (ECJ) ruled in December 2018 that the U.K. could “revoke that notification unilaterally, in an unequivocal and unconditional manner, by a notice addressed to the European Council in writing.”5 The only requirement is that the notification be sent to Brussels prior to March 29 (or, in the case of a mutually agreed upon extension, prior to April 12). It is increasingly likely that, after the deal on offer fails, Theresa May will have to go “hat-in-hand” to the EU to ask for a much longer extension. She will have until April 12 to ask for that extension, but it would require participation in the European Parliamentary (EP) elections on May 23. Prime Minister May has said that the U.K. will not hold those elections. We beg to differ. Not holding the election would allow the EU to end the U.K.’s membership in the bloc, which would by default mean contravening the Parliament’s will to reject a no-deal Brexit (which it did in a rebuke to the government in March). As such, the U.K. will absolutely hold an EP election in May. Yes, it will be a huge embarrassment to the Conservative government. And we would venture that the election would turn out a huge pro-EU majority from the U.K., given that it is the Europhile side of the aisle that is now excited and activated, further embarrassing the ruling government. The most likely scenario, therefore, is that Theresa May either resigns and is replaced by a soft-Brexit Tory, or that she agrees to a long-term extension to give the U.K. time to call a new election. As we have been arguing throughout the year, the only way to break the impasse without calling a referendum – is to call a new election. A new election would be contested almost exclusively on the issue of Brexit – unlike the 2017 election, which Jeremy Corbyn managed to be almost exclusively contested on the issue of austerity. As such, the winner would have a clear political mandate to pursue the Brexit of their choice. If it is Jeremy Corbyn, this would mean a second referendum, given his recent conversion to supporting one. If Theresa May remains prime minister, it would be her relatively hard Brexit option; if another Tory replaces her, it would potentially be a softer Brexit. Intriguingly, Theresa May is coming up to the average “expiry date” of a “takeover” prime minister, which is 3.3 years (Chart II-14).
Chart II-14
Why do we think that Theresa May would be replaced with a soft Brexit Tory? Because there are simply not enough members of parliament in the Conservative Party caucus to elect a hard Brexiteer. Furthermore, the current deal on offer, which is a form of hard Brexit, clearly has no chance of passing in the House of Commons. Theresa May herself did not support the Leave campaign, but she converted into a hard Brexiteer due to the pressures in the Conservative Party caucus. If, on the other hand, we are wrong and the Conservative Party elects a hard Brexit Tory as leader, the odds of losing the election to the Labour Party would increase. Furthermore, the impasse in the House of Commons would not be resolved as Theresa May would be replaced by a prime minister with essentially the same approach to Brexit. Confused? You are not alone. Diagram II-1 illustrates the complexity of the tactical (0-3 months) and strategic (3-12 months) time horizons. There are so many options over the next six months alone that we ran out of space in our diagram to consider the consequences of the general election.
Chart II-
Needless to say, an election would induce volatility in the market as it would put Jeremy Corbyn close to the premiership. While he has now promised a second referendum, his government would also implement policies that could, especially in the short term, agitate the markets. Our forecasts of the currency moves alone suggest that volatility is the only sure bet over tactical and strategic time horizons. We do not have a high-conviction view on a directional call on the pound or U.K. equities. However, global growth concerns, combined with political uncertainty, should create a bond-bullish environment. Bottom Line: Over the course of the year, political uncertainty will remain high in the United Kingdom. A general election is the clearest path to breaking the current deadlock. However, it is not guaranteed, as Labour’s recent decline in the polls appears to be reversing since Jeremy Corbyn finally succumbed to the demands that he support a new referendum (Chart II-15). Chart II-15Labour Party Revives On Referendum Support
Labour Party Revives On Referendum Support
Labour Party Revives On Referendum Support
The Secular Horizon BCA Geopolitical Strategy believes that the median voter is the price maker in the political market place. Politicians are merely price takers. This is why Theresa May’s notion that the sanctity of the 2016 referendum cannot be abrogated is doubly false. First, she cannot truly claim from the slim 52%-48% result that U.K. voters want her form of Brexit. The referendum therefore may be a sacred expression of the democratic will, but her “no customs union” Brexit option is not holy water: It is an educated guess at best, pandering to hard Brexit Tories (a minority of the electorate) at worst. Given that 48% of the electorate wanted to remain in the EU and that a large portion of Brexit voters wanted a Common Market membership as part of Brexit, it is mathematically obvious that the softest of soft Brexit options was the desire of the median voter in June 2016. Furthermore, polling data (presented in Chart II-12 and Chart II-13 on page 28) now clearly show that the median voter is migrating away from even the softest of soft Brexit options to the “Stay” camp. Bregret has set in and a strong plurality of voters no longer supports Brexit. The question behind Chart II-12 is unambiguous. It clearly asks, “In hindsight, do you think Britain was right or wrong to vote to leave the EU?” What does all of this infer for the long term, or secular, horizon? First, an election this year could usher in a Labour government that delivers a new referendum. At this time, given the polling data and the geopolitical context, sans terror and migration crises, we would expect such a referendum to lead to a win for the Stay camp. Second, an election that produces a soft Brexit prime minister or negotiated outcome would allow the U.K. to leave the EU in an orderly fashion. A new Tory prime minister, pursuing a soft Brexit outcome, could even entice some Labour MPs to cross the aisle and support such an exit from the bloc. However, over a secular time horizon of the next two-to-three years, we doubt that a soft Brexit outcome would be viable. Investors have to realize that the vote on leaving the EU does not conclude the U.K. long-term deal with the bloc. That negotiating phase will last during the transition phase, over the next two-to-three years, and would conclude in yet another Westminster vote – and likely crisis – at the end of the period. If this deal entails membership in the Common Market, our low- conviction view over the long term is that it will ultimately fail. Take the financial community’s preferred soft Brexit option, the so-called super soft “Norway Plus” option. A Norway Plus option would entail the highest loss of sovereignty imaginable, given that the U.K. would essentially pay full EU membership fees with no ability to influence the regulatory policies that London would have to abide by. There is also a debate as to whether London would be able to constrict immigration from the EU under that option over the long term, a key demand of Brexiters.6 As such, the only viable option would be to switch to a customs union relationship. However, we fear that even this option may no longer be available to U.K. policymakers. Conservative Party leaders have wasted too much time and lost too much of the public’s good will. With only 40% of the electorate now considering Brexit the correct decision, it is possible that even a customs union arrangement will be unacceptable by the end of the transition period. Aside from the electorate’s growing Bregret, there is also the economic logic – or lack thereof – behind a customs union. A customs union would ensure the unfettered transit of goods between the U.K. and the continent, but not of services. This arrangement greatly favors the EU, not the U.K., as the latter has a wide (and growing) deficit in goods and an expanding surplus in services with the bloc (Chart II-16). Chart II-16Services Are Key For The U.K.
Services Are Key For The U.K.
Services Are Key For The U.K.
The only logic behind selecting a customs union over the Common Market is that a customs union would allow the U.K. to conclude separate trade deals with the rest of the world. While that may be a fantasy of the few remaining laissez-faire free traders in the U.K. Conservative Party, the view hardly represents the desire of the median voter. Other than a potential trade deal with the U.S., it is practically inconceivable to expect the U.K. electorate to support a free trade agreement with China or India, both of which would likely entail an even greater loss of blue-collar jobs. Even a trade deal with the U.S. would likely face political opposition, given that the U.K. is highly unlikely to be given preferential treatment by an economy seven times its size.7 The fact of the matter is that the Conservative Party has wasted its window of opportunity to push a hard, or moderately hard (customs union), Brexit through Parliament. Bregret has set in, as the doyens of Brexit increasingly pursued an unpopular strategy. On the other hand, a Brexit that retains the U.K. membership in the Common Market has never had much logic to begin with. Where does this leave the U.K. in the long term? Given the time horizon and the uncertainty on multiple fronts, our low-conviction view is that it leaves the U.K. inside the European Union. Bottom Line: The combination of increasing Bregret, lack of economic logic behind a customs union membership alone, and the lack of a political logic behind a Common Market membership, suggests that Brexit is unsustainable over the secular time horizon. This imperils the ultimate deal between the U.K. and the EU, which we think will not be able to pass the House of Commons in two-to-three years when it comes up for approval. This is a low-conviction view, however, as political realities can change. Support for Brexit could turn due to exogenous factors, such as a global recession that renews the Euro Area economic imbroglio or a major geopolitical crisis. Both are quite likely over the secular time horizon. Investment Implications Today, cable is cheap, trading at an 18% discount to its long-term fair value as implied by purchasing-power parity models (Chart II-17). The growing probability that the U.K. may, down the road, remain in the European Union means that, at current levels the pound is indeed attractive, especially against the U.S. dollar. Chart II-17Cable Attractive On Higher Odds Of Bremain
Cable Attractive On Higher Odds Of Bremain
Cable Attractive On Higher Odds Of Bremain
However, when it comes to short-term dynamics, the picture is much murkier. The low probability of a no-deal Brexit implies limited downside. However, the path to get the U.K. to abandon the current relatively hard Brexit is also one that involves a new election. This implies that before a resolution is reached, multiple scenarios are possible, including one where Corbyn becomes the next prime minister. Jeremy Corbyn could be the most left-of center leader of any G-10 nation since Francois Mitterrand in France in the early 1980s. Mitterrand’s audacious nationalization and left-leaning policies were met with a collapse in the French franc (Chart II-18). Chart II-18A Left-Wing Leader Bodes Ill For The Currency
A Left-Wing Leader Bodes Ill For The Currency
A Left-Wing Leader Bodes Ill For The Currency
Global growth also has an impact on cable. Despite all the noise around Brexit, the reality remains that exports constitute 30% of U.K. GDP, a larger contribution to output than in the euro area. This means that if global growth deteriorates, GBP/USD will face another headwind. If, however, global growth improves, then cable would face a new tailwind. Since BCA is of the view that global growth will likely trough by the summer, we are inclined to be positive on the pound. Netting out all those factors, it makes sense for long-term investors to buy the GBP, using the dips along the way to build a larger position in this currency. Even on a six-to-twelve-month basis, the path of least resistance for cable is likely upward. The problem is that risk-adjusted returns are likely to be poor as volatility will remain very elevated. We therefore recommend that short-term investors instead buy the 2-year call while selling 3-month ones (Chart II-19). Chart II-19Volatility Will Be A Challenge For Short Term Investors
Volatility Will Be A Challenge For Short Term Investors
Volatility Will Be A Challenge For Short Term Investors
Marko Papic Senior Vice President Chief Geopolitical Strategist Mathieu Savary Vice President The Bank Credit Analyst III. Indicators And Reference Charts Equities have had a volatile month of March, something that was bound to happen after the violent rally witnessed from the end of December to the end of February. When a rally is being tested, it always make sense to review our indicators to gauge whether or not a trend change is in the offing. Generally, our indicators remain broadly positive. Our Willingness-to-Pay (WTP) indicators for the U.S. and the euro area continue to improve. Meanwhile, it has begun to hook back up in Japan. The WTP indicators track flows, and thus provide information on what investors are actually doing, as opposed to sentiment indexes that track how investors are feeling. The current readings in major advanced economies thus suggest that investors are still inclined to add to their stock holdings. Our Revealed Preference Indicator (RPI) has however once again deteriorated, suggesting that the period of churn in global equities prices could last a bit longer. This indicator is essentially saying that in order to resume their ascent, stocks need a bit more time to digest their previous surge. The RPI combines the idea of market momentum with valuation and policy measures. It provides a powerful bullish signal if positive market momentum lines up with constructive signals from the policy and valuation measures. Conversely, if constructive market momentum is not supported by valuation and policy, investors should lean against the market trend. According to BCA’s Composite Valuation Indicator, an amalgamation of 11 measures, the U.S. stock market remains slightly overvalued from a long-term perspective. Nonetheless, despite this year’s rally, the S&P 500 offers a much more attractive risk/reward profile than it did in the fall. Moreover, our Monetary Indicator has shifted out of negative territory for stocks, and is now decisively in stimulative territory. The Fed’s dovish forward guidance last week only reinforces the message from this indicator. Our Composite Technical Indicator for stocks had broken down in December, but it is finally flashing a buy signal. This further confirms that the current period of churn is most likely to ultimately make way for a continued rally in the S&P 500. The 10-year Treasury yield remains within its neutral range according to our valuation model. Moreover, our technical indicator flags a similar picture. This means that without signs of improvements in global growth, price action alone will not be enough to lift bond yields higher. That being said, since BCA expects that over the next 24 months, the Fed will lift rates more than the OIS curve anticipates, and since the term premium is incredibly low, once green shoots for global growth become evident, bonds could suffer a violent selloff. The U.S. dollar is still very expensive on a PPP basis. Our Composite Technical Indicator is not as overbought as it once was, but it is far from having reached oversold levels either. This combination suggests that the greenback could experience further downside this year. However, for this downside to materialize, global growth will first have to stabilize. EQUITIES: Chart III-1U.S. Equity Indicators
U.S. Equity Indicators
U.S. Equity Indicators
Chart III-2Willingness To Pay For Risk
Willingness To Pay For Risk
Willingness To Pay For Risk
Chart III-3U.S. Equity Sentiment Indicators
U.S. Equity Sentiment Indicators
U.S. Equity Sentiment Indicators
Chart III-4Revealed Preference Indicator
Revealed Preference Indicator
Revealed Preference Indicator
Chart III-5U.S. Stock Market Valuation
U.S. Stock Market Valuation
U.S. Stock Market Valuation
Chart III-6U.S. Earnings
U.S. Earnings
U.S. Earnings
Chart III-7Global Stock Market And Earnings: Relative Performance
Global Stock Market And Earnings: Relative Performance
Global Stock Market And Earnings: Relative Performance
Chart III-8Global Stock Market And Earnings: Relative Performance
Global Stock Market And Earnings: Relative Performance
Global Stock Market And Earnings: Relative Performance
FIXED INCOME: Chart III-9U.S. Treasurys And Valuations
U.S. Treasurys And Valuations
U.S. Treasurys And Valuations
Chart III-10Yield Curve Slopes
Yield Curve Slopes
Yield Curve Slopes
Chart III-11Selected U.S. Bond Yields
Selected U.S. Bond Yields
Selected U.S. Bond Yields
Chart III-1210-Year Treasury Yield Components
10-Year Treasury Yield Components
10-Year Treasury Yield Components
Chart III-13U.S. Corporate Bonds And Health Monitor
U.S. Corporate Bonds And Health Monitor
U.S. Corporate Bonds And Health Monitor
Chart III-14Global Bonds: Developed Markets
Global Bonds: Developed Markets
Global Bonds: Developed Markets
Chart III-15Global Bonds: Emerging Markets
Global Bonds: Emerging Markets
Global Bonds: Emerging Markets
CURRENCIES: Chart III-16U.S. Dollar And PPP
U.S. Dollar And PPP
U.S. Dollar And PPP
Chart III-17U.S. Dollar And Indicator
U.S. Dollar And Indicator
U.S. Dollar And Indicator
Chart III-18U.S. Dollar Fundamentals
U.S. Dollar Fundamentals
U.S. Dollar Fundamentals
Chart III-19Japanese Yen Technicals
Japanese Yen Technicals
Japanese Yen Technicals
Chart III-20Euro Technicals
Euro Technicals
Euro Technicals
Chart III-21Euro/Yen Technicals
Euro/Yen Technicals
Euro/Yen Technicals
Chart III-22Euro/Pound Technicals
Euro/Pound Technicals
Euro/Pound Technicals
COMMODITIES: Chart III-23Broad Commodity Indicators
Broad Commodity Indicators
Broad Commodity Indicators
Chart III-24Commodity Prices
Commodity Prices
Commodity Prices
Chart III-25Commodity Prices
Commodity Prices
Commodity Prices
Chart III-26Commodity Sentiment
Commodity Sentiment
Commodity Sentiment
Chart III-27Speculative Positioning
Speculative Positioning
Speculative Positioning
ECONOMY: Chart III-28U.S. And Global Macro Backdrop
U.S. And Global Macro Backdrop
U.S. And Global Macro Backdrop
Chart III-29U.S. Macro Snapshot
U.S. Macro Snapshot
U.S. Macro Snapshot
Chart III-30U.S. Growth Outlook
U.S. Growth Outlook
U.S. Growth Outlook
Chart III-31U.S. Cyclical Spending
U.S. Cyclical Spending
U.S. Cyclical Spending
Chart III-32U.S. Labor Market
U.S. Labor Market
U.S. Labor Market
Chart III-33U.S. Consumption
U.S. Consumption
U.S. Consumption
Chart III-34U.S. Housing
U.S. Housing
U.S. Housing
Chart III-35U.S. Debt And Deleveraging
U.S. Debt And Deleveraging
U.S. Debt And Deleveraging
Chart III-36U.S. Financial Conditions
U.S. Financial Conditions
U.S. Financial Conditions
Chart III-37Global Economic Snapshot: Europe
Global Economic Snapshot: Europe
Global Economic Snapshot: Europe
Chart III-38Global Economic Snapshot: China
Global Economic Snapshot: China
Global Economic Snapshot: China
Mathieu Savary Vice President The Bank Credit Analyst Footnotes 1 At the time of publication of our March report, we still had a low-conviction view that the vote would swing towards Stay at the last moment. 2 Please see BCA Research European Investment Strategy Weekly Report, “Important Message From The Currency Markets,” dated March 14, 2019, available at eis.bcaresearch.com. 3 Trying to play up the threat of unchecked migration, the U.K. Independence Party ran a famous campaign poster showing hundreds of refugees on a road under the title of “Breaking Point – The EU has failed us all.” Despite the fact that the U.K. accepted only around 10,000 Syrian refugees since the 2015 crisis. Germany has accepted over 700,000 while Canada – which is located across the Atlantic Ocean on a different continent – accepted over 40,000. Even the impoverished Serbia has accepted more Syrian refugees than the U.K. 4 One of the most prominent Leave supporters, Boris Johnson, famously quipped after the referendum result that “There will continue to be free trade and access to the single market.” 5 Please see The European Court of Justice, “Judgement Of The Court,” In Case C-621/18, dated December 10, 2018, available at curia.europa.eu. 6 Proponents of the Norway Plus option point out that Article 112(1) of the European Economic Area (EEA) Agreement allows for restriction of movement of people within the area. However, these restrictions are intended to be used in times of “serious economic, societal or environmental difficulties.” It certainly appears to be an option for London to restrict EU migration, but it is not clear whether Europe would agree for this to be a permanent solution. Liechtenstein has been using Article 112 to impose quantitative limitations on immigration for decades, but that is because its tiny geographical area is recognized as a “specific situation” that justifies such restrictions. 7 President Donald Trump may want to give the U.K. preferential trade terms on the basis of the filial Anglo-Saxon relationship alone, but it is highly unlikely that the increasingly protectionist Congress would do the same. There is also no guarantee that President Trump will be around to bring such trade negotiations across the finish line. EQUITIES:FIXED INCOME:CURRENCIES:COMMODITIES:ECONOMY: