Global

Highlights The European barometer that best gauges global growth is euro area growth excluding inventory adjustments. Euro area growth excluding inventory adjustments is now running at a blistering 4.2 percent nominal pace – close to its 10-year upper bound – and is unlikely to accelerate much further. All the evidence shows that we are at the tail-end of a global growth up-oscillation. Irrespective of the evolution of the trade war, our high conviction view is that our global growth barometer will show weaker readings in the second half of the year. We present the correct investment strategy for this environment within the report. Feature Chart of the WeekGrowth Isn’t Going To Get Much Better
Growth Isn't Going To Get Much Better
Growth Isn't Going To Get Much Better
Europe is an excellent barometer of the world economy. Not only is Europe a big chunk of the global economy in its own right, Europe also has a very open economy with a huge external sector. Gross exports amount to almost a half of GDP in the euro area, compared to little more than a tenth in the United States (Chart I-2). But here’s the key point: the European barometer that best gauges global growth is not euro area growth per se; it is euro area growth excluding inventory adjustments (Chart of the Week and Chart I-3). Chart I-2Europe Has A Very Open Economy
Europe Has A Very Open Economy
Europe Has A Very Open Economy
Chart I-3Euro Area Growth Ex Inventory Adjustments Has Rebounded Sharply
Euro Area Growth Ex Inventory Adjustments Has Rebounded Sharply
Euro Area Growth Ex Inventory Adjustments Has Rebounded Sharply
If euro area firms were building inventories, it would clearly boost economic output; and vice versa. However, this inventory building would not represent genuine end demand from abroad. It follows that we must strip out inventory adjustments to yield a truer gauge of external demand.1 The Reading From Our European Barometer What does euro area growth excluding inventory adjustments show? The long-term analysis confirms that global activity suffered its sharpest setbacks this millennium in 2002, 2008, 2012, and again briefly last year. But in the first quarter of this year, euro area real growth excluding inventory adjustments bounced back to a very robust 2.5 percent clip or, in nominal terms, a blistering 4.2 percent clip.2 Indeed, in nominal terms, our barometer was close to its strongest reading since 2010! These impressive numbers leave us with not a shred of doubt: after a sharp setback, global growth commenced a strong rebound at the end of last year. Global growth commenced a strong rebound at the end of last year. For those still in doubt, further compelling evidence comes from the very clear recent outperformance of the economically sensitive global sectors: industrials and financials. Through the past decade, the relative performance of these global cyclicals has closely tracked our European barometer – albeit a brief decoupling did occur in 2012 after Draghi’s “whatever it takes” speech gave all financial assets a big shot in the arm (Chart I-4). Chart I-4Global Cyclicals Are Tracking Our Growth Barometer
Global Cyclicals Are Tracking Our Growth Barometer
Global Cyclicals Are Tracking Our Growth Barometer
One problem is that our barometer gives a reading just once a quarter and these readings come out after a long delay. From the mid-point of the quarter to which the GDP data refers to their release date around one month after the quarter end, there is a two and a half month delay. Begging the question, is there a more frequent and timely current activity indicator (CAI) for the euro area? The answer is yes. We have found that the ZEW economic sentiment indicator (not to be confused with the current situation indicator) does the job well in real-time (Chart I-5 and Chart I-6). Chart I-5The ZEW Economic Sentiment Indicator...
The ZEW Economic Sentiment Indicator...
The ZEW Economic Sentiment Indicator...
Chart I-6...Is A Good Current Activity Indicator
...Is A Good Current Activity Indicator
...Is A Good Current Activity Indicator
How Should Investors Use Our Barometer? However, investors face an even more fundamental problem. The equity market is itself a real-time current activity indicator. To be more precise, the best current activity is not the equity market taken as a whole – because the aggregate equity market can move as a result of drivers other than current economic activity, most notably central bank policy. Rather, as we have just shown, the very best current activity indicator is the performance of economically sensitive sectors – such as industrials and financials – relative to the total market (Chart I-7 and Chart I-8). Chart I-7The Best Current Activity Indicator...
The Best Current Activity Indicator...
The Best Current Activity Indicator...
Chart I-8...Is The Relative Performance Of Global Cyclicals
...Is The Relative Performance Of Global Cyclicals
...Is The Relative Performance Of Global Cyclicals
This means that even if we could measure GDP growth excluding inventory adjustments in real time, it would not help investors. After all, it would be ludicrous to expect one current activity indicator consistently to lead another current activity indicator! What we really need is a future activity indicator (FAI). If we could reliably predict where our barometer’s reading would be three or six months from now we could also reliably allocate our investments ‘ahead of the move’. Still, sometimes the current reading does inform us about the future. If a barometer already reads ‘very dry’ then we know that the weather is not going to get any better in the next few months! To be clear, euro area nominal growth excluding inventories, running at a blistering 4.2 percent pace, is near a 10-year high not just on a quarter-on-quarter basis but also on a six month on six month basis. The chances that it moves significantly higher are close to nil. We are at the tail-end of a global growth up-oscillation. We should also look at the short-term impulses that drive growth. Crucially, these emanate from the short-term changes – and not the levels – of bond yields, the oil price (inverted), and bank credit flows. These impulses are now losing momentum (Chart I-9). Chart I-9Short-Term Impulses Are Losing Momentum
Short-Term Impulses Are Losing Momentum
Short-Term Impulses Are Losing Momentum
The Correct Investment Strategy To sum up, all the evidence shows that we are at the tail-end of a global growth up-oscillation. Irrespective of the evolution of the trade war, our high conviction view is that our global growth barometer – euro area growth excluding inventory adjustments – is highly unlikely to accelerate much further from its blistering 4.2 percent nominal clip. Much more likely, it will show weaker readings in the second half of the year. The yen is still an excellent defensive currency. Nevertheless, in the near term, asset allocation is a tough call. This is because, very unusually, all asset classes have performed well in unison, making it hard to rotate into one that offers value (Chart I-10). Hence, from a tactical perspective, we are shorting a 30:60:10 portfolio of equities, long-dated bonds, and crude oil. So far, the position is slightly down but we recommend holding it until it either achieves a 3 percent profit or it hits a 3 percent stop-loss. Chart I-10All Asset-Classes Have Performed Well In Unison
All Asset-Classes Have Performed Well In Unison
All Asset-Classes Have Performed Well In Unison
For equities versus bonds, our long DAX versus the 30-year bund is now broadly flat since inception in January. But we will hold it for a while longer until we see clearer signs that global growth has flipped into a down-oscillation. Within bonds, our underweight German 10-year bunds versus U.S 10-year T-bonds is still appropriate given the closer proximity of the bund yield, at -0.2 percent, to the mathematical lower bound. Moreover, this relative position has been working well recently. Within equities, overweight European equities versus China and the U.S. has also been working well. However, we will be looking for opportunities to switch to underweight Europe versus the less economically sensitive U.S. equity market within the next couple of months. Finally, our stance to the euro – long versus the dollar, short versus the yen – has also been working well. The stance remains appropriate as the yen is still an excellent defensive currency, with the big additional advantage of possessing minimal political risk. Fractal Trading System* Given the synchronized rally of all asset classes this year, the financial services sector has strongly outperformed the market. But according to its 130-day fractal dimension, this strong outperformance is approaching technical exhaustion. Accordingly, this week’s trade recommendation is to short the financial services sector versus the market. The profit target is 2 percent with a symmetrical stop-loss. (One way of executing this is to short the IYG ETF versus the MSCI All Country World Index). In other trades, we are pleased to report that short NZX 50 versus FTSE100 achieved its 2 percent profit target and is now closed, leaving three open positions. For any investment, excessive trend following and groupthink can reach a natural point of instability, at which point the established trend is highly likely to break down with or without an external catalyst. An early warning sign is the investment’s fractal dimension approaching its natural lower bound. Encouragingly, this trigger has consistently identified countertrend moves of various magnitudes across all asset classes. Chart I-11
Global Financial Services Vs. Market
Global Financial Services Vs. Market
The post-June 9, 2016 fractal trading model rules are: When the fractal dimension approaches the lower limit after an investment has been in an established trend it is a potential trigger for a liquidity-triggered trend reversal. Therefore, open a countertrend position. The profit target is a one-third reversal of the preceding 13-week move. Apply a symmetrical stop-loss. Close the position at the profit target or stop-loss. Otherwise close the position after 13 weeks. Use the position size multiple to control risk. The position size will be smaller for more risky positions. * For more details please see the European Investment Strategy Special Report “Fractals, Liquidity & A Trading Model,” dated December 11, 2014, available at eis.bcaresearch.com. Dhaval Joshi, Chief European Investment Strategist dhaval@bcaresearch.com Footnotes 1 To be precise, it is the change in the change in inventories that contributes to GDP growth. For example, if the change in inventories added 0.5 percent to GDP this quarter, but 1 percent last quarter, then it will have subtracted 0.5% from growth this quarter. 2 Quarter-on-quarter growth at annualised rates. Fractal Trading System Recommendations Asset Allocation Equity Regional and Country Allocation Equity Sector Allocation Bond and Interest Rate Allocation Currency and Other Allocation Closed Fractal Trades Trades Closed Trades Asset Performance Currency & Bond Equity Sector Country Equity Indicators Bond Yields Chart II-1Indicators To Watch - Bond Yields
Indicators To Watch - Bond Yields
Indicators To Watch - Bond Yields
Chart II-2Indicators To Watch - Bond Yields
Indicators To Watch - Bond Yields
Indicators To Watch - Bond Yields
Chart II-3Indicators To Watch - Bond Yields
Indicators To Watch - Bond Yields
Indicators To Watch - Bond Yields
Chart II-4Indicators To Watch - Bond Yields
Indicators To Watch - Bond Yields
Indicators To Watch - Bond Yields
Interest Rate Chart II-5Indicators To Watch - Interest Rate Expectations
Indicators To Watch - Interest Rate Expectations
Indicators To Watch - Interest Rate Expectations
Chart II-6Indicators To Watch - Interest Rate Expectations
Indicators To Watch - Interest Rate Expectations
Indicators To Watch - Interest Rate Expectations
Chart II-7Indicators To Watch - Interest Rate Expectations
Indicators To Watch - Interest Rate Expectations
Indicators To Watch - Interest Rate Expectations
Chart II-8Indicators To Watch - Interest Rate Expectations
Indicators To Watch - Interest Rate Expectations
Indicators To Watch - Interest Rate Expectations
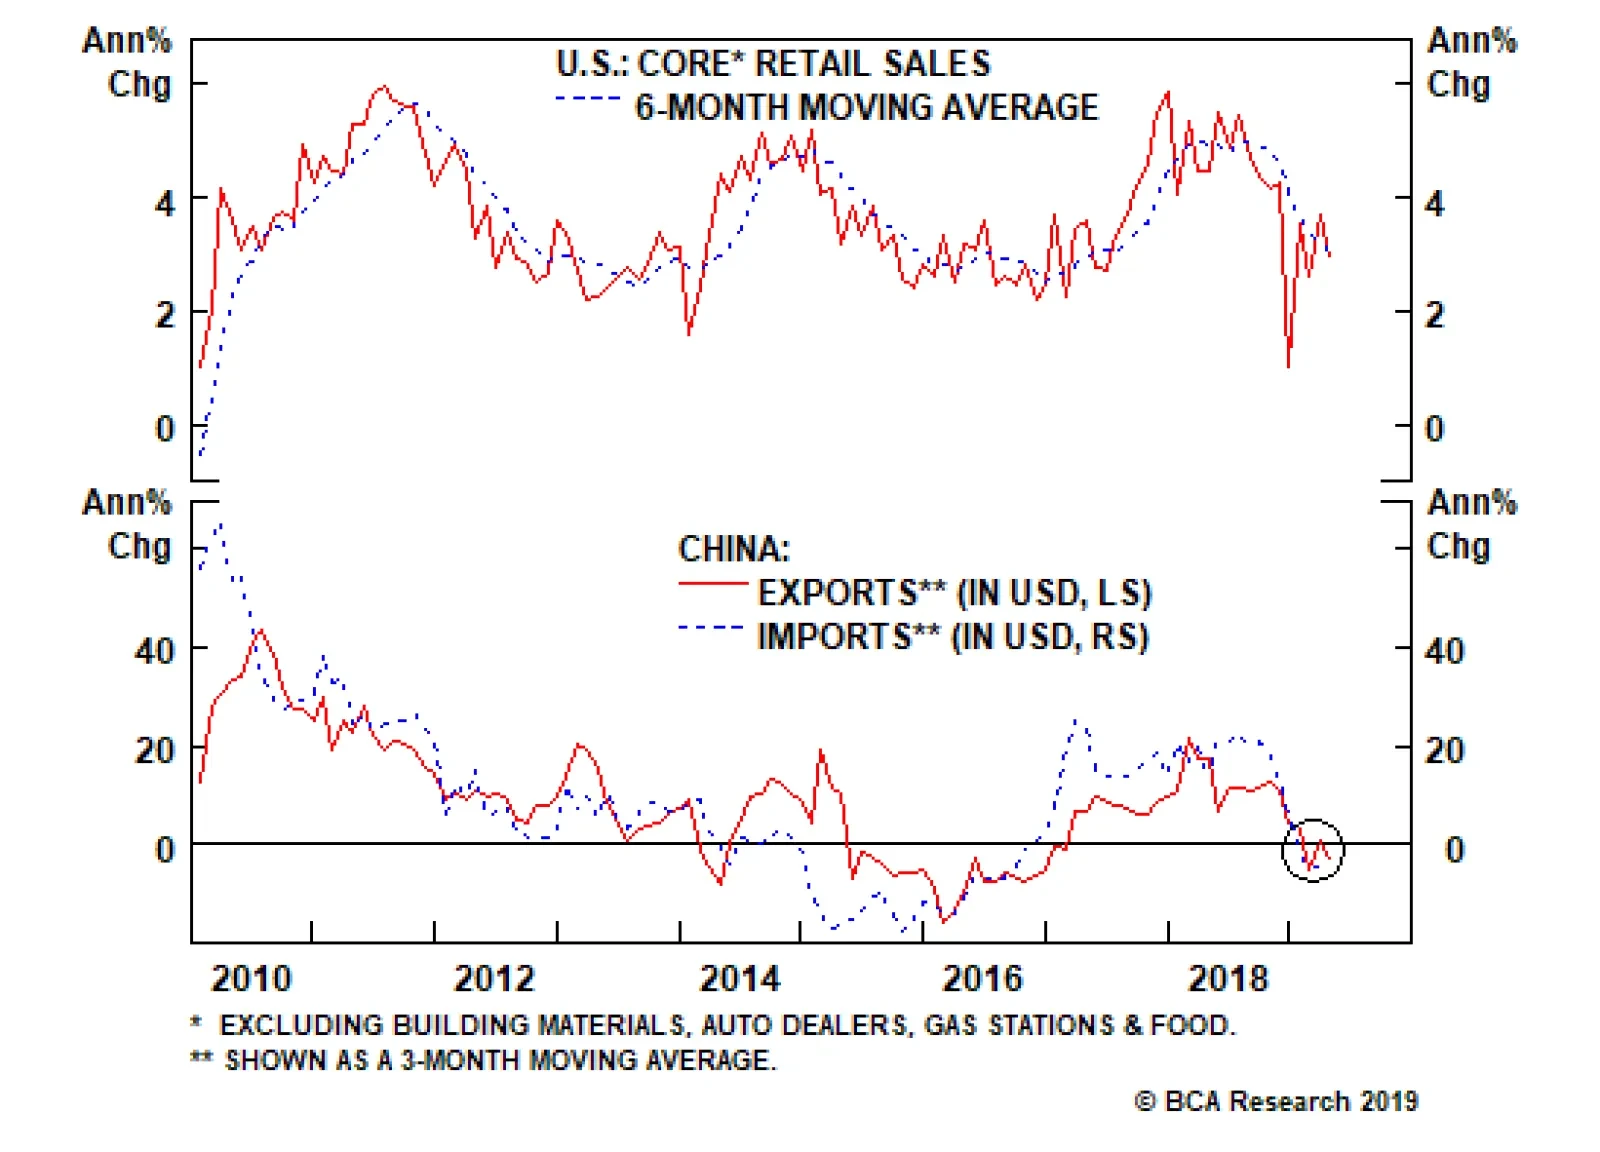
Next week we will get more clarity on how the U.S. and Chinese economies performed in May after re-escalation of trade confrontation. In the U.S., retail sales and industrial production data will shed light on growth and the NFBI survey will reflect small…
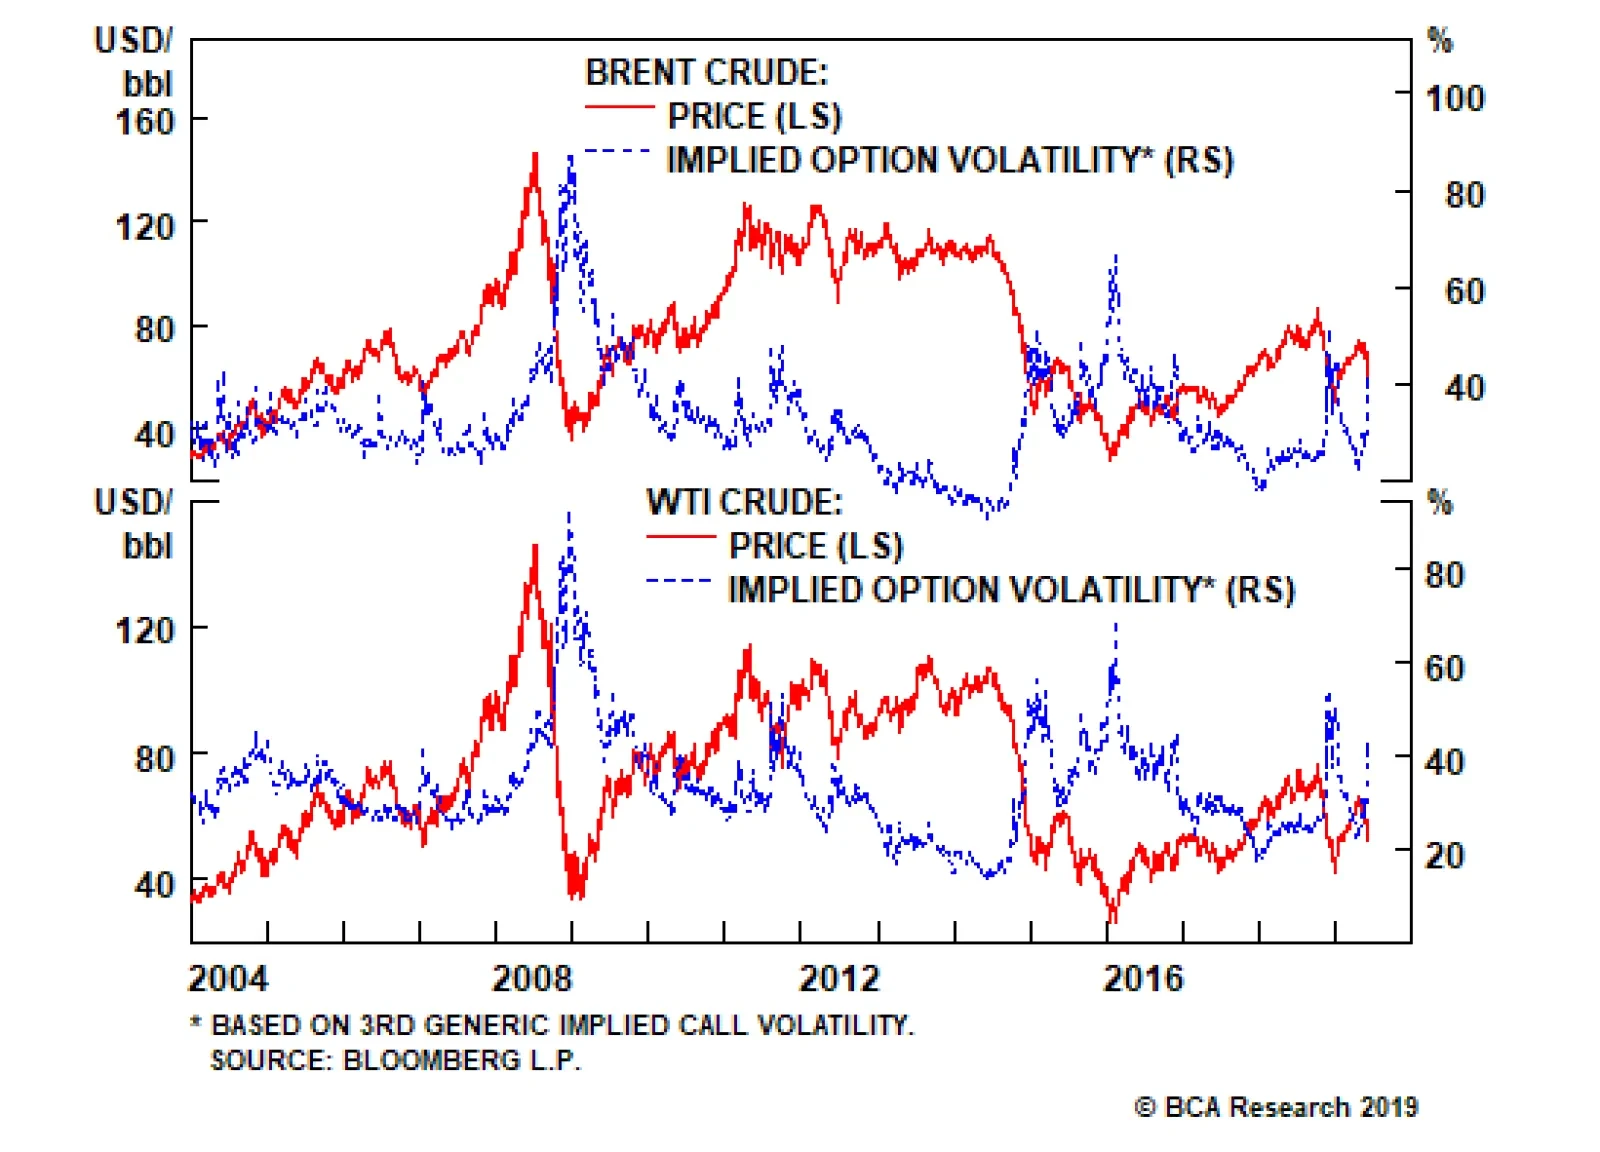
Oil prices continue to reflect heightened policy risk ranging from continuing Sino – U.S. trade-war tensions; new tariff threats against Mexico from the Trump administration; global growth concerns, which are fueled by rising oil inventories in the U.S.; and…
Feature Through the past five years, the global long bond yield has tried to surpass 2.5 percent on three occasions – once in 2015, twice in 2018. But it has failed (Feature Chart). The global long bond yield’s five-year struggle to break through 2.5 percent convinces us that the so-called ‘neutral’ rate of interest is now extremely low, indeed zero in real terms. This is a very high conviction view though, to be clear, not every BCA strategist may necessarily concur. Feature ChartSince 2015, The Global Long Bond Yield Has Struggled To Surpass 2.5 Percent
Since 2015, The Global Long Bond Yield Has Struggled To Surpass 2.5 Percent
Since 2015, The Global Long Bond Yield Has Struggled To Surpass 2.5 Percent
The neutral rate of interest is the interest rate at which monetary policy is neither accommodative nor restrictive, the interest rate consistent with the economy maintaining full employment while keeping inflation constant. That much is generally accepted. Here’s where we differ from the conventional thinking: what is setting the neutral rate now is not the economy’s direct sensitivity to the interest rate via rate sensitive sectors such as mortgage lending or home construction: rather, it is the economy’s indirect sensitivity to the interest rate via its impact on equities and other so-called ‘risky’ assets. This Special Report challenges the conventional wisdom on the neutral rate on three specific points: The neutral rate is based on the bond yield, not on the policy interest rate. The neutral rate is global, not European or region specific. The neutral rate is nominal, not real. The Neutral Rate Is Based On The Bond Yield, Not On The Policy Interest Rate
Chart I-2
The $400 trillion combined value of equities, corporate bonds, real estate and other risky assets dwarfs the $80 trillion global economy by five to one. These risky assets are long-duration assets, because their cash flows extend into the distant future. Hence, the market calibrates the expected return available on these risky assets from the supposedly less risky return available from long-duration bonds – the bond yield – plus a ‘risk premium’. Now comes the part of the story that is not well understood, even by central bankers, because it derives from recent advances outside their field of expertise. Years of research in behavioural finance conclude that the measure that best encapsulates our perception of an investment’s risk is not its volatility but its negative asymmetry: the potential largest loss as a multiple of the potential largest gain (Chart I-2). The $400 trillion combined value of equities, corporate bonds, real estate and other risky assets dwarfs the $80 trillion global economy by five to one. Crucially, when the bond yield gets low, the proximity of its lower bound dramatically reduces the potential for price gains while leaving open the potential for large losses. This sudden onset of negative asymmetry means that bonds are no longer less risky than equities or other risky assets (Chart I-3). So risky assets no longer need to deliver a higher expected return than bonds (Chart I-4).
Chart I-3
Chart I-4
Chart I-5Equities Offer Diversification Benefits Too!
Equities Offer Diversification Benefits Too!
Equities Offer Diversification Benefits Too!
Some people counter that bonds offer investors a diversification benefit and, because of this, investors still need a higher return from equities. This argument is wrong. Just as bonds can protect equity investors, equities can protect bond investors during vicious sell-offs in the bond market – such as after Trump’s shock victory in 2016 (Chart I-5). So we could equally argue that equities require the lower return. In fact, at a low bond yield, with the same negative asymmetry and diversification properties, both equities and bonds must offer the same prospective return. The upshot is that once the bond yield gets low and stays low, equity (and other risky asset) returns collapse to the feeble return offered by bonds with no additional ‘risk premium’ giving the valuation of $400 trillion of assets an exponential uplift (Chart I-6). The unfortunate corollary is that if the bond yield was no longer low, the valuation of $400 trillion of assets would suffer an exponential decline. And the consequent deterioration in financial conditions would send a chill wind through the global economy. Theoretically and empirically, the hyper-sensitivity of equity valuations to bond yields is greatest when the 10-year bond yield is in the 2-3 percent range. But which 10-year bond yield?1 Chart I-6Equities Are Now Priced To Generate A Feeble Long-Term Return
Equities Are Now Priced To Generate A Feeble Long-Term Return
Equities Are Now Priced To Generate A Feeble Long-Term Return
The Neutral Rate Is Global, Not European Or Region Specific The question: ‘will European equities go up or down?’ is essentially the same as ‘will U.S. equities go up or down?’ or ‘will Chinese equities go up or down?’ albeit the size of the moves can be quite different. The same applies to mainstream bond markets; in directional terms, bonds move together. Chart I-7The Global 10-Year Yield Is The Average Of The Euro Area, U.S., And China
The Global 10-Year Yield Is The Average Of The Euro Area, U.S., And China
The Global 10-Year Yield Is The Average Of The Euro Area, U.S., And China
Given this tight directional integration of global capital markets – and to some extent economies too – asset allocators make the asset class choice between equities and bonds their primary decision, and the regional allocation the subsidiary decision. It follows that the point of hyper-sensitivity of equity valuations, be it in Europe or any other region, is when the global 10-year bond yield is in the 2-3 percent range. What is the global 10-year bond yield? Previously, we defined it in terms of the German bund, U.S. T-bond, and JGB. But we now have an even better definition: it is the simple average of the 10-year yields in the world’s three major economies; the euro area, U.S., and China (Chart I-7).2 Given this yield’s five year struggle to surpass 2.5 percent, we can say that the ‘neutral’ rate, at which tighter financial conditions do not threaten any major economy, might be somewhere below this recent empirical limit, at around 2 percent. The Neutral Rate Is Nominal, Not Real
Chart I-8
Investors always think about the negative asymmetry of returns in nominal terms. This is because the losses they fear tend to be too short and too sharp for the real return to be meaningfully different from the nominal return.3 It follows that the aforementioned hyper-sensitivity of equity valuations is when the nominal bond yield is in the 2-3 percent range, resulting in a neutral nominal rate which might be 2 percent (Chart I-8). But if inflation is also running fairly close to 2 percent, as it is in the major economies, the upshot is that the neutral real rate of interest is zero. What Does All Of This Mean? To sum up, a decade of ultra-loose monetary policy has fostered an addiction to – or at least a dependency on – low bond yields (Chart I-9). But the dependency is not of the rate sensitive sectors in the economy per se, rather it is of the rich valuation of risky assets whose worth dwarfs the global economy by five to one (Chart I-10). Gradually, this dependency should diminish as economic and profit growth improves valuations, but this will take time. Chart I-9A Decade Of Ultra-Loose Monetary Policy...
A Decade Of Ultra-Loose Monetary Policy...
A Decade Of Ultra-Loose Monetary Policy...
Chart I-10...Has Made The Rich Valuation Of Risky Assets Dependent On Low Bond Yields
...Has Made The Rich Valuation Of Risky Assets Dependent On Low Bond Yields
...Has Made The Rich Valuation Of Risky Assets Dependent On Low Bond Yields
In the meantime, the integration of global capital markets means that the valuation cue for European – and all regional – stock markets now comes from the global 10-year bond yield. Given its recent decline to slightly below neutral, stock markets are unlikely to free fall. A decade of ultra-loose monetary policy has fostered an addiction to – or at least a dependency on – low bond yields. That said, the aggregate market is likely to be in a sideways structural pattern, as it has been for the past eighteen months, and the big opportunities will continue to come from sector rotation: in the second half of the year switch out of economically sensitives such as industrials, and into defensives such as healthcare. A final point is that any decline in the global bond yield to below neutral will come disproportionately from higher yielding bond markets. This will underpin the lower yielding major currencies such as the euro. But our first choice for the second half of the year remains the Japanese yen. Fractal Trading System* This week, we see an excellent opportunity to short Russia’s recent strong outperformance versus Japan. The recommended trade is short MOEX versus Nikkei225 with a profit target of 5 percent and symmetrical stop-loss. In other trades, short WTI crude versus LMEX achieved its profit target. Against this, short the French OAT reached its stop-loss. This leaves three open positions. For any investment, excessive trend following and groupthink can reach a natural point of instability, at which point the established trend is highly likely to break down with or without an external catalyst. An early warning sign is the investment’s fractal dimension approaching its natural lower bound. Encouragingly, this trigger has consistently identified countertrend moves of various magnitudes across all asset classes. Chart I-11
Russia (MOEX) VS. Japan (NIKKEI225)
Russia (MOEX) VS. Japan (NIKKEI225)
The post-June 9, 2016 fractal trading model rules are: When the fractal dimension approaches the lower limit after an investment has been in an established trend it is a potential trigger for a liquidity-triggered trend reversal. Therefore, open a countertrend position. The profit target is a one-third reversal of the preceding 13-week move. Apply a symmetrical stop-loss. Close the position at the profit target or stop-loss. Otherwise close the position after 13 weeks. Use the position size multiple to control risk. The position size will be smaller for more risky positions. * For more details please see the European Investment Strategy Special Report “Fractals, Liquidity & A Trading Model,” dated December 11, 2014, available at eis.bcaresearch.com. Dhaval Joshi, Chief European Investment Strategist dhaval@bcaresearch.com Footnotes 1 Consider what happens to valuations when bond yields decline from 4% to 2%. At a 4% bond yield, equities possess significantly more negative asymmetry than 10-year bonds. So investors will demand a comparatively higher return from equities, let’s say 8% a year. Whereas, at a 2% bond yield, equities and 10-year bonds possess the same negative asymmetry. So investors will demand the same return from equities as they can get from bonds, 2% a year. At the lower bond yield, the bond must deliver 2% a year less for ten years compared to previously, meaning its price must rise by 22%. But equities must deliver 6% a year less for ten years, so the equity market must surge by 80%. 2 We define the global 10-year bond yield as the simple average of the three 10-year bond yields in the euro area, U.S., and China, where the 10-year bond yield in the euro area is the issue-weighted average of the euro area’s individual 10-year bond yields. 3 For example, if bonds had a countertrend correction of 10% in a month when the economy was suffering severe deflation of 10% (per annum), it would still equate to a 9% loss in real terms! Fractal Trading System Recommendations Asset Allocation Equity Regional and Country Allocation Equity Sector Allocation Bond and Interest Rate Allocation Currency and Other Allocation Closed Fractal Trades Trades Closed Trades Asset Performance Currency & Bond Equity Sector Country Equity Indicators Bond Yields Chart II-1Indicators To Watch - Bond Yields
Indicators To Watch - Bond Yields
Indicators To Watch - Bond Yields
Chart II-2Indicators To Watch - Bond Yields
Indicators To Watch - Bond Yields
Indicators To Watch - Bond Yields
Chart II-3Indicators To Watch - Bond Yields
Indicators To Watch - Bond Yields
Indicators To Watch - Bond Yields
Chart II-4Indicators To Watch - Bond Yields
Indicators To Watch - Bond Yields
Indicators To Watch - Bond Yields
Interest Rate Chart II-5Indicators To Watch - ##br##Interest Rate Expectations
Indicators To Watch - Interest Rate Expectations
Indicators To Watch - Interest Rate Expectations
Chart II-6Indicators To Watch -##br## Interest Rate Expectations
Indicators To Watch - Interest Rate Expectations
Indicators To Watch - Interest Rate Expectations
Chart II-7Indicators To Watch -##br## Interest Rate Expectations
Indicators To Watch - Interest Rate Expectations
Indicators To Watch - Interest Rate Expectations
Chart II-8Indicators To Watch - ##br##Interest Rate Expectations
Indicators To Watch - Interest Rate Expectations
Indicators To Watch - Interest Rate Expectations
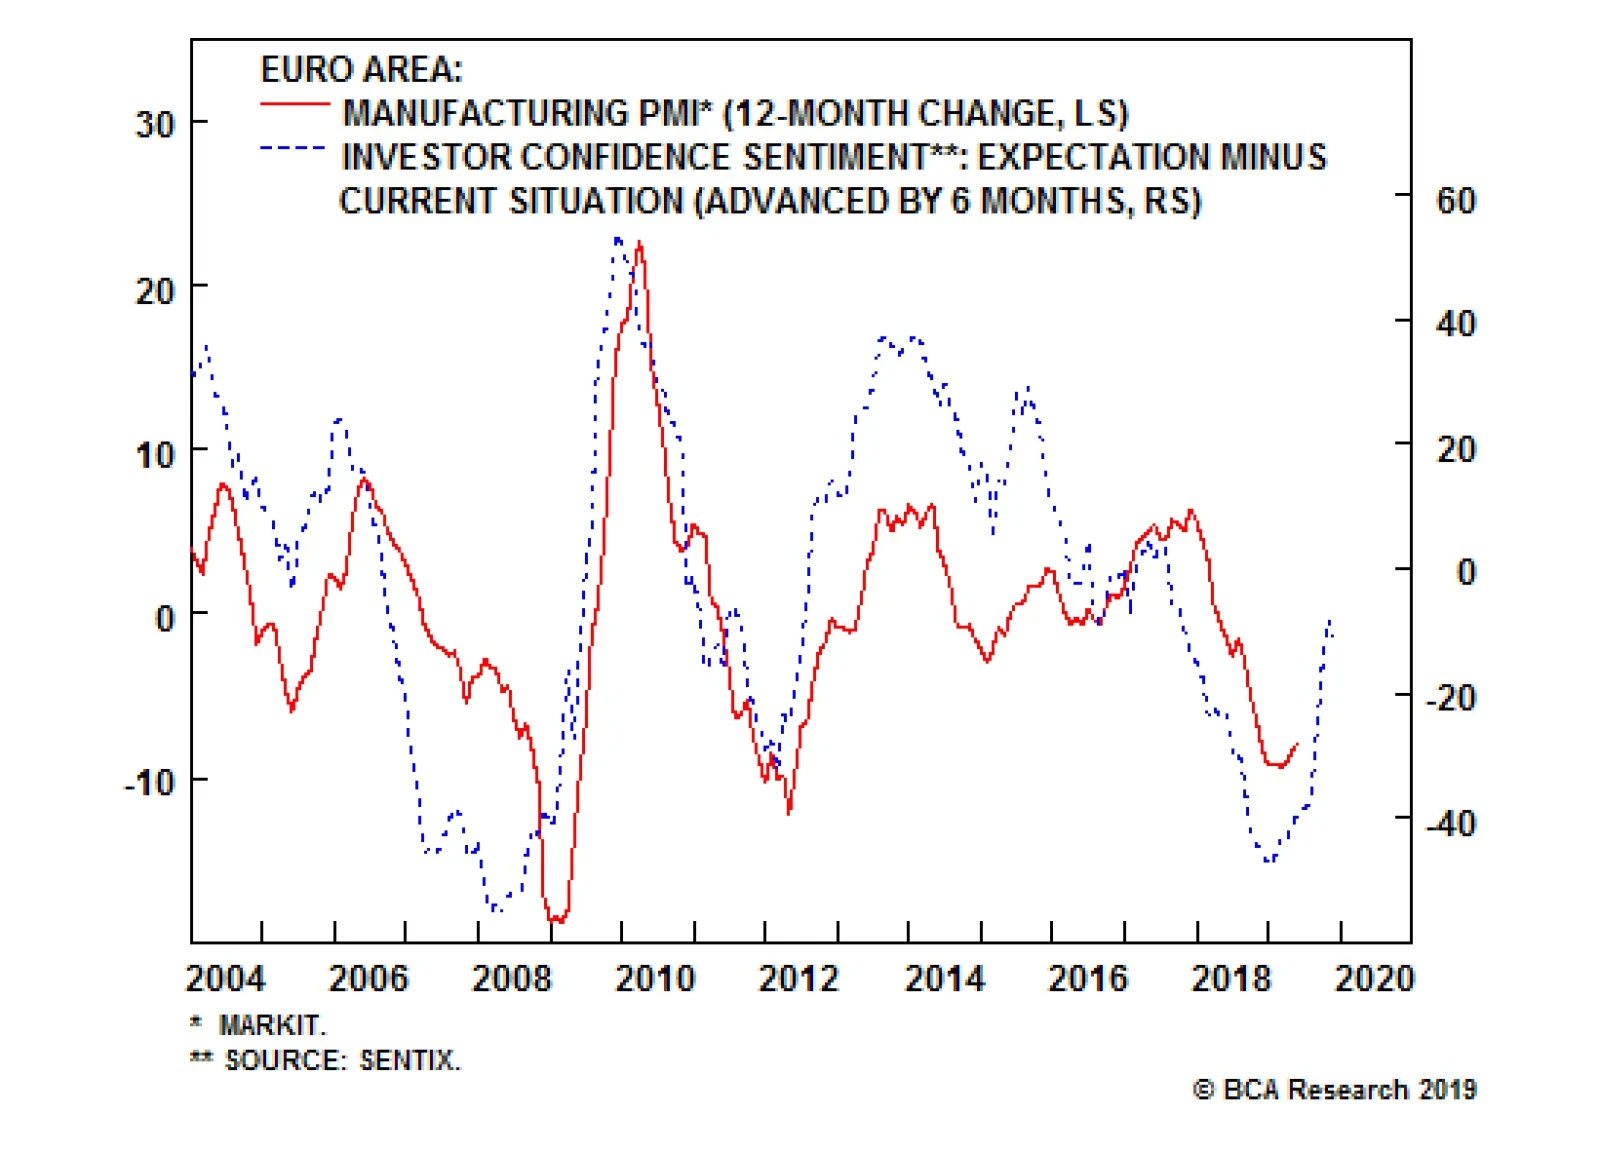
Seventeen months since global trade peaked in January 2018, evidence continues to accumulate that there is little recovery in sight: The euro zone manufacturing PMI remained very weak in May. The print came in at 47.7, with Germany holding at a…
Feature The GAA DM Equity Country Allocation model is updated as of May 31, 2019. The quant model has not made significant changes in the major country allocations, but has further increased Australia’s overweight after the upgrade in the previous month, as shown in Table 1. Table 1Model Allocation Vs. Benchmark Weights
GAA Quant Model Updates
GAA Quant Model Updates
As shown in Table 2 and Charts 1, 2 and 3, the overall model outperformed the MSCI World benchmark by 17 bps in May, largely from a 17 bps of outperformance from the Level 1 model, as the Level 2 model only eked out 1 bp of outperformance. Directionally, five out of the 12 choices generated positive alpha. The largest contributions to the outperformance in May came from the overweight in Switzerland and Australia, as well as the underweight in the U.S. Since going live, the overall model has outperformed by 170 bps, with a 350 bps of outperformance by Level 2 model, and an 11bps of outperformance from Level 1. Table 2Performance (Total Returns In USD %)
GAA Quant Model Updates
GAA Quant Model Updates
Chart 1GAA DM Model Vs. MSCI World
GAA DM Model Vs. MSCI World
GAA DM Model Vs. MSCI World
Chart 2GAA U.S. Vs. Non U.S. Model (Level 1)
GAA U.S. Vs. Non U.S. Model (Level 1)
GAA U.S. Vs. Non U.S. Model (Level 1)
Please see also the website http://gaa.bcaresearch.com/trades/allocation_performance. For more details on the models, please see Special Report, “Global Equity Allocation: Introducing The Developed Markets Country Allocation Model,” dated January 29, 2016, available at https://gaa.bcaresearch.com. Please note that the overall country and sector recommendations published in our Monthly Portfolio Update and Quarterly Portfolio Outlook use the results of these quantitative models as one input, but do not stick slavishly to them. We believe that models are a useful check, but structural changes and unquantifiable factors need to be considered too in making overall recommendations. Chart 3GAA Non U.S. Model (Level 2)
GAA Non U.S. Model (Level 2)
GAA Non U.S. Model (Level 2)
GAA Equity Sector Selection Model The GAA Equity Sector Model (Chart 4) is updated as of May 31, 2019. Chart 4Overall Model Performance
Overall Model Performance
Overall Model Performance
Table 3Model’s Performance (March 1, 2019 - Current)
GAA Quant Model Updates
GAA Quant Model Updates
Table 4Current Model Allocations
GAA Quant Model Updates
GAA Quant Model Updates
The model’s relative tilts between cyclicals and defensives have changed compared to last month. On the backdrop of weaker global growth, the model has become positive on Consumer Staples and upgraded the sector. This was driven by both the momentum and growth components. This in turn decreases the overweight allocations to Industrials and Utilities, the model’s two overweights, and increases the underweight allocation to the eight remaining sectors. The valuation component remains muted across all sectors. Our expectations are that global growth bottoms in the back end of the year. However, the hard data has not fully materialized yet. While escalated trade war tensions between the U.S. and China continue to put downward pressure on growth indicators, Chinese credit and fiscal stimulus, similar to that of 2009 and 2015, will more than likely put a floor under further downside. For more details on the model, please see the Special Report “Introducing the GAA Equity Sector Selection Model,” dated July 27, 2016, as well as the Sector Selection Model section in the Special Alert “GAA Quant Model Updates,” dated March 1, 2019 available at https://gaa.bcaresearch.com. Xiaoli Tang, Associate Vice President xiaoliT@bcaresearch.com Amr Hanafy, Research Associate amrh@bcaresearch.com
Highlights Monetary policy remains accommodative in Japan, but will tighten on a relative basis if the Bank Of Japan (BoJ) stands pat. The BoJ’s margin of error is non-trivial, since a small external shock could well tip the economy back into deflation. Historically, the BoJ has needed an external shock to act, suggesting the path towards additional stimulus could be lined with a stronger yen. Our bias is that USD/JPY could weaken to 104 in the next three to six months, especially if market volatility spikes further. We are carefully monitoring any shift in the yen’s behavior, in particular its role as a counter-cyclical currency. If global growth eventually picks up, the yen will surely weaken on its crosses, but could still strengthen versus the dollar. Feature The powerful bounce in global markets since the December lows is sitting at a critical juncture. With the S&P 500 at its 200-day moving average, crude oil and Treasury yields plunging and the dollar taking a bid, it may only require a small shift in market prices to change sentiment sharply. The yen has strengthened in sympathy with these moves, but the balance of evidence suggests the possibility of a much bigger adjustment. Should the selloff in global risk assets persist, the yen will strengthen further. On the other hand, if global growth does eventually pick up, the yen could weaken on its crosses but strengthen vis-à-vis the dollar. This places short USD/JPY bets in an enviable “heads I win, tails I do not lose too much” position. BoJ: Out Of Policy Bullets For most of the 1990s, Japan was in a deflationary bust. In hindsight, the reason was simple: The structural growth rate of the economy was well below interest rates, which meant paying down debt was preferable to investing. Tight money also led to a structurally strong currency, reinforcing the negative feedback loop (Chart I-1). Chart I-1The Story Of Japan In One Chart
The Story Of Japan In One Chart
The Story Of Japan In One Chart
Much farther down the road, the three arrows of ‘Abenomics’ arrived, ushering in a paradigm shift. Since 2012, Japan has enjoyed one of its longest economic expansions in recent history, having fine-tuned monetary policy each time private sector GDP growth has fallen close to interest rates. The result has been remarkable. The unemployment rate is close to a 26-year low, and the Nikkei index has tripled. But if the economy once again flirts with deflation, additional monetary policy options may be hard to come by, since there have been diminishing economic returns to additional stimulus. Chart I-2Stealth Tapering By ##br##The BoJ
Stealth Tapering By The BoJ
Stealth Tapering By The BoJ
Chart I-32 Percent Inflation Equal Mission Impossible?
2% Inflation = Mission Impossible?
2% Inflation = Mission Impossible?
The end of the Heisei era1 has brought forward the urgency of the above quandary. At its latest monetary policy meeting, the BoJ strengthened forward guidance, expanded collateral requirements for the provision of credit, and stated that it will continue to “conduct purchases of JGBs in a flexible manner so that their amount outstanding will increase at an annual pace of about 80 trillion yen.”2 But with the BoJ owning 46% of outstanding JGBs, about 75% of ETFs, and almost 5% of JREITs, this will be a tall order. The supply side obviously puts a serious limitation on how much more stimulus the central bank can provide. In recent years, the yen has become extremely sensitive to shifts in the relative balance sheets of the Federal Reserve and the BoJ. Total annual asset purchases by the BoJ are currently running at about ¥27 trillion, while JGBs purchases are running at ¥20 trillion. This is a far cry from the central bank’s soft target of ¥80 trillion, and is unlikely to change anytime soon. In recent years, the yen has become extremely sensitive to shifts in the relative balance sheets of the Federal Reserve and the BoJ. If the BoJ continues to purchase securities at its current pace, then the rate of expansion in its balance sheet will severely slow, and could trigger a knee-jerk rally in the yen (Chart I-2). The BoJ targets an inflation rate of 2%, but it is an open question as to whether it can actually achieve this. It pays attention to three main variables when looking at inflation: Core CPI, the GDP deflator, and the output gap. All indicators are pointing in the right direction, but the recent slowdown in the global economy could reverse this trend. It is always important to remember that the overarching theme for prices in Japan is a falling (and aging) population leading to deficient demand (Chart I-3). More importantly, almost 40% of the Japanese consumption basket is in tradeable goods, meaning domestic inflation is as much driven by the influence of the BoJ as it is by globalization. Even for prices within the BoJ’s control, an aging demographic that has a strong preference for falling prices is a powerful conflicting force. For example, over the years the government has been a thorn in the side of telecom companies, pushing them to keep cutting prices, given domestic pressures from its voting base. Transportation and telecommunications make up 17% of the core consumption basket in Japan, a non-negligible weight. This is and will remain a powerful drag on CPI (Chart I-4), making it difficult for the BoJ to re-anchor inflation expectations upward. On the other side of the coin, the importance of financial stability to the credit intermediation process has been a recurring theme among Japanese policymakers, with the health of the banking sector an important pillar. YCC and negative interest rates have been anathemas for Japanese net interest margins and share prices (Chart I-5). This, together with QE, has pushed banks to search for yield down the credit spectrum. Any policy shift that is increasingly negative for banks could easily tip them over. Chart I-4The Japanese Prefer Falling Prices
The Japanese Prefer Falling Prices
The Japanese Prefer Falling Prices
Chart I-5Negative Rates Are Anathema To Banks
Negative Rates Are Anathema To Banks
Negative Rates Are Anathema To Banks
Bottom Line: Inflation expectations are falling to rock-bottom levels in Japan, at a time when the BoJ may be running out of policy bullets. Meanwhile, the margin of error for the BoJ is non-trivial, since a small external shock could tip the economy back into deflation. The BoJ will eventually act, but it might first require a riot point. Go short USD/JPY. High Hurdle For Delaying Consumption Tax Since the late 1990s, every time Japan’s consumption tax has been hiked, the economy has slumped by an average of over 1.3% in subsequent quarters. For an economy with a potential growth rate of just 0.5-1%, this is a disastrous outcome. More importantly, similar to past episodes, the consumption tax is being hiked at a time when the economy is at the precipice of a major slowdown. Foreign and domestic machinery orders are slowing, employment growth has halved from 2% to 1%, and wages are inflecting lower (Chart I-6). This is especially worrisome since the labor market has been the poster child of the Japanese recovery.3 The consumption tax is being hiked at a time when the economy is at the precipice of a major slowdown. Why go ahead with the consumption tax then? The answer lies in the concept of Ricardian equivalence.4 Despite relatively robust economic conditions since the Fukushima disaster, Japanese consumption has remained tepid. By the same token, the savings ratio for workers has surged (Chart I-7). If consumers are caught in a Ricardian equivalence negative feedback loop, exiting deflation becomes a pipe dream. Chart I-6A Bad Omen
A Bad Omen
A Bad Omen
Increased social security spending: This will be particularly geared towards child education. For example, preschool and tertiary education will be made free of charge. Promoting cashless transactions: Transactions made via cashless payments (for example, via mobile pay) will not be subject to the 2% tax increase for nine months. Cashless payments in Japan account for less than 25% of overall transactions – among the lowest of developed economies. This incentive should help lift the velocity of money. Chart I-7Strong Labor Market, Weak Consumption
Strong Labor Market, Weak Consumption
Strong Labor Market, Weak Consumption
Construction spending: This will offset the natural disasters that afflicted Japan last year. Construction orders in Japan accelerated at a 66% pace in March. The Abe government’s strategy has so far been to offset the consumption tax hike with increased domestic spending. The thinking is that once in a liquidity trap, the fiscal multiplier tends to be much larger. Some of these outlays include: Chart I-8Japan Needs More Fiscal Stimulus
Japan Needs More Fiscal Stimulus
Japan Needs More Fiscal Stimulus
The new immigration law will also help. Foreign workers were responsible for 30% of all new jobs filled in Japan in 2017. Assuming public aversion towards immigration remains benign, as is the case now (these are mostly lower-paying jobs in sectors with severe labor shortages), the government’s target to attract 350,000+ new workers by 2025 will be beneficial for consumption. To be sure, this may not be enough. The IMF still projects the fiscal drag in Japan to be 0.1% of GDP in 2019 and 0.6% in 2020 (Chart I-8). This puts the onus back on the BoJ to ease financial conditions. A combination of easier fiscal and monetary policy will be a headwind for the yen. This could happen if the U.S./China trade war escalates, and twists the arm of the finance ministry. But the hurdle is high for the government to roll back the consumption tax, given significant spending offsets. The Yen As A Safe Haven Correlations do shift from time to time, but one longstanding rule of thumb still holds for yen investors: Buy the currency on any market turbulence (Chart I-9). This is because with a net international investment position of almost 60% of GDP and net income receipts of almost 4% of GDP, volatility in markets tend to lead to powerful repatriation flows back to Japan. Real interest rates also tend to be higher in Japan in recessions as already-low inflation expectations fall further. Correlations do shift from time to time, but one longstanding rule of thumb still holds for yen investors: Buy the currency on any market turbulence. Some have suggested that the BoJ’s asset purchases are pushing investors out of Japan and weakening the safe-haven status of the yen. While plausible, our view is that other factors have been at play. First, tax changes led to repatriation of capital back to the U.S. in 2018. This unduly pressured foreign direct investment in Japan as well as other safe-haven countries like Switzerland. Second, Japan, by virtue of its current account surplus, runs a capital account deficit. This means that portfolio outflows are the norm. This is how it has managed to build the biggest net international investment position in the world. Only in times of severe flight to safety are those investments liquidated and brought home. More importantly, the time may now be very ripe for yen long positions, given rising suspicion towards the currency as a haven. To see why, one only has to return to late 2016. Back then, global growth was soft, the yen was very cheap and everyone was short the currency on the back of a dovish shift by the BoJ. Despite that backdrop, the yen strengthened by almost 10% from December 2016 to mid-2017, even as equity markets remained resilient. When the equity market drawdown finally arrived in early 2018, it carried the final legs of the yen rally. With U.S. interest rates having risen significantly versus almost all G10 countries in recent years, including Japan’s, the dollar has become a carry currency. It will be difficult for the dollar to act as both a safe-haven and carry currency, because the forces that drive both move in opposite directions. As markets become volatile and these trades get unwound, this will be a powerful undercurrent for the yen (Chart I-10). Chart I-9The Yen Remains A Safe Haven
The Yen Remains A Safe Haven
The Yen Remains A Safe Haven
Chart I-10The Yen Has Financed Carry Trades
The Yen Has Financed Carry Trades
The Yen Has Financed Carry Trades
Bottom Line: Every diversified currency portfolio should hold the yen as insurance against rising market volatility. What If Global Growth Picks Up? The eventual bottom in global growth is a key risk to our scenario. However, inflows into Japan could accelerate, given cheap equity valuations and improved corporate governance that has been raising the relative return on capital (Chart I-11). The propensity of investors to hedge these purchases will dictate the yen’s path. The traditional negative relationship between the yen and the Nikkei still holds, but it will be important to monitor if this correlation shifts during the next equity market rally. Over the past few years, an offshoring of industrial production has been marginally eroding the benefit of a weak yen/strong Nikkei. If a company’s labor costs are no longer incurred in yen, then the translation effect for profits is reduced on currency weakness. USD/JPY and the DXY tend to have a positive correlation because the dollar drives the yen most of the time. Our contention is that the yen will surely weaken at the crosses, but could strengthen versus the dollar. USD/JPY and the DXY tend to have a positive correlation because the dollar drives the yen most of the time. Meanwhile, large net short positioning in the yen versus the dollar makes it attractive from a contrarian standpoint (Chart I-12). Chart I-11Japan: Better Governance, Higher ROIC
Japan: Better Governance, Higher ROIC
Japan: Better Governance, Higher ROIC
Chart I-12Short USD/JPY: A Contrarian Bet
Short USD/JPY: A Contrarian Bet
Short USD/JPY: A Contrarian Bet
Bottom Line: Short USD/JPY trades have entered into an envious “heads I win, tails I do not lose too much” position. Should the selloff in global risk assets persist, the yen will strengthen further. On the other hand, if global growth does eventually pick up later this year, the yen could weaken on its crosses but may actually strengthen versus the dollar. Housekeeping We are closing our short EUR/CZK position with a 4.7% profit. Interest rate differentials between the Czech Republic and the euro area have widened significantly, at a time when growth and labor market tightness could be fraying at the edges. Meanwhile, possible weakness in the dollar will be a risk to this position. Chester Ntonifor, Foreign Exchange Strategist chestern@bcaresearch.com Footnotes 1 The Heisei era refers to the period corresponding to the reign of Japanese Emperor Akihito from 1989 until 2019. 2 Please see “Minutes of the Monetary Policy Meeting,” Bank of Japan, dated May 8, 2019, p.27. 3 Sample changes last year make it more difficult to have an apples-to-apples comparison for wages. 4 Ricardian equivalence suggests in simple terms that public sector dissaving will encourage private sector savings. Currencies U.S. Dollar USD Technicals 1
USD Technicals 1
USD Technicals 1
USD Technicals 2
USD Technicals 2
USD Technicals 2
Recent data in the U.S. have been negative: Total durable goods orders decreased by 2.1% in April. On the housing front, FHFA house price growth fell to 0.1% month-on-month in March. MBA Mortgage applications fell by 3.3% in May. Conference Board consumer confidence index improved to 134.1 in May. Dallas Fed Manufacturing activity index fell to -5.3 in May. Annualized GDP came in at 3.1% quarter-on-quarter in Q1, revised from the previous 3.2% but higher than the consensus of 3%. Q1 headline and core PCE both fell to 0.4% and 1% quarter-on-quarter respectively. DXY index increased by 0.6% this week. In the long-term, we maintain a pro-cyclical stance, and continue to believe that the path of least resistance for the dollar in down. In the short-term however, there is more room for the trade-weighted dollar to rise before eventually reversing, amid global data weakness and political uncertainties. Report Links: President Trump And The Dollar - May 9, 2019 Take Out Some Insurance - May 3, 2019 Currency Complacency Amid A Global Dovish Shift - April 26, 2019 The Euro EUR Technicals 1
EUR Technicals 1
EUR Technicals 1
EUR Technicals 2
EUR Technicals 2
EUR Technicals 2
Recent data in the euro area have shown improvement: Private loans increased by 3.4% year-on-year in April. Money supply (M3) increased by 4.7% year-on-year in April. Business climate indicator fell to 0.3 in May. Despite the weak business climate indicator, soft data in the euro area have generally improved in May: economic confidence rose to 104; industrial confidence increased to -2.9; services confidence climbed to 12.2. Lastly, the consumer confidence increased to -6.5. EUR/USD fell by 0.7% this week. During this weekend’s European Parliament election, the European People’s Party (EPP) won with 24% of the seats. However, 43 seats were lost compared with their last election result. The S&D party also lost 34 seats, together ending the 40-year majority of the center-right and center-left coalitions. Report Links: Take Out Some Insurance - May 3, 2019 Reading The Tea Leaves From China - April 12, 2019 Into A Transition Phase - March 8, 2019 The Yen JPY Technicals 1
JPY Technicals 1
JPY Technicals 1
JPY Technicals 2
JPY Technicals 2
JPY Technicals 2
Recent data in Japan have been negative: All industry activity index fell by 0.4% month-on-month in March. The leading index and coincident index both fell to 95.9 and 99.4 respectively in March. PPI services fell to 0.9% year-on-year in April, below the expected 1.1%. Labor market and CPI data will be released after we go to press today. USD/JPY rose by 0.3% this week. BoJ Governor Haruhiko Kuroda has given two speeches this week, warning about the high degree of uncertainty, and potential downside risks worldwide. On the positive side, Kuroda thinks that EM capital outflows are less at risk than during recent financial crises, given a better framework for risk management. In the meantime, uncertainties remain regarding the U.S.-Japan trade disputes, especially vis-à-vis Japanese auto exports. Report Links: Beware Of Diminishing Marginal Returns - April 19, 2019 Tug OF War, With Gold As Umpire - March 29, 2019 A Trader’s Guide To The Yen - March 15, 2019 British Pound GBP Technicals 1
GBP Technicals 1
GBP Technicals 1
GBP Technicals 2
GBP Technicals 2
GBP Technicals 2
Recent data in the U.K. continue to outperform: Total retail sales increased by 5.2% year-on-year in April, surprising to the upside. BBA mortgage a pprovals increased to 43 thousand in April. GBP/USD fell by 0.8% this week. The uncertainties of Brexit increased with the resignation of Prime Minister Theresa May last Friday. With a Brexit decision not due until October 31, 2019, the U.K. has participated in the recent EU election. The newly formed Brexit Party led by Nigel Farage, won with more than 31% of the votes. This reflects a growing dissatisfaction with traditional parties within U.K. Report Links: A Contrarian View On The Australian Dollar - May 24, 2019 Take Out Some Insurance - May 3, 2019 Not Out Of The Woods Yet - April 5, 2019 Australian Dollar AUD Technicals 1
AUD Technicals 1
AUD Technicals 1
AUD Technicals 2
AUD Technicals 2
AUD Technicals 2
Recent data in Australia have been mostly negative: ANZ Roy Morgan weekly consumer confidence index increased to 118.6 this week. HIA new home sales fell by 11.8% month-on-month in April. Moreover, building permits decreased by 24.2% year-on-year. Private capital expenditure in Q1 fell by 1.7% quarter-on-quarter. Building approvals fell by 4.7% month-on-month in April. AUD/USD fell by 0.2% this week. As we argued in last week’s report, we favor the Aussie dollar from a contrarian point of view. Despite the negative data points on the surface, the recent election result and dovish shift by RBA all support the Australian economy in the long-term. Moreover, the robust job market, rising terms of trade, and Chinese stimulus will likely put a floor under AUD/USD. Report Links: A Contrarian View On The Australian Dollar - May 24, 2019 Beware Of Diminishing Marginal Returns- April 19, 2019 Not Out Of The Woods Yet - April 5, 2019 New Zealand Dollar NZD Technicals 1
NZD Technicals 1
NZD Technicals 1
NZD Technicals 2
NZD Technicals 2
NZD Technicals 2
Recent data in New Zealand have been mixed: ANZ activity outlook increased by 8.5% in May, well above consensus. Building permits fell by 7.9% month-on-month in April. ANZ business confidence remained low at -32 in May. NZD/USD fell by 0.6% this week. The Financial Stability Report, released by RBNZ this week, highlighted the worrisome debt levels, particularly in the household and dairy sectors. Ongoing efforts are necessary to bolster system soundness and efficiency, according to RBNZ governor Adrian Orr. Report Links: Not Out Of The Woods Yet - April 5, 2019 Balance Of Payments Across The G10 - February 15, 2019 A Simple Attractiveness Ranking For Currencies - February 8, 2019 Canadian Dollar CAD Technicals 1
CAD Technicals 1
CAD Technicals 1
CAD Technicals 2
CAD Technicals 2
CAD Technicals 2
Recent data in Canada have been positive: Bloomberg Nanos confidence index improved to 55.7, from the previous 55.1. Current account deficit increased to C$17.35 billion from C$16.62 billion, but it is lower than the expected C$ 18 billion. USD/CAD increased by 0.4% this week. On Wednesday, the Bank of Canada (BoC) held interest rates steady at 1.75%, as widely expected. Despite the recent trade uncertainties, the BoC views the slowdown in late 2018 and early 2019 as temporary, and expects growth to pick up again in the second quarter this year, supported by recovering oil prices, stabilizing housing sector, robust job market and easy financial conditions. Report Links: Currency Complacency Amid A Global Dovish Shift - April 26, 2019 A Shifting Landscape For Petrocurrencies - March 22, 2019 Into A Transition Phase - March 8, 2019 Swiss Franc CHF Technicals 1
CHF Technicals 1
CHF Technicals 1
CHF Technicals 2
CHF Technicals 2
CHF Technicals 2
Recent data in Switzerland have been mixed: Q1 GDP came in higher-than-expected at 1.7% year-on-year, from the previous reading of 1.5%. Trade surplus reduced to 2.3 million CHF in April, mostly due to the decrease in exports. KOF leading indicator fell to 94.4 in May. ZEW expectations fell in May to -14.3. USD/CHF appreciated by 0.7% this week. We favor the Swiss franc as a safe haven when market volatility rises. In the longer term, the high domestic savings rate, rising productivity, and current account surplus should all underpin the franc. Report Links: What To Do About The Swiss Franc? - May 17, 2019 Beware Of Diminishing Marginal Returns - April 19, 2019 Balance Of Payments Across The G10 - February 15, 2019 Norwegian Krone NOK Technicals 1
NOK Technicals 1
NOK Technicals 1
NOK Technicals 2
NOK Technicals 2
NOK Technicals 2
There is little data from Norway this week: Retail sales increased by 1.6% year-on-year in April. Credit expanded by 5.7% year-on-year in April USD/NOK increased by 0.9% this week. Our Commodity & Energy Strategy team believe that the energy market is underpricing the U.S. - Iran war risk, and overestimating the short-term effects of the trade war. In the long run, the Chinese stimulus, dollar weakness, and supply uncertainties should lift oil prices, which will support the Norwegian krone. Report Links: Currency Complacency Amid A Global Dovish Shift - April 26, 2019 A Shifting Landscape For Petrocurrencies - March 22, 2019 Balance Of Payments Across The G10 - February 15, 2019 Swedish Krona SEK Technicals 1
SEK Technicals 1
SEK Technicals 1
SEK Technicals 2
SEK Technicals 2
SEK Technicals 2
Recent data in Sweden have been mostly negative: Producer price inflation fell to 4.9% year-on-year in April from 6.3% in March. Consumer confidence fell to 91 in May. Moreover, manufacturing confidence fell to 103.7 in May. Trade surplus fell from 6.4 billion to 1.4 billion SEK in April. Q1 GDP came in at 2.1% year-on-year, outperforming expectations but lower than the previous 2.4%. USD/SEK has been flat this week. Swedish exports, a reliable barometer for global business confidence, fell from 133.4 billion SEK to 128 billion SEK in April, which is a total decrease of 5.4 billion SEK in exports, implying that the global growth remains in a volatile bottoming process. Report Links: Balance Of Payments Across The G10 - February 15, 2019 A Simple Attractiveness Ranking For Currencies - February 8, 2019 Global Liquidity Trends Support The Dollar, But... - January 25, 2019 Trades & Forecasts Forecast Summary Core Portfolio Tactical Trades Closed Trades
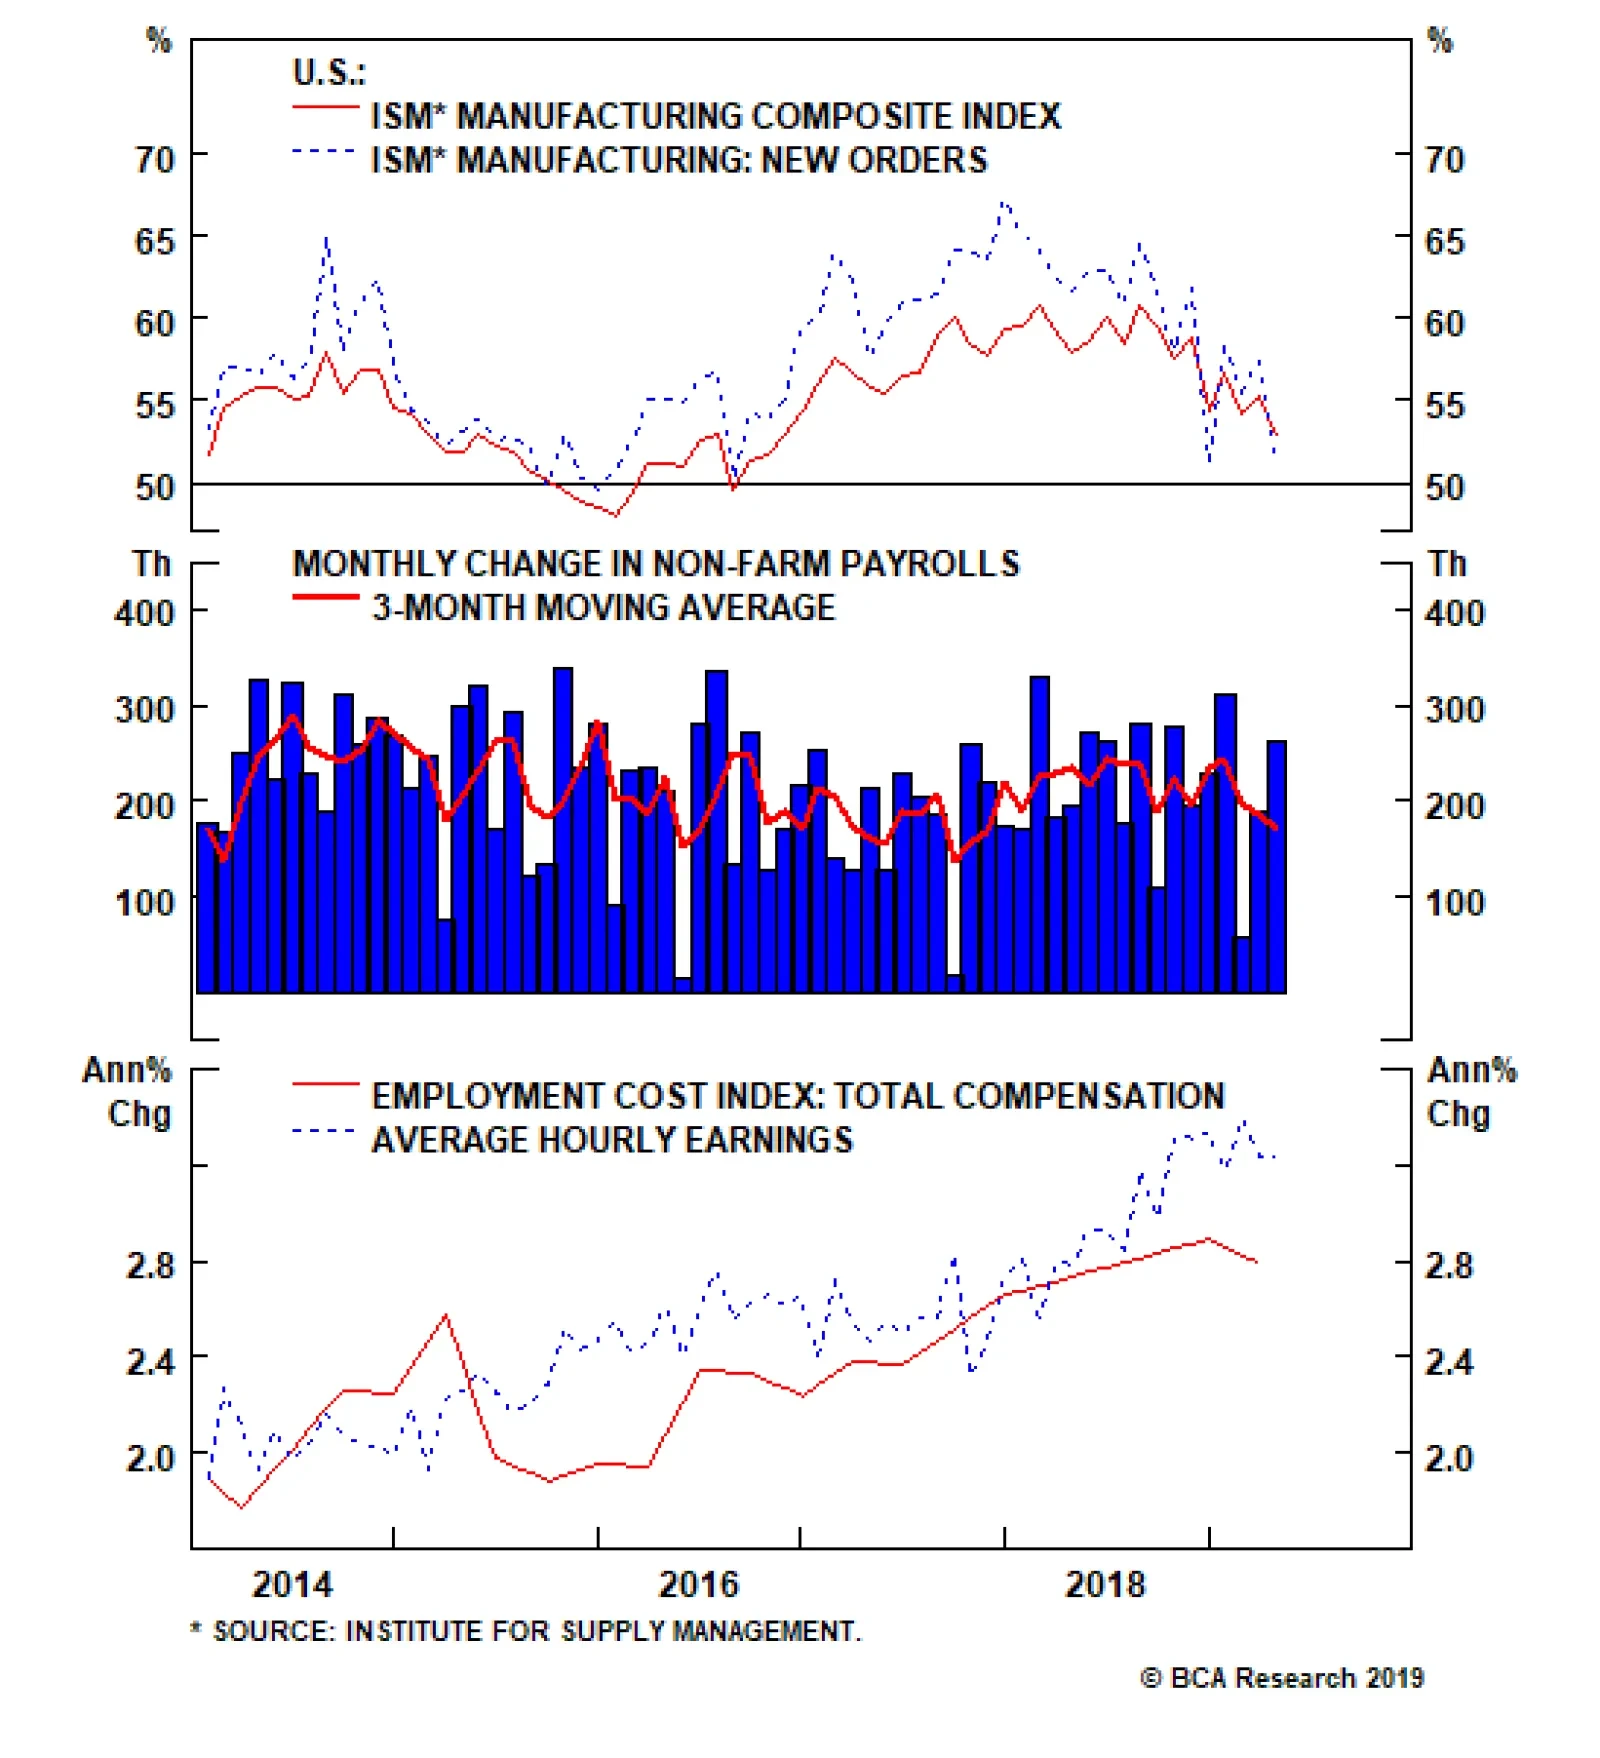
Next week will be a busy one marked by the release of the global PMIs on Monday. If the flash estimates and the Chinese data this morning are any guide, the global manufacturing PMIs will have weakened in May. In the U.S., the ISM manufacturing comes out…
Highlights Global equities face near-term downside risks from the trade war, but should be higher in 12 months’ time. Its claims to novelty notwithstanding, Modern Monetary Theory is basically indistinguishable from standard Keynesian economics except that MMT assumes that changes in interest rates have no discernible effect on aggregate demand. This straightforward but unrealistic assumption allows MMT’s proponents to argue that the neutral rate of interest does not exist, that crowding out is impossible, and that while fiscal deficits do matter (because too much government spending can stoke inflation), debt levels do not. Despite its many shortcomings, MMT’s focus on financial balances and the role of sovereign-issued money is laudable. A better understanding of these concepts would have made investors a lot of money during the past decade. Today, most economies are still running large private-sector financial surpluses. This surplus of desired savings relative to investment has kept interest rates low, which have allowed governments to finance their budgets at favorable terms. As these surpluses decline, inflation will rise. Feature Greetings From Down Under I have been meeting clients in Australia and New Zealand this week. The mood has been generally negative on the outlook for both the domestic and global economies. As one might imagine, the brewing China-U.S. trade war has been a hot topic of discussion. We went tactically short the S&P 500 on May 10th, a move that for the time being effectively neutralizes our structurally overweight stance on global equities. As we indicated when we initiated the hedge, we will take profits on the position if the S&P 500 drops below 2711. Despite the darkening clouds hanging over the trade war, we still expect a detente to be reached that prevents a further escalation of the conflict. Both sides would suffer from an extended trade war. For China, it is no longer just about losing access to the vast U.S. market. It is also about losing access to vital technology. The blacklisting of Huawei deprives China of critical components needed to realize its dream of becoming a world leader in AI and robotics. The trade war will not harm the U.S. as much as it will China, but it has still raised prices for American consumers, while lowering the prices of key agricultural exports such as soybeans. It has also hurt the stock market, which Trump seems to view as a barometer for his own success as president. If a trade detente is eventually reached, market attention will shift back to the outlook for global growth. We expect the combination of aggressive Chinese fiscal/credit stimulus and the palliative effects of falling global bond yields over the past seven months to lift growth in the back half of the year. As a countercyclical currency, the U.S. dollar is likely to weaken when global growth starts to strengthen. This will provide an opportune time to go overweight EM and European equities as well as the more cyclical sectors of the stock market. Are You Now Or Have You Ever Been A Member Of The MMT Movement? Last week’s report1 argued that a global deflationary ice age is unlikely to transpire because politicians will pursue large-scale fiscal stimulus to preclude this outcome. We noted that many countries are easing fiscal policy at the margin, partly in response to populist pressures. Even in Japan, the likelihood that the government will raise the sales tax this year has diminished, while structural forces will continue to drain savings for years to come. This will set the stage for higher inflation in Japan, something the market is not at all anticipating. Somewhat controversially, we contended that larger budget deficits are unlikely to imperil debt sustainability, at least for countries that are able to issue debt in their own currencies. This implies that any government with its own printing press should simply ease fiscal policy until long-term inflation expectations reach their target level. MMT can best be thought of as a special case of Keynesian economic theory where monetary policy is not just relegated to the back burner, but banished from the kitchen altogether. A number of readers pointed out that our analysis sounded suspiciously supportive of Modern Monetary Theory (MMT). Are we really closet MMT devotees? No, we are not. Our approach shares some commonalities with MMT (so if you want to call me a “MMT sympathizer,” go ahead). However, it also differs from MMT in a number of important respects. As we discuss below, these differences have significant implications for market outcomes, particularly one’s views about the long-term direction of government bond yields. MMT: A “Special Case” Of Keynesian Economics
Chart 1
Modern Monetary Theory is not nearly as novel as its backers claim. In fact, MMT can best be thought of as a special case of Keynesian economic theory where monetary policy is not just relegated to the back burner, but banished from the kitchen altogether. Outside of liquidity trap conditions, most economists believe that monetary policy is an effective aggregate demand management tool. MMT’s supporters reject this. In their view, changes in interest rates have no impact on spending. In the technical parlance of economics, MMT is basically the Hicksian IS/LM model but with a vertical IS curve and an LM curve that intersects the IS curve at an interest rate of zero (Chart 1). This seemingly small variation on the traditional Keynesian framework has far-reaching consequences. For one thing, it renders meaningless the entire concept of the neutral rate of interest. If changes in interest rates have no effect on aggregate demand, then one cannot identify an equilibrium level of interest rates that is consistent with full employment and stable inflation. Given their leftist roots, it is not surprising that most MMTers favor keeping rates low, preferably near zero. Higher rates shift income from borrowers to lenders. The latter tend to be richer than the former. Why reward fat cats when you don’t have to? Low rates also allow the government to spend more without putting the debt-to-GDP ratio on an unsustainable trajectory. If the interest rate at which the government borrows stays below the growth rate of the economy, the government can run a stable Ponzi scheme, perpetually issuing new debt to pay the interest on existing debt (Chart 2). In such a world, budget deficits only matter to the extent that too much fiscal stimulus can stoke inflation. The level of debt, in contrast, never matters.
Chart 2
Interest Rates Do Affect Aggregate Demand Chart 3Mortgage Rate Swings Matter For The Housing Market
Mortgage Rate Swings Matter For The Housing Market
Mortgage Rate Swings Matter For The Housing Market
Despite MMT’s efforts to deny any role for monetary policy in stabilizing the economy, the empirical evidence clearly shows that changes in interest rates do affect consumption and investment decisions. Housing activity, in particular, is very sensitive to movements in mortgage rates. The recent drop in mortgage rates bodes well for U.S. housing activity during the remainder of the year (Chart 3). The dollar, like most currencies, is also influenced by shifts in interest rate differentials (Chart 4). Changes in the dollar affect net exports, and hence overall employment. Once we acknowledge that interest rates affect aggregate demand, we are back in a world of trade-offs between monetary and fiscal policy. One can have easy monetary policy and tight fiscal policy, or tight monetary policy and easy fiscal policy. But outside of liquidity trap conditions, one cannot have both easy monetary and fiscal policies for a prolonged period of time without tolerating higher and rising inflation. Chart 4Historically, The Dollar Has Moved In Line With Interest Rate Differentials
Historically, The Dollar Has Moved In Line With Interest Rate Differentials
Historically, The Dollar Has Moved In Line With Interest Rate Differentials
The Perils Of Accounting Identities MMT proponents love accounting identities. They are particularly fond of saying that government deficits endow the private sector with additional wealth in the form of government bonds or cash. Unfortunately, the penchant to “argue by accounting identity” is almost always a recipe for disaster since such arguments usually fail to identify the causal forces by which one thing affects the other. For example, no competent economist would deny that an increase in the fiscal deficit must tautologically imply an increase in the private sector’s financial balance (the difference between the private sector’s income and spending). What MMT adherents fail to appreciate is that private-sector savings can increase either if incomes rise or spending falls. Ironically, what often gets overlooked is that the predictions made by standard Keynesian economic theory over the past decade have proven to be broadly accurate. When an economy is depressed, fiscal stimulus is likely to increase employment. In such a setting, rising payrolls will boost incomes, leading to a larger private-sector surplus. In contrast, when the economy is operating at full employment, any increase in the private-sector surplus must come about through a decline in private-sector spending. That is to say, if the government consumes more of the economy’s output, the private sector has to consume less. There is a huge difference between the two cases. MMTers tend to gloss over this distinction because they do not really have a theory for why the private-sector financial balance moves around in the first place. To them, private-sector spending is completely exogenous. It is determined by such things as animal spirits that the government has no control over. The government’s only job is to adjust the fiscal balance to ensure that it is the mirror image of the private-sector’s balance. Budget deficits cannot crowd out private-sector spending in this context because the government plays no role in determining how much the private sector wishes to spend. Investment Conclusions Economics gets a bad rap these days. Although most people would not go as far as Nassim Taleb who once mused about running over economists in his Lexus, it is fair to say that there is a lot of disillusionment towards the economics profession. Ostensibly heterodox theories like MMT help fill an intellectual void for those hoping to rewrite the economics textbooks for the 21st century. Ironically, what often gets overlooked is that the predictions made by standard Keynesian economic theory over the past decade have proven to be broadly accurate. Shortly after the financial crisis, when the world was still mired in a deep slump, Keynesian economics predicted that large budget deficits would not push up interest rates and that QE would not lead to runaway inflation. In contrast, Taleb said in early February 2010, when the 10-year Treasury yield was trading at around 3.6%, that Ben Bernanke was “immoral” and that “Every single human being should short Treasury bonds. It’s a no-brainer.” The study of financial balances is not unique to MMT, nor is MMT’s approach to thinking about financial balances the best one. Even so, a basic understanding of the concept would have prevented Taleb and countless others from making the mistakes they did. The fact that MMT has brought the discussion of financial balances, along with related concepts such as the role of sovereign-issued money in an economy, back into the spotlight is its greatest virtue. Today, most economies are still running large private-sector financial surpluses (Chart 5). Given that interest rates are so low, it is difficult to argue that budget deficits are crowding out private spending. This may change over time, however. Falling unemployment is boosting consumer confidence, which will bolster spending. U.S. wage growth has already accelerated sharply among workers at the bottom end of the income distribution (Chart 6). These are the workers with the highest marginal propensity to consume. Chart 5AMost Major Countries Run Private-Sector Surpluses (I)
Most Major Countries Run Private-Sector Surpluses (I)
Most Major Countries Run Private-Sector Surpluses (I)
Chart 5BMost Major Countries Run Private-Sector Surpluses (II)
Most Major Countries Run Private-Sector Surpluses (II)
Most Major Countries Run Private-Sector Surpluses (II)
Meanwhile, baby boomers are leaving the labor force. More retirees means less production, but not necessarily less consumption. Once health care spending is added to the tally, consumption actually increases in old age (Chart 7). If production falls in relation to consumption, excess savings will decline and the neutral rate of interest will rise.
Chart 6
Chart 7Savings Over The Life Cycle
Savings Over The Life Cycle
Savings Over The Life Cycle
When this happens, will governments tighten fiscal policy, as the MMT prescription requires? In a world where entitlement programs are politically sacrosanct, that seems unlikely. The end result is that economies will overheat and inflation will rise. Will central banks tighten monetary policy in response to higher inflation? That depends on what one means by tighten. Central banks will undoubtedly raise rates, but in a world of high debt levels, they will be loath to push interest rates above the growth rate of the economy. Interest rates will rise in nominal terms, but probably very little or not at all in real terms. In such an environment, investors should maintain below-benchmark duration exposure in their fixed-income portfolios, while favouring inflation-linked bonds over nominal bonds. Owning traditional inflation hedges such as gold would also make sense. Peter Berezin, Chief Global Strategist Global Investment Strategy peterb@bcaresearch.com Footnotes 1 Please see Global Investment Strategy Weekly Report, “Ice Age Cometh?” dated May 24, 2019. Strategy & Market Trends MacroQuant Model And Current Subjective Scores
Chart 8
Tactical Trades Strategic Recommendations Closed Trades
We remain structurally overweight global equities, but hedged our long exposure on May 10th following what we regarded as an overly complacent reaction by investors to President Trump’s decision to further raise tariffs on Chinese imports. Last night’s announcement that the U.S. will increase tariffs on Mexican imports represents a further escalation of the trade war. About two-thirds of U.S.-Mexican cross-border trade is between the same companies. Higher tariffs and increased operating inefficiencies will eat into the profits of U.S.-listed firms. Accordingly, we are reducing the profit target on our short S&P 500 trade from 2711 to 2650. Peter Berezin, Chief Global Strategist Global Investment Strategy peterb@bcaresearch.com