Global
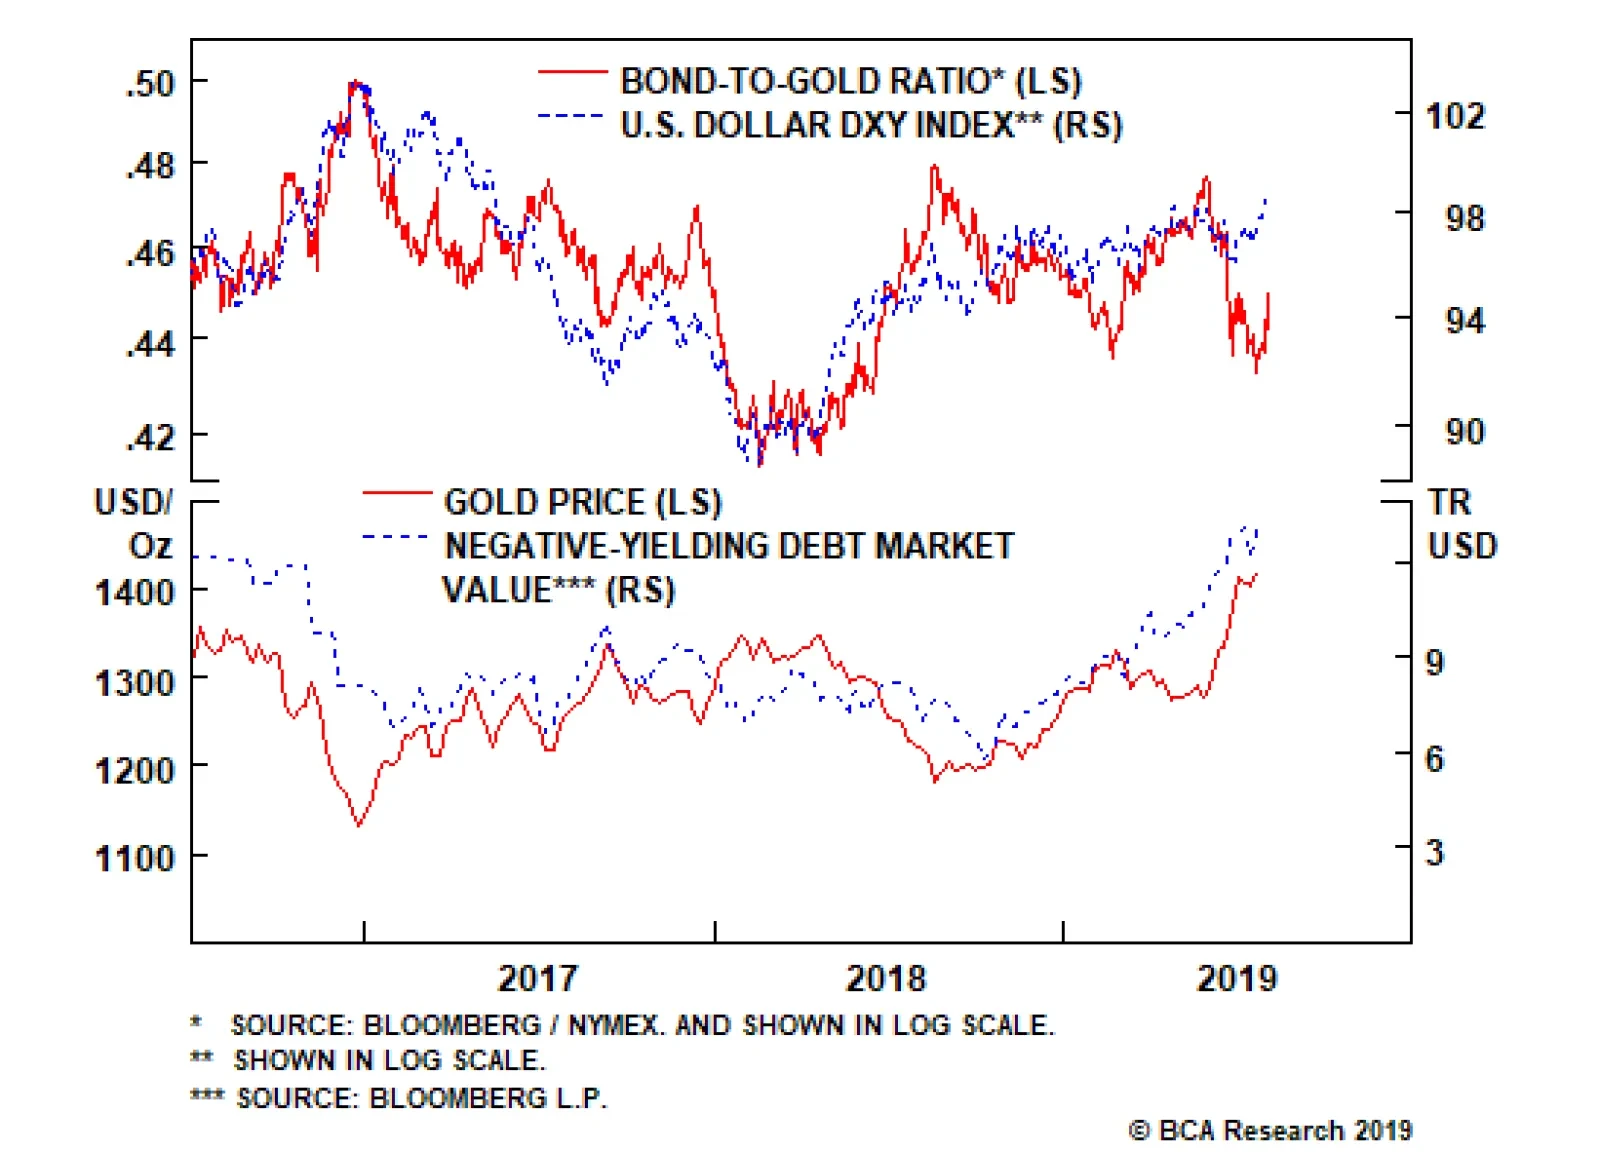
The Fed may have delivered a hawkish surprise, and Trump may appear victorious, but confidence in the dollar is fraying at the edges. This can be observed in a falling bond-to-gold ratio. Ever since the end of the Bretton Woods agreement broke the gold/dollar…
Investors are constantly evaluating how to allocate funds and will rationally deploy capital towards projects that have the highest returns. BCA's Foreign Exchange Strategy team knows that starting points matter – this is clear from both the wealth of…
The next few months will provide important information to markets and policymakers alike, as both wait to see whether the concerted monetary policy efforts aimed at reviving the real economy – manufacturing, in particular – will be effective. As an aside,…

Dear Client, Next week I am sending you a Special Report on Japan written by Amr Hanafy, Research Associate of BCA’s Global Asset Allocation service. Amr answers some key questions that clients have been asking about Japan recently: Does the Bank of Japan have any monetary policy ammunition left? How hard will October’s tax hike hit consumption? Has Japan’s corporate governance improved meaningfully? Is there a case for a rerating of Japanese equities? I trust you will find his report very informative. Best regards, Peter Berezin, Chief Global Strategist Highlights Risk assets are likely to struggle over the next few weeks as investors digest both the decision by President Trump to further raise tariffs on Chinese imports, and the realization that the Fed’s “insurance cuts” may not be as generous as they had anticipated. Beyond then, the key question is whether the global economy is, in fact, experiencing a mid-cycle slowdown or is on the brink of a recession. If it is the former, as we think is the case, risk assets will bounce back. Despite the bluster from the Trump Administration, a trade deal between the U.S. and China is still more likely than not. The failure to reach a deal would weaken the U.S. economy, hurting Trump’s reelection prospects. Reassuringly, there is scant evidence that the global manufacturing downturn has infected the service sector to any significant degree. This is true not just for the U.S., but for manufacturing-intensive economies such as Germany as well. The share of manufacturing in both GDP and employment has fallen steadily around the world. Manufacturing output has also become less volatile over time, and less correlated with service sector growth. As global manufacturing activity starts to recover later this year, earnings growth will pick up. Stay overweight global equities relative to bonds on a 12-month horizon, while preparing to increase exposure to EM and European stocks. Feature First The Fed, And Then Trump Risk assets got hit by a one-two punch this week. First, the Federal Reserve dashed investors’ hopes for an extended easing cycle. While the Fed did cut rates by 25 basis points and pledged to end its balance sheet runoff in August (two months earlier than previously indicated), Jay Powell’s characterization of the Fed’s current mantra as a “mid-cycle adjustment to policy” suggested that further cuts were far from guaranteed. To reinforce the point, Powell stated that the Fed was not at “the beginning of a lengthy cutting cycle.” “That’s not our perspective now, our outlook,” he added. Contributing to the hawkish backdrop, Esther George, the president of the Kansas City Fed, and Eric Rosengren, the once fairly dovish president of the Boston Fed, voted to keep rates unchanged. Equities initially plunged on Wednesday following Chair Powell’s press conference. Markets rallied back Thursday morning, only to tumble again in the wake of President Trump’s decision to further raise tariffs on Chinese imports. There is no shortage of theories purporting to explain the timing of Trump’s decision. Was he trying to send a message to the Fed that it had better keep easing? Was he annoyed that Elizabeth Warren, Bernie Sanders, and a number of other presidential contenders tried to outflank him on trade during the Democratic debate the prior evening by suggesting he was not protectionist enough? Regardless, risk assets are likely to struggle over the next few weeks as investors grapple with both renewed trade war anxiety and the realization that the Fed’s “insurance cuts” may not be as generous as they had anticipated. Beyond then, the key question is whether the global economy is, in fact, experiencing a mid-cycle slowdown or is on the brink of a recession. If it is the former, as we think is the case, risk assets will bounce back. While a severe escalation of the trade war would tip the scales towards recession, the risk of such an outcome remains low. Negotiations with China are ongoing. The threat to further raise tariffs in September is consistent with the “maximum pressure” doctrine that has governed Trump’s policy decisions. Ultimately, the failure to reach a trade deal would weaken the U.S. economy, undermining Trump’s reelection prospects. The fact that the latest tranche of tariffs, unlike previous ones, will fall mainly on consumer goods could further hurt Trump in the polls. He does not want that. The Manufacturing Cycle: How Low Will It Go? Chart 1The Global Manufacturing Cycle Has Likely Reached A Bottom
The Global Manufacturing Cycle Has Likely Reached A Bottom
The Global Manufacturing Cycle Has Likely Reached A Bottom
Trade tensions have undoubtedly exacerbated the global manufacturing downturn. However, trade policy hasn't been the only culprit, as evidenced by the fact that manufacturing activity began to decelerate even before the trade war heated up in earnest. As we explained in detail last week,1 manufacturing activity tends to follow a “natural cycle” lasting about three years, with output growth rising for the first 18 months, and falling for the next 18 months (Chart 1). The latest downleg began at the start of 2018. Thus, as long as the trade war does not spiral out of control, we should soon see a bottom in the manufacturing cycle based on this timing. For now, the evidence for such a bottom remains mixed. It is encouraging that data released this week showed an improvement in the Chinese Caixin Manufacturing PMI and a slight uptick in the new orders component of the U.S. ISM manufacturing survey. Nevertheless, both surveys remain weak in absolute terms. Meanwhile, the European PMIs have continued to deteriorate, taking the global manufacturing PMI down to 49.3 in July, the lowest level since October 2012. What one can say more definitively is that at least so far, the manufacturing downturn has not infected the service sector to any significant degree (Chart 2). The U.S. non-manufacturing ISM will be released on Monday, but the June reading of 55.1, while below year-ago levels, was still in the middle of its historic range (Chart 3). Chart 2AThe Service Sector Has Softened Much Less Than Manufacturing (I)
The Service Sector Has Softened Much Less Than Manufacturing (I)
The Service Sector Has Softened Much Less Than Manufacturing (I)
Chart 2BThe Service Sector Has Softened Much Less Than Manufacturing (II)
The Service Sector Has Softened Much Less Than Manufacturing (II)
The Service Sector Has Softened Much Less Than Manufacturing (II)
Chart 3U.S. ISM Non-Manufacturing Still Close To Its Historic Average
U.S. ISM Non-Manufacturing Still Close To Its Historic Average
U.S. ISM Non-Manufacturing Still Close To Its Historic Average
Strong demand for services has underpinned U.S. employment growth which, in turn, has supported consumption growth. Real PCE rose by 4.3% in Q2. The jump in the Conference Board’s index of consumer confidence in July suggests that U.S. consumers remain upbeat. Notably, the services PMI has increased in the euro area this year, even as the manufacturing sector has weakened there. In Germany, where the manufacturing PMI plunged to 43.2 in July, the non-manufacturing PMI still managed to clock in at 55.4, up from 51.8 in December 2018. Manufacturing: A Canary In The Coal Mine Or Just A Coal Mine? The fact that the overall German economy has not come crashing down despite its high reliance on manufacturing is reassuring. Nevertheless, many investors remain convinced that it is just a matter of time before manufacturing woes precipitate a broad-based economic downturn. Such concerns are well founded if protectionism causes the entire global trading system to come crashing down. However, provided that this does not occur, it is unlikely that slower manufacturing growth, in and of itself, will trigger a recession. Uncertainty over Fed policy and the trade war are likely to weigh on risk assets over the coming weeks. Contrary to conventional wisdom, there is little evidence that manufacturing leads the broader economy. Chart 4 clearly shows that manufacturing output tracks overall real GDP growth, with no clear lead-lag relationship. Chart 4Manufacturing Activity Moves In Sync With The Broad Economy
Manufacturing Activity Moves In Sync With The Broad Economy
Manufacturing Activity Moves In Sync With The Broad Economy
Granted, manufacturing growth is more volatile than GDP growth, but that is simply because of the nature of manufacturing production. More than half of manufacturing output consists of durable goods. Purchases of durable goods tend to be lumpy over time. When unemployment starts to rise, households typically postpone purchases of, say, refrigerators and automobiles, while businesses postpone purchases of capital goods. As inventories pile up, manufacturers respond by cutting output. The opposite happens during expansions. The Declining Role Of Manufacturing In The Economy As a share of GDP, global manufacturing output currently stands at 16%. The manufacturing share has been trending lower in most countries (Chart 5). In the U.S., where the data goes back much further, manufacturing output has declined from over 25% of GDP in the 1950s to 11% of GDP at present. The share of manufacturing jobs in total employment has dropped in tandem (Chart 6). Chart 5The Declining Role Of Manufacturing Is A Global Phenomenon
The Declining Role Of Manufacturing Is A Global Phenomenon
The Declining Role Of Manufacturing Is A Global Phenomenon
Chart 6The Relative Size Of Manufacturing In The U.S. Economy Has Been Falling
The Relative Size Of Manufacturing In The U.S. Economy Has Been Falling
The Relative Size Of Manufacturing In The U.S. Economy Has Been Falling
The volatility of manufacturing growth rates has also fallen over time. This has occurred partly because of better inventory management techniques. Chart 7 shows that the ratio of real nonfarm inventories-to-domestic sales of goods and structures has been trending lower for the past 40 years. Diminished fears of oil embargos and price controls, which were rampant during the 1970s, have also allowed inventory levels to come down. Chart 7A Structural Decline In The Inventories-To-Sales Ratio Starting In The Early 1980s
A Structural Decline In The Inventories-To-Sales Ratio Starting in The Early 1980s
A Structural Decline In The Inventories-To-Sales Ratio Starting in The Early 1980s
As manufacturing has become a smaller and less volatile part of the economy, its impact on the service sector has diminished. In fact, we estimate that all of the reduction in the variance of U.S. private sector GDP growth over the past 50 years can be attributed to a smaller contribution from the goods-producing sector, as well as a decline in the correlation between goods-producing and service-producing industries (Chart 8).
Chart 8
Investment Conclusions Uncertainty over Fed policy and the trade war are likely to weigh on risk assets over the coming weeks. As long as the trade war does not boil over, global manufacturing activity should recover during the remainder of this year, boosting corporate earnings in the process. More cyclically-oriented stock markets and sectors will benefit the most. Non-U.S. stocks have the advantage of trading at a substantial discount to their U.S. peers. Chart 9 shows that U.S. stocks trade at 17.5-times forward earnings, while non-U.S. stocks trade at only 13.5-times forward earnings. We expect to upgrade European and EM equities over the coming months. Chart 9AEquities: Better Valuations Outside The U.S. (I)
Equities: Better Valuations Outside The U.S. (I)
Equities: Better Valuations Outside The U.S. (I)
Chart 9BEquities: Better Valuations Outside The U.S. (II)
Equities: Better Valuations Outside The U.S. (II)
Equities: Better Valuations Outside The U.S. (II)
Better global growth prospects should cause the dollar to weaken. Stronger growth should also allow government bond yields to rise and yield curves to steepen. Investors should favor stocks over bonds for the next 12 months. Housekeeping: We were stopped out of our long EUR/JPY trade for a loss of 5%. We will consider reopening this trade once market volatility settles down. Peter Berezin, Chief Global Strategist Global Investment Strategy peterb@bcaresearch.com Footnotes 1 Please see Global Investment Strategy Weekly Report, “Three Cycles,” dated July 26, 2019. Strategy & Market Trends MacroQuant Model And Current Subjective Scores
Chart 10
Tactical Trades Strategic Recommendations Closed Trades
Feature The global manufacturing cycle looks dire at the moment. Around the world, manufacturing PMIs have fallen, profit growth has slowed, and capex has been reined back (Chart 1). This is clearly a risky moment for the economic expansion (and the equity bull market) which began in 2009. We hear that many clients are having vigorous debates on their investment committees about what to do – and indeed, at BCA, the views of our strategists are unusually divided.1 Recommendations
Monthly Portfolio Update: Manufacturing Recession, Consumer Resilience, Dovish Central Banks
Monthly Portfolio Update: Manufacturing Recession, Consumer Resilience, Dovish Central Banks
Chart 1Heading Downhill Fast
Heading Downhill Fast
Heading Downhill Fast
Global Asset Allocation veers towards the optimistic camp. In brief, we expect the services and consumer sectors of major economies to remain robust, and that manufacturing will bottom out in the coming months, partly as a result of easier financial conditions, including the dovish turn by central banks and monetary stimulus in China. But we recognize the risks currently and have constructed our portfolio accordingly. We remain overweight equities versus bonds, but leaven that with an overweight on the most defensive equity market, the U.S. The global economy is a wonderful self-organizing system. The disparity between manufacturing and services is stark everywhere. Both the soft data, such as PMIs (Chart 2), and hard data, such as industrial production and retail sales (Chart 3), show that manufacturing almost everywhere is in recession (the U.S. is not yet, but is perhaps headed that way), but that services growth remains robust. Services have been held up by decent wage growth (even in the manufacturing-heavy eurozone) and generally easier fiscal policy (in the eurozone and China, in particular), which have allowed consumers to continue spending. (In the U.S., the risk of tighter fiscal policy next year has been alleviated by last month’s budget agreement which will produce a small positive fiscal thrust in 2020 – see Chart 4.) Chart 2Service Sector Surveys Look Healthier...
Service Sector Surveys Look Healthier...
Service Sector Surveys Look Healthier...
Chart 3...Supported By The Hard Data
...Supported By The Hard Data
...Supported By The Hard Data
Chart 4
Chart 5China Is The Root Cause
China Is The Root Cause
China Is The Root Cause
The manufacturing recession was clearly triggered by China – it is notable, for instance, that large exporting countries have seen no slowdown in sales to the U.S. but a big drop in those to China (Chart 5). In 2017-18, China slowed as a result of its tighter monetary policy and clamp-down on shadow banking. The countries that have been most affected by the slowdown over the past 18 months are, unsurprisingly then, those which have the largest manufacturing sectors, notably Korea, Germany and Japan (Chart 6).
Chart 6
But the global economy is a wonderful self-organizing system. Historically, intra-expansion industrial cycles have typically lasted around 18 months from peak to trough, and 18 months from trough to peak (Chart 7). Lower commodity prices, easier financial conditions, and pent-up demand mean that, after a period of slowdown, demand and risk appetite build up. This self-equilibrating cycle breaks only if there is a major structural imbalance, usually excess debt or rising inflation. As we have argued previously, we do not see clear signs currently that either of these usual structural triggers of recession is present (Chart 8). Chart 7Close To The End Of The Down Wave?
Close To The End Of The Down Wave?
Close To The End Of The Down Wave?
Chart 8No Structural Triggers For Recession
No Structural Triggers For Recession
No Structural Triggers For Recession
Chart 9Financial Conditions Have Eased
Financial Conditions Have Eased
Financial Conditions Have Eased
The Fed cut rates on July 31 as a risk management measure, “a mid-cycle adjustment to policy,” as Chair Powell put it in his post-FOMC press conference. With the stock market close to a record high and unemployment at a 50-year low, there is no obvious need for the Fed to implement a full-out easing campaign. But with inflation well below its 2% target, and a risk that the manufacturing slowdown could spill over into consumption (perhaps if companies start to lay off workers – something there is little sign of yet), an “insurance” cut seemed prudent. Financial conditions have eased significantly in the U.S. this year, and somewhat in Europe (Chart 9), and this should soon start to positively affect growth. China’s stimulus remains key. So far it has been half-hearted (Chart 10). This is because Chinese growth has to a degree stabilized, trade negotiations with the U.S. continue, and because the authorities have not abandoned their wish to delever the economy – it is notable that shadow-bank credit creation has not rebounded (Chart 11). Both fiscal and monetary stimulus will need to be ramped up in the second half if we are to see a repeat of 2016’s China-driven risk rally. Investors should see this as a put option – if Chinese growth slows again, and the trade talks break down (both of which are likely), the authorities will roll out a stimulus on the scale of their previous efforts. Chart 10China's Stimulus Is Only Half-Hearted
China's Stimulus Is Only Half-Hearted
China's Stimulus Is Only Half-Hearted
Chart 11Still Clamping Down On Shadow Banks
Still Clamping Down On Shadow Banks
Still Clamping Down On Shadow Banks
Chart 12Have Stocks Already Discounted A Rebound?
Have Stocks Already Discounted A Rebound?
Have Stocks Already Discounted A Rebound?
What is the biggest risk to our sanguine view? With global stocks up 16% and U.S. stocks 20% year-to-date, the bottoming-out of the manufacturing cycle and greater monetary easing may already be priced in. Chart 12 shows that year-on-year stock market moves typically follow the manufacturing PMIs closely. Even if stock prices remain only at their current level to year-end, they are already discounting a sharp bounce in the PMIs. Fixed Income: If we are right about the macro environment, U.S. Treasury bond yields should rise from their current 2%. Yields usually move in line with consensus GDP forecasts (Chart 13). Economists have cut their 2020 forecast to only 1.8% (from 2.5% for this year). If the 2020 number is revised up, as we expect, Treasury yields have some room to move back up. Moreover, the Fed is unlikely to cut rates twice more by year-end as the futures market implies. Therefore, we stay underweight duration. We have a neutral stance on credit, but this asset class should produce reasonable excess returns over coming quarters given current spreads (Chart 14). U.S. high yield (especially B and below) and eurozone investment grade bonds (which the ECB may start buying again) look attractive. Chart 13Yields Will Rise With GDP Forecasts
Yields Will Rise With GDP Forecasts
Yields Will Rise With GDP Forecasts
Chart 14Some Credit Spreads Look Attractive
Some Credit Spreads Look Attractive
Some Credit Spreads Look Attractive
Equities: Given the uncertainties over the timing and strength of Chinese stimulus, we remain cautious on Emerging Markets and euro area stocks, the most obvious beneficiaries of this. Both regions have structural headwinds (excess foreign-currency debt in the case of EM, the fragile banking system and flattening yield curve for Europe) which mean that, even when Chinese stimulus comes, their outperformance may prove short-lived. For now, we prefer U.S. equities, although we recognize that upside for this year is limited. The key will be whether earnings can surprise analysts’ (over cautious) forecast of only 3% EPS growth in 2019. This seems likely since the Q2 earnings season, with almost half of companies having reported, is coming in at close to 80% beats on the bottom line. To hedge against the upside risk of Chinese stimulus, we continue to recommend building a position in Australian equities and in the Industrials sector. China’s stimulus remains key, but so far it has been half-hearted. Currencies: The U.S. dollar is a counter-cyclical currency and should start to depreciate once signs of a manufacturing recovery become apparent. Moreover, the Fed’s dovish move – and the fact that it has significantly more room to ease than other large DM central banks – should also prove to be dollar bearish eventually (Chart 15). One key cross to watch for signs that the global cycle is bottoming is AUD/JPY, since the Australian dollar is a very cyclical, and the Japanese yen a very defensive, currency (Chart 16). Chart 15Dovish Fed Is Dollar Bearish
Dovish Fed Is Dollar Bearish
Dovish Fed Is Dollar Bearish
Chart 16Watch AUD/JPY For Signs Of A Bottom
Watch AUD/JPY For Signs Of A Bottom
Watch AUD/JPY For Signs Of A Bottom
Chart 17Oil Has Further To Rise
Oil Has Further To Rise
Oil Has Further To Rise
Chart 18
Commodities: We continue to have a bullish outlook for oil. Although developed-world demand growth has slowed slightly this year, OPEC supply constraints mean that inventories should draw down further (Chart 17). We expect Brent crude to average $74 a barrel in 2H2019 (from $65 today). Gold has performed well this year, up 11%. Our colleagues in BCA’s Foreign Exchange Strategy and Commodity & Energy Strategy services conclude that this has largely been because of monetary and financial factors, mostly lower real rates (Chart 18).2 In the coming months, while rates may rise, gold should be helped by a weaker USD. We are neutral on the metal and see it more as an insurance asset. Our FX and Commodity strategists concur with GAA’s long-standing view that gold is a useful portfolio diversification tool to protect against financial, geopolitical, and inflation risks. Garry Evans Chief Global Asset Allocation Strategist garry@bcaresearch.com Footnotes 1 Please see BCA’s Special Report, “What Goes On Between Those Walls? BCA’s Diverging Views In The Open,” dated 19 July 2019, available at www.bcaresearch.com. 2 Please see Commodity & Energy Strategy Special Report, “All That Glitters…And Then Some,” dated 25 July 2019, available at ces.bcaresearch.com. GAA Asset Allocation
Much like the rest of the global economy, oil markets await the lift in demand that fiscal and monetary stimulus have delivered in the past. As the debate among BCA Research’s strategists demonstrated, this is not a given. Uncertainty over the effectiveness of these policy responses will remain elevated as 2H19 evolves.1 For our part, we expect global stimulus – led by easing financial conditions in the U.S. and China – will reboot demand. On the supply side, we expect OPEC 2.0 production discipline and capital-constrained U.S. shale-oil production to keep output growth just below demand growth for the next year (Chart of the Week, top panel).2 Markets arguably have not been on the same page as us for the past two months or so, and appear to be pricing in supply-demand assumptions similar to those contained in the U.S. EIA’s latest Short-term Energy Outlook (STEO).3 These generate lower forecasts – $61/bbl and $57/bbl – than the $75/bbl and $70/bbl we expect for Brent and WTI next year, when we run them through our fundamental econometric model (Chart 2). Chart of the WeekOil Supply - Demand Balance Will Continue To Tighten
Oil Supply - Demand Balance Will Continue To Tighten
Oil Supply - Demand Balance Will Continue To Tighten
We argue below the EIA’s assumptions are consistent with current price levels, but inconsistent with current Brent and WTI forward curves. We remain long September – December 2019 Brent vs. short September – December 2020 Brent, which is up 76% since inception February 28, 2019, and long 1Q20 vs. 1Q21 Brent, which is up 39% since inception July 18, 2019, in anticipation of steeper backwardations. We also expect the combination of global fiscal and monetary stimulus, along with the aforementioned production constraints, will lift price levels in line with our forecasts. Highlights Energy: Overweight. In line with our expectation, U.S. crude oil inventories drew 8.5mm barrels last week, posting a record seventh consecutive draw. Last week’s inventory drawdown follows a massive draw in crude oil of close to 11mm barrels the previous week. Base Metals: Neutral. Spot treatment and refining charges (TC/RC) for copper fell to $51.20/MT last week, the lowest reading since the launch of Fastmarkets MB’s Asia-Pacific index in 2013. This is consistent with tighter spot supplies – low TC/RC levels mean demand for spot refining services is weak due to low concentrate supply. Our long Dec19 $3.00/lb calls vs. short Dec19 $3.30/lb call on the COMEX was stopped out after hitting our -15% stop-loss limit. We remain bullish and will re-visit this recommendation in the near future. Precious Metals: Neutral. Gold prices remain well supported by global monetary accommodation, as seen this week following the Fed’s decision to lower its policy rate by 25bps to 2.25%. We expect another “insurance cut” later this year, and remain long gold, which is up 12% this year as central banks scramble to redress tightening financial conditions globally. Ags/Softs: Underweight. 54% of the U.S. soybean crop was rated in good or excellent condition in states accounting for 95% of bean acreage. Last year at this time, 70% of the crop was rated good or excellent, according to the USDA’s Crop Progress Report. Feature The oil market presently is pricing to a weaker set of fundamentals, which are very close to those assumed by the U.S. EIA in its monthly STEO forecast. Easing financial conditions in the U.S. and China, along with higher fiscal outlays globally, are necessary and likely sufficient to reboot global oil demand, in our assessment of fundamentals.4 On the supply side, our modeling assumes OPEC 2.0’s production discipline and capital-constrained U.S. shale-oil production will be sufficient to keep output growth just below demand growth for the next year.5 Chart 2Oil Markets Pricing Weaker Fundamentals Than BCA Expects
Oil Markets Pricing Weaker Fundamentals Than BCA Expects
Oil Markets Pricing Weaker Fundamentals Than BCA Expects
In our modeling, these supply-demand effects combine to lift prices, and to further backwardate the Brent and WTI forward curves as global storage levels fall, as the top panel of Chart 2 shows. However, as the bottom panel of Chart 2 illustrates, the oil market presently is pricing to a weaker set of fundamentals, which are very close to those assumed by the U.S. EIA in its monthly STEO forecast. The EIA assumes demand growth of 1.1mm b/d this year, versus our assumption of 1.25mm b/d, and 1.4mm b/d next year, versus our 1.5mm b/d assumption. When we push the EIA’s assumptions through our fundamental supply-demand-inventory model, we get average Brent prices of $64/bbl this year and $61/bbl in 2020, versus our expectations of $70/bbl this year and $75/bbl next year for Brent.6 For WTI, the EIA’s fundamentals produce prices of $57/bbl in 2019 and $57/bbl in 2020, versus our expectation of $63/bbl and $70/bbl. Whither Storage? The EIA’s supply-demand fundamentals produce price levels closer to where the market is trading currently, when we run them through our fundamental model. However, they are not consistent with forward-curve dynamics, which presently are backwardated. Using the EIA’s supply and demand assumptions for this year and next in our econometric model produces an increase in oil inventories, which grows next year, as opposed to our expectation inventories will shrink over the course of the next year (Chart 3, bottom panel). If the EIA’s expectation for inventories was shared by market participants, Brent and WTI forward curves would be in contango, not backwardation as they are presently. In this respect, our estimates are more consistent with current forward-curve dynamics (Chart 3, top panel). Chart 3Inventories Swell Assuming EIA's Supply-Demand Fundamentals
Inventories Swell Assuming EIA's Supply-Demand Fundamentals
Inventories Swell Assuming EIA's Supply-Demand Fundamentals
Chart 4Crude Inventories' Days-Forward-Cover
Crude Inventories' Days-Forward-Cover
Crude Inventories' Days-Forward-Cover
This also can be seen in an analysis of days-forward-cover (DFC) dynamics, in which we compare deviations from the five-year average (trend) number of days’ worth of demand that can be covered by current inventory levels (Chart 4). Our assumptions produce deviations that align with the differentials between prompt and deferred futures contracts, which measures the backwardation and contango in Brent and WTI markets. The implied DFC ratio that falls out of running the EIA’s supply-demand assumptions in our fundamental model shows inventories in 2020 level out, even as market participants continue to price in a backwardated forward curve for Brent and WTI.7 If we are correct in our assessment of inventories, Brent volatility will increase next year as inventories and DFC fall (Chart 5).
Chart 5
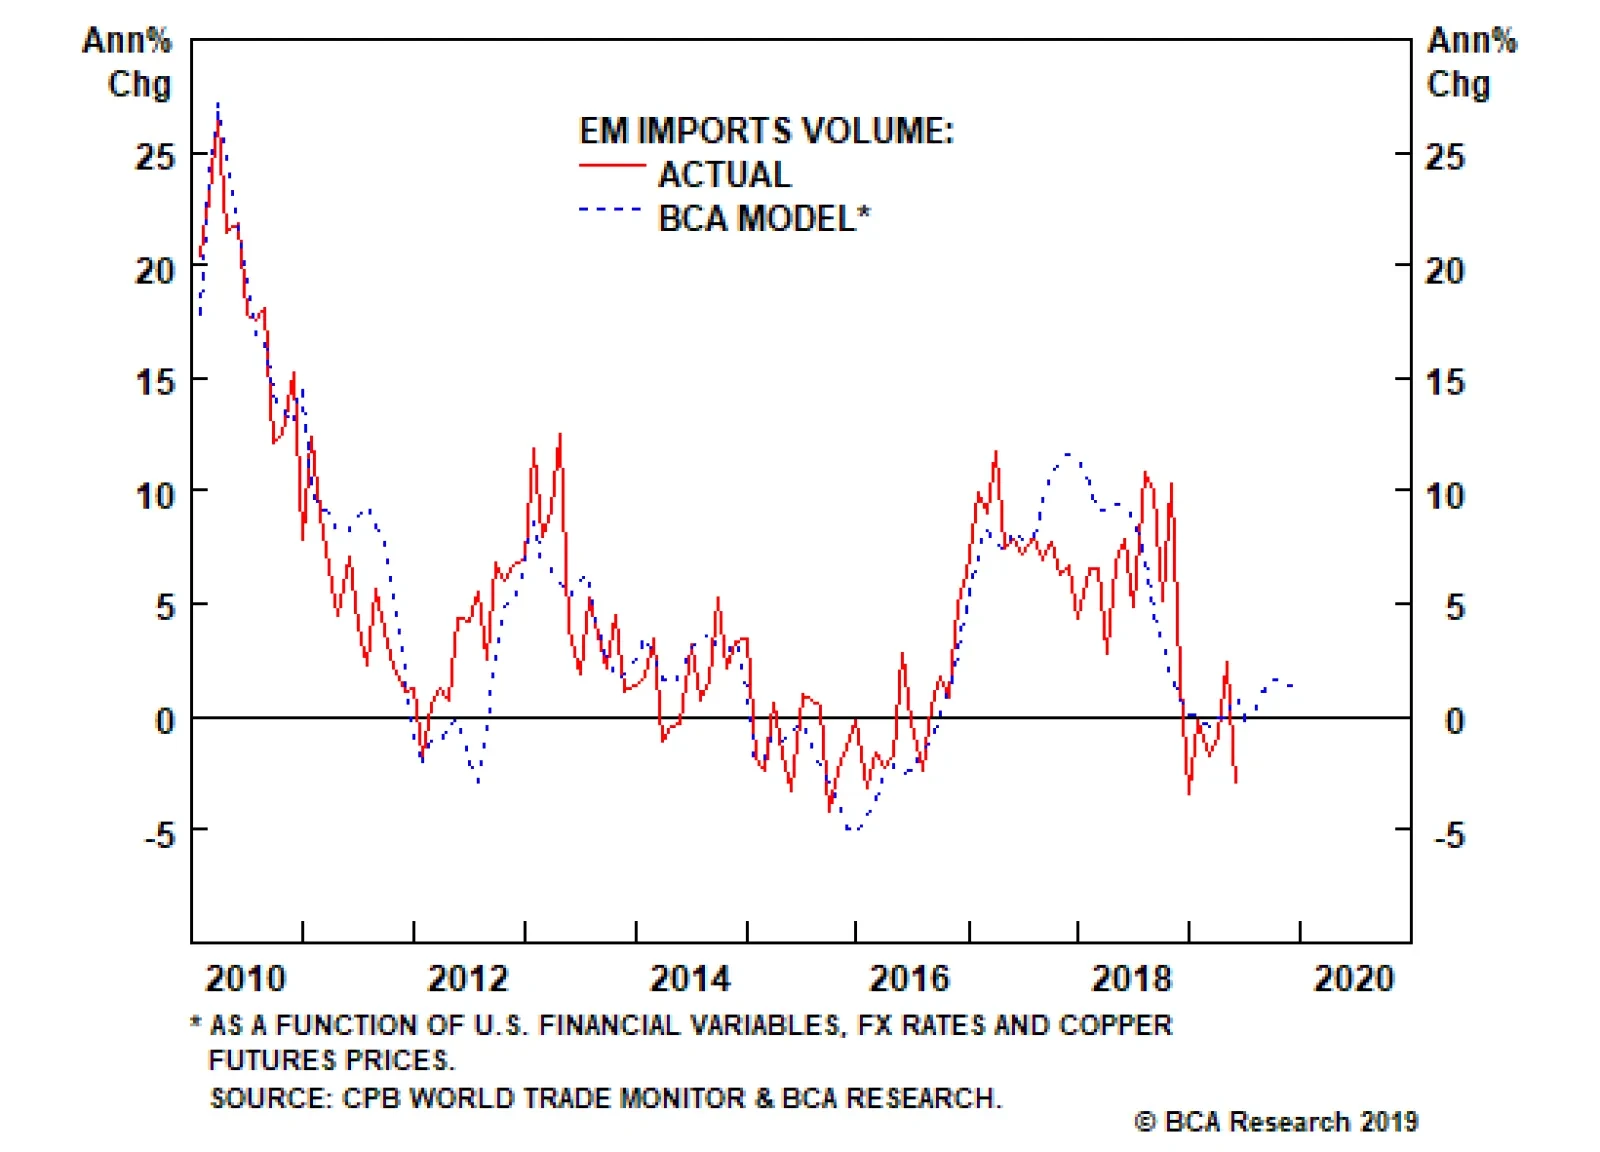
Whither Global Trade, Manufacturing? As we’ve noted above, the next few months will provide important information to markets and policymakers alike, as both wait to see whether the concerted monetary policy efforts aimed at reviving the real economy – manufacturing, in particular – will be effective. As an aside, uncertainty regarding the effectiveness of what, in the not-too-distant past, was considered standard macroeconomic stimulus is not restricted to market participants and practitioners. Central banks, and the economics profession itself are in the midst of a fundamental rethink of its foundational assumptions and models, and will be dialed in on this entire process.8 We continue to expect demand to revive on the back of global monetary and fiscal stimulus, and for supplies to be constrained this year and next. The global manufacturing slowdown in 1H19 is confirmed in EM trade data (Chart 6). This has the potential to continue if the Sino-U.S. trade war retards capex and durable-goods spending. The IMF notes the linkage between manufacturing and global trade exists because trade includes a lot of durables, which are energy-intensive in their production and transportation.9 Again, the big unknown here is whether the fiscal and monetary stimulus in systematically important economies will be sufficient to revive manufacturing globally and commodity demand, particularly for energy. There is enough cognitive dissonance around the effectiveness of monetary policy – and the channels through which it operates – to give even a hardened monetarist pause. If, as we expect, U.S. monetary stimulus succeeds in weakening the USD, global trade and EM GDP levels can be expected to increase.10 This will be supportive of commodity demand generally, oil demand in particular. In a simulation of oil prices as a function of the broad trade-weighted USD, we found Brent prices could rally sharply on a 10% depreciation between now and end-2020 (Chart 7). Chart 6Fiscal and Monetary Stimulus Will Lift Global Trade and Manufacturing
Fiscal and Monetary Stimulus Will Lift Global Trade and Manufacturing
Fiscal and Monetary Stimulus Will Lift Global Trade and Manufacturing
Chart 7Fed Policy Should Weaken USD, Boost Oil Demand
Fed Policy Should Weaken USD, Boost Oil Demand
Fed Policy Should Weaken USD, Boost Oil Demand
Such a rally is unlikely to occur due to USD weakness alone, given the mitigating factors observed in recent excursions above $80 Brent. OPEC 2.0 likely would raise production as prices moved through $80/bbl, and we expect demand destruction in EM economies would quickly follow, due to the removal of fuel subsidies in many EM economies. These supply-demand responses would push prices lower after a few months. However, this exercise is worthwhile in forming an expectation around successful Fed stimulus, given the long-term equilibrium between the broad USD TWIB and oil prices since 2000. This analysis also suggests there is a role for OPEC 2.0 in increasing production, if systematically important central banks succeed in reviving global demand, and the Fed can lower the USD TWIB. Keeping production too low at that point would be self-defeating for the coalition. Successfully managing this balance would support EM GDP growth and, in so doing, lift commodity demand. Bottom Line: Oil prices are trading to lower expected levels of demand and higher supply than we currently are using in our forecasts. However, we continue to expect demand to revive on the back of global monetary and fiscal stimulus, and for supplies to be constrained this year and next. As such, we are maintaining our expectation Brent crude will average $70 and $75/bbl this year and next, with WTI trading $7 and $5/bbl lower, respectively. We also expect these forces to steepen the backwardation in Brent and WTI forward curves this year and next. Big policy issues – the Sino-U.S. trade war, U.S.- Iran tensions in the Persian Gulf, uncertainty around how the crisis in Venezuela is resolved – still dog markets, as do persistent doubts re the effectiveness of monetary policy. Robert P. Ryan, Chief Commodity & Energy Strategist rryan@bcaresearch.com Hugo Bélanger, Senior Analyst Commodity & Energy Strategy HugoB@bcaresearch.com Footnotes 1 Please see What Goes On Between Those Walls? BCA’s Diverging Views In The Open, a Special Report published by BCA Research July 19, 2019. It is available at bca.bcaresearch.com. 2 OPEC 2.0 is the producer coalition led by the Kingdom of Saudi Arabia (KSA) and Russia, which was founded in 2016 to reduce global oil inventory levels bloated by a market-share war launched by the original OPEC cartel in 2014. Backwardation is a term of art in commodity markets, which describes a forward curve in which prompt prices exceed deferred prices. The opposite of backwardation is contango. 3 The U.S. Energy Information Administration’s Short-term Energy Outlook is published monthly. 4 Please see Weak 1H19 Oil Demand Data Fuels Market Uncertainty, published July 18, 2019, for our latest forecast. 5 NB: Our forecast for U.S. shale-oil production includes the drawdown of excess drilled-but-uncompleted (DUC) wells, especially in the Permian as pipeline constraints are removed this year. Recent reports have suggested DUC excess inventory is over-estimated in EIA data we use in our models, and that more wells than actually are reported by the EIA are required to produce the volumes reported for the Permian Basin. Please see Analytics Firm: Permian Fracturing Work Underreported by 21% in 2018 published by the Journal of Petroleum Engineering July 24, 2019. 6 The EIA’s forecast calls for Brent to average $67/bbl in 2H19 and for all of 2020, and for WTI to trade $5/bbl and $4/bbl under Brent in 2H19 and 2020, respectively. For 2H19, we expect Brent to trade at $74/bbl; we expect WTI to trade $7/bbl below Brent in 2H19 and $5/bbl lower in 2020. 7 We assume OPEC 2.0 will need to increase production in 2H20, to keep inventories from falling so low that Brent prices risk breaching $80 - $85/bbl, which we view as the no-go zone the producer coalition is most sensitive to. 8 Please see Rebuilding macroeconomic theory Volume 34, Issue 1-2 of the Spring-Summer 2018 issue of the Oxford Economic Policy Review for an excellent treatment of this effort. The Fed also is examining how it conducts monetary policy, in an effort led by Vice Chair Richard Clarida. The initial research goals were laid out in November 2018, when the Fed announced it would be conducting a comprehensive review of its monetary policy strategy, tools, and communication practices. In June of this year, the Fed followed through with a two-day symposium to discuss many of the topics we routinely address in our publications. Prof. Maurice Obstfeld of Berkeley’s Global Dimensions of U.S. Monetary Policy was an insightful paper re how U.S. monetary policy affects global growth; Prof. Kristin Forbes of MIT’s discussion also was excellent, and highlighted the role of commodity markets in this framework. 9 Please see Still Sluggish Global Growth in the IMF’s World Economic Outlook Update, published July 23, 2019. The Fund lowered its global growth forecast slightly, and cautioned, "GDP releases so far this year, together with generally softening inflation, point to weaker-than-anticipated global activity. Investment and demand for consumer durables have been subdued across advanced and emerging market economies as firms and households continue to hold back on long-term spending. Accordingly, global trade, which is intensive in machinery and consumer durables, remains sluggish. The projected growth pickup in 2020 is precarious, presuming stabilization in currently stressed emerging market and developing economies and progress toward resolving trade policy differences." 10 These variables are intimately connected. Please see Third Quarter 2019 Strategy Outlook: The Long Hurrah published by BCA Research’s Global Investment Strategy June 28, 2019, for our House view on global growth, interest rates and the expected evolution of the USD. It is available at gis.bcaresearch.com. Investment Views and Themes Recommendations Strategic Recommendations Tactical Trades TRADE RECOMMENDATION PERFORMANCE IN 2019 Q2
Image
Commodity Prices and Plays Reference Table Trades Closed in 2019 Summary of Closed Trades
Image
Escalating Sino-U.S. trade tensions. The effect on gold prices from an escalation in Sino-U.S. trade tensions are difficult to model. On the one hand, such an escalation would positively impact gold prices, because it increases the probability of more rate…
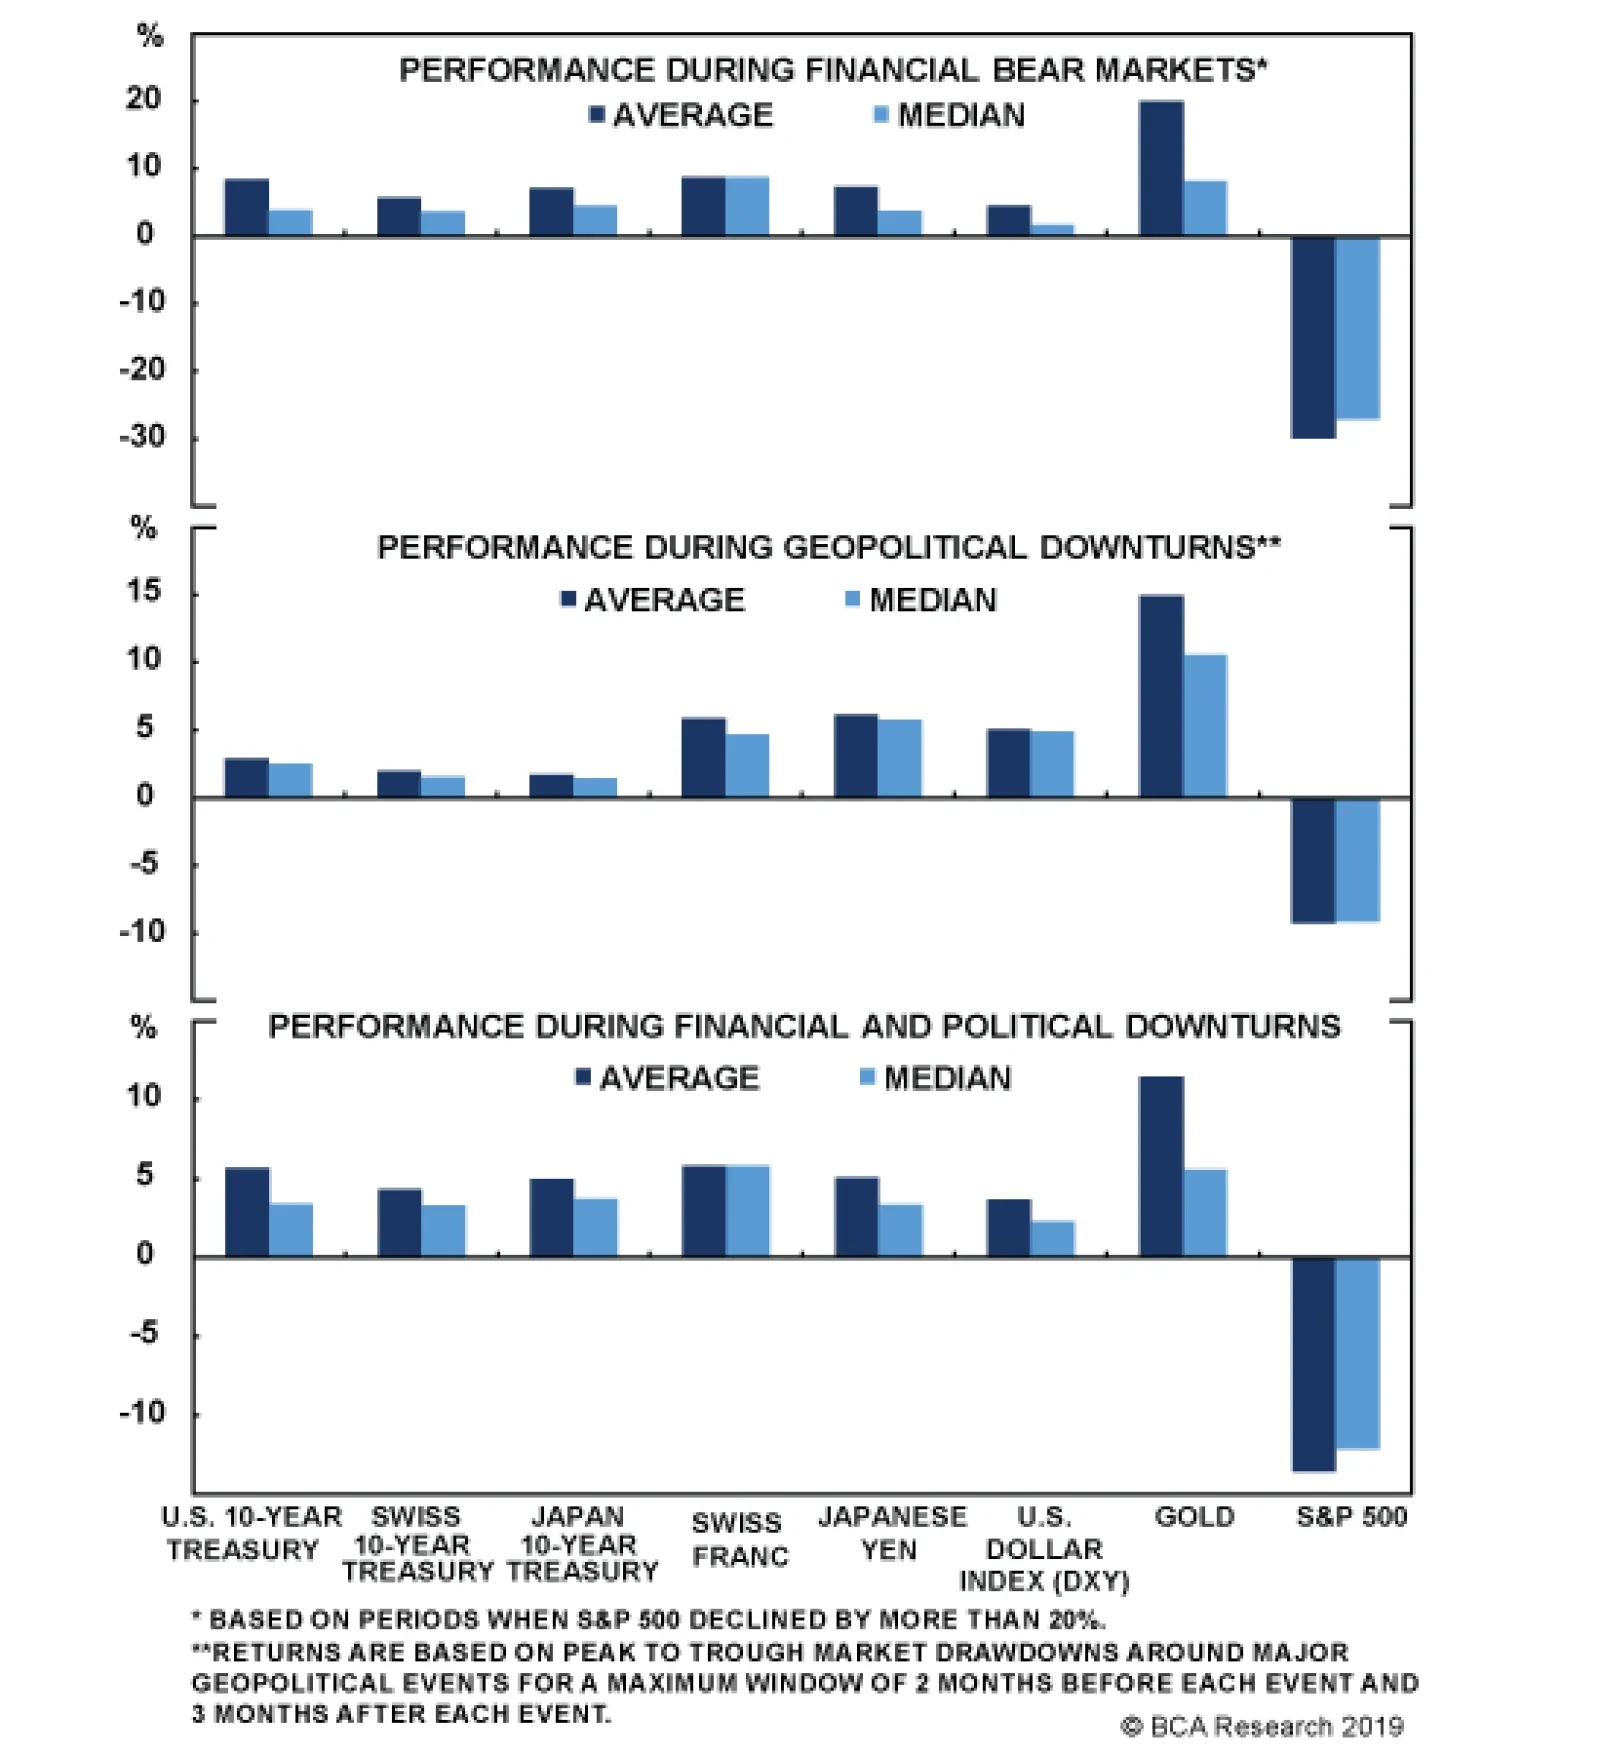
BCA's Foreign Exchange Strategy and Commodity & Energy Strategy services have collaborated to analyze how gold performs better than most alternative safe-haven assets – i.e. U.S., Japanese and Swiss bonds and currencies. Importantly, gold is unique…
Highlights Portfolio Strategy Despite the Fed’s supra natural powers, the deep rooted global growth slowdown will likely win the tug of war versus flush liquidity, especially if the trade war spat stays unresolved and the U.S. dollar remains well bid, both of which undermine U.S. corporate sector profitability. Recent Changes There are no changes to the portfolio this week. Table 1
The Fed Apotheosis
The Fed Apotheosis
Feature Equities hit all-time highs last week, eagerly anticipating this Wednesday’s Fed decision to commence an easing interest rate cycle and save the day. The looming global liquidity injection is the sole reason that stocks are holding near their all-time highs. While markets are treating the Fed as a deity, empirical evidence suggests that risks are actually lurking beneath the surface. Over the past two decades the correlation between stocks and the fed funds rate has been tight and positive. Given the bond market’s view of four fed cuts in the coming year, equity gains are likely running on fumes (Chart 1). Chart 1Mind The Positive Correlation
Mind The Positive Correlation
Mind The Positive Correlation
As we highlighted recently, we remain perplexed that stocks are diverging from earnings.1 Anticipating a flush global liquidity backdrop (i.e. global central banks increasing their reflationary efforts) likely explains this dynamic as the former should ultimately rekindle economic growth, which in turn should boost profit growth. However, the disinflationary fallout from the ongoing manufacturing recession and the petering out in the global credit impulse signal that the liquidity pipes remain clogged. We recently read and re-read the Bank For International Settlements (BIS) Hyun Song Shin’s “What is behind the recent slowdown” speech where he eloquently argues that the global trade deceleration predates last spring’s U.S./China trade dispute.2 Shin has a compelling argument blaming the growth deceleration on the drop in manufactured goods global value chains (GVC) and he depicts this as global trade trailing global GDP (top panel, Chart 2). Interestingly, despite the V-shaped recovery following the Great Recession, global trade never really regained its footing, failing to surpass the 2007 peak. Shin then links this slowdown in global supply chains to financial conditions and the role that banking plays in global trade financing. The middle panel of Chart 2 shows that the GVC move with the ebbs and flows of global banks. In other words, healthy banks tend to boost global trade and vice versa. Finally, given that most trade financing is conducted in U.S. dollars, the greenback’s recent appreciation also explains trade blues. Simply put, decreased availability of U.S. dollar denominated bank credit as a result of a rising greenback is another culprit (U.S. dollar shown inverted, bottom panel, Chart 2). Ergo, there is no miracle cure for the sputtering world economy, especially given the recent re-escalation in global trade tensions and the stubbornly high U.S. dollar, and the gap between buoyant share prices and poor profit performance is likely to narrow via a fall in the former. Two weeks ago we highlighted that foreign sourced profits for U.S. multinationals are under attack as BCA’s global ex-U.S. ZEW survey ticked down anew (top panel, Chart 3). Tack on the global race to ZIRP (and in some cases further into NIRP) and it is crystal clear that the profit recession has yet to run its course. Chart 2Grim Trade Backdrop...
Grim Trade Backdrop...
Grim Trade Backdrop...
Chart 3...Will Continue To Weigh On Foreign Sourced Profits
...Will Continue To Weigh On Foreign Sourced Profits
...Will Continue To Weigh On Foreign Sourced Profits
Meanwhile, China is likely exporting its deflation to the rest of the world and until its business sector regains pricing power, U.S. profits will continue to suffer (bottom panel, Chart 3). Turning over to U.S. shores and domestic corporate pricing power, the news is equally grim. Our pricing power proxy is outright contracting and warns that revenue growth is also under duress for U.S. corporates. Similarly, the ISM manufacturing prices paid subcomponent fell below the 50 boom/bust line and steeply contracting raw industrials commodities are signaling that 6%/annum top line growth for the SPX is unsustainable (Chart 4). On a cyclical 3-12 month time horizon we remain cautious on the broad equity market. Chart 4Sales Pressures...
Sales Pressures...
Sales Pressures...
Chart 5...Are Building Rapidly
...Are Building Rapidly
...Are Building Rapidly
Melting inflation expectations and the NY Fed’s softening Underlying Inflation Gauge (UIG) best encapsulate this softening revenue backdrop and warn that any further letdown in inflation risks sinking S&P 500 sales growth below the zero line (Chart 5). Netting it all out, despite the Fed’s supra natural powers, the deep rooted global growth slowdown will likely win the tug of war versus flush liquidity, especially if the trade war spat stays unresolved and the U.S. dollar remains well bid, both of which undermine U.S. corporate sector profitability. On a cyclical 3-12 month time horizon we remain cautious on the broad equity market. This is U.S. Equity Strategy’s view, which stands in contrast to the more sanguine equity BCA House View. What follows is a recap of recent (mostly) defensive moves in the health care, consumer staples, materials, tech, consumer discretionary and communication services sectors. Anastasios Avgeriou, U.S. Equity Strategist anastasios@bcaresearch.com S&P Health Care (Overweight) Upgraded from Neutral S&P Health Care Equipment (Overweight) Upgraded from Neutral Fear-based sell-off created a buying opportunity in the U.S. health care equipment index as fundamentals remain upbeat. Rising U.S. medical equipment exports are a tailwind for this health care subgroup as 60% of its revenues are generated outside the United States (second panel). The EM demographic shift (not shown) represents yet another boost to the sector as U.S. companies are the technology leaders and often the only source for equipping hospitals/clinics around the globe. Our move to upgrade the S&P health care equipment index also pushed the entire health care sector from neutral to overweight (bottom panel). S&P Health Care
S&P Health Care
S&P Health Care
S&P Managed Health Care (Overweight) Upgraded from Neutral The Bernie Sanders “Medicare For All” bill reintroduction created a buying opportunity in the S&P managed health care index and we were swift to act on it in mid-April. Contained industry cost factors including wages staying at the 2% mark help preserve industry margins (bottom panel). Melting medical cost inflation signals that HMO profit margins will likely expand (third panel). Overall healthy labor market conditions with unemployment insurance claims probing 60-year lows should underpin managed health care enrollment (top & second panels). S&P Managed Health Care
S&P Managed Health Care
S&P Managed Health Care
S&P Hypermarkets (Overweight) Upgraded from Neutral S&P Soft Drinks (Neutral) Upgraded from Underweight A deteriorating macro landscape reflected in the steep fall in U.S. economic data surprises, the drubbing of the 10-year U.S. Treasury yield and melting inflation make a compelling case for an overweight stance in the S&P Hypermarkets index (top & second panels). Similarly, safe haven soft drinks stocks shine when economic conditions are deteriorating (third panel). This defensive pure-play consumer goods sub-sector is also enjoying a rebound in operating metrics, and thus it no longer pays to stay bearish. We lifted exposure to neutral last week, locking in gains of 5.5% since inception. S&P Hypermarkets
S&P Hypermarkets
S&P Hypermarkets
S&P Materials (Neutral) Downgraded from Overweight S&P Chemicals (Underweight) Downgraded from Neutral Global macro headwinds continue to weigh on this deep cyclical sub-index as the risks of a full-blown trade war will likely take a bite out of final demand (third panel). Chemical producers garner 60% of their revenues from abroad and falling U.S. chemical exports are troublesome for this index (top & second panels). Given that chemicals have a 74% market cap weight in the S&P materials index, our move to underweight on the sub-index level also pushed the entire S&P materials index to neutral from overweight. S&P Materials
S&P Materials
S&P Materials
S&P Technology (Neutral) Downgrade Alert S&P Software (Overweight) Lifted trailing stops As a part of our portfolio de-risking measures, we put a 27% profit-taking stop loss on our overweight S&P software index call on June 10. Once triggered, a downgrade to neutral in the S&P software index would also push our S&P tech sector weight to a below benchmark allocation. Meanwhile, our EPS model for the overall tech sector is on the verge of contraction on the back of sinking capex and a firming U.S. dollar (middle panel). The San Francisco Fed’s Tech Pulse Index is also closing in on the expansion/contraction line warning that tech stocks are in for a rough ride (bottom panel). S&P Technology
S&P Technology
S&P Technology
S&P Technology Hardware, Storage & Peripherals (Neutral) Downgraded from Overweight As nearly 60% of the revenues for the S&P technology hardware, storage & peripherals (THS&P) index are sourced from abroad, deflating EM currencies sap foreign consumer purchasing power and weigh on the industry’s exports (third panel). Global export volumes have sunk into contractionary territory, to a level last seen during the Great Recession (not shown) and underscore that industry exports will remain under pressure. The IFO World Economic Survey confirms this challenging export backdrop as it is still pointing toward sustained global export ails (second panel). As a result, all of this has shaken our confidence in an overweight stance in the S&P THS&P and we were compelled to move to the sidelines in early June for a modest relative loss since inception. S&P Technology Hardware, Storage & Peripherals
S&P Technology Hardware, Storage & Peripherals
S&P Technology Hardware, Storage & Peripherals
S&P Consumer Discretionary (Underweight) Upgrade Alert S&P Home Improvement Retail (Neutral) Upgraded from underweight In the July 8 Weekly Report, we put the S&P consumer discretionary sector on an upgrade alert as this early-cyclical sector benefits the most from lower interest rates (bottom panel). The way we will execute this upgrade will be by triggering the upgrade alert on the S&P internet retail index. Melting interest rates and rebounding lumber prices are a boon for home improvement retailers (HIR, second & third panels). Tack on profit-augmenting industry productivity gains and it no longer pays to be bearish HIR. S&P Consumer Discretionary
S&P Consumer Discretionary
S&P Consumer Discretionary
S&P Homebuilders (Neutral) Downgraded from overweight Long S&P Homebuilders / Short S&P Home Improvement Retail Booked Profits Lumber represents an input cost to homebuilders (we booked profits of 10% in our overweight recommendation on May 22 and downgraded to neutral) whereas it is an important selling item in Big Box building & supply retailers that make a set margin on it (third panel). On June 18, as part of our de-risking strategy, we locked in 10% gains in the long S&P homebuilders/short S&P home improvement retail trade that hit our stop loss and we moved to the sidelines. S&P Homebuilders
S&P Homebuilders
S&P Homebuilders
S&P Telecommunication Services (Neutral) Upgraded from Underweight The recent escalation of the trade spat has pushed July’s Markit’s flash U.S. manufacturing PMI reading to 50 - the lowest level since the history of the data. Historically, relative S&P telecom services share price momentum has moved inversely with the manufacturing PMI and the current message is to expect a sustained rebound in the former (bottom panel). Rock bottom profit expectations and firming industry operating metrics signal that most of the grim news is priced in bombed out telecom services valuations (middle panel), and it no longer pays to be underweight. In late-May, we lifted exposure to neutral for 6% relative gains since inception. S&P Telecommunication Services
S&P Telecommunication Services
S&P Telecommunication Services
S&P Movies & Entertainment (Overweight) Upgraded from Neutral Structural shifts in the streaming services industry marked a start of a pricing war with incumbents and new entrants fighting for market share, as evidenced by DIS’s pricing of their upcoming Disney+ service. Consumer confidence remains glued to multi-decade highs and there are high odds that the big gulf that has opened up between confidence and relative S&P movies & entertainment share prices will narrow via a rise in the latter (top panel). Moreover, more dollars spent on recreation is synonymous with a margin expansion in the S&P movies & entertainment index (bottom panel). This consumer spending backdrop is also conducive to a rise in relative profitability, the opposite of what the sell-side currently expects. S&P Movies & Entertainment
S&P Movies & Entertainment
S&P Movies & Entertainment
Arseniy Urazov, Research Associate ArseniyU@bcaresearch.com Footnotes 1 Please see BCA U.S. Equity Strategy Weekly Report, “Beware Profit Recession” dated July 8, 2019, available at uses.bcaresearch.com. 2 https://www.bis.org/speeches/sp190514.pdf Current Recommendations Current Trades Size And Style Views Favor value over growth Favor large over small caps
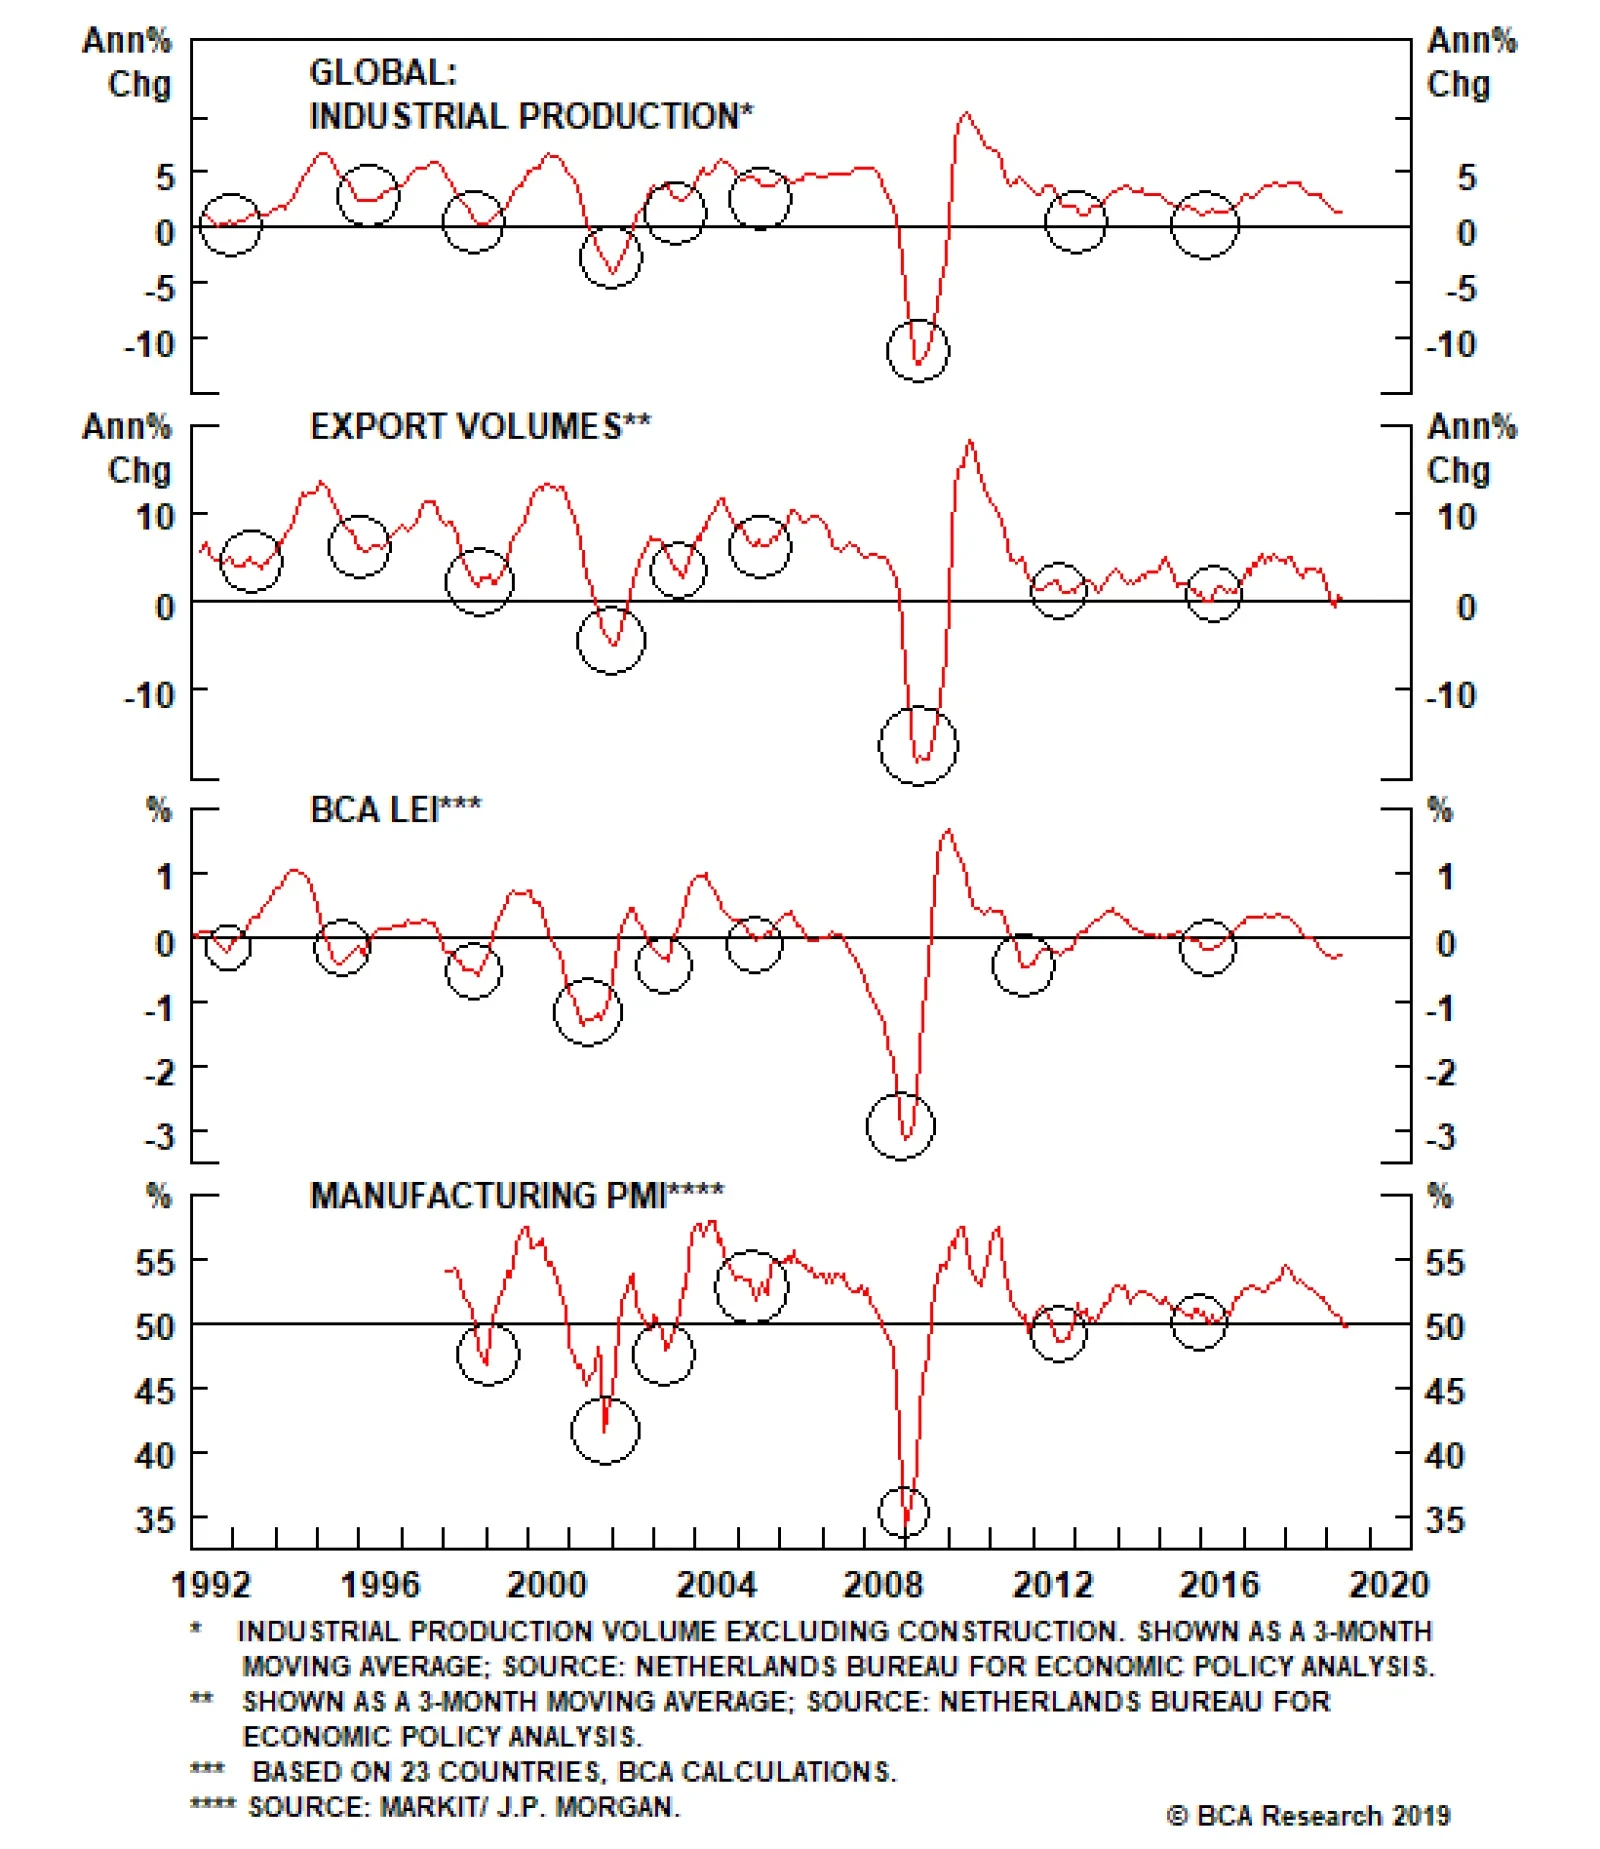
Global manufacturing activity follows a fairly predictable three-year growth cycle: up for the first 18 months, down for the second 18 months. This is not an immutable law of nature, but it is a handy rule of thumb. The last growth cycle began in the late…