Global
Investors should always be cautious of “new era” explanations to justify an elevated asset price after a massive rally. The latest argument can be found in government bonds, where fundamental justifications for the growing inventory of negative yielding bonds…
The German ZEW survey for August was much weaker than forecasters anticipated. The growth expectations component for Germany fell to -44 from -24.5, and for the Eurozone, it plunged to -43.6 from -20.3. These are levels last recorded at the height of the euro…
As investment strategists, our primary focus should be the financial markets rather than the economy. On this basis, we define a major dislocation in terms of the markets: an episode in which equities underperform bonds by more than 20 percent over a period…

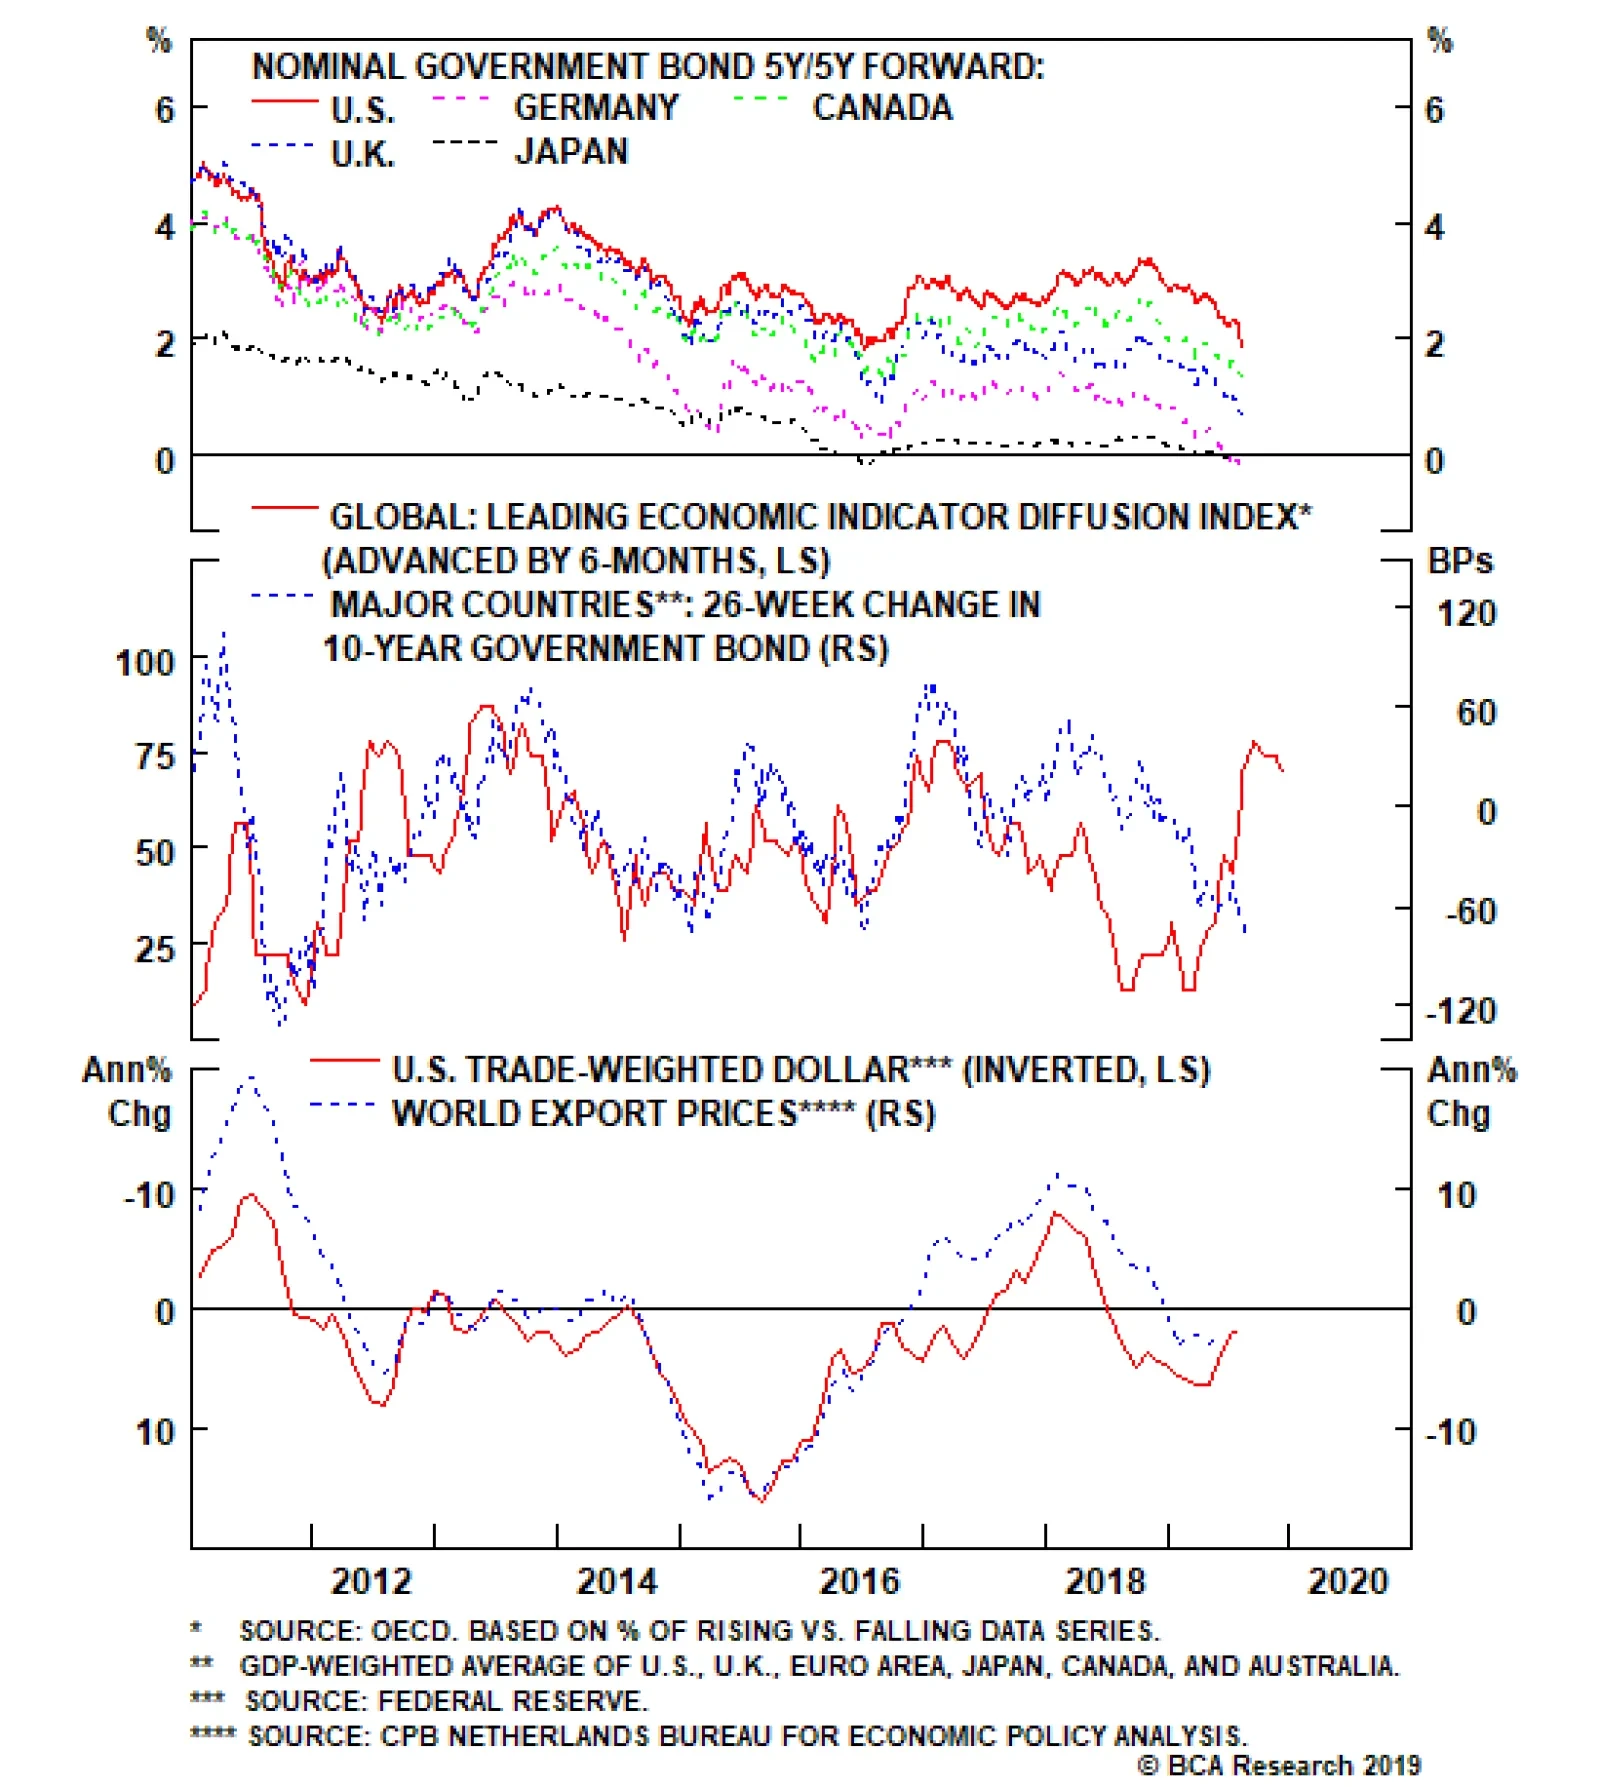
Highlights Negative Interest Rates: Time will tell if negative bond yields are indeed the “new normal”. We need to see negative yields maintained outside of a growth slowdown to prove that thesis. USTs & Bunds: U.S. Treasuries and German Bunds both look overbought, amid extreme price/yield momentum and aggressively long duration positioning. Yet given the persistent headline risk from the U.S.-China trade dispute, and without signs of improving growth in China or Europe, it is too early to position for a reversal of the stretched yield moves. Maintain a neutral overall stance on global duration exposure.1 Feature Positive Headlines On Negative Yields? Investors should always be cautious of “new era” explanations to justify an elevated asset price after a massive rally. That is akin to internet stocks in the late 1990s that were valued on “clicks and eyeballs” in the absence of actual profits. Or the “peak oil” thesis, predicting an impending exhaustion of global petroleum supplies, that was trotted out during past periods when oil prices were already above $100/bbl. The latest such argument can be found in government bonds, where fundamental justifications for the growing inventory of negative yielding bonds being “the new normal” have started to proliferate. The arguments underlying the “Negative Normal Thesis” (which we will coin “NNT”, not to be confused with the MMT of Modern Monetary Theory!) are hardly new. Aging demographics, “savings gluts” and a dwindling supply of global safe assets have been widely cited as causes for low bond yields since early in the 21st century (remember former Fed Chair Alan Greenspan’s famous “bond conundrum”?). Proponents of NNT point to Japan as the textbook example of how rates can stay low forever when savings are high and demand for capital is low. They are now declaring the “Japanification” of Europe … with the U.S. next in line to eventually join the negative rate party. If the argument that negative interest rates are now normal were to hold, however, we would need to see bond yields continue to stay at negative (or at least extremely low) levels even after global economic growth has stabilized. Chart of the WeekIs This Really A “New Era” For Bond Yields?
Is This Really A "New Era" For Bond Yields?
Is This Really A "New Era" For Bond Yields?
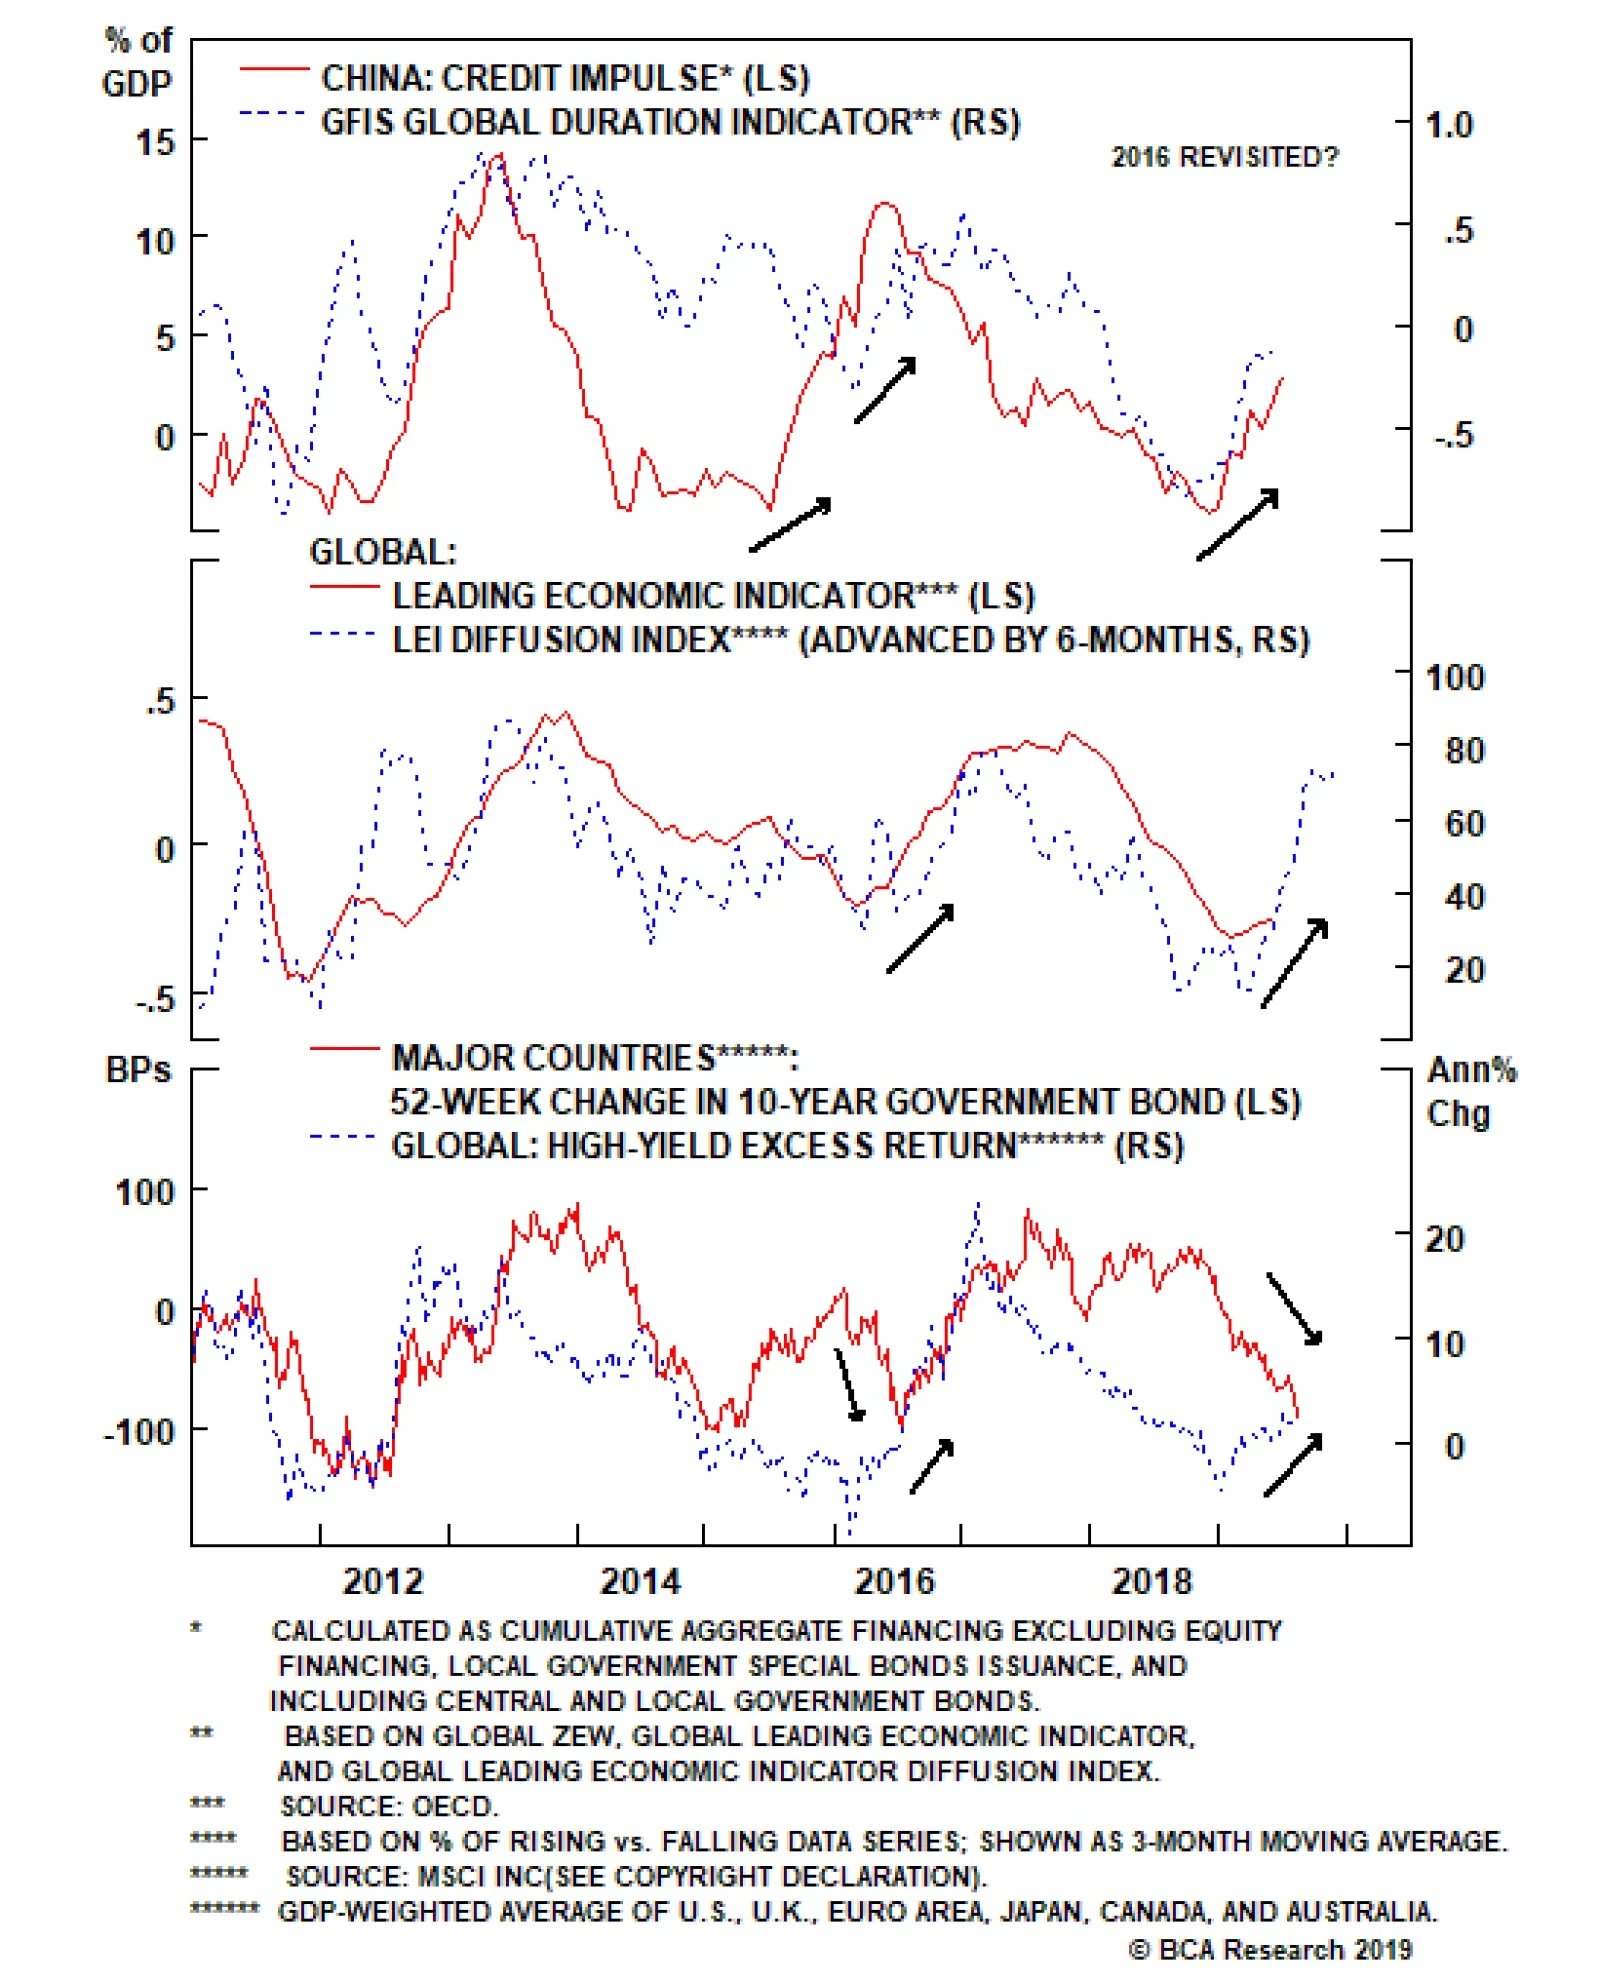
If the argument that negative interest rates are now normal were to hold, however, we would need to see bond yields continue to stay at negative (or at least extremely low) levels even after global economic growth has stabilized. For if negative yields are, in fact, structurally driven by excess savings and not just cyclically driven by weak nominal growth, then improving economic momentum should have little impact on the level of interest rates. That would be a true “Japanification” scenario. For now, as far as we can tell from the data, the big decline in bond yields over the past year can be fully explained by the classic drivers – slowing economic growth and soft inflation (Chart of the Week). Investors are keenly aware of the triggers for these moves by now: a) slowing global trade and capital spending, both victims of the ever-worsening U.S.-China trade dispute; b) the lagged impact of past monetary tightening (Fed rate hikes and, arguably, the end of ECB bond buying at the end of 2018); and c) the persistent strength of the U.S. dollar preventing global “reflation”. You do not have to be an aging saver to view those as good reasons to favor the near-term safety of government bonds. Right now, the steady drumbeat of weakening cyclical global growth indicators is fueling bullish bond sentiment, especially in the parts of the world most exposed to global trade like Europe. Looking ahead, however, we may get the first test of NNT much sooner than expected. The latest update of the OECD’s leading economic indicators (LEI) was released last week. The message is consistent with the modest improvement seen over the past several months (Chart 2), with meaningful gains seen in many economies sensitive to global growth like Mexico, Taiwan, Australia and, most importantly, China. Our “leading leading” indicator – the diffusion index of the global LEI, which includes many of the individual country OECD LEIs – continues to show that the majority of countries are seeing a rise in their LEI. We have shown that the LEI diffusion index has, in the past, been a fairly reliable leading indicator of the direction of not only the global LEI itself but of global bond yields as well. At present, the relatively optimistic reading from the global LEI diffusion index is at odds with the sharp downward momentum in bond yields (see the middle panel of the Chart of the Week). NNT at work, or a sign of a bubble forming in government bond markets? Time will tell. To be sure, the shaken confidence of investors thanks to the intensifying U.S.-China trade dispute has likely weakened the link between growth and yields – at least temporarily. Investors need to see hard evidence that global growth is bottoming out before seriously reevaluating the current level of bond yields. Signs of improvement in Chinese growth momentum would go a long way to turning around depressed investor confidence. It is still a bit too soon, however, to expect a rebound in Chinese domestic demand given the long lags between leading indicators like the OECD measure (or the China credit impulse) and hard Chinese economic data (Chart 3). More likely, a change in trend for these series would not be visible until well into the 4th quarter of 2019, at the earliest. Chart 2A Ray Of Hope For Global Growth?
A Ray Of Hope For Global Growth?
A Ray Of Hope For Global Growth?
Chart 3Still A Bit Too Soon To Expect A China Turnaround
Still A Bit Too Soon To Expect A China Turnaround
Still A Bit Too Soon To Expect A China Turnaround
Signs of better growth in Europe – where negative bond yields are most prevalent, including in corporate bonds – would also help to reverse excessive investor pessimism. A turnaround there, however, also needs better growth in China, given the heavy exposure of European exporters to Chinese demand. So until we see signs of a pickup in Chinese growth momentum, the economic gloomsters, “Ice Agers” and NNT crowd are in charge of the global government bond market. Until we see signs of a pickup in Chinese growth momentum, the economic gloomsters, “Ice Agers” and NNT crowd are in charge of the global government bond market. Bottom Line: Time will tell if negative bond yields are indeed the “new normal”. We need to see negative yields sustained outside of a growth slowdown to prove that thesis. Have The Rallies In U.S. Treasuries & German Bunds Now Gone Too Far? Last week, we upgraded our overall global duration call to neutral on a tactical (0-3 month) basis.2 This was driven by the growing risk that the global central banks – most notably, the Federal Reserve – could be forced to become even more dovish because of the escalation in the U.S.-China trade war. Furthermore, our Global Duration Indicator has pulled back after the steady rise since late 2018, and is now in line with the aggregate level of 10-year bond yields in the major developed markets (Chart 4). This is consistent with a neutral tactical duration view. Chart 4The Signal From Our Duration Indicator Is Consistent With A Neutral Stance
The Signal From Our Duration Indicator Is Consistent With A Neutral Stance
The Signal From Our Duration Indicator Is Consistent With A Neutral Stance
There are signs, however, that Treasuries are overbought: Even as Treasury yields are heading closer to the 2016 lows, U.S. inflation expectations derived from the TIPS market are closer to 2% than the lows below 1.5% seen in 2016 (Chart 5). That market pricing seems reasonable, with realized inflation higher, and the labor market tighter, than was the case three years ago. The price momentum for the 10-year Treasury yield is approaching the extremes seen in the “post Fed QE” era (Chart 6), with the 6-month rate of change of the Bloomberg Barclays U.S. Treasury index approaching 10%. The deviation of the 10-year Treasury yield from its 200-day moving average, which is also at the post-QE extreme of -75bps, tells a similar story. Chart 5A Different U.S. Inflation Backdrop Vs. 2016
A Different U.S. Inflation Backdrop Vs. 2016
A Different U.S. Inflation Backdrop Vs. 2016
Chart 6The Fall In UST Yields Looks Stretched
The Fall In UST Yields Looks Stretched
The Fall In UST Yields Looks Stretched
Investor positioning has become VERY long, with the J.P. Morgan duration survey of Active Clients surging to the highest level in the two-decade history of the series (Chart 6, third panel). A similar story applies to the German bond market, where the entire yield curve out to 30-years is trading below 0% (raising a cheer from the NNTers): Market-based inflation expectations have collapsed, with the 5-year CPI swap, 5-years forward reaching a low of 1.2% – lower than 2016, despite a tighter overall euro area labor market, accelerating wage growth and core inflation remaining sticky around 1% (Chart 7). The 6-month total return of the German government bond index is reaching a post-European Debt Crisis extreme near 10%, while the 10-year Bund yield is trading around a similar extreme of 50bps below its 200-day moving average (Chart 8). Chart 7European Inflation: Expectations Worse Than Reality
European Inflation: Expectations Worse Than Reality
European Inflation: Expectations Worse Than Reality
Chart 8The Fall in Bund Yields Is Looking Stretched
The Fall in Bund Yields Is Looking Stretched
The Fall in Bund Yields Is Looking Stretched
While the near-term backdrop does not justify a tactically bearish view on Treasuries or Bunds, the stretched technical backdrop suggests that yields could snap back quite sharply on any sign of better global growth or an easing of U.S.-China trade tensions. While the near-term backdrop does not justify a tactically bearish view on Treasuries or Bunds, the stretched technical backdrop suggests that yields could snap back quite sharply on any sign of better global growth or an easing of U.S.-China trade tensions. Bottom Line: U.S. Treasuries and German Bunds both look overbought, amid extreme price/yield momentum and aggressively long duration positioning. Yet given the persistent headline risk from the U.S.-China trade dispute, and without durable signs of improving growth in China or Europe, it is too early to position for a reversal of the stretched yield moves. Maintain a neutral overall stance on global duration exposure. Robert Robis, CFA, Chief Fixed Income Strategist rrobis@bcaresearch.com Footnotes 1 Please see BCA Global Fixed Income Strategy Weekly Report, “Trade War Worries: Once More, With Feeling”, dated August 6, 2019, available at gfis.bcarsearch.com. 2 Please see BCA Global Fixed Income Strategy Weekly Report, “Trade War Worries: Once More, With Feeling”, dated August 6, 2019, available at gfis.bcarsearch.com. Recommendations The GFIS Recommended Portfolio Vs. The Custom Benchmark Index
A "New Negative" World For Bonds? Or Just The Latest Bubble?
A "New Negative" World For Bonds? Or Just The Latest Bubble?
Duration Regional Allocation Spread Product Tactical Trades Yields & Returns Global Bond Yields Historical Returns
We expect central banks generally – and the Fed in particular – will err on the side of maintaining monetary accommodation while uncertainty over trade and global growth prospects remains elevated. Fed Chairman Jay Powell's description of the central bank's…
Just as it appeared the slowdown in global industrial activity had run its course, commodity markets face another test of demand resiliency brought on by exogenous political shocks (Chart Of The Week). As luck would have it, these shocks – arriving in the form of an unexpected escalation of Sino-U.S. trade tensions – came on the heels of reports of further weakness in global manufacturing activity, a less-dovish-than-expected Fed, and a breach of the 7.0 level of the RMB/USD cross. The fallout – a global risk-off event – raises the spectre of a deeper trade war damaging EM GDP growth, which would weaken commodity demand. We continue to expect global fiscal and monetary stimulus to revive commodity demand, albeit further out the curve – i.e., later this year, as opposed to earlier in 2H19. Given the trade-war escalation, we are recommending a tactical long position in spot silver to hedge portfolio risk. The metal has been tracking gold’s ups and downs post-GFC – more so than industrial demand for silver – indicating it may have some catching up to do. This will make us strategically long gold, and tactically long silver at tonight’s close. Chart Of The WeekRenewed Trade Tensions Threaten Industrial Commodities' Recovery
Renewed Trade Tensions Threaten Industrial Commodities' Recovery
Renewed Trade Tensions Threaten Industrial Commodities' Recovery
Highlights Energy: Overweight. U.S. President Trump informed Congress earlier this week he was imposing a total economic embargo on Venezuela, which freezes assets of the Maduro government and all business dealings with its representatives except for humanitarian aid. Venezuela’s oil production averaged ~ 750k b/d in 2Q19, and was supported by the assistance of Russian technicians, U.S.-based Chevron Corp., and four service companies that were granted 90-day waivers by the U.S. to continue to do business in the country.1 Our long Sept19 Brent vs. short Sept20 Brent position expired with a gain of 101.7%. We remain long 4Q19 Brent vs. short 4Q20 Brent. Base Metals: Neutral. Industrial metals, iron ore and steel came under renewed selling pressure this week, in the wake of heightened trade tensions between the U.S. and China. Precious Metals: Neutral. Safe-haven demand rallied gold 3% over the week ended Tuesday, following the escalation in Sino-U.S. trade tensions. We continue to favor gold as a strategic portfolio hedge, particularly if central banks are compelled to accelerate monetary accommodation as global trade tensions rise, and are adding a tactical long silver position to our recommendations. Ags/Softs: Underweight. China’s Commerce Ministry reported U.S. ag products no longer are being purchased by Chinese companies earlier this week.2 U.S. President Trump’s decision to impose tariffs on Chinese imports to the U.S. were occasioned by his claim China was not living up to an agreement to increase agricultural purchases. This broke the truce in the Sino-U.S. trade war that accompanied the resumption in negotiations last month. Feature A recovery in industrial-commodity demand – particularly for oil and base metals – could be stretched out longer than we expected just a week ago. It’s still too early to tell whether the escalation in Sino-U.S. trade tensions will throw a spanner into the revival of commodity demand we’ve been expecting, but it does give us pause. Prior to the political shocks and other disappointments hitting markets this past week, our commodity demand gauges were indicating the slowdown in demand had – or was close to – run its course, and that EM demand, in particular, was set to revive. EM GDP growth drives commodity demand growth globally, which is why it is so important in our analysis. Our Chart of the Week illustrates this point, showing three relationships we've developed that allow us to track the evolution of EM GDP growth in something close to real time: BCA’s Global Industrial Activity (GIA) index, which is highly sensitive to economic activity in EM generally and China in particular;3 BCA’s Global Commodity Factor (GCF), which condenses the information contained in 28 commodity price series to a common factor using principal components analysis; and BCA’s EM Import Volume model, which generates an expectation of EM import volumes using mainly FX values for countries highly exposed to global trade. To be precise, we find the output of these three models shown in the Chart of the Week and EM GDP growth are deeply entwined.4 As can be seen in the chart, these models appeared to have bottomed and were preparing to hook up. This is supported by current global activity indicators (CAIs), particularly for China and EM, which still is showing positive y/y growth, even if its rate is slowing. (Chart 2), and the recent upturn in EM Financial Conditions we track here at BCA Research (Chart 3). Chart 2Global CAIs Support EM Growth Expectation
Global CAIs Support EM Growth Expectation
Global CAIs Support EM Growth Expectation
Chart 3EM Financial Conditions Move To Easier Setting
EM Financial Conditions Move To Easier Setting
EM Financial Conditions Move To Easier Setting
However, the escalation of Sino-U.S. trade tensions, coming off a somewhat disappointing Fed rate cut of 25bps and weak manufacturing data, was enough to erase 6% and 3% from the GSCI and Bloomberg commodity indices over the week ended Tuesday (Chart 4), and to lift volatility in industrial commodities’ prices sharply (Chart 5).5 Chart 4Policy Shock, Disappointing Rate Cut Hammer Commodity Indices
Policy Shock, Disappointing Rate Cut Hammer Commodity Indices
Policy Shock, Disappointing Rate Cut Hammer Commodity Indices
Chart 5Crude Oil, Copper Vol Jump On Policy Shock
Crude Oil, Copper Vol Jump On Policy Shock
Crude Oil, Copper Vol Jump On Policy Shock
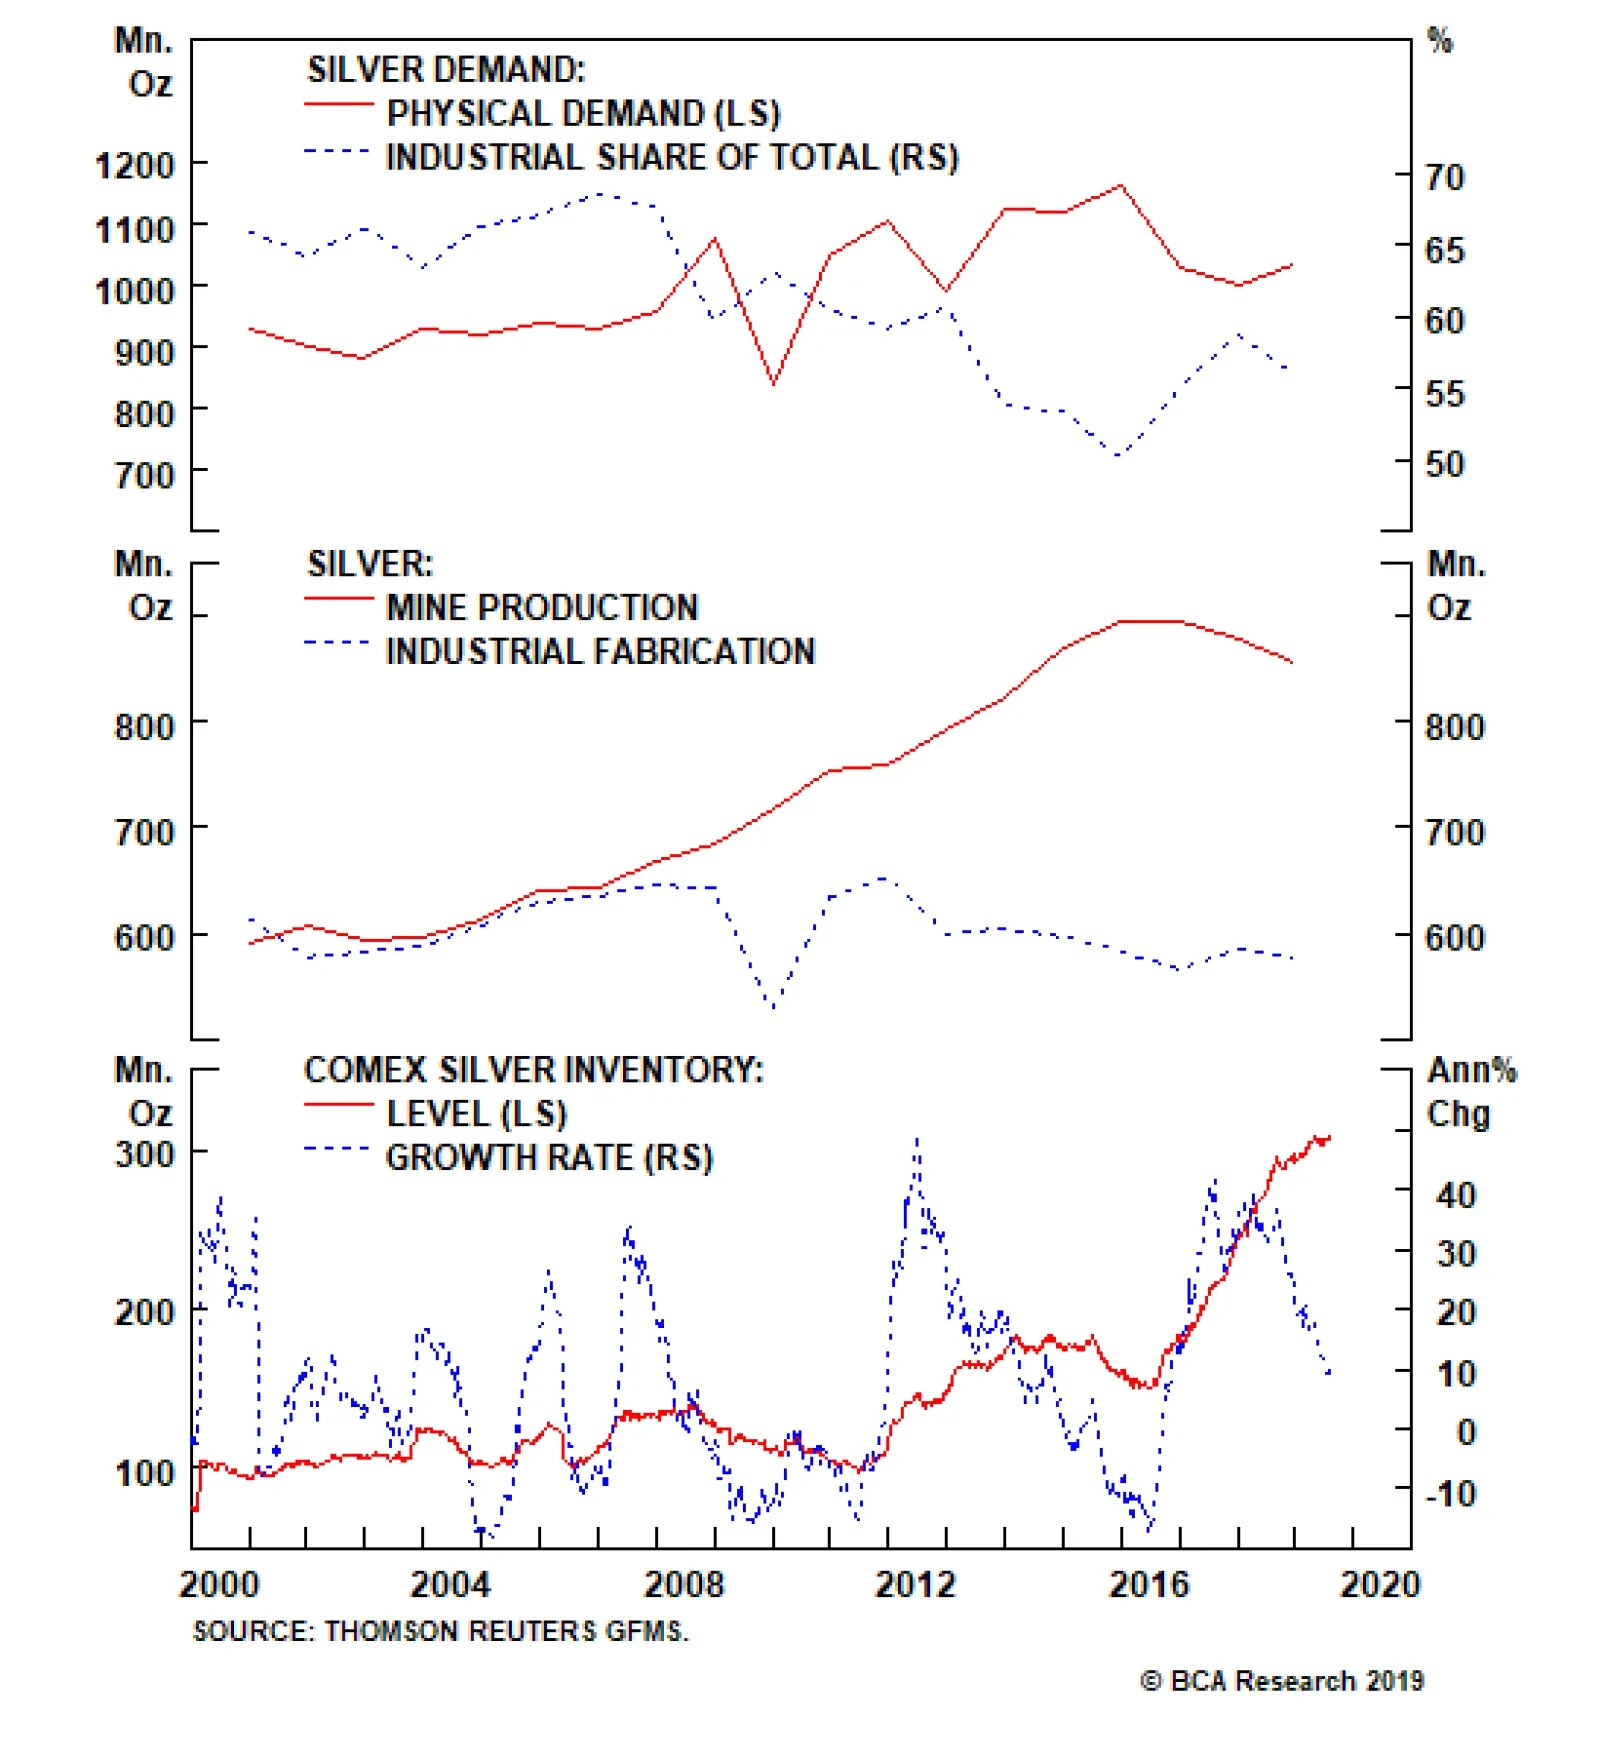
A Fraught Situation The Sino-U.S. trade standoff is fraught with risk for both sides. A full-blown trade war could devolve into domestic recessions (there is a non-trivial risk to the global economy, as well). In addition, a kinetic military confrontation between China and its allies and the U.S. and its allies cannot be ruled out, as tensions rise. The case for resolving the trade dispute is strong. Our colleague Peter Berezin notes that while an escalation in the Sino-U.S. trade war “would tip the scales towards recession, the risk of such an outcome remains low.”6 An all-out trade war could push the U.S. economy into a recession next year, just as President Trump faced re-election, which strongly suggests a goodwill gesture or two from the U.S. – e.g., the Commerce Department renewing the licenses allowing U.S. firms to deal with Huawei – could go a long way to getting trade talks back on track. Our commodity demand gauges were indicating the slowdown in demand had – or was close to – run its course, and that EM demand, in particular, was set to revive. That said, we cannot gainsay the conclusions of our colleague Matt Gertken, who runs our Geopolitical Strategy: “The U.S.-China trade negotiations are falling apart at the moment. … (B)ut with the latest round of tariffs we think it is more likely that we will get a major escalation of strategic tensions and even saber-rattling,” as U.S. and Chinese positions harden, particularly around North Korea, Hong Kong and Taiwan.7 Clearly, the outcome of this latest round of the Sino-U.S. dispute is uncertain, and the risks are elevated. Moving To A Safe Haven: Silver While we continue to expect global fiscal and monetary stimulus will revive commodity demand, the shocks and disappointments visited upon markets could incline firms, households and investors globally to scale back on risky investments and purchases until the dust settles.8 Over the near term – i.e., 3 months or so – seeking refuge in a safe haven is sensible. In particular, we believe silver offers near-term cover, and expect it will continue to follow the evolution of gold prices.9 We expect central banks generally – the Fed in particular – will err on the side of maintaining monetary accommodation while uncertainty over trade and global growth prospects remains elevated. Fed Chairman Jay Powell's description of the central bank's July rate cut of 25 bps as a mid-cycle adjustment – and not the beginning of a lengthy cutting cycle – was perceived as a hawkish surprise, but markets appear to be pricing in additional cuts this year, which will support precious metals until further guidance from the Fed arrives. An escalation of the trade war likely would increase the probability the Fed cuts rates further at its next meeting, which would push down recession fears. The outcome of this latest round of the Sino-U.S. dispute is uncertain, and the risks are elevated. On the supply side, silver typically is mined as a secondary metal, and usually is found with gold, copper and lead deposits, according to the Silver Institute.10 On the demand side, investment and electronics account for much of the usage. Prior to the Global Financial Crisis (GFC), silver traded like a base metal, owing to the high growth rates in EM economies undergoing rapid industrialization, which led to higher consumption. This resulted in a large supply-deficit in most industrial commodities, including silver (Chart 6). Following the GFC, the evolution of silver’s price more closely tracked gold prices, following the massive injections of money and credit by central banks globally. (Chart 7).11 Chart 6Silver Is Less Industrial, More Precious Now
Silver Is Less Industrial, More Precious Now
Silver Is Less Industrial, More Precious Now
Chart 7Post-GFC, Silver and Gold Are More Closely Aligned
Post-GFC, Silver and Gold Are More Closely Aligned
Post-GFC, Silver and Gold Are More Closely Aligned
We expect this to continue, given our view central banks are likely to either increase or accelerate monetary accommodation to offset Sino-U.S. trade tensions, should they worsen. The U.S. dollar outlook remains important for precious metals. The dollar is a counter-cyclical currency. Thus, the escalation in trade tensions risks delaying the rebound we expect in emerging markets. This could support the USD for longer than we expected. Bottom Line: We expect commodity demand to revive on the back of global fiscal and monetary stimulus. However, exogenous political shocks along the way toward that revival likely will force households, firms and investors to re-think spending and investment decisions. This could potentially lead to reduced aggregate demand, in the event uncertainty around manufacturing, which still accounts for significant employment and output in EM economies, and global trade becomes too high. Until this is sorted, taking refuge in a safe haven is prudent. To hedge against this, we are recommending spot silver as a tactical portfolio hedge. We already are long gold as a strategic portfolio hedge, and this position is up 20% this year. Robert P. Ryan, Chief Commodity & Energy Strategist rryan@bcaresearch.com Hugo Bélanger, Senior Analyst Commodity & Energy Strategy HugoB@bcaresearch.com 1 Please see U.S. sanctions waiver for Chevron signals Venezuela solution near: opposition ambassador, published by S&P Global Platts July 30, 2019. 2 Please see U.S. farmers suffer 'body blow' as China slams door on farm purchases published by reuters.com August 5, 2019. 3 Please see Expanded Sino – U.S. Trade War Could Be Bullish For Base Metals, published by BCA Research’s Commodity & Energy Strategy May 9, 2019, for a discussion of the GIA index. The index is a weighted average of selected trade, currency, manufacturing PMIs, and Chinese industrial sector variables. The article is available at ces.bcaresearch.com. 4 This is to say there is strong two-way Granger causality between EM GDP and the output of the models shown above in the Chart of the Week. Knowing the output of one of the models allows one to forecast EM GDP growth, and vice versa. We will be doing further research into using these models to estimate the change in EM GDP at a higher frequency than the stand-alone EM GDP data are reported – e.g., the World Bank’s most recent actual EM GDP data in constant 2010 USD is reported up to 1Q18, while the models shown in the chart can be updated daily (GCF and the EM Import Volume models); and monthly, as the components of the GIA index become available. 5 For a discussion of global fixed-income markets’ response to the escalation of the Sino-U.S. trade war and the outlook for more aggressive monetary policy accommodation globally, please see Trade War Worries: Once More, With Feeling, published by BCA Research’s Global Fixed Income Strategy August 6, 2019. It is available at gfis.bcaresearch.com. 6 Please see A One-Two Punch, published by BCA Research’s Global Investment Strategy August 2, 2019. It is available at gis.bcaresearch.com. 7 Please see Tariffs ... And The Last Prime Minister Of The United Kingdom?, published by BCA Research’s Geopolitical Strategy, August 2, 2019. It is available at gps.bcaresearch.com. Almost on cue, China warned the U.S. it would view its deployment of intermediate-range missiles in Asia following Russia’s revival of its intermediate-range missile development as “offensive in nature.” Please see China warns US against deploying missiles on its ‘doorstep’, published by the Financial Times August 6, 2019. 8 Our global macro expectation can be found in Oil Markets Await Lift From Global Stimulus, published by BCA Research’s Commodity & Energy Strategy August 1, 2019. It is available at ces.bcaresearch.com. 9 Please see "The Gold Trifecta," published June 27, 2019, by BCA Research's Commodity & Energy Strategy, for our most recent analysis of the gold market and of our long-held bullish gold view. It is available at ces.bcaresearch.com. 10 The Institute’s supply-demand annual supply-demand balances showed a 29.2mm-ounce deficit in 2018. 11 When we model silver returns as a function of gold and base metals’ returns, silver’s elasticity to gold prices more than doubles – from 0.68 over the 1999 - 2010 period, to 1.67 post-GFC (2010 to now). The elasticity to changes in base-metals prices was roughly cut in half over this period, to 0.28 post-GFC. Investment Views and Themes Recommendations Strategic Recommendations Tactical Trades TRADE RECOMMENDATION PERFORMANCE IN 2019 Q2
Image
Commodity Prices and Plays Reference Table Trades Closed in 2019 Summary of Closed Trades
Image
Dear Client, In case you missed it in real time, please listen to a replay of this quarter’s webcast ‘The Investment World in 5 Charts and 18 Minutes’ available at eis.bcaresearch.com. Also please note that we will be taking a summer break, so our next report will come out on August 22. Dhaval Joshi Highlights The aggregate equity market will go nowhere for the remainder of this year – as the sell-offs from a down-oscillation in growth fight the rallies from the valuation boost given by ultra-low bond yields. But there will be sector and regional losers and winners. Economically-sensitive ‘value’ sectors will be the losers, specifically Industrials and Semiconductors. Defensive ‘growth’ sectors will be the relative winners, specifically Healthcare. Continue to overweight European equities versus Chinese equities. Feature Chart of the WeekThe Global Bond Yield Is Within A Whisker Of An All-Time Low
The Global Bond Yield Is Within A Whisker Of An All-Time Low
The Global Bond Yield Is Within A Whisker Of An All-Time Low
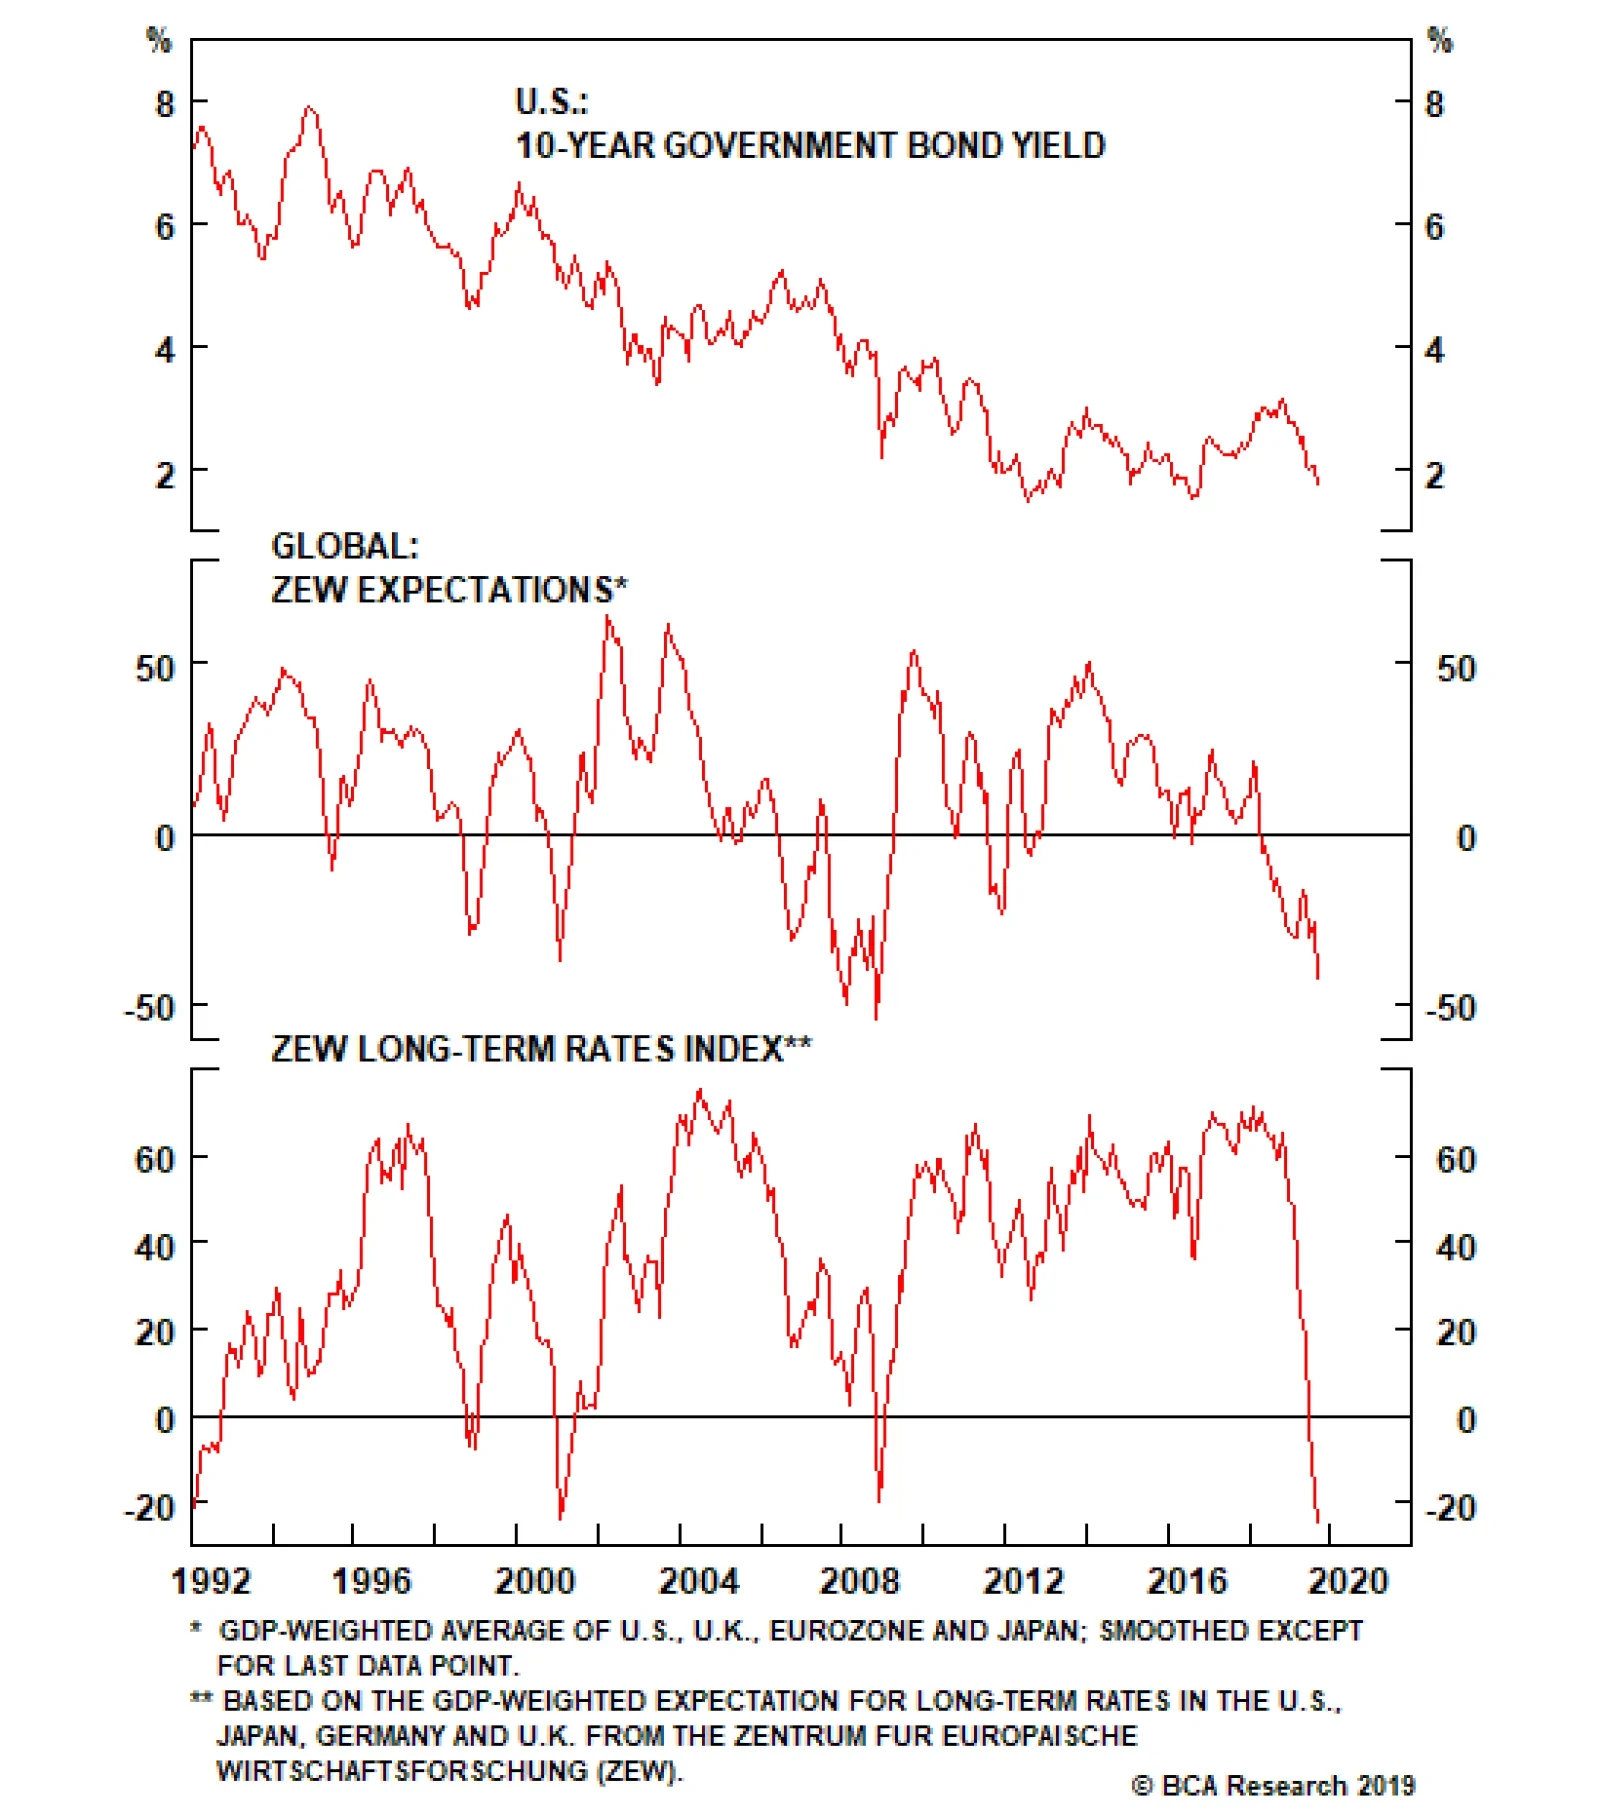
This week the global long bond yield came within a whisker of the all-time low reached after the shock vote for Brexit in June 2016 (Chart of the Week). By definition, this means that the aggregate bond market has gone nowhere for several years. Since the autumn of 2017, the aggregate equity market has also gone nowhere, with no rally or sell-off lasting more than three months (Chart I-2).1 Chart I-2Since October 2017, No Rally Or Sell-Off Has Lasted More Than Three Months
Since October 2017, No Rally Or Sell-Off Has Lasted More Than Three Months
Since October 2017, No Rally Or Sell-Off Has Lasted More Than Three Months
The correct strategy then has been to sell the equity market’s three month rallies and buy the three month sell-offs. In June we predicted that equities would end the year at broadly the same level as then, but that they would experience a dip of at least 4-5 percent along the way. We are now experiencing the dip. The correct strategy has been to sell the three month rallies and buy the three month sell-offs. But isn’t the global bond yield approaching an all-time low a good thing for the economy and equity market? The answer is yes, and no. Yes, the ultra-low level of yields is a boon for the valuation of risk-assets. However, when it comes to credit-sourced economic growth, what matters is not the level of the bond yield, nor its direction, so much as its rate of change. If Bond Yields Decline At A Reduced Pace, Growth Slows Many people struggle to understand this subtle and counterintuitive point. If the bond yield declines, but at a reduced pace, it can slow credit-sourced growth. To understand why, imagine that in a certain period, a -0.5 percent decline in the bond yield added €50 billion to credit creation. This would constitute additional economic demand. If, in the following period, a further -0.5 percent yield decline added another €50 billion of credit-sourced demand, it would constitute the same amount of additional demand – which is to say, the same growth – as in the first period. By comparison, a -0.25 percent yield decline which added €25 billion to demand would result in the growth rate halving. The subtle and counterintuitive point is that the bond yield has continued to decline, yet it has caused credit-sourced growth to slow! Chart I-3In China, The Bond Yield's Peak Rate Of Decline Happened 6 Months Ago
In China, The Bond Yield's Peak Rate Of Decline Happened 6 Months Ago
In China, The Bond Yield's Peak Rate Of Decline Happened 6 Months Ago
This counterintuitive dynamic has unfolded in the global economy this year. Although bond yields have been heading lower, the peak rate of decline – notably in China – happened six months ago. Meaning that credit-sourced growth has almost certainly slowed (Chart I-3). Amplifying this down-oscillation in growth, geopolitical storm clouds are now regathering over the global economy. In the early part of this year, trade tensions and currency wars between the major economic blocs seemed to dissipate, the Middle East was quiet, and the Brexit deadline was postponed. But the lull was temporary. The geopolitical headwinds to growth are now strengthening with a vengeance. That’s the bad news. Equity Valuations Are Hyper-Sensitive To Low Bond Yields Now the good news. While the level of bond yields does not drive economic growth, it does drive the valuations of equities and other risk-assets. Moreover, it does so in a powerful non-linear way. Below a threshold level, ultra-low bond yields can give the valuation of equities an exponential boost. Geopolitical storm clouds are now regathering over the global economy. We refer readers to our other reports for the details, but in a nutshell at ultra-low bond yields the risk of owning bonds converges to the risk of owning equities. The upshot of this risk convergence is that investors price equities to deliver the same feeble nominal return as bonds, meaning that the valuation of equities soars (Chart I-4).2 Chart I-4The Valuation Of Equities Is Back To The Peak Level Of 2000 And 2007
The Valuation Of Equities Is Back To The Peak Level Of 2000 And 2007
The Valuation Of Equities Is Back To The Peak Level Of 2000 And 2007
Theoretically and empirically, this threshold level of the bond yield is in the region of 2 percent. And the bond yield that matters is the global long bond yield, defined as the simple average of the 10-year yields of the U.S., the euro area, and China. To simplify matters, we can proxy the 10-year yield of the aggregate euro area with the 10-year yield of France. So calculate the simple average of the 10-year yields of the U.S., France, and China. A value rising towards 2.5 percent equates to danger for equity valuations. A value falling below 2.0 percent equates to an underpinning for equity valuations. Today, the value stands near 1.5 percent creating a good support for equity and risk-asset valuations. The upshot is that the aggregate equity market will go nowhere for the remainder of this year – as the sell-offs from the down-oscillation in growth fight the rallies from the valuation boost given by ultra-low bond yields. But there will be sector losers and winners. Essentially, economically-sensitive ‘value’ sectors will be the losers while defensive ‘growth’ sectors will be the relative winners. Put simply, the sector trends present during the last up-oscillation in global growth are likely to unwind if they have not already done so. In which case, the sectors most likely to suffer underperformance are: Industrials and Semiconductors (Chart I-5). Chart I-5Industrials Outperformed Strongly... But Are Now Underperforming
Industrials Outperformed Strongly... But Are Now Underperforming
Industrials Outperformed Strongly... But Are Now Underperforming
And the sector most likely to see (continued) outperformance is: Healthcare. There will also be regional losers and winners. This is because regional equity market relative performance just follows from sector relative performance combined with each region’s sector ‘fingerprint’. Bear in mind that a fingerprint can be defined not just by overweight sectors but also by underweight sectors, such as the Shanghai Composite’s negligible weighting in Healthcare, making the Chinese index ultra-cyclical. Continue to overweight European equities versus Chinese equities (Chart I-6). Chart I-6Overweight Europe Versus China
Overweight Europe Versus China
Overweight Europe Versus China
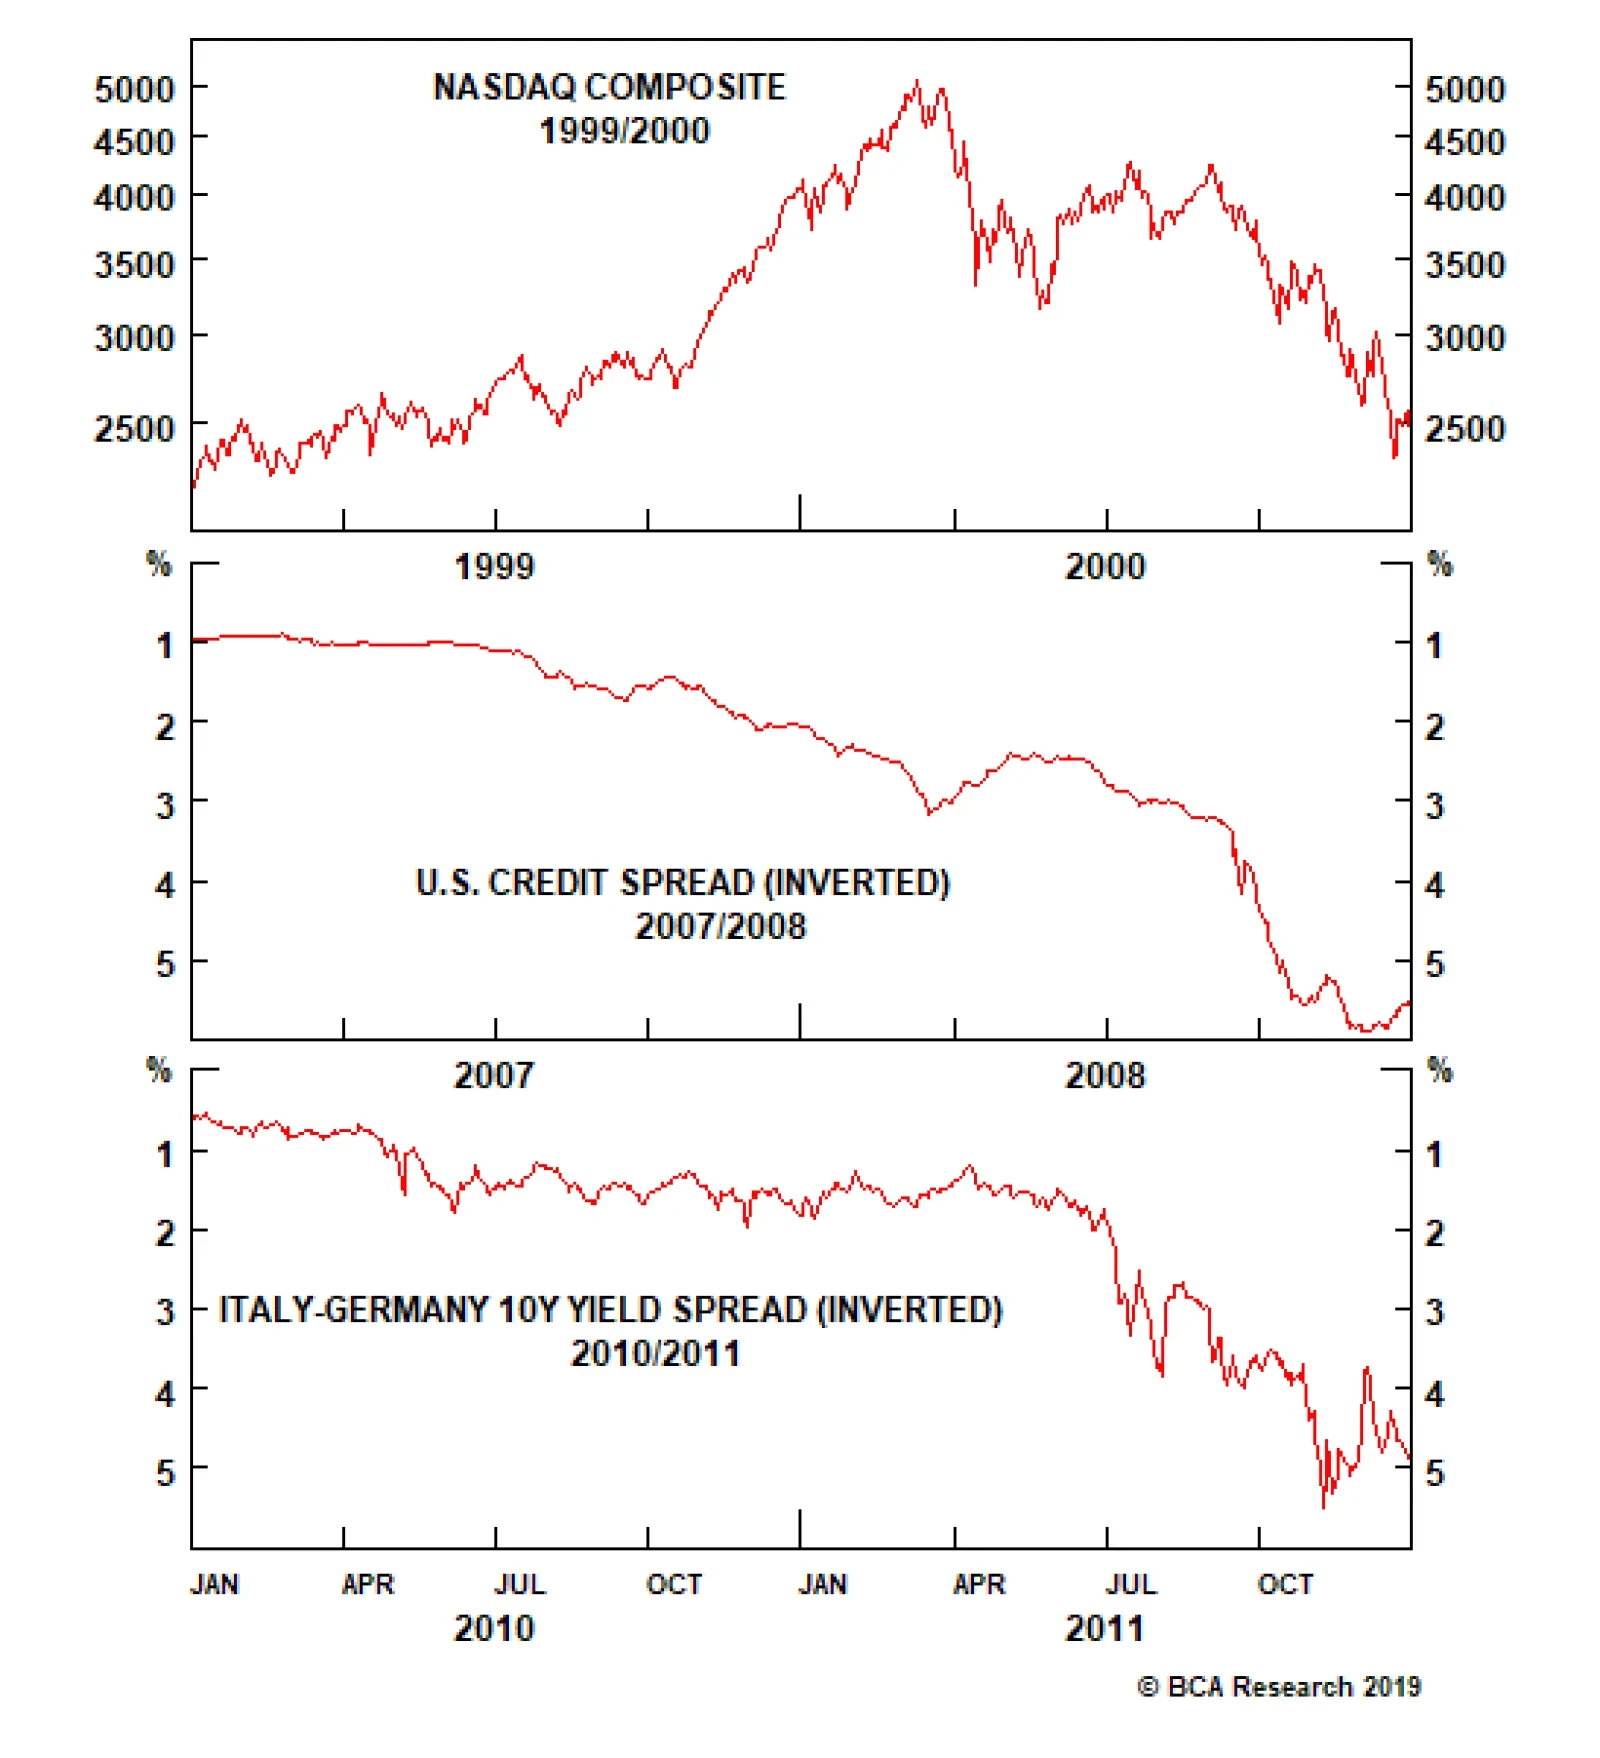
Market Dislocations And Recessions: Cause And Effect As investment strategists, our primary focus should be the financial markets rather than the economy. On this basis, we define a major dislocation in terms of the markets: an episode in which equities underperform bonds by more than 20 percent over a period of more than six months. There have been three such episodes in the twenty-first century.3 Yet our market based definition of a major dislocation also perfectly captures the three last times that the European economy went into recession or near-recession. Does this mean that the recessions caused the financial market dislocations? No. Quite the reverse. The twenty-first century’s recessions have all resulted from financial market dislocations. The twenty-first century’s recessions have all resulted from the financial market dislocations that followed market distortion or mispricing: the bubble valuations of the technology, media and telecom sectors in 2000 (Chart I-7); the mispricing of U.S. mortgages and credit in 2007 (Chart I-8); and the mispricing of euro area sovereign credit risk in 2011 (Chart I-9). Therefore, the major dislocations in the financial markets have always preceded the recessions and near-recessions, sometimes by several quarters, even when both are measured in real time. Chart I-7The Twenty First Century Recessions Stemmed From Financial Market Distortions: The Dot Com Bubble In 1999/2000...
The Twenty First Century Recessions Stemmed From Financial Market Distortions: The Dot Com Bubble In 1999/2000...
The Twenty First Century Recessions Stemmed From Financial Market Distortions: The Dot Com Bubble In 1999/2000...
Chart I-8...The Mispricing Of U.S.##br## Mortgages And Credit In##br## 2007/2008...
...The Mispricing Of U.S. Mortgages And Credit In 2007/2008...
...The Mispricing Of U.S. Mortgages And Credit In 2007/2008...
Chart I-9...And The Mispricing Of Euro Area Sovereign Credit Risk In 2010/2011
...And The Mispricing Of Euro Area Sovereign Credit Risk In 2010/2011
...And The Mispricing Of Euro Area Sovereign Credit Risk In 2010/2011
Today, the consensus overwhelmingly believes that a recession will cause the next major dislocation in financial markets. But history has taught us time and time again that the causality is much more likely to run the other way. Hence, a major dislocation in the financial markets – should one occur – will cause the next recession. And not the other way round! Fractal Trading System* The nickel price has surged on continued fears over Indonesian exports bans. But from a technical perspective the recent surge is excessive and susceptible to a reversal on any easing of the fears. Accordingly, this week’s trade is short nickel versus copper, setting a profit target of 10 percent with a symmetrical stop-loss. In other trades, short ASX200 versus FTSE100 hit its 2 percent stop-loss, but short MSCI All-Country World has moved well into profit. For any investment, excessive trend following and groupthink can reach a natural point of instability, at which point the established trend is highly likely to break down with or without an external catalyst. An early warning sign is the investment’s fractal dimension approaching its natural lower bound. Encouragingly, this trigger has consistently identified countertrend moves of various magnitudes across all asset classes. Chart I-10Short Nickel, Long Copper
Short Nickel, Long Copper
Short Nickel, Long Copper
The post-June 9, 2016 fractal trading model rules are: When the fractal dimension approaches the lower limit after an investment has been in an established trend it is a potential trigger for a liquidity-triggered trend reversal. Therefore, open a countertrend position. The profit target is a one-third reversal of the preceding 13-week move. Apply a symmetrical stop-loss. Close the position at the profit target or stop-loss. Otherwise close the position after 13 weeks. Use the position size multiple to control risk. The position size will be smaller for more risky positions. * For more details please see the European Investment Strategy Special Report “Fractals, Liquidity & A Trading Model,” dated December 11, 2014, available at eis.bcaresearch.com. Dhaval Joshi, Chief European Investment Strategist dhaval@bcaresearch.com Footnotes 1 We define the global long bond yield as the simple average of the 10-year yields in the U.S., euro area, and China. And to make things simple, France provides a good proxy for the euro area long bond yield. 2 Please see the European Investment Strategy Weekly Report “Risk: The Great Misunderstanding Of Finance”, October 25, 2018 available at eis.bcaresearch.com. 3 Based on the relative performance of the MSCI All Country World Index versus the JP Morgan Global Government Bond Index, both in local currency terms. Fractal Trading System Cyclical Recommendations Structural Recommendations Closed Fractal Trades Trades Closed Trades Asset Performance Currency & Bond Equity Sector Country Equity Indicators Bond Yields Chart II-1Indicators To Watch - Bond Yields
Indicators To Watch - Bond Yields
Indicators To Watch - Bond Yields
Chart II-2Indicators To Watch - Bond Yields
Indicators To Watch - Bond Yields
Indicators To Watch - Bond Yields
Chart II-3Indicators To Watch - Bond Yields
Indicators To Watch - Bond Yields
Indicators To Watch - Bond Yields
Chart II-4Indicators To Watch - Bond Yields
Indicators To Watch - Bond Yields
Indicators To Watch - Bond Yields
Interest Rate Chart II-5Indicators To Watch - Interest Rate Expectations
Indicators To Watch - Interest Rate Expectations
Indicators To Watch - Interest Rate Expectations
Chart II-6Indicators To Watch - Interest Rate Expectations
Indicators To Watch - Interest Rate Expectations
Indicators To Watch - Interest Rate Expectations
Chart II-7Indicators To Watch - Interest Rate Expectations
Indicators To Watch - Interest Rate Expectations
Indicators To Watch - Interest Rate Expectations
Chart II-8Indicators To Watch - Interest Rate Expectations
Indicators To Watch - Interest Rate Expectations
Indicators To Watch - Interest Rate Expectations
Early leading indicators are flashing a future bottoming of global growth. Several of the more reliable leading economic signals, like our global LEI diffusion index and the China credit impulse, are both flashing the potential for a rebound in global growth…
A lot of bad news is already discounted in global bond yields. The rally in government bond markets this year has pushed bond yields down to stretched levels using typical valuation metrics like the 5-year OIS rate, 5-years forward; the term premium on…
Highlights U.S.-China: The escalation of the trade war has renewed investor fears that uncertainty could create an even deeper drag on global growth, requiring a more aggressive easing of global monetary policy. Fed: The Fed had an opportunity last week to regain control of monetary policy from the markets, but opted for only a cautious rate cut that came off as too hawkish. The FOMC will be forced to play defense in the next 3-6 months, likely by cutting rates more than originally envisioned given the market turbulence stemming from the trade war escalation. Fixed Income Asset Allocation: Raise overall global portfolio duration to neutral on a tactical (0-3 months) basis, at least until equity markets stabilize. Maintain strategic (6-12 months) overweights to global corporate bonds, however, as global leading economic indicators are bottoming. Feature A Painful Repricing Chart of the WeekNot A Pretty Picture
Not A Pretty Picture
Not A Pretty Picture
A long-overdue correction in risk assets, or the start of something more sinister? That is the question investors must now consider. Another Twitter blast from @realDonaldTrump has triggered chaos in global financial markets, with the imposition of fresh U.S. tariffs on Chinese imports. This shattered the market calm since the June G20 meeting, when an announced truce on the U.S.-China trade dispute led to optimism that a real deal could be reached. China retaliated to the new tariffs by allowing the USD/CNY exchange rate to depreciate beyond the perceived line in the sand at 7.0. The trade news came at a bad time for financial markets, a few days after the release of soft global manufacturing PMI data for July that highlighted how global growth remains highly vulnerable to trade war developments (Chart of the Week). The Fed did not help matters by delivering an interest rate cut last week but somehow coming across as hawkish (or, at least, not dovish enough). The market response to the renewed trade tensions and yuan weakness has been classic “macro risk-off” – sharply lower government bond yields, alongside big declines in global equity markets and commodity prices (Chart 2) and increases in the value of typical safe-havens like gold and the Japanese yen (Chart 3). Chart 2Growth-Sensitive Assets Not Doing Well
Growth-Sensitive Assets Not Doing Well
Growth-Sensitive Assets Not Doing Well
Chart 3Safe Havens In Demand
Safe Havens In Demand
Safe Havens In Demand
The nature of the fall in global bond yields has been consistent with what has been seen so far in 2019 – fairly coordinated moves in terms of size, with much smaller changes seen in cross-country yield spreads. This suggests that the unobservable “global” bond yield is falling in response to deteriorating global growth expectations, rather than country-specific factors driving local bond yields. Global trade uncertainty – and what that implies for future weakness in corporate profits, investment and employment – is indeed an “external shock” for every nation. We admit that our current duration recommendations have not been aligned to benefit from these moves. Our forecasting philosophy for government bond yields is based on what our colleagues at our sister service, BCA U.S. Bond Strategy, have dubbed “The Golden Rule of Bond Investing”.1 In that framework, the primary driver of government bond market returns (excess returns over cash, to be precise) is the outcome of central bank policy moves versus what is discounted in interest rate markets. In the U.S., we have been steadfast in our expectation that the Fed would disappoint market pricing that was calling for as much as 90bps of rate cuts over the next 12 months. Global trade uncertainty – and what that implies for future weakness in corporate profits, investment and employment – is indeed an “external shock” for every nation. Chart 4Rate Cuts Required - And Discounted - Everywhere
Rate Cuts Required - And Discounted - Everywhere
Rate Cuts Required - And Discounted - Everywhere
Now, with the President giving markets the unpleasant news that a trade deal with China is not imminent, and new tariffs about to be imposed, the pressure is on the Fed to provide an offset through easier monetary policy. Some are even interpreting the timing of Trump’s latest Tariff Tweet in a Machiavellian fashion, as if he wanted to create more uncertainty to get to Fed to cut rates (and, by association, help deliver Trump’s goal of weakening the U.S. dollar). On the surface, Trump ratcheting up the trade tensions sounds like a risky economic game to play leading up to the 2020 Presidential election. Our colleagues at BCA Geopolitical Strategy, however, note that many of the leading Democratic presidential nominee contenders have themselves been pushing for a more hawkish stance on China. Trump may now feel politically emboldened to become even harder on China himself, to avoid being outflanked by the Democrats – even if it means the U.S. stock market suffers a nasty selloff as a result. Although, again, if the Fed cuts rates as a result, Trump will likely view that as a victory given his constant haranguing of Fed Chair Jay Powell over the past year. With Powell tipping his hand last week that trade uncertainty was something that could trigger additional Fed interest rate cuts, and with Trump now highly incentivized to create that uncertainty, the case for betting against the rate cuts discounted in U.S. interest rate markets has weakened – even though it is still debatable whether the U.S. economy has softened enough to justify a full-blown easing cycle. With Powell tipping his hand last week that trade uncertainty was something that could trigger additional Fed interest rate cuts, and with Trump now highly incentivized to create that uncertainty, the case for betting against the rate cuts discounted in U.S. interest rate markets has weakened Our Central Bank Monitors are now signaling a need for some easing of monetary policy in all the major developed economies, including the U.S. (Chart 4). Even though our 12-month Discounters also show that a lot of easing is already priced into Overnight Index Swap (OIS) curves in those same countries, the amount of cuts discounted is consistent with the dovish message from our Central Bank Monitors. Given the renewed trade tensions, alongside no signs of much improvement in overall global growth momentum, we are less certain at the moment that the amount of cuts discounted by markets will not be delivered. Thus, under our Golden Rule framework, a below-benchmark overall global duration stance is not warranted at this time. Therefore, this week, we are increasing our overall duration stance to neutral from below-benchmark, on a tactical basis. In our model bond portfolio on Page 10, we are implementing this view by “neutralizing” the duration exposures within each country. This is done by keeping the same total country weightings versus the benchmark index, but allocating across all maturities in line with the index weightings within each country. This adds about one-half of year of duration to the model portfolio to bring it up the same level as the benchmark index, but without altering the overall allocations to countries or spread product sectors. What To Do Beyond The Short-Term? Chart 5A Lot Of Bad News Discounted In Bond Yields
A Lot Of Bad News Discounted In Bond Yields
A Lot Of Bad News Discounted In Bond Yields
Despite the near-term concerns and volatility stemming from the increased trade tensions, we do not advocate moving to a more defensive portfolio allocation (above-benchmark duration, underweight corporate bonds) to position for a deeper global growth slowdown, for the following reasons: A lot of bad news is already discounted in global bond yields. The rally in government bond markets this year has pushed bond yields down to stretched levels using typical valuation metrics (Chart 5) like the 5-year OIS rate, 5-years forward; the term premium on 10-year yields, and market-implied inflation expectations from CPI swaps or inflation-linked bonds. Additional sustainable declines will be harder to achieve from current levels. The U.S. economy is still holding up relatively well, especially compared to other major economies. Although the U.S. manufacturing sector data has slowed, U.S. Treasury yields already are in line with the diminished readings of the ISM Manufacturing index, which is still above the 50 level signifying expanding activity (Chart 6). The non-manufacturing (services) side of the economy has not seen the same degree of slowing, while consumer confidence and retail sales have both picked up of late. Also, the mean-reverting U.S. data surprise index – which is correlated to the momentum of bond yields – is very stretched to the downside, suggesting less downside potential for Treasury yields from weak U.S. data (Chart 7). Chart 6UST Yields Consistent With Slower Manufacturing
UST Yields Consistent With Slower Manufacturing
UST Yields Consistent With Slower Manufacturing
In addition, the easing of U.S. financial conditions from the 2019 rally in U.S. equity and credit markets before the past few days does suggest a rebound in U.S. growth is likely beyond the next few months. It will take much bigger market declines than seen so far, something beyond a mere “garden-variety” correction in U.S. equities, to tighten financial conditions enough to offset the prior loosening. Chart 7Treasuries Are Vulnerable To Better Data
Treasuries Are Vulnerable To Better Data
Treasuries Are Vulnerable To Better Data
Early leading indicators are flashing a future bottoming of global growth. Several of the more reliable leading economic signals, like our global LEI diffusion index and the China credit impulse, are both flashing the potential for a rebound in global growth to begin around the end of the year (Chart 8). If Chinese policymakers choose to offset the negative domestic economic impact of the new Trump tariffs with even more stimulus measures, as seems likely, then the odds of an eventual growth rebound would improve – especially if there is also a healthy dose of monetary easing from the Fed, ECB (both rate cuts and renewed asset purchases) and other major central banks. Early leading indicators are flashing a future bottoming of global growth. Summing it all up, we see the best way to protect against the risks of an even deeper near-term selloff in risk assets is to increase duration by buying liquid government bonds, rather than reduce credit exposure by selling less liquid corporate bonds. It would take signs that the improvement in leading economic indicators is reversing to justify downgrading global corporate bond exposure. We think it more likely that we’ll be reducing our recommended duration exposure back to below-benchmark sometime in the next few months. We will be watching news on global trade, China stimulus and U.S. non-manufacturing growth before making the next change to our duration call. We see the best way to protect against the risks of an even deeper near-term selloff in risk assets is to increase duration by buying liquid government bonds, rather than reduce credit exposure by selling less liquid corporate bonds. With regards to country allocation within developed market government bonds, we are choosing to stick with our current recommendations: overweight core Europe, the U.K., Japan, Australia and Spain; underweight the U.S. and Italy; and neutral Canada (Chart 9). Those allocations have served us reasonably throughout 2019, with the bulk of the overweights outperforming the Bloomberg Barclays Global Treasury index in hedged USD terms, and the U.S. actually only just matching the global hedged benchmark (thanks to the yield pickup for non-U.S. debt from hedging currency exposure back to higher-yielding U.S. dollars). Chart 8A Light At The End Of The Tunnel?
A Light At The End Of The Tunnel?
A Light At The End Of The Tunnel?
Chart 9We're Sticking With Our Country Allocations
We're Sticking With Our Country Allocations
We're Sticking With Our Country Allocations
Only in the case of Italy, were we have maintained an underweight stance given our concerns about weak Italian growth and the implications for debt sustainability, have we seen a significant underperformance of our recommendation. At current yield/spread levels, however, we remain reluctant to simply chase higher-yielding Italian bond yields in the absence of any sign of improving Italian growth that would justify lower Italian risk premia. Bottom Line: The escalation of the trade war has renewed investor fears that trade could create an even deeper drag on global growth, requiring a more aggressive easing of global monetary policy. Raise overall global portfolio duration to neutral on a tactical (0-3 months) basis, at least until equity markets stabilize. Maintain strategic (6-12 months) overweights to global corporate bonds, however, as global leading economic indicators are bottoming. Robert Robis, CFA, Chief Fixed Income Strategist rrobis@bcaresearch.com Footnotes 1 Please see BCA U.S. Bond Strategy Special Report, “The Golden Rule Of Bond Investing”, dated July 24, 2018, available at usbs.bcaresearch.com. Recommendations The GFIS Recommended Portfolio Vs. The Custom Benchmark Index
Trade War Worries: Once More, With Feeling
Trade War Worries: Once More, With Feeling
Duration Regional Allocation Spread Product Tactical Trades Yields & Returns Global Bond Yields Historical Returns