Global
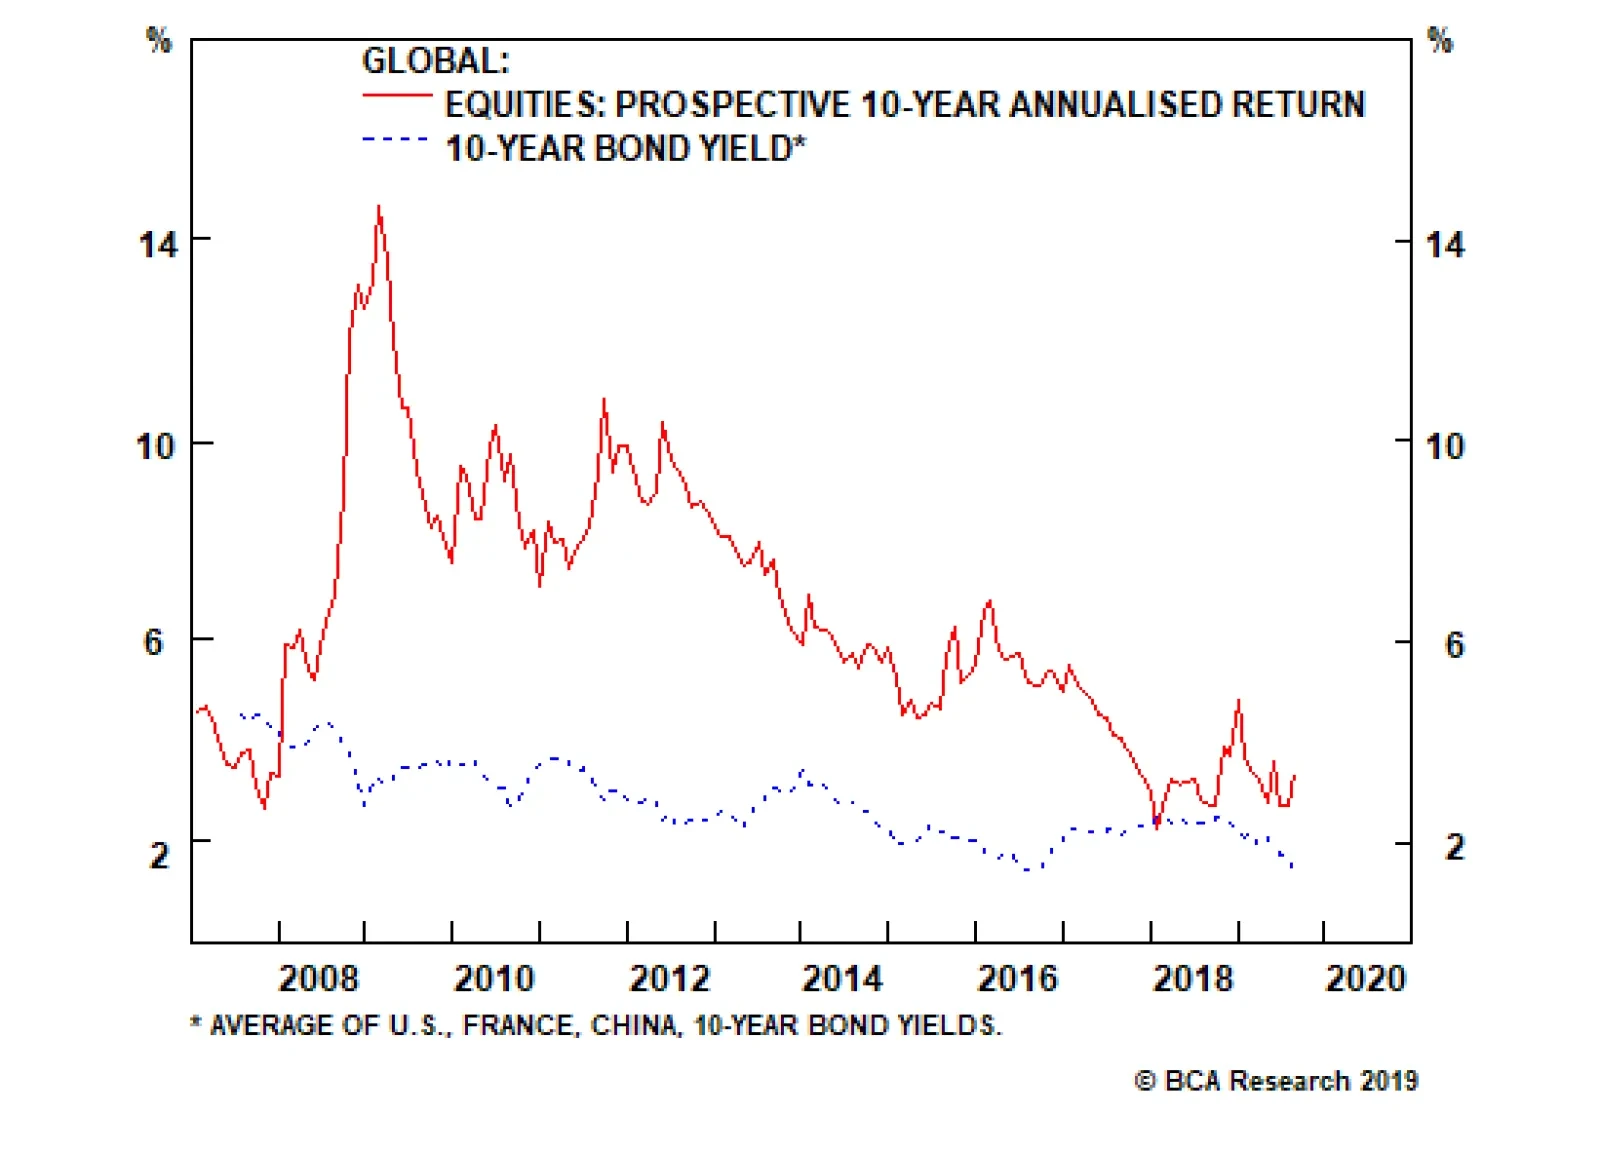
According to our European Investment Strategy team, the prospective 10-year return from equities is an annualized 3 percent, 1.6 percent more than that from bonds. Is the equity risk premium large enough? Yes, because at ultra-low bond yields, the risk of…
In our balances estimates, we show OPEC producing 29.8mm b/d of crude oil on average this year, and 29.7mm b/d next year. This is down sharply from the 32mm b/d we estimate the Cartel produced last year, which included a surge in 2H18 undertaken in response…
For 2019, a grouping of negative demand-side effects have proven to be strong – uncertainty spawned by the Sino-U.S. trade-war, tightening financial conditions globally, and the strong USD. As a result, we have been forced to lower our growth expectation for…

Highlights Portfolio Strategy The sustained global growth slowdown, widening junk spreads, along with the risk of a U.S. recession becoming a self-fulfilling prophecy suggest that caution is still warranted in the broad equity market on a 3-12 month time horizon. Weakening consumer sentiment, softening hotel industry operating metrics that point to a margin squeeze, anemic relative outlays on lodging and a decelerating ISM non-manufacturing index, all signal that more pain lies ahead for the S&P hotels, resorts & cruise lines index. Waning industry operating metrics, a bearish signal from our EPS growth model along with the mighty U.S. dollar warns against bottom fishing in the S&P electrical components & equipment (EC&E) index. Recent Changes There are no changes to the portfolio this week. Table 1
Elusive Growth
Elusive Growth
Feature The S&P 500 traded in an uncharacteristically tight range last week before falling apart on Friday on the back of a re-escalation in the U.S./China trade war. Worries of recession also resurfaced. Not only did the MARKIT flash manufacturing PMI break below the 50 expansion/contraction line, but it also pulled down the MARKIT flash services PMI survey that barely held above the boom/bust line. Adding insult to injury, the 10/2 yield curve slope inverted anew last week further fanning these recession fears. Worrisomely, consumer sentiment took a hit recently according to the University of Michigan survey (top panel, Chart 1). Importantly, what caught our attention was the following commentary: “The main takeaway for consumers from the first cut in interest rates in a decade was to increase apprehensions about a possible recession. Consumers concluded, following the Fed’s lead, that they may need to reduce spending in anticipation of a potential recession.” While the consumer is the last and most significant pillar standing for the U.S. economy, reflexivity may spoil the party and a recession may become a self-fulfilling prophecy. This is the message the bond market is sending and it is warning that the path of least resistance is a lot lower for stocks (bottom panel, Chart 1). Chart 1“The First Cut Is The Deepest”
“The First Cut Is The Deepest”
“The First Cut Is The Deepest”
Economists are also downgrading their U.S. real GDP growth estimates and that forecast now stands at 2.3% for the current year according to Bloomberg. While the recession alarm bells are not sounding off, these downward revisions bode ill for stocks (Chart 2) Chart 2Watch Out Down Below
Watch Out Down Below
Watch Out Down Below
Moving to another part of the fixed income market, stress is slowly building in the high yield market especially given the recent tick up in bankruptcies and the blind sides that cove-lite loans now pose to bond investors. As a reminder, the U.S. high yield option adjusted spread (OAS) troughed last September and continues to emit a distress signal for the broad equity market (junk OAS shown inverted, top panel, Chart 3). Chart 3Mind The Gaps
Mind The Gaps
Mind The Gaps
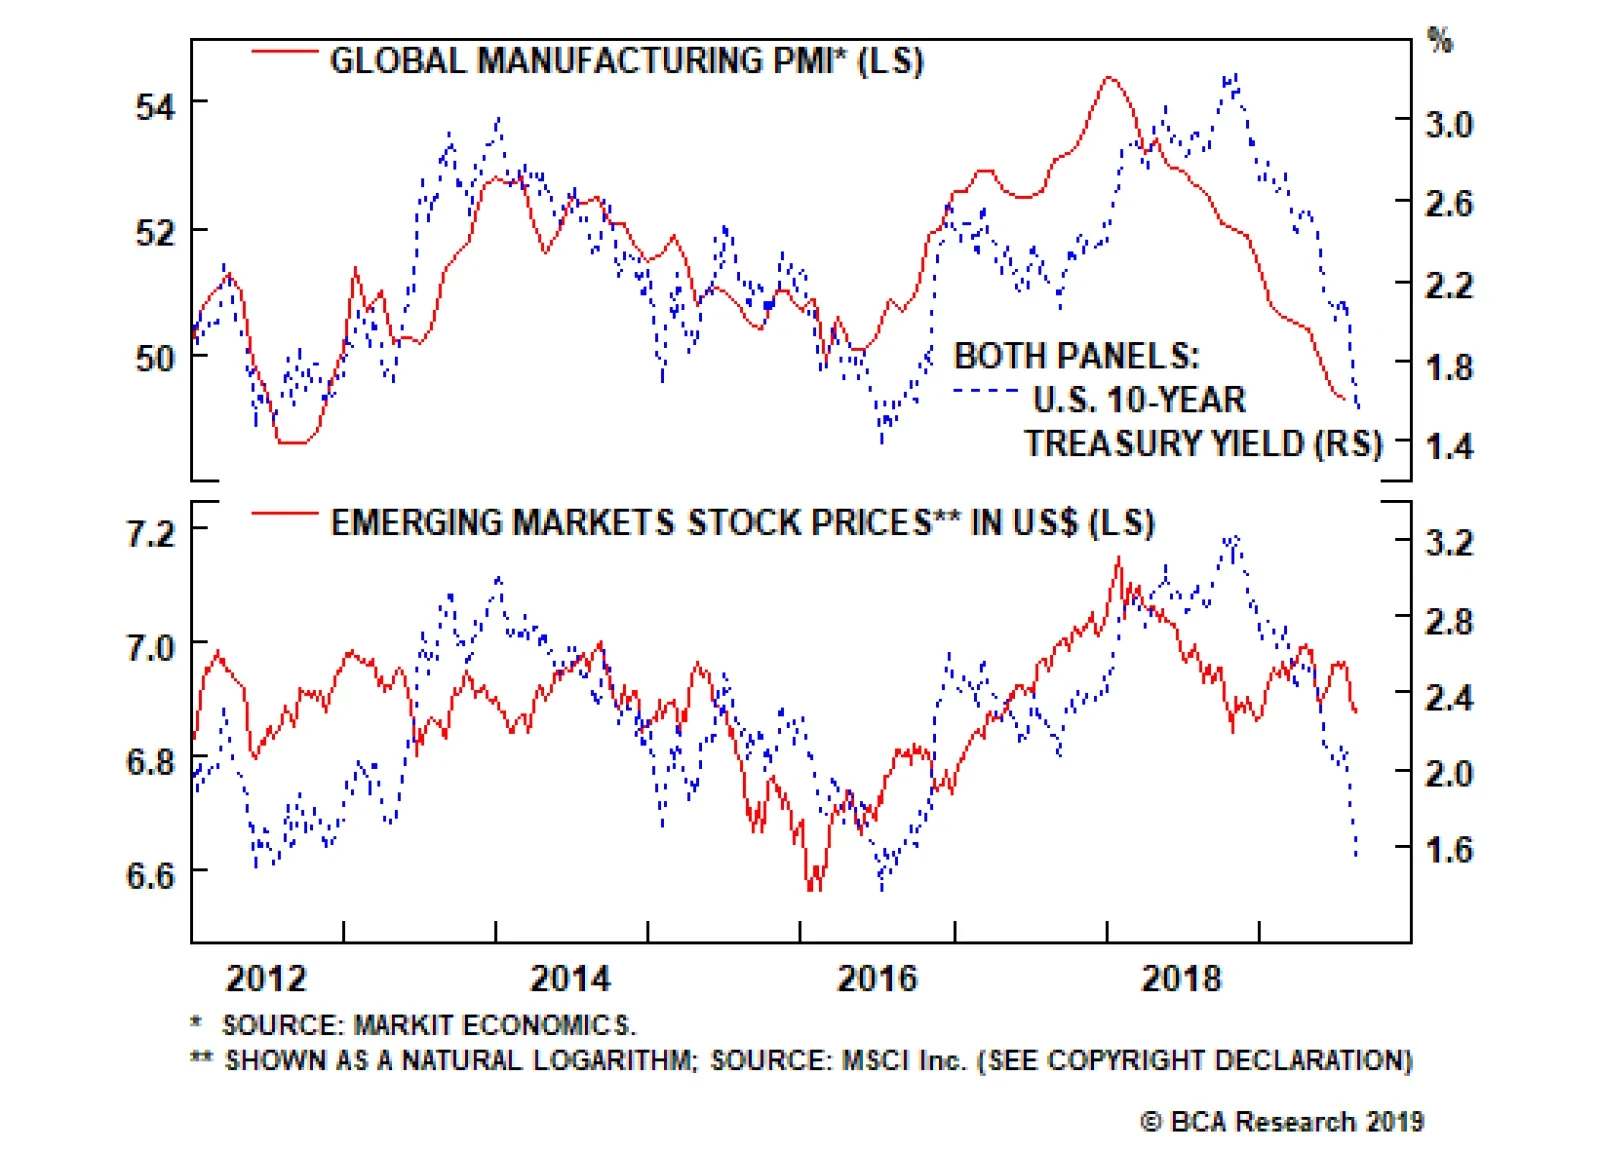
With regard to global growth, it is still missing in action, and given that Dr. Copper is on the verge of a breakdown, a global growth recovery is a Q1/2020 story at the earliest. This week we update a consumer discretionary subindex and also highlight an industrials sector subgroup. Chart 4SPX: The Next Shoe To Drop?
SPX: The Next Shoe To Drop?
SPX: The Next Shoe To Drop?
Chart 5Risk To View
Risk To View
Risk To View
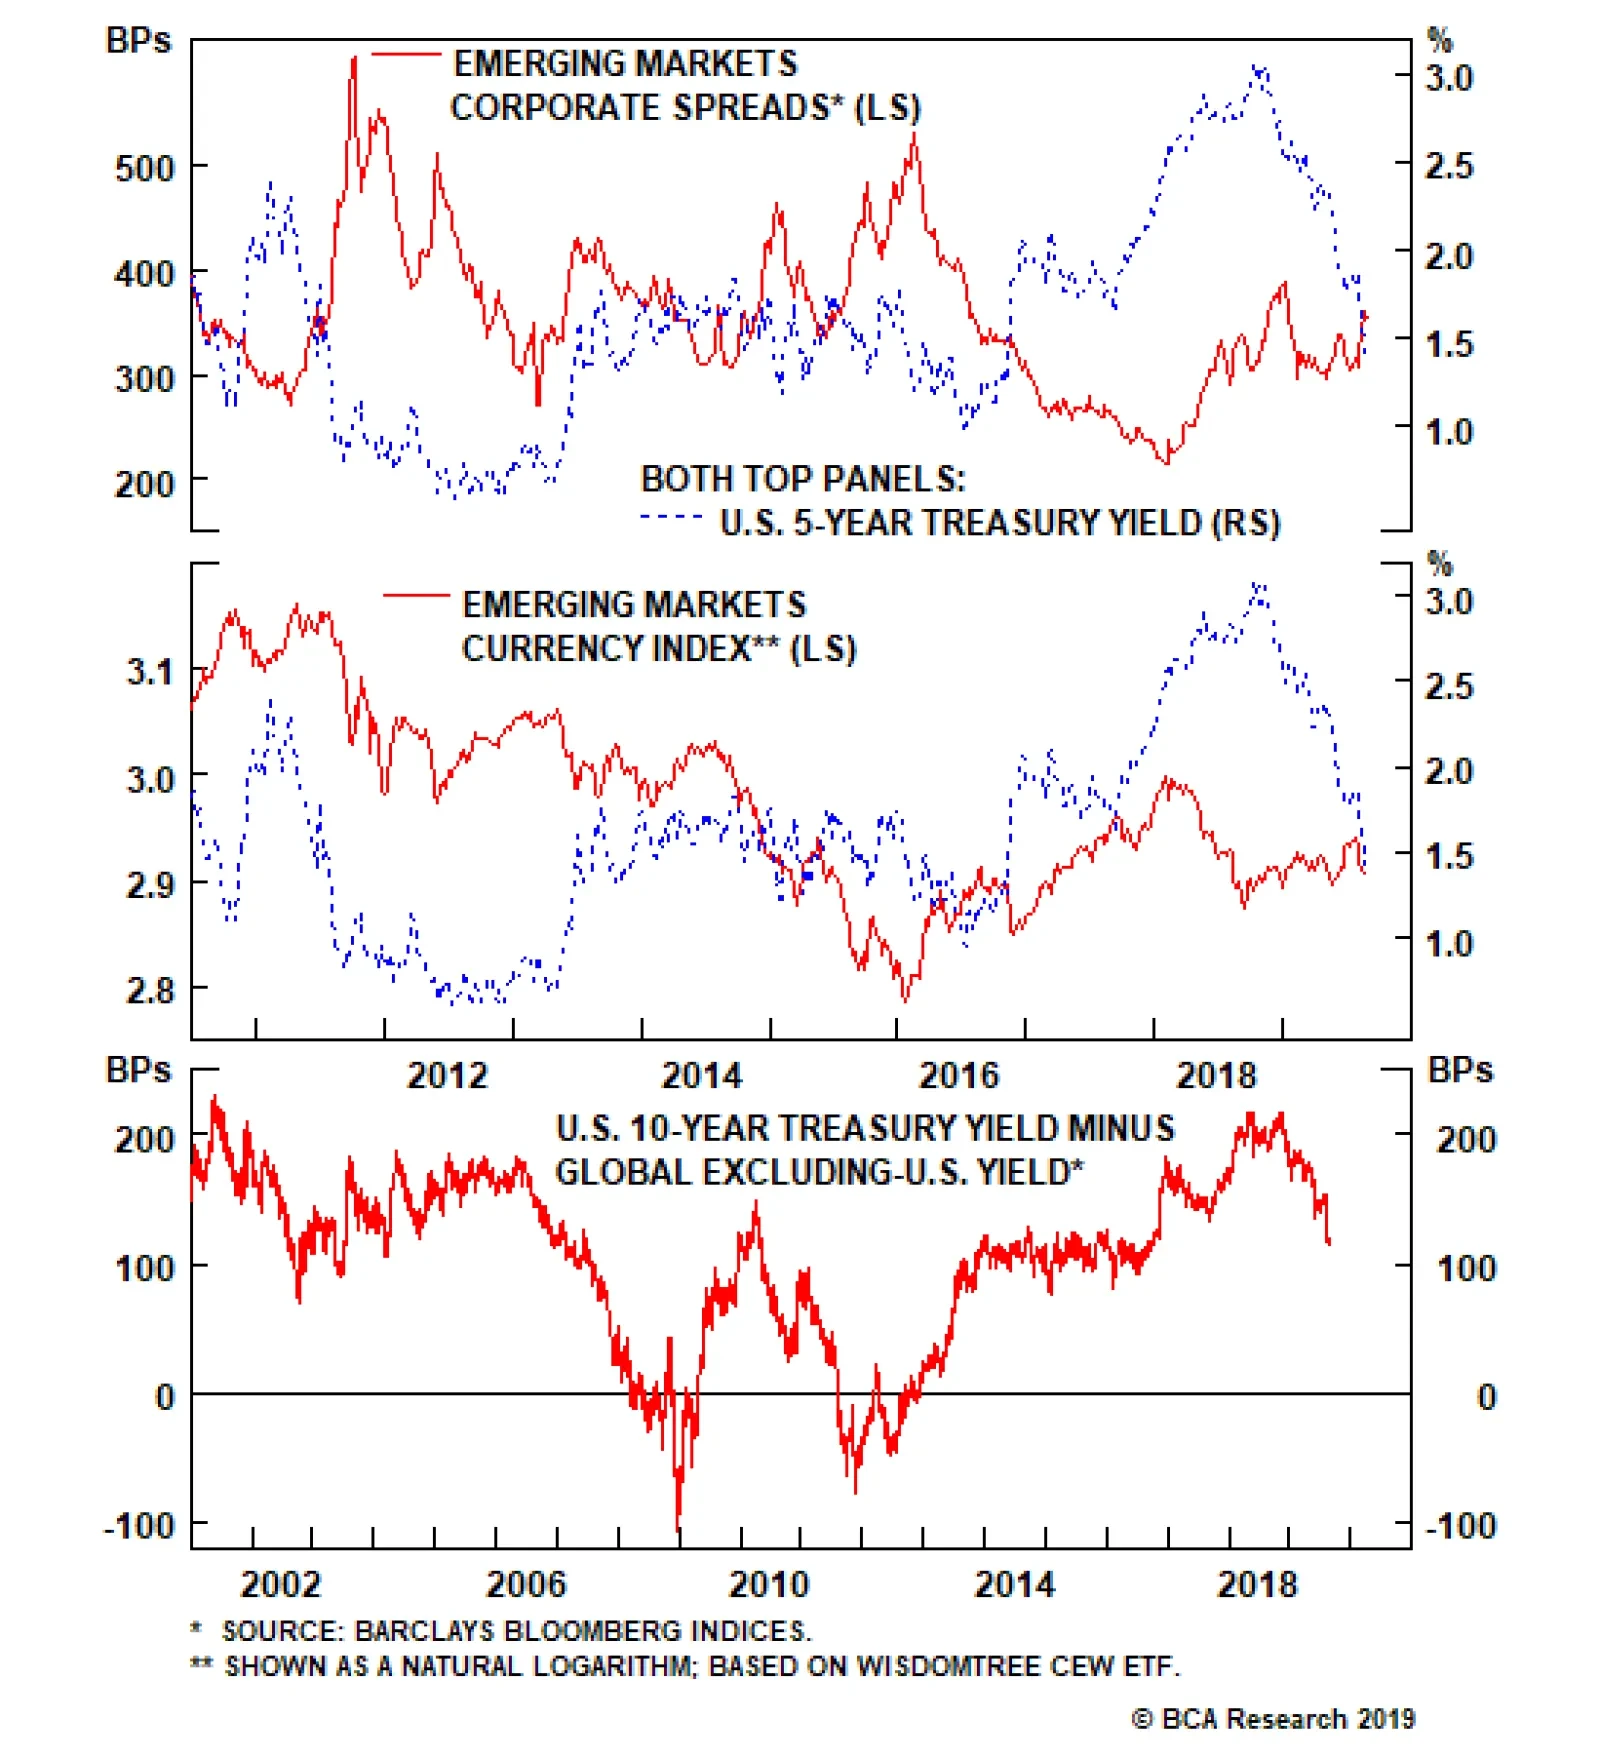
Other financial market variables concur that global growth is elusive. J.P. Morgan’s EM FX index has broken down and EM equities are also hanging from a thread. The EM high yield OAS has broken out signaling that the risk off phase has yet to fully run its course (EM junk OAS shown inverted, bottom panel, Chart 4). Finally, there is a short-term risk to our cautious equity market view. Indiscriminate buying in U.S. Treasurys has now pushed the 10-year yield down almost 180bps from last November’s peak deeply in overvalued territory. While such a move is not unprecedented, buying may be exhausted and in need of at least a short-term breather (Chart 5). Netting it all out, the sustained global growth slowdown, widening junk spreads, along with the risk of a U.S. recession becoming a self-fulfilling prophecy suggest that caution is still warranted in the broad equity market on a 3-12 month time horizon. As a reminder, this is U.S. Equity Strategy’s view, which contrasts BCA’s sanguine equity market house view. This week we update a consumer discretionary subindex and also highlight an industrials sector subgroup. Empty Spaces When the consumer is worried about a possible recession as the latest survey revealed, the knee jerk reaction is to tighten the purse strings and marginally retrench. The latest University of Michigan consumer sentiment survey made for grim reading and such souring in confidence will continue to weigh on lodging equities (Chart 6). As a result, we remain underweight the niche S&P hotels, resorts & cruise lines consumer discretionary subgroup. When the consumer is worried about a possible recession as the latest survey revealed, the knee jerk reaction is to tighten the purse strings and marginally retrench. Chart 6Stay Checked Out Of Hotels
Stay Checked Out Of Hotels
Stay Checked Out Of Hotels
Already discretionary retail sales have taken the back seat and non-discretionary retail sales are in the driver’s seat. In fact, the top panel of Chart 7 shows that the relative retail sales backdrop has plunged to levels last seen during the GFC, warning that relative share prices have ample room to fall. Drilling deeper in the consumption data is instructive. Lodging outlays are decelerating and are also trailing overall PCE. The implication is that relative profits will likely underwhelm sustaining the 18-month long de-rating phase (middle & bottom panels, Chart 7). On the operating front the news is equally dour. While selling prices are expanding, the relentless construction binge will lead to a mean reversion sooner rather than later (bottom panel, Chart 8). Chart 7De-rating Phase To Gain Steam
De-rating Phase To Gain Steam
De-rating Phase To Gain Steam
Chart 8Margin Squeeze Looming
Margin Squeeze Looming
Margin Squeeze Looming
Tack on the ongoing assault from the new sharing economy unicorns like Airbnb, and industry pricing power will remain in check in coming quarters. Similarly, the ISM non-manufacturing price subcomponent is warning that a deflation scare is looming in the lodging industry (second panel, Chart 8). Not only are selling prices under attack, but also labor-related input costs are on fire. The sector’s wage inflation is climbing at a 3.9%/annum pace or roughly 120bps higher that the overall employment cost index (third panel, Chart 8). Taken together, there are high odds that a profit margin squeeze will weigh on profits and on relative share prices (top panel, Chart 8). Importantly, the overall ISM services survey best encapsulates the bearish backdrop of the S&P hotels, resorts & cruise lines index. Historically, relative share prices have been moving in tandem with the ISM non-manufacturing survey and the current message is that selling pressures on relative share prices will persist in the coming months (Chart 9). Chart 9Heed The Message From The ISM Services Survey
Heed The Message From The ISM Services Survey
Heed The Message From The ISM Services Survey
In sum, weakening consumer sentiment, softening hotel industry operating metrics that point to a margin squeeze, anemic relative outlays on lodging and a decelerating ISM non-manufacturing index signal that more pain lies ahead for the S&P hotels, resorts & cruise lines index. Bottom Line: Continue to avoid the S&P hotels, resorts & cruise lines index. The ticker symbols for the stocks in this index are: BLBG: S5HOTL – MAR, HLT, RCL, CCL, NCLH. Short Circuited The S&P EC&E index broke down recently (top panel, Chart 10) and we reiterate our underweight recommendation in this industrials sector subgroup. While it is tempting to bottom fish here especially given oversold technical and bombed out valuations (bottom panel, Chart 11), a number of the indicators we track suggest that more losses are around the corner. Chart 10Sell The Weakness
Sell The Weakness
Sell The Weakness
Chart 11Good Reasons For Valuation Discount
Good Reasons For Valuation Discount
Good Reasons For Valuation Discount
First the trade-weighted dollar has broken out to fresh cyclical highs despite the collapse in the 10-year yield. Historically, relative share prices and the greenback are tightly inversely correlated and the current weak global growth message the U.S. dollar is emitting is bearish for the S&P EC&E index (U.S. dollar shown inverted, middle panel, Chart 10). This global growth soft patch is not only negative for new orders owing to deficient foreign demand, but the appreciating currency also makes EC&E exports less competitive in the global market place (U.S. dollar shown inverted, bottom panel, Chart 10). Second, while industry new orders have been resilient, the massive inventory buildup dwarfs new order growth and warns that a deflationary liquidation phase is looming (middle panel, Chart 11). In fact, the recent drubbing in the ISM manufacturing prices paid subcomponent portends a deflationary industry phase (third panel, Chart 12). Adding it all up, waning industry operating metrics, a bearish signal from our EPS growth model along with the mighty U.S. dollar warns against bottom fishing in the S&P EC&E index. Other operating metrics are also warning that EC&E profits will underwhelm. Industry weekly hours worked have plunged and sell-side analysts have been aggressively cutting EPS estimates (bottom panel, Chart 13). On the productivity front, executives have not adjusted labor cost structures to lower running rates yet (second panel, Chart 13) and, thus, our EC&E productivity gauge (industrials production versus employment) is contracting which bodes ill for industry earnings (third panel, Chart 13). Chart 12Weak Profit Backdrop
Weak Profit Backdrop
Weak Profit Backdrop
Chart 13Deteriorating Operating Metrics
Deteriorating Operating Metrics
Deteriorating Operating Metrics
Finally, our S&P EC&E EPS growth model does an excellent job in encapsulating all these moving parts and is signaling that the path of least resistance is lower for EPS growth in the coming months (bottom panel, Chart 12). Adding it all up, waning industry operating metrics, a bearish signal from our EPS growth model along with the mighty U.S. dollar warns against bottom fishing in the S&P EC&E index. Bottom Line: Stay underweight the S&P EC&E index. BLBG: S5ELCO – AME, EMR, ETN, ROK. Anastasios Avgeriou, U.S. Equity Strategist anastasios@bcaresearch.com Current Recommendations Current Trades Size And Style Views Favor value over growth Favor large over small caps
Highlights The plunge in government bond yields means that There Is No Alternative to stocks: TINA. As long as bond yields stay reasonably low, stocks will continue to climb the proverbial wall of worry. Global equities are quite cheap compared with bonds. This suggests that stock market returns could be quite strong over the next couple of years, as PE multiples rise in order to narrow the gap between bond yields and earnings yields. While cheap in relative terms, global equities are modestly expensive in absolute terms. Thus, long-term absolute stock market returns are likely to be subpar, even if they are reasonably high in the near term. U.S. stocks are noticeably more expensive than their overseas peers. Differences in sector composition can explain some of the valuation gap, but not all of it. We intend to upgrade EM and European stocks later this year once global growth begins to reaccelerate. Feature Falling Bond Yields Have Made Stocks More Attractive After peaking last year, global bond yields have plunged anew (Chart 1). To a large extent, the decline in yields has been driven by the slowdown in global growth. Chart 2 shows that there is a strong correlation between government bond yields and manufacturing purchasing manager indices. Chart 1Global Bond Yields Sinking
Global Bond Yields Sinking
Global Bond Yields Sinking
Chart 2The Decline In Bond Yields Driven By Slower Global Growth
The Decline In Bond Yields Driven By Slower Global Growth
The Decline In Bond Yields Driven By Slower Global Growth
Chart 3Dividend Yields Are Higher Than Bond Yields Globally
Dividend Yields Are Higher Than Bond Yields Globally
Dividend Yields Are Higher Than Bond Yields Globally
As we discussed last week, global growth should stabilize and recover over the remainder of the year, which will cause bond yields to move somewhat higher. Nevertheless, yields are poised to stay low by historic standards – at least until inflation picks up significantly, which is unlikely to occur during the next 12 months. The fact that government bond yields in many countries are negative in real terms – and indeed, negative in nominal terms in Japan and across much of Europe – implies that the only way investors can hope to generate decent returns is by taking on more risk. This means moving further down the quality ladder in the fixed-income space, as well as turning to historically riskier asset classes such as equities. The allure that equities have in today’s low rate environment even has a name: TINA – There Is No Alternative. The S&P 500 dividend yield is currently 1.98%, 37 bps above the yield on 10-year Treasury notes. To put things in perspective, even if S&P 500 companies did not increase cash dividends at all for the next ten years, the real value of the index would still have to fall by 26% (assuming 2% inflation) for bonds to outperform stocks. The gap between dividend yields and bond yields is even greater abroad (Chart 3). TINA’s Critics That may seem like a very low bar for success, but there are plenty of prognosticators who think stocks will still fail to clear it. TINA’s detractors offer two arguments to justify their skepticism: Today’s low interest rates are simply a reflection of poor economic growth prospects. Even if one believed that lower interest rates warrant higher equity multiples, the stock market has already priced that in. John Hussman eloquently summarized these arguments in a recent report: Another danger for investors here is the willingness to accept offensively speculative valuations on the argument that bond yields are low. The empirical fact is that bond yields are tightly correlated with nominal GDP growth. But as one can demonstrate using any discounted cash flow model, if interest rates are low because growth rates are also low, no valuation premium is “justified” by the low interest rates at all. Long-term returns will already be lower, commensurate with the lower interest rates, by virtue of the lower growth rate itself. A valuation premium then just adds insult to injury. – John Hussman, “Questions we hear a lot,” Hussman Market Comment, (January 2019). John Hussman is a perspicuous market observer, but there are two flaws in his logic here. The first one is factual. Despite his claim to the contrary, U.S. bond yields have actually fallen more than trend nominal GDP growth over the past decade (Chart 4). The current gap between U.S. potential nominal GDP growth, as estimated by the Congressional Budget Office, and the 10-year Treasury yield is over two percentage points, the highest since 1979. Chart 4Bond Yields Have Fallen More Than Trend Nominal GDP Growth
Bond Yields Have Fallen More Than Trend Nominal GDP Growth
Bond Yields Have Fallen More Than Trend Nominal GDP Growth
Chart 5The Trend In Global Growth Has Remained Steady Thanks To Faster-Growing EM
The Trend In Global Growth Has Remained Steady Thanks To Faster-Growing EM
The Trend In Global Growth Has Remained Steady Thanks To Faster-Growing EM
Chart 6
At the global level, trend GDP growth has barely changed, largely because faster-growing emerging markets now make up a larger share of the global economy (Chart 5). For large multinational companies, global growth, rather than domestic growth, is the more relevant measure. If trend global GDP growth has not fallen, why are real interest rates so low? The answer is that the world is still awash with savings. As Chart 6 illustrates, an increase in desired savings will lead to a decline in real rates, even if underlying growth does not change. No Free Lunch The second error is more subtle. Hussman discusses earnings growth and GDP growth as though they are one in the same. However, there is no long-term mechanism that magically bestows faster earnings growth on firms just because trend economic growth accelerates. Earnings growth and GDP growth are tightly correlated over the course of a business cycle because rising demand allows firms to spread fixed costs over a larger amount of output, thus increasing so-called operational leverage. But if a firm wishes to grow earnings over the long run, it has to invest in new technology and new capacity. That takes real resources — resources that could otherwise be distributed to shareholders. An example might clarify this point. Consider two firms, each with a market value of $1 million and $100,000 in earnings. Firm A distributes all its earnings to shareholders in the form of dividends. Firm B pays no dividend. Rather, it invests all its earnings in trying to grow the business. Which firm would you rather own? There is actually no simple answer to this question. If you invest in Firm A and the share price remains unchanged because the company has done nothing to grow its business, you will still receive a 10% dividend yield. You will not receive a dividend by investing in Firm B. However, if the company is able to grow earnings by 10% and the price-earnings ratio remains unchanged, the share price will rise by 10%. In both cases, you make a 10% return. The point is that there is no free lunch. Firms in fast-growing economies will be able to avail themselves of expanding domestic markets, but they will need to spend money to grow their businesses. They are also likely to face stiffer competition from new entrants. This is a key reason why Jay Ritter and other economists have shown that there is no clear correlation between long-term economic growth and shareholder returns (Chart 7).
Chart 7
Priced For Perfection?
Chart 8
One thing that Hussman gets completely right is that absolute long-term equity returns depend on the absolute level of valuations rather than how expensive stocks are in relation to bonds. A decline in the discount rate will increase the present value of future earnings, thus leading to a temporary period of abnormally high returns. However, once equity valuations have reset to a higher level, returns will be permanently lower. In other words, falling interest rates simply shift returns from the future into the present (Chart 8). The key question for investors is where we are in this process. If stock valuations have yet to fully adjust to the decline in interest rates, near-term returns could still be quite strong, even if they do come at the expense of subsequent returns. There is good reason to think this adjustment has yet to play out fully. The forward PE ratio for U.S. stocks is currently 16.5. If one were to use the earnings yield as a proxy for expected returns (see Appendix A for details), one would expect U.S. equities to generate long-term annualized real total returns of 6.1%. Outside the U.S., the forward PE ratio stands at 12.7, implying an expected return of 7.8% (Chart 9).
Chart 9
Chart 10 shows that the equity risk premium in the U.S. based on the forward PE ratio remains quite high, indicating that the earnings yield has not fallen as much as one would have expected based on the decline in real bond yields. The equity risk premium is even higher outside the U.S., reflecting both the fact that valuations are cheaper abroad and interest rates are generally lower. Chart 10AEquity Risk Premia Remain Quite High (I)
Equity Risk Premia Remain Quite High (I)
Equity Risk Premia Remain Quite High (I)
Chart 10BEquity Risk Premia Remain Quite High (II)
Equity Risk Premia Remain Quite High (II)
Equity Risk Premia Remain Quite High (II)
Are PE Ratios Biased Down? One legitimate criticism of the forward PE ratio is that it relies on analyst earnings estimates, which tend to be too optimistic. That analysts tend to be too bullish is undeniable (Chart 11). However, even if one were to use the trailing PE ratio, the implied long-term expected real total return would still be 4.8% in the U.S. and 7.1% abroad. Chart 11Analysts Are Usually Too Optimistic
Analysts Are Usually Too Optimistic
Analysts Are Usually Too Optimistic
Moreover, as Chart 12 illustrates, projected 12-month earnings growth is currently below its historic average both in the U.S. and abroad. Thus, to the extent that forward PE ratios are biased downwards, that bias is arguably smaller than in the past. Chart 12Earnings Growth Estimates Are Not Excessive Today
Earnings Growth Estimates Are Not Excessive Today
Earnings Growth Estimates Are Not Excessive Today
Chart 13Cyclically-Adjusted PEs Point To Subpar Absolute Future Returns
Cyclically-Adjusted PEs Point To Subpar Absolute Future Returns
Cyclically-Adjusted PEs Point To Subpar Absolute Future Returns
A further criticism of both trailing and forward PE ratios is that they do not take into account cyclical factors that could either flatter or depress earnings. For example, if profit margins are temporarily inflated, standard PE ratios will tend to show that stocks are cheaper than they really are. One way to address this issue is to use a moving average for earnings. The most popular tool for doing so is the Shiller PE ratio (also known as the cyclically-adjusted PE ratio, or CAPE). It divides the value of today’s stock market index by the average of real earnings over the past ten years. The Shiller PE ratio currently points to below-average, but still positive, real returns for stocks over the coming years (Chart 13). S&P 500 Margins Versus Economy-Wide Margins Some stock market bears charge that the Shiller PE ratio does not go far enough in eliminating the upward bias to earnings. They point out that even though S&P 500 profit margins were very depressed following the Global Financial Crisis, the 10-year average of margins is now well above its historic norm (Chart 14). Chart 14U.S.: 10-Year Average Of Margins Is Now Well Above Its Historic Norm
U.S.: 10-Year Average Of Margins Is Now Well Above Its Historic Norm
U.S.: 10-Year Average Of Margins Is Now Well Above Its Historic Norm
John Hussman’s preferred measure, the Margin-Adjusted PE ratio, tries to control for this alleged problem by adjusting earnings using the economy-wide profit-to-GDP ratio. It suggests that future returns will be lower than those implied by the Shiller PE ratio. The problem with Hussman’s approach is that S&P 500 profits have increasingly become disconnected from economy-wide profits. Chart 15 shows that pre-tax profits have trended lower as a share of GDP in recent years, a move that has been mirrored in the rise in employee compensation. However, no such decline has occurred for S&P 500 profits. Chart 15The Recent Decline In U.S. Pre-Tax Profits Has Been Mirrored In The Rise In Employee Compensation
The Recent Decline In U.S. Pre-Tax Profits Has Been Mirrored In The Rise In Employee Compensation
The Recent Decline In U.S. Pre-Tax Profits Has Been Mirrored In The Rise In Employee Compensation
Chart 16S&P 500: All Of The Increase In Margins Has Occurred In The IT Sector
S&P 500: All Of The Increase In Margins Has Occurred In The IT Sector
S&P 500: All Of The Increase In Margins Has Occurred In The IT Sector
S&P 500 margins have stayed elevated partly because U.S. multinationals are less exposed to domestic wage pressures. Margins have also been propped up by the fact that the largest companies in the index increasingly operate like natural monopolies. It is perhaps no surprise that all of the increase in S&P 500 margins over the past few decades has been due to soaring profits in the IT sector (Chart 16). If this represents a true structural change, S&P margins could remain high by historic standards. Investment Implications Different valuation measures can generate different results. As such, we would not get too hung up on the precise expected return forecast that any one particular valuation indicator produces. Appendix B shows long-term return projections for various stock markets using a composite valuation measure based on price-to-trailing earnings, price-to-forward earnings, price-to-cash flow, price-to-sales, price-to-book, Tobin’s Q, stock market capitalization-to-GDP, and dividend yield.
Chart 17
Three broad conclusions stand out: First, global equities are quite cheap compared with bonds. This suggests that stock market returns could be quite strong over the next couple of years, as PE multiples rise in order to narrow the gap between bond yields and earnings yields. We recommend that asset allocators overweight stocks relative to government bonds on a 12-to-18 month horizon. Second, global equities are modestly expensive in absolute terms. Thus, long-term stock market returns are likely to be subpar, even if they are reasonably high in the near term. Put differently, while equities will trump bonds over the long haul, both asset classes will deliver uninspiring absolute returns compared with their long-term history. Third, U.S. stocks are noticeably more expensive than their overseas peers. Differences in sector composition can explain some of the valuation gap, but not all of it. As Chart 17 illustrates, if one were to calculate the forward PE of say, European stocks, using U.S. sector weights, the former would still be significantly cheaper than the latter. We intend to upgrade EM and European stocks later this year once global growth begins to reaccelerate. APPENDIX A The Earnings Yield As A Proxy For Expected Shareholder Returns
Chart 18
APPENDIX B CHART 1 Equities: Composite Valuation Indicators Versus Subsequent 10-Year Real Annualized Returns
Chart 19
Peter Berezin, Chief Global Strategist Global Investment Strategy peterb@bcaresearch.com MacroQuant Model And Current Subjective Scores
Chart 20
This weekend, the G7 meets in the South West of France. Recent tensions between the U.S, Europe and the U.K. means that little positives are likely to come out of the meeting. Furthermore, no joint communiqué will be released, which paints a picture of…
The latest plunge in EM currencies and the widening in EM credit spreads have occurred amid falling U.S. bond yields and a Fed easing. EM equities, credit markets and currencies are much more sensitive to the global business cycle than to U.S.…
With respect to ultra-low bond yield, investors and commentators generally subscribe to one of the following two arguments: Bond yields are reflective – i.e. they are indicative of an upcoming economic calamity and thereby signal a bearish outlook for…
Hard-to-predict policy risks and trade-war uncertainty will continue to hinder oil-demand growth, as will USD strength. The cost of oil in local-currency terms remains close to highs not seen since Brent and WTI traded above $100/bbl in 2014 in key EM economies, which partly explains the fall-off in demand begun in 2H18 that carried into 1H19 (Chart of the Week). We continue to expect oil demand to revive on the back of global fiscal and monetary stimulus, which, along with continued production discipline by OPEC 2.0 and capital discipline by U.S. shale producers, keeps our 2020 Brent forecast at $75/bbl. For 2019, however, our Brent forecast falls to $66/bbl from $70/bbl, following a re-basing of estimated demand in 2017-18 to bring it in line with lower historical data, and the lingering impact of a stronger USD.1 We also are revising our WTI expectation, as markets price in the last bits of ~ 2mm b/d of new pipeline takeaway capacity coming online in the Permian Basin. For 2019, we expect WTI to trade $6.50/bbl under Brent, and $4/bbl under next year, vs. $7/bbl and $5/bbl we expected last month. Chart of the WeekUSD Strength Hinders Oil-Demand Rebound
USD Strength Hinders Oil-Demand Rebound
USD Strength Hinders Oil-Demand Rebound
Highlights Energy: Overweight. Distillate fuel accounted for 29.6% of the product derived from refining crude oil in the U.S. during July, a record for the month, according to the Energy Information Administration (EIA). Refiners are gearing up for the global change-over to low-sulfur marine fuels ahead of the January 1, 2020, implementation of IMO 2020. Base Metals: Neutral. Increased infrastructure spending will add ~ $2 billion (14 billion RMB) to China’s total infrastructure spending of 524 billion RMB, according to a Fastmarkets MB analyst survey. Copper usage is expected to increase as 2H19 grid spending picks up. Precious Metals: Neutral. Gold and silver continue to mark time close to recent highs. USD strength could slow the metals’ rally. We remain long both metals as portfolio hedges. Ags/Softs: Underweight. This week’s USDA’s Crop Progress report showed 56% of the corn crop was in good or excellent condition, vs. 68% in 2018. For beans, 53% of the crop is in good or excellent condition, vs. 65% last year. Feature We expect global fiscal and monetary stimulus to lift demand in EM economies, which will be visible over the balance of this year and next. In this month’s assessment of supply-demand balances, we are lowering our 2019 Brent forecast to $66/bbl from $70/bbl, after re-basing our demand estimates so that they are more in line with EIA’s historical data (Chart 2). We lowered our historical demand estimates up to and including 2017, in line with the EIA data. This reduces the base level for 2018-20 demand. As a result, the level of our 2018 demand is down by 200k b/d to 100.1mm b/d, vs. last month’s estimate, and the level of our 2019 and 2020 demand estimates is down by 250k b/d to 101.3mm b/d and to 102.8mm b/d. The adjustments are mainly due to the revision of historical level of demand in 2017-2018. In addition, we lowered our growth estimate for 2019 slightly to 1.2mm b/d from 1.25mm b/d last month, but kept our 2020 growth rate expectation at 1.5mm b/d. Chart 2Lower 2019 Demand Estimate, Price; Keeping 2020 Unchanged
Lower 2019 Demand Estimate, Price; Keeping 2020 Unchanged
Lower 2019 Demand Estimate, Price; Keeping 2020 Unchanged
As noted above, we expect global fiscal and monetary stimulus to lift demand in EM economies, which will be visible over the balance of this year and next. Continued production discipline by OPEC 2.0 and capital discipline by U.S. shale producers leaves our 2020 Brent forecast unchanged at $75/bbl. In addition, this combination of stronger demand and tighter supply will create a physical supply deficit (Chart 3). This deficit will force inventories lower, which remains OPEC 2.0’s paramount goal, and backwardate the Brent and WTI forward curves (Chart 4). Chart 3Stronger Demand, Tighter Supply Produces Physical Deficit
Stronger Demand, Tighter Supply Produces Physical Deficit
Stronger Demand, Tighter Supply Produces Physical Deficit
Chart 4Inventory Draws Will Resume
Inventory Draws Will Resume
Inventory Draws Will Resume
For WTI, we now expect it to trade $6.50/bbl under Brent in 2019 and $4/bbl under in 2020, vs. the $7/bbl and $5/bbl differentials we expected last month. This narrowing of the differential comes on the back of the build-out of takeaway pipeline capacity in the Permian Basin, which amounts to ~ 2mm b/d by the end of this year. The expansion of deep-water harbor capacity in the U.S. Gulf is being delayed by regulatory action, which means the Brent vs. WTI differential will not significantly contract further until later in 2020 or 2021 when we expect crude-oil export volumes to pick up sharply. Over the course of the coming year, we do expect exports to pick up before 2021, as they have done in 2018-2019. This trend likely continues. We calculated there is ~ 4.5 mm b/d of current export capacity in the Gulf, therefore exports still can increase before being fully constrained. In addition, small capacity expansion projects already are under construction, which will lift capacity next year. That said, any delays could pressure differentials (LLS-Brent, WTI-Brent). But, as long as shale-oil production keeps increasing and foreign demand remains strong, exports can increase – likely at a slower pace – while differentials hold around the $4/bbl level next year. Digging Into The Oil Demand Slow-Down This was a stealthy USD rally, overshadowed by the Sino-U.S. trade war, and exogenous foreign-policy shocks re U.S. Venezuela and Iran policy. For 2019, a grouping of negative demand-side effects have proven to be quite strong – uncertainty spawned by the Sino-U.S. trade-war, tightening financial conditions globally, and the strong USD. Over the past year, these effects have combined to lower actual demand, and forced us to lower our growth expectation for this year for a fourth time to 1.2mm b/d. In hindsight, it is apparent the strong USD has affected EM demand by raising the local-currency cost of oil in particular over the past year to levels not seen since crude was trading above $100/bbl in 2014 (Charts 5A and 5B). Chart 5AAs USD Strengthened Local-Currency Costs Skyrocketed
As USD Strengthened Local-Currency Costs Skyrocketed
As USD Strengthened Local-Currency Costs Skyrocketed
Chart 5BAs USD Strengthened Local-Currency Costs Skyrocketed
As USD Strengthened Local-Currency Costs Skyrocketed
As USD Strengthened Local-Currency Costs Skyrocketed
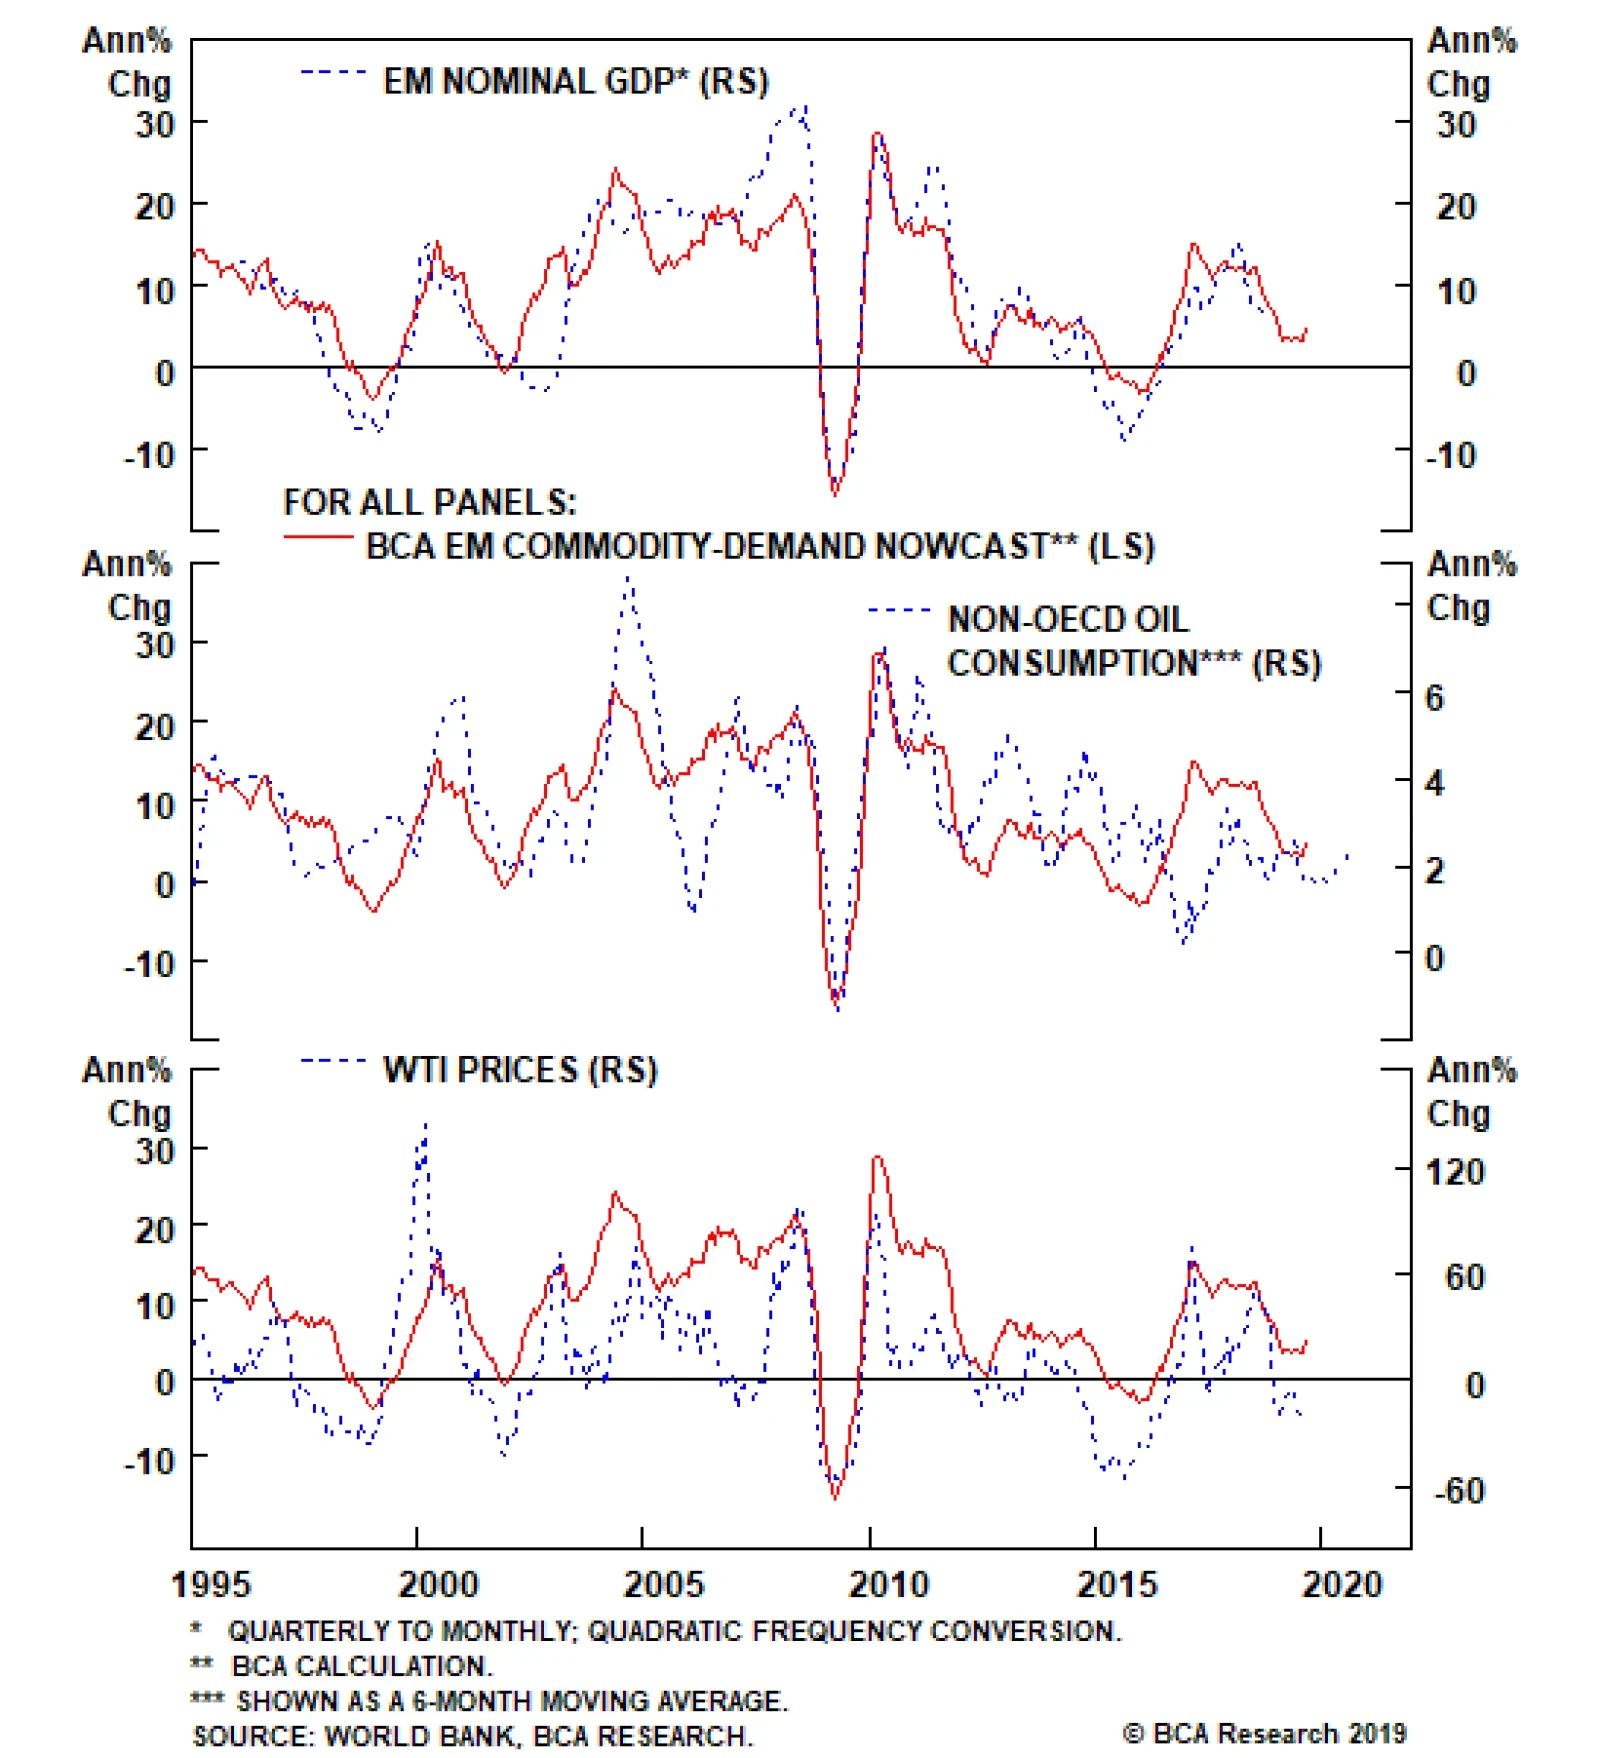
This was a stealthy USD rally, overshadowed by the Sino-U.S. trade war, and exogenous foreign-policy shocks re U.S. Venezuela and Iran policy. In addition to raising the cost of commodities priced in USD, in local-currency terms, the stronger dollar lowered the cost of producing commodities for countries like Russia, whose currencies are not pegged to the USD. So, in one fell swoop, USD strength lowered demand via higher prices, and increased supply via lower costs of production. In addition, weaker local currencies catalyze capital outflow, which reduces the supply of savings available to EM economies for investment. At the margin, this also stunts income growth.2 The effects of USD strength could persist, and continue to have a deleterious influence on oil demand into next year, given the way in which monetary policy – and its effects on FX rates – can act with “long and variable lags.” Our BCA Commodity-Demand Nowcasting model continues to point toward a revival of demand as EM economic growth picks up (Chart 6).3 Given the dollar is a counter-cyclical currency vis-à-vis the rest of the world, we expect this will weaken the USD and be supportive of commodity prices. Chart 6BCA Commodity-Demand Nowcast Remains Upbeat
BCA Commodity-Demand Nowcast Remains Upbeat
BCA Commodity-Demand Nowcast Remains Upbeat
Chart 7Expect Further Backwardation In Crude Oil Forward Curves
Expect Further Backwardation In Crude Oil Forward Curves
Expect Further Backwardation In Crude Oil Forward Curves
Higher oil demand and lower supply likely will further backwardate Brent and WTI forward curves, which will diminish the impact of the USD’s strength (Chart 7), and lead to higher volatility, as fundamentals once again dominate price formation (Chart 8). Still, the effects of USD strength could persist, and continue to have a deleterious influence on oil demand into next year, given the way in which monetary policy – and its effects on FX rates – can act with “long and variable lags," to borrow Milton Friedman's well-turned phrase.4 We will monitor this risk closely, and will be offering further research into it.
Chart 8
Supply Concerns Persist E&P companies are using their accumulated inventory of excess Drilled-but-Uncompleted (DUC) wells to reach their production targets, while controlling capital expenditures (i.e. flat/lower rig count). We continue to expect OPEC 2.0 to manage production, and to keep a laser focus on reducing inventories. The producer coalition continues to get a huge assist in this effort from the U.S. sanctions against Iran, which, according to the American Secretary of State Mike Pompeo have taken almost all of that country’s oil exports – some 2.7mm b/d – out of the market (Chart 9).5
Chart 9
In our balances estimates, we show OPEC producing 29.8mm b/d of crude oil on average this year, and 29.7mm b/d next year. This is down sharply from the 32mm b/d we estimate the Cartel produced last year, which included a surge in 2H18 undertaken in response to pressure from the U.S. to build inventories ahead of oil-export sanctions being re-imposed against Iran (Table 1). Given the lower demand estimate OPEC is forecasting for this year and next – 99.9mm b/d, and 101.1mm b/d this year and next – we expect OPEC’s leader, KSA, to keep production closer to 10mm b/d vs. its 10.33mm b/d quota. We expect the other putative leader of OPEC 2.0, Russia, to produce 11.43mm b/d and 11.41mm b/d this year and next, versus 11.4mm b/d last year. Table 1BCA Global Oil Supply - Demand Balances (MMb/d, Base Case Balances)
USD Strength Slows Oil Demand Growth; 2020 Brent Forecast Remains At $75/bbl
USD Strength Slows Oil Demand Growth; 2020 Brent Forecast Remains At $75/bbl
Once again, U.S. shale-oil output provides the largest increase in supply globally. That said, shale-oil producers are being forced to temper production growth, as investors’ demand higher profits or greater return of capital. We revised down our U.S. shale production growth to 8.2mm b/d in 2019 and 9.1mm b/d in 2020 (Chart 10). In 2018, we estimated U.S. shale production at 7.2mm b/d. Chart 10Shale Output Reduced Slightly
Shale Output Reduced Slightly
Shale Output Reduced Slightly
Chart 11
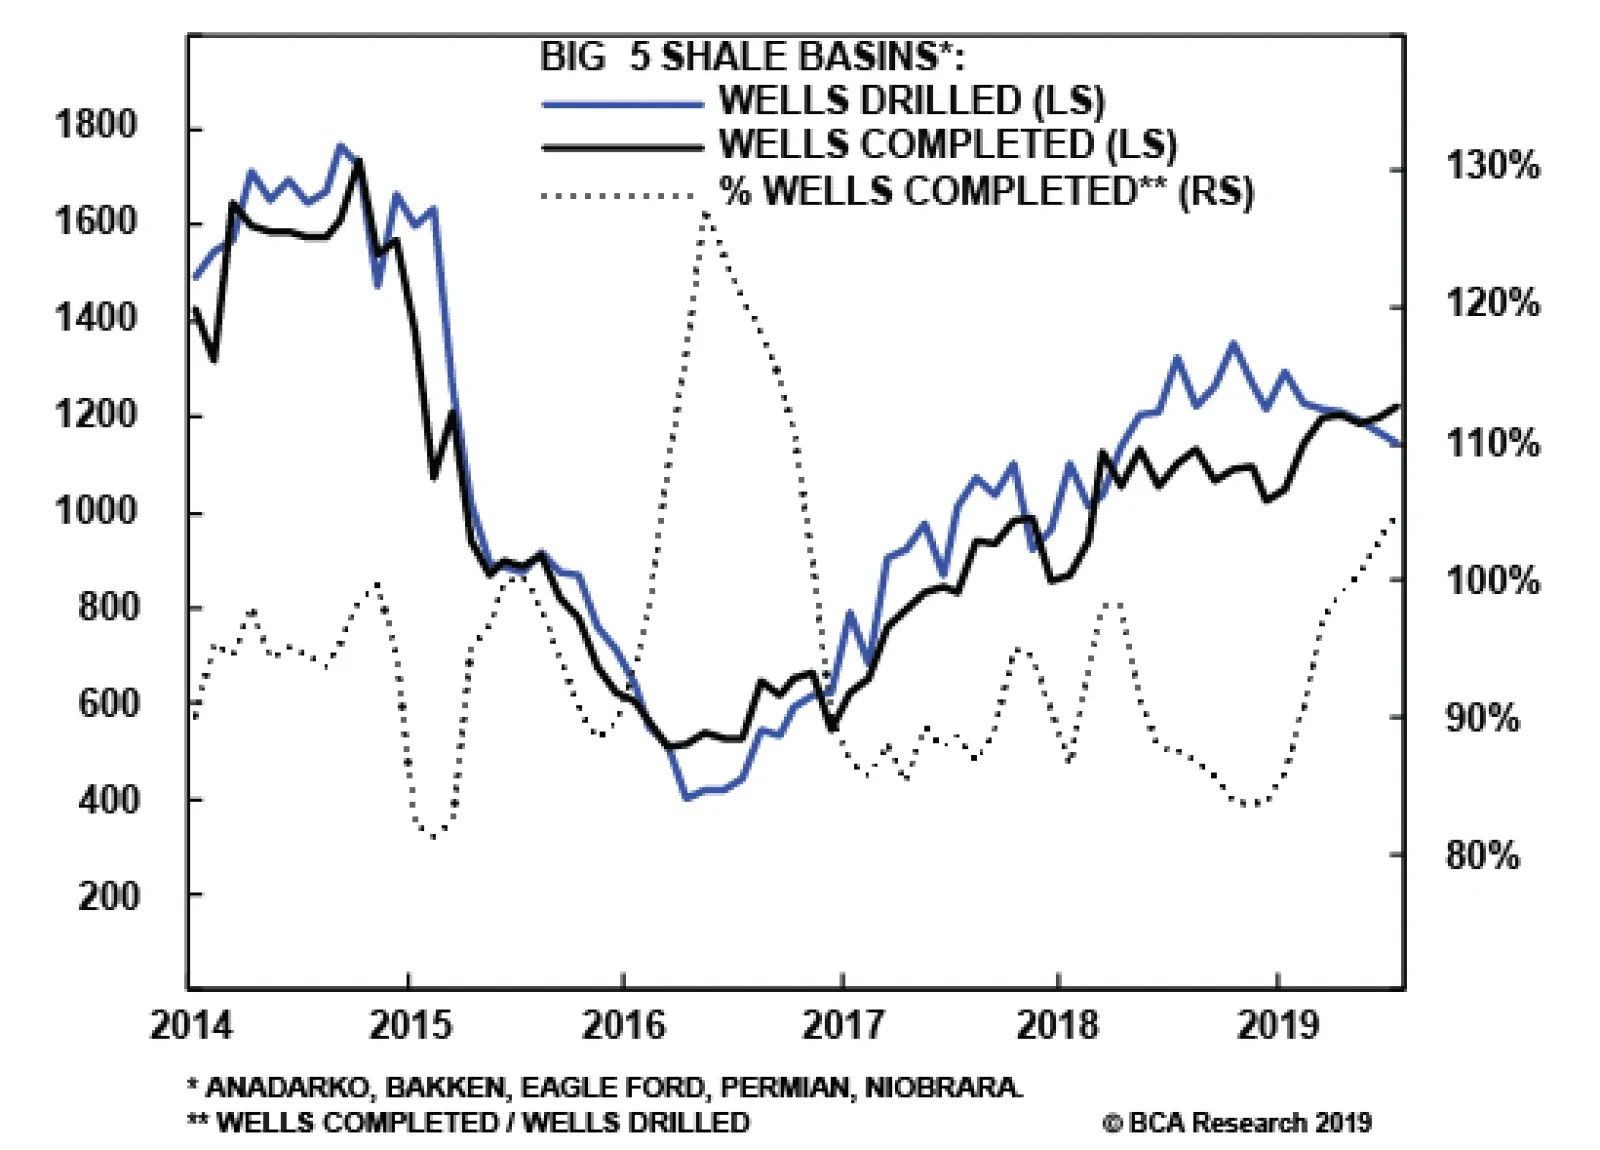
Lower-than-expected WTI prices and capital discipline will limit U.S. shale production growth this year, and temper it next year. E&P companies are using their accumulated inventory of excess Drilled-but-Uncompleted (DUC) wells to reach their production targets, while controlling capital expenditures (i.e. flat/lower rig count).6 Year to date, DUC completions increased in the Big Five tight-oil basins, overtaking new wells drilled (Chart 11).7 However, the Permian’s excess DUC inventory increased in July despite the ongoing pipeline capacity expansion and falling rig count. The Permian’s completion rate will be important to monitor. At current oil prices, producers need to tap into their excess DUC inventories to reach both their free-cash-flow and production goals. Bottom Line: We are reducing our Brent price forecast for 2019 to $66/bbl, on the back of weaker demand. Our forecast for 2020 remains unchanged at $75/bbl. Our expectations are driven by our expectation fiscal and monetary stimulus to lift commodity demand – oil in particular – and that production discipline by OPEC 2.0 and capital discipline from U.S. shale-oil producers will tighten markets and lift prices from here. Robert P. Ryan, Chief Commodity & Energy Strategist rryan@bcaresearch.com Hugo Bélanger, Senior Analyst Commodity & Energy Strategy HugoB@bcaresearch.com Footnotes 1 OPEC 2.0 is the name we coined for the producer coalition formed in late 2016 by the Kingdom of Saudi Arabia (KSA) and Russia. The producer coalition’s mission was – and remains – managing global supply so as to reduce inventories. We expect OPEC 2.0 production to be at or below quota levels agreed December 7, 2018, when KSA and Russia and their respective allies set about once again to drain global inventories of the 62-million-barrel overhang that resulted from the production ramp-up undertaken in response to demands from U.S. President Donald Trump. 2 The International Energy Agency (IEA) noted that, on the back of higher prices last year, oil once again was “the most heavily subsidized” energy source, expanding its share of the $400 billion provided consumers by their governments to 40%. Please see Commentary: Fossil fuel consumption subsidies bounced back strongly in 2018, published by the IEA June 13, 2019. 3 For a description of our nowcast model, please see Just In Time For Christmas! U.S. Tariff Delay Rocks Oil published last week by BCA Research’s Commodity & Energy Strategy. It is available at ces.bcaresearch.com. We noted last week that our expectation of stronger EM growth and a weaker USD is contrary to the view of BCA Research’s Emerging Markets Strategy, which expects continued weakness in EM GDP growth. Moreover, as mentioned in last week's report, our nowcast’s last data point was observed in July, which is before the latest escalation in trade tensions. We could see a move down in some of the indicators used as input in our nowcast model in the coming month. 4 Friedman, the 1976 Nobel Laureate in Economics, noted monetary policy operates with long and varying lags, which makes it difficult to be precise as to when its effects will be noticed in the macroeconomy. Please see Milton Friedman’s article, “The Lag in Effect of Monetary Policy,” Journal of Political Economy Vol. 69, No. 5 (Oct., 1961), pp. 447-466. 5 To date, OPEC and non-OPEC producers have had no apparent trouble replacing lost Iranian and Venezuelan barrels taken off the market as a result of U.S. sanctions. This indicates spare capacity remains sufficient to meet short-term supply disruptions and unplanned outages. Please see U.S. removed almost 2.7 million barrels of Iranian oil from market - Pompeo, published by uk.reuters.com August 20, 2019. 6 The process of drilling and completing wells produces a normal inventory of uncompleted wells, because of the time lag between the moment wells are drilled and the time they are completed. The development of multi-well pad drilling in U.S. shales structurally increased the time lag between drilling and completion to ~ 5 months. This implies a normal level of DUC inventory that corresponds to ~ 5 - 6 months’ worth of drilling activity. We define any DUC above our estimate of normal as an excess DUC well. On average, completion accounts for ~ 65% of the total well costs. 7 The Big Five shale basins are the Permian; the Eagle Ford; Niobrara; the Bakken, and the Anadarko. Investment Views and Themes Recommendations Strategic Recommendations Tactical Trades TRADE RECOMMENDATION PERFORMANCE IN 2019 Q2
Image
Commodity Prices and Plays Reference Table Trades Closed in 2019 Summary of Closed Trades
Image
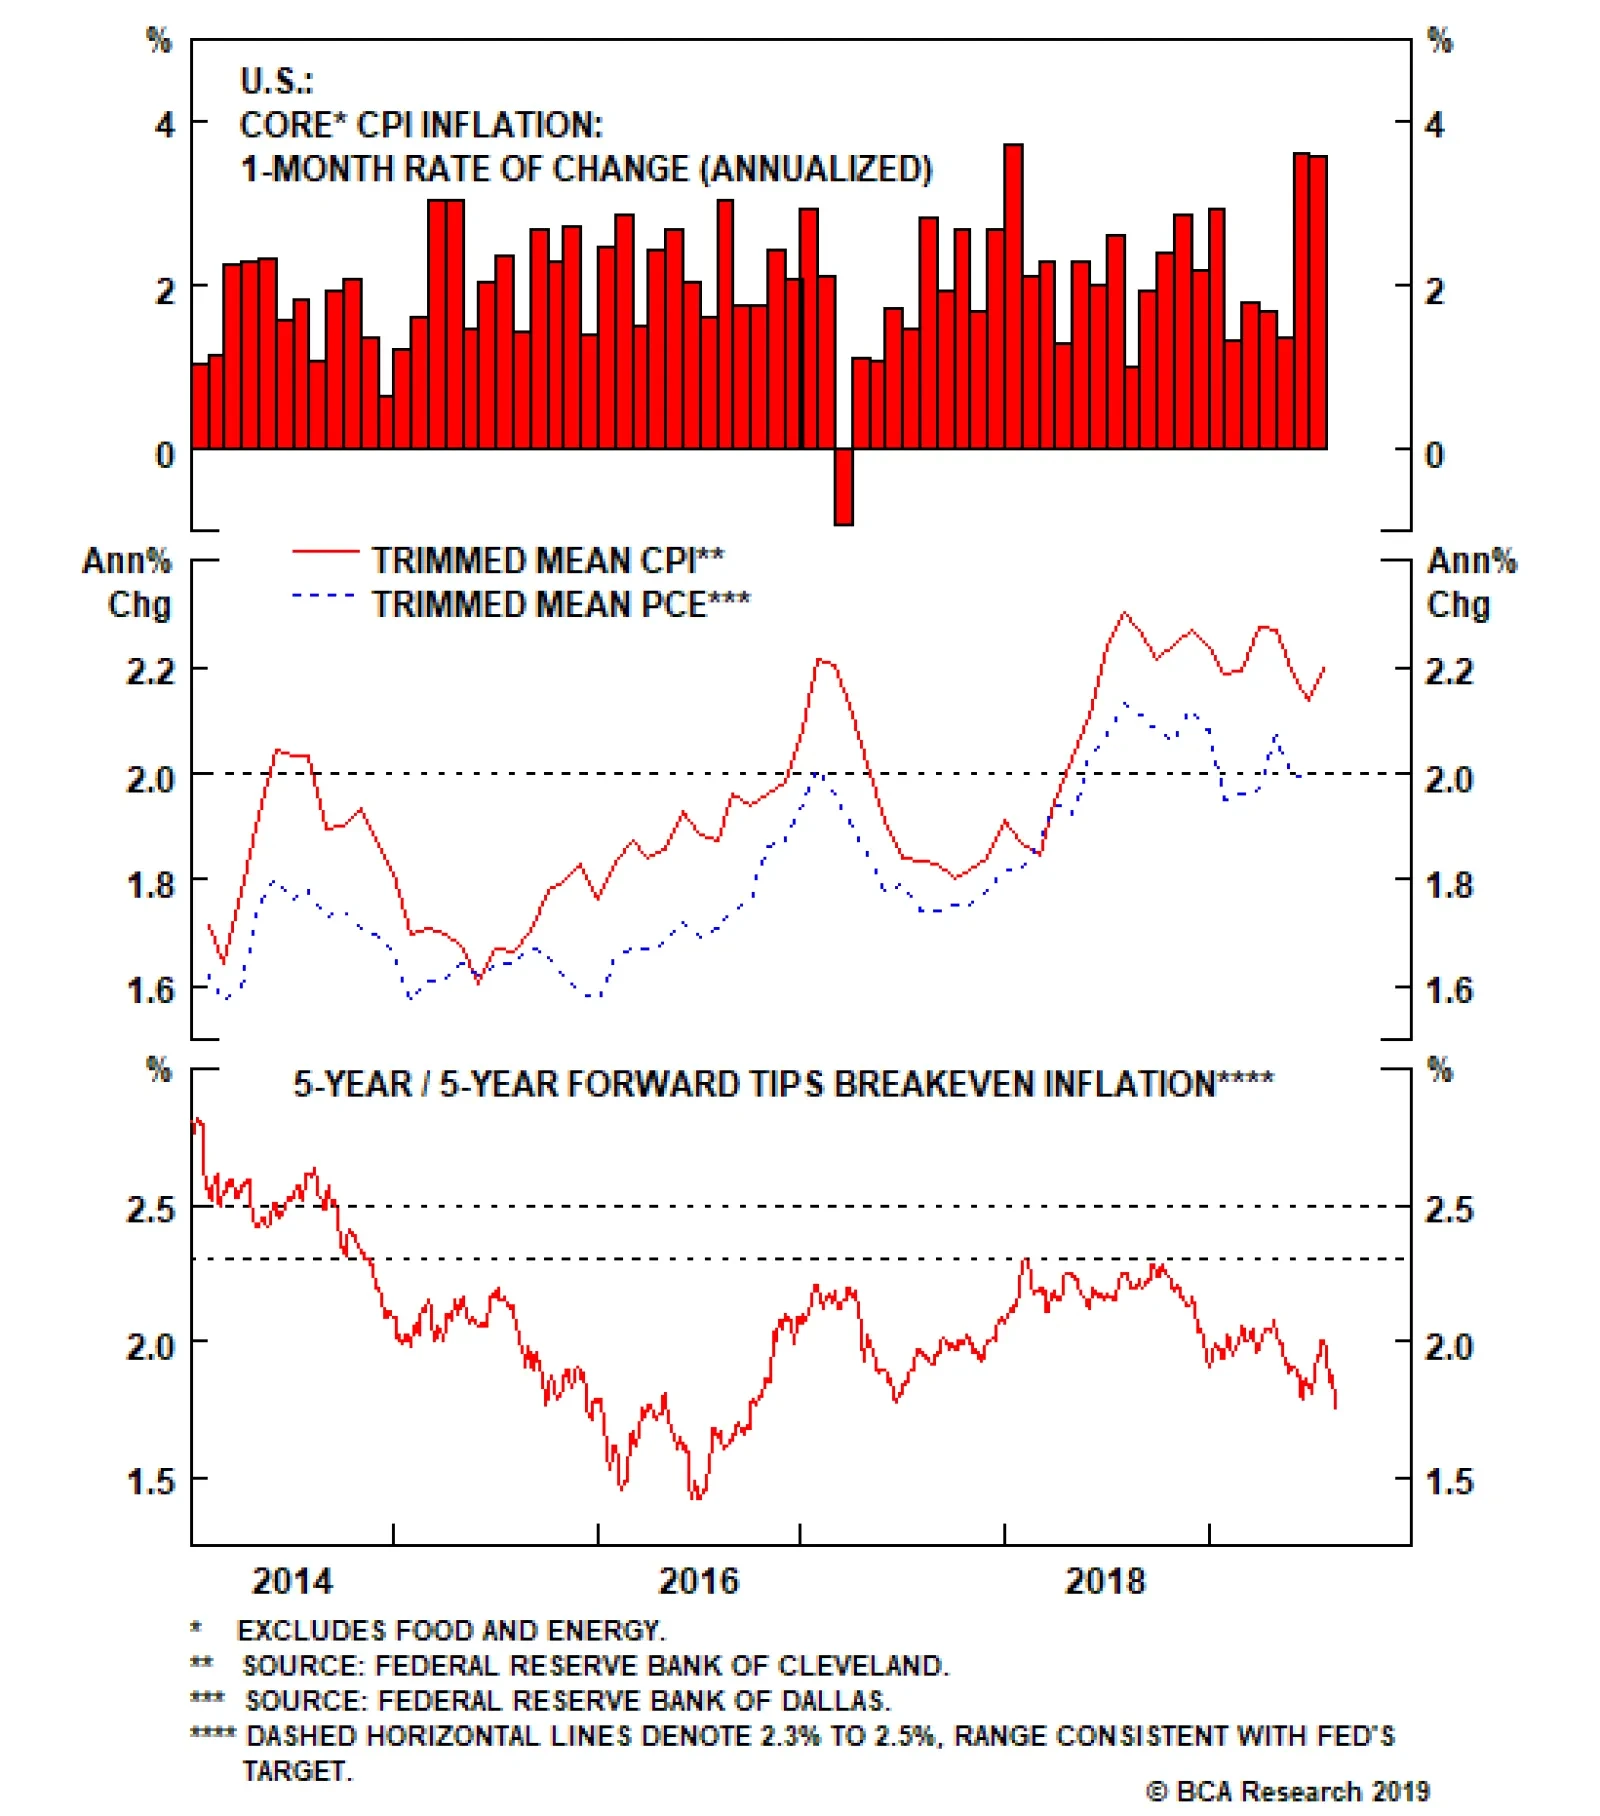
Strong U.S. inflation prints during the past two months add an interesting wrinkle to the macro landscape. Core U.S. inflation grew at an annualized rate of 3.55% in July, following an annualized rate of 3.59% in June. However, these strong inflation readings…