Global

As the summer holidays become a memory, central banks globally are mobilizing to fight mounting recession risks. More than 30 at last count are busily easing financial conditions to boost growth (Chart of the Week). Going into 4Q19, this monetary stimulus – coupled with fiscal stimulus globally – should allow growth ex-U.S. to revive, which will weaken the USD. This will be bullish for commodity demand in general, oil in particular. Fundamentally, the supply side of the oil market is in good shape. Production discipline by OPEC 2.0 will be maintained, while members of the coalition iterate on the level of output required to keep the rate of growth on the supply side below that of consumption.1 Capital discipline is being forced on U.S. shale-oil operators by markets. This will restrain their output growth rates to levels markets can absorb without inducing unintended inventory accumulation. A ceasefire in the Sino-U.S. trade war also could brighten short-term demand prospects and revive global trade volumes. This would indicate a recovery in manufacturing, given the heavy weight of manufactured goods in trade flows, and also in the the low-sulfur marine fuel markets. Going into 4Q19 and 1Q20, these supply-demand fundamentals will tighten markets, and force crude oil and refined product inventories lower. This will push Brent crude oil prices to our forecast levels of $66 and $75/bbl on average this year and next, with WTI trading $6.50 and $4/bbl under that. In addition, it would further backwardate crude oil forward curves. Chart of the WeekFinancial Conditions Continue Easing
Financial Conditions Continue Easing
Financial Conditions Continue Easing
Among the risks to this view: Too-weak monetary/fiscal stimulus, leading to a failure to revive demand and stave off recession; a breakdown in OPEC 2.0’s production discipline; an expansion of the Sino-U.S. trade war; a disorderly Brexit; and, critically, a stubbornly strong USD, which raises the risk of direct intervention in FX markets by the U.S. central bank. Highlights Energy: Overweight. Saudi Aramco’s board of directors apparently has ruled out a listing of its IPO in New York, owing to legal risk in the U.S., according to Reuters news service.2 Riyadh and London reportedly are favored by board members. The Kingdom’s Crown Prince Mohammed bin Salman reportedly has the final say. Base Metals: Neutral. The nickel rally likely corrects over the short term, after a vertical shot that lifted the metal ~56.2% between early June and this week. This was partly fueled by speculation over commentary from an Indonesian official in July reinforcing the country’s stated goal of banning raw ore exports by 2022. Indonesia is the largest nickel ore producer in the world.3 Precious Metals: Neutral. Our tactical long platinum position is up 3.9% since it was recommended last week. We continue to expect platinum will draft in gold’s wake, benefiting from safe-haven demand for precious metals generally. Fundamentally, the risk of power outages in South Africa, which produces ~67% of the world’s platinum, remains high this month, putting platinum-group metal production at risk there. Technically, the metal held long-term support at $785/oz this year – a level that goes back to the Global Financial Crisis lows – and has since rallied ~ 18%. Ags/Softs: Underweight. Chinese tariffs on U.S. soybean imports went up 5% to a total of 30% September 1, coinciding with the imposition of additional tariffs on $300 billion of Chinese imports. Feature USD strength remains a headwind to stronger EM growth, which is keeping oil demand growth in check (Chart 2).4 Indeed, in local-currency terms, oil prices remain closer to their 2014 highs, when Brent and WTI were trading above $100/bbl (Chart 3). The persistently strong USD is one reason we lowered our oil-demand forecast four times this year, which puts it at 1.2mm b/d for 2019. Chart 2USD Strength Hinders Oil Demand Growth
USD Strength Hinders Oil Demand Growth
USD Strength Hinders Oil Demand Growth
Chart 3USD Strength Keeps Local-Currency Costs High
USD Strength Keeps Local-Currency Costs High
USD Strength Keeps Local-Currency Costs High
The slowdown in global oil demand began in 2H18 and picked up speed in 1H19. We believe this largely was the result of a global tightening in financial conditions – apparent in the Chart of the Week – led by the Fed, which, with near-singular determination, raised its policy rate four times last year. Fed policy kept USD-denominated assets well bid, but, equally importantly, it raised the costs of commodities and all goods and services invoiced in USD globally in local-currency terms. This reduced aggregate demand ex-U.S. as households’ and firms’ discretionary incomes fell.5 Commodity demand also was derailed by the extended de-leveraging campaign by Chinese policymakers, which ran from 2017-18 and succeeded in its goal of bringing down the country’s debt-to-GDP ratio and the growth rate of leverage. Central Banks Scramble To Revive Growth The Treasury may be forced to up the ante and directly intervene in FX markets to weaken the dollar. To reverse the tightening of monetary conditions worldwide, central banks this year started moving to more accommodative monetary-policy settings, which we expect will continue to support looser financial conditions around the globe. In addition, fiscal stimulus either is being deployed or readied in key EM economies like China and India, which, together, account for 36% of the 53.5mm b/d of EM oil consumption we estimate for 2019. These policy responses should revive GDP growth – particularly in EM economies – and, all else equal, oil demand in the process going into 4Q19. The performance of our leading indicators support this expectation (Chart 4). That said, with so many systematically important central banks weakening their currencies, the USD could remain strong in relative terms.6 If the dollar remains a safe-haven asset in uncertain markets, while serving as the world’s reserve/invoicing/funding currency, weakening the USD during a period of high financial stress could be difficult. In that case, the Treasury may be forced to up the ante and directly intervene in FX markets to weaken the dollar. Chart 4Global LEIs Bottomed And Are Moving Up
Global LEIs Bottomed And Are Moving Up
Global LEIs Bottomed And Are Moving Up
Managing Financial Conditions In A Trade War We do not expect the Sino-U.S. trade war to be resolved. National security, foreign policy and technology positions that have been advanced by both sides appear impossible to walk back (e.g., protecting 5G networks from spying, and safeguarding intellectual property). This suggests the Sino-U.S. relationship is in the early stages of a Cold War, which could go hot in the short run.7 Still, a short-term agreement or ceasefire this year or next is still possible. The basis for such a shift would be President Trump staging a retreat to try to clinch a deal and improve the economy prior to his re-election campaign. China might accept a temporary reprieve. This would allow both sides to retreat to re-group for the almost-certain renewed trade tension that will mark the Sino-U.S. relationship going forward. Over the short run, a ceasefire could brighten demand prospects and revive global trade volumes. This would be supportive of crude oil and refined-products markets, particularly the low-sulfur marine fuel market, which, on January 1, will be bound by IMO 2020 standards.8 In the medium to longer-run, however, neither the U.S. nor China will cede ground if it strengthens the hand of the other, particularly regarding national security and technology, which will continue to be the key concern for all national security issues. This complicates fiscal and monetary policy for both sides going forward, along with trade relationships for each. We do not believe either side has these issues sorted, and likely will need time and space to develop policies for the medium- and longer-term. It also means each side’s respective allies will have to make hard choices in deciding whose camp they will migrate toward. These considerations cloud the outlook for the medium- to long-term oil markets. We will be exploring them in greater depth in forthcoming Commodity & Energy Strategy reports. Investment Implications We remain broadly long in our exposure to oil markets, expecting the fundamentals outlined above to tighten supply, strengthen demand and draw down inventories. Given this view, we remain long WTI flat price, and long 4Q19 Brent futures vs. short 4Q20 Brent futures, expecting a steeper backwardation. We also remain long the S&P GSCI commodity index, given its relatively heavy exposure to energy markets. Bottom Line: Supply-demand fundamentals, coupled with a favorable fiscal and monetary backdrop, indicate oil prices will move higher from current levels toward our forecasts of $75/bbl and $71/bbl next year for Brent and WTI, respectively. This view is not without risk – chiefly around the Sino-U.S. trade war, and the risk that an expansion of tensions would stunt global demand for oil significantly. We continue to follow this closely. Robert P. Ryan, Chief Commodity & Energy Strategist rryan@bcaresearch.com Footnotes 1 OPEC 2.0 is the name we coined for the producer coalition led by the Kingdom of Saudi Arabia (KSA) and Russia. It was formed in 2016 to manage production and reduce oil inventory levels globally. For a complete summary of our supply-demand expectations for this year and next, please see the August 22, 2019 Commodity & Energy Strategy Weekly Report, "USD Strength Slows Oil Demand Growth; 2020 Brent Forecast Remains At $75/bbl". 2 Please see Exclusive: Saudi Aramco board sees too many risks for New York IPO - sources, published by reuters.com August 30, 2019. 3 Please see Nickel price forecast revised up as speculative rally boosts tight market — report, published by mining.com August 29, 2019. 4 We have shown in previous research EM income growth accounts for most of the growth in oil demand globally. This year, for example, we expect EM demand growth to account for 87% of 2019’s 1.2mm b/d growth in oil consumption. Next year, EM is expected to account for 79% of the 1.5mm b/d of growth we expect. For this reason, oil prices – and base metals prices – are a good barometer of the of EM income growth. 5 Maurice Obstfeld noted at the Fed’s June 2019 Conference on Monetary Policy Strategy, Tools, and Communication Practices (A Fed Listens Event) that the USD is not only the world’s reserve currency, it also is the dominant invoicing and funding currency. “… the dollar’s invoice-currency role affects the international price mechanism by influencing how U.S. monetary policy will move real exchange rates, inflation, and export competitiveness throughout the world. … (The) dollar’s funding currency role mediates the transmission of U.S. monetary policy to global financing conditions. “Through both mechanisms, U.S. monetary policy has an outsized impact on global economic activity – consistent with the evidence on unconventional policy spillovers. … The Federal Reserve, more than other central banks, should therefore consider spillbacks from the global economy as a relevant transmission mechanism for its policies.” Prof. Obstfeld’s paper can be downloaded at the Fed website, Global Dimensions of U.S. Monetary Policy. 6 In the August 26, 2019, issue of BCA Research’s U.S. Investment Strategy, our colleague Doug Peta, chief U.S. investment strategist, notes, “No central bank wants a stronger currency while confronting a demand deficiency aggravated by trade tensions and a global manufacturing slowdown. The New York Times Business section put the prevailing policy winds into living color in a nearly full-page, four-column graphic spotlighting the 32 central banks that have cut their policy rate so far this year.” For further discussion, please see Market Messages, published August 26, 2019, by BCA Research’s U.S. Investment Strategy. It is available at usis.bcaresearch.com. 7 Our geopolitical strategists make the odds of a trade agreement 40%, perhaps a bit higher. Please see Big Trouble In Greater China, published August 23, 2019, by BCA Research’s Geopolitical Strategy, for an excellent discussion of the fraught Sino-U.S. relationship. It is available at gps.bcaresearch.com. 8 We expect global shipping-fuels market to tighten as UN-mandated fuel standards kick in next year. This will keep ship fuels, specifically Gasoil and ULSFO, and other distillate prices – e.g., diesel and jet fuel – elevated relative to other refined products like gasoline. This will boost demand for lighter, sweeter crudes – particularly Brent and similar grades – that allow refiners to raise distillate yields, as they scramble to meet higher demand for low-sulfur ship-fuel next year. For more information on IMO 2020, please see IMO 2020: The Greening Of The Ship-Fuel Market, published by BCA Research’s Commodity & Energy Strategy February 28, 2019. It is available at ces.bcaresearch.com. Investment Views and Themes Recommendations Strategic Recommendations Tactical Trades TRADE RECOMMENDATION PERFORMANCE IN 2019 Q2
Central Bank Easing Key To Oil Prices
Central Bank Easing Key To Oil Prices
Commodity Prices and Plays Reference Table Trades Closed in 2019 Summary of Closed Trades
Central Bank Easing Key To Oil Prices
Central Bank Easing Key To Oil Prices
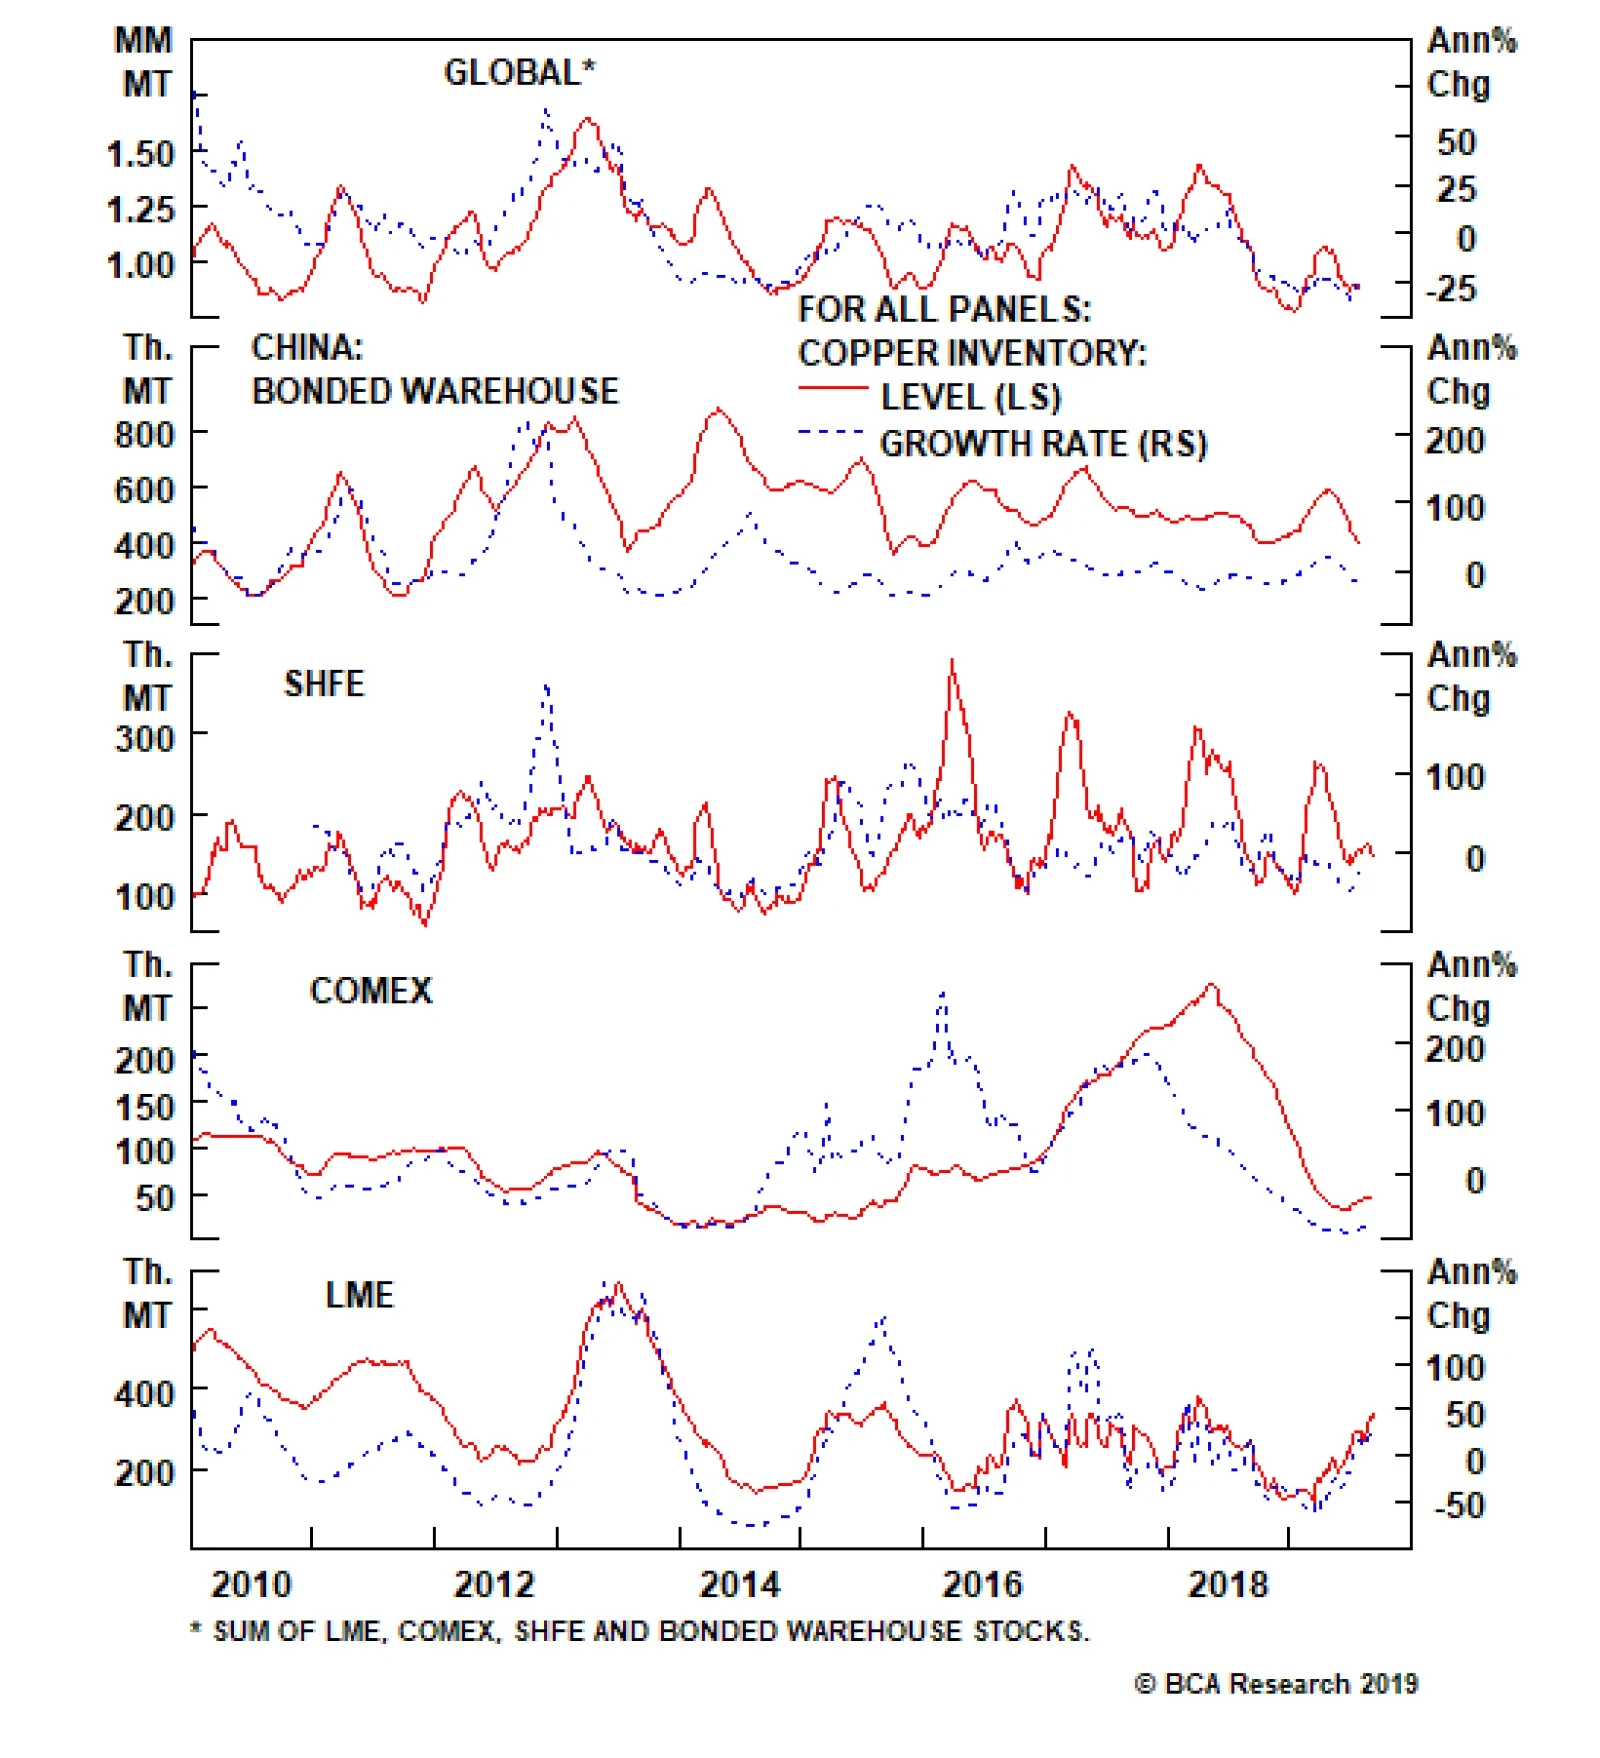
Prices for iron ore and steel have come back to earth, following their impressive rallies this year. However, copper prices languished, and retreated to $2.50/lb on the COMEX. This, despite a contraction of physical copper concentrates supply, which kept…
Feature BCA Research (aka The Bank Credit Analyst) published its first report in 1949, a remarkable 70 years ago. This probably makes us the longest-running independent investment research firm in the world. As we age, it is normal to occasionally reflect on how the world has changed over the course of our lives. It is an interesting exercise in the case of BCA. We need to start with a little history. The Bank Credit Analyst began life as a small-circulation newsletter produced by Hamilton Bolton, a Montreal-based money manager. He had been sending out investment commentary to his clients for some time and was encouraged to start catering to a wider audience. Bolton was a visionary because he was one of the few market analysts at that time to understand the importance of money and credit in driving economic and market cycles. In those days, banks were the dominant financial intermediary, so an analysis of flows through the banking system provided accurate and leading signals about economic and market trends. That is why he named his new service “The Bank Credit Analyst”. Bolton developed a series of monetary-based indicators that allowed him to make some great market calls. He passed away in 1967, but his valuable contribution to financial research was acknowledged in 1987 when the CFA Institute posthumously awarded him the prestigious “Outstanding Contribution to Investment Research Award”.1 Hamilton Bolton was a product of his times in that his worldview was influenced heavily by having lived through the Great Depression. Like many of his generation, he had a strong aversion to excessive debt growth, and was highly sensitive to any buildup of financial imbalances that could tip the economy back into a severe downturn. In fact, widespread fears of renewed depression did not really fade until the late 1950s. That psychology helps explain why policymakers were complicit in allowing inflation to take hold in the 1960s because there is a common tendency to fight the last war. As long as depression/deflation is seen as the primary threat, then there will be complacency about inflation risks. Does This Sound Familiar? Let’s look at some of the conditions that existed in 1949, when The Bank Credit Analyst started publication. The U.S. long-term Treasury yield had been capped at 2.5% since April 1942. At the request of the Treasury Department, the Fed had given up control of the money supply by buying whatever bonds were needed to keep yields below 2.5%, in order to support the financing of war-inflated budget deficits. The level of federal debt was down from its wartime peak of 106% of GDP, but was still at a historically high 77.5%. The European and Japanese economies were in a complete mess, having been devastated during the war. As already noted, fears of renewed deflation and depression were prevalent. Inflation was tame with the U.S. personal consumption deflator declining by 0.8% in 1949 and rising by only 1.2% in 1950. There was considerable geopolitical upheaval. Most notably, the Cold War intensified as Russia extended its control over East Europe and other countries. Mao Zedong founded the People’s Republic of China in October 1949 after his communist forces defeated the Kuomintang led by Chiang Kai-shek. There were serious border clashes between North and South Korea in August 1949, a prelude to the North’s invasion in June 1950. It does not require a huge stretch of the imagination to see some parallels with the current environment. We currently are having (or have had): Massive central bank purchases of government debt (i.e. quantitative easing) and the explicit pegging of bond yields by the Bank of Japan. A huge increase in government debt levels, albeit not because of war-related spending. In a remarkable coincidence, U.S. federal debt reached 77.8% of GDP in fiscal 2018, almost exactly the same level as in 1949. The European and Japanese economies are moribund. However, unlike in 1949, this reflects structural forces, not war-related devastation. There are widespread fears about the long-run economic growth outlook, well captured by the secular stagnation thesis, promoted by Larry Summers. Central bankers are concerned that inflation is too low. Geopolitical concerns abound. These include U.S.-China tensions, Brexit, Korea (again), rising populism and Russia’s more aggressive stance on the world stage. In the end, the fears of 70 years ago that the world might slip back into depression proved unfounded. The 1950s and 1960s, for the most part, turned out to be golden decades for consumers, businesses and equity investors. Unfortunately, this does not mean that we can look forward to a repeat experience in the decades ahead, because we must now turn to the major differences between the present and the past. The Past Worked Out Just Fine The conditions for an economic boom in the 1950s and 1960s could hardly have been better. The U.S. armed forces employed more than 12 million men and women at the end of WWII, 7.6 million of whom were stationed overseas. After the war, these people were desperate to get back to a normal life, with civilian jobs, marriage and children. The inevitable result was a population boom and a surge in growth as pent-up demand for housing and consumer goods was unleashed. It was all aided by the 1944 G.I. Bill that provided low-cost mortgages and many other benefits. The improvement in economic growth boosted government tax receipts and, coupled with a drop in defense spending, this kept fiscal finances in check. During the 1950s and 1960s, the federal deficit averaged less than 1% of GDP and debt had fallen to less than 30% of GDP by 1969. This occurred despite a surge in federal infrastructure spending, helped by the Federal Highway Act of 1956 that authorized the construction of an interstate highway system. Meanwhile, the economy did not appear to be impeded by tax rates that were far above current levels. The reconstruction of the European economies was a monumental task that was beyond the financing capabilities of those shattered countries. However, between 1948 and 1951, the U.S. European Recovery Program (The Marshall Plan) transferred $100 billion in 2018 dollars to aid the recovery effort and this helped Europe get back on its feet. There also was a huge amount of U.S. aid to support the rebuilding of Japan. Economic growth in Japan averaged almost 9% a year in the 1950s and more than 10% in the 1960s. In Germany, the comparable figures were 7.7% and 4.2%. The growth of the world economy also was boosted by steady reductions in tariffs during the 1950s and 60s. The most notable was the Kennedy Round of 1964-67 that achieved a 38% weighted average drop in tariffs. Protectionism was in strong retreat in the decades after WWII. Finally, a word on the markets. At the end of 1949, the S&P 500 was trading at seven times trailing earnings while the dividend yield was at 6¾%. The market’s earnings yield of 14% compared to a 2.2% yield on 30-year Treasuries. In other words, stocks were incredibly cheap. Moreover, when the 1951 Treasury-Federal Reserve Accord ended the bond peg, yields inevitably rose steadily over the subsequent years, making bonds a poor investment. In the 1950s, U.S. equities delivered real compound returns of 16.6% a year compared to -3.3% for 30-year bonds. In the 1960s, the annualized real returns were a still-respectable 5.3% for stocks and -1.4% for bonds. In sum, the two decades after the launch of the BCA were a very favorable time and it was largely due to a very depressed starting point. However, the current environment is very different to that of 70 years ago. It’s a Different Picture Now Perhaps the most important difference with the past is the demographic outlook. In contrast to the post-WWII baby boom, the U.S. and most other developed economies face bleak population dynamics. Almost all developed economies – and many emerging ones – have seen the birth rate drop below replacement levels with the result that population growth has slowed dramatically. In many cases, populations are in actual decline – especially in the important working-age segment. That deprives economic growth of its main driver. The annual potential growth of U.S. real GDP averaged 4% in the 1950s and 4.3% in the 1960s. Potential growth in the next decade will average only 1.8% a year, according to the Congressional Budget Office (CBO). And it will be even lower in Europe and Japan. As far as pent-up demand is concerned, the picture also is very different. While the consumer industry works hard to develop new must-have goods and services, the reality is that demand is satiated for a lot of products. For example, in 2017, there were 259 million registered private and commercial autos and trucks in the U.S. compared to only 225 million licensed drivers. In 1950, the number of licensed drivers (62 million) far exceeded the number of registered vehicles (48 million). And it is hard to believe that the ownership penetration of most consumer durables has much upside. Turning to government finances, the current environment of bloated deficits and debt significantly constrains the room for fiscal stimulus. Yes, there is constant talk of the need for more infrastructure spending, but this has proven very difficult to implement without offsetting cuts in other spending or measures to boost revenues. The U.S. is saddled with unprecedented peacetime fiscal deficits and the CBO projects that federal debt will approach 100% of GDP within ten years, even without factoring in another recession. The comparison between the free trade era of the 1950s and 60s and the current situation speaks for itself. It is unclear at this stage just how far the move toward protectionism will go, but one thing seems clear. The rush toward globalization that followed the breakup of the Soviet Union and the entry of China into the global trading system is in retreat. This shows up not only in rising tariffs, but also in declining cross-border direct investment flows and increased antipathy to large-scale international migration. The irony is that the developed world needs more immigration to offset the weak growth in resident populations. What about the markets? The stock market certainly is not cheap, the way it was 70 years ago, with the S&P 500 trading at more than 18 times trailing operating earnings. Low interest rates are providing support, but future returns are likely to be in low single figures in a world where economic growth is moderate and there is little scope for profit margins and/or multiples to expand. Prospects for bonds do look somewhat similar to the situation in the early 1950s. Then, there was only one way for yields to go once the Fed’s peg ended. Today, yields will only fall sustainably if the economy sinks into a protracted downturn. We will get another recession in the next few years and yields could certainly hit new lows at that point. But the resulting policy response – both fiscal and monetary – seems almost certain to lead to higher inflation down the road. That would not bode well for the bond outlook, as was the case between the second half of the 1960s and the early 1980s. Concluding Thoughts Hamilton Bolton was fortunate to launch his new investment service ahead of a powerful economic revival and an almost two-decade bull market in stocks. He did not live long enough to witness the inflation upturn and volatile economic environment of the 1970s and 1980s, but BCA’s monetary focus allowed it to prosper during that period. Under the leadership of Tony Boeckh, the company’s then owner and Editor-in-Chief, BCA was strident in warning investors about the buildup of inflationary pressures and the dangers this posed for markets. During this time, BCA also developed the concept of the Debt Supercycle which helped investors understand the complex forces driving policy and the economic/market cycles. If Bolton was alive today, he would be horrified at the state of the world. He would not be able to understand how investors could be so complacent in the face of record government deficits and debt and by what he would regard as the reckless behavior of central banks. At the same time, he would be able to identify with the renewed focus on weak growth and deflation risks. The bottom line is that he would be advising investors to be extremely cautious. Investors currently are semi-obsessed with the timing of the next recession as that would be the signal to significantly downgrade risk assets. The official BCA stance is that a recession is not imminent and this creates a window for stocks to outperform. This matters for those investors who need to be concerned with relative performance. It is painful to sit on the sidelines if markets keep rising and you underperform your peers. However, for those more concerned with absolute performance, and that was true of most investors in Bolton’s time, the upside potential currently seems unattractive relative to the downside risks. Unfortunately, economists have a poor track record of forecasting recessions and bear markets thus often come as a complete surprise. Yes, low interest rates provide a floor under stocks, with the dividend yield comfortably above the 10-year Treasury yield. But rates are low for a reason: the economy and thus corporate earnings face major downside risks. Against this background, I would tend to side with what I imagine Bolton would say: this is a time to focus on capital preservation rather than taking risks to maximize returns. Let me try to end on a more positive note. As noted earlier, the long-term outlook turned out much better than Bolton probably anticipated 70 years ago. What could make that true this time around? Some things cannot be changed, at least over the next decade: adverse demographic trends, high ownership of consumer goods, and high levels of government debt. Geopolitical developments could go either way – for the better or worse – so I will make no predictions there. The one savior would be a marked revival in productivity because, ultimately, that is the only real source of rising living standards. Technology is changing rapidly and there are lots of exciting innovations. But to make a significant and lasting difference it will require more than developments such as autonomous vehicles or 3-D printing. We will need a new General Purpose Technology (GPT) that has a profound impact on the way economies and societies are structured. Previous examples include the steam engine, electricity and of course the internet. Perhaps Artificial Intelligence will do the trick, but that does not seem likely to be a near-term cure. Chart 1Then (1949) And Now (2019)
Then (1949) And Now (2019)
Then (1949) And Now (2019)
In closing, we can be sure of one thing. The world changed in ways Hamilton Bolton could not have conceived and that also will be true for us today. BCA will endeavor to evolve with the times as it has done over the past 70 years and we look forward to keep helping our clients prosper in a complex and ever-changing world. 1949 – A Very Momentous Year Hamilton Bolton launches The Bank Credit Analyst The Peoples Republic of China, the Federal Republic of Germany and the German Democratic Republic (East Germany) are founded Indonesia gains independence from the Netherlands The civil war in Greece ends NATO is established The Geneva Convention is agreed The Soviet Union detonates its first atomic bomb Apartheid becomes official policy in South Africa Alfred Jones creates the first hedge fund The first non-stop circumnavigation of the world by an aircraft occurs The first commercial jet airliner, the De Havilland Comet, has its maiden flight EDSAC – the first practicable stored-program computer runs its first program at Cambridge University Products introduced that year included Lego, the 45 rpm record, the first Porsche car and the Xerox photocopier. George Orwell’s dystopian novel 1984 is published People born include Ivana Trump, Jeremy Corbyn, Benjamin Netanyahu, Meryl Streep and Bruce Springsteen 2019 – Not So Much Chaotic politics in the U.K., Italy and many other countries Trade wars Martin H. Barnes, Senior Vice President Economic Advisor mbarnes@bcaresearch.com Footnotes 1 Previously known as the Nicholas Molodovsky Award
On a like-for-like basis, 5-year inflation rates are way below the 2 percent target in all the major jurisdictions: the U.S., euro area, and Japan. Our European Investment Strategy service therefore believes that the current chasm in monetary policies is…
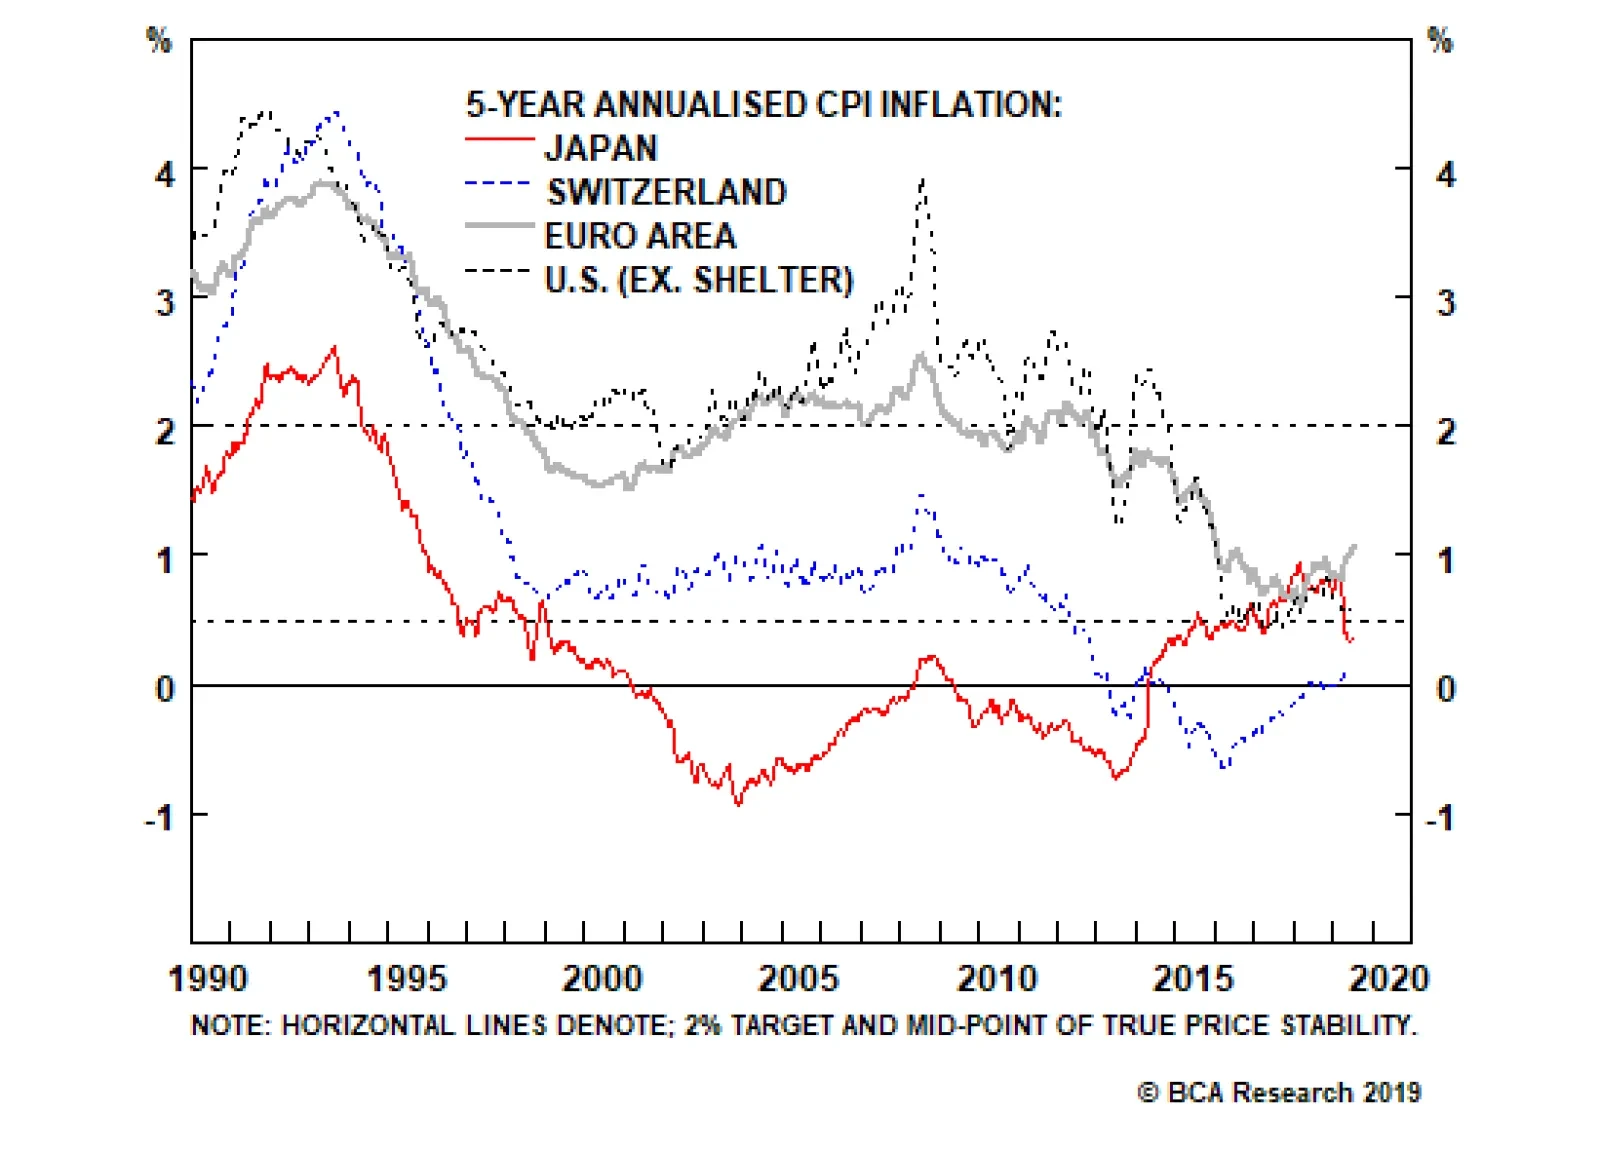
As structural credit booms have ended, economies have one by one entered the state of price stability. First it was Japan; then it was Switzerland; more recently it has been the euro area and the United States. It follows that the 5-year annualized…
Feature In investment, there are times when your view and your strategy should not be the same. Our view remains that the global economy is likely to avoid recession over the next 18 months, that the Fed will cut rates once or twice more as an “insurance” but not enter a full easing cycle, that global bond yields will rise, and that risk assets will outperform over the next 12 months. But the risks to that view have increased, and so we want to bolster the hedge against our view being wrong. We don’t see Recommended Allocation
Monthly Portfolio Update: Dialing Down Risk
Monthly Portfolio Update: Dialing Down Risk
Chart 1GAA Portfolio Volatility Relative To Benchmark
GAA Portfolio Volatility Relative To Benchmark
GAA Portfolio Volatility Relative To Benchmark
government bonds as an attractive hedge at this level of yield, and so are moving to a “barbell” strategy, with overweights in equities and cash, and an underweight in fixed income. This lowers the volatility of our recommended portfolio to close to that of the benchmark (Chart 1). First, the good news. Although the manufacturing sector globally continues to deteriorate, with many PMIs falling to below 50, services and consumption remain robust almost everywhere (Chart 2). With central banks easing monetary policy, and in some countries (Italy, the U.S., the U.K., maybe even Germany) governments loosening fiscal policy, financial conditions are improving, which will eventually support growth (Chart 3). Intra-cyclical manufacturing downturns typically last around 18 months, and this one is close to its sell-by date (Chart 4). Chart 2Manufacturing Weak, Services Fine
Manufacturing Weak, Services Fine
Manufacturing Weak, Services Fine
So what has changed? First, manufacturing has continued to decline for longer than we expected. In the early summer, there were signs of a bottoming in Europe, but these are no longer evident. The diffusion index of the global manufacturing PMI (i.e. the percentage of countries with a rising versus falling PMI), which typically leads the PMI by six months, suggests the PMI has further to fall (Chart 5). Chart 3Easing Financial Conditions Will Help
Easing Financial Conditions Will Help
Easing Financial Conditions Will Help
Chart 4Close To The Bottom?
Close To The Bottom?
Close To The Bottom?
Chart 5Further Downside For PMIs?
Further Downside For PMIs?
Further Downside For PMIs?
Chart 6China's Reluctant Monetary Stimulus
China's Reluctant Monetary Stimulus
China's Reluctant Monetary Stimulus
The most likely cause of this is that China has been more reluctant to ramp up monetary stimulus than we expected. It has eased fiscal policy, but monetary policy has been tentative: despite a moderate increase in credit creation this year, M3 money supply growth has barely accelerated (Chart 6). This has been enough to stabilize Chinese growth, but has been insufficient to give the sort of boost to global growth that China provided in 2016. There are two reasons for China’s reluctance to stimulate. The authorities seemingly continue to prioritize debt deleveraging and clamping down on shadow banking. And, also, maybe they do not want to give a boost to the global economy that would help the U.S. avoid recession and increase the probability of President Trump’s being reelected. China has been more reluctant to ramp up monetary stimulus than we expected. The Trade War is an increasing risk. BCA’s geopolitical strategists continue to assign a 40% probability to a resolution by year-end,1 but it is becoming harder to see how (or, indeed, why) President Xi would offer concessions to the U.S. that would lead to a deal. Ultimately, if Chinese growth slows significantly and U.S. stocks fall sharply, China will boost monetary stimulus and President Trump will push for even a superficial trade agreement. But things will need to get worse first. Meanwhile, the rise in global political uncertainty – and the mercurial nature of Trump’s foreign and trade policies – are a risk for markets (Chart 7). Chart 7Global Political Risks Rising
Global Political Risks Rising
Global Political Risks Rising
Chart 8Consumers (Mostly) Remain Confident
Consumers (Mostly) Remain Confident
Consumers (Mostly) Remain Confident
We are also concerned about how long consumption can remain robust in this environment. So far, consumer confidence has remained resilient in the U.S., though it has dipped a little in Europe and Japan (Chart 8). But, if corporate profits remain weak, companies will start to delay hiring decisions and begin to lay off workers. This would be the transmission mechanism for the manufacturing slowdown to spread into the broader economy. So far, fortunately, there are few signs it is happening: German unemployment is at a record low, and U.S. initial claims continue to run at or below last year’s level (Chart 9). Chart 9No Signs Of Weakening Labor Market
No Signs Of Weakening Labor Market
No Signs Of Weakening Labor Market
Table 1GAA Recession Checklist
Monthly Portfolio Update: Dialing Down Risk
Monthly Portfolio Update: Dialing Down Risk
In the recession checklist we have published for the past two or more years, we are starting to have to tick off more warning signs (Table 1 and Chart 10). Chart 10Some Worrying Signs
Some Worrying Signs
Some Worrying Signs
Chart 11Risk Of Recession No Longer Negligible
Risk Of Recession No Longer Negligible
Risk Of Recession No Longer Negligible
For example, the yield curve has inverted both for the 3-month/10 year and 2-year/10-year. Although the yield curve has been an almost infallible predictor of recession in the past 70 years, there are some reasons to argue that it may not be as good this time: for example, central bank purchases have artificially pulled down long-term rates. But inversion is probably a self-fulfilling prophesy. For example, in a recent Fed Senior Bank Loan Officers Survey, 40% of banks said they would tighten credit standards simply because of a moderate inversion of the yield curve. Formal models of recession 12 months ahead that incorporate the yield curve slope, put recession risk now at about 25% (Chart 11). Chart 1218 Months Of Ups And Downs
18 Months Of Ups And Downs
18 Months Of Ups And Downs
Given all this, we think it is appropriate to take some risk off. As far back as February 2018, we argued that “investors primarily concerned with capital preservation might look to dial down risk or hedge exposure now”.2 Given the ups and down of markets in the past 18 months, we suspect that those risk-averse investors would not have been unhappy with that advice (Chart 12), although they would also have missed some nice equity rallies over that time, if they had been nimble enough to time entry and exit points. Since a majority of the subscribers to this service are rather conservative, we are now extending that advice to all clients. On a 12-month time horizon, we raise cash to overweight. We are also reducing somewhat both our equity overweight and bond underweight. In this period of increased uncertainty, a portfolio closer than usual to benchmark makes sense. (BCA’s House View is a little more bullish, remaining neutral on cash and overweight equities on the 12-month horizon). Fixed Income: Absent recession, we see little room for rates to fall further. The U.S. 10-year Treasury yield (now 1.5%) should stay above its July 2016 historic low of 1.37%. The Fed is unlikely to cut rates by 100 basis points over the next 12 months, as futures imply. We would expect only two 25 bp rate cuts: in September and either October or December. Yields are likely eventually to move up over the next 12 months (particularly given that inflation continues to trend higher). But they may not move much for a while, and so we move from underweight to neutral on duration for now. Eventually, we see investors understanding that government bonds are no longer an attractive hedge at current yields. Even if German 10-year yields fell to -1.2% (probably around the lowest possible), one-year total return would only be 5% (Table 2). The U.S. looks a little better, though. One could imagine the yield falling to zero in the next recession, which would give a return of 16%. On credit, we remain neutral: it represents a low-beta play on equities. So far this year, both investment-grade and high-yield bonds have eked out a small positive excess return (Chart 13). Table 2Not Much Room For Positive Returns
Monthly Portfolio Update: Dialing Down Risk
Monthly Portfolio Update: Dialing Down Risk
Chart 13Credit Returns Have Not Been Bad
Credit Returns Have Not Been Bad
Credit Returns Have Not Been Bad
Chart 14Downside For Cyclicals?
Downside For Cyclicals?
Downside For Cyclicals?
Equities: To offset our overweight on equities, we continue with a low-beta country/regional tilt. We recommend an overweight on the U.S., and underweight on Emerging Markets. The key for upside to U.S. equities remains earnings. Analysts have a pessimistic forecast of only 2.5% EPS growth in 2019 for the S&P500. A rough proxy for earnings growth (nominal GDP growth of 4.5%, wage growth of 3.5% leading to some margin expansion, 2% buybacks) points to EPS growth of around 7-8%. Q3 earnings (where analysts forecast -2% year-on-year) are likely to surprise on the upside, as did Q1 and Q2, though the strong dollar and weak overseas growth are risks. In our next Quarterly, to be published on October 1, we may make some adjustments to further dial down risk, for example in our equity sector recommendations, which currently have a slight cyclical tilt. The relative performance of cyclicals has started to wobble, and the message from bond markets is that cyclicals have further to fall in relative terms (Chart 14). Investors will come to understand that government bonds are no longer an attractive hedge at current yields. Currencies: The trade-weighted dollar has broadly moved sideways in the past year (Chart 15), weakening against the yen, but strengthening against the euro and EM currencies. We remain neutral on the dollar. It will continue to be pulled by two opposing forces: weak global growth is a positive, but the Fed has more room to cut rates than the rest of the world and so interest rate differentials will shift against the dollar. The renminbi is likely to continue to weaken, as the Chinese use currency policy as the least painful offset against U.S. tariffs. The latest set of tariffs suggests that the CNY needs to fall to around 7.5-7.6 to the USD to offset their impact but, if Trump implements all the tariffs he has threatened, it could fall as far as 8.0 (Chart 16). This would pull other EM currencies down further. GBP will continue to be buffeted by Brexit scenarios. A no-deal Brexit could bring it down to 1.00 against the USD, whereas Remain or a very soft Brexit would take it back to PPP, 1.43. The current level is a probability weighted average of the two. Chart 15Dollar Has Moved Broadly Sideways
Dollar Has Moved Broadly Sideways
Dollar Has Moved Broadly Sideways
Chart 16CNY Could Fall Much Further
CNY Could Fall Much Further
CNY Could Fall Much Further
Commodities: The oil price has been hurt by a slowing of demand in developed economies (Chart 17). Supply, however, remains tight, and our energy strategists have cut their forecast for Brent this year only modestly to an average of $66 a barrel (from an earlier forecast of $70, and from a current spot price of $60).3 Industrial commodities continue to struggle because of China’s slowdown (Chart 18) and are unlikely to recover until China’s stimulus is beefed up. Gold remains a good insurance for investors worried about geopolitical risk, recession, and inflation. Chart 17EM Oil Demand Has Been Weak
EM Oil Demand Has Been Weak
EM Oil Demand Has Been Weak
Chart 18Industrial Commodities Hurt By China
Industrial Commodities Hurt By China
Industrial Commodities Hurt By China
Garry Evans, Senior Vice President Chief Global Asset Allocation Strategist garry@bcaresearch.com 1 Please see Geopolitical Strategy Weekly, “Big Trouble In Greater China,” dated August 23, 2019, available at gps.bcareseach.com 2 Please see Global Asset Allocation, “GAA Monthly Portfolio Update,” dated February 1, 2018, available at gaa.bcaresearch.com. 3 Please see Commodity & Energy Strategy, “USD Strength Slows Oil Demand Growth; 2020 Brent Forecast Remains At $75/bbl,” dated August 22, 2019, available at ces.bcaresearch.com Recommended Asset Allocation
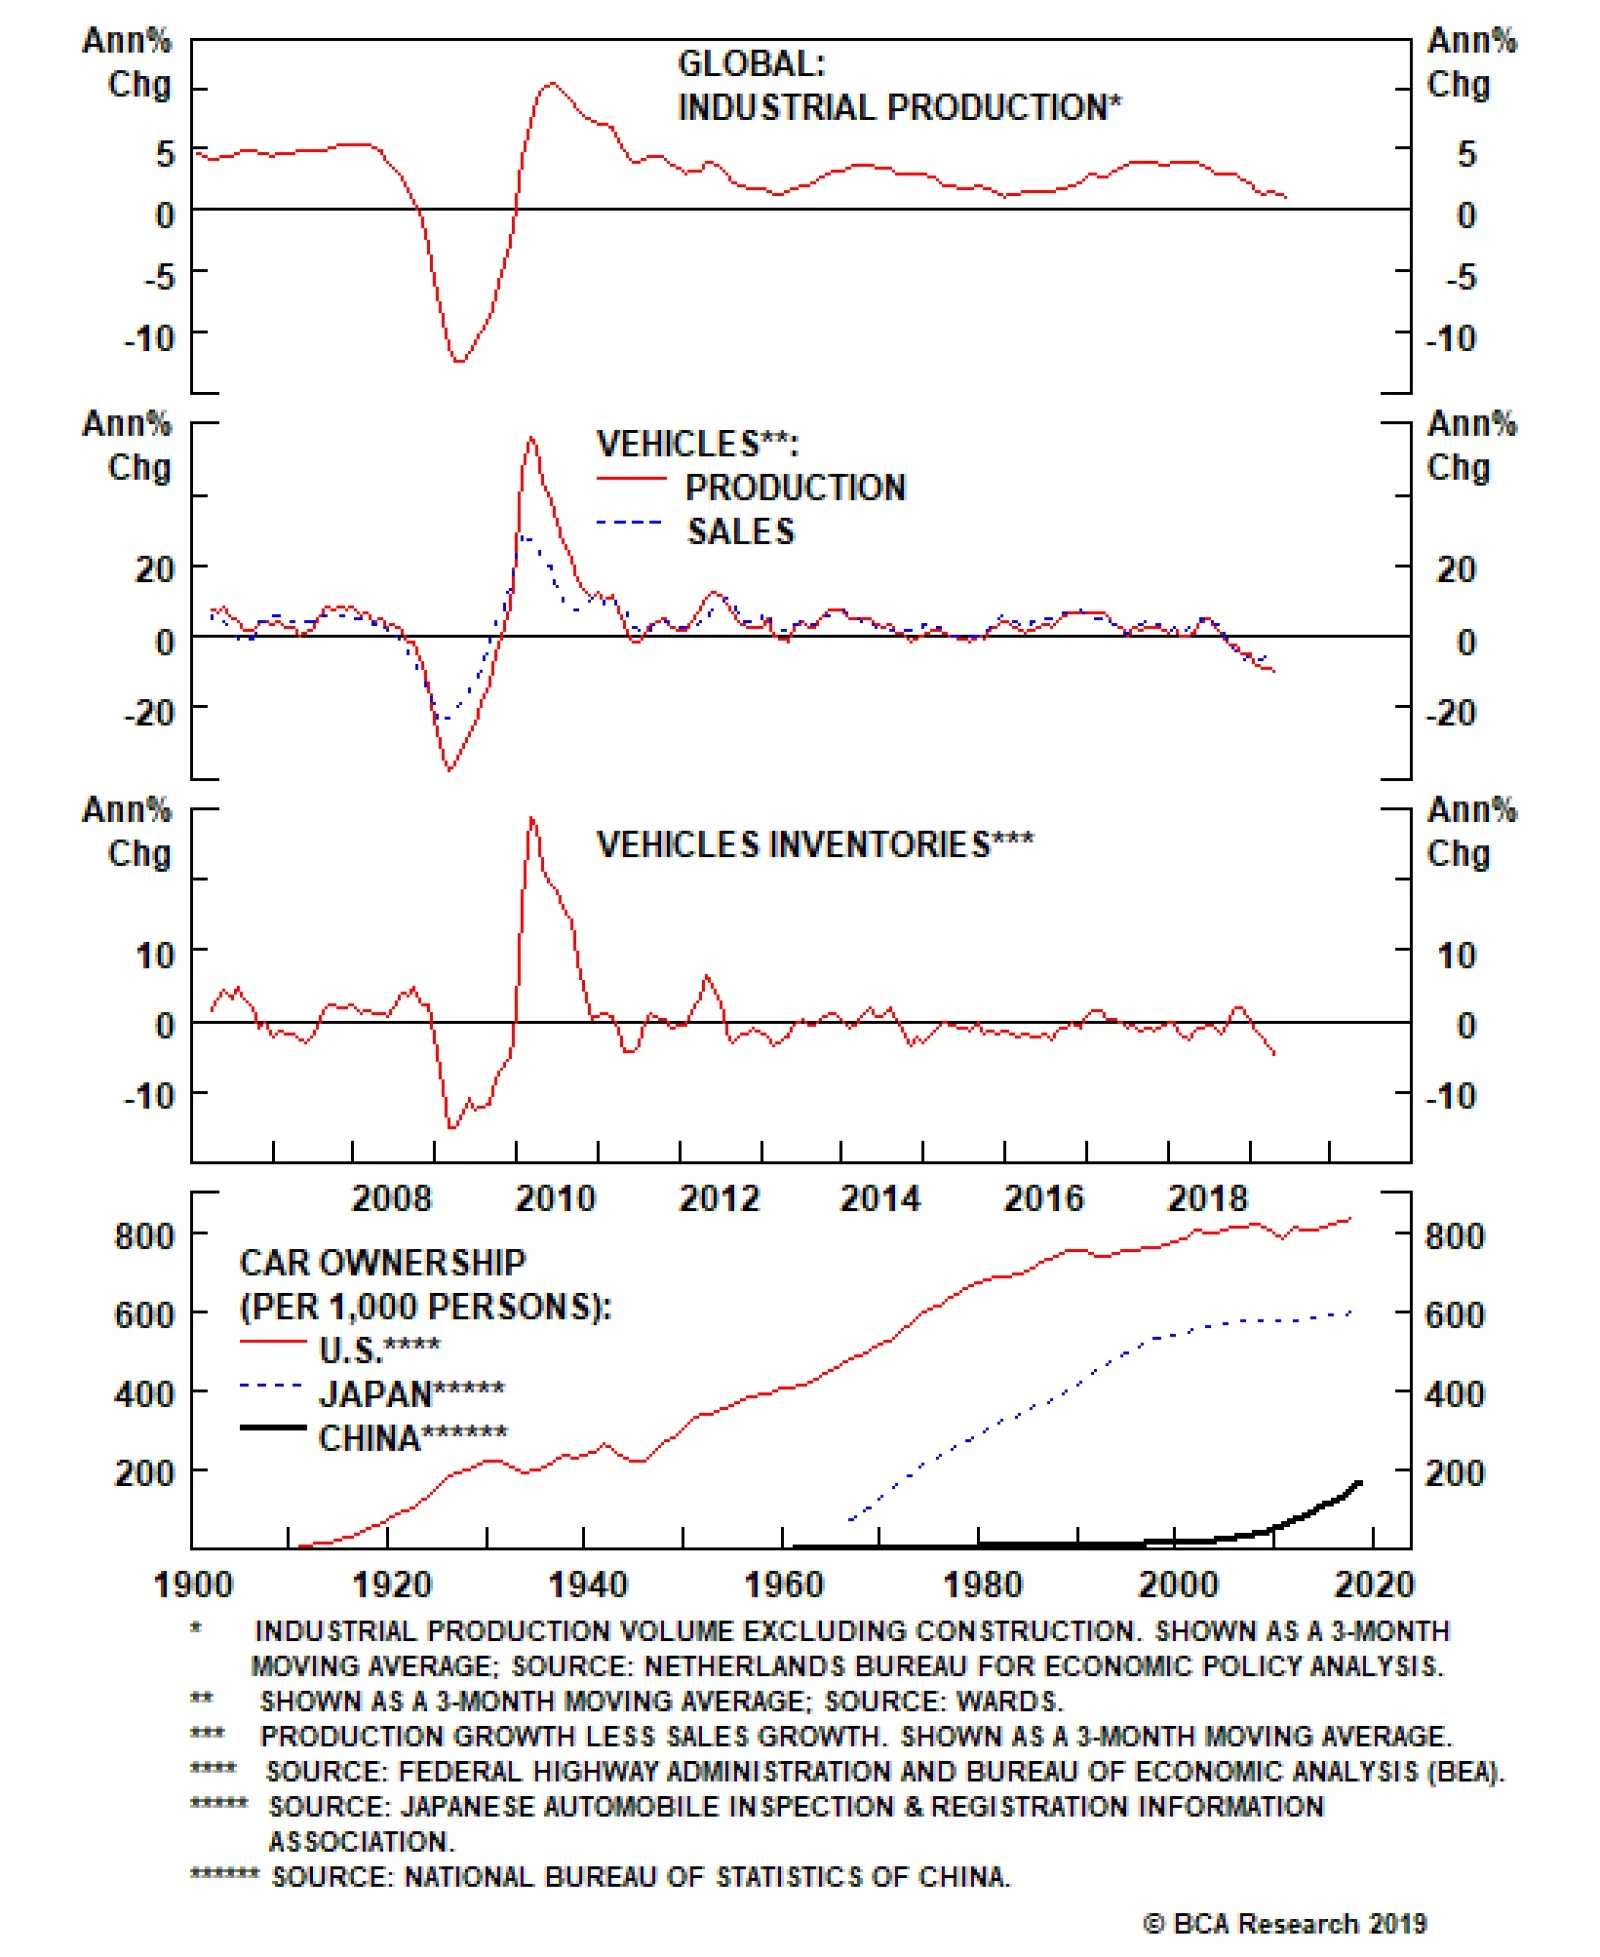
The automobile sector has been the key driver of the global manufacturing slowdown. This is in contrast to 2015-16, when the main culprit was declining energy capex. According to Wards, global vehicle production is down about 10% from year-ago levels, by far…
Could rising angst induce an actual recession? Theoretically, the answer is yes. A sudden drop in confidence can generate a self-fulfilling cycle where rising pessimism leads to less private-sector spending, higher unemployment, lower corporate profits,…
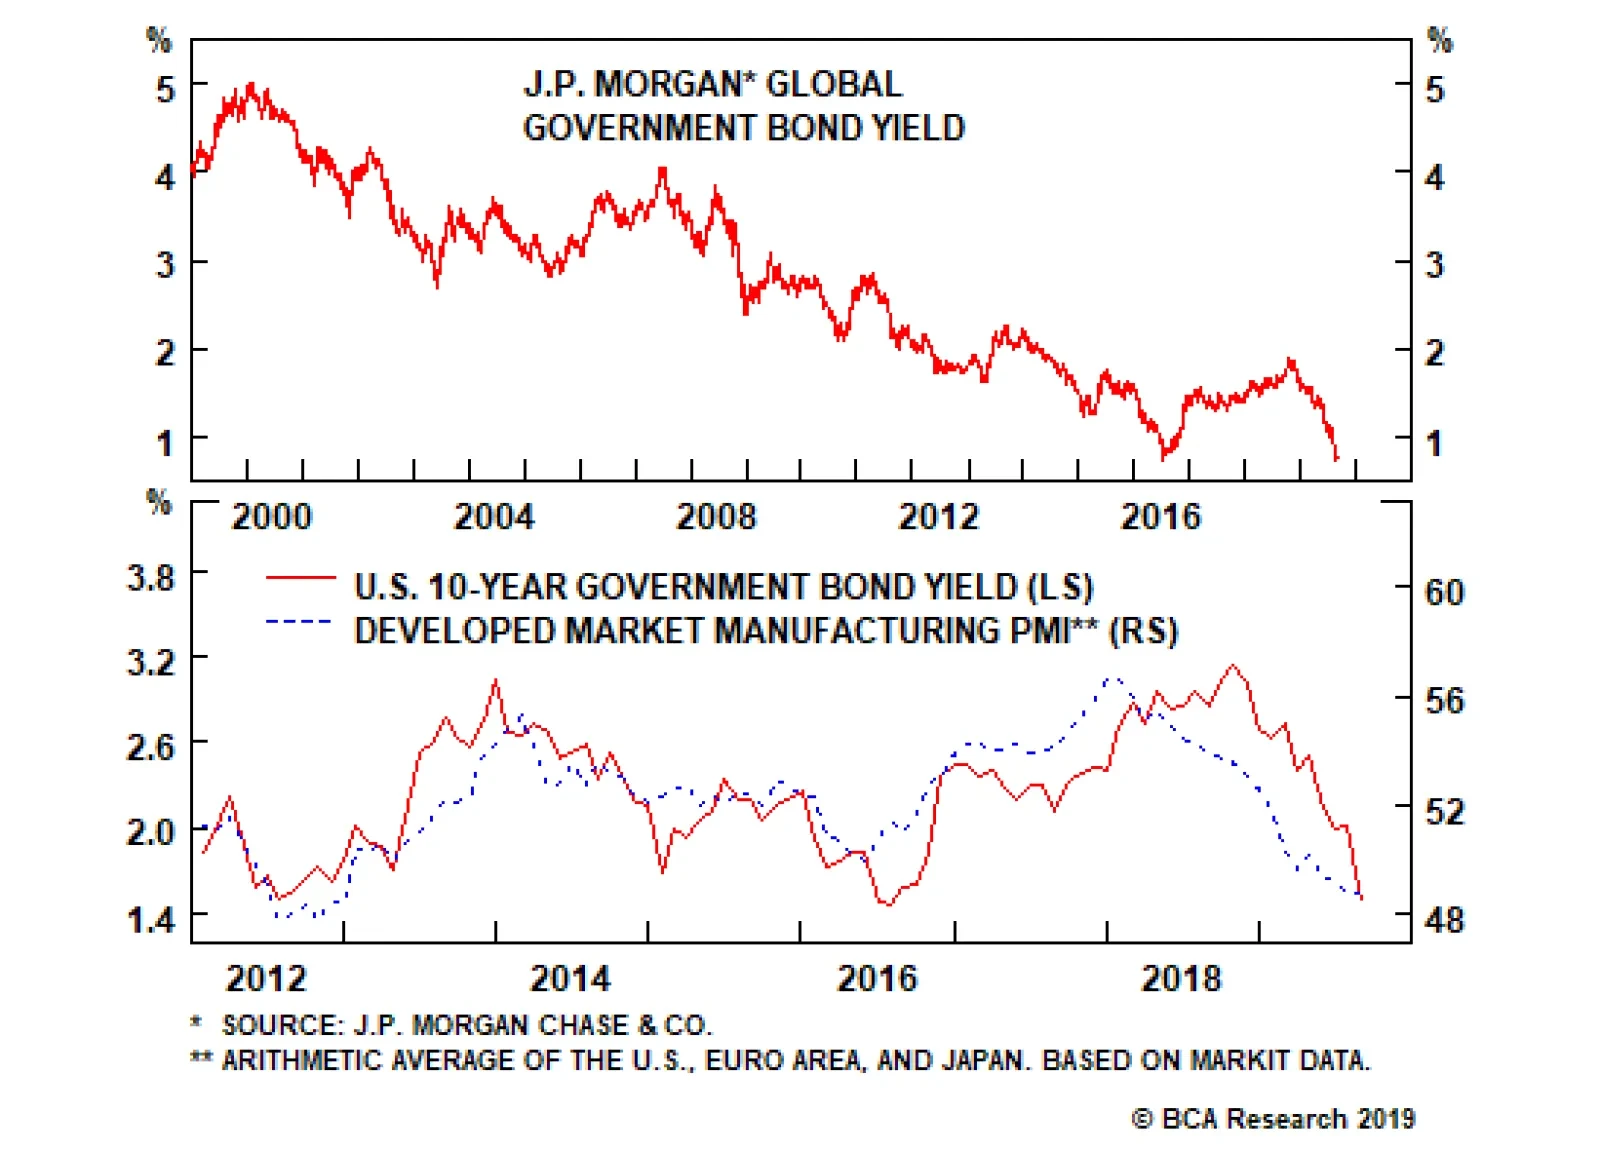
After peaking last year, global bond yields have plunged anew. The strong correlation between government bond yields and manufacturing purchasing manager indices, argues that to a large extent, the decline in yields has been driven by the slowdown in global…
Highlights The U.S.-Sino trade war is taking a dangerous turn, but the U.S. should avoid a recession until 2022. Global growth will bottom in early 2020. The Fed is set to cut rates two to three times in the next year. Safe-haven bonds have more tactical upside, but will perform poorly on a cyclical basis. Long-term investors should use the next six to nine months to offload their corporate bonds. Equities will be volatile for the rest of 2019; a breakout is forecast for 2020. Long-term investors should favor stocks over bonds, and international stocks over U.S. ones. Feature The yield curve has become the punch line of late-night shows, triggered by the 2-/10-year yield curve inversion in early August. Recession fears have hit the front page. There are good reasons for the mounting concern. Historically, yield curve inversions have done an excellent job forecasting recession. The trade war between the U.S. and China is intensifying at an alarming speed. Moreover, global government bond yields are dipping to all-time lows. Additionally, the global ZEW and PMIs are depressed, while the global production of capital goods and machinery is contracting (Chart I-1). Despite this backdrop, the odds of a U.S. recession are overstated. Consumers in the U.S. and other advanced economies are healthy, the U.S. Federal Reserve and other major central banks are easing, and global financial conditions are supporting growth. We expect stocks to break out of their volatile period of consolidation early next year. Bond yields should rise later this year, but it is too early to stand in front of their downward trend. Finally, long-term investors should use any additional narrowing in credit spreads to lighten their exposure to corporates. U.S. Recession Odds Are Low The yield curve signal is not as dire as the headlines suggest. The inversion is incomplete; the curve is inverted up to the five-year mark and beyond that point, it steepens again. If the yield curve foreshadows a recession, then its slope would be negative across all maturities (Chart I-2). Chart I-1The List Of Worries Is Long
The List Of Worries Is Long
The List Of Worries Is Long
Chart I-2
The consumer sector is doing well despite the global growth slowdown. Real retail sales, excluding motor vehicles, are growing at 4.4% and have quickly recovered from this past winter’s government shutdown. Meanwhile, retailers such as Walmart, Target, Home Depot and Lowe’s are reporting strong numbers. Three factors insulate consumer spending from global woes. First, household disposable income is expanding at a healthy 4.7% pace, courtesy of a tight labor market. Secondly, household balance sheets are robust. Household debt-servicing costs only represent 9.9% of disposable income, the lowest reading in more than four decades (Chart I-3, first panel). According to a December BIS paper, debt-servicing costs are one of the best forecasters of recessions.1 Additionally, household debt relative to GDP and to household assets is at 16- and 34-year lows, respectively (Chart I-3, second and third panel). Thirdly, the U.S. savings rate, which stands at 8.1%, already offers a cushion against adverse shocks and has limited upside. The corporate sector also displays some easily overlooked positives. So far, the PMIs and capex growth are still in mid-cycle slowdown territory. Meanwhile, debt loads have never provided an accurate recessionary signal. Since the end of the gold standard, recessions have always materialized after debt-servicing costs as a share of EBITDA rose two to four percentage points above their five-year moving average. We are nowhere near there (Chart I-4). Chart I-3Consumer Balance Sheets Are Very Robust
Consumer Balance Sheets Are Very Robust
Consumer Balance Sheets Are Very Robust
Chart I-4Corporate Debt Is Not In Recessionary Territory
Corporate Debt Is Not In Recessionary Territory
Corporate Debt Is Not In Recessionary Territory
Nevertheless, we will remain vigilant on the capex trend. Corporate investment may not indicate a recession, but the escalating trade war with China will hurt capex intentions. Even if capex contracts, as in 2016, the economy can still avoid a recession. The factors that prompted slowdowns in global trade and manufacturing provide a mixed message. Housing is showing some positive signs after subtracting from GDP in the past six quarters. The NAHB Housing Market Index is recovering smartly from its plunge last year and homebuilder stocks have been outperforming the S&P 500 since October 2018 (Chart I-5). Meanwhile, the 139-basis point collapse in mortgage rates since November 2018 is finally impacting the economy. Mortgage demand is surging, according to the Fed’s Senior Loan Officers Survey. The MBA mortgage applications data corroborate this observation. As a result, both existing home sales and residential investment are trying to bottom (Chart I-6). Chart I-5Leading Indicators Of Residential Activity Are Improving
Leading Indicators Of Residential Activity Are Improving
Leading Indicators Of Residential Activity Are Improving
Chart I-6Positive Signs For Residential Activity
Positive Signs For Residential Activity
Positive Signs For Residential Activity
The liquidity of the U.S. private sector is also strengthening. Deposit growth has reaccelerated after falling to near recessionary levels (Chart I-7) and the non-financial, private sector’s cash holdings are again increasing faster than debt. Furthermore, bank credit is expanding. Chart I-7The Private Sector Is Accumulating Liquidity
The Private Sector Is Accumulating Liquidity
The Private Sector Is Accumulating Liquidity
Waiting For The Global Economy To Bottom Global growth should bottom by early 2020. Thus, while the U.S. economy should avoid a recession, any distinct re-acceleration will wait until next year. The factors that prompted slowdowns in global trade and manufacturing provide a mixed message. The trade war between the U.S. and China is intensifying. Chinese activity has not yet bottomed but policymakers will be increasingly forced to react. However, the global inventory down cycle is advanced, and in Europe, domestic activity indicators are holding up despite the continued deterioration in external and industrial conditions. Trade War The uncertainty created by the Sino-U.S. trade war is hurting global growth. On August 1, U.S. President Donald Trump announced a 10% tariff on the remaining $300 billion of Chinese exports to the U.S. The tariffs are phased in: $112 billions of goods will be taxed on September 1 while $160 billion will be hit on December 15. Unsurprisingly, a vicious circle of retaliation has been unleashed as China imposed a tariff ranging from 5% to 10% on U.S. goods last Friday, to which Trump immediately responded with a tariff hike from 25% to 30% on the $250 billion batch of goods and from 10% to 15% on the $300 billion batch slated to come into place September 1 and December 1. To bring back hedged foreign buying of Treasurys, the Fed will have to engineer a steeper yield curve and lower FX hedging costs. A resumption in talks between Beijing and Washington in September will offer little solace to investors. Even if President Trump is pressured by the stock market and the U.S. electoral calendar to settle for what Beijing is offering, it is not clear that President Xi Jinping will accept a deal. As BCA’s Chief Geopolitical Strategist Matt Gertken discusses in Section II, the two superpowers are locked in a multi-decade geopolitical rivalry and the Hong Kong protests and tensions over Taiwan could move the talks off track. China’s Challenges China’s economy has yet to bottom convincingly. So far, Chinese reflation has been weaker than anticipated. Given that stimulus has not been forceful, the uncertainty produced by the trade war and the illiquidity created by bloated balance sheets is still dragging down China’s marginal propensity to consume (Chart I-8). However, this propensity to spend has little downside, if the past 10 years are any indication. Chinese infrastructure and equipment investment needs to be revived. They are shouldering the bulk of the decline in economic activity and have slowed to an annual pace of 2.8% and -2.1%, respectively. Residential investment is expanding at a 9.4% annual rate (Chart I-9), but according to Arthur Budaghyan, BCA’s Chief Emerging Markets Strategist, even this sector’s strength could be an illusion. Chinese property developers are starting projects to raise funds via pre-sales. However, they are not completing nearly as many projects as they have started.2 Chart I-8A Falling Marginal Propensity To Spend Means More Stimulus Is Needed
A Falling Marginal Propensity To Spend Means More Stimulus Is Needed
A Falling Marginal Propensity To Spend Means More Stimulus Is Needed
Chart I-9
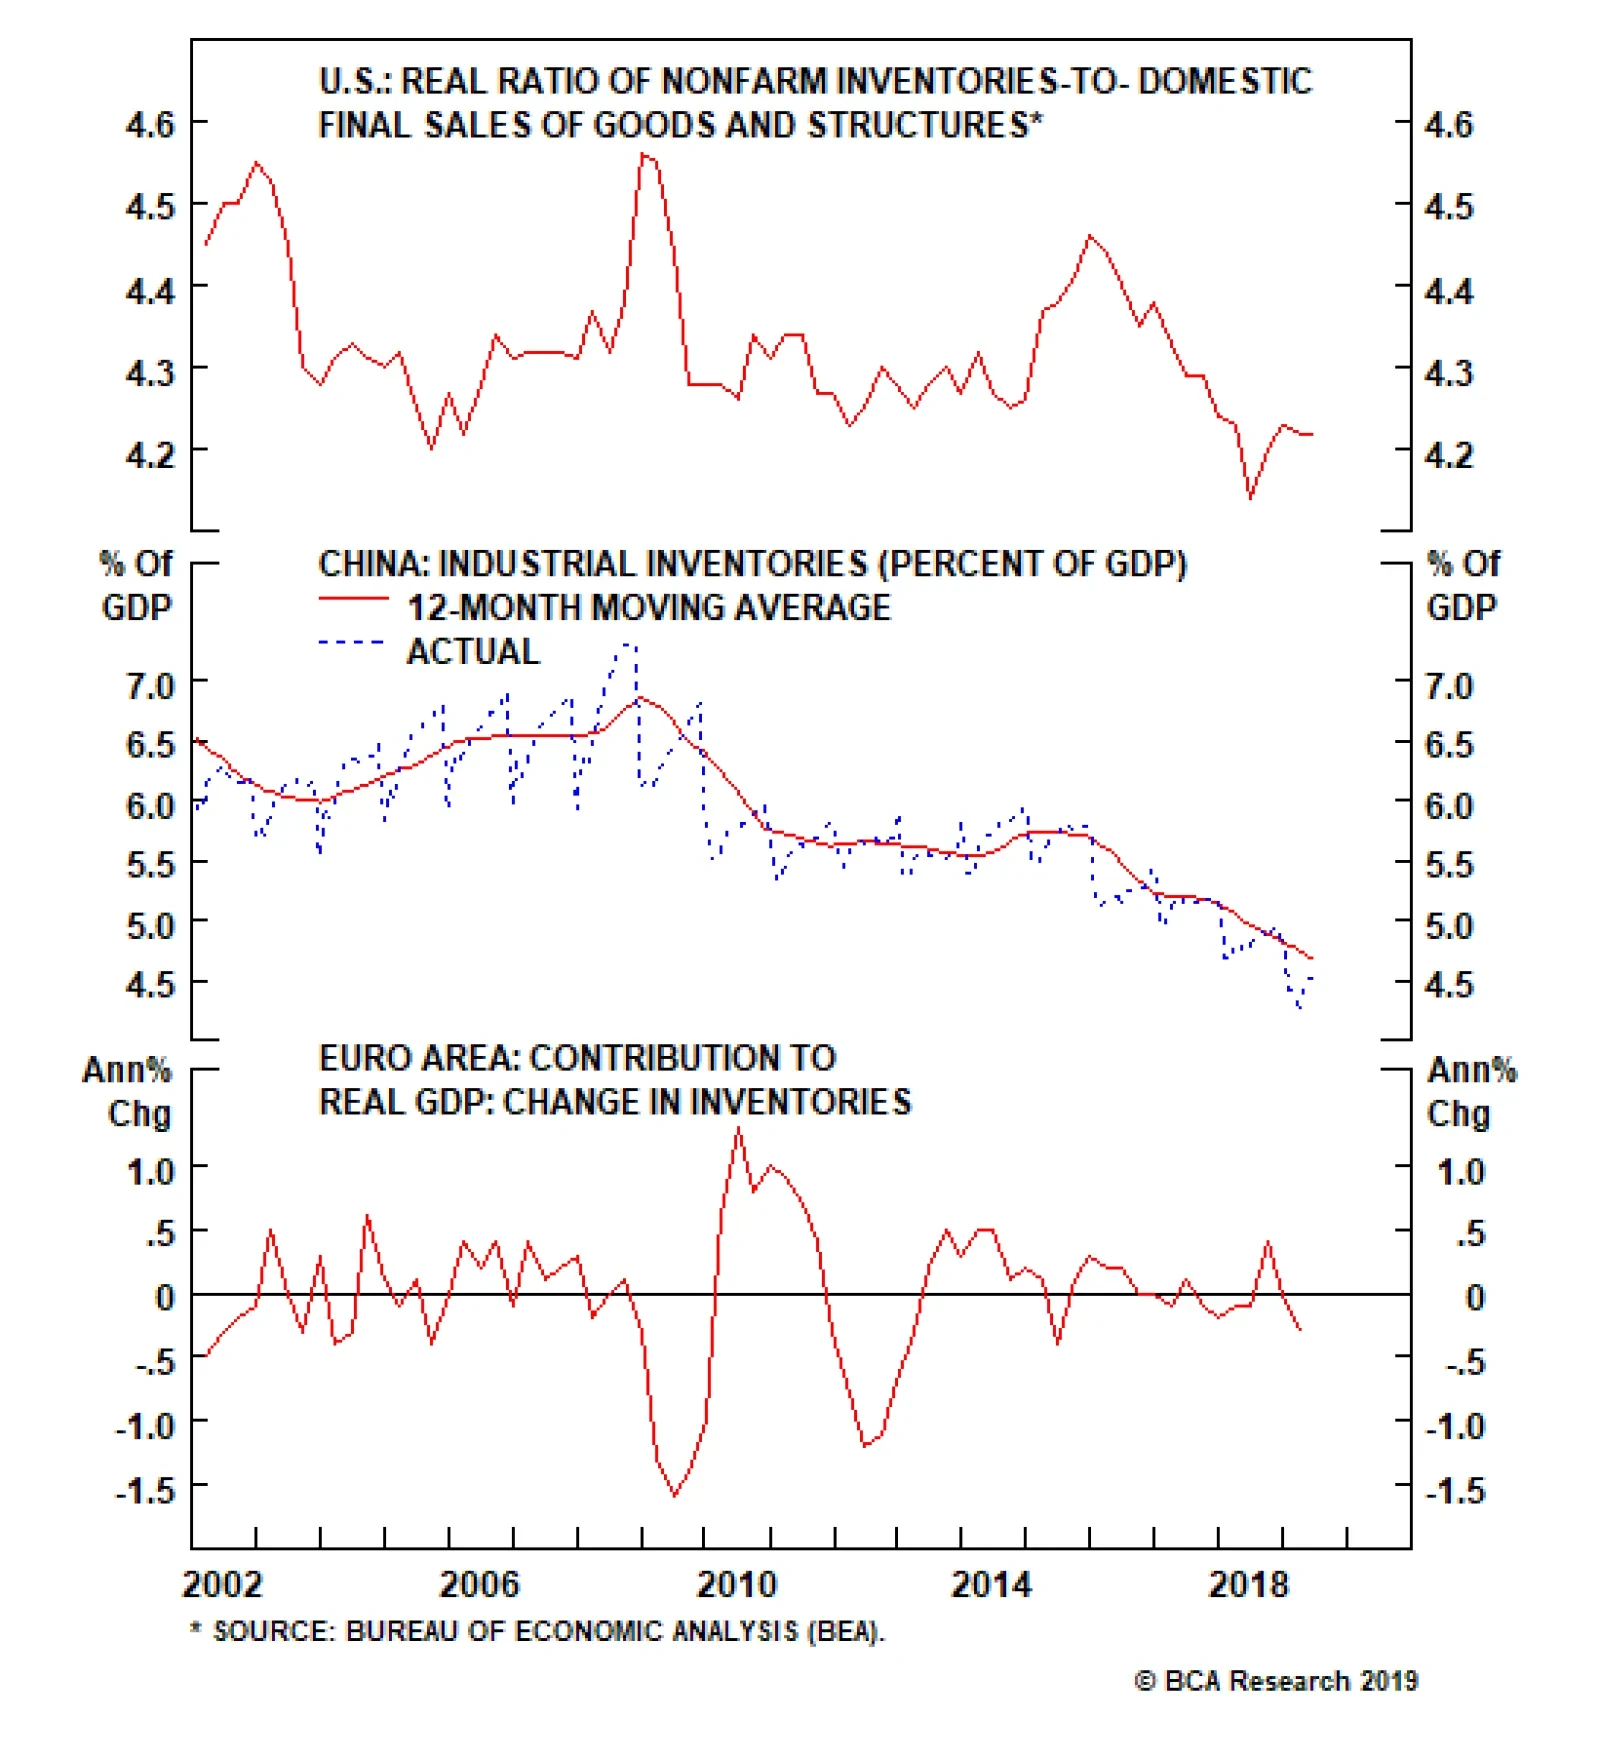
We are not yet ready to give up on Chinese stimulus as the economy is on the verge of a deflationary spiral that could push debt-to-GDP abruptly higher. The following developments support this view: The statement following the July Politburo meeting showed a greater willingness to stimulate economic activity, as long as it does not add to the property bubble. Producer prices are again deflating. Contracting PPIs often unleash vicious circles as they push real rates higher and hurt investment, which foments additional price declines. Retail sales are slowing and the employment components of the manufacturing and non-manufacturing PMIs have fallen to 47.1 and 48.7, respectively. China’s economy needs to be insulated from the intensifying trade war with the U.S. or the deteriorating labor market will dampen consumer spending even more. We expect more tax cuts, more credit growth, and more issuance of local government special bonds to finance government spending, following China’s 70th anniversary celebrations on October 1. As Chart I-10 illustrates, an acceleration in total social financing will ultimately lift EM PMIs as well as Asian and European exports. Inventory Cycle The inventory cycle is very advanced. Inventories in the U.S., China and euro area are depleting (Chart I-11). Inventories cannot fall forever, especially when global monetary policy is increasingly accommodative and fiscal policy is loosened. Chart I-10More Chinese Stimulus Will Eventually Support Global Growth
More Chinese Stimulus Will Eventually Support Global Growth
More Chinese Stimulus Will Eventually Support Global Growth
Chart I-11The Inventory Purge Is Advanced
The Inventory Purge Is Advanced
The Inventory Purge Is Advanced
Global activity can rebound if the inventory adjustment ends. Inventory fluctuations help drive the Kitchin cycle, a 36-40 month oscillation in activity. According to BCA’s Chief Global Strategist, Peter Berezin, the current slowdown is nearing 18 months, the typical length of a down oscillation in these cycles (Chart I-12).3 Europe The manufacturing-heavy euro area will benefit when the global industrial cycle bottoms, but domestic tailwinds are also emerging. European deposits accumulation is quickening, driven by households (Chart I-13, top panel). Meanwhile, the European credit impulse has recovered thanks to the fall in both non-performing loans and borrowing costs (Chart I-13, bottom panel). Moreover, consumer spending is healthy as household balance sheets are improving and wage growth is accelerating to a 3.2% annual pace. Finally, last month we highlighted that the euro area fiscal thrust is set to increase by 0.7% of GDP this year.4 Fiscal easing appears set to expand as Germany and Italy study support packages. Finally, the Italian political uncertainty is receding as the Five Star Movement and the Democratic Party have agreed to form a coalition government. Chart I-12The Three-Year Cycle Is Also Advanced
The Three-Year Cycle Is Also Advanced
The Three-Year Cycle Is Also Advanced
Chart I-13Some Ignored Improvements In Europe
Some Ignored Improvements In Europe
Some Ignored Improvements In Europe
At the moment, the biggest risk for Europe is the significant probability of a No-Deal Brexit. After the recent decision to prorogue Parliament, Matt Gertken raised his probability of a No-Deal Brexit to one third from 20%.Such an event would negatively impact Dutch, German and French exports, which could scuttle any improvement in Europe. Adding It Up The combined effects of more Chinese stimulus in the fourth quarter, an impending end to the global inventory drawdown, and an endogenous improvement in Europe, all should ultimately outweigh the negatives created by the U.S.-Sino trade war. Moreover, global financial conditions are easing (Chart I-14). Therefore, the fall in global bond yields should push the G-10 12-month credit impulse higher (Chart I-14, bottom panel). Lower oil prices should also help G-10 consumers. Early indicators support this assessment. BCA’s Global Leading Economic Indicator has been slowly bottoming, and according to its diffusion index, it will soon move higher (Chart I-15, top panel). Moreover, Singapore’s container throughput is tentatively stabilizing, while our Asian EM Diffusion Index is improving, albeit from depressed levels (Chart I-15, second panel). Finally, ethylene and propylene prices are rallying with accelerating momentum (Chart I-15, third and fourth panels). Chart I-14Easier Financial Conditions Favor Credit Growth
Easier Financial Conditions Favor Credit Growth
Easier Financial Conditions Favor Credit Growth
Chart I-15Some Growth Indicators Are Stabilizing
Some Growth Indicators Are Stabilizing
Some Growth Indicators Are Stabilizing
Bottom Line: The U.S. economy will probably slow further in the coming months, but it will not enter into recession anytime soon. Neither debt nor consumers pose problems, the housing sector is turning the corner and the private sector’s liquidity position is strengthening. Meanwhile, global activity is trying to bottom, but any improvement will be delayed by the latest round of trade tensions. However, global policymakers are responding, thus global growth should improve by early 2020. Fed Policy: More Cuts Expected Chart I-16A Liquidity Crunch In The Interbank Market?
A Liquidity Crunch In The Interbank Market?
A Liquidity Crunch In The Interbank Market?
Our base case is that the Fed will cut rates twice more in the coming nine months. In the tails of the probability distribution, three supplementary cuts are more likely than only one additional cut. Paradoxically, liquidity considerations support our Fed view. A recurring theme in our research is the improvement in global liquidity indicators such as excess money, deposit growth and our financial liquidity index.5 However, these indicators are not able to boost growth because of an important technical consideration. What might be classified as excess reserves by the Fed may not be free reserves. Higher Supplementary Leverage Ratios under Basel III rules require commercial banks to hold greater levels of excess reserves to meet their mandatory Tier 1 capital ratios. Since the Fed’s balance sheet runoff results in falling excess reserves, the decline in reserves may have already created some illiquidity in the interbank system. Global central banks have been divesting from the T-bill market, which is worsening the decline in excess reserves. They have parked their short-term funds at the New York Fed’s Foreign Repurchase Agreement Pool (Foreign Repo Pool) which limits the availability of reserves in the banking system (Chart I-16).6 These dynamics increase the cost of hedging the dollar for foreign buyers of U.S. assets. When reserves fall below thresholds implied by Basel III regulations, global banks lose their ability to use their balance sheets to conduct capital market transactions. Without this necessary wiggle room, they cannot arbitrage away wider cross-currency basis swap spreads and deviations of FX forward prices from covered interest rate parity. For foreign investors, the cost of hedging their FX exposure increases. Together with the flatness of the U.S. yield curve, hedged U.S. Treasurys currently yield less than German Bunds or JGBs (Table I-1).
Chart I-
Chart I-17Declining Excess Reserves Hurt Risk Assets And Growth
Declining Excess Reserves Hurt Risk Assets And Growth
Declining Excess Reserves Hurt Risk Assets And Growth
Lower excess reserves and higher hedging costs have been bullish for the USD and negative for the global economy. Instead of buying hedged Treasurys, foreigners purchase U.S. assets unhedged (agency and corporate bonds, not Treasurys). Thus, falling excess reserves have been correlated with a stronger dollar, softer global growth and weaker EM asset and FX prices (Chart I-17). This adverse environment has accentuated the downside in Treasury yields and flattened the yield curve (Chart I-17, bottom panel). Going forward, these problems should intensify. The Treasury will issue over US$800 billion of debt by year-end to replenish its cash balance and finance the bulging U.S. budget deficit. Primary dealers will continue to plug the void left by foreigners and will purchase the expanding issuance (Chart I-18). In the past year, primary dealers have already increased their repo-market borrowing by $300 billion to finance their inventories of securities. They will need to expand these borrowings, which will further lift the cost of hedging U.S. assets. Thus, foreign investors faced with $16 trillion of assets with negative yields will buy more U.S. assets on an unhedged basis. The dollar will rise and global growth conditions will deteriorate. The Fed will have to cut rates two to three more times, otherwise the dangerous feedback loop described above will take hold. These cuts are more than domestic economic conditions warrant. To bring back hedged foreign buying of Treasurys, the Fed will have to engineer a steeper yield curve and lower FX hedging costs. The end of the balance sheet runoff is a step in the right direction, but it will not be enough. The BCA Financial Stress Index and our Fed Monitor are consistent with this view (Chart I-19). Moreover, the intensifying trade war is hurting the outlook for growth, inflation expectations and the stock market. Chart I-18A Large Inventory Build Up By Primary Dealers
A Large Inventory Build Up By Primary Dealers
A Large Inventory Build Up By Primary Dealers
Chart I-19Two To Three More Cuts Are Coming
Two To Three More Cuts Are Coming
Two To Three More Cuts Are Coming
Investment Implications Government Bonds We have revised our position on an imminent end to the bull market. We do expect bond yields to be higher in 12 months, but for now the global economy has too many risks to time a bottom in yields. The cyclical picture for bonds is bearish. Treasurys have outperformed cash by 8% in the past year, a performance normally associated with a fed fund rate that is 200 to 300 basis points below what markets anticipated 12 months ago (Chart I-20). In order for Treasurys to continue outperforming cash, the Fed must cut rates to zero next year. Nonetheless, a U.S. recession is not in the offing and the global economy should perk up by early 2020. At most, the Fed will validate current rate expectations of 96 basis points of cuts. Chart I-20The Fed Must Cut To Zero For Bonds To Further Outperform Cash Next Year
The Fed Must Cut To Zero For Bonds To Further Outperform Cash Next Year
The Fed Must Cut To Zero For Bonds To Further Outperform Cash Next Year
Valuations are also consistent with Treasurys delivering negative returns in the next 12 months. According to the BCA Bond Valuation Index, Treasurys are extremely overvalued. Moreover, real 10-year yields are two standard deviations below the three-year moving average of real GDP growth, a proxy for potential GDP (Chart I-21). Investors should wait to sell bonds until the Fed cuts rates by another 50 basis points, global and U.S. PMIs stabilize, and our cyclical indicator sends a sell signal. Technicals also point to poor 12-month prospective returns. The 13-week and 52-week rates of change in yields are consistent with tops in bond prices (Chart I-22). Positioning is also very stretched, as highlighted by the J.P. Morgan Duration Survey, the Bank of America Merrill Lynch Investors Survey, ETF flows, and government bonds futures and options holdings of asset managers. As a result, our Composite Technical Indicator is very overbought (Chart I-22, bottom panel). Chart I-21U.S. Bonds Are Very Expensive ...
U.S. Bonds Are Very Expensive ...
U.S. Bonds Are Very Expensive ...
Chart I-22... And Very Overbought
... And Very Overbought
... And Very Overbought
The quickening pace of accumulation of securities on bank balance sheets also points to higher yields in 12 months (Chart I-23). As banks stockpile liquid assets, they accumulate more juice to fuel future lending. However, the rising cost of hedging FX exposure is bullish for the dollar. Hence, increasing Treasury holdings will not lift yields until the Fed cuts rates more aggressively. We are reluctant to recommend shorting / underweighting bonds. As Chart I-24 illustrates, mounting uncertainty over economic policy anchors U.S. yields. Last week’s round of tariff increases, along with the Brexit saga, suggests that the uncertainty has not yet peaked. Chart I-23A Coiled Spring
A Coiled Spring
A Coiled Spring
Chart I-24Uncertainty Is Keeping Global Bonds Expensive
Uncertainty Is Keeping Global Bonds Expensive
Uncertainty Is Keeping Global Bonds Expensive
The collapse in German yields is also not finished. The fall in bund yields to -0.7% has dragged down rates worldwide as investors seek positive long-term returns. In response, the U.S. 10-year premium dropped to -1.1%. Historically, bunds end their rally when yields decline 120 basis points below their two-year moving average (Chart I-25). If history is a guide, German yields could bottom toward -1%, which is in line with Swiss 10-year yields. The 1995 experience also argues against an imminent end to the bond rally. In a recent Special Report, BCA’s U.S. Equity Strategy service highlighted the parallels between today’s environment and the aftermath of the December 1994 Tequila Crisis.7 In that episode, global growth troughed and the Fed cut rates three times before the U.S. ISM Manufacturing Index bottomed in January 1996. Only then did Treasury yields turn higher (Chart I-26). A similar scenario could easily unfold. Chart I-25More Downside For German Yields
More Downside For German Yields
More Downside For German Yields
Chart I-26Bottom In Yields: Wait For The ISM To Turn And The Fed To Cut More
Bottom In Yields: Wait For The ISM To Turn And The Fed To Cut More
Bottom In Yields: Wait For The ISM To Turn And The Fed To Cut More
EM assets are vulnerable and could spark a last stampede into U.S. Treasurys. Investors of EM fixed-income products have not yet capitulated. EM assets perform poorly when global growth is weak, dollar funding is hard to come by and trade uncertainty is rising. Yet, yields on EM local-currency bonds have fallen, indicating little selling pressure. Rather than dispose of their EM holdings, investors have hedged their EM exposure by selling EM currencies. Therefore, EM bonds are rallying with EM currencies falling (Chart I-27), which is a rare occurrence. Recent cracks in EM high-yield bonds and the breakdown in EM currencies suggest investors will not ignore the trade war for much longer. The ensuing flight to safety should pull down Treasury yields. Chart I-27A Rare Occurrence
A Rare Occurrence
A Rare Occurrence
BCA’s Cyclical Bond Indicator has yet to flash a buy signal, which will only happen when the indicator moves above its 9-month moving average (Chart I-28). Investors should wait to sell bonds until the Fed cuts rates by another 50 basis points, global and U.S. PMIs stabilize, and our cyclical indicator sends a sell signal. As a corollary, we remain positive on gold prices and expect the yellow metal to move to $1,600 in the coming months. Chart I-28BCA Cyclical Bond Indicator: Don't Sell Yet
BCA Cyclical Bond Indicator: Don't Sell Yet
BCA Cyclical Bond Indicator: Don't Sell Yet
Corporate Bonds Chart I-29Corporate Bond Fundamentals Are Worsening
Corporate Bond Fundamentals Are Worsening
Corporate Bond Fundamentals Are Worsening
The long-term outlook for corporate bonds is deteriorating enough that long-term investors should use any rally to lighten their exposures. However, on a six- to nine-month horizon, stresses will probably remain contained. A significant deterioration in corporate health will hurt this asset class’s long-term returns. Recent data revisions pushed GDP and productivity well below previous estimates. This curtailed corporate profitability, lifted debt-to-cash flow ratios, and hurt interest coverage measures. BCA’s Corporate Health Monitor is flashing its worst reading since the financial crisis. Moreover, the return on capital is at its lowest level in this cycle. Historically, these developments have pointed to higher default rates and spreads (Chart I-29). Worryingly, average interest coverage and profitability levels are distorted. Tech firms only account for 8% of the U.S. corporate bond universe, yet they represent 19% of cash flows generated by the U.S. corporate sector. Outside the tech sector, cash generation is poorer than suggested by our Corporate Health Monitor. This will amplify losses when the default cycle begins. The poor quality of bond issuance in the past 8 years will also hurt recovery rates when defaults rise. Since then, junk bonds constitute 10% of overall issuance, and BBB-rated bonds represent 42% of investment-grade issues. Historical averages are 9% and 27%, respectively. Additionally, covenants have been particularly light in the same period. Investors with horizons of one year or less still have a window to own corporate bonds. Moreover, since the deviation of corporate debt-servicing costs as a percentage of EBITDA remains well below historical trigger points, an imminent and durable jump in spreads is unlikely. Within the corporate universe, BCA’s U.S. Bond Strategy service currently favors high-yield to investment-grade bonds.8 Breakeven spreads in the junk space are much more rewarding than those offered by investment-grade issues (Chart I-30). Equities We expect the S&P 500 to remain volatile and below 3,000 for the rest of 2019. Early next year, an upside breakout will end this period of churn. The S&P will probably soon test the 2,700 level. Technically, the selling is not exhausted. The number of stocks above their 40-, 30- and 10-week moving averages have formed successively lower highs and are not yet oversold (Chart I-31). Furthermore, the Fed is unlikely to deliver a dovish surprise in September. Fed Chairman Jerome Powell’s recent speech at Jackson Hole suggests that the Fed needs to see more pain before moving ahead of the curve. Chart I-30Short-Term Investors Should Favor Junk Over Investment Grade Issues
Short-Term Investors Should Favor Junk Over Investment Grade Issues
Short-Term Investors Should Favor Junk Over Investment Grade Issues
Chart I-31This Correction Can Run Further
This Correction Can Run Further
This Correction Can Run Further
Once stocks stabilize, the subsequent rebound will not lead to an immediate breakout this year. Yields will move up when growth picks up or if President Trump becomes less combative on trade. However, falling interest rates have been a crucial support for stock prices in 2019. As the 1995-1996 experience shows, when the ISM turned up, the S&P 500 did not gain much traction. Higher yields pushed down multiples even as earnings estimates strengthened. We are more positive on the outlook for stocks next year with BCA’s Monetary Indicator pointing to higher stock prices (see Section III). Moreover, bear markets materialize only when a recession is roughly six to nine months away (Chart I-32). The S&P still has time to rally because we do not anticipate a recession until early 2022. Chart I-32No Recession, No Bear Market
No Recession, No Bear Market
No Recession, No Bear Market
Chart I-33Better Prospects For Non-U.S. Stocks
Better Prospects For Non-U.S. Stocks
Better Prospects For Non-U.S. Stocks
Cyclical investors should move their equity holdings outside the U.S. International markets are comparatively cheap (Chart I-33, top panel). Moreover, a rebound in global growth early next year is congruent with U.S. underperformance. Finally, our earnings models forecast an end to the deterioration of European profit growth in September 2019, but not yet in the U.S. (Chart I-33, bottom two panels). Stocks should outperform bonds on a long-term basis. According to the BCA Valuation Index, U.S. stocks are extremely expensive (see Section III). Our valuation indicator would be as elevated as in 2000 if interest rates were not so depressed today. As Peter Berezin showed in BCA’s Global Investment Strategy service, based on current valuation levels, investors can expect 10-year returns of 3.0%, 4.5%, 11.9% and 7.4% for the U.S., euro area, Japan and EM equities, respectively.9 This is not appealing. Nonetheless, long-term equity expected returns are superior to bonds. If held to maturity, they will return 1.5%, -0.7%, and -0.3% annually in the U.S., Germany and Japan, respectively. Practically, long-term investors should favor the rest of the world over the U.S. Local-currency expected returns are higher outside the U.S., and the dollar will decline during the next 10 years. As our Foreign Exchange Strategy service recently highlighted, the dollar is very expensive on a long-term basis.10 Exchange rates strongly revert to their purchasing-parity equilibria in such investment horizons. The growing U.S. twin deficit and the strong desire of reserve managers to diversify out of the greenback will only exacerbate the dollar’s decline. Mathieu Savary Vice President The Bank Credit Analyst August 29, 2019 Next Report: September 26, 2019 II. Big Trouble In Greater China The chance of a U.S.-China trade agreement by November 2020 is still only 40% – but an upgrade may be around the corner. Trump is on the verge of a tactical trade retreat due to fears of economic slowdown and a loss in 2020. Xi Jinping is now the known unknown. His aggressive foreign policy is a major risk even if Trump softens. Political divisions in Greater China – Hong Kong unrest and Taiwan elections – could harm the trade talks. Maintain tactical caution but remain cyclically overweight global equities. “I am the chosen one. Somebody had to do it. So I’m taking on China. I’m taking on China on trade. And you know what, we’re winning.” – U.S. President Donald J. Trump, August 21, 2019 On August 1, United States President Donald Trump declared that he would raise a new tariff of 10% on the remaining $300 billion worth of imports from China not already subject to his administration’s sweeping 25% tariff. Then, on August 13, with the S&P 500 index down a mere 2.4%, Trump announced that he would partially delay the tariff, separating it into two tranches that will take effect on September 1 and December 15 (Chart II-1). Chart II-1Trump's Latest Tariff Salvo
Trump's Latest Tariff Salvo
Trump's Latest Tariff Salvo
Six days later Trump’s Commerce Department renewed the 90-day temporary general license for U.S. companies to do business with embattled Chinese telecom company Huawei, which has ties to the Chinese state and is viewed as a threat to U.S. network security.
Chart II-2
The same pattern played out on August 23 when President Trump responded to China’s retaliatory tariffs by declaring he would raise tariffs to 30% on the first half of imports and 15% on the remainder by December 15. Within a single weekend he softened his rhetoric and said he still wanted a deal. Trump’s tendency to take two steps forward with coercive measures and then one step back to control the damage is by now familiar to global investors. Yet this backpedaling reveals that like other politicians he is concerned about reelection. After all, there is a clear chain of consequence leading from trade war to bear market to recession to a Democrat taking the White House in November 2020. Trump’s approval rating is already similar to that of presidents who fell short of re-election amid recession (Chart II-2) – an actual recession would consign him to history. Will Trump Stage A Tactical Retreat On Trade? Yes. Trump’s predicament suggests that he will have to adjust his policies. Global trade, capital spending, and sentiment have deteriorated significantly since the last escalation-and-delay episode with China in May and June. Beijing’s economic stimulus measures disappointed expectations, exacerbating the global slowdown (Chart II-3). This leaves him less room for maneuver going forward. The fourth quarter of 2019 may be Trump’s last chance to save the business cycle and his presidency. Even “Fortress America” – consumer-driven and relatively insulated from global trade – has seen manufacturing, private investment, and business sentiment weaken. GDP growth is slowing and has been revised downward for 2018 despite a surge in budget deficit projections to above $1 trillion dollars (Chart II-4). Chart II-3China's Gradual Stimulus Yet To Revive Global Economy
China's Gradual Stimulus Yet To Revive Global Economy
China's Gradual Stimulus Yet To Revive Global Economy
Chart II-4Trump's Economy Grew Slower Than Thought Despite Fiscal Stimulus
Trump's Economy Grew Slower Than Thought Despite Fiscal Stimulus
Trump's Economy Grew Slower Than Thought Despite Fiscal Stimulus
The U.S. Treasury yield curve inversion is deepening. While we at BCA would point out reasons that this may not be a reliable signal of imminent recession, Trump cannot afford to ignore it. He is sensitive to the widening talk of “recession” in American airwaves and is openly contemplating stimulus options (Chart II-5). His approval rating has lost momentum, partly due to his perceived mishandling of a domestic terrorist attack motivated by racist anti-immigrant sentiment in El Paso, Texas, but negative financial and economic news have likely also played a part (Chart II-6). Chart II-5Trump Fears Growing Talk Of Recession
Trump Fears Growing Talk Of Recession
Trump Fears Growing Talk Of Recession
In short, the fourth quarter of 2019 may be Trump’s last chance to save the business cycle and his presidency. The core predicament for Trump continues to be the divergence in American and Chinese policy. In the U.S., the stimulating effect of Trump’s Tax Cut and Jobs Act is wearing off just as the deflationary effect of his trade policy begins to bite. In China, the lingering effects of Xi’s all-but-defunct deleveraging campaign are combining with the trade war, and slowing trend growth, to produce a drag on domestic demand and global trade. The result is a rising dollar, which increases the trade deficit – the opposite of what Trump wants and needs (Chart II-7).
Chart II-6
Chart II-7Trump's Fiscal Policy Undid His Trade Policy
Trump's Fiscal Policy Undid His Trade Policy
Trump's Fiscal Policy Undid His Trade Policy
The United States is insulated from global trade, but only to a point – it cannot escape a global recession should one develop (Chart II-8). With global and U.S. equities vulnerable to additional volatility in the near term, Trump will have to make at least a tactical retreat on his trade policy over the rest of the year. First and foremost this would mean: Chart II-8If Total Trade War Causes A Global Relapse, The U.S. Economy Cannot Escape
If Total Trade War Causes A Global Relapse, The U.S. Economy Cannot Escape
If Total Trade War Causes A Global Relapse, The U.S. Economy Cannot Escape
Expediting a trade deal with Japan – this should get done before a China deal, possibly as early as September. Ratifying the U.S.-Mexico-Canada “NAFTA 2.0” agreement – this requires support from moderate Democrats in Congress. The window for passage is closing fast but not yet closed. Removing the threat to slap tariffs on European car and car part imports in mid-November. There is some momentum given Europe’s need to boost growth and recent progress on U.S. beef exports to the EU. Lastly, if financial and economic pressure are sustained, Trump will be forced to soften his stance on China. The problem for global risk assets – in the very near term – is that Trump’s tactical retreat has not fully materialized yet. The new tariff on China is still slated to take effect on September 1. This tariff hike or other disagreements could result in a cancellation of talks or failure to make any progress.11 Even if Trump does pivot on trade, China’s position has hardened. It is no longer clear that Beijing will accept a deal that is transparently designed to boost Trump’s reelection chances. Thus, the biggest question in the trade talks is no longer Trump, but Xi. Is Xi prepared to receive Trump kindly if the latter comes crawling back? How will he handle rising political risk in Hong Kong SAR and Taiwan island,12 and will the outcome derail the trade talks? The biggest question in the trade talks is no longer Trump, but Xi. Bottom Line: Global economic growth is fragile and President Trump has only rhetorically retracted his latest salvo against China. Nevertheless, the clear signal is that he is sensitive to the financial and economic constraints that affect his presidential run next year – and therefore investors should expect U.S. trade policy to turn less market-negative on the margin in the coming months. This is positive for the cyclical view on global risk assets. But the risk to the view is China: whether Trump will take a conciliatory turn and whether Xi will reciprocate. Can Xi Jinping Accept A Deal? Yes. It is extremely difficult for Xi Jinping to offer concessions in the short term. He is facing another tariff hike, U.S. military shows of force, persistent social unrest in Hong Kong, and a critical election in Taiwan. Certainly, he will not risk any sign of weakness ahead of the 70th anniversary of the People’s Republic of China on October 1, which will be a nationalist rally in defiance of imperialist western powers. After that, however, there is potential for Xi to be receptive to any Trump pivot on trade. China’s strategy in the trade talks has generally been to offer limited concessions and wait for Trump to resign himself to them. Concessions thus far are not negligible, but they can easily be picked apart. They consist largely of preexisting trends (large commodity purchases); minor adjustments (e.g. to car tariffs and foreign ownership rules); unverifiable promises (on foreign investment, technological transfer, and intellectual property); or reversible strategic cooperation (partial enforcement of North Korean and Iranian sanctions) (Table II-1). Many of these concessions have been postponed as a result of Trump’s punitive measures.
Chart II-
It is unlikely that Beijing will offer much more under today’s adverse circumstances. The exception is cooperation on North Korea, which should improve. So the contours of a deal are generally known. This is what Trump will have to accept if he seeks to calm markets and restore confidence in the economy ahead of his election. But this slate of concessions is ultimately acceptable for the U.S. Chart II-9China's Ultimate Economic Constraint
China's Ultimate Economic Constraint
China's Ultimate Economic Constraint
China’s demands are that Trump roll back all his tariffs, that purchases of U.S. goods must be reasonable in scale, and that any agreement be balanced and conducted with mutual respect. Of these three, the tariffs and the “respect” pose the most trouble. Trade balance: Washington and Beijing can agree on the terms of specific purchases. China can increase select imports substantially – it remains a cash-rich nation with a state sector that can be commanded to buy American goods. Tariff rollback: This is tougher but can be done. The U.S. will insist on some tariffs – or the threat of tech sanctions – as an enforcement mechanism to ensure that Beijing implements the structural concessions necessary for an agreement. But China might accept a deal in which tariffs were mostly rolled back – say to the original 25% tariff on $50 billion worth of goods. This would likely offset the degree of yuan appreciation to be expected from the likely currency addendum to any agreement. Balance and respect: This qualitative demand is the sticking point. Fundamentally, China cannot reward Trump for his aggressive and unilateral protectionist measures. This would be to set a precedent for future American presidents that sweeping tariffs on national security grounds are a legitimate way of coercing China into making economic structural reforms. Moreover if the U.S. wants to improve the trade balance, China thinks, it cannot embargo Chinese high-tech imports but must actually increase its high-tech exports. Clearly this is a major impasse in the talks. The last point, mutual respect, is the likeliest deal-breaker. It may ultimately hinge on strategic events outside of the realm of trade. But before discussing it further, it is important to recognize that China is not invincible – it has a pain threshold. Deterioration in China’s labor market is of utmost seriousness to any Chinese leader (Chart II-9). And the economy is still struggling to revive. Xi’s reform and deleveraging campaign of 2017-18 has largely been postponed but the lingering effects are weighing on growth and the property sector remains under tight regulation. Moreover the removal of implicit guarantees, and rare toleration of creative destruction (Chart II-10), have left banks and corporations afraid to take on new risks. The state’s reflationary measures, including a big boost to local government spending, have so far been merely sufficient for domestic stability. Chart II-10Creative Destruction In China
Creative Destruction In China
Creative Destruction In China
These problems can be addressed by additional policy easing. But the domestic political crackdown and the break with the U.S. have shaken manufacturers and private entrepreneurs to the bone, suppressing animal spirits and reducing the demand for loans. Ultimately a short-term trade deal to ease this economic stress would make sense for Xi Jinping, even though he knows that U.S. protectionism and the conflict over technological acquisition will persist beyond 2020 and beyond Trump. The threat of a sharp and destabilizing divorce from the U.S. is a real and present danger to the long-term stability of China’s economy and the Communist regime. Xi is a strongman leader, but is he really ready for Mao Zedong-style austerity? Is he not more like former President Jiang Zemin (ruled 1993-2003), who imposed some austerity while prizing domestic economic and political stability above all? To this question we now turn. Bottom Line: China has become the wild card in the trade war. Trump’s need to prevent a recession is known. Beijing has a higher pain threshold and could walk away from the deal to punish Trump (upsetting the global economy and diminishing Trump’s reelection prospects). This would set the precedent for future American presidents that China will not bow to gunboat diplomacy. Will Xi Jinping Overplay His Hand? Be Afraid. For decades China’s main foreign policy principle has been to “lie low and bide its time,” to paraphrase former leader Deng Xiaoping. In the current context this means maintaining a willingness to engage with the U.S. whenever it engages sincerely. This approach implies making the above concessions to minimize the immediate threat to stability from the trade war, while biding time in the longer run rivalry against the United States. Such an approach would also imply assisting the diplomatic process on the Korean peninsula, avoiding a military crackdown in Hong Kong, and refraining from aggressive military intimidation ahead of Taiwan’s election in January. Chart II-11China's Vast Market Its Most Persuasive Tool
China's Vast Market Its Most Persuasive Tool
China's Vast Market Its Most Persuasive Tool
After all, there is no better way for the Communist Party to undercut dissidents in Hong Kong and Taiwan than to strike a deal with the United States. This would demonstrate that Xi is a pragmatic leader who is still committed to “reform and opening up.” It would help generate an economic rebound that would bring other countries deeper into Beijing’s orbit (Chart II-11). China’s vast domestic market is ultimately its greatest strength in its contest with the United States. In short, conventional Chinese policy suggests that Xi should perpetuate the long success story since 1978 by striking another deal with another Republican president. The catch is that Xi Jinping is not conventional. Since coming to power in 2012, Xi has eschewed the subtle strategies of Sun Tzu and Deng Xiaoping in favor of a more ambitious approach: that of declaring China’s arrival as a major power and leveraging its economic and military heft to pursue foreign policy and commercial interests aggressively. Xi’s reassertion of Communist rule and state-guided technological acquisition is the biggest factor behind the new U.S. political consensus – entirely aside from Trump – that China is foe rather than friend. There are several empirical reasons to think that Xi might overplay his hand: Xi failed to make substantive concessions with President Barack Obama’s administration on North Korea, the South China Sea, and cyber security, resulting in Obama’s decision to harden U.S. policy toward both China and North Korea in 2015 – a trend that predates Trump. Xi formally removed presidential term limits from China’s constitution even though he could have attracted less negative attention from the West by ruling from behind the scenes after his term in office, like Deng Xiaoping or Jiang Zemin. China has mostly played for time in negotiations with the Trump administration, as mentioned, and this aggravated tensions. Deep revisions to the draft agreement, and the extent of tariff rollback which was supposedly 90% complete, broke the negotiations in May, sparking this summer’s standoff. Aggressive policies in territorial disputes have alienated even China’s potential allies. This includes regional states whose current ruling parties have courted China in recent years, in some cases obsequiously – South Korea, the Philippines, and Vietnam. The East and South China Seas remain a genuine source of “black swans” – unpredictable, low-probability, high-impact events – due to their status as critical sea lanes for the major Asian economies. China continues to militarize the islands there and aggressively prosecute its maritime-territorial disputes. We calculate that $6.4 trillion worth of goods flowed through this bottleneck in the year ending April 2019, 8% of which consists of energy goods from the Middle East that are vital to China and its East Asian neighbors, none of whom can stomach Chinese domination of this geographic space (Diagram II-1). Even if Washington abandoned the region, Japan, South Korea, and Taiwan would see Chinese control as a threat to their security. Ultimately, however, China’s adventures in its neighboring seas are a matter of choice. Not so for Greater China – in Hong Kong and Taiwan, political risk is rapidly mounting in a way that enflames the U.S.-China strategic distrust and threatens to prevent a trade agreement.
Chart II-
Hong Kong: The Dust Has Not Settled Mass protests in Hong Kong have lost some momentum, based on the size of the largest rally in August versus June. But do not be fooled: the political crisis is deepening. A plurality of Hong Kongers now harbors negative feelings toward mainland Chinese people as well as the government in Beijing – a trend that is spiking amid today’s protests but began with the Great Recession and has roots in the deeper socioeconomic malaise of this capitalist enclave (Chart II-12A & II-12B).
Chart II-12
Chart II-12
Chart II-13
A majority also lacks confidence in the political arrangement that ensures some autonomy from Beijing – known as “One Country, Two Systems” (Chart II-13). This is a particularly worrisome sign since this is the fundamental basis for stable political relations with Beijing. With clashes continuing between protesters and police, students calling for a boycott of school this fall, and Beijing rotating troops into the city and openly drilling its security forces in Shenzhen for a potential intervention, Hong Kong’s unrest is not yet laid to rest and could flare up again ahead of China’s sensitive National Day celebration. U.S. tariffs and sanctions are already in effect, reducing the ability of the U.S. to deter China from using force if it believes instability has gone too far. And as President Trump has warned – and would be true of any U.S. administration – a violent crackdown on civilian demonstrators would greatly reduce the political viability of a trade deal in the United States. Taiwan: The Black Swan Arrives Since Taiwan’s 2016 election, we have argued that it is a potential source of “black swans.” Mass protests in Hong Kong may have taken the cake. But these protests are now affecting the Taiwanese election dynamic and potentially the U.S.-China trade talks. Chart II-14U.S. Approves Big New Arms Sale To Taiwan
U.S. Approves Big New Arms Sale To Taiwan
U.S. Approves Big New Arms Sale To Taiwan
On August 20, the United States Department of Defense informed Congress that it is proceeding with an $8 billion sale of F-16 fighter jets and other military arms and equipment to Taiwan – the largest sale in 22 years and the largest aircraft sale since 1992 (Chart II-14). This sale is not yet complete and delivered, but ultimately will be – the question is the timing. Arms sales to Taiwan are a perennial source of tension between the United States and China – and China is increasingly assertive in using economic sanctions to get its way over such issues, as it showed in the lead up to South Korea’s election in 2017. This sale is not a military “game changer” – the U.S. did not send over fifth-generation F-35s, for instance – but China will respond vehemently. It is threatening to impose sanctions on American companies like Lockheed Martin and General Electric for their part in the deal. The sale does not in itself preclude the chance of a trade agreement but it contributes to a rise in strategic tensions that ultimately could. Chart II-15A 'Fourth Taiwan Strait Crisis' Would Have A Seismic Equity Impact
A 'Fourth Taiwan Strait Crisis' Would Have A Seismic Equity Impact
A 'Fourth Taiwan Strait Crisis' Would Have A Seismic Equity Impact
The context is Taiwan’s hugely important election in January. Four years ago, President Tsai Ing-wen and her pro-independence Democratic Progressive Party swept to power on the back of a popular protest movement – the “Sunflower Movement” – that opposed deeper cross-strait economic integration. It dangerously resembled the kind of anti-Communist “color revolutions” that motivate Xi Jinping’s hardline policies. Tsai shocked the world when she called Trump personally to congratulate him after his election, which violated diplomatic protocol given that Taiwan is a territory of China and not an independent nation-state. Since then Trump has largely avoided provoking the Taiwan issue so as not to strike at a core Chinese interest and obliterate the chance of a trade deal. But the U.S. has always argued that the provision of defensive arms to Taiwan is a condition of the U.S.-China détente – and Trump is so far moving forward with the sale. How will Xi Jinping react if the sale goes through? In 1995-96, China’s use of missile tests to try to intimidate Taiwan produced the opposite effect – driving voters into the arms of Lee Teng-hui, the candidate Beijing opposed. This was the occasion of the Third Taiwan Strait Crisis, in which U.S. President Bill Clinton sent two aircraft carriers to the region, one that sailed through the Taiwan Strait. The negative effect on markets at that time was local, whereas anything resembling this level of tensions would today be a seismic global risk-off (Chart II-15). Since the 1990s, leaders in Beijing have avoided direct military coercion ahead of elections. But Xi Jinping has hardened his stance on Taiwan throughout his term. He has dabbled with such coercion in his use of military drills that encircle Taiwan in recent years. While one must assume that he will use economic sanctions rather than outright military threats – as he did with South Korea – saber-rattling cannot be ruled out. The pressure on him is rising. Prior to the Hong Kong unrest, Taiwan’s elections looked likely to return the pro-mainland Kuomintang (KMT) to power and remove the incumbent President Tsai – a boon for Beijing. That outlook has changed and Tsai now has a fighting chance of staying in power (Chart II-16). The prospect of four more years of Tsai would not be too problematic for Beijing if not for the fact that the U.S. political establishment is now firmly in agreement on challenging China. But even if Tsai loses, Taiwan’s outlook is troublesome. And this makes Xi’s decision-making harder to predict. Taiwan has a lot more dry powder for a political crisis in the long run than Hong Kong. It is not that Tsai or her party will necessarily prevail. The manufacturing slowdown will take a toll and third-party candidates, particularly Ko Wen-je, would likely split Tsai’s vote. Moreover her Democratic Progressives still tie the KMT in opinion polling (Chart II-17). The Taiwanese people are primarily concerned about maintaining the strong economy and cross-strait peace and stability, which her reelection could jeopardize (Chart II-18). Tsai could very well lose, or she could be a lame duck presiding over the KMT in the legislature.
Chart II-16
Chart II-17
Rather, the problem for Xi Jinping is that the Taiwanese people clearly sympathize with the protesters in Hong Kong (Chart II-19). They fear that their own governance system faces the same fate as Hong Kong’s, with the Communist Party encroaching on traditional political liberties over time.
Chart II-18
Chart II-19
While Hong Kong ultimately has zero choice as to whether to accept Beijing’s supremacy, Taiwan has much greater autonomy – and the military support of outside forces. It is not a foregone conclusion that Taiwan must suffer the same political dependency as Hong Kong. Indeed, Taiwan has a long history of exercising the democratic vote and has even dabbled into the realm of popular referendums. In short, Taiwan has a lot more dry powder for a political crisis in the long run than Hong Kong. But the Hong Kong events have accentuated this fact, for two key reasons: First, Taiwanese people identify increasingly as exclusively Taiwanese, rather than as both Taiwanese and Chinese (Chart II-20). The incidents in Hong Kong reveal that this sentiment is tied to immediate political relations and therefore deterioration would encourage further alienation from the mainland. Second, while a strong majority of Taiwanese wish to maintain the political status quo to avoid conflict with the mainland, a substantial subset – approaching one-fourth – supports eventual or immediate independence (Chart II-21).
Chart II-20
Chart II-21
This means that relations with the mainland will eventually deteriorate even if the KMT wins the election. The KMT itself must respond to popular demand not to cozy up too much with Beijing, which is how it fell from power in 2016. Meanwhile, under KMT rule, Taiwan’s progressive-leaning youth are likely to set about reviving their protest movement in the subsequent years and imitating their Hong Kong peers, especially if the KMT warms up relations too fast with the mainland. Ultimately these points suggest that Xi Jinping will strive to avoid a violent crackdown in Hong Kong. A crackdown would be the surest way for him to harm the KMT in the Taiwanese election and to hasten the rebuilding of U.S.-Taiwan security ties. Call The President The best argument for Xi to lie low and avoid a larger crisis in Greater China is that it would unify the West and its allies against China. So far Xi’s foreign policy has not been so aggressive as to lead to diplomatic isolation. Europe is maintaining a studied neutrality due to its own differences with the United States; Asian neighbors are wary of provoking Chinese sanctions or military threats. A humanitarian crisis in Hong Kong or a “Fourth Taiwan Strait Crisis” would change that. For markets, the best-case scenario is that Xi Jinping exercises restraint. This would help Hong Kong protests lose steam, North Korean diplomacy get back on track, and Taiwanese independence sentiment simmer down. China would be more likely to halt U.S. tariffs and tech sanctions, settle a short-term trade agreement, and delay the upgrade in U.S.-Taiwan defense relations. China would still face adverse long-term political trends in both the U.S. and Taiwan, but an immediate crisis would be averted. The worst-case scenario is that Xi indulges his ambition. Hong Kong protests could explode, relations with Taiwan would deteriorate, and U.S.-China relations would move more rapidly in their downward spiral. Trade talks could collapse. Xi Jinping would face the possibility of a unified Western front, instability within Greater China, and a global recession. This might get rid of Donald Trump, but it would not get rid of the U.S. Congress, Navy, or Department of Defense. The choice seems pretty clear. Xi, like Trump, faces constraints that should motivate a tactical retreat from confrontation, at least after October 1. While this does not necessarily mean a settled trade agreement, it does suggest at least a ceasefire or truce. Our GeoRisk indicators show that market-based political risk in Taiwan – and less so South Korea – moves in keeping with global economic policy uncertainty. The underlying U.S.-China strategic confrontation and trade war are driving both (Chart II-22). A deterioration in this region has global consequences. Chart II-22U.S.-China Strategic Conflict Fuels Global Economic Uncertainty And Taiwanese Geopolitical Risk In Tandem
U.S.-China Strategic Conflict Fuels Global Economic Uncertainty And Taiwanese Geopolitical Risk In Tandem
U.S.-China Strategic Conflict Fuels Global Economic Uncertainty And Taiwanese Geopolitical Risk In Tandem
Xi is a markedly aggressive “strongman” Chinese leader who has not been afraid to model his leadership on that of Chairman Mao. He could still overplay his hand. This is why we maintain that the odds of a U.S.-China trade agreement remain 40%, though we are prepared to upgrade that probability if Trump and Xi make pro-market decisions. Investment Implications On the three-month tactical horizon, BCA’s Geopolitical Strategy is paring back our tactical safe-haven trades: we are closing our “Doomsday Basket” of long gold and Swiss bonds for a gain of 13.6%, while maintaining our simple gold portfolio hedge going forward. Trump has not yet decisively staged his tactical retreat on trade policy, while rising political risk in Greater China increases uncertainty over Xi Jinping’s next moves. On the cyclical horizon, the above suggests that there is a light at the end of the tunnel – if both Trump and Xi recognize their political constraints. This means that there is still a political and geopolitical basis to reinforce BCA’s House View to remain optimistic on global and U.S. equities over the next 12 months, with the potential for non-U.S. equities to recover and bond yields to reverse their deep dive. Matt Gertken Vice President Geopolitical Strategy III. Indicators And Reference Charts The S&P 500 correction is likely to deepen a bit further. A move toward 2700 remains our base case scenario. Short-term oscillators have not yet reached capitulation levels and the Sino-U.S. trade war remains a source of risks, especially as the Chinese side is unlikely to provide any strong concessions until October. However, we still do not expect a deeper correction to unfold. In other words, equities remain stuck in a trading range for the remainder of the year. Our Revealed Preference Indicator (RPI) continues to shun stocks. The RPI combines the idea of market momentum with valuation and policy measures. It provides a powerful bullish signal if positive market momentum lines up with constructive readings from the policy and valuation measures. Conversely, if strong market momentum is not supported by valuations and policy, investors should lean against the market trend. Global growth remains the biggest problem for stocks. Until the global economy finds a floor, the outlook for profits will be poor and our RPI will argue against buying equities. Beyond this year, the outlook remains constructive of stocks. Our Willingness-to-Pay (WTP) indicator for the U.S. and Japan is markedly improving. However, it continues to deteriorate in Europe. The WTP indicator tracks flows, and thus provides information on what investors are actually doing, as opposed to sentiment indexes that track how investors are feeling. The WTP therefore argues that investors are still looking to buy the dips in the U.S. and in Japan, which limits the downside in those markets. Yields have collapsed, money growth has picked up, and global central banks are cutting rates in unison. As a result, our Monetary Indicator points to the most accommodative global monetary backdrop since early 2015. Moreover, our Composite Technical Indicator is improving and continues to flash a buy signal. In 2015, it was deteriorating after having hit overbought territory. Therefore, unlike four years ago, equities are more likely to avoid the gravitational pull created by their overvaluation, especially as our BCA Composite Valuation index is in fact improving thanks to lower bond yields. According to our model, 10-year Treasurys have not been this expensive since late 2012. Back then, this level of overvaluation warned of an impending Treasury selloff. Moreover, our technical indicator is now deeply overbought. So are various rate-of-change measures for bond prices. While none of those indicators can tell you if yields will move up in the next few weeks, they do argue that the risk/reward of holding bonds over the coming year is extremely poor. That being said, we are closely monitoring the recent breakdown in the advanced/decline line of commodities, which might herald another down-leg in commodity prices, and therefore, in bond yields as well. On a PPP basis, the U.S. dollar is only growing ever more expensive. Additionally, despite the dollar’s recent strength, our Composite Technical Indicator has lost enough momentum that the negative divergence we flagged last month remains in place. It is worrisome for dollar bulls that despite growing uncertainty and a deteriorating global economy, the euro is not breaking down. If the dollar’s Technical Indicator deteriorates further and falls below zero, the momentum-continuation behavior of the greenback will likely kick in. The USD would suffer markedly were this to happen. EQUITIES: Chart III-1U.S. Equity Indicators
U.S. Equity Indicators
U.S. Equity Indicators
Chart III-2Willingness To Pay For Risk
Willingness To Pay For Risk
Willingness To Pay For Risk
Chart III-3U.S. Equity Sentiment Indicators
U.S. Equity Sentiment Indicators
U.S. Equity Sentiment Indicators
Chart III-4Revealed Preference Indicator
Revealed Preference Indicator
Revealed Preference Indicator
Chart III-5U.S. Stock Market Valuation
U.S. Stock Market Valuation
U.S. Stock Market Valuation
Chart III-6U.S. Earnings
U.S. Earnings
U.S. Earnings
Chart III-7Global Stock Market And Earnings: Relative Performance
Global Stock Market And Earnings: Relative Performance
Global Stock Market And Earnings: Relative Performance
Chart III-8Global Stock Market And Earnings: Relative Performance
Global Stock Market And Earnings: Relative Performance
Global Stock Market And Earnings: Relative Performance
FIXED INCOME: Chart III-9U.S. Treasurys And Valuations
U.S. Treasurys And Valuations
U.S. Treasurys And Valuations
Chart III-10Yield Curve Slopes
Yield Curve Slopes
Yield Curve Slopes
Chart III-11Selected U.S. Bond Yields
Selected U.S. Bond Yields
Selected U.S. Bond Yields
Chart III-1210-Year Treasury Yield Components
10-Year Treasury Yield Components
10-Year Treasury Yield Components
Chart III-13U.S. Corporate Bonds And Health Monitor
U.S. Corporate Bonds And Health Monitor
U.S. Corporate Bonds And Health Monitor
Chart III-14Global Bonds: Developed Markets
Global Bonds: Developed Markets
Global Bonds: Developed Markets
Chart III-15Global Bonds: Emerging Markets
Global Bonds: Emerging Markets
Global Bonds: Emerging Markets
CURRENCIES: Chart III-16U.S. Dollar And PPP
U.S. Dollar And PPP
U.S. Dollar And PPP
Chart III-17U.S. Dollar And Indicator
U.S. Dollar And Indicator
U.S. Dollar And Indicator
Chart III-18U.S. Dollar Fundamentals
U.S. Dollar Fundamentals
U.S. Dollar Fundamentals
Chart III-19Japanese Yen Technicals
Japanese Yen Technicals
Japanese Yen Technicals
Chart III-20Euro Technicals
Euro Technicals
Euro Technicals
Chart III-21Euro/Yen Technicals
Euro/Yen Technicals
Euro/Yen Technicals
Chart III-22Euro/Pound Technicals
Euro/Pound Technicals
Euro/Pound Technicals
COMMODITIES: Chart III-23Broad Commodity Indicators
Broad Commodity Indicators
Broad Commodity Indicators
Chart III-24Commodity Prices
Commodity Prices
Commodity Prices
Chart III-25Commodity Prices
Commodity Prices
Commodity Prices
Chart III-26Commodity Sentiment
Commodity Sentiment
Commodity Sentiment
Chart III-27Speculative Positioning
Speculative Positioning
Speculative Positioning
ECONOMY: Chart III-28U.S. And Global Macro Backdrop
U.S. And Global Macro Backdrop
U.S. And Global Macro Backdrop
Chart III-29U.S. Macro Snapshot
U.S. Macro Snapshot
U.S. Macro Snapshot
Chart III-30U.S. Growth Outlook
U.S. Growth Outlook
U.S. Growth Outlook
Chart III-31U.S. Cyclical Spending
U.S. Cyclical Spending
U.S. Cyclical Spending
Chart III-32U.S. Labor Market
U.S. Labor Market
U.S. Labor Market
Chart III-33U.S. Consumption
U.S. Consumption
U.S. Consumption
Chart III-34U.S. Housing
U.S. Housing
U.S. Housing
Chart III-35U.S. Debt And Deleveraging
U.S. Debt And Deleveraging
U.S. Debt And Deleveraging
Chart III-36U.S. Financial Conditions
U.S. Financial Conditions
U.S. Financial Conditions
Chart III-37Global Economic Snapshot: Europe
Global Economic Snapshot: Europe
Global Economic Snapshot: Europe
Chart III-38Global Economic Snapshot: China
Global Economic Snapshot: China
Global Economic Snapshot: China
Mathieu Savary Vice President The Bank Credit Analyst Footnotes 1 Claudio Borio , Mathias Drehmann, Dora Xia, "The financial cycle and recession risk," BIS Quarterly Review, December 2018. 2 Please see Emerging Markets Strategy Special Report "China’s Property Market: Making Sense Of Divergences," dated May 9, 2019, available at ems.bcaresearch.com 3 Please see Global Investment Strategy Weekly Report, “Three Cycles,” dated July 26, 2019, available at gis.bcaresearch.com 4 Please see The Bank Credit Analyst Section I, “August 2019,” dated July 25, 2019, available at bca.bcaresearch.com 5 Please see The Bank Credit Analyst Section I, “August 2019,” dated July 25, 2019, available at bca.bcaresearch.com 6 For an explanation of the mechanics of the FRP, please see NY Fed’s website: https://www.newyorkfed.org/aboutthefed/fedpoint/fed20 7 Please see U.S. Equity Strategy Special Report "Sector Performance And Fed “Mid-Cycle Adjustments”: For Better Or For Worse," dated August 19, 2019, available at uses.bcaresearch.com 8 Please see U.S. Bond Strategy Weekly Report "The Trump Interruption," dated August 13, 2019, available at usbs.bcaresearch.com 9 Please see Global Investment Strategy Special Report, “TINA To The Rescue?,” dated August 23, 2019, available at gis.bcaresearch.com 10 Please see Foreign Exchange Strategy Special Report, “A Fresh Look At Purchasing Power Parity,” dated August 23, 2019, available at fes.bcaresearch.com 11 Negotiations between Trump and Xi are slated for September in Washington. There is a prospect for Trump to hold another summit with Communist Party General Secretary Xi Jinping on the sidelines of the United Nations General Assembly in New York in late September and at the APEC summit in Chile in mid-November. 12 Hong Kong is a Special Administrative Region of the People’s Republic of China, while Taiwan is recognized as a province or territory. EQUITIES:FIXED INCOME:CURRENCIES:COMMODITIES:ECONOMY: