Global
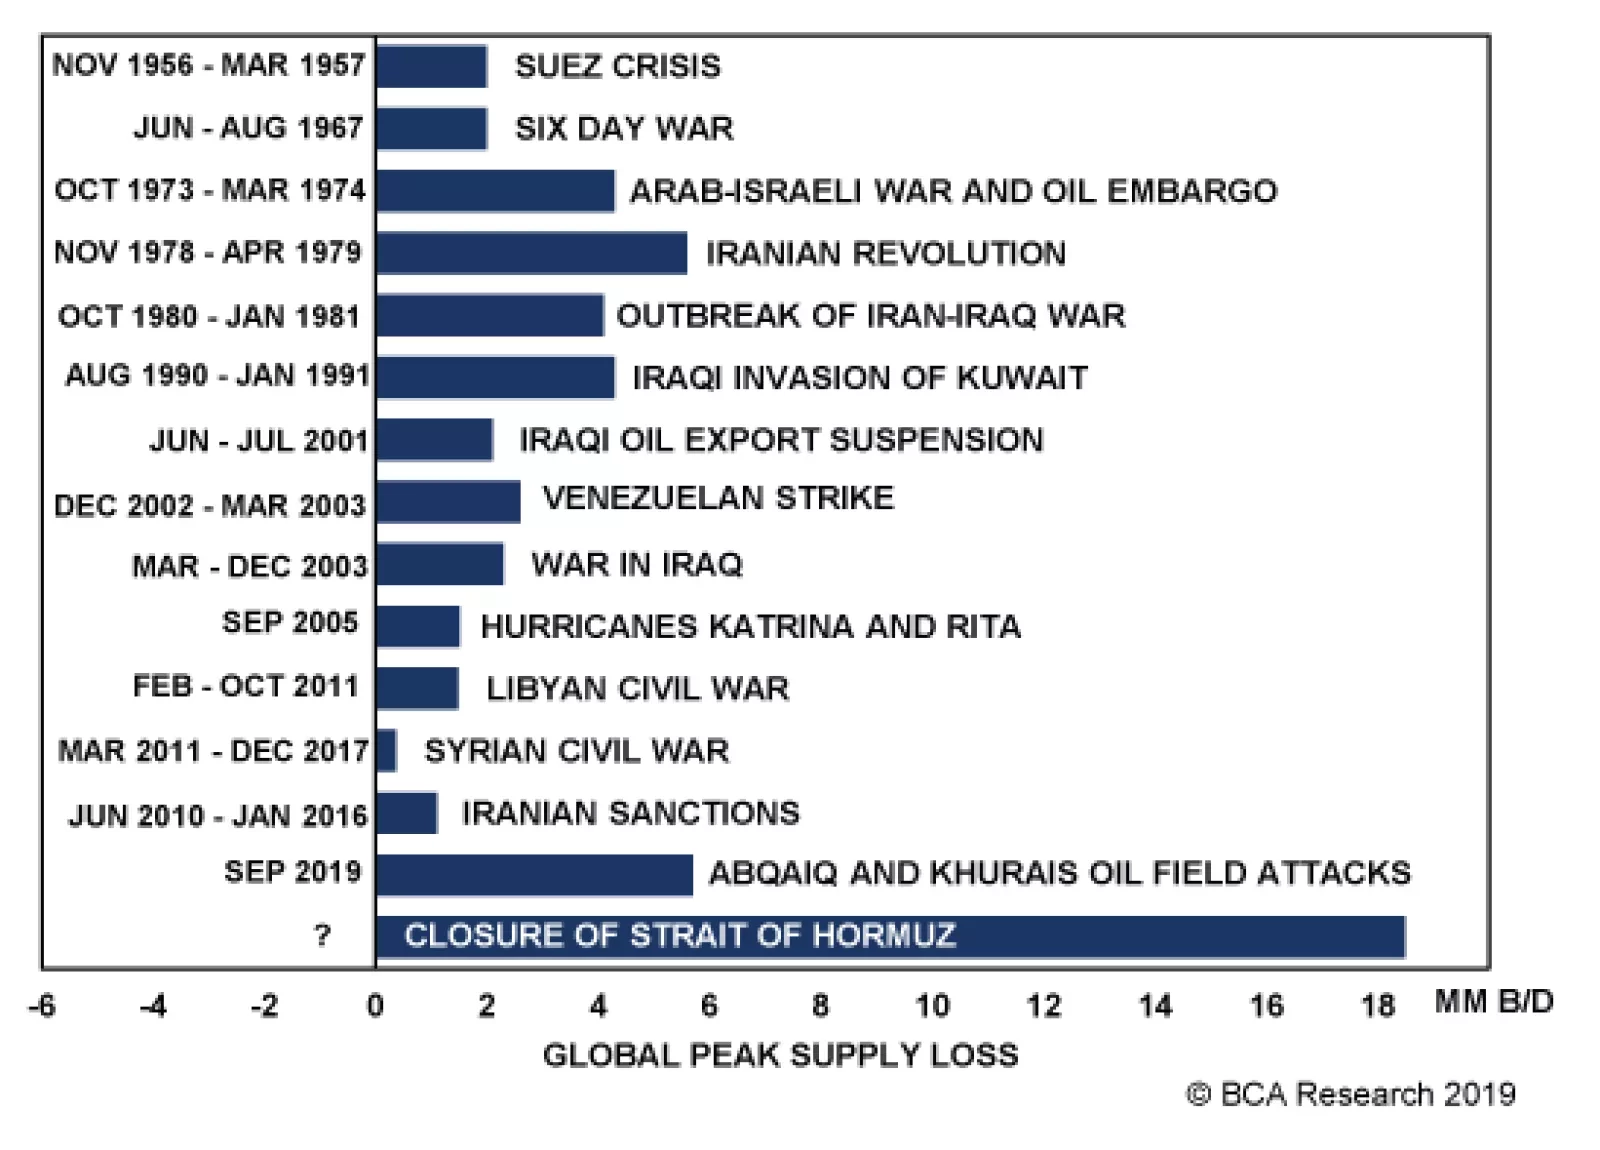
In the immediate aftermath of the drone attacks on Saudi Arabia's massive 7-million-barrel-per-day processing facility at Abqaiq and the Khurais oil fields, which produces close to 2mm b/d, markets will be hanging on every announcement coming from the Kingdom…
BCA’s Chief Global Strategist, Peter Berezin, has noted that global manufacturing cycles average three years from peak to peak. As the last growth cycle began in late spring of 2017, this means that we are likely close to the bottom of the current cycle and…
The dovish turn of global monetary policy in 2019 has been fairly limited in terms of the size of cuts, but broad in terms of the number of countries that have delivered cuts. Our Global Monetary Easing Indicator (GMEI), which measures the percentage of…

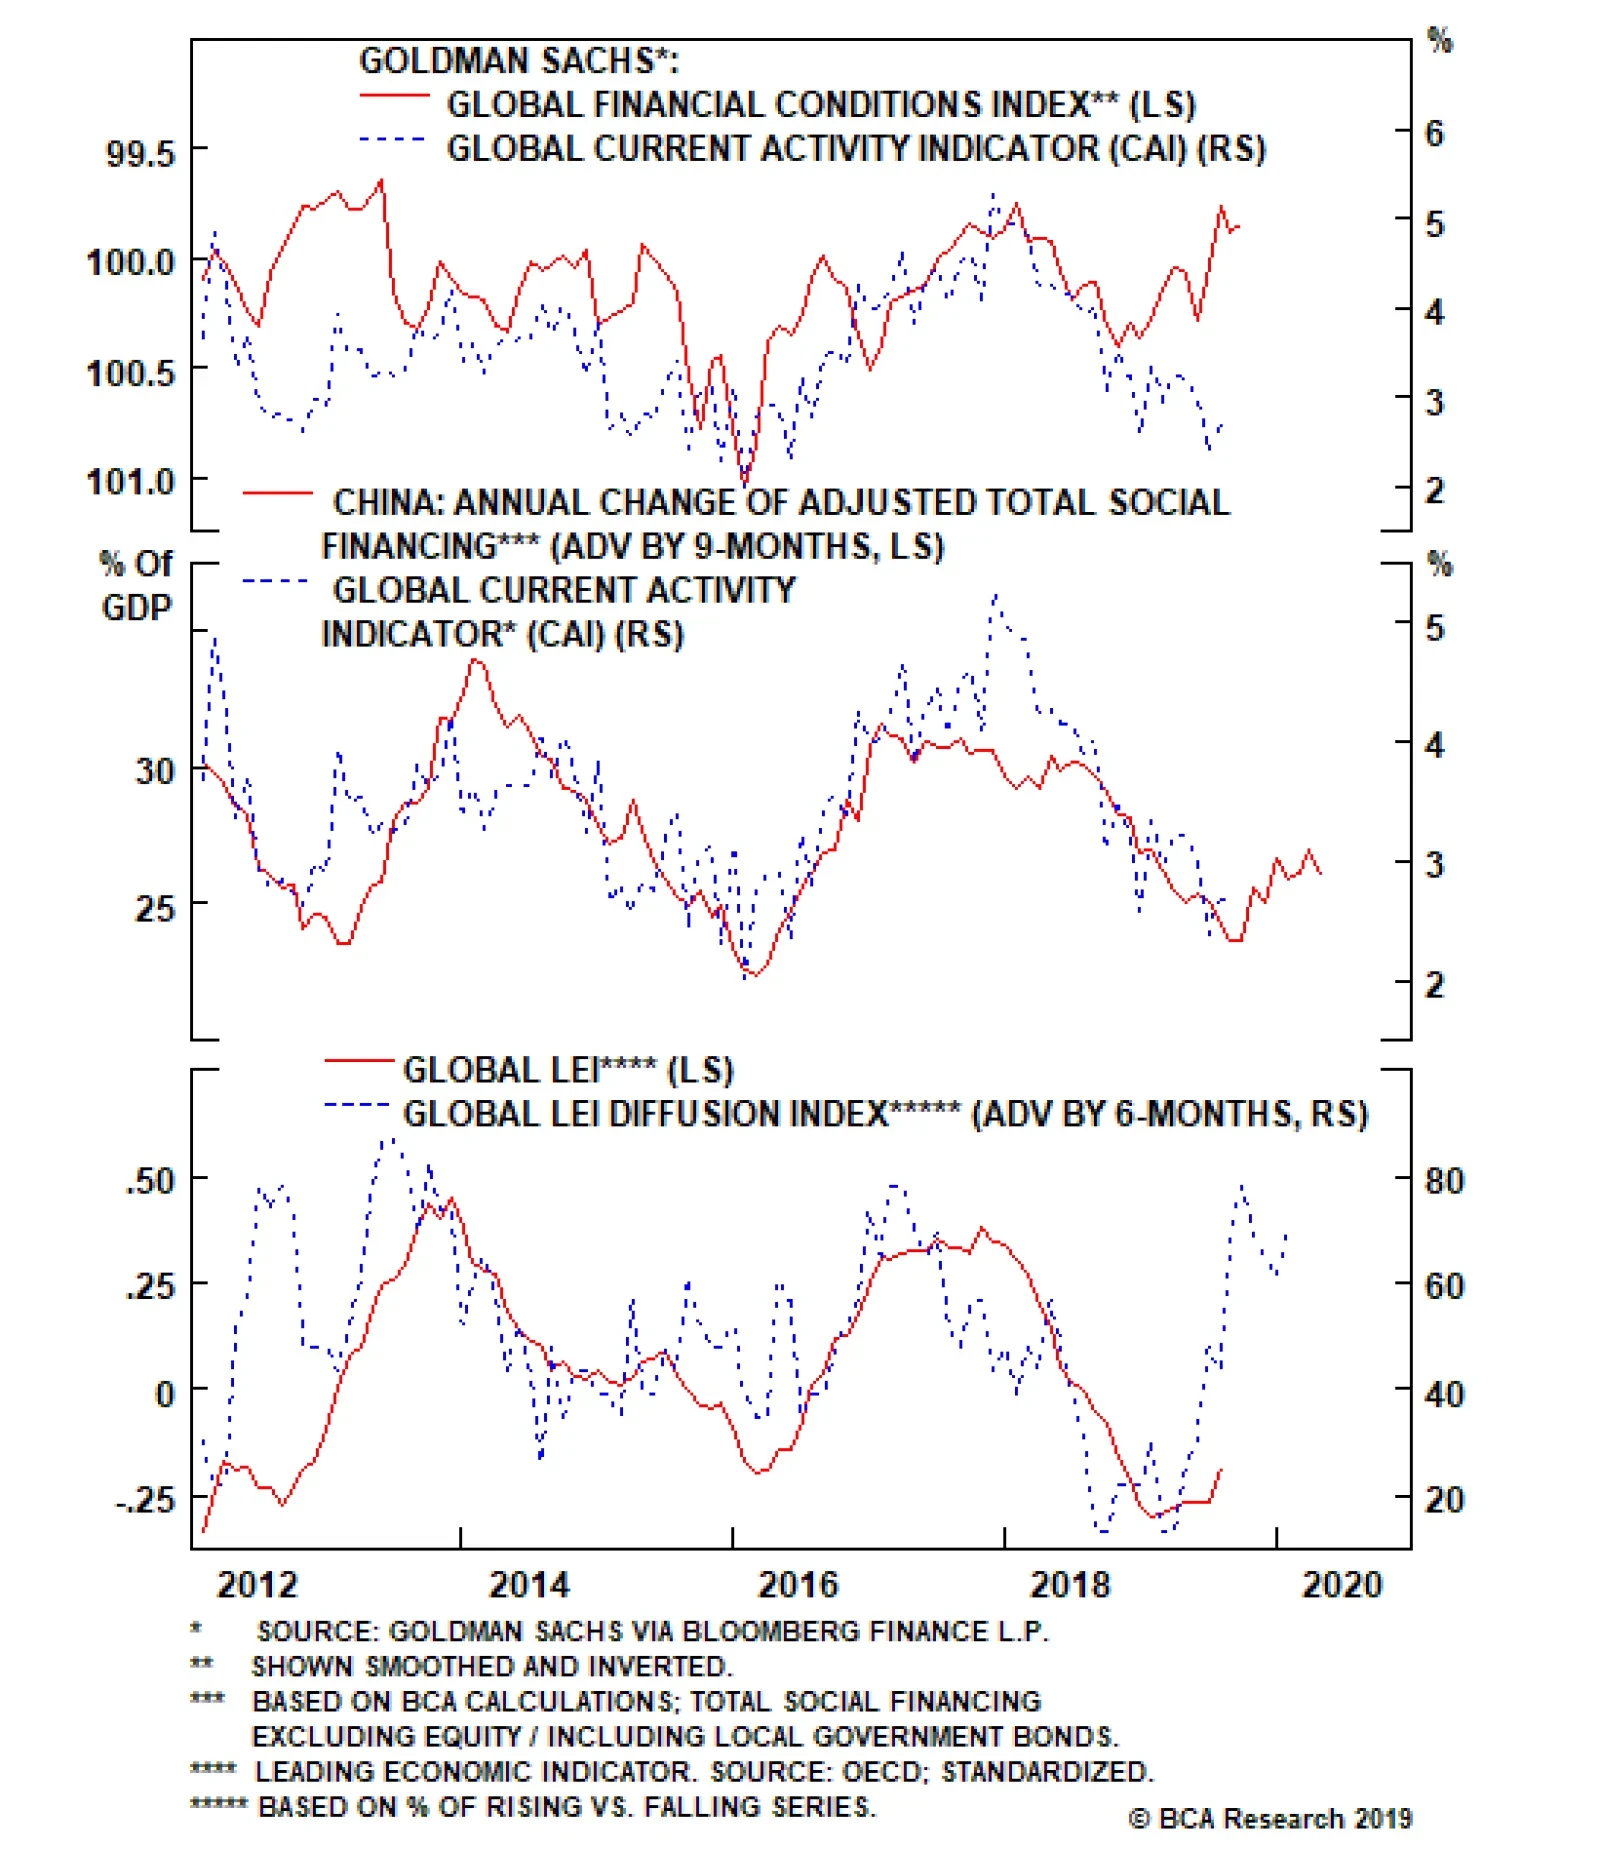
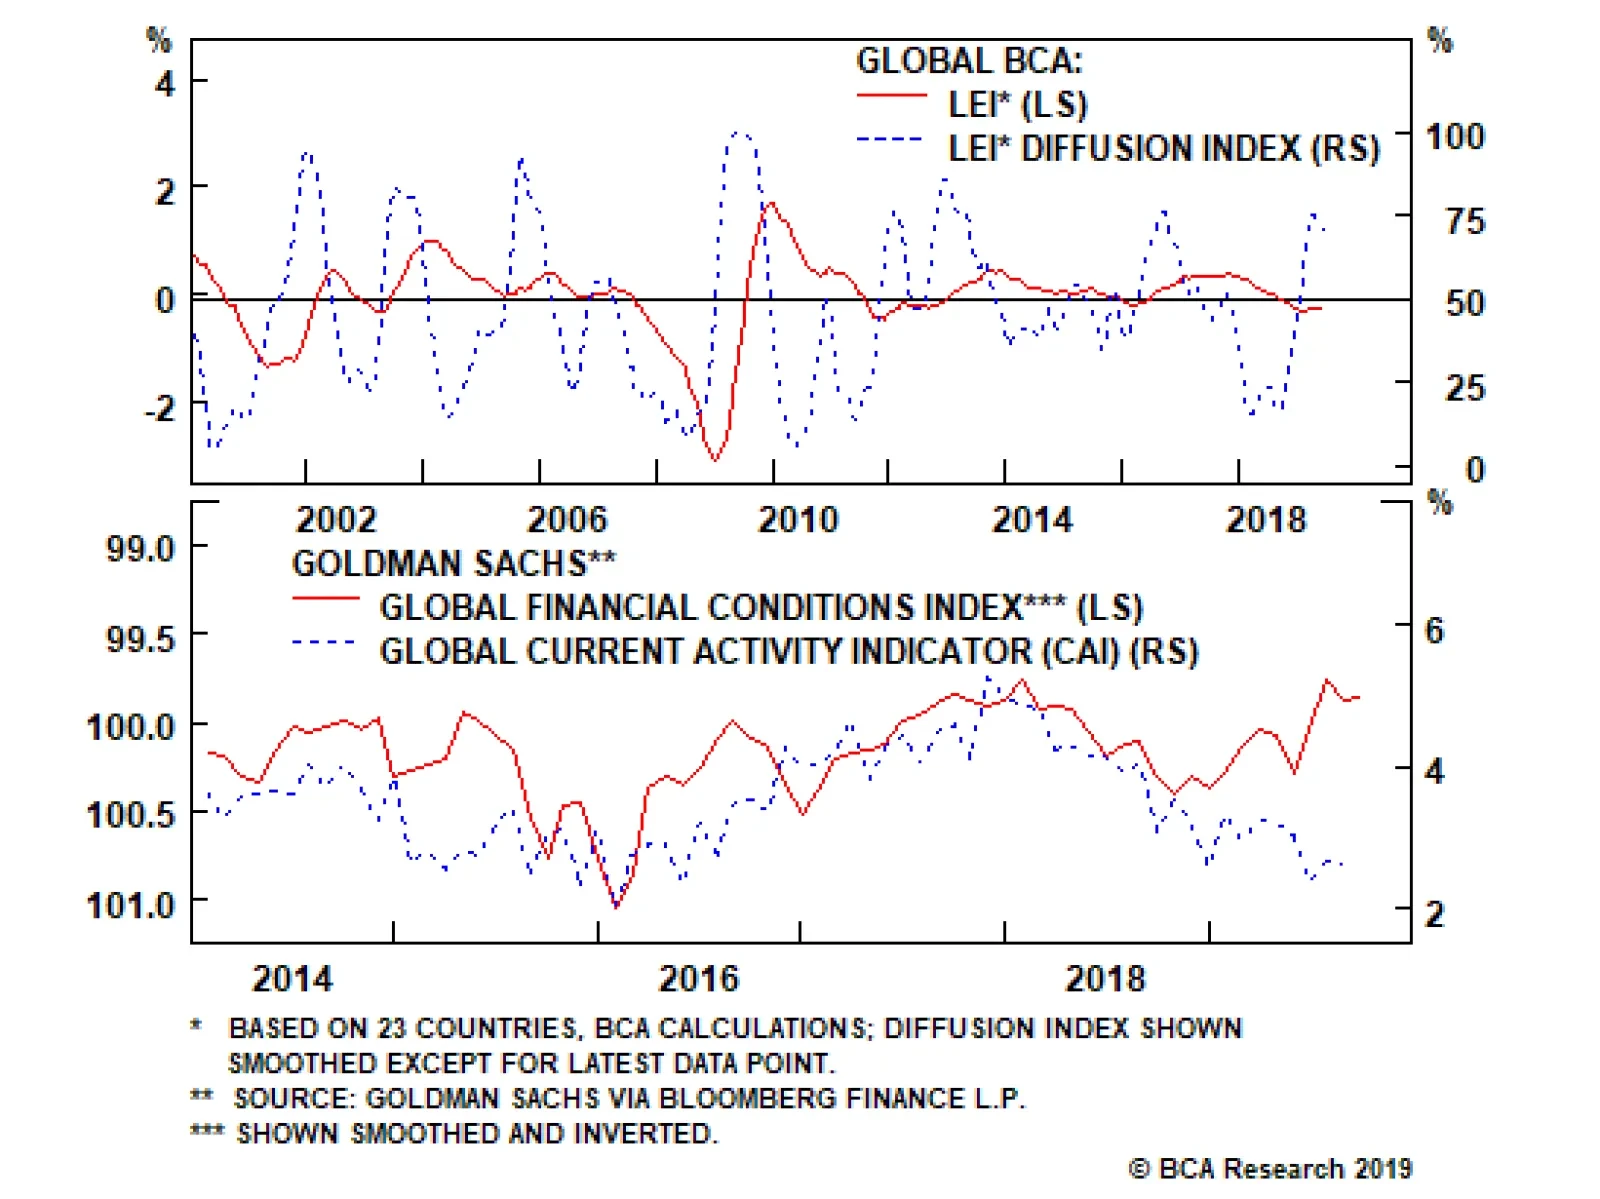
Commodity demand appears to be turning up, based on our assessment of global industrial activity. As demand picks up, we expect industrial commodity prices will move higher (Chart of the Week, top panel). For all practical purposes, central banks and numerous governments have moved into recession-fighting mode, following the contraction in manufacturing activity brought on by the U.S. Fed’s rates-normalization policy last year, and China’s deleveraging campaign in 2017-18. Together, these policies severely retarded credit and liquidity available to markets, and drove the USD higher, to the detriment of commodity demand (Chart of the Week, middle panel). Current policy responses will support a revival of manufacturing, and with it, global trade (Chart of the Week, bottom panel). While we continue to expect a weaker USD on the back of additional Fed easing this year and recovery of ex-U.S. economic growth in line with our House view, we remain wary uncoordinated global monetary accommodation by a large number of central banks could leave the dollar well bid. This could stifle the commodity-demand revival by keeping local-currency commodity costs high (Chart 2). This would be especially bearish for base metals prices.1 Chart of the WeekGlobal Industrial Activity Moving Higher
Global Industrial Activity Moving Higher
Global Industrial Activity Moving Higher
Chart 2USD Strength Will Pose Risk To Industrial Commodity Demand
USD Strength Will Pose Risk To Industrial Commodity Demand
USD Strength Will Pose Risk To Industrial Commodity Demand
Highlights Energy: Overweight. The appointment of Prince Abdulaziz bin Salman as the Kingdom of Saudi Arabia’s (KSA) new Energy Minister signals the royal family will push harder to manage production and reduce global oil inventories ahead of the IPO of Saudi Aramco. The prince brings more than 30 years of experience to the role, making him something of an outlier among KSA’s ministers – technocrats typically have occupied the position, and he is the first royal to serve as Energy Minister. We believe the prince’s immediate goal is to get Brent into the mid- to high-$70/bbl ahead of the IPO later this year or early next year. The first leg of the IPO reportedly will be done locally in the Kingdom, with Saudi investors taking ~ 1% of the Saudi Aramco float. Base Metals: Neutral. China imported 1.82mm MT of copper concentrates in August, a 9.3% increase y/y, as smelters continue to buy partly processed ores to feed expanding capacity. Concentrate imports in July were a record 2.07mm MT. Precious Metals: Neutral. The World Platinum Investment Council (WPIC) forecasts a 9% increase in platinum demand this year, driven primarily by ETF investors. This “more than offsets expected demand decreases in the automotive and jewellery segments of 4% and 5% respectively.” WPIC reduced its expected physical surplus this year to 345k ounces, from its earlier expectation of 375k ounces. Our tactical long platinum position recommended August 29, 2019 is up 1.9%. Separately, we are taking profits on our Long 10-year TIPS position at tonight’s close. It was up 9.3% on September 10, 2019. The position was recommended July, 27, 2017. Ags/Softs: Underweight. A wet start to the planting season points to lower corn and bean yields this year vs. 2018. AccuWeather expects 2019 corn yields will fall 7.35% y/y to 13.36 billion bushels, and soybean yields will be down 19.5% y/y to 3.658 billion bushels. Besides stressing crops at the beginning of the season, weather-related delays also increase the risk some of this year’s crop will be exposed to frost at the end of the season before it is harvested. Weather effects continue to be apparent in the USDA’s crop conditions report, particularly for corn, where the USDA now rates 55% of the U.S. crop good or excellent, vs. 68% a year earlier. Last week, the USDA rated 58% of the corn crop good or excellent. Feature Leading indicators are signaling the slowdown in global growth – i.e., aggregate-demand growth – likely bottomed ex-Europe (Chart 3). The chart shows easing global financial conditions, along with fiscal stimulus, most likely have arrested the slowdown in industrial commodity demand (Chart 4). Chart 3Manufacturing Downturn Likely Arrested Following Broad Monetary Stimulus
Manufacturing Downturn Likely Arrested Following Broad Monetary Stimulus
Manufacturing Downturn Likely Arrested Following Broad Monetary Stimulus
Chart 4Global Financial Conditions Are Supportive Easier Financial Conditions Will Benefit Global Growth
Global Financial Conditions Are Supportive Easier Financial Conditions Will Benefit Global Growth
Global Financial Conditions Are Supportive Easier Financial Conditions Will Benefit Global Growth
We expect the recovery in demand will be most visible in the LMEX base metals index and in oil markets. Base metals demand is highly concentrated in China – accounting for ~ 50% of global demand – and EM Asia. Our EM Commodity-Demand Nowcast continues to signal oil demand also will revive in 2H19 as GDP growth picks up (Chart 5). Markets still could wobble, which is why the evolution of EM import volumes remains important, given their high correlation with GDP levels. A number of gauges we follow closely – particularly those associated with the movement of good on the sea (Chart 6) and in the air (Chart 7) – have turned up in 3Q19. We expect this to continue into 4Q19 and next year. Chart 5Monetary, Fiscal Stimulus Will Lift Oil Demand
Monetary, Fiscal Stimulus Will Lift Oil Demand
Monetary, Fiscal Stimulus Will Lift Oil Demand
Chart 6Shipping Gauges Signal Uptick in Movement of Goods
Shipping Gauges Signal Uptick in Movement of Goods
Shipping Gauges Signal Uptick in Movement of Goods
Chart 7Air Freight Gauges Signal Uptick in Movement of Goods
Air Freight Gauges Signal Uptick in Movement of Goods
Air Freight Gauges Signal Uptick in Movement of Goods
USD Strength Keeps Us Wary The contraction in manufacturing and EM trade volumes is largely the result of the Fed’s rates-normalization policy last year, and China’s deleveraging campaign in 2017-18, in our view. These policies raised the value of the USD, which raised local-currency costs of dollar-denominated commodities, and all other goods and services invoiced and funded with dollars (Chart 8). Indeed, as Chart 2 shows, oil prices and base metals prices in local-currency terms ex-U.S. are closer to their earlier highs when Brent was trading above $100/bbl. This redounded to the detriment of commodity demand.2 The Sino-U.S. trade war certainly does not help commodity demand. For the most part, however, we believe this affects demand expectations – i.e., capex- and investment-driven demand. We believe firms and households will reduce outlays and increase precautionary savings, as a buffer against an expansion of the trade war into a larger global conflict, which likely would impair global supply chains and growth prospects. Chart 8Strong USD Keeps Us Wary
Strong USD Keeps Us Wary
Strong USD Keeps Us Wary
While we expect the USD to weaken as the Fed cuts its policy rate, in line with our House view, we reiterate the non-trivial risk that global monetary accommodation still could leave the dollar well bid.3 Rising negative yielding debts globally makes U.S. yields relatively attractive despite the ongoing easing, supporting capital inflows in U.S. fixed income markets. Investment Implications The coincidence of fiscal and monetary policy easing is showing up in our gauges of global economic activity and in our leading indicators. We remain long oil exposure and precious metals – gold on a strategic basis, silver and platinum on a tactical basis. As we see industrial commodity demand picking up, we will look to go long copper. Bottom Line: Our gauges of economic activity continue to point to a bottoming of the global ex-U.S. slowdown in industrial activity, particularly in manufacturing, which has been hard-hit by a downturn in auto output. We expect USD weakness to become a tailwind for industrial commodities; however, we are wary continued strength in the dollar – it is above its 1Q02 peak – could crimp industrial metals, and maybe even oil, prices (Chart 9). Chart 9USD TWIB Strength Hampers Industrial Commodity Demand
USD TWIB Strength Hampers Industrial Commodity Demand
USD TWIB Strength Hampers Industrial Commodity Demand
Robert P. Ryan, Chief Commodity & Energy Strategist rryan@bcaresearch.com Footnotes 1 We use base metals demand, particularly for copper, as an indicator of EM industrial activity in our modeling. These markets are somewhat removed from the idiosyncratic forces driving oil supply-demand dynamics, particularly on the supply side, where OPEC 2.0 continues to maintain its policy of production discipline to reduce global inventory levels. OPEC 2.0 is the name we coined for the producer coalition lead by KSA and Russia, which was formed in 2016 with the explicit mission of reducing the global oil-inventory overhang resulting from the 2014-15 market share war launched by the original OPEC states in 2H14. 2 Last week we discussed USD strength vis-à-vis oil demand. Please see Central Bank Easing Key To Oil Prices. It is available at ces.bcaresearch.com. 3 A non-trivial risk is bounded at the lower end by Russian-roulette odds – i.e., 1:6 – in our usage of the phrase. Investment Views and Themes Recommendations Strategic Recommendations Tactical Trades TRADE RECOMMENDATION PERFORMANCE IN 2019 Q2
Industrial Commodity Demand Recovery Will Boost Metals, Oil
Industrial Commodity Demand Recovery Will Boost Metals, Oil
Commodity Prices and Plays Reference Table Trades Closed in 2019 Summary of Closed Trades
Industrial Commodity Demand Recovery Will Boost Metals, Oil
Industrial Commodity Demand Recovery Will Boost Metals, Oil
Anecdotal evidences from industry specialists suggest that many manufacturers have been engaging in re-routing their supply chains to avoid the U.S.-China tariffs. This is welcome news. Manufacturing slowdowns have tended to last 18 months peak-to-trough,…
The tug of war between deteriorating global growth and easing liquidity conditions cannot last forever. Either the dollar breakout morphs into a panic buying frenzy or proves to be a bull trap. Are we at the cusp of a bottom in global growth, or approaching a…
The Markit global manufacturing PMI remained below 50 for the fourth month in a row in August. While the global PMI did edge up slightly from July’s reading, this was largely due to a modest rebound in the Chinese PMI, which rose from 49.9 to 50.4. The…
Highlights Growth & Yields: The massive bond rally of 2019 is in its dying days - the sharp downward momentum of global bond yields is fading, just as leading economic indicators are starting to move higher. Data Surprises & Yields: The risk of a snapback in yields is growing in countries where there are more positive economic data surprises but where yields remain depressed – like the U.S., Canada, Australia and New Zealand. Duration Strategy: We still recommend investors to stick to a neutral (at benchmark) stance on overall portfolio duration in the near term (0-3 months). Markets will need more than just one or two positive data points to be convinced that global growth is rebounding, and U.S.-China trade tensions remain a lingering concern. On a cyclical horizon (6-12 months), however, once it is clear that we’ve entered into a new global manufacturing up-cycle, global yields will rise more sustainably, justifying reduced duration exposure. Feature Chart of the WeekA Potential Bottoming Of Growth & Yields
A Potential Bottoming Of Growth & Yields
A Potential Bottoming Of Growth & Yields
Is The Great Global Bond Rally of 2019 finally running out of gas? Government bond yields in the major developed economies have stabilized and are now starting to drift a bit higher. Benchmark 10-year yields are all up by healthy amounts from the inter-day lows reached on September 3rd (U.S. +18bps, Germany +17bps, U.K. +24bps, Canada +24bps). Yields remain well below intermediate term trend measures like the 200-day moving average, however, suggesting that these rebounds may only be corrective in nature and not yet the start of a more sustained cyclical move higher. Reliable economic data like our global manufacturing PMI are still falling and remain at levels suggesting weakening global growth. Yet on a rate-of-change basis, the pace of the decline in the PMI is fading, indicating that the worst of the downturn is likely behind us. A bottoming of the downward momentum of the PMI typically coincides with fading downward momentum in bond yields (Chart of the Week), which suggests that, at a minimum, bond yields are unlikely to fall below the recent lows. A similar signal is given by our global leading economic indicator (LEI), which has clearly bottomed and is now starting to drift higher. We shifted to a tactically neutral stance on global duration exposure back in early August, based on our near-term concerns that the ratcheting up of U.S.-China trade tensions through new tariffs would further raise economic uncertainty and heighten the demand for safe assets like government bonds – especially given the decline in global manufacturing activity. Last week’s announcement that U.S.-China trade talks would resume in early October was a positive step towards a potential de-escalation of trade tensions, which did help provide a pro-risk lift to global bond yields (at least for one day). For now, however, we are staying with a near-term neutral view on duration until we see more concrete signs of progress from the October 5 U.S.-China trade meetings in D.C. The heightened political drama in the U.K. is another reason to be cautious, with the October 31 Brexit deadline – and potentially a U.K. election before then – fast approaching (NOTE: we will be publishing a joint Special Report on the U.K. with our colleagues at Foreign Exchange Strategy and Geopolitical Strategy on September 20). More fundamentally, we will look to reduce our recommended duration exposure back to below-benchmark once global manufacturing data (i.e. U.S. ISM, Markit PMIs) and economic sentiment data (i.e. global ZEW, German IFO) stabilize – an outcome that grows increasingly likely given the signs of improvement we are seeing in the global LEI. Finding The Biggest Disagreements Between Economic Data & Bond Yields One time-tested way to identify a potential cyclical market top or bottom, for any asset class and not just bonds, is to look for divergences in prices from fundamentals. For example, when bond yields continue to fall despite signs that economic data are starting to improve (or, at least, when there is less data underperforming expectations). We can see such a divergence today when looking at bond yields versus data surprise indices. The most visible divergences between better data surprises and low bond yields are in the U.S., Australia, Canada and New Zealand. In Charts 2 & 3, we show the 26-week change in the benchmark 10-year government bond yield (in basis points) versus the widely followed Citigroup Economic Data Surprise Indices for the U.S., euro area, Japan, the U.K., Australia, Canada, New Zealand and Sweden The broad relationship is that yields fall faster when data is weaker than expected, and vice versa. The relationship is stronger in some countries like the U.S. and the U.K., and very weak in Japan, but we can still look for divergences between yield changes and data surprises for signs of bond yields deviating from economic growth. Chart 2Data Surprises Diverging From Yields In The U.S. …
Data Surprises Diverging From Yields In The U.S. ...
Data Surprises Diverging From Yields In The U.S. ...
Chart 3… And In "The Dollar Bloc"
... And In "The Dollar Bloc"
... And In "The Dollar Bloc"
The most visible such divergences are in the U.S., Japan, Australia, Canada and New Zealand; in those countries, more data releases have been surprising to the upside versus consensus forecasts of late, yet bond yields have been falling at a very rapid rate. In the euro area, the U.K. and Sweden, data has been disappointing versus expectations, justifying the rapid move down in bond yields in those countries purely from an economic growth perspective. For all countries shown, interest rate markets are now priced for aggressive monetary easing. Our 12-month discounters, based on pricing from Overnight Index Swap (OIS) curves, all show that money markets expect central banks to ease policy over the next year. Our discounters remain highly correlated to the level of government bond yields (Charts 4 & 5), which means that the biggest risk to the Great Global Bond Rally of 2019 is that policymakers do not deliver the full amount of easing discounted by markets. Chart 4Bond Yields Are Vulnerable To A Rebound …
Bond Yields Are Vulnerable To A Rebound ...
Bond Yields Are Vulnerable To A Rebound ...
Chart 5… Given Overly Dovish Policy Expectations
... Given Overly Dovish Policy Expectations
... Given Overly Dovish Policy Expectations
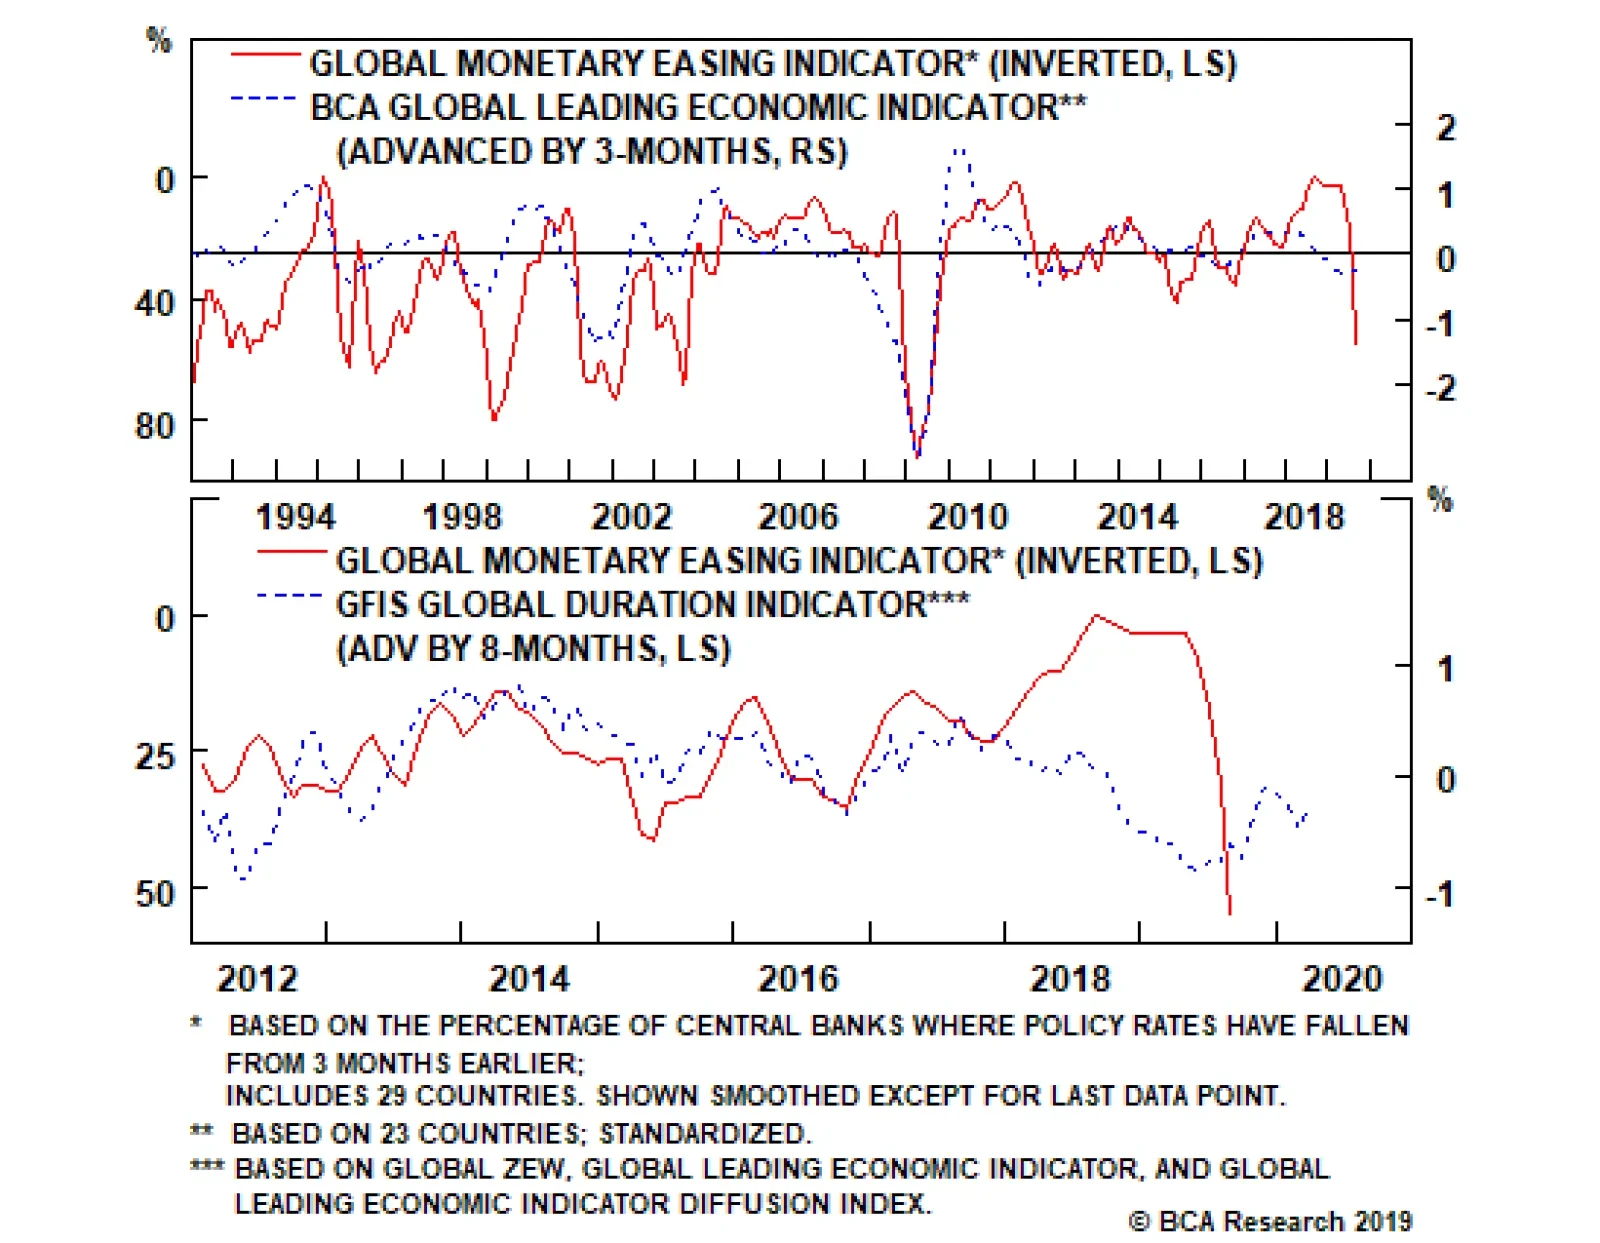
That risk looks greatest in countries where there is both a divergence between improving data surprises and low bond yields AND a significant amount of interest rate cuts priced into the OIS curve – like the U.S. (98bps of cuts discounted), Australia (42bps), Canada (32bps) and New Zealand (33bps). Japan (13bps), the euro area (22bps) and Sweden (4bps) are all cases where central bank policy rates (and bond yields) are negative but where additional rate cuts are still discounted. Data continues to disappoint to the downside in the euro area and Sweden, however, suggesting that bond yields there are less at risk of a corrective snapback. A similar argument applies in the U.K. (25bps), where there is not a divergence between weak data and falling Gilt yields. Given the weak correlation between data surprises and changes in bond yields in Japan – an unsurprising outcome given the Bank of Japan’s outright manipulation of JGB yields – we find it difficult to make any conclusions on the next move in yields based solely on an analysis of Japanese data surprises. That risk of higher bond yields is greatest in countries where data surprises are diverging from bond yields AND a significant amount of interest rate cuts are discounted. Bottom Line: The massive bond rally of 2019 is in its dying days - the sharp downward momentum of global bond yields is fading, just as leading economic indicators are starting to move higher. The risk of a snapback in yields is growing in countries where there are more positive economic data surprises but where yields remain depressed – like the U.S., Canada, Australia and New Zealand. The Increasingly Schizophrenic Nature Of Global Central Banks The dovish turn of global monetary policy in 2019 has been fairly limited in terms of the size of cuts, but broad in terms of the number of countries that have delivered cuts. Our Global Monetary Easing Indicator (GMEI), which measures the percentage of central banks (out of a list of 29) that have cut policy rates from three months earlier, is a simple way to measure the “breadth” of the global monetary policy cycle. In Chart 6, we compare the GMEI (shown on an inverted scale) to our global LEI. Historically, the GMEI has peaked around three months after the global LEI troughs. Afterward, facing prospects of improving growth, central banks gradually took their feet off the gas pedal, with the GMEI moving to zero as the global LEI continued to climb. Chart 6Introducing Our Global Monetary Easing Indicator
Introducing Our Global Monetary Easing Indicator
Introducing Our Global Monetary Easing Indicator
The ups and downs of central banker actions have become more complicated since 2008. After the financial crisis, policymakers had to keep rates at or near the zero lower bound. For the Fed looking over at its Japanese counterpart, the prospect of keeping rates too low for too long, and thereby eventually losing the ability to stimulate the economy through rate cuts in the next downturn, was a fearful one. At the same time, creating overly easy financial conditions and indirectly causing the next asset bubble was another concern for policymakers in the aftermath of the financial crisis. After 2016, central bank behavior became particularly misguided. This “bi-polar” policy environment clearly caused a change in the reaction function of global central banks. Post-crisis, they have been slower to react to signs of global weakness. In 2016, for example, the GMEI peaked a full six months after the trough in the LEI – a longer reaction time compared to previous cycles. Even when they did react, however, it was at a lower intensity, with smaller easings by fewer banks, compared to previous cycles After 2016, however, central bank behavior became particularly misguided. The subsequent monetary tightening was clearly too abrupt. Investor sentiment and expectations of global growth, captured by our GFIS duration indicator (Chart 7), were on their way down while global central banks were all too eager to stop easing, ignoring the data showing signs of global weakness – especially from China. Chart 7Central Banks Are Zigging When They Should Be Zagging
Central Banks Are Zigging When They Should Be Zagging
Central Banks Are Zigging When They Should Be Zagging
By June 2018, none of the central banks included in the GMEI were easing, despite the global LEI having peaked six months earlier. In September 2018, despite facing persistent global weakness – the global manufacturing PMI had fallen from its peak of 54.4 nine months earlier to 52.1 and the global LEI was already in negative territory indicating more weakness to come – only a meagre 3% of central banks had begun stimulating. The Fed exemplified this complacency with its rate hike in December 2018 and its refusal to clearly pivot in a dovish direction until three months later. When they ultimately delivered a rate cut in late July of this year, it was clear they had waited too long. Chart 8How Will Dovish Policymakers Respond To Improving Growth?
How Will Dovish Policymakers Respond To Improving Growth?
How Will Dovish Policymakers Respond To Improving Growth?
Globally, the overall policy response was non-existent all the way until May 2019, when central banks finally got with the program and scrambled to ease. Now, with the Fed having cut rates and facing the possibility of further rate cuts (possibly hastened by the Tweeter-in-Chief), global central bankers will not want to be left behind, lest they suffer unwanted currency strength and forgo export competitiveness. However, they might be once again misreading the data and the global easing cycle might be much closer to its end than its beginning. BCA’s Chief Global Strategist, Peter Berezin, has noted that global manufacturing cycles average three years from peak to peak. As the last growth cycle began in late spring of 2017, this means that we are likely at the bottom of the current cycle and therefore, global growth should start to pick up soon. This message is reinforced by our Global LEI diffusion index (Chart 8), which indicates that the Global LEI has put in a bottom and will continue climbing higher in the coming months. The easing of global financial conditions, and the lagged impact of China’s policy stimulus measures from earlier in 2019, corroborate the message from the global LEI. With bonds as overbought as they are today, we expect yields to rebound once investors realize that the sky is not really falling. A pick up in the global LEI, in turn, suggests that the global PMI will follow and should soon move higher, with a lead time of six months based on past cycles (as we show in the bottom panel of Chart 1). Another reliable leading growth indicator, the level of high-yield corporate bond spreads, is also signaling a rebound in both the U.S. and euro area economies over the next few quarters (Chart 9). Chart 9High-Yield Spreads Are A Leading Economic Indicator
High-Yield Spreads Are A Leading Economic Indicator
High-Yield Spreads Are A Leading Economic Indicator
Global bond yields, meanwhile, seem stuck between a rock and a hard place. As shown in Chart 10, yields move with expectations of future growth. Bond investors are sensitive to declines in expectations of future growth, captured by the global LEI, as this necessitates central bank intervention in the future to lower short-term rates, thus bringing down the expectations component of long-term yields. At the same time, a slowdown in growth in the present increases the safe-haven demand for bonds which again drives down yields. Chart 10Potential Triggers For Higher Bond Yields
Potential Triggers For Higher Bond Yields
Potential Triggers For Higher Bond Yields
Although the global is ticking back up, global policy uncertainty (Chart 10, middle panel) is near all-time highs due to the U.S.-China trade war. In such an environment, investors will naturally flock to the safety of bonds. In previous reports, we have shown how similar the current backdrop is to the 2015/2016 episode, when nervous bond investors were less likely to be forward-looking and needed to see firm evidence of a pickup in global growth before they started to push up yields on a sustained basis. Given the increasing likelihood that global central banks will not be able to fully deliver the amount of aggressive easing discounted by markets because of a more stable growth backdrop, any lessening of trade tensions – a growing possibility with U.S. President Donald Trump gearing up for the 2020 election – should allow calmer heads to once again prevail as global economic momentum improves and policy uncertainty wanes. With bonds as overbought as they are today, we expect yields to rebound once investors realize that the sky is not really falling. It remains to be seen how policymakers respond to that outcome. Given recent history, however, we fear that central bankers could end up turning more hawkish once again faster than markets expect, which would set the stage for a more sustainable rise in global bond yields in 2020. Bottom Line: We still recommend that investors stick to a neutral benchmark overall portfolio duration stance in the near term (0-3 months). Markets will need more than just one or two positive data points to be convinced that global growth is rebounding. On a cyclical horizon, once it is clear that we’ve entered into a new global manufacturing up-cycle, global yields are likely to rise. As Trump reaches for a deal ahead of the 2020 election, the decline in global policy uncertainty will contribute to a more bond-bearish environment. Robert Robis, CFA, Chief Fixed Income Strategist rrobis@bcaresearch.com Shakti Sharma, Research Associate shaktis@bcaresearch.com Recommendations The GFIS Recommended Portfolio Vs. The Custom Benchmark Index
As The Yield Turns
As The Yield Turns
Duration Regional Allocation Spread Product Tactical Trades Yields & Returns Global Bond Yields Historical Returns
Highlights Global bond yields have closely tracked the trajectory of global growth. While the global economy remains fragile, some positive signs are emerging: Our global leading economic indicator has moved off its lows; global financial conditions have eased significantly; U.S. household spending remains resilient; and China is set to further increase stimulus. Neither a severe escalation of the trade war nor a hard Brexit is likely. A simple comparison between current dividend yields and bond yields implies that global equities would need to fall by an outsized amount over the next decade for bonds to outperform stocks. As global growth stabilizes and then begins to recover over the coming months, bond yields will rebound from depressed levels. Investors should overweight stocks versus bonds for now, and look to upgrade EM and European equities later this year. Feature Global Growth Driving Bond Yields Chart 1Global Bond Yields: How Low Will They Go?
Global Bond Yields: How Low Will They Go?
Global Bond Yields: How Low Will They Go?
Global bond yields rose sharply yesterday on word that U.S. and Chinese trade negotiators will meet in October. The announcement by China’s State Council of additional stimulus measures and better-than-expected data on the health of the U.S. service sector also drove the bond sell-off. The jump in yields follows a period of almost unrelenting declines. After hitting a high of 3.25% last October, the U.S. 10-year yield fell to 1.43% this Tuesday, just shy of its all-time low of 1.34% reached on July 5, 2016. The 30-year Treasury yield broke below 2% for the first time in history on August 15, falling to as low as 1.91% this week. It now stands at 2.07%. In Japan and across much of Europe, bond yields remain firmly in negative territory (Chart 1). The large movements in bond yields can be attributed to both the state of the global economy as well as to changes in how central banks are reacting to economic uncertainty. Just as stronger global growth pushed yields higher between mid-2016 and early-2018, the deceleration in growth since then has pulled yields lower. Chart 2 shows that there has been a close correlation between changes in the U.S. 10-year yield and the ISM manufacturing index. The release on Tuesday of a weaker-than-expected ISM manufacturing print for August was enough to push the 10-year yield down by seven basis points within a matter of minutes. Chart 2The Deceleration In Growth Has Pulled Yields Down
The Deceleration In Growth Has Pulled Yields Down
The Deceleration In Growth Has Pulled Yields Down
The forward-looking new orders component of the ISM manufacturing index sunk to a seven-year low. The export orders component fell to the lowest level since 2009. Export volumes track ISM export orders quite closely (Chart 3). Not surprisingly, the ISM press release noted that trade remains “the most significant issue” for U.S. manufacturers. Chart 3Export Volumes Track The ISM Export Component
Export Volumes Track The ISM Export Component
Export Volumes Track The ISM Export Component
The only redeeming feature in the report was that the customers’ inventories index dropped a notch from 45.7 in July to 44.9 in August. A reading below 50 for this subindex indicates that manufacturers believe that their customers are holding too few inventories, which is positive for future production. Global Manufacturing PMI Not Looking Much Brighter The Markit global manufacturing PMI remained below 50 for the fourth month in a row in August. While the global PMI did edge up slightly from July’s reading, this was largely due to a modest rebound in the Chinese PMI, which rose from 49.9 to 50.4. The improvement in the China Markit-Caixin PMI stands in contrast to the further deterioration observed in the “official” National Bureau of Statistics PMI. The former is more heavily geared towards private-sector exporting companies, and hence may have been influenced by the front-loading of exports ahead of the planned tariff increase on Chinese exports to the United States. Some Positive Signs Chart 4Global LEI Has Moved Off Its Lows
Global LEI Has Moved Off Its Lows
Global LEI Has Moved Off Its Lows
In light of the disappointing manufacturing data, it is too early to call a bottom in the global industrial cycle. Nevertheless, there are some hopeful signs. Our Global Leading Economic Indicator (LEI) has moved off its lows (Chart 4). It usually leads the PMIs by a few months. Sterling will probably be the best performing currency in the G7 over the next five years. Despite ongoing weakness in the manufacturing sector, household spending has held up in most economies. In the U.S., the nonmanufacturing ISM index jumped to 56.4 in August from 53.7 in July. Real personal consumption is still on track to grow by 2.8% in Q3 according to the Atlanta Fed (Chart 5). The euro area services PMIs have also been resilient (Chart 6). In Germany, where the manufacturing PMI stood at 43.5 in August, the services PMI rose to 54.8. Chart 5Inventories And Net Exports Have Subtracted From U.S. Growth In Q2 And Q3
Bond Yields Have Hit Bottom
Bond Yields Have Hit Bottom
Chart 6AThe Service Sector Has Softened Much Less Than Manufacturing (I)
The Service Sector Has Softened Much Less Than Manufacturing (I)
The Service Sector Has Softened Much Less Than Manufacturing (I)
Chart 6BThe Service Sector Has Softened Much Less Than Manufacturing (II)
The Service Sector Has Softened Much Less Than Manufacturing (II)
The Service Sector Has Softened Much Less Than Manufacturing (II)
Global financial conditions have eased significantly, mainly thanks to the steep decline in bond yields. The current level of financial conditions implies that global growth could rebound swiftly (Chart 7). The Chinese government is also likely to step up fiscal/credit stimulus over the coming months in an effort to shore up growth. In a boldly worded statement released on Wednesday, the Chinese State Council promised to further increase bond issuance to finance infrastructure projects, while cutting interest rates and reserve requirements. A stronger Chinese economy should benefit global growth (Chart 8). Chart 7Easier Financial Conditions Will Benefit Global Growth
Easier Financial Conditions Will Benefit Global Growth
Easier Financial Conditions Will Benefit Global Growth
Chart 8Stronger Chinese Growth Should Benefit The Global Economy
Stronger Chinese Growth Should Benefit The Global Economy
Stronger Chinese Growth Should Benefit The Global Economy
The Trade War: Moving Towards A Détente? The announcement that the U.S. and China will resume trade negotiations on October 5th is a step in the right direction. As we noted last week, both parties have an incentive to de-escalate the trade conflict. President Trump wants to prop up the stock market and the economy in order to improve his re-election prospects. China also wants to bolster growth.1 Chart 9Would China Really Be Better Off Negotiating With A Democrat As President?
Would China Really Be Better Off Negotiating With A Democrat As President?
Would China Really Be Better Off Negotiating With A Democrat As President?
As difficult as it has been for China to deal with Donald Trump, trying to secure a trade deal with him after he has been re-elected would be even more challenging. This would be especially the case if Trump thought that the Chinese had tried to sabotage his re-election bid. Even if Trump were to lose the election, it is not clear that China would end up with someone more palatable to deal with on trade matters. Does the Chinese government really want to negotiate over labor standards and human rights with President Warren, who betting markets now think has a better chance of becoming the Democratic nominee than Joe Biden (Chart 9)? While Republicans in Congress would be able to restrain a Democratic president on domestic issues, the president would still enjoy free rein over trade policy. Brexit Uncertainty Adding To Investor Angst Two weeks before the Brexit vote on June 23, 2016, I wrote that “Just like my gut told me last August that Trump would do much better at the polls than almost anyone thought possible, I increasingly feel that come June 24th, the EU may find itself with one less member.”2 Chart 10Brexit Opposition Has Been Growing
Brexit Opposition Has Been Growing
Brexit Opposition Has Been Growing
Soon after the shocking verdict, we argued that a hard Brexit would prove to be politically infeasible, meaning that the U.K. would either end up holding another referendum or be forced to negotiate some sort of customs union with the EU. Our view that a hard Brexit will not happen has not changed. Chart 10 shows that opposition to Brexit has only grown since that fateful day. Boris Johnson does not have enough votes in Westminster to force a hard Brexit. Another election would not change this outcome, given that it would almost certainly produce a hung parliament. In any case, it is not clear that Johnson actually wants a hard Brexit. The Times of London recently reported that the government’s own contingency plans for a hard Brexit, weirdly code-named “Operation Yellowhammer,” predicted a crippling logjam at British ports leading to shortages of fuel, food and medicine.3 Boris Johnson is all hat and no cattle. He will be forced to make a deal with the EU. Buy the pound on any dips. Sterling will probably be the best performing currency in the G7 over the next five years. Central Banks: Cut First, Ask Questions Later Chart 11Inflation Expectations Are Low Across The Globe
Inflation Expectations Are Low Across The Globe
Inflation Expectations Are Low Across The Globe
Despite a few glimmers of good news, central banks are in no mood to take any chances. St. Louis Fed President James Bullard said it bluntly last week: “Our job is to get the yield curve uninverted.”4 If history is any guide, global growth will stabilize and begin to recover over the coming months. Inflation expectations are below target in most economies (Chart 11). Central banks know full well that if the current slowdown morphs into a full-blown recession, they will be out of monetary ammunition very quickly. In such a setting, it does not make sense to hold your punches. Much better to generate as much inflation as possible, and as soon as possible, so that real rates can be brought deeper into negative territory if economic circumstances later warrant it. What If The Medicine Works? The risk of easing monetary policy too much is that economies will eventually overheat, producing more inflation than is desirable. It is easy to forget that the aggregate unemployment rate in the G7 is now below its 2007 lows (Chart 12). True, inflation has yet to take off, but this may simply be because inflation is a lagging indicator (Chart 13). Chart 12Unemployment Rates Keep Trending Lower
Unemployment Rates Keep Trending Lower
Unemployment Rates Keep Trending Lower
Chart 13Inflation Is A Lagging Indicator
Bond Yields Have Hit Bottom
Bond Yields Have Hit Bottom
For all the talk about how the Phillips curve is dead, the empirical evidence suggests it is very much alive and well (Chart 14). Ironically, this means that lower interest rates today could set the stage for much higher rates in the future if hyperstimulative monetary policies ultimately generate a bout of inflation. Chart 14The Phillips Curve Is Alive And Well
The Phillips Curve Is Alive And Well
The Phillips Curve Is Alive And Well
Chart 15The Dollar Is A Countercyclical Currency
The Dollar Is A Countercyclical Currency
The Dollar Is A Countercyclical Currency
Investment Conclusions Like most economic forecasters, central banks tend to extrapolate recent trends too far into the future. Global growth has been weakening since early 2018 so it seems reasonable to assume that this trend will persist into next year. However, as we have documented, global industrial cycles tend to last about three years – 18 months of rising growth followed by 18 months of falling growth.5 If history is any guide, global growth will stabilize and begin to recover over the coming months. Should that occur, we will enter an environment where the lagged effects of easier monetary policy are hitting the economy just when the manufacturing cycle is taking a turn for the better. Stocks are likely to fare well in such a setting, while long-term bond yields will move higher. As a countercyclical currency, the dollar will also start to weaken anew (Chart 15). Granted, an intensification of the trade war or some other major adverse shock would upset this rosy forecast. Nevertheless, current market pricing offers a fairly large cushion against downside risks. Thanks to the drop in bond yields, the equity risk premium is quite high globally (Chart 16). Even if one were to assume that nominal dividend payments remain unchanged for the next ten years, the S&P 500 would still need to fall by more than 20% in real terms over the next decade for bonds to outperform stocks (Chart 17). Euro area stocks would need to drop by more than 42%. U.K. stocks would need to plummet by at least 60%! Chart 16AEquity Risk Premia Remain Quite High (I)
Equity Risk Premia Remain Quite High (I)
Equity Risk Premia Remain Quite High (I)
Chart 16BEquity Risk Premia Remain Quite High (II)
Equity Risk Premia Remain Quite High (II)
Equity Risk Premia Remain Quite High (II)
Chart 17AStocks Need To Fall By A Considerable Amount For Bonds To Outperform Over A 10-Year Horizon (I)
Stocks Need To Fall By A Considerable Amount For Bonds To Outperform Over A 10-Year Horizon (I)
Stocks Need To Fall By A Considerable Amount For Bonds To Outperform Over A 10-Year Horizon (I)
Chart 17BStocks Need To Fall By A Considerable Amount For Bonds To Outperform Over A 10-Year Horizon (II)
Stocks Need To Fall By A Considerable Amount For Bonds To Outperform Over A 10-Year Horizon (II)
Stocks Need To Fall By A Considerable Amount For Bonds To Outperform Over A 10-Year Horizon (II)
Investors should remain overweight stocks versus bonds over the next 12 months. We intend to upgrade EM and European equities once we see a bit more evidence that global growth has troughed. Peter Berezin, Chief Global Strategist Global Investment Strategy peterb@bcaresearch.com Footnotes 1Please see Global Investment Strategy Weekly Report, “A Psychological Recession?” dated August 30, 2019. 2Please see Global Investment Strategy Weekly Report, “Worry About Brexit, Not Payrolls,” dated June 10, 2016. 3Rosamund Urwin and Caroline Wheeler, “Operation Chaos: Whitehall’s Secret No-Deal Brexit Preparations Leaked,” The Times, August 18, 2019. 4“Fed’s Bullard Sees ‘Robust Debate’ Over Half-Point Cut,” Bloomberg, August 23, 2019. 5Please see Global Investment Strategy Weekly Report, “Three Cycles,” dated July 26, 2019. Strategy & Market Trends MacroQuant Model And Current Subjective Scores
Bond Yields Have Hit Bottom
Bond Yields Have Hit Bottom
Strategic Recommendations Closed Trades
Highlights Currency markets continue to fight a tug-of-war between deteriorating global growth and easing global financial conditions. Such an environment is typically fertile ground for a dollar bull market, yet the trade-weighted dollar is up only 2.3% this year. The lack of more-pronounced strength in the greenback suggests that other powerful underlying forces are preventing the dollar from gapping higher. The breakdown in the bond-to-gold ratio is an important distress signal for dollar bulls. As both political and economic uncertainty remain elevated, likely winners in the interim remain safe-haven currencies such as the yen and the Swiss franc. For the remainder of the year, portfolio managers should focus on relative value trades at the crosses, rather than outright dollar bets. Stand aside on the pound for now. Aggressive investors can place a buy stop at 1.25 and sell stop at 1.20. The Riksbank’s hawkish surprise was a welcome development for the krona. Remain long SEK/NZD. The SEK might be the best-performing G10 currency over the next five years. Feature Yearly performance is an important benchmark for most portfolio managers. As most CIOs return to their desks from a summer break, they will be looking at a few barometers to help them navigate the rest of 2019. On the currency front, here is what the report card looks like so far: The dollar has been a strong currency, but the magnitude of the increase has been underwhelming, given market developments. The Federal Reserve’s trade-weighted dollar is up only 2.3% this year. In contrast, the yen is up 3.6% and the Canadian dollar 2.3%. Meanwhile, the best shorts have been the Swedish krona (down 9.7%) and the kiwi. Through the lens of the currency market, the dollar has been in a run-of-the-mill bull market, rather than in a panic buying frenzy (Chart I-1). Chart I-1A Report Card On Currency Performance
Preserving Capital During Riot Points
Preserving Capital During Riot Points
Gold has broken out in every major currency. This carries a lot of weight because it has occurred amid dollar strength, a historical rarity. Importantly, the breakout culminates the seven-or-so-year pattern where gold was stable versus many major currencies (Chart I-2). We are no technical analysts, but ever since gold peaked in 2011, all subsequent rallies have seen diminishing amplitude, which by definition were bull traps. This appeared to have changed since 2015-2016, which could be a signal that the dollar bull market is nearing an end. Commodities have been a mixed bag. Precious metals have surged alongside gold. Despite the recent correction, oil is still up 13.8% for the year. Meanwhile, natural gas is in a bear market. Among metals, nickel has surged 70%, while Doctor Copper is down 5.1%. The only semblance of agreement is among soft commodities, which have been mostly deflating (Chart I-3). In short, there has been no coherent theme for commodity currencies. All the talk of a Sino-U.S. trade war, Chinese A-shares are up 18.7% for the year. This more than makes up for any CNY depreciation. Equities have performed well across the board, mostly up double digits. The only notable laggards have been in Asia, specifically Japan, Hong Kong and Korea. That said, of all the talk of a Sino-U.S. trade war, Chinese A-shares are up 18.7% for the year. This more than makes up for any CNY depreciation. This also suggests that capital flows into equities have not been a major driver of currencies this year. Chart I-2Gold Has Been The Ultimate Currency
Gold Has Been The Ultimate Currency
Gold Has Been The Ultimate Currency
Chart I-3Commodities Are A Mixed Bag
Commodities Are A Mixed Bag
Commodities Are A Mixed Bag
Yields have collapsed, with higher-beta markets seeing bigger drops. Differentials have mostly moved against the dollar in recent weeks as the U.S. 10-year yield plays catch-up to the downside. One important question is that with Swiss 10-year yields now at -0.96% and German yields at -0.67%, is there a theoretical floor to how low bond yields can fall (Chart I-4)? Chart I-4Yields Have Melted
Yields Have Melted
Yields Have Melted
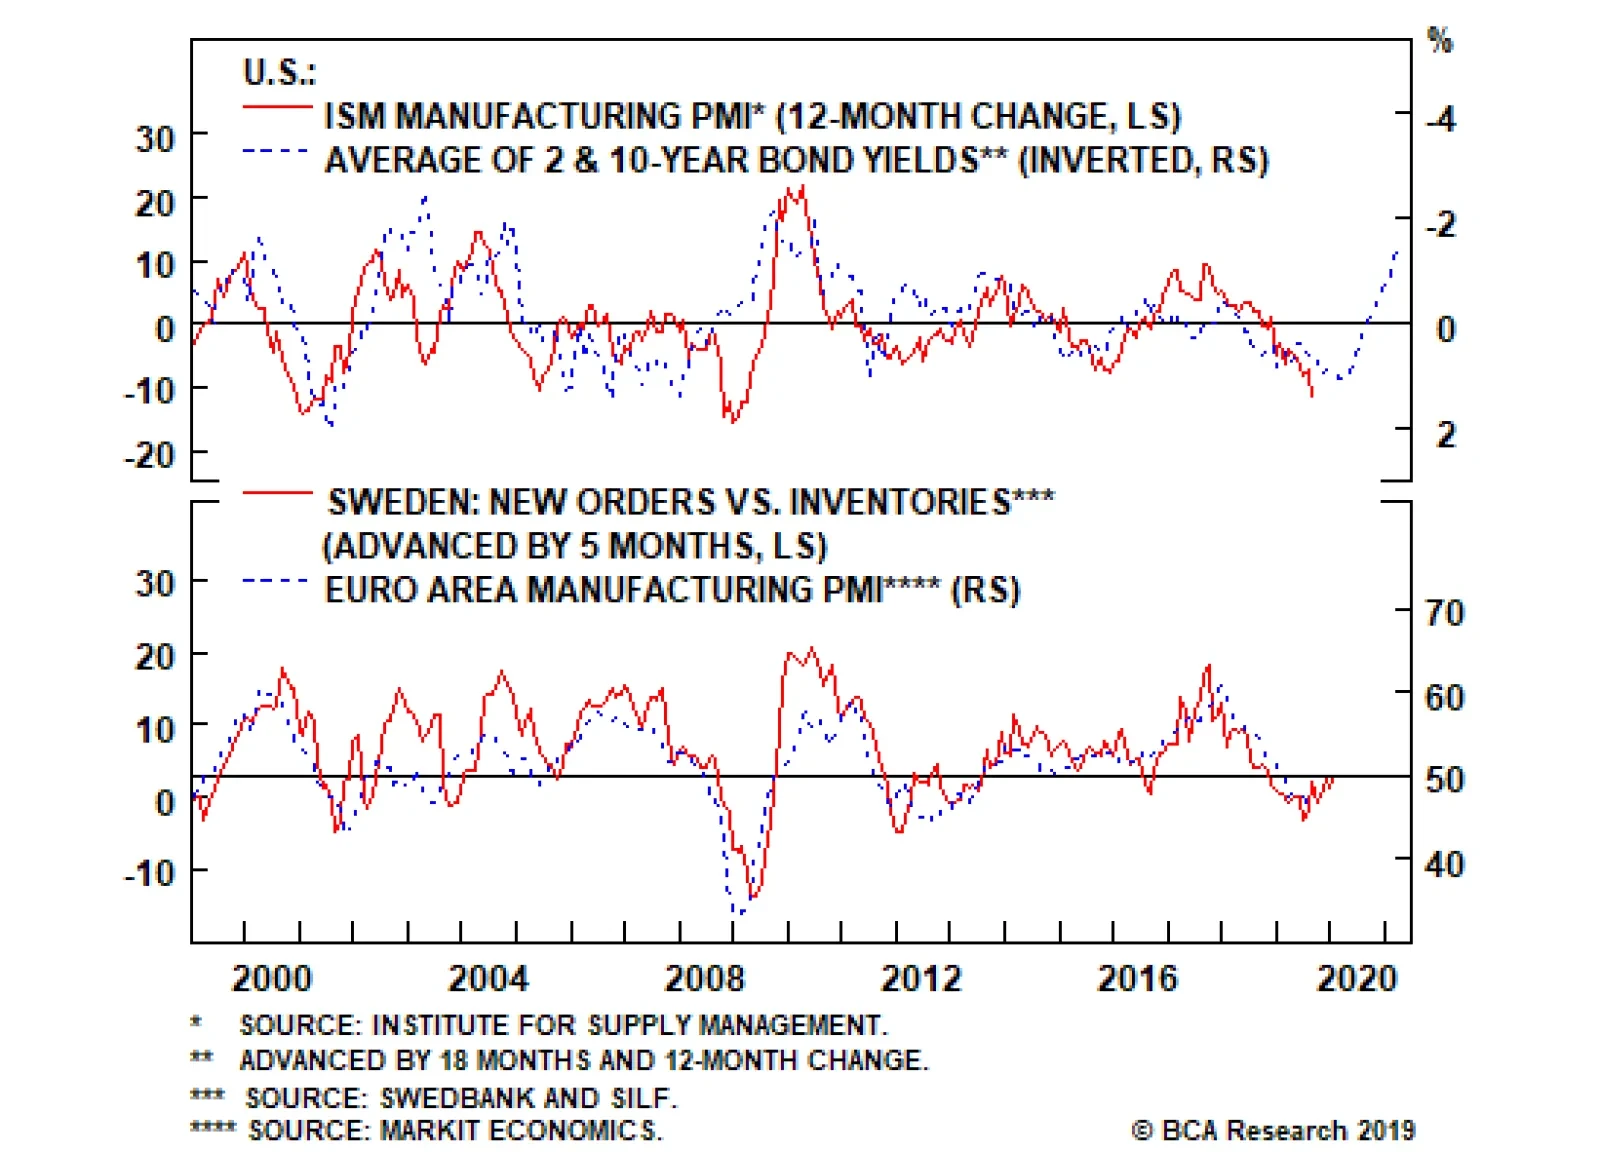
Heading back to his office, the CIO is now pondering how to deploy fresh capital. On one hand, the typical narrative that we have been operating in the quadrant of a deflationary bust, given the trade war, manufacturing recession, political unrest and rapidly rising probability of recession is not clearly visible in financial data. This would have been historically dollar bullish, and negative for other asset classes. However, the plunge in bond yields begs the question of whether this is a prelude to worse things to come. A more sanguine assessment is that we might be at a crossroads of sorts. If economic data continues to deteriorate due to much larger endogenous factors, a defensive strategy is clearly warranted. One way to tell will be an emerging divergence between our leading indicators and actual underlying data. On the flip side, any specter of positive news could light a fire under sectors, currencies and countries that have borne the brunt of the slowdown. Time is of the essence, and strategy will be dependent on horizons. A review of the leading indicators for the major economic blocks is in order. Are We At The Cusp Of A Recession? Centripetal systems tend to stay in equilibrium, while centrifugal forces can explode in spectacular fashion. In the currency world, this means that the tug of war between deteriorating global growth and easing liquidity conditions cannot last forever. Either the dollar breakout morphs into a panic buying frenzy or proves to be a bull trap. Are we at the cusp of a bottom in global growth, or approaching a riot point? Let us start with the economic front: U.S.: Plunging U.S. bond yields have historically been bullish for growth. More importantly, the recent decline in the ISM Manufacturing Index is approaching 2008 recessionary levels. Either easing in financial conditions revive the index, or the decoupling persists for a while longer. The tone on the political front appears reconciliatory, which means September and October data will be critical. In 2008, the divergence between deteriorating economic conditions and falling yields was an important signpost for a riot point (Chart I-5). Eurozone: The Swedish manufacturing PMI ticked up to 52.4 in August. Most importantly, the new orders-to-inventories ratio is suggesting that the German (and European) manufacturing recession is reversing (Chart I-6). For all the debate about whether China is stimulating enough or not, the beauty about this indicator is that there are no Chinese variables in it (the euro zone and Sweden export a lot of goods and services to China). Any surge higher in this indicator will categorically conclude the euro zone manufacturing recession is over, lighting a fire under the euro in the process. Whatever the number is, if it can stabilize Chinese growth, a powerful deflationary force that dictated markets in 2018-2019 will dissipate. China: Chinese bond yields have melted alongside global yields. This is reflationary, given the liberalization in the bond market over the past few years. Policy makers are currently discussing the quota for next year’s fiscal spending. Whatever the number is, if it can stabilize Chinese growth, a powerful deflationary force that dictated markets in 2018-2019 will dissipate. Chart I-5Is U.S. Manufacturing Close ##br##To A Bottom?
Is U.S. Manufacturing Close To A Bottom?
Is U.S. Manufacturing Close To A Bottom?
Chart I-6Is Eurozone Manufacturing Close To A Bottom?
Is Eurozone Manufacturing Close To A Bottom?
Is Eurozone Manufacturing Close To A Bottom?
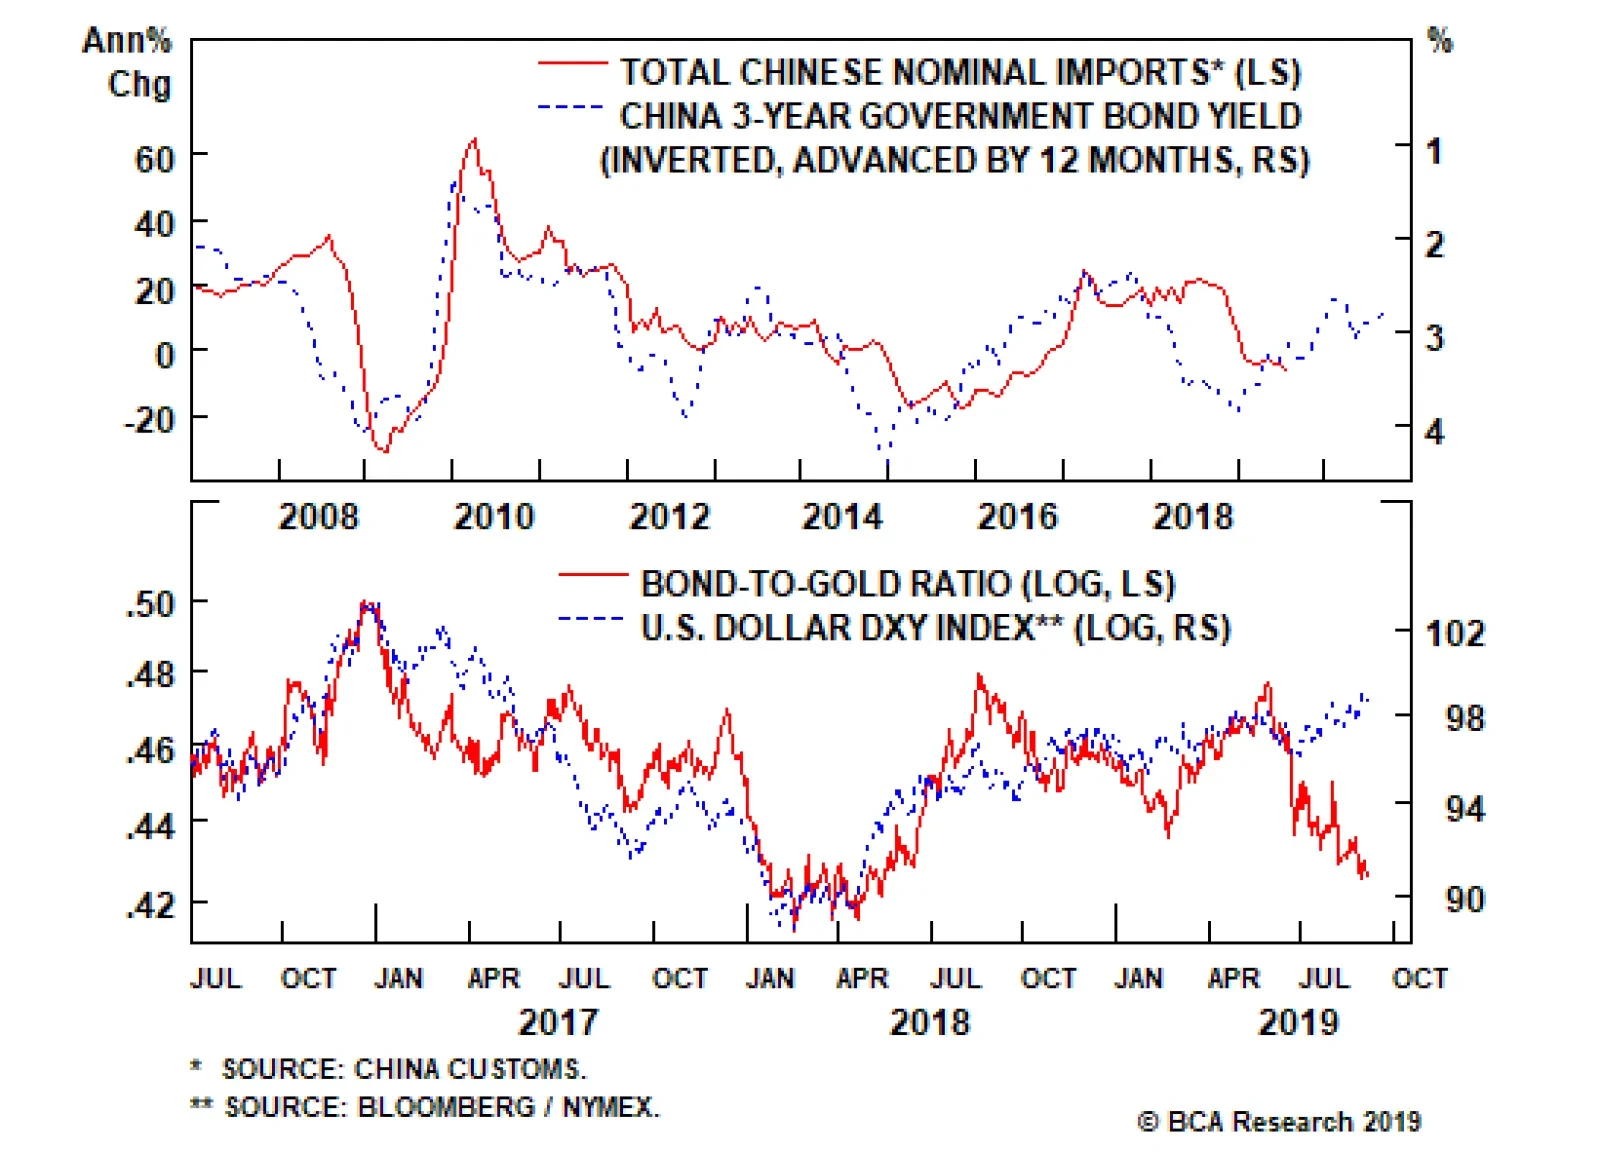
Discussions among industry specialists suggest some anecdotal evidence that many manufacturers have been engaged in re-routing channels and parallel manufacturing chains to avoid the U.S.-China tariffs. This is welcome news, since global exports and global trade are still in a downtrend. A key barometer to watch on whether the global slowdown is infecting domestic demand will be Chinese imports (Chart I-7). So far, the message is that traditional correlations have not yet broken down. As a contrarian, this is positive. Manufacturing slowdowns have tended to last 18 months peak-to-trough, the final months of which are characterized by fatigue and capitulation. However, unless major imbalances exist (our contention is that so far they do not), mid-cycle slowdowns sow the seeds of their own recovery via accumulated savings and pent-up demand. In the currency world, the dollar has tended to be an excellent counter-cyclical barometer. On the dollar, the bond-to-gold ratio is breaking down, in contrast to the rise in the DXY. This is not a sustainable divergence (Chart I-8). The last time the bond-to-gold ratio diverged from the DXY was in 2017, and that proved extremely short-lived. As global growth rebounded and U.S. repatriation flows eased, dollar support was quickly toppled over. Chart I-7Chinese Imports Could Soon Rebound
Chinese Imports Could Soon Rebound
Chinese Imports Could Soon Rebound
Chart I-8Mind The Gap
Mind The Gap
Mind The Gap
Ever since the end of the Bretton Woods agreement broke the gold/dollar anchor in the early 1970s, bullion has stood as a viable threat to dollar liabilities, capturing the ebbs and flows of investor confidence in the greenback tick-for-tick. While U.S. yields remain attractive, portfolio outflows and a deteriorating balance-of-payments backdrop will keep longer-term investors on the sidelines. Chart I-9Dollar Bulls Need A More Hawkish Fed
Dollar Bulls Need A More Hawkish Fed
Dollar Bulls Need A More Hawkish Fed
Capital tends to gravitate towards higher returns, and the U.S. tax break in 2017 was a one-off that is now ebbing. Meanwhile, despite wanting to resist the appearance of influence from President Trump, the Fed realises that the neutral rate of interest in the U.S. is now below its target rate, which should keep them on an easing path. A dovish Fed has historically been bearish for the dollar (Chart I-9). Bottom Line: In terms of strategy, heightened uncertainty can keep the greenback bid in the coming weeks, but we will be sellers on strength. Our favorite plays remain the Swedish krona, the Norwegian krone, and, for insurance purposes, the Japanese yen. Outright dollar shorts await confirmation from more economic data. What To Do About CAD? The Bank of Canada (BoC) decided to stay on hold at its latest policy meeting. This was highly anticipated, but the silver lining is that the BoC might later reflect on this move as a policy mistake, given the arms race by other central banks to ease policy. The three most important variables for the Canadian economy are a:) what is happening to the U.S. economy, b:) what is happening to crude oil prices and c:) what is happening to consumer leverage and the housing market. On all three fronts, there has been scant good news in recent weeks. Heightened uncertainty can keep the greenback bid in the coming weeks, but we will be sellers on strength. The Nanos Investor Confidence Index suggests Canadian GDP might be at the cusp of a slowdown after an excellent run of a few quarters (Chart I-10). One of the key drivers for the CAD/USD exchange rate is interest rate differentials with the U.S., and the compression in rates could run further (Chart I-11). Unless the BoC adopts a looser monetary stance, a rising exchange rate is likely to tighten financial conditions. Rising energy prices will be a tailwind, but the Western Canadian Select discount, and persistent infrastructure problems are headwinds. As such, we think domestic conditions will continue to knock down whatever benefit comes from rising oil prices. Chart I-10Canadian Data Has##br## Been Firm
Canadian Data Has Been Firm
Canadian Data Has Been Firm
Chart I-11A Firm Exchange Rate Could Tighten Financial Conditions
A Firm Exchange Rate Could Tighten Financial Conditions
A Firm Exchange Rate Could Tighten Financial Conditions
On the consumer side, real retail sales are deflating at the worst pace since the financial crisis, but consumer confidence remains elevated given the robust labor market data (Chart I-12). However, if house prices continue to roll over, confidence is likely to crater (Chart I-13). Chart I-12Canada: Consumer Spending Is Weak
Canada: Consumer Spending Is Weak
Canada: Consumer Spending Is Weak
Chart I-13Canada: The Housing Market Is Softening
Canada: The Housing Market Is Softening
Canada: The Housing Market Is Softening
On the corporate side of the equation, the latest Canadian Business Outlook Survey suggests there has been no meaningful revival in capital spending. This is a big headwind, since Canada finances itself externally rather than via domestic savings. For external investors, the large stock of debt in the Canadian private sector and overvaluation in the housing market are likely to continue leading to equity outflows (from bank shares) on a rate-of-change basis (Chart I-14). Chart I-14Foreign Investors Are Fleeing Canadian Securities
Foreign Investors Are Fleeing Canadian Securities
Foreign Investors Are Fleeing Canadian Securities
Technically, the USD/CAD failed to break below the upward sloping trend line drawn from its 2012 lows, and the series of lower highs since the 2016 peak is forcing the cross into the apex of a tight wedge. The next resistance zone on the downside is the 1.30-1.32 level. Our bias is that this zone will prove to be formidable resistance. We continue to recommend investors short the CAD, mainly via the euro. Housekeeping We were stopped out of our short XAU/JPY position amid fervent buying in gold. Even though we are gold bulls, the rationale behind the trade was that the ratio of the two safe havens was at a speculative extreme. We will stand aside for now and look to re-establish the position in the near future. The Risksbank left rates on hold this week. This was welcome news for our long SEK/NZD position. The weakness in the SEK this year was expected given the surge in summer volatility, but the magnitude of the fall took us by surprise. In general, as soon as President Trump ramped up the trade-war rhetoric and China started devaluing the RMB, the environment became precarious for all pro-cyclical currencies. In terms of strategy going forward, the SEK probably has some additional downside, but not a lot. It is currently the cheapest currency in the G10. Should the Riksbank be actively trying to weaken the currency ahead of ECB policy stimulus this month, the final announcement, depending on what it entails, might be the bottom for the SEK and top for the EUR/SEK. Finally, as the Brexit drama unfolds, the outlook for the pound is highly binary. Aggressive investors can place a buy stop at 1.25 and a sell stop at 1.20. Anything in between should be regarded as noise. Chester Ntonifor, Foreign Exchange Strategist chestern@bcaresearch.com Currencies U.S. Dollar Chart II-1USD Technicals 1
USD Technicals 1
USD Technicals 1
Chart II-2USD Technicals 2
USD Technicals 2
USD Technicals 2
Recent data in the U.S. have been firm: PCE deflator nudged up from 1.3% to 1.4% year-on-year in July. Core PCE was unchanged at 1.6% year-on-year. Michigan consumer sentiment index fell from 92.1 to 89.8 in August. Trade deficit narrowed marginally by $1.5 billion to $54 billion in July. Notably, the trade deficit with China increased by 9.4% to $32.8 billion in July. Initial jobless claims was little changed at 217 thousand for the past week. Unit labor cost increased by 2.6% in Q2. Nonfarm productivity remained unchanged at 2.3%. Factory orders increased by 1.4% month-on-month in July. More importantly on the PMI front, Markit manufacturing PMI was down from 50.4 in July to 50.3 in August. ISM manufacturing PMI deteriorated to 49.1 in August, while ISM non-manufacturing PMI increased to 56.4, up from the previous 53.7 and well above estimates. DXY index fell by 0.5% this week. The recent worries about a near-term recession since the 10/2 yield curve inverted last month has been supporting the dollar, together with possible additional tariffs against China and the Chinese yuan devaluation. Going forward, we believe the dollar strength will ebb, given fading interest rate differentials. Report Links: Has The Currency Landscape Shifted? - August 16, 2019 USD/CNY And Market Turbulence - August 9, 2019 Focusing On the Trees But Missing The Forest - August 2, 2019 The Euro Chart II-3EUR Technicals 1
EUR Technicals 1
EUR Technicals 1
Chart II-4EUR Technicals 2
EUR Technicals 2
EUR Technicals 2
Recent data in the euro area have been firm: Unemployment rate was unchanged at 7.5% in July. Both headline and core preliminary inflation were unchanged at 1% and 0.9% year-on-year respectively in August. PPI fell from 0.7% to 0.2% year-on-year in July. On the PMI front, Markit composite PMI was little changed at 51.9 in August. Manufacturing component was unchanged at 47, while services component nudged up slightly to 53.5. Retail sales growth fell from upwardly-revised 2.8% to 2.2% year-on-year in July, still better than the estimated 2%. EUR/USD appreciated by 0.5% this week. While the manufacturing sector across Europe remain depressed, the services sector seems to be alive and well. The ECB monetary policy meeting next Thursday will be key for the path of the euro. Report Links: Battle Of The Central Banks - June 21, 2019 EUR/USD And The Neutral Rate Of Interest - June 14, 2019 Take Out Some Insurance - May 3, 2019 The Yen Chart II-5JPY Technicals 1
JPY Technicals 1
JPY Technicals 1
Chart II-6JPY Technicals 2
JPY Technicals 2
JPY Technicals 2
Recent data in Japan have been mixed: Housing starts fell by 4.1% year-on-year in July. Construction orders increased by 26.9% year-on-year in July, a positive shift from 4.2% contraction in the previous month. Capital spending growth slowed to 1.9% in Q2. Manufacturing PMI fell slightly to 49.3 in August, while services PMI jumped from 51.8 to 53.3. USD/JPY increased by 0.5% this week. The consumption tax hike in Japan is scheduled for October 1. The tax rate will rise from 8% to 10%, with possible exemption on several goods such as food and non-alcoholic beverages, which could be a drag on domestic spending. That being said, we continue to favor the Japanese yen due to the risk of a recession amid the escalating global trade war. Report Links: Has The Currency Landscape Shifted? - August 16, 2019 Portfolio Tweaks Into Thin Summer Trading - July 5, 2019 Battle Of The Central Banks - June 21, 2019 British Pound Chart II-7GBP Technicals 1
GBP Technicals 1
GBP Technicals 1
Chart II-8GBP Technicals 2
GBP Technicals 2
GBP Technicals 2
Recent data in the U.K. continued to deteriorate: Nationwide house price index was unchanged in August. Markit composite PMI fell to 50.2 in August: Manufacturing component slowed to 47.4; Construction PMI fell to 45; Services component decreased to 50.6. Retail sales contracted by 0.5% year-on-year in August. GBP/USD increased by 1.2% this week. Brexit remains the biggest driver behind the pound. British PM Boris Johnson’s brother resigned this week, citing tension between “family loyalty” and “national interest”. Our Geopolitical Strategy upgraded a no-deal Brexit probability to about 33%, maintaining that it is not the base case since nobody wants an imminent recession. From a valuation perspective, the pound is quite cheap and currently trading far below its fair value. Report Links: Battle Of The Central Banks - June 21, 2019 A Contrarian View On The Australian Dollar - May 24, 2019 Take Out Some Insurance - May 3, 2019 Australian Dollar Chart II-9AUD Technicals 1
AUD Technicals 1
AUD Technicals 1
Chart II-10AUD Technicals 2
AUD Technicals 2
AUD Technicals 2
Recent data in Australia have been mixed: Building approvals keep contracting by 28.5% year-on-year in July. Australian Industry Group (AiG) manufacturing index increased to 53.1 in August. The services index soared to 51.4 in August from a previous reading of 43.9. Current account balance shifted to A$5.9 billion in Q2, the first surplus since 1975. Retail sales contracted by 0.1% month-on-month in July. GDP growth slowed down to 1.4% year-on-year in Q2, the lowest rate in over a decade. Exports and imports both grew by 1% and 3% month-on-month respectively. Trade surplus narrowed marginally to A$7.3 million. AUD/USD increased by 1.4% this week. While Q2 GDP growth rate continued to soften, the current account and PMI data are showing tentative signs of a recovery. On Monday, the RBA kept interest rates unchanged at 1%. In the press release, the Bank acknowledged that low income growth and falling house prices limited household consumption in the first half of the year. Going forward, the tax cuts, infrastructure spending, housing market stabilization, and a healthy resources sector should all support the Australian economy, and put a floor under the Aussie dollar. Report Links: A Contrarian View On The Australian Dollar - May 24, 2019 Beware Of Diminishing Marginal Returns- April 19, 2019 Not Out Of The Woods Yet - April 5, 2019 New Zealand Dollar Chart II-11NZD Technicals 1
NZD Technicals 1
NZD Technicals 1
Chart II-12NZD Technicals 2
NZD Technicals 2
NZD Technicals 2
Recent data in New Zealand have been negative: Consumer confidence improved slightly to 118.2 in August. Building permits continued to contract by 1.3% month-on-month in July. Terms of trade increased to 1.6% in Q2. NZD/USD increased by 1.2% this week. In a Bloomberg interview earlier this week, the New Zealand finance minister Grant Robertson expressed his confidence on the fundamentals of the domestic economy, especially the low unemployment rate and sound wage growth. The largest downside risk remains the global trade and manufacturing slowdown. As a small open economy, New Zealand is ultimately vulnerable to exogenous factors, especially those related to its large trading partners including U.S., China, and Australia. On the policy side, the finance minister believes that there is “still room to move” in terms of monetary policy. Report Links: USD/CNY And Market Turbulence - August 9, 2019 Where To Next For The U.S. Dollar? - June 7, 2019 Not Out Of The Woods Yet - April 5, 2019 Canadian Dollar Chart II-13CAD Technicals 1
CAD Technicals 1
CAD Technicals 1
Chart II-14CAD Technicals 2
CAD Technicals 2
CAD Technicals 2
Recent data in Canada have been mostly negative: Annualized Q2 GDP growth jumped from 0.5% to 3.7% quarter-on-quarter, well above estimates. Bloomberg Nanos confidence fell slightly from 57 to 56.4. Markit manufacturing PMI fell to 49.1 in August, right after a small rebound in July to 50.2. Trade deficit widened to C$1.12 billion in July. USD/CAD fell by 0.5% this week. On Wednesday, BoC held its interest rate unchanged at 1.75%, as widely expected. In its monetary policy statement, the BoC sounded cautiously dovish, and expects economic activity to slow in the second half of the year amid global growth worries. The strong Q2 rebound was mostly driven by cyclical energy production and robust export growth, which could be temporary given the current market volatility. The rate cut probability next month is currently at 40%. Report Links: Portfolio Tweaks Into Thin Summer Trading - July 5, 2019 On Gold, Oil And Cryptocurrencies - June 28, 2019 Currency Complacency Amid A Global Dovish Shift - April 26, 2019 Swiss Franc Chart II-15CHF Technicals 1
CHF Technicals 1
CHF Technicals 1
Chart II-16CHF Technicals 2
CHF Technicals 2
CHF Technicals 2
Recent data in Switzerland have been positive: KOF leading indicator was unchanged at 97 in August. Real retail sales grew by 1.4% year-on-year in July, up from the previous 0.7%. Manufacturing PMI increased to 47.2 in August, up from 44.7 in the previous month. Headline inflation remained muted at 0.3% year-on-year in July. GDP yearly growth slowed to 0.2% in Q2, from a downwardly-revised 1% in Q1. USD/CHF fell by 0.2% this week. We remain positive on the Swiss franc. The global economic slowdown and increasing worries about a near-term recession remain tailwind for the safe-haven franc. Report Links: What To Do About The Swiss Franc? - May 17, 2019 Beware Of Diminishing Marginal Returns - April 19, 2019 Balance Of Payments Across The G10 - February 15, 2019 Norwegian Krone Chart II-17NOK Technicals 1
NOK Technicals 1
NOK Technicals 1
Chart II-18NOK Technicals 2
NOK Technicals 2
NOK Technicals 2
Recent data in Norway have been mostly negative: Retail sales increased by 0.9% year-on-year in July. Current account surplus plunged by 60% from NOK 73.1 billion to NOK 30.6 billion in Q2, the lowest since Q4 2017. USD/NOK fell by 1.3% this week. The rebound in oil prices this week has supported petrocurrencies. On the supply side, the production discipline is likely to be maintained. On the demand side, fiscal stimulus globally should revive overall demand. A potential weaker USD should also support oil prices in the second half of the year, which will be bullish for the Norwegian krone. Report Links: Portfolio Tweaks Into Thin Summer Trading - July 5, 2019 On Gold, Oil And Cryptocurrencies - June 28, 2019 Currency Complacency Amid A Global Dovish Shift - April 26, 2019 Swedish Krona Chart II-19SEK Technicals 1
SEK Technicals 1
SEK Technicals 1
Chart II-20SEK Technicals 2
SEK Technicals 2
SEK Technicals 2
Recent data in Sweden have been mixed: Manufacturing PMI increased slightly to 52.4 in August, from 52 in the previous month. Current account surplus narrowed from SEK 63 billion to SEK 37 billion in Q2. Industrial production increased by 3.2% year-on-year in July. Manufacturing new orders increased by 0.4% in July compared with last month. However, on a year-on-year basis, it fell by 2.2%. The Swedish krona rallied this week, appreciating by 1.4% against USD. The Riksbank held its interest rate unchanged at -0.25% this Thursday, and stated that they still plan to raise interest rates this year or early next, but at a slower pace than the previous forecast. Report Links: Where To Next For The U.S. Dollar? - June 7, 2019 Balance Of Payments Across The G10 - February 15, 2019 A Simple Attractiveness Ranking For Currencies - February 8, 2019 Trades & Forecasts Forecast Summary Core Portfolio Tactical Trades Limit Orders Closed Trades