Global
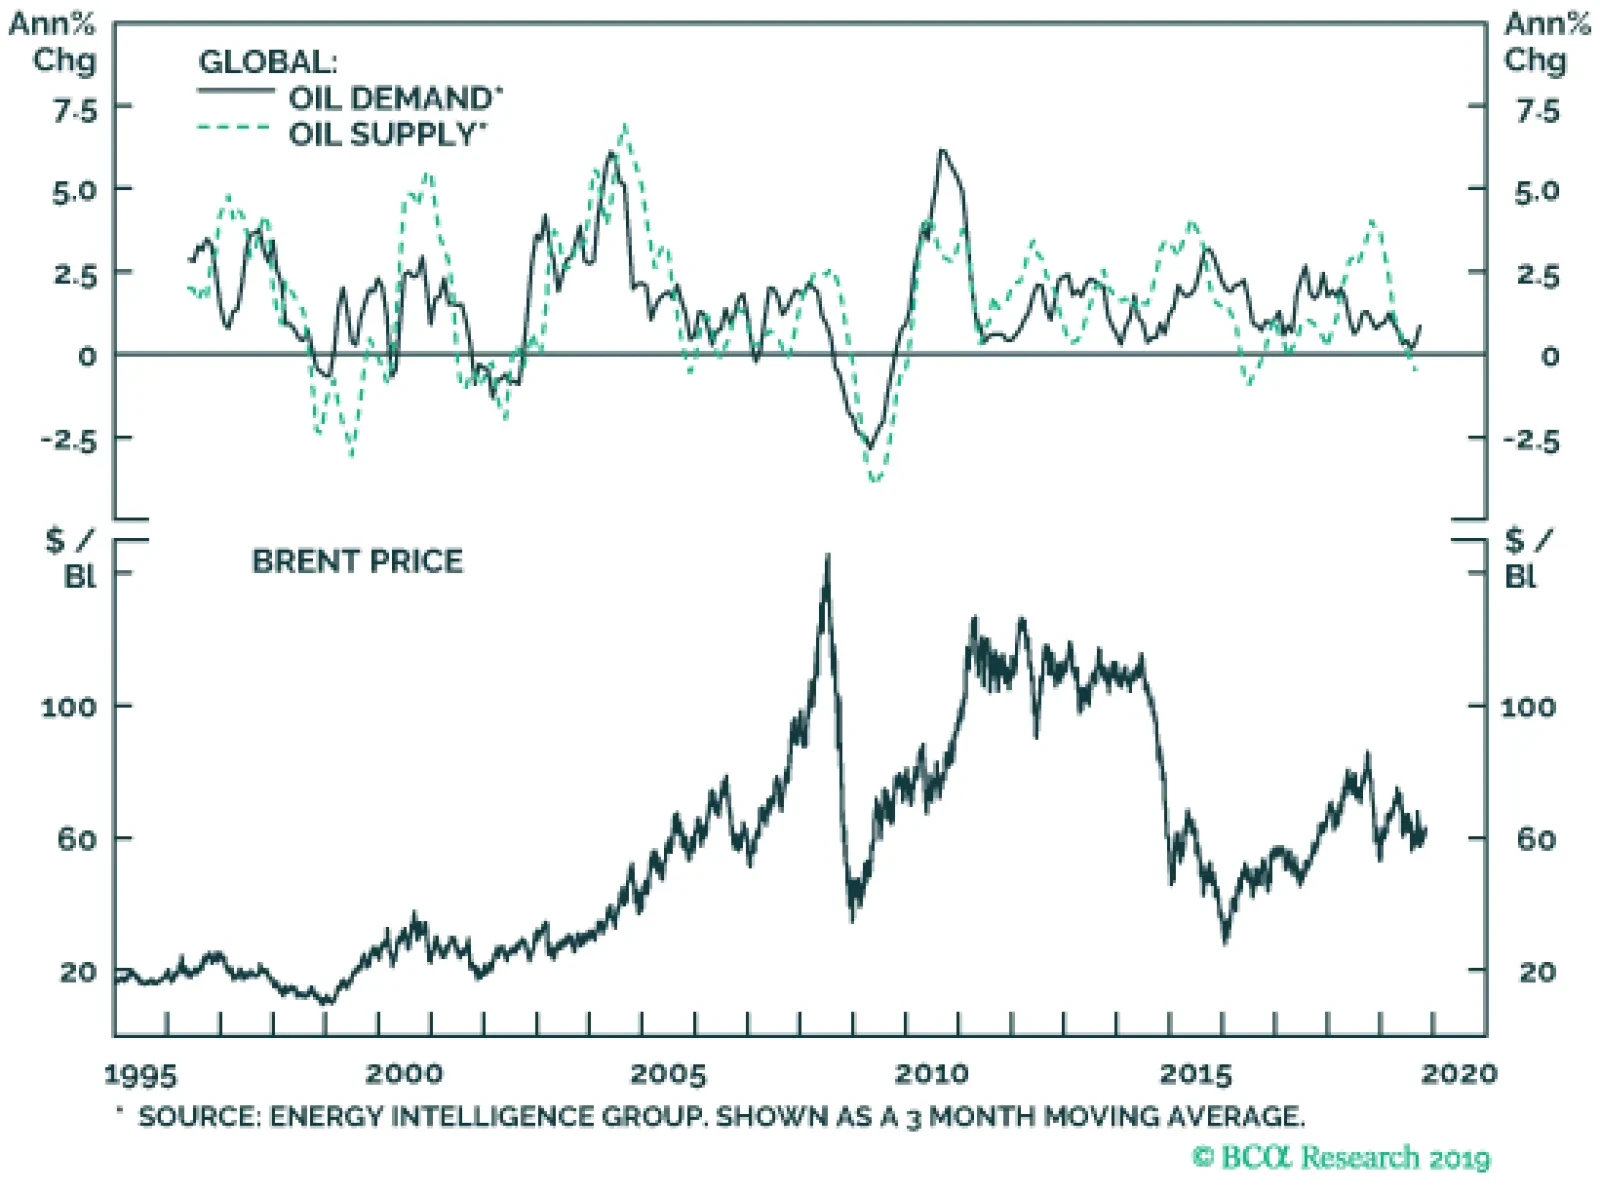
Crude oil has moved largely in a range for the past six months, with tightness in supply offset by some weakness in demand, especially from developed economies. Demand is likely to pick up in line with the global economy, and supply remains constrained by the…

Highlights Duration: A survey of the five factors that determine the path for Treasury yields suggests that further upside is likely. We see a clear path to 2.5% for long-maturity Treasury yields as recessionary risk moves to the back burner in the coming months. Credit Cycle: C&I lending standards tightened on net in the third quarter of 2019. But other indicators of monetary conditions point to continued accommodation. We expect lending standards will soon move back into “net easing” territory. Remain overweight Spread Product versus Treasuries. IG Valuation: Investment grade corporate bond spreads for all credit tiers are now below our fair value targets. We recommend only a neutral allocation to the sector. Investors should prefer high-yield bonds, where spreads are more attractive, and Agency MBS, which offer competitive expected returns and much less risk. Feature Chart 1Recession Risk Getting Priced Out
Recession Risk Getting Priced Out
Recession Risk Getting Priced Out
The bond sell-off continued last week, driven by positive developments in US/China trade negotiations and tentative signs of stabilization in some global growth indicators. The renewed sense of economic optimism has reduced the recessionary risk priced into bond markets. The 2/10 Treasury slope has steepened 30 bps since it briefly inverted in late August. During that same period, the 2-year Treasury yield is up 15 bps, the 10-year yield is up 45 bps and the Bloomberg Barclays Treasury index has underperformed a position in cash by 2.7% (Chart 1). These recent developments raise two important questions. First, should investors chase or fade the back-up in Treasury yields? And second, if the sell-off does continue, how high can yields go? To answer these questions we turn to the five macro factors that drive trends in US bond yields. These factors were outlined in our “Bond Kitchen” report from last April, and are listed right here:1 Global growth Policy uncertainty The US dollar The output gap Sentiment Back In The Kitchen Global Growth Chart 2CRB Index Needs To Rebound
CRB Index Needs To Rebound
CRB Index Needs To Rebound
Three global growth indicators are particularly relevant for US Treasury yields. They are the Global Manufacturing PMI, the US ISM Manufacturing PMI and the CRB Raw Industrials index. The latter is especially useful because it updates on a daily basis. Considering the CRB index, we notice that, while it is no longer in a steep downtrend, it has also not rebounded alongside the jump in bond yields (Chart 2). This should give us pause. Continued low readings from the CRB index make it more likely that bond yields will fall back in the coming weeks. We should also note that the ratio between the CRB index and Gold is more highly correlated with the 10-year Treasury yield than the CRB index itself.2 This ratio has bounced off its lows (Chart 2, top panel), but only because Gold has come under downward pressure. With the Fed committed to maintaining an accommodative policy stance until inflation expectations are re-anchored, we expect the Gold price to remain well bid. This means that raw industrials prices must rebound to keep the ratio trending higher. The CRB/Gold ratio has bounced off its lows, but only because Gold has come under downward pressure. More encouraging than the CRB index is the Global Manufacturing PMI, which has moved off its lows during the past three months (Chart 3). The increase has been partially driven by stronger US readings (Chart 3, panel 2), but principally by a significant jump in China’s PMI (Chart 3, bottom panel). Chart 3China Pulling The Global Manufacturing PMI Higher
China Pulling The Global Manufacturing PMI Higher
China Pulling The Global Manufacturing PMI Higher
Somewhat stronger China PMI readings should be expected, given the rebound in our China Investment Strategy’s Li Keqiang Leading Indicator – a composite measure of monetary conditions, money and credit growth (Chart 4).3 We should also expect further modest policy stimulus from China, as long as the labor market remains under pressure (Chart 4, bottom panel). Turning to the US, we have seen three very positive developments in the economic data during the past month. First, the ISM Services PMI jumped from 52.6 to 54.7 in October (Chart 5). A drop in this index to 50 or below would be consistent with a US recession, while the combination of a strong service sector and a depressed manufacturing sector is consistent with our baseline 2015/16 roadmap. This roadmap leads to an eventual rebound in the manufacturing index. Second, the ISM Manufacturing PMI rose a tad in October, but the New Export Orders component jumped significantly from 41 to 50.4 (Chart 5, panel 2). Since the global slowdown began as a non-US phenomenon, a rebound in this export component sends a strong signal that we are at an inflection point. Finally, consumer confidence rose in October following a sharp decline in September. A year-over-year decline in the consumer confidence index is a reasonably strong recession signal, but recent data suggest that this signal is fading (Chart 5, bottom panel). Chart 4Modest Stimulus In China
Modest Stimulus In China
Modest Stimulus In China
Chart 5Three Positive Developments
Three Positive Developments
Three Positive Developments
All in all, the global growth data have turned more positive during the past month. US indicators, in particular, are no longer sending strong recessionary signals. A rebound in the CRB Raw Industrials index would give us more confidence in the durability of the recent rise in Treasury yields. Policy Uncertainty Uncertainty about the US/China trade conflict has eased considerably during the past few weeks, as the two sides appear to be working toward a “phase 1” deal that would prevent the imposition of new tariffs and roll back some that are already in place. Heightened uncertainty about the trade war played a large role in dragging bond yields lower in 2019. This becomes apparent when you notice that survey and sentiment (aka “soft”) data about the economic outlook have been significantly worse than the actual “hard” data on US economic activity.4 It is clear that negative sentiment about the trade war has held survey data and bond yields down, even as underlying US economic activity has been solid. Less bullish dollar sentiment supports a continued uptrend in Treasury yields. We see a continued easing of trade tensions as we head into the first half of next year. President Trump has an incentive to support the economy in an election year, given the historical record of incumbent presidents being re-elected when the economy is strong. However, if this strategy doesn’t work and Trump finds himself behind in the polls by the end of next summer, then he could decide that ramping up the trade war again is the best course of action. In other words, another spike in policy uncertainty in the second half of 2020 is possible if President Trump is trailing in the polls. The US Dollar Chart 6Dollar Sentiment Points To Higher Yields
Dollar Sentiment Points To Higher Yields
Dollar Sentiment Points To Higher Yields
The US dollar is important for the path of US Treasury yields because it signals whether US yields are decoupling from yields in the rest of the world. In other words, if the dollar appreciates significantly alongside rising Treasury yields, then we should view those yields as increasingly out of step with the rest of the world, and thus more likely to fall back down. So far, the dollar has been relatively flat as yields have risen and bullish sentiment toward the US dollar has declined significantly (Chart 6). Less bullish dollar sentiment supports a continued uptrend in Treasury yields. But if yields do in fact continue to rise, it will be important to watch the dollar’s reaction. The Output Gap Chart 7Wage Gains Hurting Margins, Not Raising Prices
Wage Gains Hurting Margins, Not Raising Prices
Wage Gains Hurting Margins, Not Raising Prices
Some sense of the output gap is important for forecasting bond yields. This is because the same amount of global growth will lead to more inflationary pressure and higher bond yields when the output gap is small than when it is large. The fact that the output gap is smaller now than it was in 2016 is probably the reason why the 10-year Treasury yield bottomed 10 bps above its 2016 trough this year, and why the average Treasury index yield bottomed 47 bps above its 2016 trough. We have found wage growth to be an excellent indicator of the output gap, and noted in a recent report that wage growth should continue to accelerate.5 In this vein, another crucial variable to monitor is labor compensation as a percent of national income (Chart 7). The rise in this series indicates that wage gains during the past few years have come at the expense of corporate profit margins, and have not been passed through to higher consumer prices. If this series proves to have a lot more cyclical upside, then it could be some time before wage acceleration translates to higher inflation. Sentiment Chart 8Surprise Index Says Sentiment Is Neutral
Surprise Index Says Sentiment Is Neutral
Surprise Index Says Sentiment Is Neutral
The final factor we consider when forecasting US Treasury yields is sentiment. We have found that the Economic Surprise Index is the single best measure of aggregate market sentiment. That is, when the Surprise index reaches a positive or negative extreme, it usually means that sentiment is too positive or too negative, and will mean-revert in the months ahead. Also, we have observed a strong correlation between the Surprise index and changes in Treasury yields (Chart 8). At present, the Surprise index is roughly neutral, and therefore does not send a strong signal about where sentiment might push bond yields during the next few months. Investment Conclusions To summarize, the outlook from our five macro factors suggests that Treasury yields will rise further in the coming months. Global growth indicators are showing tentative signs of bottoming, and should rise to levels more consistent with the “hard” economic data as policy uncertainty continues to wane. The fact that the US economic data look less recessionary than they did one month ago makes us more confident that our global indicators will rebound. Chart 9A Clear Path To 2.5%
A Clear Path To 2.5%
A Clear Path To 2.5%
We would become concerned about a renewed downtick in yields if the CRB Raw Industrials index fails to rebound, or if the dollar strengthens significantly in the coming weeks. At the beginning of this report, we asked how high Treasury yields can go if the global growth rebound proves durable. To answer that question we refer to current estimates of the long-run neutral fed funds rate. The FOMC’s median estimate of the long-run neutral fed funds rate is 2.5% and the median estimate from the New York Fed’s Survey of Market Participants is 2.48%, with an interquartile range of 2.25% - 2.5%. If recessionary fears move to the back burner, it would be logical for long-dated yields to converge toward those levels. That is in fact what happened in recent years, with the 5-year/5-year forward Treasury yield peaking several times at levels close to the Fed’s median neutral rate estimate (Chart 9). With this in mind, we see a clear path to 2.5% on the 5-year/5-year forward Treasury yield, with the 10-year yield reaching similar levels since the 5/10 Treasury slope is likely to remain flat (Chart 9, bottom panel). For yields to eventually move above 2.5%, the market would have to re-consider its outlook for the long-run neutral fed funds rate. We discussed what factors to monitor in this regard in a recent report.6 Bottom Line: Treasury yields have moved significantly higher in recent weeks, but a survey of the five factors that determine the path for Treasury yields suggests that further upside is likely. We see a clear path to 2.5% for long-maturity Treasury yields as recessionary risk moves to the back burner in the coming months. Checking In On The Credit Cycle In previous reports, we mentioned that three factors drive our view of corporate bond spreads and the credit cycle: Balance sheet health Monetary conditions Valuation We last presented a detailed examination of these factors in a report from mid-September, concluding that accommodative monetary conditions will support corporate bond excess returns, despite deteriorating balance sheet health.7 Three factors drive our view of corporate bond spreads and the credit cycle: Balance sheet health, monetary conditions,and valuation. But since then, C&I lending standards – an important indicator of monetary conditions – moved into “net tightening” territory for the third quarter of 2019 (Chart 10). Tightening C&I lending standards, if they persist, would put significant upward pressure on corporate defaults and credit spreads. Chart 10Credit Cycle Checklist: Monetary Conditions
Credit Cycle Checklist: Monetary Conditions
Credit Cycle Checklist: Monetary Conditions
While the recent move in lending standards is concerning, we expect it to reverse in the near future. The yield curve, another indicator of monetary conditions, has steepened in recent months, suggesting that conditions are becoming more accommodative. Also, loan officers reported that the terms on C&I loans continued to ease in Q3, even as overall standards tightened (Chart 10, panel 3). Most importantly, inflation expectations remain extremely low (Chart 10, bottom panel). This gives the Fed every incentive to maintain accommodative monetary conditions. This should give lenders the confidence to ease lending standards, leading to tight credit spreads and a low corporate default rate. Bottom Line: C&I lending standards tightened on net in the third quarter of 2019. But other indicators of monetary conditions point to continued accommodation. We expect lending standards will soon move back into “net easing” territory. Remain overweight Spread Product versus Treasuries. Downgrade Investment Grade Corporates To Neutral Last week, we downgraded our recommended allocation to investment grade corporate bonds from overweight to neutral.8 We maintain a positive view of the credit cycle, and expect that corporate bonds will continue to outperform Treasuries. However, investment grade corporate spreads no longer provide adequate compensation for their level of risk. We maintain an overweight allocation to high-yield corporates, where spreads remain attractive. Chart 11 shows that investment grade corporate spreads have tightened somewhat in recent months, but that they remain well above the tights seen in early 2018. However, the chart also shows that average index duration has increased considerably this year. All else equal, higher index duration justifies a wider spread. In contrast, notice that high-yield index duration fell this year (Chart 11, bottom panel). This is because high-yield bonds usually carry embedded call options, making them negatively convex. All else equal, lower index duration makes the spread offered by the high-yield index more attractive. Because changes in spread and duration are both important, we prefer to use the 12-month breakeven spread as our main valuation tool. This measure is the spread widening required on a 12-month investment horizon to underperform a duration-matched position in Treasuries. It can be approximated by dividing the option-adjusted spread by duration. Chart 12 shows investment grade 12-month breakeven spreads as a percentile rank since 1995. The overall message is that spreads have rarely been lower. Chart 11Higher Durations Makes IG Spreads Look Too Tight
Higher Durations Makes IG Spreads Look Too Tight
Higher Durations Makes IG Spreads Look Too Tight
Chart 12Investment Grade Corporate Spreads Have Rarely Been Lower
Investment Grade Corporate Spreads Have Rarely Been Lower
Investment Grade Corporate Spreads Have Rarely Been Lower
Finally, we can also recognize that spreads tend to be tight in the middle and late stages of the credit cycle. In the current environment, that means we should expect spreads to be near the bottom of their historical ranges. To control for this fact, we re-calculate our breakeven spread percentile ranks using only mid-cycle periods when the slope of the yield curve is between 0 bps and 50 bps. We can then back-out spread targets for each credit tier based on the median 12-month breakeven spreads seen in similar macro environments. Chart 13 shows that spreads for all investment grade credit tiers have moved below our targets. High-yield spreads are not shown, but they remain well above target levels.9 Chart 13Spreads For All IG Credit Tiers Are Below Target
Spreads For All IG Credit Tiers Are Below Target
Spreads For All IG Credit Tiers Are Below Target
In place of investment grade corporates, which have become expensive, we recommend upgrading Agency MBS. MBS now offer expected returns that are comparable with corporate bonds rated A or higher, with considerably less risk.10 Bottom Line: Investment grade corporate bond spreads for all credit tiers are now below our fair value targets. We recommend only a neutral allocation to the sector. Investors should prefer high-yield bonds, where spreads are more attractive, and Agency MBS, which offer competitive expected returns and much less risk. Ryan Swift US Bond Strategist rswift@bcaresearch.com Footnotes 1 Please see US Bond Strategy Weekly Report, “Bond Kitchen”, dated April 9, 2019, available at usbs.bcaresearch.com 2 For details on why the ratio between the CRB Raw Industrials index and Gold tracks the 10-year Treasury yield please see US Bond Strategy Portfolio Allocation Summary, “The Sequence Of Reflation”, dated March 5, 2019, available at usbs.bcaresearch.com 3 Please see China Investment Strategy Special Report, “The Data Lab: Testing The Predictability Of China’s Business Cycle”, dated November 30, 2017, available at cis.bcaresearch.com 4 For more details on the divergence between “soft” and “hard” data please see US Bond Strategy Weekly Report, “Crisis Of Confidence”, dated October 22, 2019, available at usbs.bcaresearch.com 5 Please see US Bond Strategy Weekly Report, “Position For Modest Curve Steepening”, dated October 29, 2019, available at usbs.bcaresearch.com 6 Please see US Bond Strategy Weekly Report, “Position For Modest Curve Steepening”, dated October 29, 2019, available at usbs.bcaresearch.com 7 Please see US Bond Strategy Weekly Report, “Corporate Bond Investors Should Not Fight The Fed”, dated September 17, 2019, available at usbs.bcaresearch.com 8 Please see US Bond Strategy Portfolio Allocation Summary, “The Fed Will Stay Supportive”, dated November 5, 2019, available at usbs.bcaresearch.com 9 For details on how we calculate our spread targets please see US Bond Strategy Weekly Report, “The Value In Corporate Bonds”, dated February 19, 2019, available at usbs.bcaresearch.com 10 For more details on the positive outlook for MBS please see US Bond Strategy Weekly Report, “Two Themes And Two Trades”, dated October 1, 2019, available at usbs.bcaresearch.com Fixed Income Sector Performance Recommended Portfolio Specification
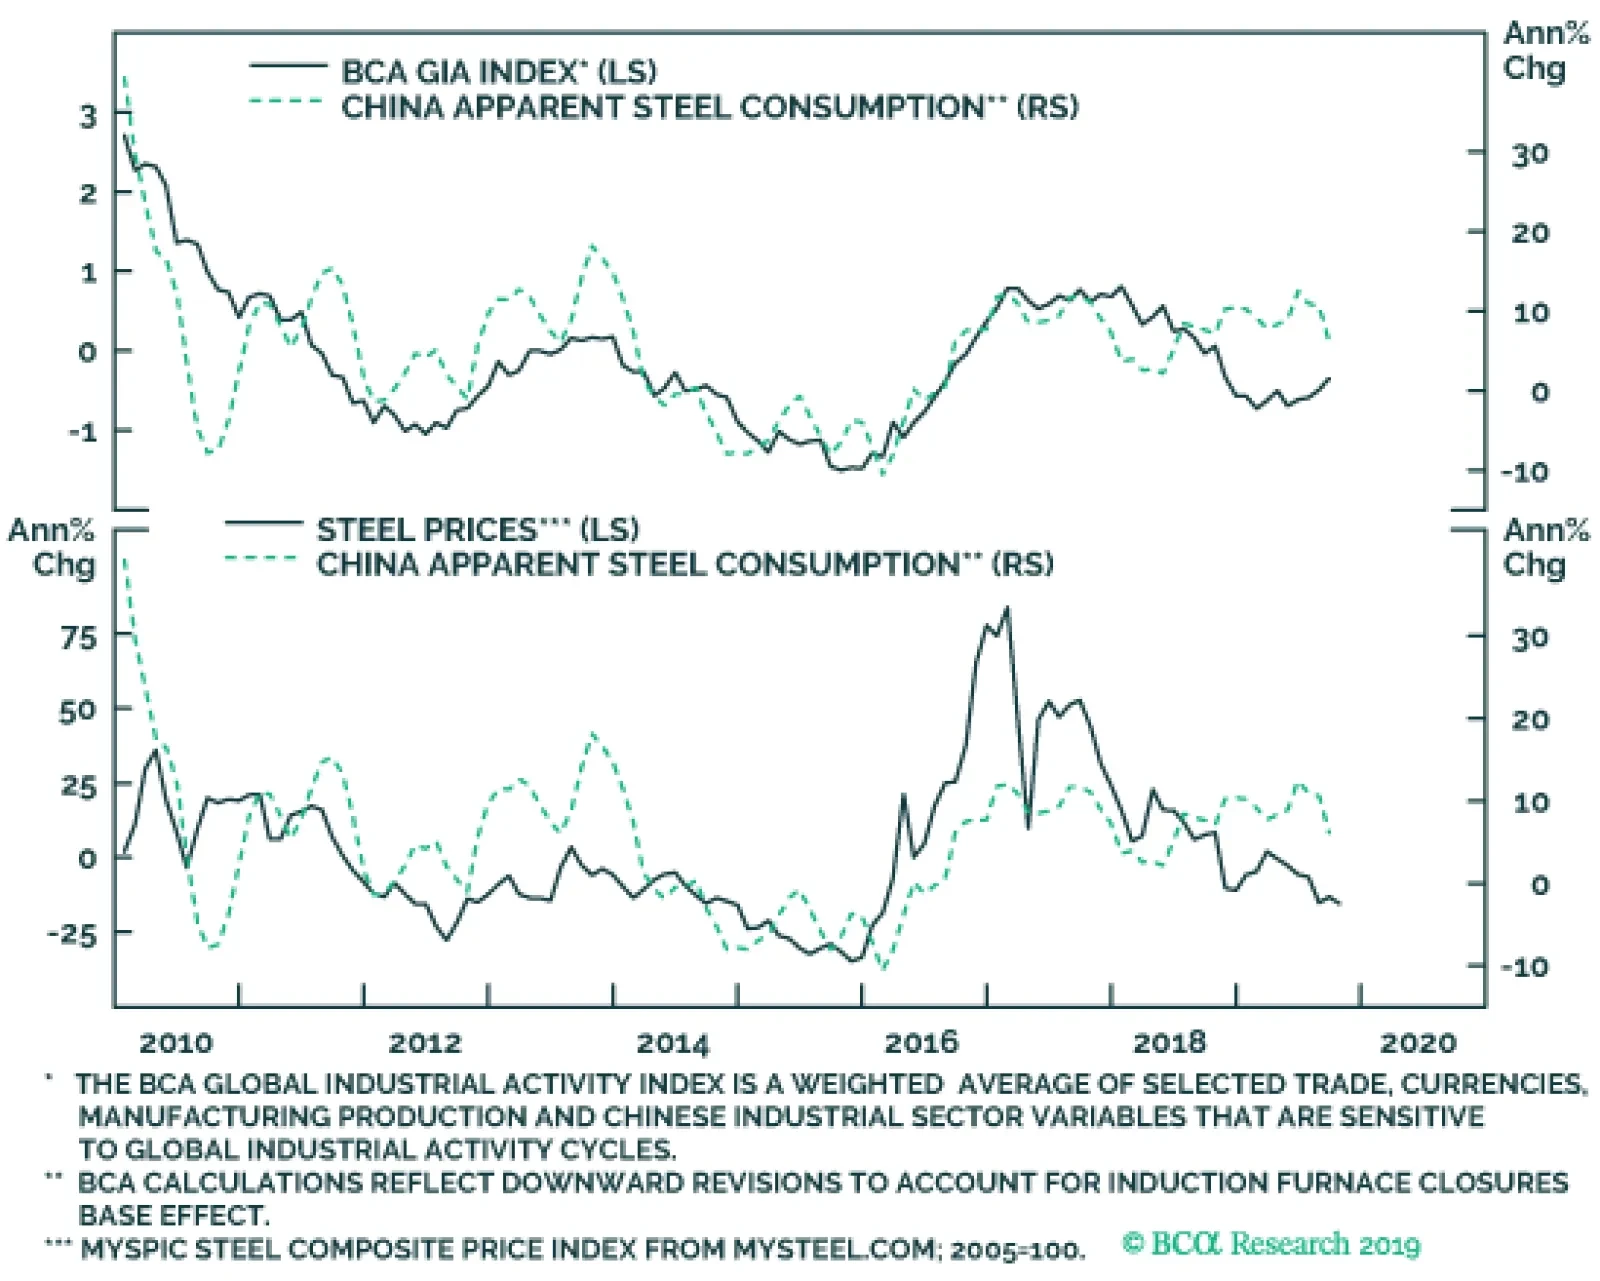
China’s steel industry is critically important to the global economy, and a key barometer of industrial activity worldwide. China’s apparent steel demand held up fairly well during the manufacturing slowdown, but it now appears to be stalling. Moreover,…
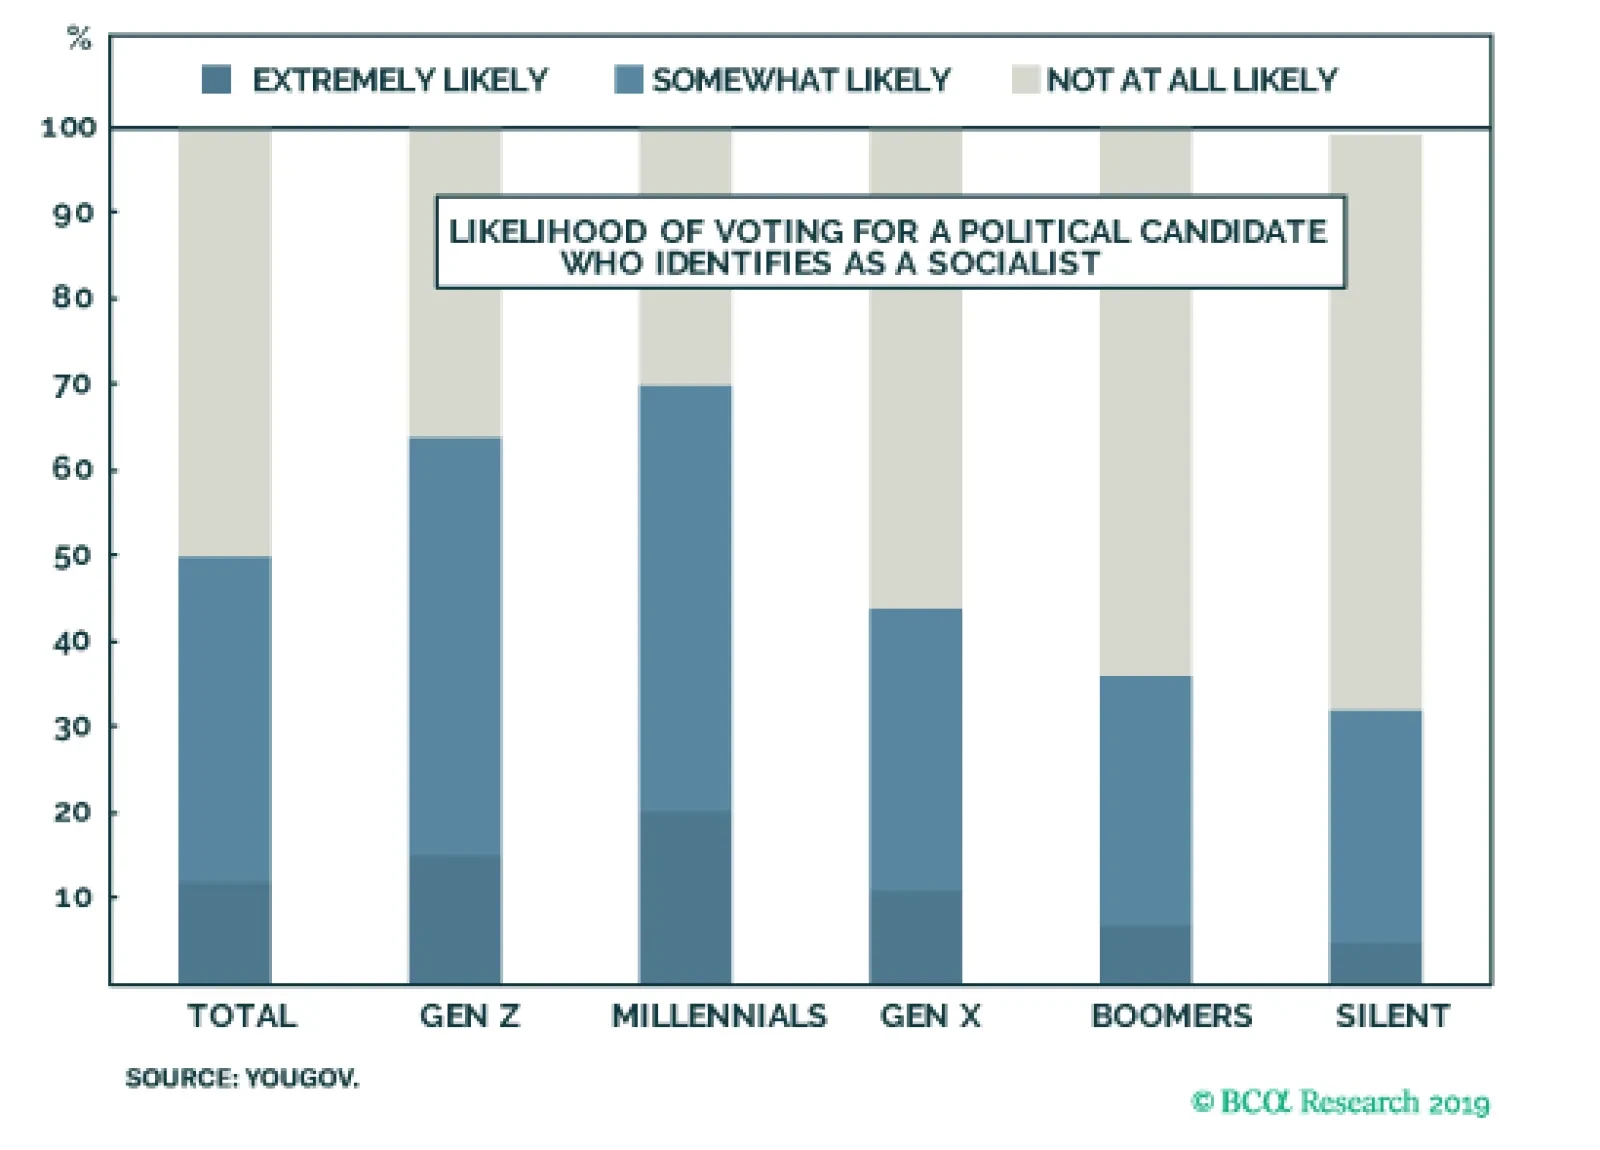
Today’s youth has become increasingly enamored with socialism. According to a recent YouGov poll, 70% of Millennials would be somewhat or extremely likely to vote for a socialist candidate. More than one-third of Millennials view communism favorably, while…
Political forces, rather than economic logic, explain why some countries fail to take the necessary steps to solve what should be an elementary problem: increasing demand. In particular, demand-side secular stagnation is likely to be a bigger threat in…
Highlights Maintaining an adequate level of aggregate demand has proven to be one of the biggest macroeconomic challenges of the modern era. Yet, in principle, it should not be difficult to increase demand. After all, people like to consume. If households are not spending enough, governments can just give them money or increase spending directly on public infrastructure and other worthwhile endeavors. Various explanations have been proposed for why these solutions either won’t work or are bad ideas even if they do work. These include Ricardian Equivalence-type arguments; claims that periods of high unemployment may be necessary to cleanse financial and economic imbalances; and concerns about excessive levels of government debt. None of these explanations are particularly persuasive, which suggests that politics, rather than economics, may be at the heart of the demand-side secular stagnation problem. Bondholders benefit from low inflation, which has often led them to oppose meaningful fiscal stimulus. Looking out, the influence of bondholders is likely to wane as populism proliferates. Investors should favor “real assets” such as equities, real estate, and commodities over “nominal assets” such as bonds and cash. A Rather Peculiar Problem Some problems are hard to solve. Curing cancer is hard. Reconciling quantum mechanics with general relativity is hard. But why should getting people to spend more be so difficult? After all, people like to consume. It is getting them to save that should be challenging. And yet, the most pressing macroeconomic problem in many countries over the past decade (and much longer in Japan) has been generating enough spending to achieve full employment, which is a precondition for allowing central banks to move away from extreme measures such as quantitative easing and negative rates. It would be one thing if secular stagnation were primarily a problem of inadequate supply. Increasing supply is difficult. While some economists such as Robert Gordon have focused on the poor prospects for potential GDP growth in developed economies (sluggish productivity and labor force growth being among the key culprits), the Larry Summers characterization of secular stagnation is first and foremost about inadequate demand. If people are not spending enough, why can’t the government simply increase transfers to households or spend money directly on public infrastructure, scientific exploration, or other worthwhile endeavors? Three arguments have been advanced as to why this strategy either will not work or is a bad idea even if it does work: 1) Ricardian Equivalence-type theories claiming that the private sector will increase savings by enough to counter larger budget deficits, thus leaving overall demand unchanged; 2) claims that periods of high unemployment are both necessary and desirable for shifting resources to more productive uses; and 3) concerns that higher government debt levels stemming from larger budget deficits will impose long-term costs that swamp the short-term growth benefits of fiscal stimulus. As we discuss below, none of these arguments are particularly persuasive. This suggests that politics, rather than economics, explains why there has been so much reluctance towards fiscal easing. Ricardian Equivalence Ricardian Equivalence stipulates that the lifetime present value of after-tax income determines household consumption. This implies that if a government issues each person a check for $1 million, everybody will just save the money in anticipation of higher taxes down the road. If that sounds a tad implausible, this is because the theory assumes, among other things, that everyone is perfectly rational, can borrow as much as they want, and lives forever (or at least values their heirs’ or beneficiaries’ welfare as much as their own). The theory is even less convincing when applied to government spending. Only in the extreme scenario where the government permanently increases spending would rational, infinitely-lived households cut their spending by exactly enough to offset the rise in government expenditures. If the increase in government spending were perceived to be temporary, aggregate demand would still rise, even if everyone is completely rational. To see this, consider a case where the government increases spending by $1 billion per year for three years. The “rational” response would be for households to cut their own expenditures by the annual carrying cost of the additional $3 billion in debt. Assuming an interest rate of 2%, this would amount to a reduction in annual consumption of about $60 million, leaving a net annual fiscal boost of $940 billion. The example above almost certainly overstates the negative impact on consumption in situations where the economy is operating below potential. This is because raising government spending in a depressed economy will boost output, thus increasing the present value of lifetime incomes. The expectation of higher income will lift consumption. The bottom line is that Ricardian Equivalence applies only in a very narrow range of circumstances, none of which are relevant in the real world. Indeed, as Box 1 discusses, the empirical evidence clearly suggests that fiscal multipliers are positive, especially in economies grappling with high unemployment. The Urge To Purge One popular view, often associated with the Austrian School of economics, is that recessions cleanse the economy and the financial system of excesses, paving the way for faster growth. The main problem with this view is that it assumes that resources will only shift to more worthwhile uses if many people are unemployed. In practice, this is not the case. In any given month, about five million US workers will either quit or lose their job, while a slightly higher number will find new work (Chart 1). Chart 1Labor Market Churn Tends To Increase As Unemployment Falls
Labor Market Churn Tends To Increase As Unemployment Falls
Labor Market Churn Tends To Increase As Unemployment Falls
Chart 2Residential Construction Accounted For Only 20% Of The Job Losses During The Great Recession
Secular Stagnation: The Easiest Problem In The World?
Secular Stagnation: The Easiest Problem In The World?
The small difference between gross inflows and outflows is the net change in employment. This is the number investors focus on every month when the payroll report is released; it is usually less than 5% of gross flows. Strikingly, gross separations usually rise when the unemployment rate falls, implying that labor market churn increases when the economy strengthens. This occurs because more people tend to quit their jobs when the labor market is tight and job openings are plentiful. The pro-cyclicality of the quits rate dominates the counter-cyclicality of the discharge rate. The Great Recession demonstrated that most of the job losses during severe downturns are gratuitous in the sense that they impose needless suffering on workers without making the economy more productive. Chart 2 shows that only 20% of US job losses between 2007 and 2009 took place in the residential building sector and related financial activities where excesses were plainly evident. The rest of the losses were in parts of the economy that had little to do with the housing bubble. Too Much Debt? Opponents of loose fiscal policy often point to rising government debt levels as an unwelcome side effect of larger budget deficits. Worries about high debt levels are certainly justified for countries that do not print their own currencies. When a country lacks a buyer of last resort for its debt, a self-fulfilling crisis can develop where rising bond yields make it more difficult for the government to service its obligations, leading to even higher bond yields (Chart 3). Chart 3Multiple Equilibria In Debt Markets Are Possible Without A Lender Of Last Resort
Secular Stagnation: The Easiest Problem In The World?
Secular Stagnation: The Easiest Problem In The World?
In contrast, central banks in countries that are able to issue debt in their own currencies can always purchase their own government’s bonds with newly issued cash. They can also set short-term interest rates at whatever level they want, thus ensuring that the government has a reliable source of financing. The “golden rule” for debt sustainability says that a country’s debt-to-GDP ratio will stabilize as long as the interest rate the government pays on its debt is less than the growth rate of the economy. This is true regardless of how big a primary budget deficit the government runs (Chart 4).1 Chart 4Debt Dynamics When r Is Less Than g
Secular Stagnation: The Easiest Problem In The World?
Secular Stagnation: The Easiest Problem In The World?
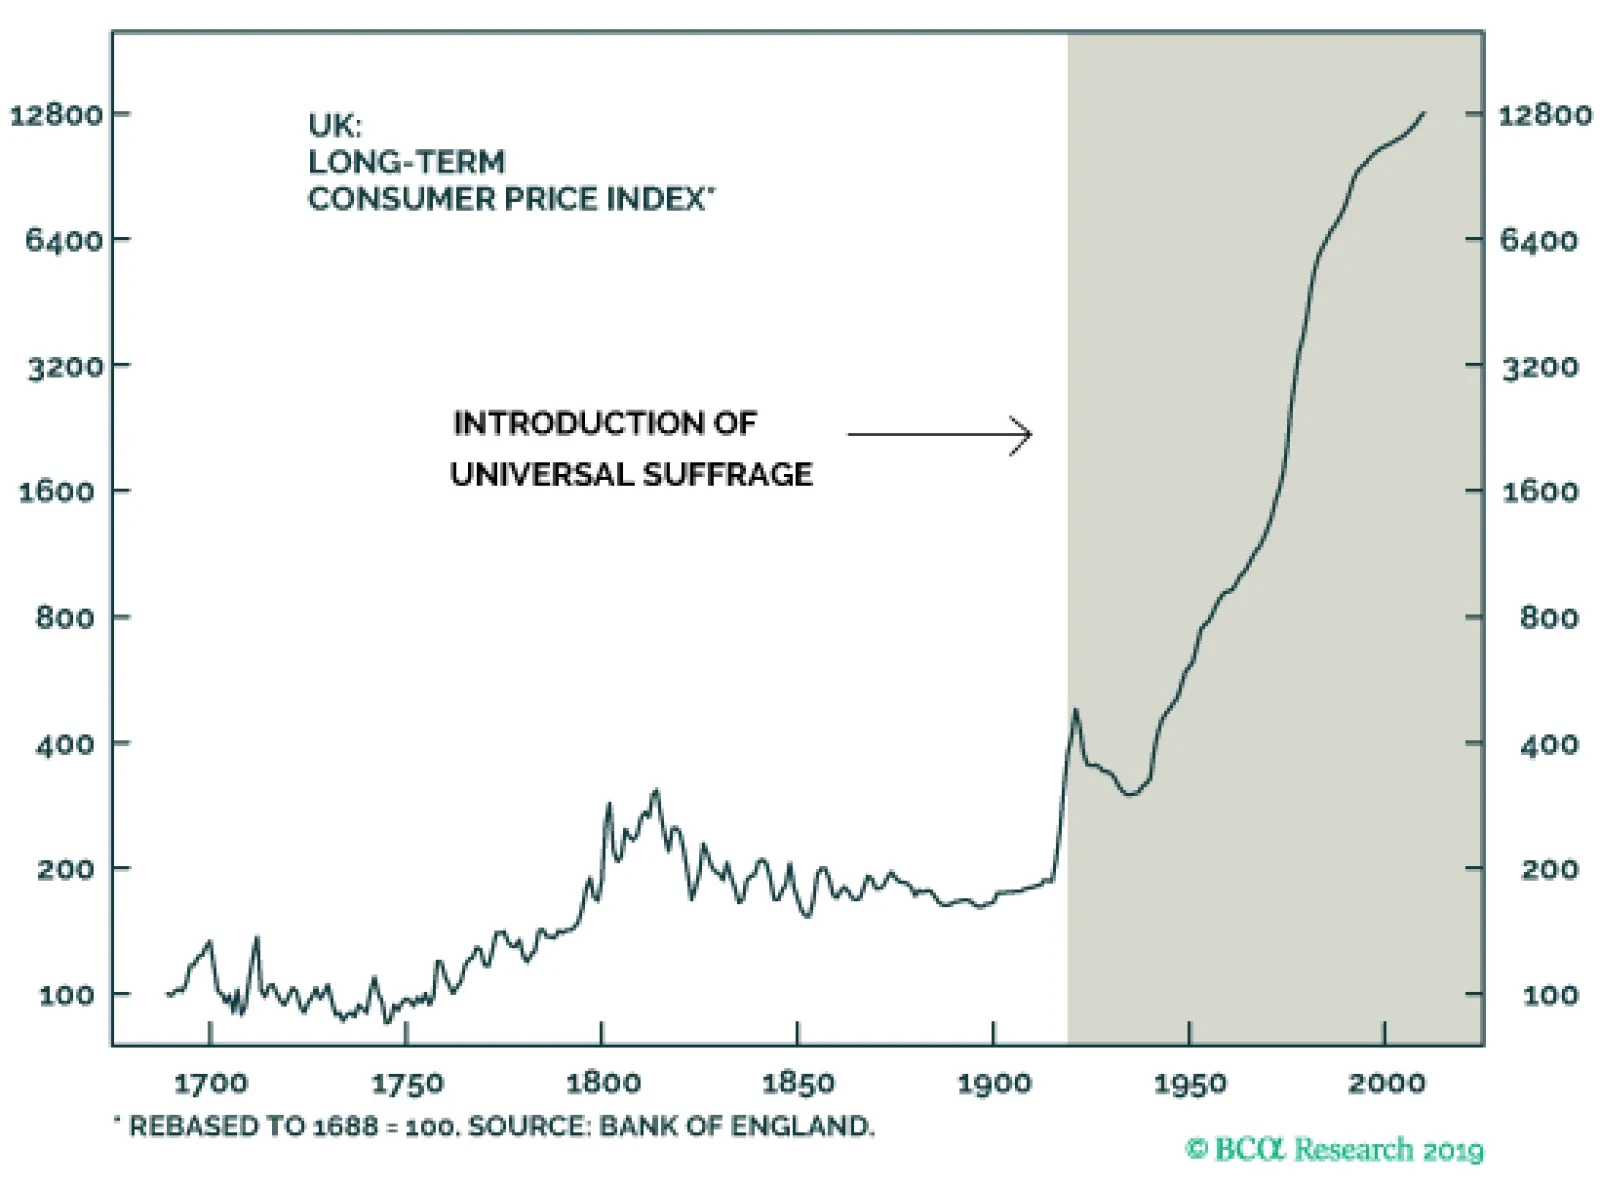
In fact, the higher the debt-to-GDP ratio is, the larger the sustainable level of the budget deficit that the government can achieve. For example, if nominal GDP growth is 4% and the target debt-to-GDP ratio is 50%, the government can run a budget deficit of 2% of GDP in perpetuity; in contrast, if the target debt-to-GDP ratio is 250%, the government can run a budget deficit of 10% of GDP. The catch is that this magic only works if the interest rate stays below the growth rate of the economy. When there is a lot of spare capacity, this is not a major issue since interest rates can be kept low without the worry that inflation will accelerate. Things get trickier once the economy reaches full employment. At that point, if the budget deficit remains high, inflation could rise as aggregate demand begins to outstrip the economy’s productive capacity. This may cause the central bank to raise interest rates, which could be a vexing problem for a highly indebted government. One might argue that the government could preempt the central bank from having to raise rates simply by tightening fiscal policy once the economy begins to overheat. In many cases, this would indeed be the correct response. However, there may be some occasions where tightening fiscal policy is politically impossible. In such cases, the preferred political response may be to allow inflation to rise. Higher inflation would push up nominal income, thus putting downward pressure on the debt-to-GDP ratio. Once the real value of the debt has been inflated away, the central bank could raise rates in order to cool the economy. Would such an inflationary strategy be preferable to not running a large budget deficit to begin with? It depends on who you ask! If you ask bondholders, they would certainly say no. If anything, bondholders might prefer a deflationary environment since falling prices would increase the purchasing power of their bonds. In contrast, workers and businesses may prefer more stimulus. For them, higher inflation down the road is a price worth paying if it means continued low unemployment and rising profits. How do these competing interests balance out? In most cases, the economy would be better off following the bigger budget deficit/higher inflation strategy. This is partly because deflation is generally a greater risk to the financial system and the broader economy than inflation. It is also because the capital stock is likely to grow more quickly in an economy that is able to stay close to full employment than one that suffers from deficient demand (firms generally invest more when unemployment is low). Hence, not only can fiscal stimulus provide short-term support to employment and consumption during the period when demand is depressed, it can even generate longer-term gains in the form of higher labor productivity and lower structural unemployment compared to what would have happened in the absence of any fiscal easing. The Political Economy Of Debt And Inflation The discussion above suggests that political forces, rather than economic logic, explain why some countries fail to take the necessary steps to solve what should be an elementary problem: increasing demand. In particular, demand-side secular stagnation is likely to be a bigger threat in countries where the preferences of bondholders and others who benefit from very low inflation hold sway. The appreciation of this fact helps explain some key developments in economic history, while shedding light on what the future may hold. Chart 5Universal Suffrage Made Inflation Politically More Palatable Than Deflation
Universal Suffrage Made Inflation Politically More Palatable Than Deflation
Universal Suffrage Made Inflation Politically More Palatable Than Deflation
The introduction of universal suffrage in the first few decades of the twentieth century made inflation politically more palatable (Chart 5). A poor farmer did not need to worry quite as much about losing his land to the bank, since he could vote for someone who would ensure that crop prices increased rather than decreased. In William Jennings Bryan's colorful words, the rich and powerful would no longer “crucify mankind upon a cross of gold." Today, populism is on the rise again. Whether it is rightwing populism or leftwing populism, the result is usually the same: bigger budget deficits and higher inflation. Retirees may not welcome higher inflation, but given the choice between rising prices and cuts to pensions and health care programs, they are likely to opt for the former. For their part, today’s youth has become increasingly enamored with socialism. According to a recent YouGov poll, 70% of Millennials would be somewhat or extremely likely to vote for a socialist candidate (Chart 6). More than one-third of Millennials view communism favorably, while about 20% think the Communist Manifesto “better guarantees freedom and equality” than the Declaration of Independence. No wonder the Democrats are talking about introducing Universal Basic Income, Medicare For All, and a Green New Deal. Chart 6Woke Millennials Cozying Up To Socialism
Secular Stagnation: The Easiest Problem In The World?
Secular Stagnation: The Easiest Problem In The World?
Contrary to conventional wisdom, an individual’s political attitudes are fairly stable over their lifespan.2 This suggests that the average political orientation of US voters will continue to move leftward as older voters pass away. Meanwhile, globalization – a historically deflationary force – has peaked (Chart 7). And despite all the hype about game-changing technological innovation, productivity growth in advanced economies continues to underwhelm (Chart 8). Chart 7Globalization Has Peaked
Globalization Has Peaked
Globalization Has Peaked
In a world of excess savings, inflation could be held at bay. However, the ratio of workers-to-consumers has now begun to decline as ever more baby boomers leave the labor force (Chart 9). As more people stop working, aggregate savings will fall. The shortage of savings will put upward pressure on the neutral rate. If central banks drag their feet in raising policy rates in response to an increase in the neutral rate, monetary policy will end up being too stimulative. As economies overheat, inflation will pick up. Chart 8Productivity Growth In Advanced Economies Has Decelerated Materially
Productivity Growth In Advanced Economies Has Decelerated Materially
Productivity Growth In Advanced Economies Has Decelerated Materially
Chart 9The Worker-To-Consumer Ratio Has Peaked Globally
The Worker-To-Consumer Ratio Has Peaked Globally
The Worker-To-Consumer Ratio Has Peaked Globally
Investment Conclusions Few people are worried about rising inflation these days, as evidenced by the weakness in long-term market-based inflation expectations (Chart 10). For now, most of our leading inflation indicators remain contained (Chart 11). However, we suspect this will change in the next few years as the unemployment rate – which is already at a generational low in the G7 – continues to fall (Chart 12). Chart 10Long-Term Inflation Expectations Are Muted
Long-Term Inflation Expectations Are Muted
Long-Term Inflation Expectations Are Muted
Chart 11An Inflation Breakout Is Not Imminent
An Inflation Breakout Is Not Imminent
An Inflation Breakout Is Not Imminent
Chart 12Falling Unemployment Rate Across Developed Markets
Falling Unemployment Rate Across Developed Markets
Falling Unemployment Rate Across Developed Markets
Chart 13Prices And Wages In Japan Have Been Rising Since 2014... Albeit At A Sluggish Pace
Prices And Wages In Japan Have Been Rising Since 2014... Albeit At A Sluggish Pace
Prices And Wages In Japan Have Been Rising Since 2014... Albeit At A Sluggish Pace
Chart 14Japan: Labor Market Tightening May Eventually Spur Higher Inflation
Japan: Labor Market Tightening May Eventually Spur Higher Inflation
Japan: Labor Market Tightening May Eventually Spur Higher Inflation
As we discussed two weeks ago in our analysis of whether negative rates will spread out across the world, both the theoretical and empirical evidence suggest that the Phillips curve is kinked.3 This means that a decline in the unemployment rate may not have a significant effect on inflation until unemployment reaches a threshold that is low enough to trigger a price-wage spiral. The US will probably be the first major economy to reach the kink, but others will follow. This includes the mother of all recent deflationary economies: Japan. Chart 13 shows that Japanese prices are rising again, albeit still at a slower pace than the BoJ’s target. Japanese inflation will accelerate if the labor market continues to tighten. Already, the ratio of job openings-to-applicants is near a 45-year high (Chart 14). All this suggests that investors should favor “real assets” such as equities, real estate, and commodities over “nominal assets” such as bonds and cash. To the extent that investors need to maintain exposure to fixed income, we would recommend a short-duration stance and above-benchmark exposure to inflation-linked securities. Box 1 Fiscal Multipliers: How Large?
Secular Stagnation: The Easiest Problem In The World?
Secular Stagnation: The Easiest Problem In The World?
Peter Berezin Chief Global Strategist peterb@bcaresearch.com Footnotes 1Please see Global Investment Strategy Weekly Report, “Is There Really Too Much Government Debt In The World?” dated February 22, 2019, for a fuller discussion of this debt sustainability equation. 2Johnathan Peterson, Kevin Smith, and John Hibbing, “Do People Really Become More Conservative as They Age? ” The Journal of Politics, (2018). 3Please see Global Investment Strategy Special Report, “Is The Entire World Heading For Negative Rates?” dated October 25, 2019. Strategy & Market Trends MacroQuant Model And Current Subjective Scores
Secular Stagnation: The Easiest Problem In The World?
Secular Stagnation: The Easiest Problem In The World?
Strategic Recommendations Closed Trades
Highlights The slowdown in global industrial activity appears to have bottomed. This, along with an apparent shared desire for a ceasefire in the Sino-US trade war, points toward a measured recovery in manufacturing and global trade, which will contribute to higher iron-ore and steel demand beginning in 1H20. A trade-war ceasefire, should it endure, will reduce global economic uncertainty. Along with continued monetary accommodation from systematically important central banks, reduced economic uncertainty will boost global growth and industrial-commodity demand generally by allowing the USD to weaken. We expect Beijing policymakers to remain focused on keeping GDP growth above 6.0% p.a. To that end, we believe a boost in infrastructure spending next year is likely, which also will be bullish for steel demand. Given China’s growing share of global steel production, we expect price differentials for high-grade iron ore – most of which comes from Brazil – to widen as steel demand increases next year. Given this view, we are initiating a strategic iron-ore spread trade at tonight’s close: Getting long December 2020 high-grade (65% Fe) futures traded on the Singapore Exchange vs. short the benchmark-grade (62% Fe) December 2020 futures traded on the CME. We recommend a 20% stop-loss on this recommendation. Feature Iron ore and steel demand will get a lift from the rebound our proprietary Global Industrial Activity (GIA) index has been forecasting for the past few months (Chart of the Week). The GIA index is designed to pick up changes in Chinese industrial activity, given its outsized influence on world industrial output, and also makes use of trade data, FX rates, and global manufacturing data. The rebound we are expecting will get a fillip from an apparent shared desire for a ceasefire in the Sino-US trade war, which, based on media reports, is close to being agreed. Should this ceasefire prove to be durable, it would contribute to a lowering of global economic policy uncertainty (GEPU), which, as we have shown recently, has kept the USD well bid to the detriment of industrial-commodity demand.1 Chart of the WeekBCA GIA Index Pick-Up Points To Higher Global Steel Demand
BCA GIA Index Pick-Up Points To Higher Global Steel Demand
BCA GIA Index Pick-Up Points To Higher Global Steel Demand
While we do expect economic uncertainty to decline next year, it will remain elevated due to continued Sino-US trade tensions – even if a “phase-one” deal is agreed – ongoing hostilities in the Persian Gulf, and popular discontent with the political status quo globally. As global economic uncertainty fades, the USD broad trade-weighted index for goods (TWIBG) will fall, which will bolster EM GDP growth, and a recovery in global trade next year (Chart 2). If, as media reports suggest, this so-called “phase-one” agreement includes a relaxation – or complete removal – of tariffs by the US on Chinese imports, we would expect manufacturing activity to pick up as Chinese manufacturers spin-up capacity to meet demand. A reduction in tariffs also will lessen the deadweight loss they imposed on US households, which will support higher consumption.2 Chart 2Reduced Global Economic Uncertainty Bolsters Global Trade Volumes, EM GDP
Iron Ore, Steel Prices Set To Lift
Iron Ore, Steel Prices Set To Lift
That said, economic uncertainty still remains high. This uncertainty is destructive of demand and will remain a key risk factor in 2020. While we do expect economic uncertainty to decline next year, it will remain elevated due to continued Sino-US trade tensions – even if a “phase-one” deal is agreed – ongoing hostilities in the Persian Gulf, and popular discontent with the political status quo globally. China’s Steel Demand Holds Up In Trade War China accounts for more than half of global steel production and consumption, and the lion’s share of seaborne iron-ore consumption (Chart 3). This makes its steel industry critically important to the global economy, and a key barometer of industrial activity worldwide. With global industrial activity bottoming and moving higher, and the USD expected to weaken, we expect iron ore demand and steel production in China to move higher next year as domestic and global demand for steel rises. China’s apparent steel demand held up fairly well during the slowdown observed in manufacturing and in commodity demand growth globally, averaging 8% y/y growth ytd (Chart of the Week, bottom panel). It now appears to be stalling in the wake of the global manufacturing slowdown. In addition, Chinese credit stimulus remains weak, contrary to expectations. However, with global industrial activity bottoming and moving higher, and the USD expected to weaken, we expect iron ore demand and steel production in China to move higher next year as domestic and global demand for steel rises.3 Chart 3China Dominates Global Steel Production and Consumption
China Dominates Global Steel Production and Consumption
China Dominates Global Steel Production and Consumption
Chart 4Construction, Real Estate Strength Offset Lower Chinese Auto Production
Construction, Real Estate Strength Offset Lower Chinese Auto Production
Construction, Real Estate Strength Offset Lower Chinese Auto Production
Greater demand for steel by the construction and real estate sectors offset lower consumption by the automobile industry in China this year, as manufacturing and trade slowed globally (Chart 4). Overall, apparent demand is still growing (Chart 5), which will continue to support iron ore imports, even though domestic production of low-grade ore picked up as steelmakers’ margins tightened earlier in the year (Chart 6). Chart 5China"s Apparent Steel Demand Growth Holds Up During Industrial Slowdown
China"s Apparent Steel Demand Growth Holds Up During Industrial Slowdown
China"s Apparent Steel Demand Growth Holds Up During Industrial Slowdown
Chart 6China Iron Ore Imports Remain Stout
China Iron Ore Imports Remain Stout
China Iron Ore Imports Remain Stout
Chinese imports from Brazil have rebounded following the Brumadinho tailings dam collapse in January at Vale’s Córrego do Feijão iron ore mine, which killed close to 300 people. The collapse in margins from steel mills combined with outages to Brazil and Australia high-grade ore exports led to a rise in imports and domestic production of low-grade iron ore. High-Grade Iron Ore Favored; Policy Uncertainty Persists Our overall view for industrial commodities – iron ore, steel, base metals and crude oil – is constructive but not wildly bullish going into next year. Our oil view, for example, calls for a rally in the average price of crude oil next year of ~ 10% from current levels for Brent crude oil, the world benchmark. While we expect global monetary stimulus to offset much of the tightening of financial conditions brought on by the Fed’s rate hikes last year, and China’s de-leveraging campaign of 2017-18, elevated economic uncertainty will keep the USD better bid that it otherwise would be absent the Sino-US trade war and global economic policy uncertainty. This translates into weaker commodity demand, generally, as a strong USD raises local-currency costs for consumers and lowers local-currency production costs for producers. At the margin, both push commodity prices lower. On a relative basis, we expect the more efficient, less-polluting technology likely will be called on to meet higher steel demand – in China and globally – next year, which means higher-grade iron ore will be favored by Chinese steel mills as profitability improves. For iron ore and steel in particular, environmental considerations also are important, given the Chinese government's “Blue Skies Policy” aimed at reducing the country’s high levels of air pollution.4 This policy has led to the forced retirement of older, highly polluting steelmaking capacity, which has been replaced with newer, less-polluting technology that favors high-grade iron ore. However, the application of regulations designed to reduce pollution has been uneven, and still relies on local compliance, which has been spotty. We expect demand for high-grade ore will increase as global manufacturing and trade also recovers. On a relative basis, we expect the more efficient, less-polluting technology likely will be called on to meet higher steel demand – in China and globally – next year, which means higher-grade iron ore will be favored by Chinese steel mills as profitability improves. The restoration of high-grade exports from Brazil means this ore will be available. It is worthwhile noting that these steelmakers account for an increasing share of global capacity. For this reason, we expect demand for high-grade ore will increase as global manufacturing and trade also recovers (Chart 7). Given our view, at tonight’s close we will get long December 2020 high-grade iron-ore futures (65% Fe) traded on the Singapore Exchange vs. short benchmark-grade iron-ore futures (62% Fe) traded on the CME. Both are quoted in USD/MT and settle basis Chinese port-delivery (CFR) indexes in cash. Given the uncertain nature of the durability and depth of the ceasefire currently being negotiated by the US and China, we will keep a stop-loss on this position of 20%. Bottom Line: China’s steel demand has held up relatively well despite the global slowdown in manufacturing and trade. Given our expectation for a pick-up in global growth – in response to global monetary and fiscal stimulus and lower economic uncertainty in the wake of a ceasefire in the Sino-US trade war – we expect Chinese steel demand to resume growing. This will support iron ore prices, particularly for high-grade ores. On the back of this expectation, we are recommending an iron-ore spread trade, going long high-grade futures vs. short benchmark-grade iron ore futures. Chart 7High-Grade Iron Ore Should Outperform Strategically
High-Grade Iron Ore Should Outperform Strategically
High-Grade Iron Ore Should Outperform Strategically
Robert P. Ryan Chief Commodity & Energy Strategist rryan@bcaresearch.com Hugo Bélanger Senior Analyst Commodity & Energy Strategy HugoB@bcaresearch.com Market Round-Up Energy: Overweight. Bloomberg reported China is looking to invest between $5-$10 billion in the Saudi Aramco IPO through various vehicles. Such an investment would give China a deeper stake in the Kingdom’s oil industry, and a hedge to price shocks. In addition, it could open the way for deeper investment in the Saudi oil and petchems industries. For KSA, as we have argued in the past, a deepening of China’s investment and involvement in the Kingdom’s economy would diversify the states that have a vested interest in ensuring its safety.5 We will be updating our analysis of China’s pivot to the Middle East, and KSA’s pivot to Asia next week. Separately, we the last of our Brent backwardation trades – i.e., long December 2019 Brent vs. short December 2020 Brent – was closed last week with a gain of 110.8%. Base Metals: Neutral. Copper prices are up 6% vs. last month, supported by supply-side worries in Chile and, more recently, easing trade tensions. Cyclically, we believe copper prices are turning up – spurred by easy monetary conditions and fiscal stimulus directed at infrastructure and construction spending. Most of our key commodity-demand indicators have bottomed and are suggesting EM demand growth will move up. This supports a year-end base metal rally. Precious Metals: Neutral. A risk-on sentiment fueled by expectation the U.S. and China will sign a trade deal weighs on gold’s safe-haven demand. Prices fell 2% since last week. Additionally, U.S. 10-year bond yields shot higher – pushing gold prices lower – on Tuesday following a stronger-than-expect ISM services PMI data release. Gold-backed ETF holdings reached a new record in September at 2,855 MT (up 377 MT ytd), surpassing the December 2012 peak. A reversal in investors’ sentiment towards gold could send prices down. Ags/Softs: Underweight. The USDA reported that 52% of the U.S. corn has been harvested, a 13 percentage point increase relative to last week, yet the figure came shy of analysts’ expectation and far below the 2014-2018 average of 75%. On a weekly basis, corn prices are still down 2% due to drier weather forecast. Soybean harvest did better reaching 75%, and meeting expectations. Soybean price is almost unchanged on a weekly basis, despite having edged higher earlier in the week on the back of rising expectations the US and China will agree on a ceasefire in the ongoing trade war. Footnotes 1 We measure this uncertainty using the Baker-Bloom-Davis Global Economic Policy Uncertainty (GEPU) index. This is a GDP-weighted index of newspaper headlines containing a list of words related economic uncertainty. Newspapers from 20 countries representing almost 80% of global GDP are scoured for reports reflecting economic uncertainty. Please see our October 17 and October 31, 2019, reports Policy Uncertainty Lifts USD, Stifles Global Oil Demand Growth and Global Financial Conditions Support Higher Commodity Demand for the original research on this topic. Both are available at ces.bcaresearch.com. 2 We discuss deadweight losses to US households arising from the tariffs in Waiting To Get Long Copper, In China’s Steel Slipstream, published August 29, 2019. It is available at ces.bcaresearch.com. 3 BCA Research’s China Investment Strategy expects China’s business cycle likely will bottom in 1Q20 of next year, rather than in 4Q19. This aligns with our expectation. Please see China Macro And Market Review, published November 6, 2019. It is available at cis.bcaresearch.com. 4 We examined the implications of China’s “Blue Skies” policy in China's Anti-Pollution Resolve Critical To Iron Ore Markets, published April 4, 2019. It is available at ces.bcaresearch.com. 5 We discuss these issues in our Special Report entitled ضد الواسطة published November 16, 2018. The Arabic title of the report translates as "Against Wasta." Wasta means reciprocity in formal and informal dealings. Investment Views and Themes Recommendations Strategic Recommendations Tactical Trades TRADE RECOMMENDATION PERFORMANCE IN 2019 Q3
Iron Ore, Steel Prices Set To Lift
Iron Ore, Steel Prices Set To Lift
Commodity Prices and Plays Reference Table Trades Closed in 2019 Summary of Closed Trades
Iron Ore, Steel Prices Set To Lift
Iron Ore, Steel Prices Set To Lift
Highlights Global: Global growth momentum is bottoming out, leading indicators are improving, inflation is subdued, and central bankers are biased to maintain accommodative monetary policies. This is a bullish “sweet spot” for financial markets, suggesting further upside for global risk assets like equities and corporate credit, especially relative to government bonds. US: The overall US economy is weathering the storm from the global manufacturing slump, which is showing signs of bottoming out. Stay below-benchmark on US Treasury duration, with an initial yield target of 2.25% for the benchmark 10-year. Canada: The Bank of Canada is hinting that “insurance” rate cuts may be needed, but with the Canadian economy and inflation both remaining resilient, the central bank is more likely to keep rates steady until global growth improves. Stay neutral on Canadian government bonds, for now, but prepare to move to underweight in early 2020. Feature After knocking on the door several times in recent weeks, global equity markets are finally enjoying a true breakout. In the U.S., the S&P 500 is setting new all-time highs on a daily basis, while equities in Europe and emerging markets (EM) are also registering solid gains. There is no conflicting signal from global corporate credit markets where spreads remain stable, or from the volatility space with measures like the US VIX index hovering near the 2019 lows. Chart Of The WeekThings Are Looking Up
Things Are Looking Up
Things Are Looking Up
Despite this positive price action, many remain skeptical that this “risk rally” is sustainable. Just last week, a headline in the Financial Times declared that the “U.S. stock market’s new highs baffles investors”. We find that reluctance to accept the equity market strength to be even more baffling, as the current macro backdrop is a perfect “sweet spot” for risk assets to do well. Global economic momentum is bottoming out, with improving leading indicators suggesting better days lie ahead for growth. A majority of central banks worldwide have eased monetary policy over the past several months, providing a more supportive liquidity backdrop for financial markets. The world’s most important central bank, the Federal Reserve, has delivered a cumulative -75bps of rate cuts since July, helping to cool off the US dollar, which is now flat on a year-over-year basis in trade-weighted terms (Chart Of The Week). A softening dollar is also often a signal that global growth is improving, as it indicates a shift in capital flows into more economically-sensitive non-U.S. markets like Europe and EM. Thus, a weaker greenback combined with better global growth prospects should help lift global bond yields by raising depressed inflation expectations (middle panel). The “sweet spot” of accelerating growth and easy money will support the continued outperformance of global equities and credit over government bonds, in an environment of gently rising bond yields. Yet with policymakers worldwide still playing the stimulus game, fearful of persistent negative impacts on growth from the U.S.-China trade dispute and other political uncertainties, it will take a large and sustained increase in inflation expectations before there is any shift to a more hawkish global policy bias. This is critical for bond markets, as a much bigger move higher in global bond yields would require not just a pricing out of rate cut expectations, but the pricing in of future rate hikes. Such a repricing will not occur before there is clear evidence that global growth, broadly speaking, is accelerating for a sustained period and not just stabilizing in a few countries. The earliest we can envision such a hawkish shift for global monetary policy would be late in 2020, led by the Fed signaling a removal of some of the “insurance” rate cuts of 2019. Until that happens, the “sweet spot” of accelerating growth and easy money will support the continued outperformance of global equities and credit over government bonds, in an environment of gently rising bond yields. The Art Of Analyzing Economic Data At Turning Points Typically, at turning points in the global growth cycle, there are always data available to support the arguments of both optimists and pessimists. That is certainly the case today, where so-called “hard” economic data that is reported with a lag (i.e. exports, durable goods orders) remains weak, but leading indicators are starting to improve. For example, the global manufacturing PMI data for October released last week shows the following (Chart 2): strong pickup in China, with the Caixin manufacturing PMI now up to 51.7; slight improvement in the US ISM manufacturing index, which rose from 47.8 to 48.3 in the month but remains below the 50 boom/bust line; bounce in the U.K. Markit manufacturing PMI index, rising from 48.3 to 49.6; the slightest of increases in the overall euro area Markit manufacturing PMI, from 45.7 to 45.9, still below the 50 line but showing marginal improvement in the critical German PMI; Continued weakness in the Japanese Markit manufacturing PMI, which fell to 48.4. The relative message from the PMIs fits with the signals sent from the OECD leading economic indicators (LEI) for those same countries, with the China LEI strengthening the most and the LEIs in Europe and Japan still struggling. The US is a mixed bag, with the ISM ticking up but the LEI languishing. There is, however, a sign of optimism in the export sub-index of the ISM manufacturing data. That measure surged nine points in October from 41.0 to 50.4, signaling a potential bottoming of the overall ISM index within the next three months (Chart 3). While the ISM exports index is volatile, the modest improvement seen in the export order series from the China manufacturing PMI over the past few months (bottom panel) suggests that there may be a more significant improvement in global trade activity brewing – as signaled by the improvement in our global LEI index. Another possible explanation for the reduction in U.S. capital spending is slowing growth in corporate profits, which is related to a number of factors beyond the impact of tariffs and the trade war. Chart 2Global PMIs Are A Mixed Bag
Global PMIs Are A Mixed Bag
Global PMIs Are A Mixed Bag
Chart 3Momentum Turning For The Trade Warriors?
Momentum Turning For The Trade Warriors?
Momentum Turning For The Trade Warriors?
Bottom Line: Global growth momentum is bottoming out, leading indicators are improving, inflation is subdued, and central bankers are biased to maintain accommodative monetary policies. This is a bullish “sweet spot” for financial markets, suggesting further upside for global risk assets like equities and corporate credit, especially relative to government bonds. US Capital Spending Slowdown: Only A Cautious Pause Chart 4Rising Uncertainty? Or Just Slowing Profit Growth?
Rising Uncertainty? Or Just Slowing Profit Growth?
Rising Uncertainty? Or Just Slowing Profit Growth?
For growth pessimists in the US, a modest boost to “soft” data like the ISM does not allay their concerns about a broadening US economic slowdown. The trade war with China and the global manufacturing recession have had a clear negative impact on business confidence when looking at measures like the Conference Board CEO survey. At the same time, US capital spending has contracted in real terms during the 2nd and 3rd quarter of 2019. A logical inference would be to say that uncertainty over the trade war has led to a reduction in capex. Another possible explanation for the reduction in U.S. capital spending is slowing growth in corporate profits, which is related to a number of factors beyond the impact of tariffs and the trade war. Like the fading impact of the 2018 U.S. corporate tax cuts (that helped trigger a surge in after-tax earnings growth) and the squeeze on profit margins from higher labor costs. On a year-over-year basis, US profit growth has slowed from nearly 25% in 2018 to 1.8% in the 3rd quarter (a projection based on the 76% of S&P 500 companies that have already reported). The real non-residential investment spending category from the US GDP accounts has slowed alongside profits, from 6.8% to 1.3% on a year-over-year basis (Chart 4). At the same time, annual growth in US non-farm payrolls has slowed only modestly from 1.91% to 1.4%, with average hourly earnings growth falling from a 2019 peak of 3.4% to 3.0% in October. Given the tightness of the US labor market, with firms continuing to report difficulties in finding quality labor, it should come as no surprise that employment and wages have not slowed as much as capital spending, despite the sharp downturn in profit growth. Businesses that see their earnings getting squeezed will seek to protect profits by cutting back on investment and hiring activity. With a tight labor market, however, cutting capital spending is an easier and less costly decision than laying off workers, as it may be even harder to re-hire those employees if the economy starts to improve once again. With the US Treasury curve no longer inverted, after -75bps of Fed rate cuts and with longer-dated Treasury yields starting to increase, the US economy is stepping back from the recessionary abyss that worried investors during the summer. That can also be seen when breaking down the US non-residential investment data into its broad sub-components (Chart 5). On a contribution-to-growth basis, the only part of US investment spending that is outright contracting year-over-year is Structures. There is still modest positive annual growth in Equipment investment, although that did contract on a quarter-on-quarter basis in Q3/2019. The Intellectual Property Products category (which includes Software, in addition to Research & Development) continues to expand at a steady pace. Chart 5Slowing US Capex Focused On Structures
How Sweet It Is
How Sweet It Is
Chart 6The Fed Has Dis-Inverted The UST Curve
The Fed Has Dis-Inverted The UST Curve
The Fed Has Dis-Inverted The UST Curve
So similar to signals from global PMIs and LEIs, the U.S. capital spending and employment data are sending a mixed message about U.S. growth. Yes, capital spending has slowed but the bulk of the deceleration has come in the component where canceling or delaying investment plans is easiest – buildings and construction. It is not necessarily an indication that a deeper economic downturn is unfolding. Similar cutbacks in Structures investment, without a broader decline in overall capital spending, occurred in 2013 and 2015/16. During the past two U.S. recessions in 2001 and 2008, however, all categories of capital spending contracted. If we look at the breakdown of the contribution to US investment spending today, the backdrop looks more like those non-recessionary years. With the US Treasury curve no longer inverted, after -75bps of Fed rate cuts and with longer-dated Treasury yields starting to increase, the US economy is stepping back from the recessionary abyss that worried investors during the summer (Chart 6). The trade détente between the US and China will help boost depressed business confidence, especially with global growth already showing signs of bottoming out. This, along with a softer US dollar and some easing of wage pressures, will help put a floor underneath US corporate profit growth. Treasury yields have more upside from here, as markets are still priced for -25bps of Fed rate cuts over the next year that is unlikely to happen if the US economy rebounds, as we expect. Bottom Line: The overall US economy is weathering the storm from the global manufacturing slump, which is showing signs of bottoming out. Stay below-benchmark on US Treasury duration, with an initial yield target of 2.25% for the benchmark 10-year. The Bank Of Canada’s Newfound Caution Is Unwarranted Chart 7Canada Is A High-Beta Bond Market
Canada Is A High-Beta Bond Market
Canada Is A High-Beta Bond Market
The Bank of Canada (BoC) has been one of the few central banks to resist the shift towards easier global monetary policy in 2019. This has resulted in Canadian government bonds trading at relatively wide yield spreads to other countries in the developed world, even as global growth has slowed in 2019 (Chart 7). With global growth now set to improve over the next 6-12 months, Canada’s historic status as a “high yield beta” bond market during periods of rising global yields suggests that Canadian government bonds should underperform in 2020. However, in the press conference following last week’s policy meeting, BoC Governor Stephen Poloz noted that the BoC was “mindful that the resilience of Canada’s economy will be increasingly tested as trade conflicts and uncertainty persist.” Poloz even revealed that an “insurance” rate cut was discussed at the policy meeting, although the BoC Governing Council decided against it. This is similar language to that parroted by the more dovish global central bankers over the past several months, raising the risk that Canada could be a lower-beta bond market if the Canadian economy falters. That outcome seems unlikely, given the indications of improving growth momentum, occurring alongside tight labor markets and stable inflation: The RBC/Markit Canadian manufacturing PMI has climbed from a trough of 49 in May to 51 in October, indicating that real GDP growth accelerated in Q3 (Chart 8, top panel); The BoC’s Autumn 2019 Business Outlook Survey (BoS) showed that an increasing share of firms are reporting labor shortages, coinciding with a sharp pickup in the annual growth rate of average weekly earnings to just over 4% (middle panel); Core inflation measures remain right at the midpoint of the BoC’s 1-3% target range, although breakeven inflation rates from Canadian Real Return Bonds remain closer to the bottom end of that range (bottom panel); After a long period of adjustment, house prices and housing activity are showing some signs of recovery in response to easier financial conditions, rising household incomes and improved affordability (Chart 9); Chart 8Resilience In Canadian Growth & Inflation
Resilience In Canadian Growth & Inflation
Resilience In Canadian Growth & Inflation
Chart 9Canadian Housing Showing Improvement
Canadian Housing Showing Improvement
Canadian Housing Showing Improvement
Canadian investment spending is set to pick up, as the Autumn 2019 BoS reported a modest improvement in overall business sentiment and an increase in capital spending plans with a growing number of firms facing capacity pressures (Chart 10). Our bias is to downgrade Canadian government bonds to underweight heading into 2020, as we expect a return to their typical high-beta status during a period of accelerating global growth and rising bond yields. Chart 10Signs Of Life For Canadian Capex?
Signs Of Life For Canadian Capex?
Signs Of Life For Canadian Capex?
Looking forward, reduced U.S.-China trade tensions should provide a boost to Canadian capex. Firms that had previously held off in the past few months due to the slowdown in the economy, caused partially by worries over global trade, will start to invest again. The BoC’s updated forecasts in the latest Monetary Policy Report released last week showed that the central bank expects Canadian exports to resume their expansion in 2020 – despite Governor Poloz’s stated concerns over global growth. Oil and gas exports are expected to improve as pipeline and rail capacity gradually expand, while consumer goods excluding automobiles should remain strong. Improvement in Chinese economic activity would provide a meaningful lift to Canadian exports, as Chinese imports from Canada are still contracting at a double-digit rate (Chart 11). More importantly, Canadian exports to the country’s largest trade partner, the US, have already stabilized and should accelerate as the US economy gains momentum in the next 6-12 months. As Governor Poloz mentioned during the press conference, the BoC's decisions are not going to be directly influenced by political events such as Prime Minister Justin Trudeau’s recent re-election. Yet the odds of Canadian fiscal stimulus have shot up after Trudeau could only secure a minority government in the Canadian Parliament. Any fiscal stimulus is starting from a healthier place with the budget deficit currently at only -1% of GDP and the net government debt-to-GDP ratio falling towards a low 40% level (Chart 12). Expected fiscal stimulus will provide an incremental boost to Canadian growth in 2020. Chart 11The Global Trade Slump Has Hurt Canada
The Global Trade Slump Has Hurt Canada
The Global Trade Slump Has Hurt Canada
Chart 12Canada Can Afford A Fiscal Stimulus
Canada Can Afford A Fiscal Stimulus
Canada Can Afford A Fiscal Stimulus
Net-net, the Canadian economy appears to be in good shape, with momentum starting to improve. Inflation remains close to the BoC target, with rising pressures stemming from a tight labor market. This is not a backdrop that would be conducive to an “insurance” rate cut in December or even in early 2020. Only -18bps of rate cuts over the next twelve months are discounted in the Canadian Overnight Index Swap (OIS) curve. Yet there is only a 16% chance of a -25bp cut expected at the December 2019 meeting, according to Bloomberg. In other words, the markets are not taking the threat of a BoC rate cut seriously – a view that we agree with. Chart 13Stay Neutral On Canadian Government Bonds
Stay Neutral On Canadian Government Bonds
Stay Neutral On Canadian Government Bonds
We suspect that Governor Poloz’s comments about a potential BoC policy ease were more designed to take some steam out of the strengthening Canadian dollar (Chart 13), which was threatening a major breakout going into last week’s BoC meeting. We would be surprised if a rate cut was delivered at the December 2019 BoC meeting, but the dovish message sent last week does raise the possibility that the BoC could shock us. For now, we are choosing to stick with our neutral recommendation on Canadian government bonds, but we will re-evaluate after the December 4 BoC meeting. Our bias is to downgrade Canadian government bonds to underweight heading into 2020, as we expect a return to their typical high-beta status during a period of accelerating global growth and rising bond yields. Bottom Line: The Bank of Canada is hinting that “insurance” rate cuts may be needed, but with the Canadian economy and inflation both remaining resilient, the central bank is more likely to keep rates steady until global growth improves. Stay neutral on Canadian government bonds, for now, but prepare to move to underweight in early 2020. A Brief Follow Up To Our US MBS Versus IG Corporates Recommendation Chart 14Spread Targets Reached - Downgrade US IG To Neutral
Spread Targets Reached - Downgrade US IG To Neutral
Spread Targets Reached - Downgrade US IG To Neutral
In last week’s report, we made the case for raising allocations to US Agency MBS while reducing exposure to higher-quality US investment grade (IG) corporate credit.1 We implemented the trade in our model bond portfolio, lowering our recommended allocation to US IG and increasing the weighting to US Agency MBS. We now see a case for shifting to a formal strategic recommendation, upgrading US Agency MBS to overweight (a ranking of 4 out of 5 in the tables on page 14) and downgrading US IG to neutral (3 out of 5). The rationale for the shift is based on valuation. Our colleagues at BCA Research US Bond Strategy calculate spread targets for each credit tier within US IG (Aaa, Aa, A and Baa). The targets are determined using a methodology that ranks the option-adjusted spread (OAS) of the Bloomberg Barclays index for each credit tier relative to its history, while controlling for the “phase” of the economic cycle as determined by the slope of the US Treasury yield curve.2 The latest rally in IG has driven the OAS for all tiers below those targets, with the Baa tier looking less expensive than the others (Chart 14). As a result, we now advise only a neutral allocation to US IG corporates, with a preference for the Baa credit tier. Robert Robis, CFA Chief Fixed Income Strategist rrobis@bcaresearch.com Ray Park, CFA Research Analyst ray@bcaresearch.com Footnotes 1Please see BCA Research Global Fixed Income Strategy Weekly Report, “Big Mo(mentum) Is Turning Positive”, dated Oct 29, 2019, available at gfis.bcaresearch.com 2For details on how those spread targets are determined, please see U.S. Bond Strategy Weekly Report, “The Value In Corporate Bonds”, dated February 19, 2019, available at usbs.bcaresearch.com Recommendations The GFIS Recommended Portfolio Vs. The Custom Benchmark Index
How Sweet It Is
How Sweet It Is
Duration Regional Allocation Spread Product Tactical Trades Yields & Returns Global Bond Yields Historical Returns
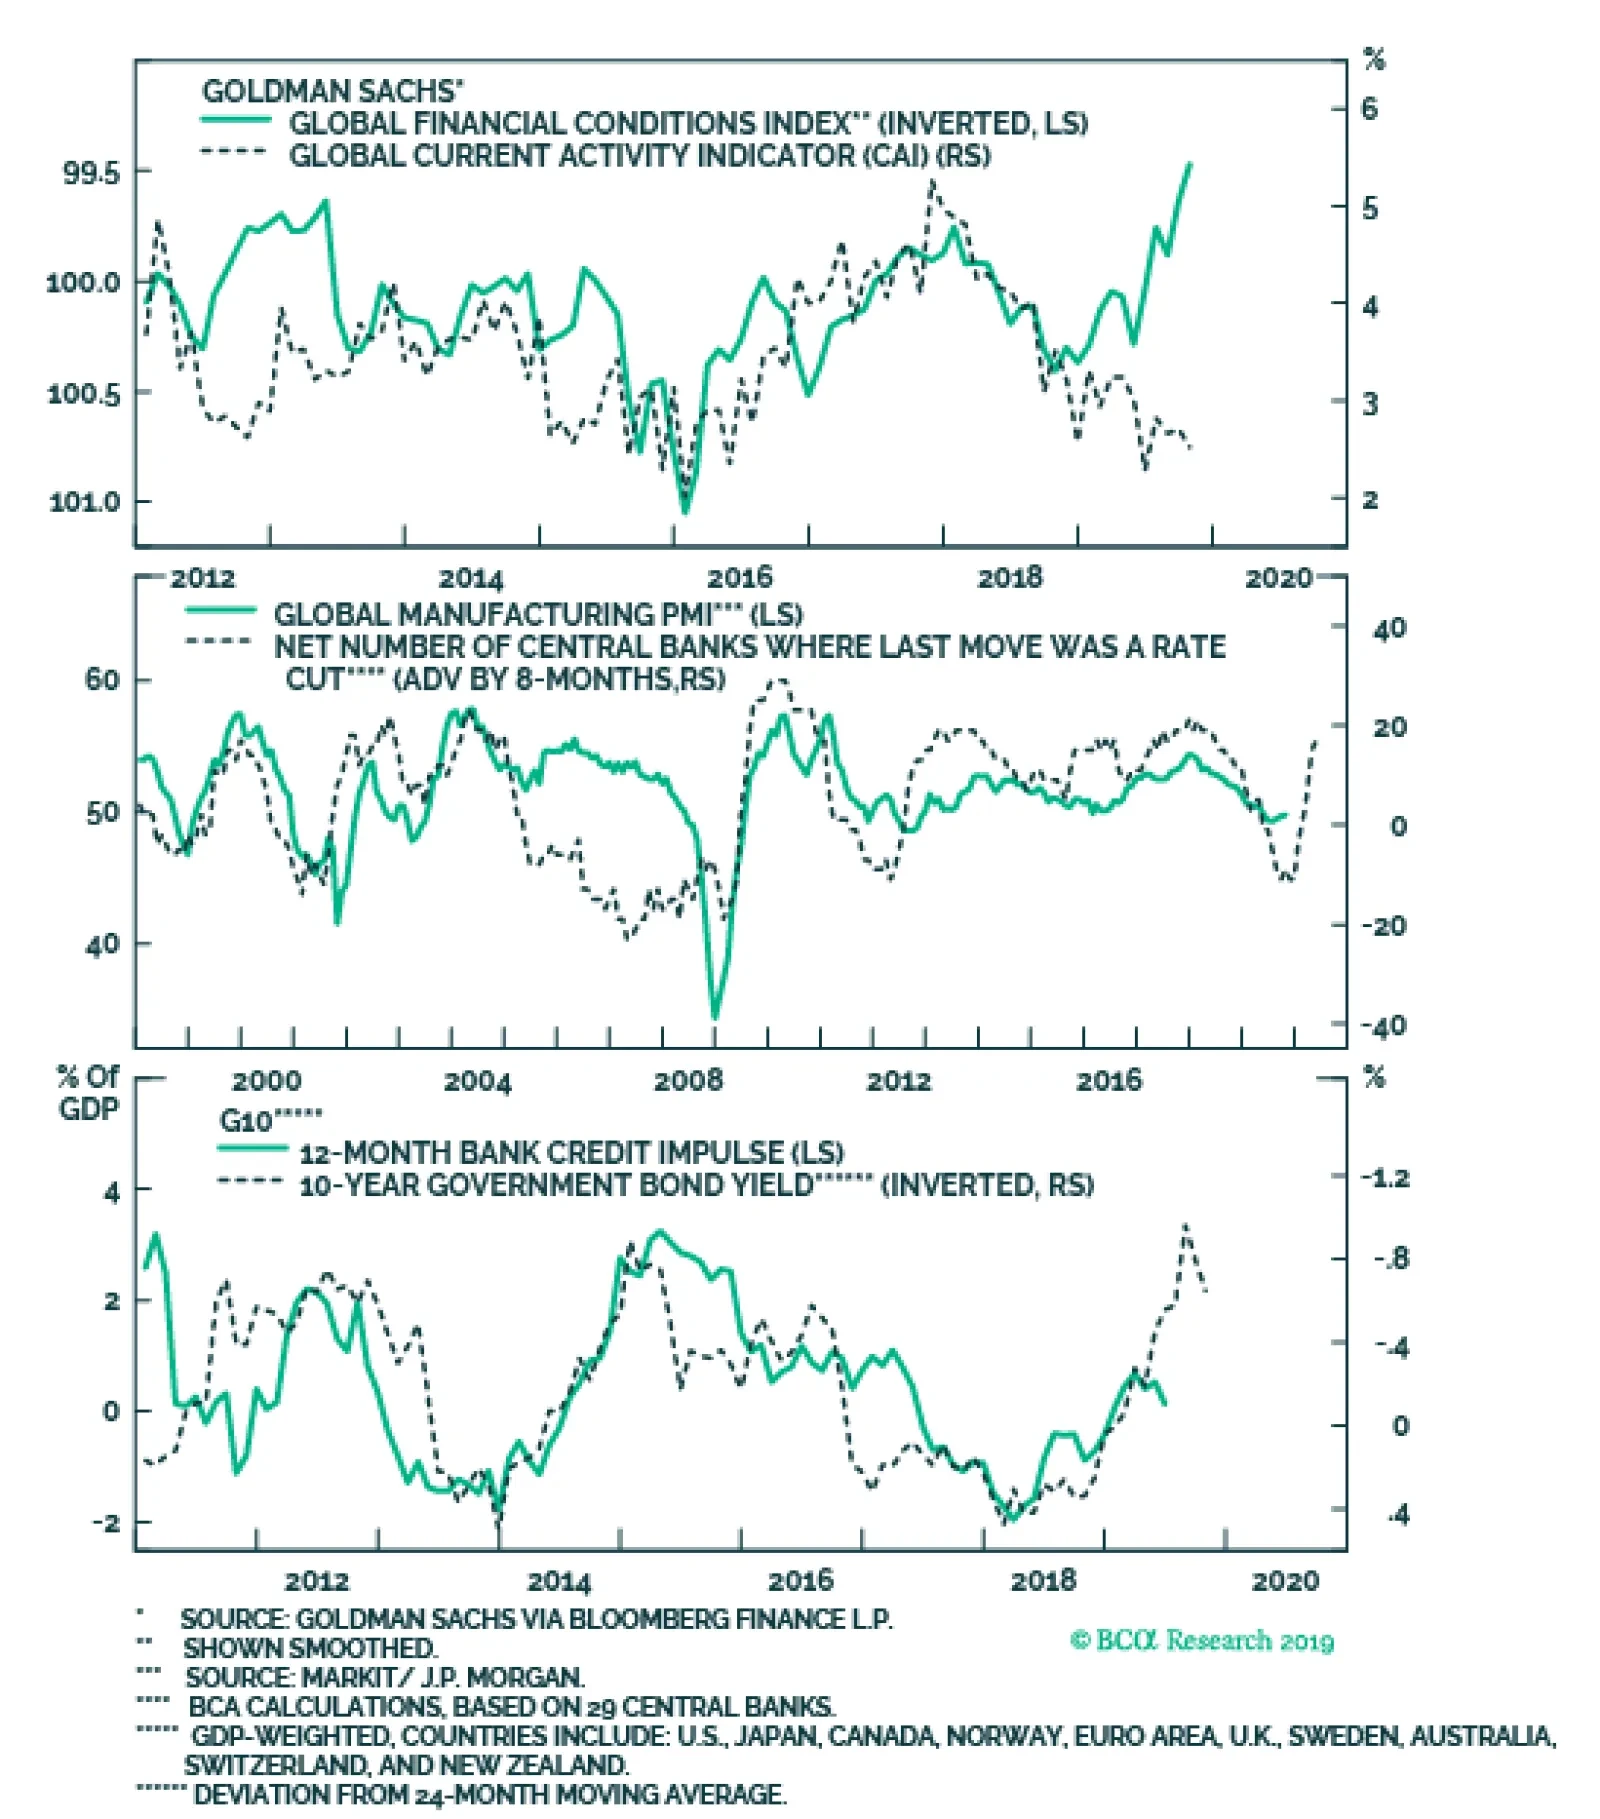
Three things. First, global financial conditions have eased significantly thanks largely to the dovish pivot of most central banks. Reflecting this development, credit growth has picked up. This should support economic activity in the months ahead. Second,…
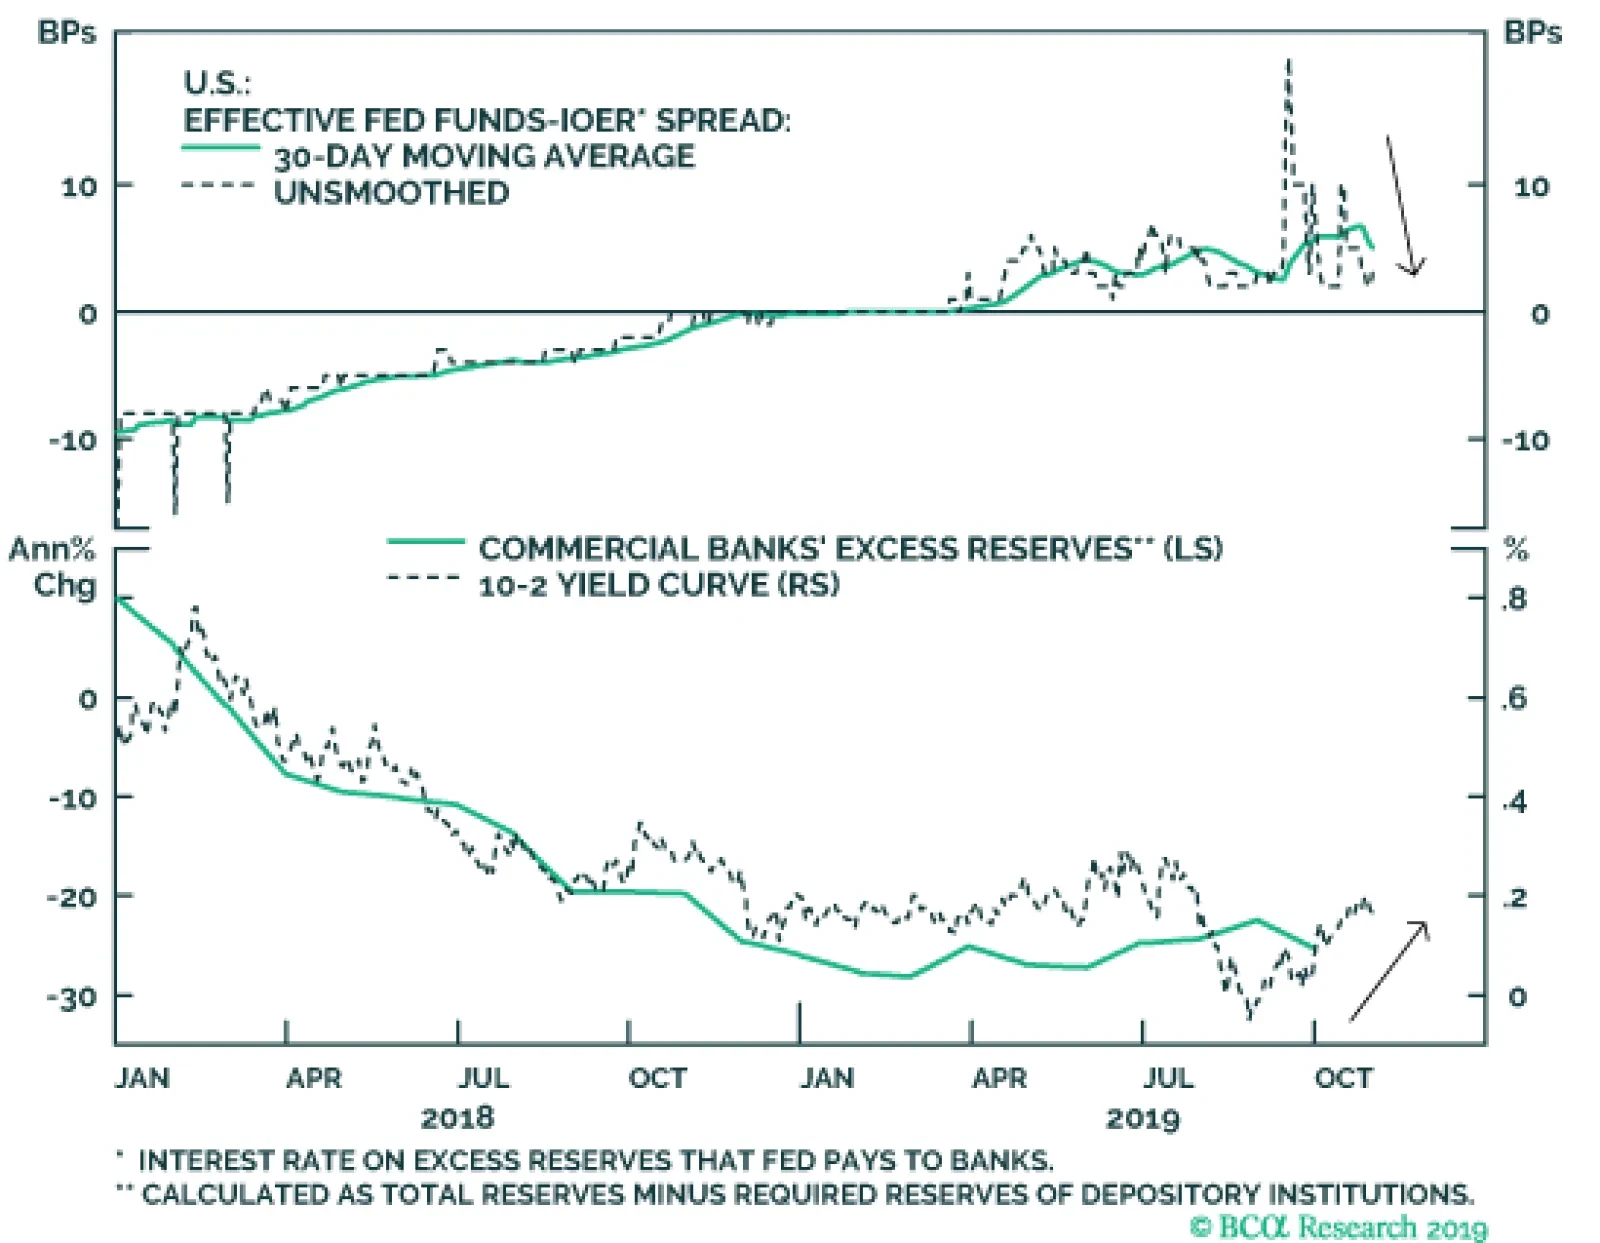
The funding crisis among U.S. domestic banks will be resolved through the Fed injecting liquidity in the repo market and its resumption of bond purchases. The interest rate the Fed pays on excess reserves may soon exceed the effective fed funds rate, meaning…