Global

Mr. X and his daughter, Ms. X, are long-time BCA clients who visit our office toward the end of each year to discuss the economic and financial market outlook for the year ahead. This report is an edited transcript of our recent conversation. Mr. X: I have been eagerly looking forward to this meeting given my many concerns about the outlook. Our portfolio has done well in the past year thanks to the surge in bond prices and the outperformance of defensive equities. However, I am deeply troubled by the amount of monetary stimulus required to support risk assets, and by how expensive bonds and equities are. Moreover, the global economy remains engulfed in deflationary risks, and policymakers are running out of ammunition. As always, there is much to talk about. Ms. X: Let me add that I am also pleased to once again be here to discuss the major risks and opportunities in the global marketplace. A year ago, I held a more positive market view than my father. Directly after our meeting, the deep market correction gave me second thoughts, but ultimately, the rebound in stock prices vindicated my view. Clearly, your assertion that markets would be turbulent proved correct. Since I joined the family firm in early 2017, I have been pushing my father to keep a higher equity exposure than he was normally comfortable with. We agreed to still favor stocks last year, albeit, with a bias toward defensive sectors, and this strategy paid off. But after the past year’s powerful rally in both bonds and stocks, we are again left wondering how to position our portfolio. Ultimately, I do not believe a recession is imminent. Yes, stocks are expensive, but bonds are even more so. Since I expect economic growth to pick up, I am inclined to tilt the portfolio further into equities and move away from our preference for defensive sectors. As usual, I am very interested to hear your views. BCA: Our core theme for 2019 was that we would face classic late-cycle turbulence. Despite this volatility, a run-up in asset prices was likely. Soon after we met, the stock market plunged, hitting a low on December 26, 2018. We anticipated the Federal Reserve to be much more hawkish than what actually transpired. Wage growth and even core inflation have remained firm in the US, but the weakness in global inflation expectations drove central banks’ reaction functions more powerfully than we anticipated. Moreover, the rapid escalation of the Sino-US trade war added a layer of uncertainty that exacerbated the economic slowdown that had started in mid-2018, forcing global central banks to ease policy as an indemnity against recession. Looking ahead, central bankers are highly unlikely to tighten monetary policy as long as inflation expectations remain below their normal range consistent with a 2% inflation target. We agree that the odds of a US recession in the coming year are still low because financial conditions are set to remain accommodative, Chinese authorities are setting policy to shore up growth, and a trade truce is likely. Global economic activity will rebound in early 2020. Instead, the most probable timeframe for a broad based recession is late 2021/early 2022. As a result, we remain positive on risk assets, especially foreign stocks. We are also underweighting bonds as they offer extremely poor absolute and relative value. Mr. X: I can see we will have a lively discussion because I do not share your or my daughter’s optimism. My list of concerns is long, I hope we have time to get through them all. But first, let’s briefly review your predictions from last year. BCA: This exercise is always interesting and often humbling, too. A year ago, our key conclusions were that: Tensions between policy and markets would be an ongoing theme in 2019. With the US unemployment rate at a 48-year low, it would take a significant slowdown for the Fed to stop hiking rates. Ultimately, the Fed would deliver more hikes in 2019 than discounted in the markets. This would push up the dollar and keep the upward trend in Treasury yields intact. The dollar would peak in mid-2019. China would also become more aggressive in stimulating its economy, which would boost global growth. However, until both of these things happened, emerging markets would remain under pressure. We favored developed market equities over their EM peers. We also preferred defensive equity sectors such as healthcare and consumer staples over cyclical sectors such as industrials and materials. Within the developed market universe, the US would outperform Europe and Japan over the next few quarters, especially in dollar terms. Stabilization in global growth would ignite a blow off rally in global equities. If the Fed was raising rates in response to falling unemployment, it would be unlikely to derail the stock market. However, once supply-side constraints began to bite fully in early 2020 and inflation began to rise well above the Fed’s target of 2%, stocks would begin to buckle. This would mean that a window would exist in 2019 for stocks to outperform bonds. We would maintain a benchmark allocation to stocks, but increase exposure if global bourses were to fall significantly from then (late 2018) current levels without a corresponding deterioration in the economic outlook. Corporate credit would underperform stocks as government bond yields rise. A major increase in credit spreads was unlikely as long as the economy remained in expansion mode, but spreads could still widen modestly. US shale companies had been the marginal producers in the global oil sector. With breakeven costs in shale close to $50/bbl, crude prices would be unlikely to rise much from current levels over the long term. However, we expected production cuts in Saudi Arabia would push prices up, with Brent crude averaging around $82/bbl in 2019. A balanced portfolio was likely to generate average returns of only 2.8% a year in real terms over the next decade. This compares to average returns of around 6.6% a year between 1982 and 2018. As already noted, our forecast for more Fed rate hikes was wrong. This meant that we were offside in our duration call. Ultimately, 10-year Treasuries have generated returns of 10.8% so far this year, and German bunds and Japanese government bonds returns of 5.8% and 1.0% in EUR and JPY terms, or 2.5% and 2.0% in USD terms, respectively (Table 1). Nonetheless, our expectation of a run-up in risk asset prices was spot on. Equities outperformed bonds, with global stocks climbing 22.2% in USD terms. We missed the initial outperformance of corporate bonds relative to Treasuries, as investment grade credit rose by 13.9%. However, our bond team took a more constructive stance on corporates as the year progressed. Table 1Market Performance
OUTLOOK 2020: Heading Into The End Game
OUTLOOK 2020: Heading Into The End Game
Chart 12019 Was A Good Year For Stocks
2019 Was A Good Year For Stocks
2019 Was A Good Year For Stocks
In terms of regional allocation recommendations, we were correct to overweight US equities which beat non-US stocks by 13.4%, partly thanks to the dollar’s appreciation. We were also right to underweight EM equities, with Asia and Latin America generating dollar returns of only 12.6% and 6.9%. Overall, it was a good year for financial markets (Chart 1). Our growth forecasts were mixed. We predicted global growth would slow in the first half of 2019 but improve thereafter. Instead, the slowdown extended and intensified into the second half of the year as the Sino-US trade war escalated more than expected, and Chinese policymakers were more reluctant to reflate than anticipated. The IMF also revised down its growth forecasts. In the October 2019 World Economic Outlook report, growth in advanced economies for the year was cut to 1.7% from 2.1% compared to 2018 forecasts, led by a downward revision to 1.5% from 2% in Europe (Table 2). They also pared down 2019 EM growth estimates to 3.9% from 4.7%. Consequently, inflation was softer than originally predicted. These trends in economic activity meant that our dollar call was partially right. The currency did not peak in the middle of the year as we foresaw, but has been flat since the spring and today trades where it was in April. Meanwhile, the weaker-than-expected growth put our oil call offside, with Brent averaging $62/bbl this year, not $82/bbl. Table 2IMF Economic Forecasts
OUTLOOK 2020: Heading Into The End Game
OUTLOOK 2020: Heading Into The End Game
The Cycle’s End Game Mr. X: You mentioned that you remain positive on risk assets and stocks for 2020. You will not be surprised that I am extremely skeptical of this view. The Fed could only raise rates to 2.5% before all hell broke loose, and it has now cut them back to 1.75%. The European Central Bank has lowered its deposit rate to -0.5% and is resuming its asset purchase program, while the Bank of Japan is clearly out of ammunition. Yet global growth remains weak. Despite this lack of economic traction, US stocks are at a record high and are unequivocally expensive. This situation seems untenable. If global growth weakens further, there is little more policymakers can do. I think the risk of a recession is a lot more elevated than you believe, especially as we cannot count on a lasting trade détente. Meanwhile, the US presidential election makes me uncomfortable, and I cannot see how business leaders will want to deploy capital to expand capacity given the risk that the regulatory and tax environment could become hostile to the corporate sector. If I’m wrong about growth – and I hope I am – then inflationary pressures will build and central banks will have to tighten policy suddenly. As bond yields rise, stocks will be sold and yet bonds will not offer any protection since they yield so little. Also, I have not even talked about negative interest rates. $12.1 trillion of debt yields less than zero percent. This is obviously preventing creative destruction from purging the system of rot. It is also promoting capital misallocation and undue risk-taking by financial institutions who cannot meet fiduciary liabilities. Ms. X: Based on this tirade, you can easily imagine what life at the office has been like in recent months. I do share some of my father’s concerns. Negative rates cannot be a good thing, especially from a long-term perspective. If growth weakens further, I’m also concerned that central banks have few options left. However, I do not see these risks as imminent. There are nascent signs that the global economy will stabilize soon; both President Trump and President Xi have strong incentives to reach a trade truce; and central banks are nowhere near removing the proverbial punch bowl. While US stocks are expensive, other risk assets offer value if global growth rebounds. The wall of worry is high, but stocks can and will climb that wall. BCA: Your debate is similar to our own internal discussions. It is undeniable that the investing landscape looks shaky at the moment, especially with the S&P 500 currently trading at 18-times forward earnings. However, the situation you are describing is a direct consequence of one BCA’s long running macro themes: The end of the debt supercycle. While the debt supercycle is dead in advanced economies, it remains very much alive in emerging markets, and China in particular. The private debt load in advanced economies has declined by 20% of GDP since 2009 (Chart 2A). Despite the burgeoning US federal government deficit, public debt accumulation has not been strong enough to cause total debt loads to increase. Instead, aggregate indebtedness has been stuck slightly above 260% of GDP for the past 10 years. Depressed, and in some cases, negative interest rates reflect weak demand for credit. Chart 2AThe Debt Supercycle Is Dead In DM...
The Debt Supercycle Is Dead In DM...
The Debt Supercycle Is Dead In DM...
Chart 2B...But Not In EM
...But Not In EM
...But Not In EM
The end of the debt supercycle has both a negative and positive impact. Without increasing leverage, domestic demand cannot grow faster than trend GDP. Thus, it takes much more time for inflationary pressures to build. Concurrently, in the absence of inflationary pressure, more time passes before monetary policy reaches a restrictive level causing recession. The upshot is that the business cycle can last much longer. Moreover, a world less geared to credit accumulation reduces the fragility of the financial system, at the margin. While the debt supercycle is dead in advanced economies, it remains very much alive in emerging markets, and China in particular (Chart 2B), where the demand for credit is still very sensitive to changes in monetary settings. EM countries are the major source of volatility in the global business cycle. Chinese policymakers’ management of the tradeoff between growth and leverage will determine whether the global economy can avoid deflation. If they decide to tackle debt excesses head on, EM credit growth will contract and EM final demand will suffer. In this scenario, negative rates will persist in low-growth advanced economies, and the Fed will be incapable of raising rates because global deflationary forces will be too strong. Chart 3The World Is In The Midst Of A Deflationary Episode
The World Is Experiencing A Deflationary Episode...
The World Is Experiencing A Deflationary Episode...
The second half of 2018 and the whole of 2019 gave us a taste of these forces. When China tightened credit conditions, the EM economies slowed first. Trade and manufacturing hubs like Europe, Australia and Japan quickly followed. A deflationary wave spread around the world, as evidenced by a drop in global producer prices (Chart 3). The US is a comparatively closed economy, but it could not avoid this gravitational pull. The ISM manufacturing survey ultimately started to contract in August 2018, converging to weakness in the rest of the world. The trade war’s hit to business confidence added insult to the injury of an already weak economic environment. Looking ahead, our optimism reflects an expectation that Chinese policymakers will adopt a more pro-growth policy stance because they too are spooked by the downtrend in their economy. While the Politburo Standing Committee has not abandoned its structural reform agenda, it realizes that aggressive deleveraging is dangerous. The Chinese economy is growing at its weakest pace in nearly 30 years and deflation is once again taking hold. In response to date, policymakers have lowered China’s reserve requirement ratio by 400 basis points, cut taxes by 2.8% of GDP, increased the issuance of local government bonds to finance public infrastructure projects, and boosted capex at state-owned enterprises. EM economies will respond to these stimulative measures. The Chinese credit and fiscal impulse has stabilized (Chart 4). Meanwhile, the Fed has pushed the real fed funds rate 74.4 basis points below the Holston-Laubach-Williams estimate of the neutral rate, and coordinated global policy easing points to a rebound in the global manufacturing sector (Chart 4, bottom panel). Moreover, the global inventory purge that magnified the industrial sector’s pain is getting exhausted and the auto sector is looking up. Finally, we agree with Ms. X that both President Trump and President Xi have their own incentives to deescalate trade policy uncertainty. We are entering the end game of this business cycle and bull market. Global borrowing rates will rise, but only to a limited extent. Rightly or wrongly, major central banks are terrified by the prospect of the Japanification of their economies. Practically speaking, this means that they want inflation expectations to move back up to normal levels (Chart 5). However, after undershooting their 2% targets for 11 years, achieving this objective will require central banks to let realized inflation overshoot these targets first. Thus, central banks are unlikely to tighten policy until late next year at the earliest, which will limit how far yields can climb in 2020. Chart 4…But Do Not Bet Against Reflation
...But Do Not Bet Against Reflation
...But Do Not Bet Against Reflation
Chart 5Depressed Inflation Expectations
Depressed Inflation Expectations
Depressed Inflation Expectations
Equities and other risk assets should perform well if global growth re-accelerates but interest rates don’t rise much at first. Some benefit of this fertile backdrop is already priced in, but many pockets of value levered to stronger global growth still exist. We are entering the end game of this already long business cycle. While the general environment favors remaining invested in risk assets in 2020, this is likely the last window of opportunity to do so. Today’s accommodative monetary policy will revive inflationary pressures in 2021, and central banks will ultimately be forced to lift rates much more aggressively. China will continue to resist excessive leverage. Neither the business cycle nor the equity bull market will withstand these final assaults. Mr. X: Your benign outlook reminds me of when we met in December 2007. Do you remember? You told me that the housing slowdown and the credit market seizure were large risks, but central banks would put a floor under global growth. How did that turn out? I agree that in advanced economies, overall debt loads have been stable. But this belies major disparities. For example, US corporate debt has never represented a larger share of GDP than it does today. This must be a major vulnerability. While household balance sheets look healthy, I do not think consumption will save the day if companies are cutting capex and employment while they clean up their balance sheets. Countries like Canada and Australia are drowning in private sector debt. How can you ignore these vulnerabilities? BCA: A comparison with 2008 actually reveals why advanced economies, particularly the US, are not the powder keg that they once were. US corporate debt is elevated when compared to GDP, but profits also represent a much larger share of GDP than they did 10 or 20 years ago, and interest rates are close to historic lows. As a result, interest coverage ratios are still adequate (Chart 6). In 2007, household debt loads were large, but interest payments also accounted for 18.1% of disposable income, the highest proportion since 1972. Additionally, US firms’ debt-to-asset ratio is in line with the post-1970 average of 22.1%. Finally, US businesses have not used rising leverage to fund capital spending, as demonstrated by the elevated age of the capital stock. Thus, the US corporate sector continues to generate positive net savings. Ahead of recessions, US businesses typically generate negative net savings. The composition of the creditors is another important difference. In 2007, an extremely large share of the spurious borrowings resided on banks’ balance sheets. Moreover, the banking system was woefully undercapitalized with a leverage ratio of 17x. Weak banks had to absorb 2.2 trillion of losses after 2008. Consequently, the money creation mechanism broke down, and money multipliers collapsed (Chart 7). Today, US banks boast relatively stronger balance sheets, and they are still judicious about extending credit despite being less exposed to the corporate sector than they were to the mortgage market in 2008. Instead, most corporate debt is held by less levered entities such as ETFs, pension plans, and insurance companies. The leveraged losses that proved so debilitating in 2008 are less likely to be a source of systemic risk in this cycle. Chart 6US Businesses Can Still Service Their Debt
US Businesses Can Still Service Their Debt
US Businesses Can Still Service Their Debt
Chart 72008 Heralded A Destruction Of Money
2008 Heralded A Destruction Of Money
2008 Heralded A Destruction Of Money
Countries like Australia and Canada have much more worrisome private sector debt dynamics, as their servicing costs are elevated (Chart 8). However, these economies are unlikely to collapse when global rates are low, as long as the global economy can avoid a recession, which would reduce export revenue in these trade-sensitive countries. You expect a moderate rebound in global growth next year, but not a sharp acceleration because Chinese stimulus will not be that aggressive. The bottom line is that both the US corporate sector and at-risk countries like Canada should avoid a day of reckoning until interest rates rise meaningfully. As we have already mentioned, central banks are very clear that they will allow inflation to overshoot before tightening policy anew. We monitor US inflation breakeven rates to gauge the likely timing of that outcome. At 1.6%, they remain well below the 2.3% to 2.5% range, which is historically consistent with central banks durably achieving their inflation target (Chart 9). Until inflation expectations are re-anchored back up in that range, we will not worry about an imminent tightening in monetary conditions. Chart 8Canada And Australia Are Close To Their Debt Walls
Canada And Australia Are Close To Their Debt Walls
Canada And Australia Are Close To Their Debt Walls
Chart 9The Fed Is In No Rush To Tighten
The Fed Is In No Rush To Tighten
The Fed Is In No Rush To Tighten
Chart 10Inflation Is A Lagging Indicator
OUTLOOK 2020: Heading Into The End Game
OUTLOOK 2020: Heading Into The End Game
It is true that inflationary pressures are building in the US. Historical evidence points to a kink in the Phillips curve, the link between wage growth and the unemployment rate. Since the labor market is tight, we are already seeing average hourly earnings growth accelerate. Moreover, the output gap is mostly closed. However, keep in mind that inflation is also a lagging economic indicator (Chart 10). Consequently, the recent global economic slowdown is likely to keep US inflation at bay for most of 2020. The sharp fall in US capacity utilization along with the decline in imported goods and core producer price inflation corroborate this picture. Mr. X: So you believe that as long as rates stay low, the day of reckoning will be delayed. But ultimately, that it is unavoidable. BCA: Correct. No matter what, we are entering the end game of this already long business cycle. The current period of easy policy will allow cyclical spending to rise as a share of output, and debt to build up again over the coming 18 months. Because slack is clearly limited, this latest wave of policy easing will generate inflationary pressures. Ultimately, the Fed will be forced to play catch up and tighten more aggressively than expected in 2021. Paradoxically, the longer the onset of recession is delayed, the deeper it is likely to be… Mr. X: Because imbalances and vulnerabilities will only grow larger! BCA: Absolutely! Mr. X: That is something we can agree on. Ms. X: The way you complete one another’s sentences is a testament to how many years you have been talking to each other. For me, the most concerning issue is political risk. While I am more positive on the outlook for trade policy than my father, I do worry about the impact of US election risk on capital spending. Chart 11If The 2012 Election Is Any Guide, Trump Can Still Win A Second Term
OUTLOOK 2020: Heading Into The End Game
OUTLOOK 2020: Heading Into The End Game
BCA: On the trade war, we would like to address your father’s concerns. All politicians, even unconventional ones like President Trump, seek re-election. Yet, President Trump’s overall approval rating is low (Chart 11). If the election were held today, his odds of winning would be minimal. However, US presidential elections do ultimately favor the incumbent. If the re-election of President Obama in 2012 is any guide, President Trump has enough time to boost his approval rating over the coming 12 months to secure a second term through the Electoral College. In order to achieve this outcome, he must reverse the large slowdown in wage growth currently plaguing the swing states he won by only a small margin in 2016 (Chart 12). Workers in states like Michigan, Pennsylvania and Wisconsin are suffering disproportionately from the uncertainty created by the trade tensions. President Trump will have to pause the tariffs – and even cut tariff rates – to support the economy and reassure voters. Chart 12Trump's Fear Is Coming True
Trump's Fear Is Coming True
Trump's Fear Is Coming True
China is willing to accept a trade truce. The Chinese economy is weak and producer prices are once again deflating. President Xi doesn’t want to preside over another massive surge in leverage or a 1930’s Irving Fisher-style deflationary spiral. Reviving private sector investment sentiment via a reduction in trade policy uncertainty would help stabilize spending and avoid a disorderly economic slump. Moreover, President Xi may not trust the current White House, but the prospect of a Democratic administration that will be tough on both environmental standards and human rights would offer little solace. This brings us to the US election. The recent Bank of America Merrill Lynch positioning survey shows that the investment community shares your concerns. This risk is hard to quantify. The Democratic nomination is wide open. Former Vice President Joe Biden leads the opinion polls, and is a known quantity. Meanwhile, the rising progressive wing of the party, embodied in Senator Elizabeth Warren, is hostile to business and likely to cause concerns in boardrooms across the US, especially in the tech, energy, financial services and healthcare sectors. This could dampen animal spirits. Biden’s and Warren’s odds of beating President Trump are overstated by current polls, especially if the President softens his stance on trade to allow for a growth pick-up. Moreover, to be competitive nationally, Senator Warren will have to abandon some of her more progressive plans and pivot toward the center. The recent upbeat equity market performance of sectors like managed healthcare suggests that markets are discounting this shift. Thus, we doubt the election is currently really weighing on business intentions. The recent pick up in capital spending intentions in various Fed Manufacturing surveys fades this risk. Chart 13A Structural Tailwind Has Vanished
A Structural Tailwind Has Vanished
A Structural Tailwind Has Vanished
What is clear though is that if the economy were to weaken further, Senator Warren’s chances would improve and CEOs would genuinely begin to worry about re-regulation, potentially unleashing a vicious cycle. Thus, the end game is an unstable equilibrium. On a structural basis, whether one looks at the rise of populism or the geopolitical rivalry between China and the US, trade tensions will remain a pesky feature of the global economy. In effect, the trade truce will not be a permanent deal. The global economy has therefore lost the tailwind of deepening global integration achieved through trade (Chart 13). This will limit global potential GDP growth. Ms. X: Thank you. I think the time is right to explore your economic outlook in more detail. The Economic Outlook Chart 14China: Modest Reflation Is Underway
China: Modest Reflation Is Underway
China: Modest Reflation Is Underway
Mr. X: From your arguments, it seems that the outlook for China and Emerging Markets is critical, so let’s start there. My impression is that President Xi is not abandoning his structural reform agenda. Avoiding the middle-income trap will require decreasing China’s dependence on credit as a growth driver. Can economic activity really stabilize under those circumstances? BCA: You are correct: Senior Chinese administrators are reluctant to allow another major phase of debt accumulation to take hold. However, as we already highlighted, policymakers are taking steps to end the most severe economic slowdown since the first half of the 1990s. China is currently implementing a middling stimulus program. The positive impact of the lower bank reserve requirement ratio, the tax cuts and increased public infrastructure spending is being mitigated by strong regulatory constraints on the shadow banking system and small financial institutions, by efforts to limit real estate speculation, and by the cash crunch facing real estate developers. These crosscurrents make it unlikely that the credit impulse will rise as sharply as it did following the reflationary campaigns of 2009, 2012 or 2016. Nonetheless, the Chinese economy is indeed exhibiting some mildly positive signals. Our monetary indicator and state-owned enterprise capital spending point to a rebound in overall Chinese economic activity (Chart 14). Moreover, household spending is trying to bottom. If China stabilizes, then the EM slowdown will end soon. Without a deepening drag from the Chinese economy, EM countries should be able to take advantage of the easing in global financial and liquidity conditions. But the end of the Chinese drag on EM growth does not mean a massive tailwind will be forthcoming. Additionally, deflationary forces remain stronger in the emerging world than in the US. As a result, EM real rates will remain stubbornly above the level that real economic activity warrants, posing a headwind for capital and durable goods spending. Generally speaking, EM and China are moving from a headwind for the world to a mild tailwind. Treasury yields are unlikely to move significantly higher than the 2.25% to 2.5% zone. Ms. X: I’m somewhat more positive than you on global growth next year. The policy easing around the world looks very promising for economic activity. How do you factor the impact of improving global liquidity conditions into your outlook for 2020? BCA: It is undeniable that global liquidity conditions have eased massively. As we already highlighted, the majority of global central banks cutting rates is a very positive dynamic for global growth. Trends in measures of liquidity ratify this message. Foreign exchange reserves are again growing and our BCA US Financial Liquidity index has rallied sharply over the past 12 months. Historically, this indicator forecasts the trend in the BCA Global Leading Economic Indicator, commodity prices and EM export prices by 18 months (Chart 15). Moreover, money aggregates are growing faster than credit across the major advanced economies. Such developments typically foretell an acceleration in global economic activity (Chart 16). Chart 15Liquidity Dynamics: Fueling A Global Growth Recovery
Liquidity Dynamics: Fueling A Global Growth Recovery
Liquidity Dynamics: Fueling A Global Growth Recovery
Chart 16Rising Money Supply Is A Good Thing
Rising Money Supply Is A Good Thing
Rising Money Supply Is A Good Thing
The duration of the current slowdown also warrants optimism. We have often highlighted that since the early 1990s, the global manufacturing sector evolves over 36-month symmetric cycles (Chart 17). The current soft patch has lasted more than 18 months. In the context of easing liquidity and depleted inventories, pent-up demand can easily translate into actual spending. The recent surge in the new orders-to-inventories ratio confirms that global manufacturing activity should soon pick up (Chart 18). The auto sector’s weakness, which was exacerbated by previous inventory buildups, changing emission standards, and rising borrowing costs, is also ebbing. Chart 17The Mid-Cycle Slowdown Is Long In The Tooth
The Mid-Cycle Slowdown Is Long In The Tooth
The Mid-Cycle Slowdown Is Long In The Tooth
Chart 18The New Order-To-Inventory Ratio Points To A Global Rebound
The New Orders-To-Inventories Ratio Points To A Global Rebound
The New Orders-To-Inventories Ratio Points To A Global Rebound
Various growth indicators are sniffing out this positive inflection point. The recent trough in the global ZEW survey is revealing (Chart 19). It materialized quickly after Sino-US trade tensions began to ease. Enough positive global economic momentum exists such that a minor decline in policy uncertainty could unleash a large improvement in growth expectations. The rebound in Taiwanese equities and European luxury stocks confirms that the global economy should soon bottom. There are two things we cannot emphasis enough. First, this is the end game of the business cycle, after which a recession will ensue. Second, investors should not expect the kind of strong synchronized growth rebound witnessed in 2017. Without a Chinese and EM boom, a crucial source of demand will be wanting. Mr. X: What about US growth? The yield curve inverted this summer and deteriorating consumer and business confidence raised the specter of an imminent recession. Moreover, the fiscal stimulus that helped the economy in the first half of 2019 is now over. In fact, with a $1 trillion federal deficit despite an unemployment rate of only 3.6%, we have run out of fiscal room to support activity if and when a recession materializes. BCA: The recent yield curve inversion most likely overstated the risk of an economic contraction. First, in the mid-1990s, if the term premium had been as low as it is today, the curve would have also inverted without any recession materializing from 1995 to 2000. Second, this summer, the curve inverted up to the 5-year tenor and steepened for longer maturities. Prior to recessions, the curve inverts across all maturities. Recessions are not born out of thin air. They are caused by imbalances and tight monetary policy. The large debt buildup and other investment imbalances that have preceded prior US recessions are not yet apparent. Prior to the 1991, 2001 and 2008 recessions, the private sector debt load had increased by 20.6%, 14.6% and 25.6% of GDP in the previous five years, not the current 1.4% run rate. The Fed’s policy is now clearly accommodative. Not only is the real fed funds rate 74.4 basis points below the Fed’s favored estimate of the neutral rate of interest, but also real estate, the most interest-rate sensitive economic sector, is rebounding. In 2018, real estate activity collapsed in response to mortgage rates rising to 4.9%. Today, the NAHB Homebuilding index has retraced 79% of its losses; mortgage demand has improved; and housing starts and building permits have recovered (Chart 20). When policy is tight, real estate activity never recovers this quickly, even as yields fall. Chart 19Positive Signals For Global Growth
Positive Signals For Global Growth
Positive Signals For Global Growth
Chart 20The Housing Market Signals That Policy Is Accommodative
The Housing Market Signals That Policy Is Accommodative
The Housing Market Signals That Policy Is Accommodative
Chart 21Robust Household Financial Health
OUTLOOK 2020: Heading Into The End Game
OUTLOOK 2020: Heading Into The End Game
A counterargument is that real estate price appreciation is weak. However, tight monetary policy is not the cause. Two forces are dampening house prices. First, the Jobs and Tax Act of 2017 lowered allowable mortgage interest and state and local tax deductions. High-end properties in high-tax states such as California, New York and Massachusetts have suffered from this adjustment. Second, the US housing market has an overhang of large, pricey homes relative to strong demand for smaller, starter homes. Median home prices outpacing average ones show this divergence. We also to need to gauge if consumer spending is likely to follow the manufacturing sector lower. If it does, a recession will be unavoidable. On this front, we are hopeful because: The outlook for household income is positive. As you noted, the unemployment rate is still extraordinarily low, and more Americans will be working by the end of 2020 than today. Additionally, the rising employment-to-population ratio for prime-age workers is tightly linked to stronger wages (Chart 21). Also, the recent pick up in productivity growth points to higher real wage growth. The household savings rate is elevated and has limited upside. Households already have a large cushion insulating them from unforeseen shocks. At 8.1% of disposable income, the savings rate is in the 65th percentile of its post-1980 distribution. It is especially lofty if we take into account robust American households’ net worth (Chart 21, bottom panel). Consumer credit demand is rising, according to the Fed’s Senior Loan officer survey. Since household liquid assets are quickly expanding and the household formation rate is robust, consumption of durable goods should pick up, especially in light of the large decrease in borrowing costs. This is particularly true since the household debt-to-assets ratio is at its lowest level since 1985 and debt-servicing costs only represent 9.7% of disposable income, the lowest share for nearly 40 years. The corporate sector outlook should brighten soon. The modest rise in productivity protects margins from higher wages, an effect that will linger given that capacity expansion is consistent with further productivity gains (Chart 22). Crucially, the combined fiscal and monetary easing in China should bolster capital-spending intentions around the world, including the US (Chart 23). Rising productivity will only consolidate these trends. Chart 22Capacity Growth Provides Some Support For Productivity
Capacity Growth Provides Some Support For Productivity
Capacity Growth Provides Some Support For Productivity
Chart 23Chinese Reflation Will Revive US Capital Spending
Chinese Reflation Will Revive US Capital Spending
Chinese Reflation Will Revive US Capital Spending
The most positive development for the US corporate sector is our outlook for non-US growth. If the global manufacturing sector mends itself, so will the US. Ample liquidity is a positive for the world economy, as well as for US manufacturing conditions (Chart 24). On the fiscal front, we appreciate your worries, but they are not a story for 2020. The US fiscal thrust will not be as positive as it was in 2018 or 2019, but it is set to remain a small tailwind, not a drag. Furthermore, given that 2020 is an election year it is unlikely that politicians will tighten purse strings over the coming 12 months. Fiscal risks are undoubtedly greater in the long run. However, a sudden fiscal consolidation is a remote probability because fiscal austerity has gone out of style. Instead, the federal debt burden will be a major source of long-term inflation because there is no other easy way to address this gigantic pile of liabilities. The path of least resistance will be more spending and financial repression. In other words, real rates will stay too low and excess government spending will push prices higher, conveniently eroding the real value of that high federal debt burden. This was a big story in the 20th century and it will remain so in the 21st (Chart 25), especially since an aging population and the peak in globalization will weigh on global savings. Chart 24The US Manufacturing Slowdown Has Run Its Course
The US Manufacturing Slowdown Has Run Its Course
The US Manufacturing Slowdown Has Run Its Course
Chart 25Inflation Is About Political Decisions
Inflation Is About Political Decisions
Inflation Is About Political Decisions
Ms. X: Your point about demographics makes me think of Europe and Japan. Brexit has not been resolved; populism remains a concern in Italy; and the European banking system is still fragile. Japan suffers from an even worse demographic profile and the recent VAT increase was ill-timed, economically. Given these headwinds, can these regions participate in the global recovery you foresee? BCA: The short answer is yes, albeit to varying degrees. The outlook for Europe is more promising than Japan. A No-Deal Brexit is now a very low probability event, even after next month’s UK election. The conservatives’ support for Prime Minister Johnson’s Brexit plan will ensure as much. A large source of uncertainty is being lifted, which will allow European businesses to resume investment planning. The situation in the European periphery is also improving. Non-performing loans in Spain and Italy are falling (Chart 26), which is allowing for a normalization of credit origination. The narrowing Italian and peripheral spreads to German bunds will be helped by easing financial conditions in the European economies that need it most. Higher Italian bond prices improve banks’ solvency and cut borrowing costs for the private sector. Finally, populism is alive and well in Europe, rejecting fiscal austerity, but not embracing euro-skepticism. More generous fiscal spending would be a positive for Europe. European liquidity conditions are also generous. Deposit growth has strengthened and financial conditions have benefited from lower German yields and a cheap euro, which trades 15% below fair-value estimates. Our model for European banks’ return on tangible equity is rising, which is a clear indication that easy financial and liquidity conditions should deliver stronger incremental economic activity (Chart 27). Chart 26Declining Non-Performing Loans Are A Positive For The European Periphery
Declining Non-Performing Loans Are A Positive For The European Periphery
Declining Non-Performing Loans Are A Positive For The European Periphery
Chart 27European Banks' Return On Equity Will Improve In 2020
European Banks' Return On Equity Will Improve In 2020
European Banks' Return On Equity Will Improve In 2020
The fiscal outlook is murkier. European fiscal thrust was a positive 0.4% of GDP in 2019, but it will decline to 0.1% in 2020. However, fiscal policy affects economic activity with a lag. The impact of this year’s easing has yet to be fully felt. Since European rates are so low and the economy is not operating at full capacity, the fiscal multiplier is greater than one. Therefore, Europe can still reap a substantial fiscal dividend next year. Finally, Europe remains a very pro-cyclical economy. A large share of euro area GDP is connected to manufacturing and exports. As a result, Europe will be one of the prime beneficiaries of a pickup in global growth. Already, the sharp rebound in the German and euro area ZEW survey expectation components point to a brighter outlook for the region. Japan is also a very pro-cyclical economy, which will reap a dividend from a bottom in global manufacturing activity. However, the Land of the Rising Sun is still subject to idiosyncratic constraints. Japanese financial conditions have not improved as much as those in Europe. The yen has appreciated 2.6% in trade-weighted terms this year, while Japanese yields have not melted as much as European ones (because Italian and peripheral yields fell so much in 2019). Japan will also have to reckon with the impact of the October VAT increase. Ahead of the tax hike, retail sales spiked by 9.1% on a year-on-year basis, or 7.1% compared to the previous month, a script similar to 2014. 2015 was a payback year where consumption was depressed. This scenario will play out again, even if the Abe government has implemented some fiscal offsets. Ultimately, the Japanese economy will lag Europe’s in the first half of the year but should catch up in the second half. The impact of the tax hike will dissipate. Most importantly, rebounding global growth will hurt the yen, at least on a trade-weighted basis, providing a lift to export prospects and easing Japanese financial conditions relative to the rest of the world, which will produce a growth dividend later in 2020. Ms. X: To summarize, you expect a moderate rebound in global growth next year, but not a sharp acceleration because Chinese stimulus will not be that aggressive. EM activity will also pick up but will not generate fireworks. The US will be okay but Europe will probably deliver the largest positive growth surprise as external and domestic conditions align positively. Japan will also stabilize on the back of stronger global growth, but domestic headwinds mean that a true reacceleration won’t happen until the latter part of the year. This recovery constitutes the business cycle’s end game as inflation will become a concern in 2021, forcing the Fed to tighten then. BCA: Yes, this is correct. Ms. X: Thank you! Bond Market Prospects Chart 28Global Bonds Are Extremely Overvalued
Global Bonds Are Extremely Overvalued
Global Bonds Are Extremely Overvalued
Ms. X: I do not like US Treasuries at current yields. They do not protect me against an inflation surprise and will do nothing for me in an economic recovery. However, my bearishness is tempered by the large stock of bonds with negative yields in Europe and Japan. As long as this strange situation persists, I doubt US yields will experience much upside. US paper is too attractive to foreign asset managers right now. BCA: We share your view and are recommending an underweight to global government bonds. Global yields offer little value and are vulnerable to a rebound in economic activity or a trade détente. Our Global Bond Valuation index is flashing a clear sell signal (Chart 28). As yields rise, global yield curves are bound to steepen. We also agree that the upside for Treasury yields is limited, but we disagree with the limiting factor. Foreign investors are not the major buyers of Treasuries. Indeed, the data shows that European and Japanese investors have not been aggressive purchasers of US government securities. The US yield curve is flat and US short rates tower above European and Japanese ones, hedging currency exposure when buying Treasuries is expensive. In euro or yen terms, a hedged Treasury yields -67 basis points and -60 basis points, less than 10-year bunds or JGBs, respectively. Meanwhile, EM central banks are diversifying their FX reserves away from the US dollar into gold. Instead, our view is governed by the concept we dub the “Golden Rule of Treasury Investing.” According to this principle, the outperformance of Treasuries relative to cash is a direct function of the Fed’s ability to surprise the market. If the Fed cuts rates more than the OIS curve anticipated 12 months prior, Treasuries outperform. The opposite happens if the Fed delivers a hawkish surprise (Chart 29). Chart 29The Golden Rule Of Treasury Investing
The Golden Rule Of Treasury Investing
The Golden Rule Of Treasury Investing
Treasury yields are unlikely to move significantly higher than the 2.25% to 2.5% zone, because the OIS curve is now only pricing in 28 basis points of rate cuts over the next year. It is not just the US OIS curve that has priced out a large amount of rate cuts; this phenomenon has materialized around the world over the past five weeks. Chart 30The Term Premium Is Too Low
The Term Premium Is Too Low
The Term Premium Is Too Low
Any upside risk to that 2.25% to 2.5% forecast for 2020 will come from the inflation expectations and term premium components of yields. Central banks, including the Fed, have telegraphed an intention to allow inflation expectations to rise, initially, in response to stronger global growth. Moreover, declining risk aversion should also allow the exceptionally depressed term premium to normalize (Chart 30). Only in late 2020 or early 2021 will Treasury yields durably move above this 2.25-2.5% zone. Punching above these levels will require core PCE inflation to have been above target long enough to re-anchor inflation expectations back up to their 2.3% to 2.5% target zone. Only then will the Fed give the all-clear signal to the bond market to lift yields higher. Mr. X: You still have not directly addressed the question of negative yields in Europe and Japan. This story will not end well. Do you worry about these bond markets over the next year? BCA: Our answer is an emphatic yes. But we assume you will not let us leave it at that. Mr. X: You know me too well. BCA: Over the course of the past 50 years, we have learned a thing or two about you. In all seriousness, let’s start with our simple but effective valuation ranking. It compares the current level of real yields for each country to their historical averages and standard deviations. You can see that the most unattractive bond markets right now are all in Europe (Chart 31). Chart 31European Bonds Are Too Dear
OUTLOOK 2020: Heading Into The End Game
OUTLOOK 2020: Heading Into The End Game
Chart 32Swiss Bonds Are A Lose-Lose Proposition
Swiss Bonds Are A Lose-Lose Proposition
Swiss Bonds Are A Lose-Lose Proposition
The lower bound of interest rates is another reason to avoid these markets. This floor seems to lie around -1% in nominal terms. Because of these constraints, in recent months, Swiss, Swedish, Dutch and German 10-year bonds have failed to rally as much as their higher-yielding US, Canadian or Australian counterparts when global yields are declining. However, they also underperform when yields are rising (Chart 32). They have become a lose-lose proposition. The only pockets of value left in DM bond markets are Greece, Portugal or Italy. Despite their apparent risks, we still like them. Support for the euro in Greece and Italy is 70% and 65%, respectively. Even populist governments in these nations are reluctant to attack euro membership anymore. Moreover, the ECB remains committed to the survival of the euro area in its current form. Christine Lagarde will not change that. For 2020 or 2021, the risk of euro breakup is practically zero. The same may not be true on a 5- to 10-year investment horizon, but for the coming year, these bonds offer an attractive risk-adjusted carry. Ms. X: Unsurprisingly, my father does not like corporate bonds because of highly levered corporate balance sheets. I think this is a long-term problem, but not a risk for 2020, so I’m looking to stay overweight spread product relative to Treasuries. Where do you stand on this market? BCA: On this issue, we sit somewhere between you both. Our Corporate Health Monitor continues to deteriorate (Chart 33). The high debt load of the US business sector coupled with the decline of the return on capital worries us. Furthermore, the covenant-lite trend in recent issuance suggests that corporate borrowers, not lenders, are getting the good deals. Essentially, too much cash is still chasing too little available yield pick-up. In this environment, capital is sure to be misallocated, and money ultimately lost. We find the reward-to-risk tradeoff more attractive in Europe and Japan than in emerging markets. On a short-term basis, the spreads will not widen much. An easy Fed, recovering global growth, and the gigantic pile of negative-yielding bonds around the world will make sure of that. We advocate a neutral stance on investment grade corporates because IG bonds have high modified duration such that breakeven spread compensation versus Treasuries is near the bottom of its historical distribution across the IG credit spectrum (Chart 34). This means that credit will generate poor returns if government bond yields rise. Chart 33Dangerous Long-Term Picture For US Corporates
A Precarious Long-Term Picture For US Corporates
A Precarious Long-Term Picture For US Corporates
Chart 34No Value Left In IG
No Value Left In IG
No Value Left In IG
Chart 35EMs Still Experiencing Deflation
EMs Still Experiencing Deflation
EMs Still Experiencing Deflation
Thankfully, they are ways around this problem: emphasizing exposure to high-yield (HY) bonds and agency mortgage-backed securities (MBS) instead. HY breakeven spreads remain much more attractive than in the IG space, and option-adjusted spreads will benefit if our growth and inflation forecasts materialize. Investors reluctant to commit capital to these products should look into high quality agency MBS. After the recent wave of mortgage refinancing, these securities’ duration has collapsed to 3.0 compared to 7.9 for IG corporates. These securities therefore offer much better protection in a rising-yield environment. Ms. X: Before we move on to equities, where do you stand on EM bonds? BCA: We need to differentiate between EM local-currency bonds and EM USD-denominated bonds. We do like some EM local currency bonds. Inflation in EM countries is low and dropping. Money and credit growth is slowing, which implies that the disinflationary trend will remain in place through 2020 (Chart 35). Weaker nominal growth means that central banks in EM will continue to cut rates, providing a nice tailwind for local-currency bond prices. This comes with a caveat. Lower policy rates will boost bond prices but hurt EM currencies, especially because most EM currencies are not cheap and are already over-owned. Next year, it will be preferable to garner exposure to those countries interest rate moves via the swap market rather than the cash bond market. Chart 36The Mexican Peso Is Cheap
The Mexican Peso Is Cheap
The Mexican Peso Is Cheap
There are some exceptions, like Mexico. The MXN is already very cheap because of fears surrounding the economic policies of President Andres Manual Lopez Obrador (AMLO) (Chart 36). However, we doubt he will turn out to be as dangerous as feared. Hence, MXN Mexican bonds are attractive to foreign investors in unhedged terms. We are currently avoiding EM USD-denominated debt, corporate and sovereign. Since emerging markets sport $5.1 trillion of dollar-denominated debt, falling EM exchange rates will increase the cost of servicing this debt, which makes it riskier. Mr. X: I think we will continue to underweight corporate and EM bonds in our fixed income portfolio. Spread levels still make no sense in terms of providing compensation for credit risk. I must admit that I find your recommendation to overweight MBS intriguing. We will need to ponder this idea further. Ms. X: And please wish me luck trying to convince my father to buy some high-yield bonds. Equity Market Outlook Mr. X: US stocks are too expensive for my taste, with the S&P 500 trading at a forward P/E ratio of 18. I’m well aware of the argument that equities may be expensive but that they are actually cheap compared to bonds, which implies that I should favor stocks over bonds. However, you know that I emphasize capital preservation. With stocks this rich already, equities offer no margin of safety. If I own stocks, I am therefore exposed to any unexpected shocks. Because I do not share your optimism on the economy, I am more worried about downside risk. Moreover, even if the economy performs better than I fear, I suspect stocks will respond poorly to higher yields. Chart 37The S&P Is Very Expensive
The S&P Is Very Expensive
The S&P Is Very Expensive
Ms. X: I agree with my father that stocks are expensive. Nonetheless, as Keynes famously quipped, “Markets can stay irrational longer than you can stay solvent.” In today’s context, to me this means that stocks can ignore their overvaluation so long as liquidity is plentiful, rates are low, and a recession is avoided. BCA: On this question, we agree with Ms. X. We all agree that US equities are expensive. As you mentioned, their price-to-earnings ratio is 18. Only at the apex of the tech bubble and in early 2018 was the S&P 500 more expensive. Worryingly, the price-to-sales ratio is at 2.3, an even larger historical outlier than the P/E (Chart 37). Chart 38Low Yields And Plentiful Liquidity Are Still Fertile Ground For Stocks
Low Bond Yields And Plentiful Liquidity Are Still Fertile Ground For Stocks
Low Bond Yields And Plentiful Liquidity Are Still Fertile Ground For Stocks
Ms. X is correct that we cannot look at stock valuations in isolation. Investing is about opportunity cost and the macroeconomic context. On this front, even US equities have their merit. Despite the S&P 500’s expensive multiples, our Composite Valuation Indicator is no more elevated than it was in 2013. Meanwhile, our Monetary Indicator has rarely been as supportive of stock prices as it is today, and our Speculation Indicator is in line with its January 2016 reading (Chart 38). Moreover, BCA’s Composite Sentiment indicator is still below its long-term historical average and margin debt has declined by $47.5 billion to the lowest share of US market capitalization since June 2005. These are hardly signs of irrational exuberance. Ultimately, bear markets and recessions travel together. A durable 20% drop in stock prices requires a significant and long-lasting decline in earnings. These developments happen during recessions (Chart 39). Our call is for a recession in the next 24 months or so. We must also remember that while equities perform poorly six months ahead of a recession, the end of a bull market, its last 12 to 18 months, tend to be very rewarding (Table 3). We are within this window. Chart 39Bear Markets And Recessions Travel Together
Bear Markets And Recessions Travel Together
Bear Markets And Recessions Travel Together
Table 3The End Game Can Be Rewarding
OUTLOOK 2020: Heading Into The End Game
OUTLOOK 2020: Heading Into The End Game
Based on our forecast for interest rates, we do not share the concerns that rising bond yields will topple stocks right away. Stock prices are an inverse function of risk-free rates, but a positive function of growth expectations. Higher yields will initially reflect stronger growth, not restrict it. But remember: the upside for yields is limited because central banks do not want to choke off the recovery. They will maintain accommodative policy. In other words, we expect real rates to lag behind growth expectations. Because long-term growth expectations, whether from sell-side analysts or extracted out of market prices using the Gordon Growth Model, are low, we are willing to make this bet (Chart 40). Equities will suffer if the global bond yield rises above 2.5%. This is more a story for 2021, and not our central scenario for 2020. It is nonetheless a reminder that we are entering the end game of the business cycle, so we are also entering the end-game of the bull market. Mr. X: I think you are playing with fire. Stocks are so expensive that if you are wrong on either the growth call or the yield call, they will suffer. I would rather miss the last melt-up in stocks than unnecessarily expose my portfolio to a meltdown. Additionally, you have not addressed the fact that S&P 500 margins have begun to soften but are still extremely elevated. Shouldn’t this dampen your optimism? BCA: Aggregate S&P 500 margins have some downside. Our Composite Margin Proxy, Operating Margins Diffusion index and Corporate Pricing Power indicator all remain weak (Chart 41). The deceleration in the crude PPI excluding food and energy and the past strength in the dollar confirm this insight, especially as the corporate wage bill climbs in a tight labor market. The biggest mitigating factor is that productivity is also on the mend, which curbs the negative impact of higher worker pay. Chart 40Growth Expectations Are Muted
Profit Growth Expectations Are Muted
Profit Growth Expectations Are Muted
Chart 41US Margins Under Pressure
US Margins Under Pressure
US Margins Under Pressure
This danger must be put into perspective though. Margin expansion has been dominated by the tech sector (Chart 42). Excluding this industry, S&P 500 margins are roughly in line with their previous peak, and are not declining. The aggregate softness in margins is a reflection of the sharper decline in tech margins. Declining margins do not spell the imminent end of the bull market either. Table 4 shows that on average, the S&P 500 rises by 9.5% following the peak in margins. Equities can rise after margins crest because this is often an environment where wages are climbing, which boosts consumption. Consequently, top-line growth can accelerate and earnings can rise even if they represent a lower proportion of sales. This is the environment we foresee over 2020. Chart 42Tech Margins Have Likely Peaked
Tech Margins Have Likely Peaked
Tech Margins Have Likely Peaked
Table 4Margin Peaks Do Not Spell S&P Doom
OUTLOOK 2020: Heading Into The End Game
OUTLOOK 2020: Heading Into The End Game
Chart 43Taiwanese Stocks Are Sniffing Out Better Global Growth
Taiwanese Stocks Are Sniffing Out Better Global Growth
Taiwanese Stocks Are Sniffing Out Better Global Growth
Ms. X: You have talked about the tech sector being a drag on overall margins. How would you position a US stock portfolio? BCA: First, around the world, we prefer cyclical sectors to defensive ones. Cyclical stocks are depressed relative to defensive firms’ shares. Rebounding global growth and rising bond yields will favor cyclical sectors. Globally, the performance of cyclical equities relative to defensive ones correlates with Taiwanese equities, which are currently rallying smartly (Chart 43). This suggests that at the margin, the most cyclical asset markets are beginning to express optimism about global growth. Within the S&P 500, our favorite pair trade to express this bias is to overweight energy stocks at the expense of utilities. Utilities are bond proxies which will substantially underperform energy stocks when the rate of change of Treasury yields moves up (Chart 44). Moreover, based on our valuation indicators, energy stocks have never traded at such a deep discount to utilities, nor have they ever been as oversold. Chart 44Favor Energy Over Utilities
Favor Energy Over Utilities
Favor Energy Over Utilities
Second, we are currently neutral on tech stocks but have put them on a downgrade alert. Tech equities are expensive, trading at a forward P/E ratio 21% above the other cyclicals. Moreover, since software spending has remained surprisingly resilient despite the global economic slowdown, it will likely lag investment in machinery and structures when industrial demand rebounds. Consequently, tech earnings will lag other traditional cyclical sectors. Tech multiples will also suffer when bond yields rise. As high-growth stocks, tech equities derive a large proportion of their intrinsic value from long-term deferred cash flows and their terminal value. Thus, tech multiples are highly sensitive to changes in the discount rate We implement this view by way of an underweight in tech and an overweight to industrials. Industrials have suffered disproportionately from the trade war. Any near term truce is unlikely to contain a grand bargain on intellectual property rights transfer that galvanizes tech exports, but it will remove some of the uncertainty weighing on industrials. Moreover, industrials are a much cheaper play on a global growth rebound. The global manufacturing slowdown has caused industrial equities to trade at their greatest discount to the tech sector since the financial crisis. Finally, the wage bill for the industrial sector is melting relative to tech, and our margin proxy is surging (Chart 45). This has created a very positive backdrop for this pair trade. We also like financials. They will be a key beneficiary of rising yields and a steepening yield curve. Additionally, household credit demand has picked up and overall credit growth should accelerate as central banks will maintain very accommodative monetary conditions. The yield impulse already points toward higher bank credit growth and companies are issuing an increasingly large stock of bonds (Chart 46). Chart 45Operating Metrics Will Boost Industrials Versus Tech Equities
Operating Leverage Will Boost Industrials Versus Tech Equities
Operating Leverage Will Boost Industrials Versus Tech Equities
Chart 46Easing Financial Conditions Will Support Credit Creation
Easing Financial Conditions Will Support Credit Creation
Easing Financial Conditions Will Support Credit Creation
Ms. X: When combining valuation analysis with your fundamental sectoral slant, I am guessing that you must favor European, Japanese and EM stocks over the S&P 500? BCA: We do favor European and Japanese equities. Based on valuation alone, all the regions you mentioned offer higher expected long-term real rates of return than the US (Chart 47). Moreover, the dollar is expensive relative to advanced economies’ currencies. Hence, these markets are cheaper vehicles than the S&P 500 to bet on a global economic recovery. But valuation alone is not enough. US stocks are trading at unprecedented levels relative to global equities because of the FAANG craze (Chart 48). Looking at sector representation, our positive view on non-tech cyclicals also flatters exposure to Europe and Japan (Table 5). Chart 47Non US Equities Offer Better Value
OUTLOOK 2020: Heading Into The End Game
OUTLOOK 2020: Heading Into The End Game
Chart 48FAANG-Driven US Outperformance
FAANG-Driven US Outperformance
FAANG-Driven US Outperformance
Table 5Equity Market Sector Composition
OUTLOOK 2020: Heading Into The End Game
OUTLOOK 2020: Heading Into The End Game
Chart 49European Banks Are Cheap
European Banks Are Cheap
European Banks Are Cheap
Europe is particularly attractive because of its large skew towards industrials and financials, which represent 32.3% of the market versus 22.3% in the US. Moreover, European financials are also a tantalizing bet because they trade at a 50% discount to US financials, according to their price-to-book ratio. Additionally, their return on tangible equity will benefit from higher German yields, easing financial conditions, declining non-performing loans in the periphery and rebounding global growth. Our RoE model for European banks already points to a resurgence in their stock prices (Chart 49). Of the major markets we track, Japan offers the highest prospective long-term real returns. Its strong cyclical slant and low share of tech stocks means it is another market investors should overweight to bet on a global recovery. The biggest problem for Japanese equities is the yen. When global yields climb higher, a weak JPY will clip some of the Nikkei’s gains for foreign investors. Finally, we are reluctant to overweight EM stocks just yet. In this space, median P/E ratios are much higher than on a market capitalization-weighted basis (Chart 50). State-owned companies explain this bifurcation, Chinese banks in particular. Since we expect Chinese banks to remain a conduit for policy, credit origination may flatter economic growth more than shareholders’ interests. Moreover, we have a negative outlook on EM currencies, and hedging this exposure is expensive. Finally, if China’s economic activity improves only modestly in 2020, the 2012 experience suggests that EM stocks can still underperform the global equity universe as global growth improves and yields rise (Chart 51). In other words, we find the reward-to-risk tradeoff more attractive in Europe and Japan than in emerging markets. Chart 50EM Stocks Are No Bargain Yet
EM Stocks Are No Bargain Yet
EM Stocks Are No Bargain Yet
Chart 51EM Stocks Can Underperform When Global Growth Improves
EM Stocks Can Underperform Even When Global Growth Improves
EM Stocks Can Underperform Even When Global Growth Improves
Mr. X: Thank you. I am still not sure what share of our portfolio will be dedicated to stocks. However, I think that whatever this proportion will be, buying global equities makes more sense than US ones. Your valuation argument alone is swaying me, considering my more conservative instincts. Ms. X: I’m glad we will not have to argue on this point, but I know we will nonetheless battle on the stock/bond/gold split. Should we move on to your currency and commodity forecasts? BCA: It would be our pleasure. Currencies And Commodities Mr. X: You have often argued that the dollar is a countercyclical currency. Based on our discussion so far, you must expect the dollar to decline until we get closer to the next recession. I am not fully convinced. Specifically, I remember that in the back half of 2016 global growth was rebounding, but the dollar soared. Therefore, the growth/dollar relationship can be more complex than you argue. Meanwhile, with negative interest rates in Europe, Japan and Switzerland, why would I even consider divesting out of my positive yielding dollar assets? Chart 52The Dollar Is A Counter Cyclical Currency
The Dollar Is A Counter Cyclical Currency
The Dollar Is A Counter Cyclical Currency
BCA: You raise interesting questions, and you are correct that we expect the dollar to depreciate if our constructive view on global growth pans out for 2020. The inverse relationship between global industrial production (excluding the US) and the trade-weighted dollar is unambiguous (Chart 52). As you also mentioned, the reality is a little bit more nuanced. To understand why, it is important to remember how currencies function. We can think of an exchange rate as an adjustment mechanism that solves for the gap in growth between any two countries. This is at the root of the dollar’s counter-cyclicality. When global growth is picking up, returns tend to be higher in cyclical markets, which are highly concentrated outside of the US. Flows then gravitate from the US to other markets and the dollar declines. After a while, the dollar becomes cheap enough that these flows reverse. In the second half of 2016, three factors drove the dollar rebound. First, US manufacturing was improving at a faster pace than that of the rest of the world. Second, the Fed resumed its interest rate hikes, so interest rate differentials suddenly flattered the dollar anew. Finally, the election of President Trump, who campaigned on large scale fiscal stimulus, elicited memories of the Reagan dollar bull market of the first half of the 1980s. These factors eventually faded as global growth rebounded. Today, the Fed’s policies are hurting the dollar. Aside from recent interest rate cuts, the Fed has been injecting liquidity into the banking system through repurchase agreements and renewed asset (T-Bills) purchases. Moreover, the rate cuts are also easing global funding conditions and promoting a re-steepening of the yield curve. This will incentivize banks to lend and boost the US money supply. As growth re-accelerates and demand for imports (machinery, commodities, and consumer goods) rises, the current account deficit will widen further. This process will increase the international supply of dollars. Historically, these dynamics usually hurt the dollar. What we have described is a tentative abatement in geopolitical risk at best – but it would be cavalier to get overly enthusiastic. Like you, we are deeply uncomfortable with negative interest rates. Thankfully, the nascent pickup in global economic activity is lifting global bond yields. So far, foreign bond markets have led this move. More specifically, countries that have suffered most from the global manufacturing slowdown are now seeing their bond yields rise the quickest (Chart 53). For example, yields in Germany, Norway, Sweden, Switzerland and Japan have risen by a lot more than those in the US since global yields troughed in September. Should the initial signals of stabilization in global growth morph into a synchronized recovery, the US yield advantage will evaporate. In a nutshell, interest rates might be negative in Europe and Switzerland, but the positive carry offered by US assets is rapidly fading. Chart 53AAre Interest Rate Differentials Flashing A Signal About Exchange Rates?
Are Interest Rate Differentials Flashing A Signal About Exchange Rates?
Are Interest Rate Differentials Flashing A Signal About Exchange Rates?
Chart 53BAre Interest Rate Differentials Flashing A Signal About Exchange Rates?
Are Interest Rate Differentials Flashing A Signal About Exchange Rates?
Are Interest Rate Differentials Flashing A Signal About Exchange Rates?
Chart 54Foreigners Are Selling Treasuries
Foreigners Are Selling Treasuries
Foreigners Are Selling Treasuries
For international investors, the currency risk inherent in owning US bonds is just too large at the current juncture. Remember, the trade-weighted dollar stands 25% above its long-term equilibrium and the US twin deficits are expanding. Markets priced in cheap currencies with some potential upside, such as Australia, Canada, Norway or even the European periphery, might be better bets. Flows highlight just how precarious the situation is for the US dollar. Since last August, overall flows into the US Treasury market have been negative. Net foreign purchases by private investors are still positive at an annualized US$180 billion, but they are clearly rolling over. Moreover, official net outflows are running at $350 billion, easily cancelling out the private sector’s inflows (Chart 54). Essentially, foreigners’ appetite for US fixed-income assets is waning exactly as interest rate differentials have started moving against the dollar. Ms. X: I share my father’s concerns, but how would you implement your negative dollar view. Which currencies should I be loading up on as we enter the business cycle’s end game? BCA: The more export-dependent economies (and currencies) should benefit the most from a rebound in global growth. Within the G-10, we particularly like the Swedish krona, the Norwegian krone and the British pound. Bond yields for these currencies are rising the fastest vis-à-vis the US. As a result, the currencies themselves should soon follow (previously mentioned Chart 53). We also expect commodity currencies to benefit, but only upon clearer signs that the resource-thirsty Chinese economy is improving. Until then, they are likely to lag the pro-cyclical European currencies, which are less directly dependent on Chinese stimulus. The euro could become the greatest beneficiary from a weaker dollar because a large headwind for European economic activity is disappearing for now. For the past ten years, European real interest rates have been too low for the most productive, competitive exporter – Germany – but too high for others such as Spain and Italy. Consequently, the euro has been caught in a tug-of-war between a rising neutral rate of interest for Germany and a very low one for the peripheral economies. Via its rate cuts, asset purchase programs, and aggressive TLTRO packages, the ECB may have now finally eased policy to the point where nearly all Eurozone countries enjoy an accommodative monetary environment. 10-year government bond yields in France, Spain, Portugal and even Italy now all sit close to the neutral rate of interest for the entire eurozone (Chart 55). Chart 55The ECB Has Eased Policy Enough
The ECB Has Eased Policy Enough
The ECB Has Eased Policy Enough
Finally, the euro is likely to benefit from inflows into European equity markets. The euro’s drop since 2018 has eased financial conditions and made euro area businesses more competitive. This is an important tailwind for European corporate profits and thus stocks. Moreover, European equities, especially those in the periphery, remain unloved, as illustrated by their cheap valuations compared to other advanced economies. Additionally, analysts’ earnings expectations for eurozone equities are perking up relative to US stocks. If the sell-side is right, powerful inflows into the region will lift the euro in 2020. Mr. X: Thank you. I find it difficult to share your enthusiasm for the euro, a currency backed by such a flimsy edifice. While I would agree that it could rebound next year, I find currencies highly unpredictable on such a time horizon. I prefer to think about them on a long-term basis, and while the euro is cheap, its weak institutional underpinning is too concerning. Let’s move on to commodities. Following our meeting last year, we took your advice on oil and gold. Overall, these calls helped our portfolio. Going forward, these markets are extremely perplexing. There is so much risk in oil markets, such as the tensions in the Middle East and the uncertainty stemming from the trade war between the US and China. How would you recommend playing the oil market in 2020? Chart 56Inventory Drawdown Will Support Oil
Inventory Drawdown Will Support Oil
Inventory Drawdown Will Support Oil
BCA: Your assessment of these markets is spot on. Yet, price risk is skewed to the upside because fiscal and monetary stimulus will revive commodity demand. The oil-producer coalition led by Saudi Arabia and Russia will continue to restrain production, and will probably extend its 1.2mm b/d production cut due to expire at the end of March to year-end 2020. In the US, market-imposed capital discipline will keep reducing the growth of US shale-oil supply. Additionally, US shale-oil supply growth is threatened by flaring of associated natural gas in the Bakken and Permian basins. Failure to limit the burn-off at oil-production sites could provide the environmental lobby an opening to challenge growth. Ms. X: What about the demand side of the oil markets? The fall in the growth rate of demand this year caught most participants off guard. What do you make of that? BCA: Demand data shows a lot of lingering weakness, much of which was caused by tight financial conditions last year in the US and China. But now, most global central banks are pursuing highly accommodative monetary policy and many governments are also easing fiscal policy. As a result, this demand weakness will fade next year. We think next year growth will clock in at 1.4mm b/d. Not as robust as 2017, but still respectable. This should stop the downward pressure on oil prices that has prevailed since May (Chart 56). Mr. X: You’re describing a fairly strong market for next year. What are the downside risks to your view? BCA: Global economic policy uncertainty remains elevated. Uncertainty is one of the key factors driving demand for USD, which is one of the most popular safe havens in the world (Chart 57). A strong dollar creates a headwind for commodity demand. It raises the local-currency costs of consumers in the EM economies that drive oil demand, and lowers production costs outside of the US, encouraging supply growth at the margin. Chart 57Elevated Global Economic Uncertainty Has Kept The USD Well Bid
OUTLOOK 2020: Heading Into The End Game
OUTLOOK 2020: Heading Into The End Game
Chart 58Gold: A Valuable Portfolio Hedge
OUTLOOK 2020: Heading Into The End Game
OUTLOOK 2020: Heading Into The End Game
Ms. X: So, pulling it all together, what is your call for 2020? BCA: The weaker 2019 demand data and the upward revisions to global oil inventories pushed our 2020 Brent Oil forecast to $67/bbl from $70/bbl. We still expect WTI to trade at a $4/bbl discount to Brent. As we mentioned earlier, the risk to our forecast is to the upside: a resolution of the US-China trade war, and lower global economic policy uncertainty could trigger a sharp rally in crude prices. Mr. X: Thank you for your insight on oil. I would like to hear your thoughts on gold. You can tell that I see little absolute value in stocks or bonds at the moment, so I have an outsized preference for the yellow metal this year. Also, how could the US dollar and gold both rally at the same time in 2019? BCA: Let’s start with your dollar/gold question. It is very rare to see gold and the dollar rally together. Normally a strong dollar hurts gold. As you know, we’ve been recommending an allocation to gold since 2017, mostly as a portfolio hedge. We like that gold strongly outperforms other safe havens in equity bear markets and can participate in the upside (even if to a limited extent) in bull markets. We think the safe-haven properties of gold and the US dollar really have come to the fore over the past couple of years (Chart 58). Economic policy uncertainty, and divisive politics globally have raised the level of uncertainty to record levels. In such an environment, the dollar and gold both provide a safe haven and a portfolio hedge. Hence, their joint popularity this past year. We should also remember that gold is a good inflation hedge, and is particularly negatively correlated with real interest rates. A Fed that is willing to let the economy overheat is a Fed that will limit how high real rates climb. Moreover, global liquidity is plentiful. Finally, EM central banks have been slowly divesting from Treasuries and diversifying into gold lately, buying most of the new supply in the process. This backdrop, along with our forecast of a weaker dollar, should support gold again in 2020. That being said, because gold is tactically overbought and could face temporary headwinds if global uncertainty recedes, we prefer silver, which is not as stretched. Furthermore, silver’s higher industrial use means that it should also benefit from a global manufacturing recovery. Geopolitics Chart 59Multipolarity Creates An Unstable Environment
Multipolarity Creates An Unstable Environment
Multipolarity Creates An Unstable Environment
Mr. X: Let’s return to geopolitical and policy risks, both of which abound. Global economic policy uncertainty is the highest it has been since academics began measuring it. The world is fraught with populism, authoritarianism, war, immigration, technological disruption, inequality, and corruption. With so much chaos, and so little consensus, is there anything solid for an investor to grasp about the political backdrop next year? BCA: Geopolitics is the likeliest candidate to short circuit this long bull market, given that the Federal Reserve, the usual culprit, has paused its rate tightening campaign. On a secular basis, geopolitical risk is rising because the United States’ national power is declining relative to that of other world powers (Chart 59). China’s rise, in particular, is stirring conflict with the US and its allies in the western Pacific. Beijing’s technological and military advance is generating fear across the American political establishment. Russia and China continue to deepen their relationship in the face of an increasingly unpredictable United States. These strategic tensions will persist despite any tariff ceasefire with China. Chart 60Globalization Has Peaked
Globalization Has Peaked
Globalization Has Peaked
Competition among the great powers makes for a world of contested authority. As the rules of the road have become less certain, the tailwind behind international trade and investment has weakened (Chart 60). Deglobalization is a headwind for the earnings of large cap global companies in the long run. Emerging markets, which are exposed to trade, face persistent unrest. Mr. X: Given the above, how can an investor take an optimistic view of the global economy and markets next year? BCA: We have a framework for analyzing politics: constraints over preferences. We cannot predict what the chief politicians will prefer at any given time, but we can try to identify and measure the constraints that will restrict their freedom of movement. With global growth slowing, world leaders have become more sensitive to their constraints. The Fed has reversed rate hikes; China is easing policy; President Trump has refrained from attacking Iran; and President Trump and President Xi are negotiating a ceasefire. The UK has avoided a “no deal” Brexit – not once but twice. In short, the risk of recession (or conflict) has been sufficient to alter the policy trajectory. As a result, there is a prospect for global geopolitical risks to abate somewhat in 2020. Both the American and Chinese administrations need to see growth stabilize despite their ongoing strategic conflict. Both the British and European governments need to avoid a disorderly Brexit despite their lack of clarity beyond that. Geopolitical risk is declining, albeit from an extremely elevated level. Mr. X: The US and China have already come close to a deal only to get cold feet and back away from it. The British Prime Minister is committed to leaving the EU with or without a deal. Surely you cannot believe that the Middle East, Russia, other emerging markets, or North Korea will be any bastion of stability. BCA: The US-China trade war is still the single greatest threat to the equity bull market. Brexit is not resolved and a new deadline for a trade deal looms at the end of 2020. Investors must remain vigilant and hedge their portfolios, particularly with gold. Nevertheless, one cannot ignore this year’s reaffirmation of the Fed put, the China put, and Trump’s “Art of the Deal.” The base case for next year should be constructive, albeit with vigilant attention to the major risks: President Trump, China and Iran. The other issues you mention have varying degrees of market relevance. Russia is focusing on pacifying domestic discontent. North Korea is on a diplomatic track with the United States. Emerging market unrest is particularly relevant where it can have a bearing on global stability: Iraq, Iran and Hong Kong in particular. Ms. X: If I may interject: It seems to me that the worst of the trade war has passed, that the risk of a no-deal Brexit is negligible, and that Iran is unlikely to outdo its attack against Saudi Arabia in September. Doesn’t this imply that geopolitical risk is overrated and that investors should rush to capture the risk premium in equities? BCA: What we have described is a tentative abatement in geopolitical risk at best – but it would be cavalier to get overly enthusiastic. After all, any fall in global risks will be amply made up for by the impending rise in US domestic political risk. Indeed, US politics are the chief source of global political risk in 2020. First, if President Trump becomes a “lame duck” then he could take actions that are hugely disruptive to global markets in a desperate attempt to win reelection as a “war president.” Chart 61European Political Risk Is Now Low
Europe Political Risk Is Now Low
Europe Political Risk Is Now Low
Second, if President Trump is reelected, then his disruptive populism will have a new mandate and his “America First” foreign and trade policy will be unshackled. Third, if the opposition Democrats succeed in unseating an incumbent president, they will likely take the Senate too, removing the main hurdle to a dramatic policy change. That would mark the third 180-degree reversal in national policy in 12 years. Moreover, investors may find the country merely exchanged right-wing populism for left-wing populism, which has a more negative impact on corporate earnings prospects. Polarization and institutional erosion will continue. The election results may be razor thin; swing states may have to recount votes; and the outcome could hinge on rare or unprecedented developments in the Electoral College, the Supreme Court or cyberspace. A crisis of legitimacy could easily afflict the next administration. In short, there are few scenarios in which US political risk does not rise over the next 12-24 months. Rising American risk stands in stark contrast to Europe (Chart 61), where the will to integrate has overcome several challenges since the sovereign debt crisis. Substantial majority of voters support the euro and the European Union. Germany is on the brink of a major political succession but it is not turning its back on the European project. France is successfully pursuing structural reforms. Italy remains the weakest link, but even the populist Northern League accepts the euro. This leaves two remaining global risks: China and Iran. Chinese political risk is generally understated. President Xi Jinping, lacking President Trump’s electoral constraint, could overestimate his leverage. He could overreach in the trade talks, in his battle to prevent excessive debt growth, or in his handling of Hong Kong, Taiwan, North Korea, or Iran. The result could be a breakdown in the trade talks or a separate strategic crisis with the United States. Another cold war-style escalation in tensions could easily kill the green shoots in global growth. As for Iran, the regime is under crippling American sanctions and faces unrest both at home and within its regional sphere of influence. There is a non-negligible risk that it will lash out and cause an extended oil supply shock. Conclusions Mr. X: This is a good place to conclude our discussion. We have covered a lot of ground but I remain deeply concerned that staying invested in risk assets today is akin to picking-up pennies in front of a steamroller. I accept your opinion that a recession is unlikely in 2020, but valuations of both stocks and bonds are uncomfortably stretched for my taste. As a result, I believe stocks could suffer whether growth is good or bad next year. Finally, since so many things need to go right for the global economy to continue to defy gravity, a recession may hit faster than you envision. To me, there is simply not enough margin of safety in stocks to compensate me for the risk! Ms. X: I agree with my father that the risks are high because we are entering the end game of the cycle. But I also see pockets of value, some of which you have mentioned today. Moreover, I am sympathetic to your view that global growth will recover next year. Corporate earnings should therefore expand. Hence, I fear that being out of the market will be very painful, especially because policy is quite accommodative. While stocks may not perform as well as they did in 2019, I expect them to outperform bonds handily. I’m therefore willing to continue holding risk assets, even if I need to be more judicious in my sector and regional allocation. BCA: Your family debate mirrors our own internal discussions. There is always a trade-off between maximizing short-term returns and taking a longer-term approach. Valuations are the ultimate guidepost for long-term return prospects. Because so many assets have become more expensive this year, long-term returns are likely to be uninspiring compared to recent history. Table 6 shows our baseline calculations of what a balanced portfolio will earn over the coming decade. We estimate that such a portfolio will deliver average annual returns of 4.4% over the next ten years, or 2.4% after adjusting for inflation. That is a noticeable deterioration from our inflation-adjusted estimate of 2.8% from last year, and also still well below the 6.5% real return that a balanced portfolio earned between 1982 and 2019. Table 6Asset Market Return Projections
OUTLOOK 2020: Heading Into The End Game
OUTLOOK 2020: Heading Into The End Game
Our outlook for next year hinges on global growth rebounding and policy uncertainty receding. Monetary policy is less of a threat to equities than it was last year because central banks have already eased considerably and have been very open about their willingness to let inflation run above target for a while before retightening the monetary screws. We propose the following list of easy-to-track milestones to monitor whether or not our central scenario for the global economy and asset markets is playing out, and how close we are to the end of the cycle: Chinese money and credit numbers. Chinese credit growth must stabilize for the economy to do so. If credit origination continues to decelerate, this will indicate that Beijing has decided to tolerate the slowdown and prioritize its reform and deleveraging agenda. In this case, the Chinese debt supercycle is over sooner and the global economy will pay the price. Our China Investment Strategy Activity Index. Global policy is accommodative and liquidity conditions have improved significantly. However, if the Chinese economy continues to deteriorate, global growth will not rebound. The China Activity Index must stabilize and even improve somewhat for our global growth view to come to fruition. Progress in the “phase one” deal. China and the US must agree to a trade détente. As long as uncertainty around immediate tariffs remain high and retaliation risks stay alive, global capital spending intentions and thus the global manufacturing sector will be hamstrung. Surveys of global growth. The Global manufacturing PMI and the global growth expectation component of the ZEW survey must both recover. If these variables cannot gain any traction, the global economy is sicker than we estimate and risk assets will suffer. Commodity prices and the dollar. In the first quarter, industrial commodity prices must rebound and the dollar must start to depreciate. These two developments will not only reflect an improvement in global growth. They will also alleviate deflationary pressures around the world, revive profits and sponsor a business spending recovery. Moreover, a weaker dollar will also ease global financial conditions by decreasing the global cost of capital. 10-year inflation breakeven rate. If US breakevens move above the 2.3% to 2.5% zone, the Fed will become more proactive about raising rates. This would provoke a quicker end to the business cycle. President Trump’s approval rating. If President Trump’s approval rating stabilizes below 42%, he could give up on the economy and instead bet on a “rally around the flag” as his best strategy for re-election. This would result in a much more hawkish and confrontational White House that would become an even greater source of uncertainty for the economy, and thus risk asset prices. Ms. X: Thank you for this comprehensive list of variables to monitor. As always, you have left us with much to think about. We look forward to these discussions every year. Before we conclude, it would be helpful to have a recap of your key views. BCA: It will be our pleasure. The key points are as follow: Global equities are entering the end game of their nearly 11-year bull market. Stocks are expensive, but bonds are even more so. As a result, if global growth can recover and the US can avoid a recession in 2020, earnings will not weaken significantly and stocks will again outperform bonds. Low rates reflect the end of the debt supercycle in the advanced economies. However, the debt supercycle is still alive in EM in general, and in China, in particular. The global economic slowdown that begun more than 18 months ago started when China tried to limit debt growth. If Beijing continues to push for more deleveraging, global growth will continue to suffer as the EM debt supercycle will end. Nonetheless, we expect China to try to mitigate domestic deflationary pressures in 2020. As a result, a small wave of Chinese reflation, coupled with the substantial easing in global monetary and liquidity conditions should promote a worldwide re-acceleration in economic activity. Policy uncertainty will recede next year. Domestic constraints are forcing China and the US toward a trade détente. The risk of a no-deal Brexit is now marginal, and President Trump is still the favorite in 2020. A decline in policy risk will foster a global economic rebound. That being said, some pockets of risk remain, such as in the Middle East. Global central banks are highly unlikely to remove the punch bowl anytime soon. Not only will it take some time before global deflationary forces recede, monetary authorities in the G10 want to avoid the Japanification of their economies. As a result, they are already announcing that they will allow inflation to overshoot their 2% target for a period of time. This will ultimately raise the need for higher rates in 2021, which will push the global economy into recession in late 2021, or early 2022. These dynamics are key to our categorization of 2020 as the end game. US growth will re-accelerate. The US consumer remains in good shape thanks to healthy balance sheets and robust employment and wage growth prospects. Meanwhile, corporate profits and capex should benefit from a decline in global uncertainty and a pick-up in global economic activity. China will continue to stimulate its economy but will not do so as aggressively as it did over the past 10 years. Consequently, EM growth will also bottom but is unlikely to boom. Europe and Japan will re-accelerate in 2020. Bond yields will grind higher in 2020. However, Treasury yields are unlikely to break above the 2.25% to 2.5% range until much later in the year. Inflationary pressures won’t resurface quickly, so the Fed is unlikely to signal its intention to raise interest rates until late 2020 or later. European bonds are particularly unattractive. Corporate bonds are a mixed offering. Investment grade credit is unattractive owing to low option-adjusted spreads and high duration, especially when corporate health is deteriorating. Agency mortgage-backed securities and high-yield bonds offer better risk-adjusted value. Global stocks will enjoy their last-gasp rally in 2020. As global growth recovers, favor the more cyclical sectors and regions which also happen to offer the best value. US stocks are the least attractive bourse; they are very expensive and loaded with defensive and tech-related exposure, two groups that could suffer from higher bond yields. We are neutral on EM equities. Investors should pare exposure to equities after inflation breakevens have moved back into their 2.3% to 2.5% normal range and the Fed funds rate has moved closer to neutral. We anticipate this to be a risk in 2021. The dollar is likely to decline because it is a countercyclical currency. Balance of payment dynamics and valuation considerations are also becoming headwinds. The pro-cyclical European currencies and the euro should be the main beneficiary of any dollar depreciation. Oil and gold will have upside next year. Crude will benefit from both supply-side discipline and a recovery in oil demand on the back of the improving growth outlook. Gold will strengthen as global central banks limit the upside to real rates by allowing inflation to run a bit hot. A weaker dollar will flatter both commodities. A balanced portfolio is likely to generate average returns of only 2.4% a year in real terms over the next decade. This compares to average returns of around 6.5% a year between 1982 and 2019. We would like to take this opportunity to wish you and all of our clients a very peaceful, healthy and prosperous New Year. The Editors November 22, 2019
Highlights Lingering weakness evident in fundamental supply-demand data will fade next year, and with it the downward pressure on oil prices. Price risk is skewed to the upside: Continued monetary accommodation from systematically important central banks and fiscal stimulus will revive oil demand; OPEC 2.0 production restraint and market-imposed discipline in the US will slow the growth of oil supply. Shale-oil supply growth also is threatened by flaring of associated natural gas in the Bakken and Permian basins. Failure to limit the burn-off into the atmosphere at oil-production sites could provide the environmental lobby an opening to challenge growth. Elevated geopolitical tensions cannot be ignored, particularly as economic and political discontent boils over in Iraq and Iran, where leaders could feel compelled to lash out. To the downside, global economic policy uncertainty remains elevated. It continues to keep the USD well bid. This raises consumers’ local-currency costs in the EM economies driving demand growth, and lowers production costs ex-US, incentivizing supply growth at the margin. Weaker 2019 data showing up in demand and upward revisions to inventories pushed our 4Q19 Brent forecast down to $63/bbl from $66/bbl, and our 2020 forecast to $67/bbl from $70/bbl. We continue to expect WTI will trade $4/bbl below Brent. Feature In the multi-level game that drives the political economy of oil, domestic and international factors shaping supply-demand fundamentals are always shifting. As multiple constituencies vie for advantage, market participants will be forced to grapple with the consequences of policies now under consideration. The bullet points above provide a restricted aperture through which to view some of the issues currently in play.1 Markets are responding favorably to the unwinding of tighter global financial conditions this year brought about by tighter US monetary policy last year, and China’s 2017-18 deleveraging campaign. Demand-side impacts of policy shifts and policy signaling remain the most prominent feature of fundamental adjustments markets will continue to grapple with, as fall-out from the Sino-US trade war; political discontent in DM and EM electorates; and ad hoc economic policy raise global economic policy uncertainty. Markets are responding favorably to the unwinding of tighter global financial conditions this year brought about by tighter US monetary policy last year, and China’s 2017-18 deleveraging campaign. This is most visible in our global Leading Economic Indicators (LEIs), particularly in EM economies, although DM demand also looks like it could pick up (Chart of the Week). For the real economy, it is useful to remember Milton Friedman’s “long and variable lags” regarding the effects of monetary policy and how they affect oil markets.2 Chart of the WeekGlobal LEIs Point To Demand Recovery
Global LEIs Point To Demand Recovery
Global LEIs Point To Demand Recovery
Chart 2BCA's EM Commodity-Demand Nowcast Points Toward Upturn in Oil Demand
BCA's EM Commodity-Demand Nowcast Points Toward Upturn in Oil Demand
BCA's EM Commodity-Demand Nowcast Points Toward Upturn in Oil Demand
EM growth is hugely important to global oil-demand growth in our analysis. Our proprietary EM Commodity-Demand Nowcast continues to indicate EM economies are responding to easier global financial conditions (Chart 2).3 Global growth expectations for oil demand are diverging sharply in the lead-up to OPEC 2.0’s December 5 meeting in Vienna. At the low end, the US EIA expects 2019 growth of 760k b/d this year, a sharply lower estimate than the agency’s co-eval institutions; OPEC is closing in on the 1mm b/d growth threshold at 0.98mm b/d, followed by the IEA at 1mm b/d. We lowered our estimate of oil-demand growth this year to 1.1mm b/d, in line with weaker consumption data being reported by these big agencies. Shale-oil production growth faces an additional risk from the flaring of associated natural gas in the Permian and Bakken basins. We are maintaining our expectation for growth of 1.4mm b/d next year, which is close to the EIA’s estimate (Chart 3). The IEA’s estimate for 2020 stays at 1.2mm b/d, while OPEC’s is just under 1.1mm b/d. On the supply side, we expect lower US shale-oil output growth next year. Lower prices, backwardated WTI futures curves – which results in lower forward prices for producers hedging their output – and recalcitrant investors who are unwilling to commit capital to all but the most profitable shale-oil producers will take their toll (Chart 4). As a result, we expect US shale output to reach ~ 9.35mm b/d on average next year in the Big Five basins (Permian, Eagle Ford, Bakken, Niobrara and Anadarko). This leads to an 800k b/d increase in our US lower 48 output over this year’s levels, which is down from our earlier estimate of a 900k b/d increase. Chart 3Stronger Oil Demand, Tighter Supply Will Lift Oil Prices in 2020
Stronger Oil Demand, Tighter Supply Will Lift Oil Prices in 2020
Stronger Oil Demand, Tighter Supply Will Lift Oil Prices in 2020
Chart 4Lower Prices, Backwardated WTI Curve Lead to Lower Rig Count, Shale-Oil Output
Lower Prices, Backwardated WTI Curve Lead to Lower Rig Count, Shale-Oil Output
Lower Prices, Backwardated WTI Curve Lead to Lower Rig Count, Shale-Oil Output
Shale-oil production growth faces an additional risk from the flaring of associated natural gas in the Permian and Bakken basins. Failure to limit the burn-off into the atmosphere at oil-production sites could provide the environmental lobby an opening to challenge growth, as the electorate grows increasingly restive with the practice. Industry officials in Texas and North Dakota – home to the Permian and Bakken plays – already have been sounding the alarm on this issue.4 According to Rystad Energy, flaring reached another record high in the Permian at 752 million cubic feet per day in 3Q19 amid growing oil production. Lastly, we continue to follow events in Iraq and Iran closely where economic and political discontent with the status quo has led to civil unrest. We also are penciling in an extension of OPEC 2.0’s 1.2mm-barrel-per-day output cut to year-end 2020. Over-compliance likely persists, particularly from the Kingdom of Saudi Arabia (KSA). Stronger non-OPEC output from Norway and Brazil offsets this somewhat (Table 1). Table 1BCA Global Oil Supply - Demand Balances (MMb/d, Base Case Balances)
Lingering Oil-Demand Weakness Will Fade
Lingering Oil-Demand Weakness Will Fade
Lastly, we continue to follow events in Iraq and Iran closely where economic and political discontent with the status quo has led to civil unrest. As our colleague Roukaya Ibrahim notes, “The country continues to be plagued by high unemployment, corruption, and an utter lack of basic services … . This has ultimately resulted in a lack of confidence in Iraqi leadership who are being increasingly perceived as benefiting from the status quo at the expense of the populace.”5 There is an underlying tension within the society between Iraqi forces loyal to Iran’s Shia theocracy and Iraqis seeking full autonomy for their country. “The widening rift between the rival Iraqi Shia blocs implies that any détente will be temporary,” according to BCA’s geopolitical strategists. We have consistently maintained markets are too complacent regarding these geopolitical risks, which also encompass US-Iran hostilities in the Persian Gulf. We are reducing our 4Q19 Brent forecast to $63/bbl from $66/bbl, and our 2020 forecast to $67/bbl from $70/bbl. That said, our balances still reflect the lingering demand weakness discussed above, and continue to work through higher inventories. In line with revisions by the EIA to historical inventory levels and lower demand growth, we are reducing our 4Q19 Brent forecast to $63/bbl from $66/bbl, and our 2020 forecast to $67/bbl from $70/bbl (Chart 5). We continue to expect WTI will trade $4/bbl below Brent (Chart 6). Chart 5Storage Revisions Help Weaken Price Forecasts
Storage Revisions Help Weaken Price Forecasts
Storage Revisions Help Weaken Price Forecasts
Chart 6BCA 2020 Oil Price Forecasts Fall Slightly To $67/bbl For Brent, $63/bbl For WTI
BCA 2020 Oil Price Forecasts Fall Slightly To $67/bbl For Brent, $63/bbl For WTI
BCA 2020 Oil Price Forecasts Fall Slightly To $67/bbl For Brent, $63/bbl For WTI
Global Economic Policy Uncertainty Persists While accommodative monetary policy and stimulative fiscal policy will foster a revival in commodity demand, global economic uncertainty remains elevated.6 This risks keeping the broad trade-weighted USD index for goods (TWIBG) well bid (Chart 7). This raises consumers’ local-currency costs in the EM economies driving growth, and lowers production costs ex-US, incentivizing supply growth at the margin. Chart 7Elevated Global Economic Uncertainty Keeps USD Well Bid, Retards Demand
Lingering Oil-Demand Weakness Will Fade
Lingering Oil-Demand Weakness Will Fade
We remain confident the combination of global monetary accommodation and fiscal stimulus will revive commodity demand. However, given the economic uncertainty confronting policymakers globally, this revival likely will be modest. As the multi-level game dominating the evolution of the political economy of the oil market becomes more complex and uncertain – particularly in re the Sino-US trade war and domestic politics in systemically important economies – monetary and fiscal policy have an additional headwind to battle in the attempt to revive aggregate commodity demand. Bottom Line: We remain confident the combination of global monetary accommodation and fiscal stimulus will revive commodity demand. However, given the economic uncertainty confronting policymakers globally, this revival likely will be modest, with oil prices rising ~ 10% next year. That said, if the phase-one Sino-US trade deal leads to a phase-two and –three – i.e., a durable resolution to the trade imbroglio and political discontent roiling markets, the recovery could be more significant.7 Robert P. Ryan Chief Commodity & Energy Strategist rryan@bcaresearch.com Hugo Bélanger Senior Analyst Commodity & Energy Strategy HugoB@bcaresearch.com Market Round-Up Energy: Overweight. Trade-related news continues to drive short-term price movements. On Tuesday, Brent prices fell 2.5% on rising pessimism about the US-China “phase one” deal. On the supply side, OPEC 2.0 countries will meet in early December to assess whether the group should extend – and possibly deepen – output cuts. Russia signaled it is unlikely to support deeper cuts, but appears to be open to extending the current quotas until year-end 2020. Our updated global oil market balances assume OPEC 2.0 will agree to extend the current production curbs. Separately, anti-government protests in Basra, Iraq, are impacting the oil sector. On Monday, protesters reportedly blocked roads leading to the major oil fields and to commodity export terminals. Base Metals: Neutral. Copper prices seem detached from their current fundamentals, moving up and down with expectations related to the US-China trade war and ongoing protests in Chile – the world’s largest copper producer. Negative sentiment has weighed on copper most of this year. Speculative short positioning reached a high of 137k contracts in August, pushing our Copper Composite Indicator into “oversold” territory. Going forward, the metal’s fundamentals will support higher prices; quarter-to-date copper prices increased 3.5%. Global visible copper inventories resumed their downward trend in 2H19 – reaching a 10-year low. We expect global growth to pick up in the coming months – led by emerging economies. Risks are skewed to the upside. Precious Metals: Neutral. Gold prices recovered to $1475/oz after trading close to our $1450/oz stop-loss last week. Slightly weaker real rates in the US and ratcheted-up trade tensions supported the yellow metal’s price this week. Over the short term, prices could be pushed lower as markets await positive developments re a Sino - US trade agreement. Ags/Softs: Underweight. Corn futures traded lower earlier in the week, but rebounded slightly Tuesday after the USDA Crop Progress reported the harvest rate for it was 76%, which was below analysts’ expectations of 77% and well below the five-year average of 92%. Wheat performed better, marking a 0.9% weekly increase in March futures on the back of a lower percentage of the crop being rated good or excellent by the USDA. Finally, soybeans were flat throughout the week but fell almost 0.8% on Wednesday, amid reports that a phase-one trade deal between US and China may not be completed by the end of 2019. Footnotes 1 Understanding and balancing these interests is difficult, as is forecasting outcomes. Please see Robert D. Putnam, “Diplomacy and Domestic Politics: The Logic of Two-Level Games,” International Organization, Vol. 42, No. 3 (Summer, 1988). 2 Friedman’s classic paper, “The Lag in Effect of Monetary Policy,” appeared in the Journal of Political Economy, Vol. 69, No. 5 (Oct., 1961). Our own research suggests these lags range from six to 18 months in commodity markets. 3 Our EM Commodity-Demand Nowcast uses our Global Industrial Activity (GIA) Index, and our Global Commodity Factor (GCF) and EM Import Volume (EMIV) models to characterize the current state of commodity demand. The GIA index uses trade data, FX rates, manufacturing data, and Chinese industrial activity statistics to gauge current global industrial activity, which is highly correlated with trade-related activity. The GCF uses principal component analysis to distill the primary driver of 28 different commodity prices traded globally. Lastly, the EMIV model is driven by EM import volumes, which are highly correlated with income; as income rises, oil demand – and commodity demand in general – rises. Please our report entitled Global Financial Conditions Support Higher Commodity Demand, which was published October 31, 2019, for additional discussion. It is available at ces.bcaresearch.com. Concerns over associated natural-gas flaring into the atmosphere are rising in the shale-oil community, as political discontent with the practice grows. Please see Gas Flaring “Running Rampant” In The Permian, published by oilprice.com, and New Initiative will Map and Measure Methane Emissions Across the Permian Basin, a press release issued by the Environmental Defense Fund outlining their initiative to install methane emissions-monitoring gear around the Permian to begin logging the massive amount of flaring in that basin. According to the Oil & Gas Journal, “… collective volumes of flared and vented gas from (the Permian and Bakken) basins up to about 1.15 bcfd. For comparative purposes, that represents 12 billion cu m/year of wasted gas, which exceeds the yearly gas demand of nations such as Israel, Colombia, and Romania.” Please see Permian gas flaring, venting reaches record high published by the OGJ June 4, 2019. Please see Permian gas flaring reaches yet another high, published by Rystad Energy on its website November 5, 2019. 4 S&P Global Platts posted an interesting podcast on its website featuring an interview with Lynn Helms, director of the North Dakota Department of Mineral Resources. He said flaring in the Bakken – where production is hitting record highs – will force state regulators to throttle back on the rate of shale-production growth beginning in 2Q20, when growth could slow substantially if gas-capture technologies are not deployed. Growth could remain subdued for 2020-21, he said. Please see North Dakota’s record oil growth to be upended by flaring rules, posted November 18, 2019. 5 Please see Iraq's Challenge To Iran Is Underrated, published by BCA Research’s Geopolitical Strategy November 8, 2019. It is available at gps.bcaresearch.com. 6 We measure uncertainty using the Baker-Bloom-Davis Global Economic Policy Uncertainty (GEPU) index. This is a GDP-weighted index of newspaper headlines containing a list of words related to economic policy uncertainty, which are found in newspapers and articles online from 20 countries representing almost 80% of global GDP are scoured for reports reflecting economic uncertainty. Please see our October 17 and October 31, 2019, reports Policy Uncertainty Lifts USD, Stifles Global Oil Demand Growth and Global Financial Conditions Support Higher Commodity Demand for the original research on this topic. Both are available at ces.bcaresearch.com. 7 This is not our base case. Our geopolitical strategists expect a temporary ceasefire in the trade war, but doubt that a “grand compromise” leading to a new period of US-China economic engagement will emerge from the negotiations. Strategic tensions will keep rising on a secular basis between the two countries. Please see BCA’s Geopolitical Strategy weekly report entitled How Much To Buy An American President? – GeoRisk Update: October 25, 2019. It is available at gps.bcaresearch.com Investment Views and Themes Recommendations Strategic Recommendations Tactical Trades TRADE RECOMMENDATION PERFORMANCE IN 2019 Q3
Lingering Oil-Demand Weakness Will Fade
Lingering Oil-Demand Weakness Will Fade
Commodity Prices and Plays Reference Table Trades Closed in 2019 Summary of Closed Trades
Lingering Oil-Demand Weakness Will Fade
Lingering Oil-Demand Weakness Will Fade
Highlights Stock markets are set to produce low single digit returns in 2020. Favour stocks over bonds and cash, especially where bond yields are zero or negative – specifically, Germany, Switzerland, and Sweden. Underweight zero and negative yielding high-quality bonds versus higher yielding bonds – for example, underweight Swiss bonds versus US T-bonds. Favour lower yielding currencies because the central bank loses the ability to depress its own currency. For 2020, our preferred expression of this is long SEK/USD. The biggest risk in 2020 is if the global bond yield were to rise towards 2.5 percent exposing the fragility of risk-asset prices to higher bond yields. The $400 trillion global risk-asset edifice dwarfs the $80 trillion global economy by five to one. Fractal trade: Short Ireland (ISEQ 20) versus Europe (Stoxx Europe 600). Feature For all the talk of economic growth driving stock markets, the big story through 2018-19 has been bond yields driving stock markets. This is true in Europe as well as more broadly – and it is very easy to demonstrate by decomposing the stock market price into its two components: the underlying profits (earnings per share) and the valuation multiple paid for those profits (Chart of the Week). Chart of the Week2018 And 2019 Were All About Valuations. What About 2020?
2018 And 2019 Were All About Valuations. What About 2020?
2018 And 2019 Were All About Valuations. What About 2020?
2018 And 2019 Were All About Valuations Contrast 2018-19 with 2017. In 2017, the stock market’s stellar return came almost entirely from growth – profits surged while the multiple drifted sideways. But in 2018 and 2019, the story was all about valuation multiples – profits drifted sideways while the multiple plunged in 2018, and then symmetrically surged in 2019 (Chart I-2 and Chart I-3). Chart I-2Decomposing Stock Market Performance...
Decomposing Stock Market Performance...
Decomposing Stock Market Performance...
Chart I-3...Into Valuation And Profits
...Into Valuation And Profits
...Into Valuation And Profits
The cause of the stock market multiple contraction and re-expansion was the dramatic swing in bond yields. This is hardly surprising given that the prospective return on bonds drives the prospective return on competing long-duration assets, like equities and real-estate. Higher bond yields require a higher prospective return on equities, meaning a lower valuation multiple, while lower bond yields require a higher valuation multiple. In driving the swing in bond yields, the principal player was the Federal Reserve. Again, this is hardly surprising given that the ECB and BoJ are stuck on the side lines with monetary policy already locked at ‘maximum accommodative’, while the Fed can still move the lever in both directions. The cause of the stock market multiple contraction and re-expansion was the dramatic swing in bond yields. Through 2018-2019, the 10-year T-bond yield took a round trip from around 2 percent to 3.3 percent and then down again to around 2 percent where it stands today. This explains the mirror-image round trip in the stock market’s multiple: from 16 down to 13 and then back up again to 16 where it stands today (Chart I-4). Chart I-4The Round Trip In The T-Bond Yield Explains The Round Trip In The Stock Market's Valuation
The Round Trip In The T-Bond Yield Explains The Round Trip In The Stock Market's Valuation
The Round Trip In The T-Bond Yield Explains The Round Trip In The Stock Market's Valuation
Admittedly, the Fed’s dramatic pivot was influenced by the trade war, and the perceived threat to global growth. But two other considerations loomed large: the persistent undershoot of inflation versus its 2 percent target; and the fragility of risk-asset valuations – and thereby financial conditions – to higher bond yields. Bear in mind that the value of global risk-assets at over $400 trillion now dwarfs the $80 trillion global economy by a factor of five to one. So the main danger is not that economic imbalances and fragilities will drag down the financial markets; the main danger is that financial market imbalances and fragilities will drag down the economy – as we painfully felt in 2000, 2007, and 2011. The Valuation And Growth Outlook In 2020 The two key investment questions for 2020 are: What will happen to bond yields, and what will happen to stock market profits? Starting with bond yields, most of the major central banks are, to repeat, out of play. Leaving the Fed as the principal player. But at the last press conference, Jay Powell, made it crystal clear that the Fed is also out of play for the time being, at least when it comes to raising rates. “We've just touched 2 percent core inflation, and then we've fallen back. So, I think we would need to see a really significant move up in inflation that's persistent before we even consider raising rates to address inflation concerns.” Reinforcing this, Powell also hinted at introducing a potential ‘tolerance band’ around the 2 percent inflation target – perhaps 1.5-2.5 percent – before the central bank would need to react. “We're also, as part of our review, looking at potential innovations… changes to the framework that would be more supportive of achieving inflation on a symmetric 2 percent basis over time… these changes to monetary policy frameworks don't happen really quickly (but)… I think we'll wrap it up around the middle of next year. I've some confidence in that.” What about profits – could 2020 be a repeat of the 2017 stellar growth story? No, there are two reasons why it will be very difficult to repeat the 2017 story on profits. The two reasons come from the two components of profits: sales and profit margins. Unlike in 2017, global sales will not start 2020 at the very depressed levels from which they can play a very strong catch-up. The first reason is that, unlike in 2017, global sales will not start 2020 at the very depressed levels from which they can play a very strong catch-up (Chart I-5). Significantly, the recession in global sales through 2015-16 was comparable to that suffered in 2008-09. The 2015-16 recession just hasn’t been well documented because it was essentially an emerging markets recession rather than the developed market recession of 2008-09. Chart I-5Global Sales Are Not Depressed
Global Sales Are Not Depressed
Global Sales Are Not Depressed
The second reason is that today’s profit margins are still close to their structural and cyclical peak; whereas at the start of 2017, they were at a cyclical low (Chart I-6). Chart I-6Profit Margins Are Elevated
Profit Margins Are Elevated
Profit Margins Are Elevated
Hence, the two components of profits – sales and profit margins – will start 2020 at elevated levels. The upshot is that profits can grow in 2020, but the growth will be pedestrian at best. Let’s summarise some of the key investment messages for 2020. High quality bond yields that are near the lower bound of -1 percent cannot go much lower, but those yields in the region of 2 percent cannot go significantly higher. It follows that fixed-income investors should underweight zero and negative yielding bonds versus higher yielding bonds – for example, underweight Swiss bonds versus US T-bonds. In a negative growth shock, T-bonds can still offer substantial capital gains but Swiss bonds cannot. For currencies, it is the opposite message. Favour lower yielding currencies because the central bank loses the ability to depress its own currency. For 2020, our preferred expression of this is long SEK/USD. Stock markets are set to produce low single digit returns. This is uninspiring, but in a world of low prospective returns from all major asset-classes, favour stocks over bonds and cash. This is especially true in those regions and countries where bond yields are zero or negative – specifically, Germany, Switzerland, and Sweden. Today’s profit margins are still close to their structural and cyclical peak The biggest risk to this view is if the global bond yield were to rise towards 2.5 percent exposing the fragility of the risk-asset edifice to higher bond yields. To repeat, the value of global risk-assets, at over $400 trillion, dwarfs the $80 trillion global economy. So the biggest risk comes from the valuation of global financial markets, it does not come from the global economy. More About Price To Sales Having completed our 20 paragraphs on 2020, we would like to follow up on the analysis in last week’s report: Are European Stocks Attractive? To recap, we found that price to sales is the stock market valuation metric that has the best predictive power for prospective returns – because unlike other metrics such as assets, profits, and cash flow, sales are quantifiable, unambiguous, and undistorted by profit margins. In last week’s report our prospective return forecasts were based on price to sales data sourced from Thomson Reuters. To which, several clients asked if the analysis would be the same using the price to sales data sourced from MSCI (Chart I-7). The answer is broadly yes. Chart I-8-Chart I-10 illustrate that: Chart I-7Despite The US, Germany, And Japan Trading On Different Valuations...
Despite The US, Germany, And Japan Trading On Different Valuations...
Despite The US, Germany, And Japan Trading On Different Valuations...
Chart I-8...The Prospective Return From The US Is Low Single Digit...
...The Prospective Return From The US Is Low Single Digit...
...The Prospective Return From The US Is Low Single Digit...
Chart I-9...The Prospective Return From Germany Is Low Single Digit...
...The Prospective Return From Germany Is Low Single Digit...
...The Prospective Return From Germany Is Low Single Digit...
Chart I-10...The Prospective Return From Japan Is Low Single Digit...
...The Prospective Return From Japan Is Low Single Digit...
...The Prospective Return From Japan Is Low Single Digit...
First, despite vastly different stock market valuations in Germany, Japan, and the US, the implied prospective 10-year annualised returns are almost identical. Second, the implied prospective returns from the MSCI calculated price to sales are slightly lower than from the Thomson Reuters data, because current MSCI valuations are closer to the dot com bubble peak. Third, this just reinforces the point that stock market valuations are very fragile to higher bond yields, as already discussed in our preceding 20 paragraphs on 2020. Fractal Trading System* This week we note that the strong outperformance of the Irish stock market is vulnerable to a correction based on its broken 65-day fractal structure. Accordingly, this week’s recommended trade is short Ireland (ISEQ 20) versus Europe (Stoxx Europe 600). Set the profit target and symmetrical stop-loss at 4 percent. In other trades, we are pleased to report that long gold versus nickel achieved its 11 percent profit target and is now closed. For any investment, excessive trend following and groupthink can reach a natural point of instability, at which point the established trend is highly likely to break down with or without an external catalyst. An early warning sign is the investment’s fractal dimension approaching its natural lower bound. Encouragingly, this trigger has consistently identified countertrend moves of various magnitudes across all asset classes.
ISEQ 20 Vs. STOXX EUROPE 600
ISEQ 20 Vs. STOXX EUROPE 600
The post-June 9, 2016 fractal trading model rules are: When the fractal dimension approaches the lower limit after an investment has been in an established trend it is a potential trigger for a liquidity-triggered trend reversal. Therefore, open a countertrend position. The profit target is a one-third reversal of the preceding 13-week move. Apply a symmetrical stop-loss. Close the position at the profit target or stop-loss. Otherwise close the position after 13 weeks. Use the position size multiple to control risk. The position size will be smaller for more risky positions. * For more details please see the European Investment Strategy Special Report “Fractals, Liquidity & A Trading Model,” dated December 11, 2014, available at eis.bcaresearch.com. Dhaval Joshi Chief European Investment Strategist dhaval@bcaresearch.com Fractal Trading System Cyclical Recommendations Structural Recommendations Closed Fractal Trades
2020 In 20 Paragraphs
2020 In 20 Paragraphs
2020 In 20 Paragraphs
2020 In 20 Paragraphs
2020 In 20 Paragraphs
2020 In 20 Paragraphs
2020 In 20 Paragraphs
2020 In 20 Paragraphs
Trades Closed Trades Asset Performance Currency & Bond Equity Sector Country Equity Indicators Bond Yields Chart II-1Indicators To Watch - Bond Yields
Indicators To Watch - Bond Yields
Indicators To Watch - Bond Yields
Chart II-2Indicators To Watch - Bond Yields
Indicators To Watch - Bond Yields
Indicators To Watch - Bond Yields
Chart II-3Indicators To Watch - Bond Yields
Indicators To Watch - Bond Yields
Indicators To Watch - Bond Yields
Chart II-4Indicators To Watch - Bond Yields
Indicators To Watch - Bond Yields
Indicators To Watch - Bond Yields
Interest Rate Chart II-5Indicators To Watch - Interest Rate Expectations
Indicators To Watch - Interest Rate Expectations
Indicators To Watch - Interest Rate Expectations
Chart II-6Indicators To Watch - Interest Rate Expectations
Indicators To Watch - Interest Rate Expectations
Indicators To Watch - Interest Rate Expectations
Chart II-7Indicators To Watch - Interest Rate Expectations
Indicators To Watch - Interest Rate Expectations
Indicators To Watch - Interest Rate Expectations
Chart II-8Indicators To Watch - Interest Rate Expectations
Indicators To Watch - Interest Rate Expectations
Indicators To Watch - Interest Rate Expectations
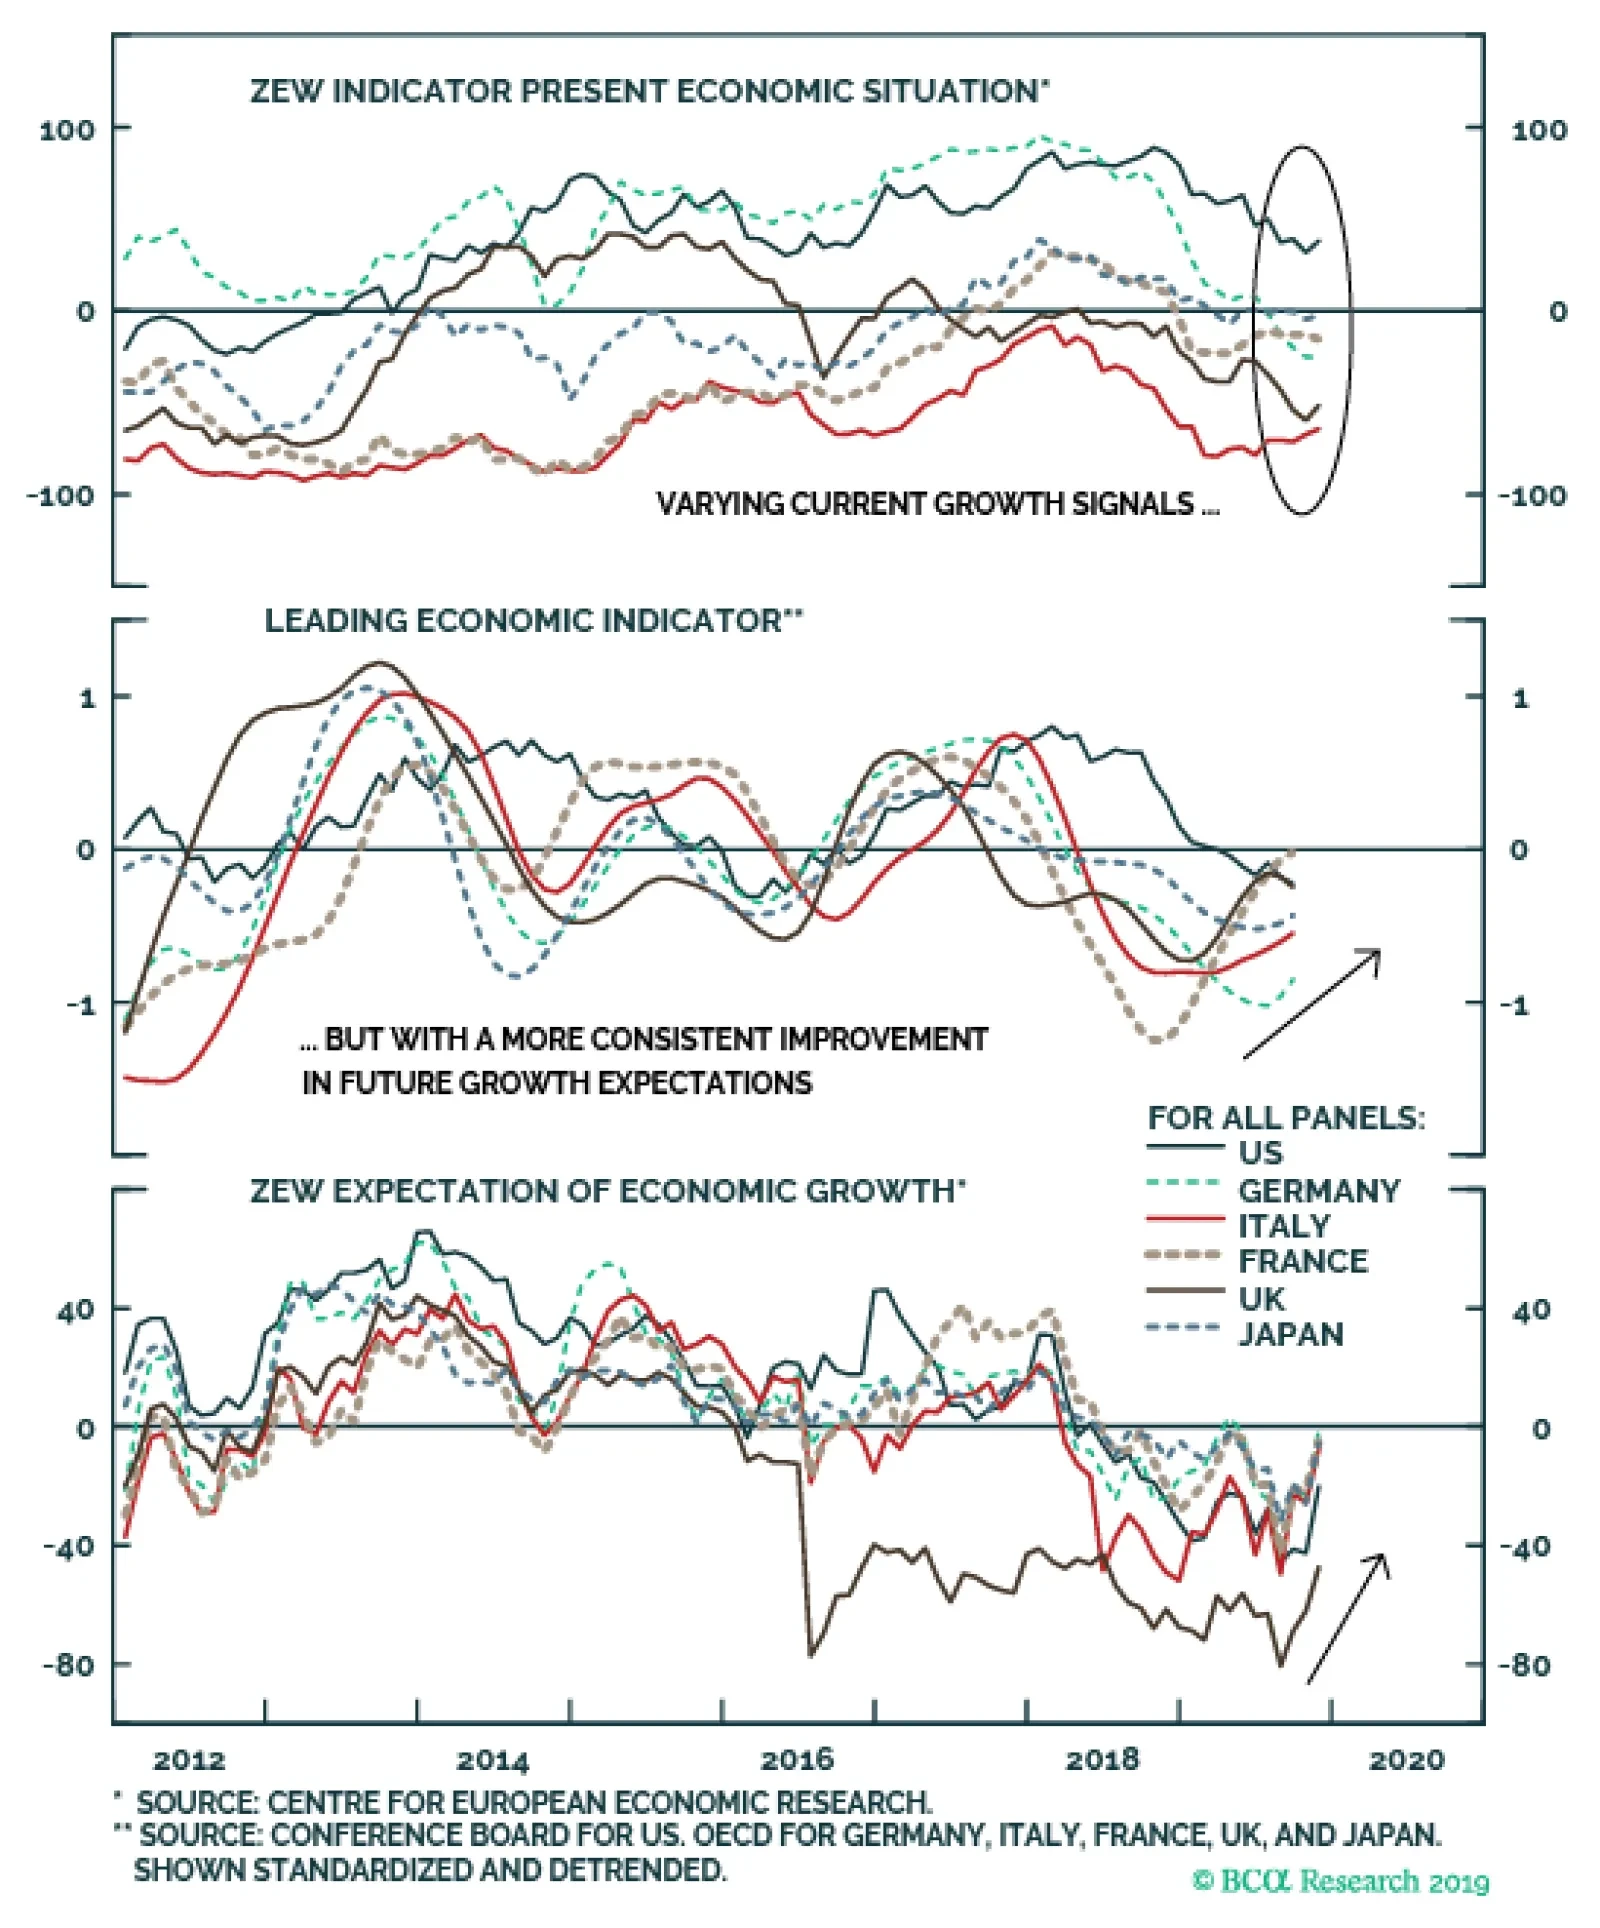
The lagging performance of the DM component of our global LEI is consistent with the more subdued signals from the individual DM country data. The US LEI continues to drift lower, while the LEIs within the euro area for Germany, Italy and (most notably)…
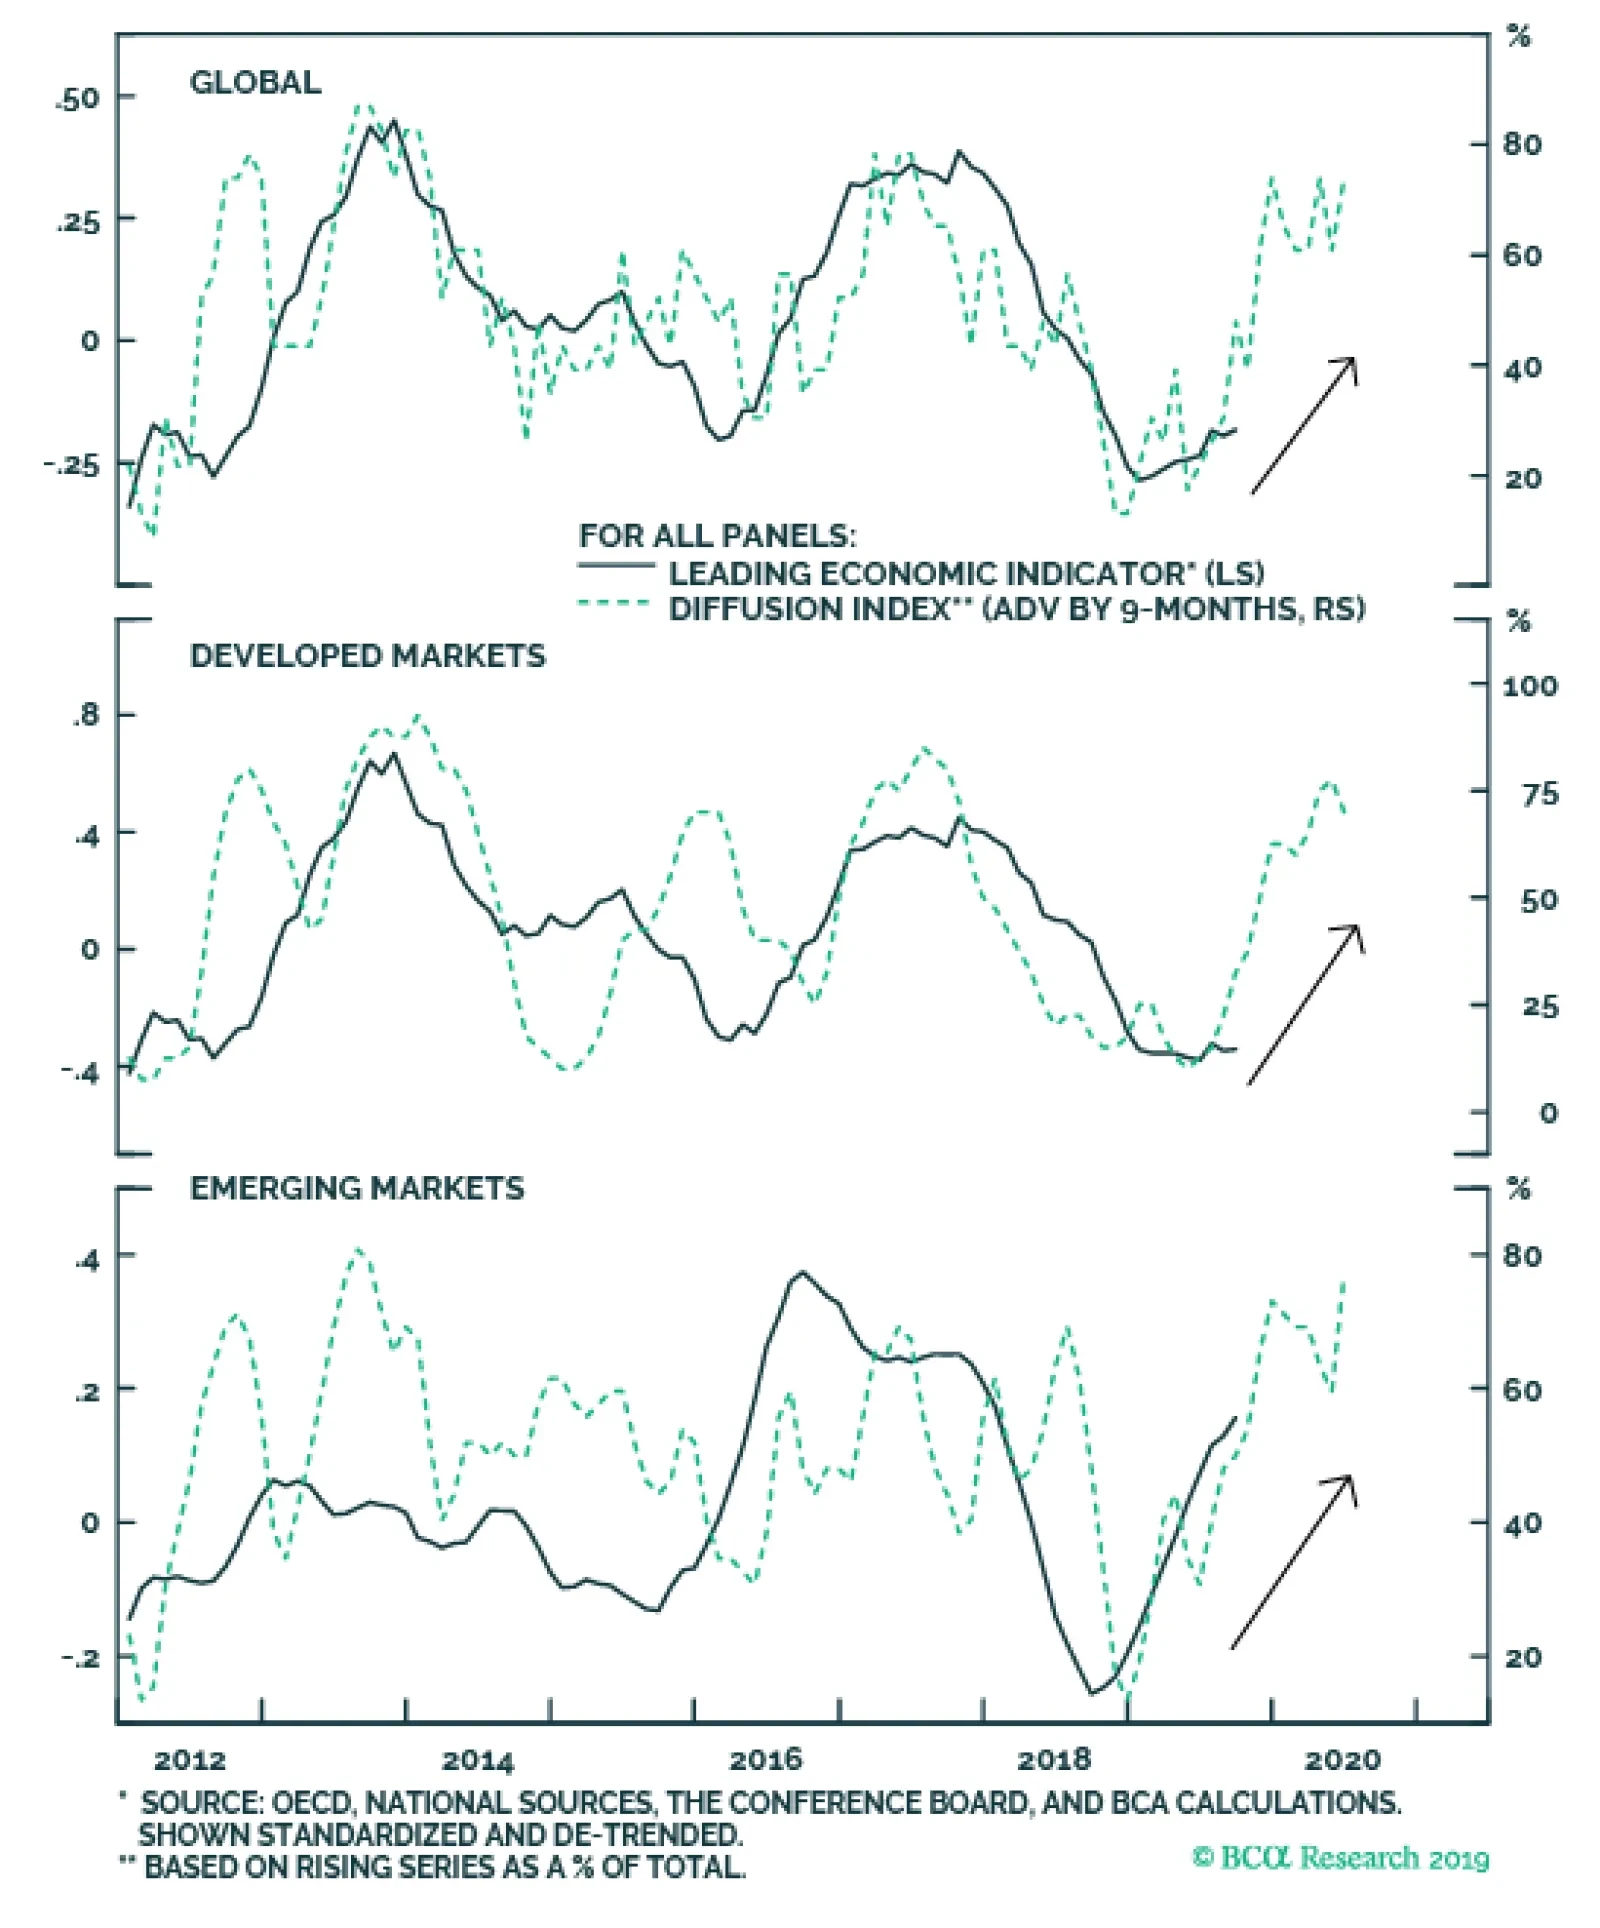
The improvement in our global LEI is broad based. The diffusion index (i.e. the share of countries with a rising LEI) shows that around 75% of the countries in the global LEI are experiencing improving economic activity. Importantly, that share is consistent…
Highlights Global Growth: The latest readings from our global leading economic indicator and the global ZEW index show further improvement in growth momentum. Maintain a below-benchmark stance on global duration, favoring inflation-linked bonds/swaps over nominal bond exposure, while positioning for steeper government bond yield curves. New Zealand: The RBNZ is likely done cutting rates, amid signs that the momentum is bottoming for both growth and inflation in New Zealand. Take profits on our long-standing recommended NZ-US and NZ-Germany 5-year government bond spread trades. Feature Investors have a lot of information to process at the moment. The daily ebb and flow of headlines on the US-China trade negotiations remains the biggest source of intraday volatility. Yet there are also mixed signals coming from economic data releases. “Soft” survey data like global manufacturing PMIs are showing some improvement, while “hard” measures of economic activity like export volumes and capital goods orders continue to languish in both the developed and emerging economies. As we have discussed in recent reports, these sorts of cross-currents are typical at cyclical inflection points. “Hard” data is reported with a lag after “soft” data, making the latter a better indicator of future economic activity than exports or fixed investment data (or even GDP data) that can be several months old once reported, reducing their market-moving relevance. The indicators that we trust the most are sending a bullish message on growth – and a bearish message for government bonds. When global growth is in the process of bottoming, as appears to be the case now, leading economic indicators are more reliable guides to follow for investment decision-making. To that end, the indicators that we trust the most are sending a bullish message on growth – and a bearish message for government bonds. The Latest From Our Global LEI & Global ZEW Chart of the WeekMore Cyclical Upward Pressure On Bond Yields
More Cyclical Upward Pressure On Bond Yields
More Cyclical Upward Pressure On Bond Yields
We received updates on two of our most reliable indicators – our global leading economic indicator (LEI) and the global ZEW expectations index – last week. Both showed broad-based improvement, highlighting that the sharp downward momentum in global growth seen over the past year is in the process of bottoming out. The global LEI and the global ZEW index are key inputs into our Duration Indicator, which has historically led developed market bond yields by between six and nine months (Chart of the Week). The Duration Indicator bottomed back in January of this year and, right on cue, the yield on the Bloomberg Barclays Global Treasury Index has gone up 28bps from the low seen on September 3. The improvement in our global LEI is also broad based. The diffusion index (i.e. the share of countries with a rising LEI) shows that around 75% of the countries in the global LEI are experiencing improved economic activity. Importantly, that share is consistent across both the developed market (DM) and emerging market (EM) nations in the indicator, heralding a synchronized improvement in global growth. (Chart 2). In absolute level terms, however, the EM sub-component of our global LEI has shown the most dramatic improvement over the past several months, compared to the DM sub-index that is only in the process of bottoming out. The EM index is boosted by improvements in large economies like China and Mexico – countries that have seen significant easing of monetary policy and financial conditions over the past 6-9 months. At the same time, the lagging performance of the DM component of our global LEI is consistent with the more subdued signals to date from the individual DM country data. The US LEI continues to drift lower, while the LEIs within the euro area for Germany, Italy and (most notably) France have all been moving higher (Chart 3). Even the Japan and UK LEIs have picked up a bit, although both remain at only moderate levels. At the same time, the expectations components of the individual country ZEW surveys have all begun to increase (bottom panel), despite more mixed performance within the current conditions components of the same ZEW survey (top panel). Chart 2Our Global LEI Continues to Climb, Led By EM
Our Global LEI Continues to Climb, Led By EM
Our Global LEI Continues to Climb, Led By EM
Chart 3A Mixed Bag Of DM Growth Indicators
A Mixed Bag Of DM Growth Indicators
A Mixed Bag Of DM Growth Indicators
Without a doubt, a reduction of US-China trade tensions would flatter the bullish growth signals seen in the global LEI and ZEW indices. Yet the turn in these indicators is so consistent, across so many countries, that we suspect it has more to do with the easier monetary policies, and the associated loosening of financial conditions, that have taken place in response to the uncertainty over global trade. The turn in these indicators is so consistent, across so many countries, that we suspect it has more to do with the easier monetary policies, and the associated loosening of financial conditions, that have taken place in response to the uncertainty over global trade. Taken together, these signals are all bond-bearish, on the margin. The diffusion index of our global LEI has proven to be an excellent leading indicator of the real component of DM bond yields, leading the latter by around one year, and is pointing to higher yields ahead (Chart 4). At the same time, the inflation expectations component of DM yields (measured using CPI swaps rates) is also expected to drift higher in the next 6-12 months, led by firmer oil prices and some softening of the US dollar. Global central banks will maintain a dovish bias over at least the first half of 2020, to ensure that there is enough positive growth momentum to push inflation expectations back up towards policymaker targets. This means that there can be some modest bear-steepening of government bond yield curves across the major DM nations over the next 6-9 months (Chart 5), as policymakers will not begin to raise policy interest rates too soon. Chart 4Global Yields Moving Higher For The Usual Reasons
Global Yields Moving Higher For The Usual Reasons
Global Yields Moving Higher For The Usual Reasons
Chart 5Higher Inflation Expectations = Steeper Yield Curves
Higher Inflation Expectations = Steeper Yield Curves
Higher Inflation Expectations = Steeper Yield Curves
Chart 6Global Yields Starting To Climb Above Moving Averages
Global Yields Starting To Climb Above Moving Averages
Global Yields Starting To Climb Above Moving Averages
The notable exception is the UK. Inflation expectations there are already elevated due to Brexit uncertainty, which has depressed the pound and reduced UK productivity growth while forcing the Bank of England to maintain highly accommodative monetary policy – all factors that should result in higher UK inflation, both realized and expected. Yet even there, the nominal Gilt curve has been bear-steepening of late, alongside the similar trends seen in the other major DM countries like the US and Germany. The move upward in global bond yields suggested by our most reliable leading indicators suggests more of a slow grinding increase in yields (through higher inflation expectations) rather than a rapid acceleration of real rates. The latter would require a shift towards more hawkish central bank monetary policies, which will not happen before there is a sustained pickup in both growth momentum and inflation expectations. The Federal Reserve is the central bank that is likely to lead that transition, but not until late in 2020 and perhaps not until after the November US presidential election. At the country level, the move upward in yields since the early September lows has begun to take out some technical targets (Chart 6). The benchmark 10-year government bond yield is above the 100-day moving average for the major DM countries (the US, Germany, UK, Japan, Canada and Australia). The 200-day moving averages represent the next key resistance level for those markets. The 10-year yield in Japan has already breached that level, perhaps signaling that similar breakouts are on the way in other major markets. Bottom Line: The latest readings from our global leading economic indicator and the global ZEW index show further improvement in growth momentum. Maintain a below-benchmark stance on global duration, favoring inflation-linked bonds/swaps over nominal bond exposure, while positioning for steeper government bond yield curves. Time To (Finally) Take Profits On Our New Zealand Spread Trades We have been structurally positive on New Zealand (NZ) government bonds since mid-2017. This was originally a shorter-term “tactical” view based on expectations that the Reserve Bank of New Zealand (RBNZ) would be forced to keep policy rates steady due to sub-par domestic economic growth and sluggish inflation. Since this was occurring at a time of improving global economic growth in 2017, especially in the US and euro area, we expressed our view as spread trades between 5-year government bonds in NZ versus equivalent maturity debt in the US and Germany (hedged back into US dollars and euros, respectively). The “tactical” trade turned into a medium-term recommendation, as the NZ economy and inflation slowed more than expected. NZ government bonds significantly outperformed global peers as a result, helping boost the returns on our recommended trades. The 5-year NZ-US yield spread has fallen from +74bps when we first initiated the trade to -52bps today, while the spread for 5-year NZ-Germany has narrowed from +292bps to +171bps (Chart 7). We now see several good reasons to take profits on those long-standing positions: NZ economic growth is set to improve The year-over-year growth rate of real GDP in NZ has slowed from 3.1% in mid-2017 (when we initiated our spread trades) to 2.1% in the Q2/2019 (Chart 8). This has occurred in both the manufacturing and services sides of the economy, based on the sharp drop in the PMIs (middle panel). Export growth has also slowed, particularly during the recent global manufacturing downturn, leading to sharp declines in business confidence and capital spending plans. The economic weakness was enough to push NZ real GDP growth below the rate of potential GDP - which is estimated by the RBNZ to have fallen from 3% to 2.5% due primarily to slowing population growth related to reduced net immigration into the country. Chart 7NZ Bonds Have Solidly Outperformed
NZ Bonds Have Solidly Outperformed
NZ Bonds Have Solidly Outperformed
Chart 8NZ Growth Should Soon Bottom Out
NZ Growth Should Soon Bottom Out
NZ Growth Should Soon Bottom Out
The long slump in NZ manufacturing appears to have ended, however. The manufacturing PMI index jumped 3.8 points to 52.6 in October, with the New Orders component rising 5.3 points to 56.2. This pushed the New Orders-to-Inventories ratio – a leading indicator of overall NZ business sentiment – to the highest level since March 2017 (bottom panel). The domestic side of the NZ economy is also set to improve (Chart 9). Consumer spending has been weighed down by both the structural factor of slowing immigration and the cyclical factor of slowing house prices. Median NZ house price growth has perked up of late, however, in response to the RBNZ’s rate cuts this year, which should help boost consumer spending through wealth effects. Business investment should also start to speed up as manufacturing activity improves, especially with the terms of trade (relative prices of NZ exports to imports) now starting to accelerate (middle panel). The external side of the economy is also set for some improvement. In the November 2019 RBNZ Monetary Policy Statement (MPS) published last week, the central bank laid out a very cautious forecast for an increase in the GDP growth of NZ’s trading partners in 2020 (bottom panel). The sharp pickup in the EM component of our global LEI, however, suggests that global growth, and demand for NZ exports, may be much stronger than the central bank envisions next year. NZ’s economy is running at close to full capacity In the November MPS, the RBNZ also presented its own estimates for spare capacity in the NZ economy, using a variety of economic models for both the output gap and the full employment “NAIRU” (Chart 10). The median estimate of the output gap models is around 0% and is expected to stay around those levels for the next two years. The NZ unemployment rate is projected to be stable around 4% through 2020, which is close to the median model estimate of NAIRU. Thus, by the central bank’s own reckoning, the NZ economy is running at full capacity. Chart 9An Upside Growth Surprise In 2020?
An Upside Growth Surprise In 2020?
An Upside Growth Surprise In 2020?
Chart 10NZ Does Not Need More Rate Cuts
NZ Does Not Need More Rate Cuts
NZ Does Not Need More Rate Cuts
The RBNZ also produces model estimates of the neutral level of its policy rate, the Overnight Cash Rate (OCR). The current OCR of 1.0% is at the low end of the range of model estimates (bottom panel). This seems inconsistent with an economy that may be operating with no spare capacity, as the RBNZ’s other models suggest. Those models appear to be giving an accurate read on the inflationary tendencies of the NZ economy, though. Underlying NZ inflation is accelerating While headline CPI inflation fell to 1.5% in Q3/2019, close to the bottom of the RBNZ’s 1-3% target band, core CPI inflation accelerated to 1.9% - just below the midpoint of the band (Chart 11). The decline in headline inflation can be attributed to weakness in the tradeables component of the CPI, but this should soon start to increase based on the lagged impact of the acceleration of energy prices denominated in NZ dollars (middle panel). With both growth and inflation dynamics now bottoming out in NZ, the RBNZ’s recent rate cuts may be working too well. Meanwhile, non-tradeables (i.e. domestically generated) CPI inflation has accelerated over the past few quarters and is now at 3.2% - above the top end of the RBNZ inflation band. This has occurred alongside an acceleration of average hourly earnings growth to 4.2%, suggesting a tight labor market that confirms the message from the RBNZ’s NAIRU models. NZ monetary conditions are now very easy With both growth and inflation dynamics now bottoming out in NZ, the RBNZ’s recent rate cuts may be working too well. The central bank also produces estimates of the neutral real rate in NZ, using the same “r*” framework used by the US Federal Reserve (Chart 12). The neutral real rate is estimated to be 1.25% which, when added to the 2% midpoint of the RBNZ’s target band, produces a neutral nominal rate of 3.25% - a whopping 225bps above the current OCR rate. Chart 11NZ Inflation Bottoming Out
NZ Inflation Bottoming Out
NZ Inflation Bottoming Out
Chart 12NZ Monetary Conditions Now Appear Too Easy
NZ Monetary Conditions Now Appear Too Easy
NZ Monetary Conditions Now Appear Too Easy
With rates so far below neutral in nominal terms, it is no surprise that the NZ dollar is at such low levels versus both the US dollar and the euro (bottom panel). This is providing an additional easing of monetary conditions that will help boost NZ growth and inflation over at least the next year – and likely force the RBNZ to stop cutting rates and, perhaps, even begin to lay the groundwork for taking back some of the 2019 rate reductions. In sum, the combination of improving growth momentum, accelerating inflation dynamics, loose monetary policy settings, and overvaluation make a powerful case for closing out our NZ-US and NZ-Germany spread trades at a healthy profit. NZ yields look too low versus the US and Germany Our fair value regression models for both the 5-year NZ-US spread (Chart 13), and the 5-year NZ-Germany spread (Chart 14), are both signaling that NZ government bonds are relatively expensive. These models estimate the fair value of the spreads as a function of relative central bank policy rates, relative unemployment rates and relative inflation rates. Both models suggest that the cross-country yield spreads have tightened too much relative to the economic fundamentals of NZ, the US and Germany. Chart 13NZ Government Bonds Look Expensive Versus US Treasuries ...
NZ Government Bonds Look Expensive Versus US Treasuries ...
NZ Government Bonds Look Expensive Versus US Treasuries ...
Chart 14... And German Government Debt
... And German Government Debt
... And German Government Debt
In sum, the combination of improving growth momentum, accelerating inflation dynamics, loose monetary policy settings, and overvaluation make a powerful case for closing out our NZ-US and NZ-Germany spread trades at a healthy profit (see the Tactical Overlay Trade table on Page 16). Bottom Line: The RBNZ is likely done cutting rates, amid signs that the momentum is bottoming for both growth and inflation in New Zealand. Take profits on our long-standing recommended NZ-US and NZ-Germany 5-year government bond spread trades Robert Robis, CFA Chief Fixed Income Strategist rrobis@bcaresearch.com Recommendations The GFIS Recommended Portfolio Vs. The Custom Benchmark Index
When In Doubt, Trust The Leading Indicators
When In Doubt, Trust The Leading Indicators
Duration Regional Allocation Spread Product Tactical Trades Yields & Returns Global Bond Yields Historical Returns
Highlights Duration: The bond market’s bearish trend remains intact, but suffered a hiccup last week as some economic data disappointed. Our sense is that the worst of the global growth slowdown is over, but a rebound in our preferred global growth indicators – Global Manufacturing PMI, US ISM Manufacturing PMI and CRB Raw Industrials index – is necessary to push bond yields higher. We expect that such a rebound will transpire in the coming months. The Credit Cycle & Inflation: Low inflation expectations will keep monetary policy accommodative for the next 6-12 months. This justifies a positive outlook for spread product excess returns. Eventually, inflation will return and force the Fed to adopt a more restrictive stance. This will lead to the end of the credit cycle. We will get more defensive on spread product when long-maturity TIPS breakeven inflation rates move above 2.3%. Municipal Bonds: The main issues facing municipal bonds are long-run in nature, mostly related to underfunded state & local government pensions. These concerns are propping up yield ratios at the long-end of the muni curve, but aren’t likely to cause a wave of ratings downgrades until revenue growth slows during the next downturn. For the time being, investors can grab an attractive after-tax yield premium in long-maturity munis. Hiccups Judging by the bond market, recession fears appear to have peaked in late August. Since then, the Treasury index has lost 2.1% versus a position in cash and the 2/10 yield curve is 23 bps steeper (Chart 1). Curve steepening has also occurred via the real yield curve, while the breakeven inflation curve is moderately flatter, consistent with our expectations.1 However, this bearish bond market trend suffered a set-back last week. The 10-year yield fell 10 bps, back down to 1.84%, and the 2-year yield fell 7 bps to 1.61%. The move was driven by an increase in skepticism about the US and China’s “phase 1” trade deal and some mixed economic data. Both industrial production growth and capacity utilization remain well above their 2016 lows, consistent with stronger PMIs. October’s Industrial Production report was the worst of last week’s data releases. Production declined 0.8% on the month and capacity utilization fell from 77.5% to 76.7% (Chart 2). The data were significantly influenced by the General Motors strike, but the index still fell 0.5% with motor vehicles and parts stripped out. In our prior discussions of the divergence between “hard” and “soft” economic data, we pointed to relatively strong industrial production as a reason to expect a snapback in depressed manufacturing PMIs.2 This month’s weak print challenges that view, though both industrial production growth and capacity utilization remain well above their 2016 lows, consistent with stronger PMIs. The New York Fed’s Manufacturing PMI also came in roughly flat last week, and continues to point to a rebound in the national index (Chart 2, bottom panel). Chart 1Bumps On The Road ##br##To Higher Yields
Bumps On The Road To Higher Yields
Bumps On The Road To Higher Yields
Chart 2Disappointing Data, But Well ##br##Above 2016 Lows
Disappointing Data, But Well Above 2016 Lows
Disappointing Data, But Well Above 2016 Lows
October’s retail sales were also released last week, and we continue to observe a wide divergence between strong consumer spending growth and falling consumer confidence (Chart 3). As with the divergence between industrial production and the manufacturing PMI, we suspect that negative sentiment about the US/China trade war has unduly depressed consumer and business sentiment. Sentiment should rebound if trade tensions ease in the coming months, as we expect. Finally, we note that the CRB Raw Industrials index remains downbeat (Chart 4). We should continue to view the recent increase in bond yields as tenuous until it is confirmed by a rebound in this global growth bellwether. Chart 3Retail Sales Still Strong
Retail Sales Still Strong
Retail Sales Still Strong
Chart 4Waiting On The CRB Index To Rebound
Waiting On The CRB Index To Rebound
Waiting On The CRB Index To Rebound
Bottom Line: The bond market’s bearish trend remains intact, but suffered a hiccup last week as some economic data disappointed. Our sense is that the worst of the global growth slowdown is over, but a rebound in our preferred global growth indicators – Global Manufacturing PMI, US ISM Manufacturing PMI and CRB Raw Industrials index – is necessary to push bond yields higher. We expect that such a rebound will transpire in the coming months. Inflation Will End The Cycle … But Not Anytime Soon As global growth improves during the next few months and recession fears fade into the background, discussion will once again turn toward questions about how much longer the credit cycle can run, and what will ultimately bring it to an end. On the first question, we find the slope of the yield curve to be an excellent indicator of the age of the cycle. Specifically, we like to split each cycle into three phases based on the slope of the 3-year/10-year yield curve: 3 Phase 1 starts at the end of the last recession and ends when the 3/10 slope flattens to below 50 bps. Phase 2 encompasses the period when the slope is between 0 bps and 50 bps. Phase 3 begins when the 3/10 slope inverts and ends at the start of the next recession. We expect Phase 2 to persist for some time given that inflation expectations remain downbeat. Table 1 shows that corporate bond excess returns are highest in Phase 1, when the yield curve is steep and spreads are tightening quickly. Excess returns tend to remain positive in Phase 2, but are much lower. Excess returns don’t usually turn negative until after the yield curve inverts and we enter Phase 3. Table 1Corporate Bond Performance During The Three Phases Of The Yield Curve Cycle
When To Worry About Inflation
When To Worry About Inflation
Though some segments of the yield curve inverted in August, we do not think that the cycle has transitioned into Phase 3. The inversion was quite brief, and the measure we employ in our analysis – the monthly average of daily closing values of the 3-year/10-year slope – never broke below zero. The 3-year/10-year slope is currently +23 bps. We expect the current Phase 2 environment to persist for some time, and consequently, corporate bonds will deliver small positive excess returns relative to Treasuries. The reason why we expect Phase 2 to persist for some time is that inflation expectations remain downbeat (Chart 5). Both the 10-year and 5-year/5-year forward TIPS breakeven inflation rates are well below the 2.3%-2.5% range that is consistent with the Fed’s target. This means that the Fed has every incentive to maintain an accommodative monetary policy until inflation expectations are re-anchored. An accommodative policy stance will prevent the yield curve from inverting for any sustained period of time. Chart 5The Re-Anchoring Process Will Take Time
The Re-Anchoring Process Will Take Time
The Re-Anchoring Process Will Take Time
The upshot is that a re-anchoring of TIPS breakeven inflation rates will be an important signal for us to get more defensive on corporate credit. When the 10-year and 5-year/5-year forward TIPS breakeven inflation rates move above 2.3%, the Fed will have less incentive to maintain an accommodative stance. The pace of tightening will likely quicken, leading to a sustained curve inversion and a transition into Phase 3 of the cycle. How Long Until Inflation Expectations Are Re-Anchored? Given our framework for thinking about the age of the cycle, the big question for our corporate credit call is: How long until inflation expectations are re-anchored? We have previously demonstrated that inflation expectations adapt to changes in the actual inflation data, and that this adaptive process occurs very slowly.4 Note that our Adaptive Expectations Model puts fair value for the 10-year TIPS breakeven inflation rate at 1.9%. This is above the current rate of 1.63%, but still well below our 2.3%-2.5% target range (Chart 5, bottom panel). The gradual nature of the adaptive process means that actual core inflation will probably have to overshoot the Fed’s 2% target for a period of time before long-dated expectations are firmly re-anchored. With that in mind, we are still a long way away from inflation posing a problem for the credit cycle. Core CPI and core PCE inflation are running at year-over-year rates of 2.3% and 1.7%, respectively, both slightly below levels consistent with the Fed’s target (Chart 6).5 Trimmed mean measures are slightly higher and less volatile. They currently suggest that core inflation will remain in a slow and steady uptrend going forward. Any durable increase in core inflation will likely occur via the Core Services (ex. shelter and medical care) component. Looking at the main components of core inflation, we see some reason to expect consumer price acceleration to cool in the coming months. Recent inflation gains have come mostly via the Core Goods component (Chart 7). This component tracks non-oil import prices with a long lag, and import prices have already rolled over. Meanwhile, shelter is the largest component of core inflation and we expect it will remain well supported in the coming months. The National Multifamily Housing Council’s Apartment Market Tightness Index has been in “net tightening” territory for two consecutive quarters (Chart 7, bottom panel). An above-50% reading from this index tends to coincide with rising shelter inflation. Chart 6Expect Core Inflation To Rise Slowly
Expect Core Inflation To Rise Slowly
Expect Core Inflation To Rise Slowly
Chart 7A Closer Look At The Core CPI Components
A Closer Look At The Core CPI Components
A Closer Look At The Core CPI Components
Ultimately, any durable increase in core inflation will likely occur via the Core Services (ex. shelter and medical care) component. This component has been relatively stable during the past few months (Chart 7, panel 3). Another interesting dynamic to monitor when assessing how long it will take for inflation to return is the labor share of national income. Chart 8 shows that the wage acceleration seen during the past few years has come mostly at the expense of corporate profit margins, and has not yet been significantly passed through to higher consumer prices. This is typical late-cycle behavior, and at some point firms will need to start raising prices in order to protect margins. Chart 8Where Will The Labor Share Peak?
Where Will The Labor Share Peak?
Where Will The Labor Share Peak?
If we use the past few cycles as a guide, we see that the labor share of income peaked at above 70%. If this is an accurate road-map for the current cycle, then it means that firms can stomach quite a bit more margin compression, and it could be a long time before inflation pressures emerge. However, some recent research suggests that the labor share of income might peak at a lower level this cycle than in the past.6 This research documents that many industries are increasingly dominated by a small number of “superstar firms”. These firms have greater pricing power and might be able to sustain higher profit margins indefinitely. This would mean that inflationary pressures could re-emerge at a lower labor share of national income than in previous cycles. Bottom Line: Low inflation expectations will keep monetary policy accommodative for the next 6-12 months. This justifies a positive outlook for spread product excess returns. Eventually, inflation will return and force the Fed to adopt a more restrictive stance. This will lead to the end of the credit cycle. We will get more defensive on spread product when long-maturity TIPS breakeven inflation rates move above 2.3%. Strong Revenue Growth Supports Munis We continue to recommend an overweight allocation to municipal bonds due to attractive yield ratios, particularly for long maturities, and steady state & local government revenue growth. Chart 9 shows that Aaa Municipal / Treasury yield ratios were quite low earlier this year, but have increased significantly during the past few months. Yield ratios are above average pre-crisis levels for maturities of 10-years and greater. Against that back-drop of attractive valuations, credit quality trends are also supportive. Municipal bond ratings upgrades are outpacing downgrades (Chart 10), and history suggests that will continue until state & local government revenue growth slows. On that front, the three main sources of state & local government revenue are all growing at strong rates, a trend that should continue as long as the economic recovery is maintained. Municipal bond ratings upgrades are outpacing downgrades, and history suggests that will continue until state & local government revenue growth slows. Of course, many state & local governments face long-run credit constraints, mostly related to underfunded pension obligations. This is almost certainly the reason why yield ratios for long-maturity bonds are so attractive. Crucially, these long-run issues will not be exposed until revenue growth slows during the next economic downturn, and investors have an opportunity to capture the attractive yield premium in the meantime. Chart 9Great Value At The Long End
Great Value At The Long End
Great Value At The Long End
Chart 10Revenue Growth Will Remain Strong
Revenue Growth Will Remain Strong
Revenue Growth Will Remain Strong
State governments have also made progress shoring up their balance sheets during the past few years. The National Association of State Budget Officers calculates that the overall state & local government total balance has returned back to 2006 levels, while rainy day funds have been built up considerably (Chart 11). Chart 11States Are Growing Rainy Day Funds
States Are Growing Rainy Day Funds
States Are Growing Rainy Day Funds
Bottom Line: The main issues facing municipal bonds are long-run in nature, mostly related to underfunded state & local government pensions. These concerns are propping up yield ratios at the long-end of the muni curve, but aren’t likely to cause a wave of ratings downgrades until revenue growth slows during the next downturn. For the time being, investors can grab an attractive after-tax yield premium in long-maturity munis. Ryan Swift US Bond Strategist rswift@bcaresearch.com Footnotes 1 Please see US Bond Strategy Weekly Report, “Position For Modest Curve Steepening”, dated October 29, 2019, available at usbs.bcaresearch.com 2Please see US Bond Strategy Weekly Report, “Crisis Of Confidence”, dated October 22, 2019, available at usbs.bcaresearch.com 3 For more details on our analysis of the phases of the cycle based on the slope of the yield curve please see US Bond Strategy Special Report, “2019 Key Views: Implications For US Fixed Income”, dated December 11, 2018, available at usbs.bcaresearch.com 4 Please see US Bond Strategy Weekly Report, “Adaptive Expectations In The TIPS Market”, dated November 20, 2018, available at usbs.bcaresearch.com 5 The Fed targets 2% PCE inflation, which is historically consistent with CPI inflation between 2.4% and 2.5%. 6 https://economics.mit.edu/files/12979 Fixed Income Sector Performance Recommended Portfolio Specification
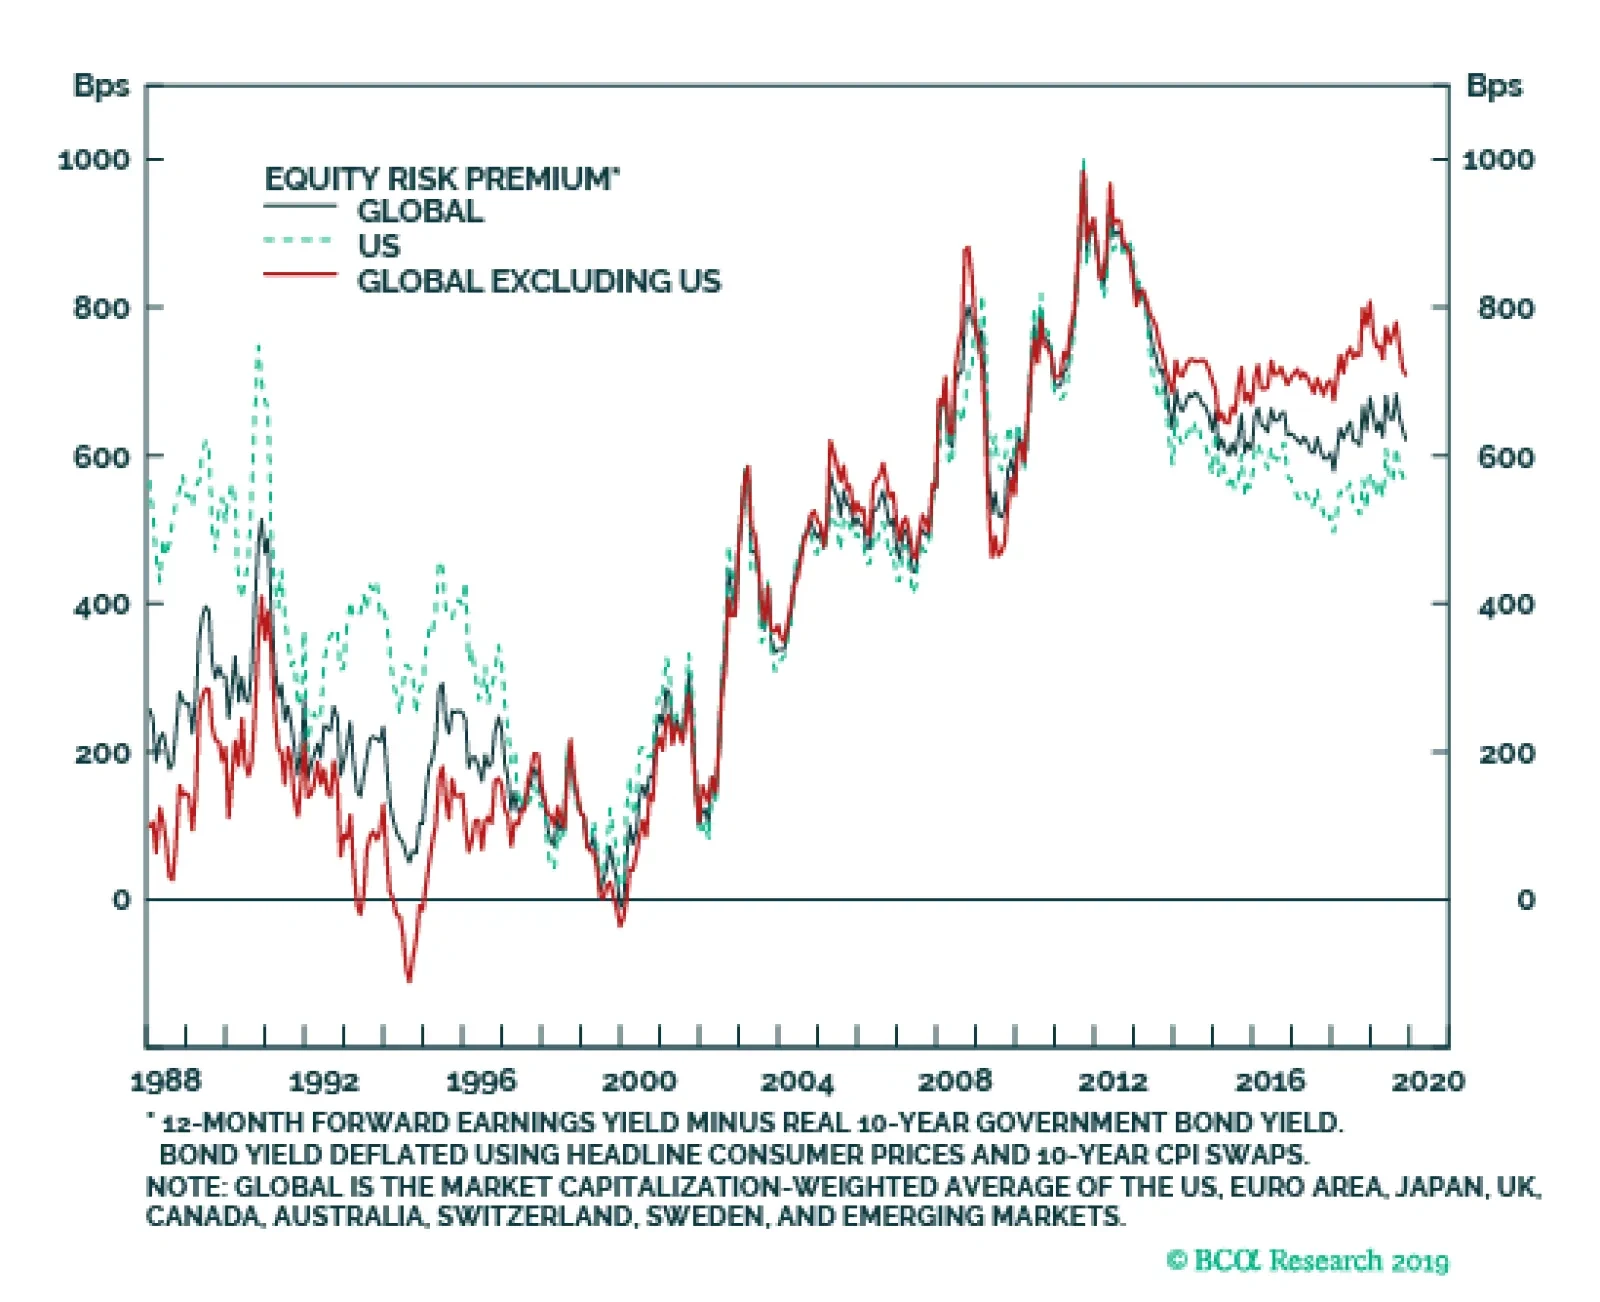
There is an old investment adage which says that valuations are useless as a short-term timing tool. That is only partially true. While valuations by themselves offer little guidance as to where the stock market is going in the short run, combined with a…
Dear Client, I will be visiting clients in Paris, Amsterdam, and London next week. In lieu of our regular report, we will be sending you a Special Report from Matt Gertken, BCA’s Chief Geopolitical Strategist. Matt argues that US politics and the 2020 election represent the greatest source of geopolitical risk over the coming year, and possibly beyond. Best regards, Peter Berezin Highlights Having underperformed for more than ten years, non-US stocks are set to gain the upper hand over their US peers. A reacceleration in global growth, a weaker US dollar, and favorable valuations should all support non-US stocks next year. Meanwhile, one of the greater drivers of US equity outperformance – the stellar returns of tech stocks – is likely to dissipate. Investors should remain overweight global equities relative to bonds, but start increasing allocations to non-US stocks at the expense of US stocks. US Stocks: From Leaders To Laggards? US equities have handily outperformed their global peers since 2008. About half of that outperformance was due to faster sales-per-share growth in the US, a third was due to faster growth in US margins, and the rest was due to relative P/E expansion in favor of the US (Chart 1). Looking ahead, non-US stocks are set to gain the upper hand over their US peers thanks to an improving global growth backdrop, a weaker US dollar, and an increasingly irresistible valuation tailwind. Chart 1Faster Sales Growth, Rising Margins, And Relative PE Expansion Helped Drive US Outperformance Over The Past Decade
A Window Of Opportunity For International Stocks
A Window Of Opportunity For International Stocks
Improving Global Growth Outlook Global growth should benefit next year from the dovish pivot by most central banks. The share of central banks cutting/raising rates leads global growth by about 6-to-9 months (Chart 2). Chart 2Lower Rates Should Help Spur Growth
Lower Rates Should Help Spur Growth
Lower Rates Should Help Spur Growth
Chart 3The Effects Of Easing Monetary Policy Should Soon Trickle Down To The Economy
The Effects Of Easing Monetary Policy Should Soon Trickle Down To The Economy
The Effects Of Easing Monetary Policy Should Soon Trickle Down To The Economy
The global manufacturing downturn is also coming to end as inventories continue to be run down. The auto sector, which has been at the forefront of the manufacturing slowdown, is finally showing signs of life. US banks stopped tightening lending standards for auto loans in the third quarter. They are also reporting stronger demand for vehicle financing (Chart 3). In Europe, the new orders-to-inventory ratio of the Markit Europe Automobile PMI has moved back to parity for the first time since the autumn of 2018. In China, vehicle production and sales are rebounding on a rate-of-change basis (Chart 4). Both automobile ownership and vehicle sales in China are still a fraction of what they are in most other economies (Chart 5). Chart 4Chinese Auto Sector Is Bottoming Out
Chinese Auto Sector Is Bottoming Out
Chinese Auto Sector Is Bottoming Out
Chart 5China: Structural Outlook For Autos Is Bright
China: Structural Outlook For Autos Is Bright
China: Structural Outlook For Autos Is Bright
The trade war is a clear and present danger to our bullish outlook on global growth. The good news is that President Trump has a strong incentive to make a deal. A resurgence in the trade war would hurt the economy, which is Trump’s best selling point (Chart 6). As a self-described master negotiator, Trump has to produce a “tremendous” deal for the American people. Had he negotiated an agreement a year or two ago, he would currently be on the hook for showing that it resulted in a smaller trade deficit with China. But with the presidential election only a year away, he can semi-credibly claim that the trade balance will improve only after he is re-elected. Assuming a “Phase 1” agreement is concluded, global business sentiment should improve. Chart 6Trump Gets Reasonably High Marks On His Handling Of The Economy, But Not Much Else
A Window Of Opportunity For International Stocks
A Window Of Opportunity For International Stocks
A détente in the trade war is unlikely to cause China to restart its deleveraging campaign. Credit growth is currently only a few points above trend nominal GDP growth, implying that the ratio of credit-to-GDP is barely increasing (Chart 7). The combined Chinese credit and fiscal impulse is still rising; it reliably leads global growth by about nine months (Chart 8). Chart 7China: The Deleveraging Campaign Has Been Put On The Backburner
China: The Deleveraging Campaign Has Been Put On The Backburner
China: The Deleveraging Campaign Has Been Put On The Backburner
Chart 8Chinese Stimulus Should Boost Global Growth
Chinese Stimulus Should Boost Global Growth
Chinese Stimulus Should Boost Global Growth
Faster Global Growth Should Disproportionately Benefit Non-US stocks The sector composition of international stocks is more skewed towards cyclicals than defensives compared to US stocks (Table 1). As a result, non-US stocks generally outperform their US peers when global growth accelerates (Chart 9). Table 1Cyclicals Are More Heavily Weighted Outside The US Stock Market
A Window Of Opportunity For International Stocks
A Window Of Opportunity For International Stocks
We would include financials in our definition of cyclical sectors. As global growth improves, long-term bond yields will increase at the margin (Chart 10). Since central banks are in no hurry to raise rates, yield curves will steepen. This will boost bank net interest margins, flattering profits and share prices (Chart 11). Chart 9Non-US Equities Usually Outperform When Global Growth Improves
Non-US Equities Usually Outperform When Global Growth Improves
Non-US Equities Usually Outperform When Global Growth Improves
Chart 10Stronger Economic Growth Will Put Upward Pressure On Government Bond Yields
Stronger Economic Growth Will Put Upward Pressure On Government Bond Yields
Stronger Economic Growth Will Put Upward Pressure On Government Bond Yields
The US Dollar Should Weaken Compared to most other economies, the United States has a large service sector and a small manufacturing base. This makes the US a “low beta” play on global growth. As a result, capital tends to flow from the US to the rest of the world when global growth picks up, putting downward pressure on the US dollar in the process (Chart 12). Chart 11Steeper Yield Curves Will Benefit Financials
Steeper Yield Curves Will Benefit Financials
Steeper Yield Curves Will Benefit Financials
Chart 12The Dollar Is A Countercyclical Currency
The Dollar Is A Countercyclical Currency
The Dollar Is A Countercyclical Currency
Interest-rate differentials have been moving against the dollar for most of this year (Chart 13). This makes the greenback more vulnerable to a correction. Chart 13The Dollar Has Been Diverging From Rate Differentials This Year
The Dollar Has Been Diverging From Rate Differentials This Year
The Dollar Has Been Diverging From Rate Differentials This Year
Chart 14Long Dollar Is A Crowded Trade
Long Dollar Is A Crowded Trade
Long Dollar Is A Crowded Trade
Bullish sentiment towards the dollar also remains somewhat stretched. Net long speculative positions are near the top of their historic range (Chart 14). Our tactical MacroQuant model, which has an excellent track record of predicting short-to-medium term moves in the dollar, has dropped its bullish bias towards the currency (Chart 15). Chart 15MacroQuant Has Soured On The US Dollar
A Window Of Opportunity For International Stocks
A Window Of Opportunity For International Stocks
A weaker dollar will help boost commodity prices, which is usually good news for cyclical stocks (Chart 16). A softer dollar will also raise the USD value of overseas shares, thus making international stocks more attractive in common-currency terms. Valuations Favor Non-US Stocks There is an old investment adage which says that valuations are useless as a short-term timing tool. That is only partially true. While valuations by themselves offer little guidance as to where the stock market is going in the short run, combined with a catalyst, valuations can make a big difference. When stocks are cheap, a bullish catalyst can cause prices to surge; whereas when stocks are expensive, a bearish catalyst can cause them to plunge. Looking ahead, non-US stocks are set to gain the upper hand over their US peers thanks to an improving global growth backdrop, a weaker US dollar, and an increasingly irresistible valuation tailwind. Non-US stocks are currently trading at 13.8-times forward earnings. This represents a significant discount to US stocks, which trade at a forward PE ratio of 17.7. The valuation discount is even greater if one looks at other measures such as the cyclically-adjusted PE, price-to-book, price-to-sales, and the dividend yield (Chart 17). Chart 16A Weaker Dollar Tends To Support Commodity Prices
A Weaker Dollar Tends To Support Commodity Prices
A Weaker Dollar Tends To Support Commodity Prices
Chart 17US Stocks Are More Expensive...
US Stocks Are More Expensive...
US Stocks Are More Expensive...
Differences in sector weights account for about a quarter of the valuation gap between the US and the rest of the world (Chart 18). The rest of the gap is due to cheaper valuations within sectors. Financials, utilities, and consumer discretionary stocks, in particular, are quite a bit more expensive in the US than elsewhere (Chart 19). Chart 18…Even When Adjusting For Sector Weights
A Window Of Opportunity For International Stocks
A Window Of Opportunity For International Stocks
Chart 19AEquity Sector Valuations: US Versus The Rest Of The World (I)
Equity Sector Valuations: US Versus The Rest Of The World (I)
Equity Sector Valuations: US Versus The Rest Of The World (I)
Chart 19BEquity Sector Valuations: US Versus The Rest Of The World (II)
Equity Sector Valuations: US Versus The Rest Of The World (II)
Equity Sector Valuations: US Versus The Rest Of The World (II)
The valuation gap between the US and the rest of the world is even starker if we compare earnings yields with bond yields. Since bond yields are lower outside the US, the implied equity risk premium is markedly higher for non-US stocks (Chart 20). An examination of the relative performance of US vs non-US companies over the past 50 years reveals two major tops, and one potential top. Some commentators have argued that the loftier valuations enjoyed by US stocks are warranted due to their superior growth prospects. While there may be some truth to that, it is worth noting that the IMF projects GDP growth (based on MSCI country weights) will be faster outside the US over the next five years (Chart 21). Chart 20Equity Risk Premia Remain Quite High
Equity Risk Premia Remain Quite High
Equity Risk Premia Remain Quite High
Chart 21Growth Prospects Brighter Outside The US
Growth Prospects Brighter Outside The US
Growth Prospects Brighter Outside The US
One should also keep in mind that relatively fast US earnings growth is a fairly recent phenomenon. Between 1970 and 2008, European EPS actually grew slightly faster than US EPS (Chart 22). Earnings in emerging markets also increased more rapidly than in the US during the two decades leading up to the Global Financial Crisis. Chart 22US Earnings Have Not Always Outperformed
US Earnings Have Not Always Outperformed
US Earnings Have Not Always Outperformed
The Role Of US Tech The large weight of the tech sector in the US stock market explains much of the superior performance of US stocks over the past decade. As Chart 23 illustrates, EPS in the I.T. sector has grown a lot more quickly than in other sectors. Chart 23US Earnings: Who Has Been Doing The Heaving Lifting?
A Window Of Opportunity For International Stocks
A Window Of Opportunity For International Stocks
Chart 24S&P 500: Much Of The Increase In Margins Has Occurred In The I.T. Sector
S&P 500: Much Of The Increase In Margins Has Occurred In The I.T. Sector
S&P 500: Much Of The Increase In Margins Has Occurred In The I.T. Sector
Looking out, there are four reasons why US tech stocks may be due for a breather. First, tech valuations have gotten stretched relative to the broader market. Second, tech margins have risen to unprecedented high levels. We estimate that about half of the increase in S&P 500 profit margins since 2007 has been due to I.T. (Chart 24). Even that understates the role of tech in the expansion of profit margins because Standard & Poor’s no longer classifies some large-cap behemoths such as Google and Facebook as I.T. companies. Third, tech companies may face increased regulatory scrutiny in the years ahead stemming from alleged privacy violations, perceived monopolistic behavior, and worries about the censorship of online speech. This could weigh on sales and earnings growth. Fourth, the growth in private equity funds is likely to limit the number of tech companies that go public at a very early stage. Stock market investors were very lucky that companies such as Microsoft, Cisco, Nvidia, Qualcomm, Oracle, Amazon, and Netflix issued shares to the public at a young stage in their development (Table 2). All seven had market caps below $1 billion when they went public. Such hidden gems are becoming less common: The number of publicly listed companies in the US has fallen by more than half over the past two decades (Chart 25). The median age of tech companies at the time of IPO has risen from around 7 in the 1990s to 12 years today (Chart 26). Table 2Big Gains From Once Small Companies
A Window Of Opportunity For International Stocks
A Window Of Opportunity For International Stocks
Chart 25The Number Of Publicly Listed Companies Fell
The Number Of Publicly Listed Companies Fell
The Number Of Publicly Listed Companies Fell
Chart 26Tech Companies Entering The Public Arena Are Now More Mature
A Window Of Opportunity For International Stocks
A Window Of Opportunity For International Stocks
Had Uber gone public as a small, upstart company not long after it was founded in 2009, it probably would have also made public shareholders a lot of money. Instead, it ended up going public this year with a market cap of $75 billion, only to see it shrink to as low as $40 billion in the ensuing six months. We won’t even mention what would have happened if WeWork had gone public. Investment Conclusions An examination of the relative performance of US vs non-US companies over the past 50 years reveals two major tops, and one potential top: The first during the “Nifty 50” era of the late 1960s, the second during the 1990s dotcom boom, and the third during the recent FAANG craze (Chart 27). It is too early to say whether FAANG stocks have peaked, but it is worth noting that the group has underperformed the S&P 500 since May (Chart 28). Chart 27Putting The Recent FAANG Craze Into Context
Putting The Recent FAANG Craze Into Context
Putting The Recent FAANG Craze Into Context
Chart 28FAANG Stocks And The Market
FAANG Stocks And The Market
FAANG Stocks And The Market
Chart 29Has The Underperformance Of Value Run Its Course?
Has The Underperformance Of Value Run Its Course?
Has The Underperformance Of Value Run Its Course?
Regardless of whether the secular outperformance of US equities is ending, the cyclical backdrop that we foresee over the next 12-to-18 months – characterized by faster global growth, a weakening dollar, and higher commodity prices – is likely to favor non-US stocks. As such, investors should remain overweight global equities relative to bonds, but start increasing allocations to non-US stocks at the expense of US stocks. Consistent with this, we are initiating a new recommendation to go long the MSCI ACWI ex USA index versus the MSCI USA index in dollar terms. Looking across the various stock markets outside the US, we are particularly fond of Europe. Net profit margins among companies in the STOXX Europe 600 index are about three percentage points below the S&P 500. This gives European companies greater scope to boost earnings. European banks are especially attractive, sporting a forward PE of 8.3, a price-to-book ratio of 0.6, and a dividend yield of 6.1%. Lastly, on the question of style investing, we would note that the relative performance of the MSCI value and growth indices closely tracks the performance of global financials versus I.T. (Chart 29). Given our preference for the former over the latter, we suspect that value will outperform growth next year. Peter Berezin Chief Global Strategist peterb@bcaresearch.com Footnotes Strategy & Market Trends MacroQuant Model And Current Subjective Scores
A Window Of Opportunity For International Stocks
A Window Of Opportunity For International Stocks
Tactical Trades Strategic Recommendations Closed Trades