Global

Dear Clients, Please note that this week we are re-publishing a Special Report written by our Emerging Market Strategy team and published on January 7, 2020. The report, authored by Ellen JingYuan He, is an extension of the Special Report published in September 2017 and examines the progress made in China’s “Belt and Road Initiative (BRI)” since its implementation in 2013. This Special Report concludes that going forward, the Chinese government will likely shift to a stricter regulatory stance in BRI project financing. The shift will lead to a modest pullback in realized BRI investment in 2020. However, given the small size of BRI investments relative to China’s total capital spending, the recovery in Chinese capital goods imports still hinges on the domestic property and infrastructure spending cycle. I trust you will find this report insightful. In addition, we are closing our long USD/CNH trade, initiated in May 2019 as a currency hedge for our cyclical overweight in Chinese stocks and corporate bonds (denominated in USD terms). As we mentioned in last week’s China Macro and Market Review, upon the signing of the Phase One trade deal on January 15, we expect further modest strengthening in the Chinese currency as China’s economy continues to improve. Therefore, the currency hedge is no longer needed and we recommend that investors favor Chinese stocks and bonds versus the global benchmark in unhedged terms. Best regards, Jing Sima, China Investment Strategist Highlights The Chinese government will be applying more scrutiny and tighter oversight over lending for ‘Belt and Road’ Initiative (BRI) projects going forward. As a result, total BRI investment with Chinese financing will fall moderately – by 5% to US$135 billion in 2020 from US$142 billion in 2019. BRI investment is too small relative to mainland capital spending. Hence, the global outlook for capital goods and industrial commodities will be driven by Chinese capex, not BRI. BRI Overview Chart I-1Chinese BRI Investment: Likely To Decline In 2020
Chinese BRI Investment: Likely To Decline In 2020
Chinese BRI Investment: Likely To Decline In 2020
China has been promoting and implementing its strategic ‘Belt and Road’ Initiative (BRI) since late 2013. The country has so far signed about 200 BRI cooperation documents with 137 countries and 30 international organizations. The government’s strong push has resulted in a surge in Chinese BRI investment, albeit with a major downturn in 2018 (Chart I-1). BRI projects center on infrastructure development such as transportation (railways, highways, subways and bridges), energy (power plants and pipelines) and telecommunications infrastructure in recipient countries covered by the BRI program. Chart I-2 demonstrates the geographical reach of the BRI as well as transportation linkages/routes being built and funded by it. We discussed the BRI in great detail in a special report published in September 2017. Chart I-2The Belt And Road Program
China’s Belt And Road Initiative: Entering A Cooling-Down Phase
China’s Belt And Road Initiative: Entering A Cooling-Down Phase
The cumulative size of the signed contracts with BRI-recipient countries over the past six years is about US$700 billion, of which US$460 billion has already been completed. However, the value of newly signed contracts in a year does not equal the actual project investment that occurred in that year, as these contracts generally take several years to be implemented and completed. In this report, “BRI investment” encompasses realized investments for BRI projects, which we derive from the official data of “BRI newly signed contracts.” Based on our calculations, Chinese BRI investment reached about US$142 billion in 2019, equaling about 2% of nominal gross fixed capital formation (GFCF) in China. The latter in 2019 was about US$6 trillion. Yet, BRI is much larger than multilateral funding for the developing world. For example, current annual financing disbursements from the World Bank are only about US$50 billion. Looking into 2020, due to a number of considerations, the Chinese government’s attitude towards BRI project financing will continue to shift from aggressive to a stricter and more-cautious stance. Looking into 2020, due to a number of considerations, the Chinese government’s attitude towards BRI project financing will continue to shift from aggressive to a stricter and more-cautious stance. Consequently, we expect a 10% decline in the total value of annual newly signed contracts in 2020, slightly less than the 13% decline in 2018. In addition, we also expect the average implementation period for BRI projects to be slightly longer this year than last year. Based on these expectations, our projection is that realized Chinese BRI investment in 2020 will likely fall moderately – by 5% to US$135 billion this year from US$142 billion in 2019 (Chart I-1 and Table I-1). Table I-1Projection Of Chinese BRI Project Investment In 2020
China’s Belt And Road Initiative: Entering A Cooling-Down Phase
China’s Belt And Road Initiative: Entering A Cooling-Down Phase
BRI Investments: More Scrutiny Ahead The Chinese authorities are constantly recalibrating their BRI implementation strategy. The lessons learned over the past six years as well as shifting domestic macro and global geopolitical landscapes all suggest even more scrutiny ahead. First, the Chinese government has learned hard lessons that easy large lending/financing can result in unanticipated negative consequences. In the past six years, the Chinese government has actively promoted the BRI by providing considerable amounts of financing to BRI projects. The main objectives of the BRI have been: (1) to export China’s excess capacity in heavy industries and construction to other countries; and (2) to build transportation and communication networks to facilitate trade between China and other regions. Although the projects have indeed improved infrastructure and connectivity and boosted both current and potential growth rates in the recipient countries, there have been numerous cases of debt restructuring demand by borrowers as well as growing criticism on China’s BRI as “debt trap diplomacy.” The argument is that China makes loans and uses the debt as leverage to secure land or strategic infrastructure in the recipient countries – in addition to the Middle Kingdom promoting its own geopolitical interests. History will eventually reveal whether BRI constituted “debt trap diplomacy.” As of now, China has either renegotiated or written off debt for some debt-strapped BRI- recipient countries rather than seize their assets. Among all BRI projects spreading over 60 countries in the past six years, there has been only one asset seizure case in Sri Lanka. Crucially, increasingly more BRI-recipient countries are now demanding to renegotiate the terms of their loans and financing, asking China for more favorable concessions, debt forgiveness and write-offs. The reasons run the gamut: from BRI projects not generating enough cash flow to service debt to simple requests among recipient countries for better financing terms. These demands are reducing the value of China’s claims on both BRI projects and recipient countries, and curtailing its willingness to finance more BRI projects. In general, China has learned again that substantially augmenting investments in a single stroke – whether on the mainland or in other countries – produces capital misallocation. The latter results in unviable debtors and bad assets on balance sheets of financiers. Second, many BRI investment projects have suffered delays or cancellations due to changes in the recipient countries’ governments. Reducing both unanticipated negative consequences and unexpected delays/ cancellations requires more scrutiny and tighter oversight on BRI projects by the Chinese government, which is on the way. In April 2019, Chinese President Xi Jinping called for high-quality, sustainability and transparency in implementing BRI projects, as well as a zero-tolerance policy towards corruption. He also stressed that China would only support open cooperation and clean governance when pursuing BRI projects. China’s Ministry of Finance last year released a new document titled, The Debt Sustainability Framework for Participating Countries of the Belt and Road Initiative, in order to identify debt stress among recipient countries and prevent defaults. China, in April, rejected the Kenyan government’s request of US$3.7 billion in new loans for the third phase of its standard gauge railway (SGR) line amid concerns about the country’s finances. In Zimbabwe, the Export-Import Bank of China backed out of providing financing for a giant solar project due to the government’s legacy debts. To be sure, like any lender, the risks and costs fall to Chinese banks and financing providers in the event of a default. Therefore, increasing scrutiny of such projects is in the best interests of China as a whole. That said, the BRI is a signature initiative of President Xi and still has many positives for China. Specifically, it helps the country export its excess capacity, increase its trade with the rest of the world and expand the country’s geopolitical influence. Therefore, any slowdown in the BRI will be marginal. China will tweak and may reduce the pace of BRI investment moderately, but it will not halt it outright. Like any lender, the risks and costs fall to Chinese banks and financing providers in the event of a default. Therefore, increasing scrutiny of such projects is in the best interests of China as a whole. Bottom Line: There will be increasing scrutiny of BRI projects by the Chinese government. Consequently, it will become incrementally more difficult for BRI countries to obtain financing from China in 2020. Nevertheless, the pace of BRI will slow somewhat but not plunge, given the program’s strategic benefits for China. BRI Financing: Switching From Dollar- To Yuan-Denominated Chinese banks have been the major BRI funding providers. Table I-2 shows Chinese policy banks and large state-owned commercial banks accounted for about 51% and 41% of BRI funding in the past five years, respectively. Table I-2China's BRI Funding Sources During 2014-2018
China’s Belt And Road Initiative: Entering A Cooling-Down Phase
China’s Belt And Road Initiative: Entering A Cooling-Down Phase
Debt and equity financing are the two major types of BRI funding, with the former playing the dominant role in the form of bank loans and BRI-specialized bond issuance. While the majority of BRI financing to date – about 83% of the total, according to our estimates – has been denominated in foreign currency (mainly in US dollars), there has been a noticeable rise in loans and bond issuance denominated in yuan. In May 2017, President Xi encouraged domestic financial institutions to promote overseas RMB-denominated financing for BRI projects. In the past two and a half years, about 17% of BRI financing has been in yuan. Before May 2017, such yuan-denominated loans for BRI projects were insignificant. Yuan-denominated BRI loans: The two Chinese policy banks have provided more than RMB 380 billion (equivalent to US$55 billion) in BRI-specialized loans in RMB terms over the past two and half years. Offshore yuan-denominated BRI-related bond issuance by Chinese banks and companies: There has been an increasing amount of BRI-specialized bond issuance in RMB terms offshore over the past several years as well. Onshore yuan-denominated BRI-related bond issuance by governments and organizations/companies of recipient countries: Since 2018, foreign private companies and government agencies have been allowed to issue RMB-denominated BRI bonds onshore in China. There are three reasons why the Chinese authorities will continue to encourage more yuan-denominated financing for BRI projects. Chart I-3China: Few FX Reserves Compared With RMB Money Supply
China: Few FX Reserves Compared With RMB Money Supply
China: Few FX Reserves Compared With RMB Money Supply
First, balance-of-payment constraints make RMB funding for BRI more desirable. US dollar financing for BRI initiatives inevitably creates demand for the People’s Bank of China’s increasingly precious foreign-exchange resources. The main risk to China’s balance of payments is the 177 trillion of local currency deposits of households and enterprises. The PBoC’s US$3 trillion in foreign exchange reserves accounts for only 12% of Chinese total deposits (Chart I-3). Chinese households and private enterprises prefer to hold a higher proportion of their assets in foreign currencies than they do now. This will continue to generate capital outflows, and risks depleting the nation’s foreign currency reserves. Given potential capital outflows from the domestic private sector, China will be careful in expanding state-sponsored capital outflows, including US dollar-denominated BRI financing. Therefore, increasing RMB-denominated funding will reduce US dollar outflows and diminish pressure on China’s foreign exchange reserves. Second, providing BRI financing in yuan promotes RMB internationalization, which is a major long-term objective of China. When a borrower (whether Chinese or foreign entity) with a BRI project obtains yuan-denominated financing, it is encouraged to also pay its suppliers in yuan. As a result, more global trade is settled in renminbi, promoting its internationalization. This is especially convenient when the borrower buys goods and services from China, as they can easily pay in yuan. In cases where a borrower has to buy services and equipment from other countries and is required to pay in US dollars, the renminbis will go into foreign exchange markets. On margin, this will drive the yuan’s value versus the US dollar lower. Provided China has excess capacity in many raw materials and industrial goods, there is a lot of scope to expand RMB financing for BRI projects, with limited downward pressure on the yuan’s exchange rate. In short, RMB-denominated funding will be used to buy Chinese goods. Chart I-4Low Odds Of Acceleration In Bank Financing In 2020
Low Odds Of Acceleration In Bank Financing In 2020
Low Odds Of Acceleration In Bank Financing In 2020
Finally, in any country, banks originate local-currency denominated loans “out of thin air,” – i.e., bank balance sheet expansion is not constrained by national savings. We have written about this extensively in numerous past reports. Theoretically, there is no hard limit on much in yuan-denominated loans Chinese commercial banks can originate, nor how many yuan-denominated bonds they can buy. What constrains commercial banks from expanding their assets infinitely is banking regulation, liquidity constraints (their excess reserves at the central bank rather than deposits), worries about asset impairment and a lack of loan demand among borrowers. Among these, the most pertinent that could cap the amount of BRI financing originated by Chinese banks is macro-prudential bank regulation that is being implemented by regulators in a piecemeal way to cap leverage among enterprises, households, local governments and banks themselves. Chart I-4 illustrates that banks’ asset growth is on par with nominal GDP, and has recently rolled over. The Chinese authorities target bank assets, bank broad credit and broad money growth at the level of potential nominal GDP growth. This entails low odds of acceleration in bank financing in general and BRI projects in particular. Meanwhile, the need for BRI debt restructuring and provisioning will also lead mainland commercial banks to become slightly more cautious in BRI financing. Bottom Line: Both RMB- and US dollar- denominated financing for BRI projects will marginally diminish in 2020. Macro Implications Chart I-5Deep Contraction In Chinese Property Construction...
Deep Contraction In Chinese Property Construction...
Deep Contraction In Chinese Property Construction...
Implications For Commodities And Capital Goods The size of BRI investments in 2019 – US$142 billion – accounts for only about 2% of China’s nominal GFCF. Hence, BRI investment is too small relative to mainland capital spending. This is why we often do not incorporate BRI when analyzing China’s capital spending cycle. In 2020, we are still negative on China’s property construction activity due to weak real estate demand and increasing difficulty for indebted property developers to secure financing (Chart I-5). There will likely be a moderate growth rebound in Chinese infrastructure investment. However, it will not be able to offset the negative impact on commodities and capital goods from weaker BRI investment and mainland contracting property construction. All in all, the recovery in Chinese capital goods imports will be moderate (Chart I-6). Notably, prices of steel, industrial metals and other raw materials do not signal widespread and robust recovery as of now (Chart I-7). Chart I-6...And In Chinese Capital Goods Imports
...And In Chinese Capital Goods Imports
...And In Chinese Capital Goods Imports
Chart I-7Commodity Prices Do Not Signal Widespread And Robust Recovery
Commodity Prices Do Not Signal Widespread And Robust Recovery
Commodity Prices Do Not Signal Widespread And Robust Recovery
Impact On Chinese Exports Chinese exports to BRI countries have done much better than its shipments elsewhere (Chart I-8). For example, Chinese exports to ASEAN countries showed a strong 10.4% year-on-year growth in 2019, versus a 1% contraction in overall exports. The ASEAN countries that received significant amounts of BRI investments posted double-digit growth in imports from China. There are two primary reasons behind the stronger growth in Chinese exports to BRI-recipient countries. 1. As most of China’s BRI investment has focused on infrastructure projects, it has significantly increased recipient countries’ imports of capital goods and raw materials. Chart I-9 shows that Chinese exports of digging and excavating machines have gone vertical. Chart I-8Strong Growth In Chinese Exports To BRI Countries
Strong Growth In Chinese Exports To BRI Countries
Strong Growth In Chinese Exports To BRI Countries
Chart I-9Surging Chinese Exports Of Digging And Excavating Machines
Surging Chinese Exports Of Digging And Excavating Machines
Surging Chinese Exports Of Digging And Excavating Machines
2. Considerable BRI investment has propelled recipient countries’ income growth. Chart I-10 reveals a positive correlation between capital spending as a share of GDP and real GDP growth across 33 BRI-receiving developing economies during the BRI implementation period of 2014-2018. Hence, BRI investments have considerable impact on both potential and current growth of recipient countries. Chart I-10Strong Capital Spending Tend To Facilitate Real Economic Growth
China’s Belt And Road Initiative: Entering A Cooling-Down Phase
China’s Belt And Road Initiative: Entering A Cooling-Down Phase
Chart I-11BRI Helped Boost Chinese Consumer Goods Exports
BRI helped Boost Chinese Consumer Goods Exports
BRI helped Boost Chinese Consumer Goods Exports
Robust income growth has boosted demand for household goods (Chart I-11). China has a very strong competitive advantage in consumer goods production, especially in low-price segments that are popular in developing economies. Despite a slight drop in overall BRI investment, we still expect solid growth (albeit less than in 2019) in Chinese exports to BRI countries in 2020. Ellen JingYuan He Associate Vice President ellenj@bcaresearch.com Cyclical Investment Stance Equity Sector Recommendations
In Gold We Trust
In Gold We Trust
Overweight This week we reintroduced a modest portfolio hedge via augmenting exposure to global gold miners to overweight. Global gold miners have a lot going for them. Rising global policy uncertainty plays to their strength as investors seek the refuge of safe haven assets especially when geopolitical risks flare up (top panel). Importantly, real US bond yields have also taken a beating recently underpinning gold prices and gold mining equities. This is significant, as bullion yields nothing and gold miners next to nothing so from an opportunity cost perspective it pays to hold a zero yielding asset when competing yields fall and vice versa (middle panel). Worrisomely, this fall in real US yields is de facto pushing global real yields lower, which might indicate that investors worry that the global economy has more downside. In fact, economists’ estimates for GDP growth (as compiled by Bloomberg, bottom panel) continue to decelerate globally, and they forecast below-trend real output growth in the US for 2020. Bottom Line: Boost global gold miners to an above benchmark allocation via the long GDX/short ACWI exchange traded funds.
Highlights 2019 Performance Breakdown: Our recommended model bond portfolio underperformed the custom benchmark index by -38bps for all of 2019. Winners & Losers: The underperformance of our model bond portfolio in 2019 was concentrated in the government bond side of the portfolio (-103bps), a result of below-benchmark duration positioning and underweights to US Treasuries and Italian government bonds. On the other side was a solid outperformance from spread product allocations (+65bps), mostly driven by an overweight to US high-yield corporate bonds. Q4/2019 Performance: The year ended strongly, however, as the portfolio outperformed by +28bps in Q4, split equally between government bonds and spread product. Scenario Analysis For The Next Six Months: We are targeting a moderately aggressive level of overall portfolio risk, with below-benchmark duration exposure alongside meaningful overweight allocations to global corporate credit. In our base case scenario, global growth will continue to recover supported by accommodative monetary policies, thus opening a window for another year of global corporates outperforming sovereign bonds in 2020. Feature Last week, we published the Global Fixed Income Strategy (GFIS) model bond portfolio strategy for the coming year, in which we translated our 2020 global fixed income Key Views into recommended investment positioning for the next 6-12 months.1 In this week’s report, take a final look back to review the performance of the model portfolio for both the fourth quarter of 2019 and the entire calendar year. We also present our updated scenario analysis, and return projections, for the portfolio over the next six months, incorporating the new recommended allocations introduced last week. As a reminder to existing readers (and to new clients), the model portfolio is a part of our service that complements the usual macro analysis of global fixed income markets. The portfolio is how we communicate our opinion on the relative attractiveness between government bond and spread product sectors. This is done by applying actual percentage weightings to each of our recommendations within a fully invested hypothetical bond portfolio. 2019 Performance: A Short Summary Of A Long Year Chart of the Week2019 Performance: Credit Good, Duration Bad, But A Solid Q4
2019 Performance: Credit Good, Duration Bad, But A Solid Q4
2019 Performance: Credit Good, Duration Bad, But A Solid Q4
The 2019 performance of the model portfolio can be summarized by duration dominating credit. Government bond yields rapidly fell in the first three quarters of the year due to weakening global growth and growing political uncertainty, to the detriment of our below-benchmark stance on overall portfolio duration. At the same time, global credit markets performed strongly in 2019, even as risk-free government bond yields plunged, which benefited our overweight stance on global spread product. The 2019 performance of the model portfolio can be summarized by duration dominating credit. All in all, the overall portfolio return in 2019 was +7.9% (hedged into USD), underperforming our custom benchmark index by -38bps (Chart of the Week).2 That underperformance was more pronounced before the strong rebound in global bond yields witnessed at the beginning of the fourth quarter, at which point the portfolio was underperforming the custom benchmark by -68bps (Table 1). Table 1GFIS Model Bond Portfolio Q4/2019 Overall Return Attribution
2019 GFIS Model Bond Portfolio Performance Review: Praise Credit & Blame Duration
2019 GFIS Model Bond Portfolio Performance Review: Praise Credit & Blame Duration
Looking at the breakdown of underperformance in 2019, our recommended positioning on government bonds (duration and country allocation) dragged the overall performance by -104bps, while our credit tilts (by country and broadly defined credit sectors) provided a partial offset, contributing +65bps. The details of the full year 2019 performance can be found in the Appendix on pages 14-16. In terms of specifics, the biggest sources of underperformance were underweights in US Treasuries (-66bps) and Italian government bonds (-28bps). Those positions, however, were used to “fund” corporate bond overweights in US investment grade (+28bps) and US high-yield (+46bps), as well as euro area corporate debt (+6bps) – allocations that performed well and helped offset the underperformance in US and Italian sovereign debt. More generally across the government bond portion of the portfolio, the drag on returns was concentrated in the 10+ year maturity buckets. This was a consequence of combining our below-benchmark duration stance with a curve-steepening bias that was hurt severely by the bullish flattening of global yield curves in the first three quarters of the year. The drag on returns from curve positioning was particularly acute in Japan and France, where the 10+ year maturity buckets underperformed by -27bps and -13bps, respectively. On a more positive note with regards to country selection, three of our favorite overweights for 2020 – Germany (+10bps), Australia (+7bps) and the UK (+5bps) – all outperformed versus the model portfolio benchmark. Q4/2019 Model Portfolio Performance Breakdown: Winning On Both Sides The GFIS model bond portfolio performed well at the end of 2019, as fixed income markets began to discount stabilizing global growth and reduced central bank easing expectations. The total return for the GFIS model portfolio (hedged into US dollars) in Q4/2019 was only +0.1%, but this managed to outperform the custom benchmark index by a solid +28bps. The GFIS model bond portfolio performed well at the end of 2019, as fixed income markets began to discount stabilizing global growth and reduced central bank easing expectations. In terms of the specific breakdown between the government bond and spread product allocations in our model portfolio, the former generated +14bps of outperformance versus our custom benchmark index while the latter outperformed by +15bps. The bar charts showing the total and relative returns for each individual government bond market and spread product sector are presented in Charts 2 and 3. Chart 2GFIS Model Bond Portfolio Q4/2019 Government Bond Performance Attribution
2019 GFIS Model Bond Portfolio Performance Review: Praise Credit & Blame Duration
2019 GFIS Model Bond Portfolio Performance Review: Praise Credit & Blame Duration
Chart 3GFIS Model Bond Portfolio Q4/2019 Spread Product Performance Attribution By Sector
2019 GFIS Model Bond Portfolio Performance Review: Praise Credit & Blame Duration
2019 GFIS Model Bond Portfolio Performance Review: Praise Credit & Blame Duration
The most significant movers were: Biggest outperformers Underweight US government bonds with maturity beyond 10+ years (+8bps) Overweight US Ba-rated high-yield corporates (+5bps) Overweight US B-rated high-yield corporates (+5bps) Underweight Italian government bonds with maturity beyond 10+ years (+4bps) Underweight German government bonds with maturity beyond 10+ years (+3bps) Biggest underperformers Underweight US government bonds with maturity of 1-3 years (-2bps) Overweight Japanese government bonds with maturity of 5-7 years (-2bps) Overweight Japanese government bonds with maturity of 7-10 years (-1bp) Overweight UK government bonds with maturity of 5-7 years (-1bp) Underweight German government bonds with maturity of 7-10 years (-1bp) Chart 4 presents the ranked benchmark index returns of the individual countries and spread product sectors in the GFIS model bond portfolio for Q4/2019. The returns are hedged into US dollars (we do not take active currency risk in this portfolio) and are adjusted to reflect duration differences between each country/sector and the overall custom benchmark index for the model portfolio. We have also color-coded the bars in each chart to reflect our recommended investment stance for each market during Q4/2019 (red for underweight, green for overweight, gray for neutral).3 Ideally, we would look to see more green bars on the left side of the chart where market returns are highest, and more red bars on the right side of the chart were returns are lowest. Chart 4Ranking The Winners & Losers From The Model Bond Portfolio In Q4/2019
2019 GFIS Model Bond Portfolio Performance Review: Praise Credit & Blame Duration
2019 GFIS Model Bond Portfolio Performance Review: Praise Credit & Blame Duration
Global spread product dominates the left half of the chart. EM corporates and EM sovereigns denominated in US dollars turned to be the best performers in Q4, followed by US and European corporate bonds. This was a boon for our model portfolio performance, given our overweight stances on global corporate bonds. This was due to credit spread narrowing, supported by accommodative monetary policy and fading fears of slower global growth. On the other hand, the right side of Chart 4 is predominantly occupied by government bonds. The worst performers in Q4 were German, New Zealand and UK governments bonds – three markets where we have been overweight, although we did take profits on our long-held bullish view on New Zealand in mid-November.4 Bottom Line: Our recommended model bond portfolio outperformed the custom benchmark index during the fourth quarter of the year. The outperformance came both from the government and spread product sides of the portfolio, driven by a smaller exposure to the long-ends of government bond yield curves and our recommended overweight position on US high-yield corporate bonds. Future Drivers Of Portfolio Returns Chart 5Overall Portfolio Allocation: Significantly Overweight Credit
2019 GFIS Model Bond Portfolio Performance Review: Praise Credit & Blame Duration
2019 GFIS Model Bond Portfolio Performance Review: Praise Credit & Blame Duration
Looking ahead, the performance of the model bond portfolio will be driven by three main factors: our below-benchmark duration bias, our overweight stance on corporate debt versus global government bonds, and last week’s upgrade of EM USD-denominated sovereigns and corporates to overweight. In terms of specific weightings in the GFIS model bond portfolio, we now have a more pronounced bias favoring global spread product over government debt, with a relative overweight of fifteen percentage points versus the benchmark index (Chart 5). We also remain modestly below-benchmark on duration, with an overall exposure equal to 0.5 years short of the benchmark (Chart 6). While we do not expect a major surge in bond yields this year, global yield curves discount inflation expectations that are too low and monetary policy easing in 2020 that is unlikely to be delivered (especially in the US). With global growth showing signs of bottoming out, and leading indicators pointing to continued improvement in the next 6-12 months, the risk/reward bias is tilted in favor of global yields moving higher, justifying reduced duration exposure. Looking ahead, the performance of the model bond portfolio will be driven by three main factors: our below-benchmark duration bias, our overweight stance on corporate debt versus global government bonds, and last week’s upgrade of EM USD-denominated sovereigns and corporates to overweight. Chart 6Overall Portfolio Duration: Moderately Below Benchmark
Overall Portfolio Duration: Moderately Below Benchmark
Overall Portfolio Duration: Moderately Below Benchmark
Chart 7Portfolio Yield: Significant Positive Carry From Credit
Portfolio Yield: Significant Positive Carry From Credit
Portfolio Yield: Significant Positive Carry From Credit
Chart 8Portfolio Risk Budget Usage: Moderately Aggressive
Portfolio Risk Budget Usage: Moderately Aggressive
Portfolio Risk Budget Usage: Moderately Aggressive
To better position the model bond portfolio to this backdrop of slowly rising global yields, we adjusted our government bond country allocations last week in favor of lower-beta markets such as Japan, Germany, France, Spain, Australia and the UK, while maintaining underweight positions in higher-beta markets such as the US, Canada and Italy.5 Our decision to upgrade global credit exposure helps boost the yield of our model portfolio to around 3%, or +43bps in excess of the benchmark index yield (Chart 7). Further, these changes represent an increase in the usage of the “risk budget” of our model bond portfolio, which is now running a tracking error (or excess volatility versus that of the benchmark) of 73bps (Chart 8). This is slightly higher than the 58bps prior to last week’s changes, but is still below the maximum allowable tracking error of 100bps that we have imposed on the model portfolio since its inception. More importantly, this is consistent with our view that investors should maintain a “moderately aggressive” level of risk in fixed income portfolios in 2020. Scenario Analysis & Return Forecasts To help provide some insight as to the potential excess returns from our model bond portfolio tilts, we use a framework for estimating total returns for all government bond markets and spread product sectors, based on common risk factors. For credit, returns are estimated as a function of changes in the US dollar, the Fed funds rate, oil prices and market volatility as proxied by the VIX index (Table 2A). For government bonds, non-US yield changes are estimated using historical betas to changes in US Treasury yields (Table 2B). We take yield forecasts for US Treasuries that are translated to shifts in non-US yields using these yield betas.6 Table 2AFactor Regressions Used To Estimate Spread Product Yield Changes
2019 GFIS Model Bond Portfolio Performance Review: Praise Credit & Blame Duration
2019 GFIS Model Bond Portfolio Performance Review: Praise Credit & Blame Duration
Table 2BEstimated Government Bond Yield Betas To US Treasuries
2019 GFIS Model Bond Portfolio Performance Review: Praise Credit & Blame Duration
2019 GFIS Model Bond Portfolio Performance Review: Praise Credit & Blame Duration
In Tables 3A and 3B, we present our three main scenarios for the next six months, defined by changes in the risk factors, and the expected performance of the model bond portfolio in each case. The scenarios, described below, all revolve around our expectation that the most important drivers of future market returns will continue to be the momentum of global growth and the path of US monetary policy. Base Case (Global Growth Recovery): The Fed stays on hold, the US dollar weakens by -2%, oil prices rise by +10%, the VIX hovers around 13, and there is a bear-steepening of the UST curve. This is a scenario where global growth keeps recovering, alongside a US dollar which slightly weakens. The model bond portfolio is expected to beat the benchmark index by +90bps in this case. Global Growth Accelerates: The Fed stays on hold, the US dollar weakens by -5%, oil prices rise by +15%, the VIX declines to 10, and there is a more pronounced bear-steepening of the UST curve. Under this scenario, the pickup in global growth is faster than anticipated, causing the US dollar to weaken substantially as global capital flows move into more growth-sensitive markets outside the US. Both of these forces support EM economies and support oil prices. The model bond portfolio is expected to beat the benchmark index by +125bps in this case. Global Growth Upturn Fails: The Fed cuts rates by -25bps, the US dollar appreciates by +3%, oil prices fall by -20%, the VIX rises to 25; there is a parallel shift down in the UST curve. This is a scenario where global growth merely stabilizes at weak levels but fails to rebound. The Fed finds itself delivering one more rate cut in order to support the US economy. Meantime, the US dollar appreciates as capital flows out of growth-sensitive regions into the safe-haven greenback, particularly as global recession fears result in increased financial market volatility. The model portfolio will underperform the benchmark by -38bps in this scenario. Table 3AScenario Analysis For The GFIS Model Bond Portfolio For The Next Six Months
2019 GFIS Model Bond Portfolio Performance Review: Praise Credit & Blame Duration
2019 GFIS Model Bond Portfolio Performance Review: Praise Credit & Blame Duration
Table 3BUS Treasury Yield Assumptions For The 6-Month Forward Scenario Analysis
2019 GFIS Model Bond Portfolio Performance Review: Praise Credit & Blame Duration
2019 GFIS Model Bond Portfolio Performance Review: Praise Credit & Blame Duration
The scenario inputs for the four main risk factors (the fed funds rate, the price of oil, the US dollar and the VIX index) are shown visually in Chart 9, while the US Treasury yield scenarios are in Chart 10. Chart 9Risk Factor Assumptions For The Scenario Analysis
Risk Factor Assumptions For The Scenario Analysis
Risk Factor Assumptions For The Scenario Analysis
Chart 10US Treasury Yield Assumptions For The Scenario Analysis
US Treasury Yield Assumptions For The Scenario Analysis
US Treasury Yield Assumptions For The Scenario Analysis
In terms of our conviction level among the main drivers of the model portfolio returns – duration allocation (across yield curves and countries) and asset allocation (credit versus government bonds) – we are confident that global growth is much more likely to rebound than decelerate further over the course of 2020. This will allow our increased spread product allocation to be the main driver of the portfolio returns. Thus, the overall expected excess return of our model bond portfolio over the benchmark is positive, given that the scenario analysis produces positive excess returns in the Base Case and “Global Growth Accelerates” outcomes. We are confident that global growth is much more likely to rebound than decelerate further over the course of 2020. This will allow our increased spread product allocation to be the main driver of the portfolio returns. Bottom Line: We are targeting a moderately aggressive level of overall portfolio risk, with below-benchmark duration exposure alongside meaningful overweight allocations to global corporate credit. In our base case scenario, global growth will continue to recover supported by accommodative global monetary policy, thus opening a window for another year of global corporates outperforming sovereign bonds in 2020. Jeremie Peloso Research Analyst jeremiep@bcaresearch.com Robert Robis, CFA Chief Fixed Income Strategist rrobis@bcaresearch.com Footnotes 1 Please see BCA Global Fixed Income Strategy Weekly Report, “Our Model Bond Portfolio Strategy For 2020: Selectively Aggressive”, dated January 7, 2020, available at gfis.bcarsearch.com. 2 The GFIS model bond portfolio custom benchmark index is the Bloomberg Barclays Global Aggregate Index, but with allocations to global high-yield corporate debt replacing very high quality spread product (i.e. AA-rated). We believe this to be more indicative of the typical internal benchmark used by global multi-sector fixed income managers. 3 Note that sectors where we made changes to our recommended weightings during Q4/2019 will have multiple colors in the respective bars in Chart 4. 4 Please see BCA Research Global Fixed Income Strategy Weekly Report, “When In Doubt, Trust The Leading Indicators”, dated November 19, 2019, available at gfis.bcaresearch.com. 5 We are defining “beta” here in terms of yield beta, or the sensitivity to changes in an individual country's bond yield to changes the overall level of global bond yields. 6 We are making a change in the betas used in our scenario analysis this week, using trailing 3-year yield betas to US Treasuries in place of the longer-term post-crisis yield betas that were measured over a full 10 years. Appendix Appendix Table 1GFIS Model Bond Portfolio Full Year 2019 Overall Return Attribution
2019 GFIS Model Bond Portfolio Performance Review: Praise Credit & Blame Duration
2019 GFIS Model Bond Portfolio Performance Review: Praise Credit & Blame Duration
Appendix Chart 1GFIS Model Bond Portfolio Full Year 2019 Government Bond Performance Attribution
2019 GFIS Model Bond Portfolio Performance Review: Praise Credit & Blame Duration
2019 GFIS Model Bond Portfolio Performance Review: Praise Credit & Blame Duration
Appendix Chart 2GFIS Model Bond Portfolio Full Year 2019 Spread Product Performance Attribution By Sector
2019 GFIS Model Bond Portfolio Performance Review: Praise Credit & Blame Duration
2019 GFIS Model Bond Portfolio Performance Review: Praise Credit & Blame Duration
Recommendations The GFIS Recommended Portfolio Vs. The Custom Benchmark Index
2019 GFIS Model Bond Portfolio Performance Review: Praise Credit & Blame Duration
2019 GFIS Model Bond Portfolio Performance Review: Praise Credit & Blame Duration
Duration Regional Allocation Spread Product Tactical Trades Yields & Returns Global Bond Yields Historical Returns
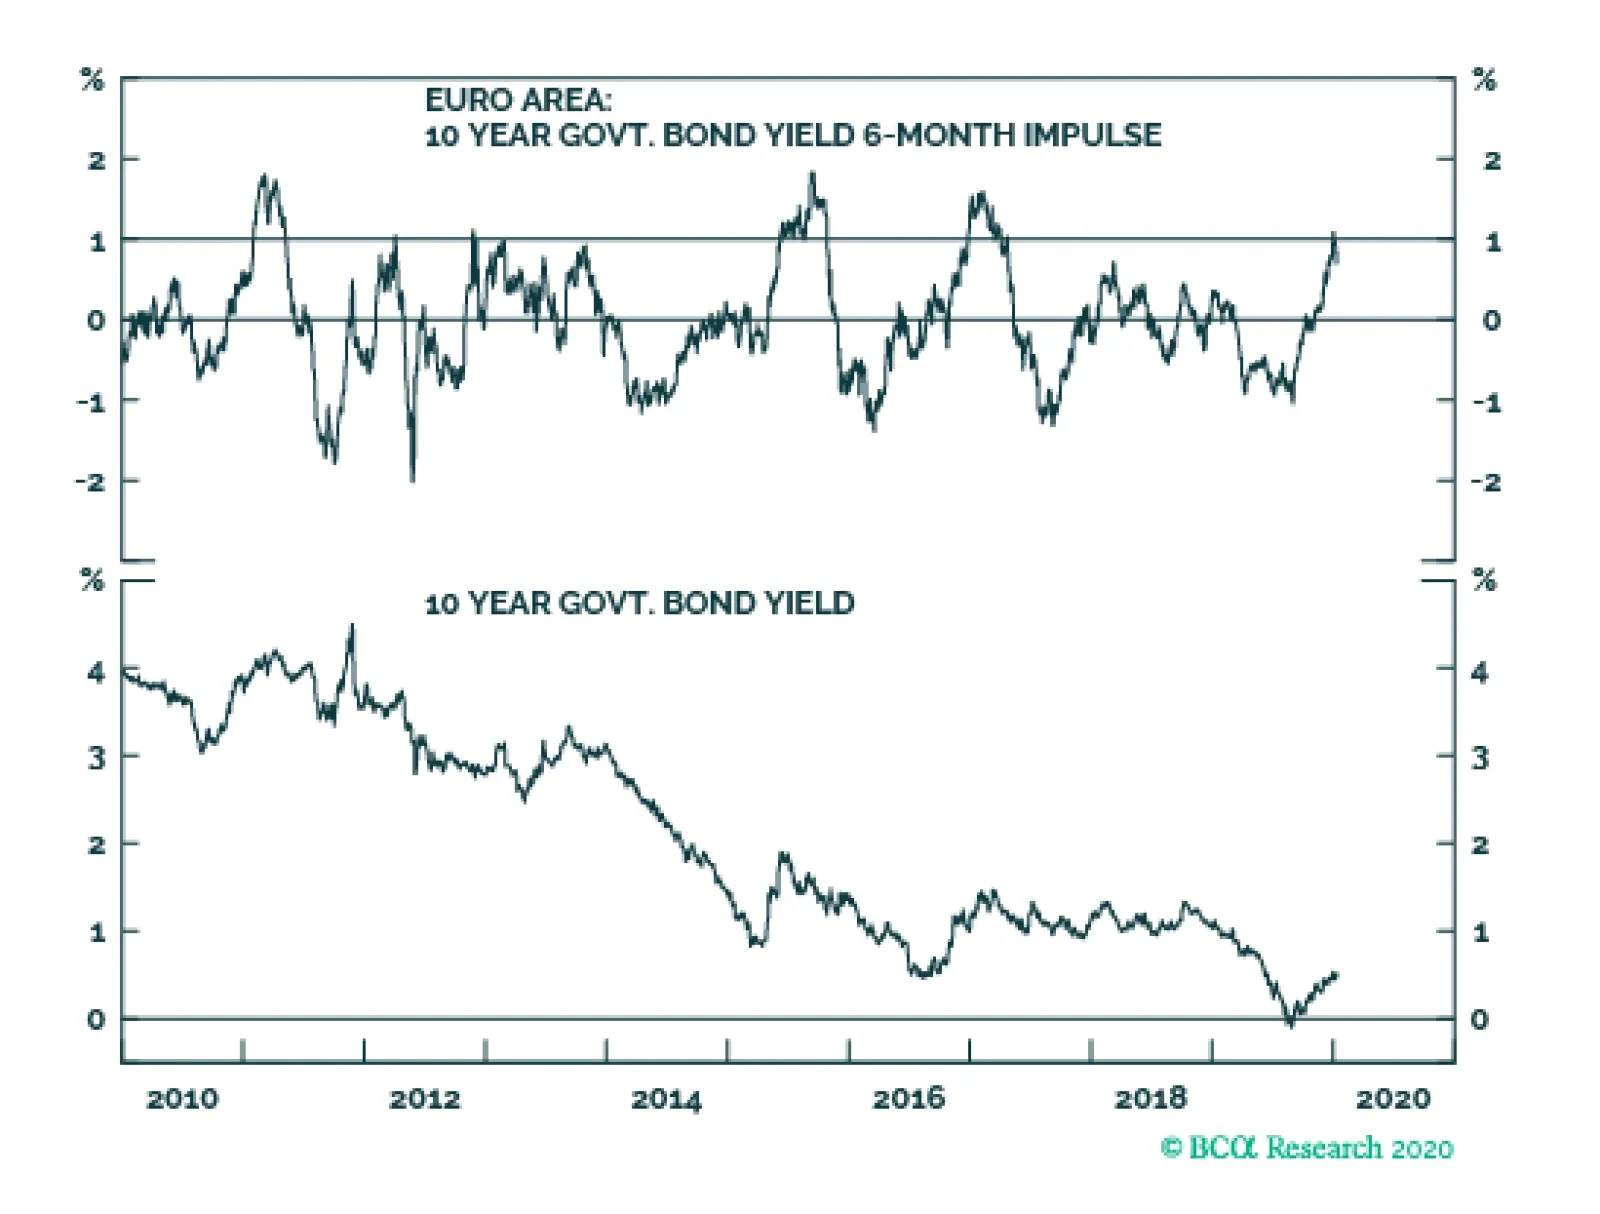
The euro area 10-year bond yield stands at a lowly 0.45 percent and the 6-month change is a seemingly benign +0.2 percent. However, the crucial 6-month impulse equals a severe +1 percent, because the +0.2 percent rise in yields followed a sharp -0.8 percent…
Highlights Duration: Despite recent setbacks, global growth looks set to improve and policy uncertainty set to ease during the next couple of months. Both will conspire to push bond yields higher. Investors should maintain below-benchmark portfolio duration. US political risks could flare again around mid-year, sending yields lower. TIPS: We recommend that investors enter TIPS breakeven curve flatteners, both because short-term inflation expectations will respond more quickly than long-term expectations to stronger realized inflation data and to hedge against the risk of an oil supply shock. High-Yield: Investors should add (or increase) exposure to the high-yield energy sector, within an overweight allocation to junk bonds. Junk energy spreads are attractive, and exposure to the sector will mitigate the impact of a potential oil supply shock. Feature Only a month ago, investors were becoming more optimistic about a global growth rebound and the US/China phase 1 trade deal was pushing political risk into the background. Both of those factors caused the 10-year Treasury yield to rise throughout December, hitting an intra-day Christmas Eve peak of 1.95% (Chart 1). But since then, softer global PMI data and the US/Iranian military conflict brought global growth concerns and political risk back to the fore, breaking the uptrend in yields. Chart 1Bond Bear On Pause
Bond Bear On Pause
Bond Bear On Pause
Global growth and political uncertainty are two of the five macro factors that we identify as important for US bond yields.1 And despite the recent setback, we think both factors will push yields higher in the coming months. Global Growth We have found that the Global Manufacturing PMI, the US ISM Manufacturing PMI and the CRB Raw Industrials index are the three global growth indicators that correlate most strongly with US bond yields. One reason for the recent pullback in yields is the disappointing December data from the Global and US Manufacturing PMIs. The ISM Manufacturing PMI moved deeper into recessionary territory. The Global Manufacturing PMI had been in a clear uptrend since mid-2019, but fell back to 50.1 in December, from 50.3 the month before (Chart 2). The US and Chinese PMIs also declined in December, though they remain well above the 50 boom/bust line (Chart 2, panels 3 & 4). The Eurozone and Japanese PMIs, meanwhile, are still in the doldrums (Chart 2, panels 2 & 5). More worrying than the small tick down in Global PMI is the US ISM Manufacturing PMI moving deeper into recessionary territory, from 48.1 to 47.2. However, we have good reason to think that stronger data are just around the corner (Chart 3). Chart 2Global PMI Ticks Down
Global PMI Ticks Down
Global PMI Ticks Down
Chart 3ISM Manufacturing Index Will Rebound
ISM Manufacturing Index Will Rebound
ISM Manufacturing Index Will Rebound
First, the difference between the new orders and inventories components of the ISM index often leads the overall index at turning points, 2016 being a prime example (Chart 3, top panel). Much like in 2016, a gap is opening up between new orders-less-inventories and the overall ISM. Second, the non-manufacturing ISM index remains strong despite the weakness in manufacturing (Chart 3, panel 2). With no contagion to the service sector of the economy, we’d expect manufacturing to pick back up. Third, the ISM Manufacturing index has diverged sharply from the Markit Manufacturing PMI, with the Markit index printing well above the ISM (Chart 3, panel 3).2 The ISM index has been more volatile than the Markit index in recent years, and should trend toward the Markit index over time. Fourth, regional Fed manufacturing surveys have generally been stronger than the ISM during the past few months. A simple regression model of the ISM index based on data from regional Fed surveys suggests that the ISM index should be at 49.7 today, instead of 47.2 (Chart 3, bottom panel). Finally, unlike the PMI surveys, the CRB Raw Industrials index has increased quite sharply in recent weeks (Chart 4). We should note that it is not the CRB index itself but rather the ratio between the CRB index and gold that tracks bond yields most closely, and this ratio has actually declined lately due to the strength in gold. Nonetheless, a sustained turnaround in the CRB index would mark a big change from 2019 and would send a strong bond-bearish signal. Chart 4CRB Sends A Bond-Bearish Signal
CRB Sends A Bond-Bearish Signal
CRB Sends A Bond-Bearish Signal
Political Uncertainty The second factor that sent bond yields lower during the past few weeks was the military conflict between the US and Iran. Tensions appear to have de-escalated for now, and we would expect any flight-to-quality flows to unwind during the next few weeks.3 But while we see policy uncertainty easing in the near-term, sending bond yields higher, we reiterate our view that US political uncertainty is the number one risk factor that could derail the 2020 bear market in bonds.4 Specifically, we see two looming US political risks. The first relates to President Trump’s re-election odds. For now, Trump’s approval rating is in line with past incumbent presidents that have won re-election (Chart 5). But if his approval doesn’t keep pace in the coming months, he will try to do something to change his fortunes. That could mean re-igniting the trade war with China, or once again ramping up tensions with Iran. A Bernie Sanders or Elizabeth Warren victory would send a flight-to-quality into bonds. The second risk is that one of the progressive candidates – Bernie Sanders or Elizabeth Warren – secures the Democratic nomination for president. Right now, both trail Joe Biden in the polls and betting markets (Chart 6), but things could change rapidly as the primary results come in during the next few months. The stock market would certainly sell off if an Elizabeth Warren or Bernie Sanders presidency seems likely, sending a flight to quality into bonds.5 Chart 5Trump’s Approval Rating Must Rise
Bond Market Implications Of An Oil Supply Shock
Bond Market Implications Of An Oil Supply Shock
Chart 6Democratic Nomination Betting Odds
Democratic Nomination Betting Odds
Democratic Nomination Betting Odds
Bottom Line: Despite recent setbacks, global growth looks set to improve and policy uncertainty set to ease during the next couple of months. Both will conspire to push bond yields higher. Investors should maintain below-benchmark portfolio duration. US political risks could flare again around mid-year, sending yields lower. Playing An Oil Supply Shock In US Bond Markets US/Iranian military tensions are easing for now, but could flare again in the future. For that reason, it’s worth considering how US bond markets would respond in the event of a conflict between the US and Iran that removed a significant amount of the world’s oil supply from the market, causing the oil price to spike. The first implication is that US bond yields would fall. Even though it’s tempting to say that the inflationary impact of higher oil prices would push yields up, this effect would not dominate the flight-to-quality into US bonds that would result from the increase in political uncertainty. Case in point, Chart 1 shows that, while the inflation component of yields was stable as tensions flared during the past few weeks, it didn’t come close to offsetting the drop in the 10-year real yield. Beyond the impact on Treasury yields, there are two other segments of the US bond market that would be materially impacted by an oil supply shock: the TIPS breakeven inflation curve and corporate bond spreads. Buy TIPS Breakeven Curve Flatteners Table 1CPI Swap Curve Sensitivity To Oil
Bond Market Implications Of An Oil Supply Shock
Bond Market Implications Of An Oil Supply Shock
When considering the impact of an oil supply shock on TIPS breakeven inflation rates, we first look at how the cost of inflation protection is influenced by changes in the oil price. Table 1 shows the sensitivity of weekly changes in different CPI swap rates to a $1 increase in the price of Brent crude oil. We use CPI swap rates instead of TIPS breakeven inflation rates because data are available for a wider maturity spectrum. Our analysis applies equally to the TIPS breakeven inflation curve. Two conclusions are apparent from Table 1. First, the entire CPI swap curve is positively correlated with the oil price, a higher oil price moves CPI swap rates higher and vice-versa. Second, the sensitivity of CPI swap rates to the oil price is greater at the short-end of the curve than at the long-end. This is fairly intuitive given that higher oil prices are inflationary in the short-term but could be deflationary in the long-run if they hamper economic growth. Chart 7Coefficients Stable Over Time
Coefficients Stable Over Time
Coefficients Stable Over Time
Chart 7 shows that our two main conclusions are not dependent on the chosen time horizon. The 2-year CPI swap rate is positively correlated with the oil price for our entire sample period, as is the 10-year rate except for a brief window in 2014. The 2-year rate’s sensitivity is also consistently higher than the 10-year’s. Based on this analysis, we can suggest two good ways to hedge against the risk of an oil supply shock that sends prices higher: Buy inflation protection, either in the CPI swaps market or by going long TIPS versus duration-equivalent nominal Treasuries. Buy CPI swap curve (or TIPS breakeven inflation curve) flatteners.6 But we can introduce one more wrinkle to our analysis. Oil prices can rise because of stronger demand or because a shock suddenly removes supply from the market. It’s possible that the cost of inflation protection behaves differently in each case. Fortunately, the New York Fed has made an attempt to distinguish between those two scenarios. In its weekly Oil Price Dynamics Report, the Fed decomposes Brent oil price changes into demand-driven changes and supply-driven changes.7 It does this by looking at how other financial assets respond to oil price changes each week. Chart 8 shows the cumulative change in the Brent oil price since 2010, along with the New York Fed’s supply and demand factors. According to the Fed, demand has pressured the oil price higher since 2010, but this has been more than offset by greater supply. Chart 8Supply & Demand Oil Price Decomposition
Supply & Demand Oil Price Decomposition
Supply & Demand Oil Price Decomposition
Using the New York Fed’s supply and demand series, we look at how CPI swap rates respond to higher oil prices in three different scenarios. First, we identify 252 weeks when demand and supply both contributed to higher oil prices. Second, we identify 95 weeks when higher oil prices were driven solely by demand. Finally, and most pertinently, we identify 92 weeks when higher oil prices were driven only by supply (Table 2). Table 2Weekly Change In CPI Swap Rate When Brent Oil Price Increases
Bond Market Implications Of An Oil Supply Shock
Bond Market Implications Of An Oil Supply Shock
Results for the ‘Demand & Supply Driven’ and ‘Demand Driven’ scenarios are consistent with our results from Table 1. CPI swap rates across the entire curve move higher more than half the time, with greater increases at the short-end of the curve. However, the scenario we are most interested in is the ‘Supply Driven’ scenario. Presumably, a military conflict with Iran that took oil supply off the market would lead to less supply and also a decrease in global demand. Results for this scenario are more mixed. The 1-year CPI swap rate still rises 60% of the time, but rates further out the curve are somewhat more likely to fall. With this in mind, CPI swap curve or TIPS breakeven curve flatteners look like the best way to hedge against an oil supply shock, better than an outright long position in inflation protection. This is good news, since we have previously argued that owning TIPS breakeven curve flatteners is a good idea even without an oil supply shock.8 Corporate bond excess returns respond positively to changes in the oil price. We recommend that investors enter TIPS breakeven curve flatteners, both because short-term inflation expectations will respond more quickly than long-term expectations to stronger realized inflation data and to hedge against the risk of an oil supply shock. Buy Energy Junk Bonds Table 3Corporate Bond Sensitivity To Oil
Bond Market Implications Of An Oil Supply Shock
Bond Market Implications Of An Oil Supply Shock
Corporate bonds are the second segment of the US fixed income market that could be materially impacted by an oil supply shock, particularly bonds in the energy sector. To assess the potential value of corporate bonds as a hedge, we repeat the above analysis but use weekly corporate bond excess returns versus duration-matched Treasuries instead of CPI swap rates. Table 3 shows that investment grade and high-yield corporate bond returns both respond positively to changes in the oil price. Further, we see that energy bonds are more sensitive to the oil price, outperforming the overall index when the oil price rises, and vice-versa. Chart 9 shows that, while oil price sensitivities vary considerably over time, they are almost always positive. Also, energy sector sensitivity has been consistently above that of the benchmark index since 2014. Chart 9Betas Mostly Positive
Betas Mostly Positive
Betas Mostly Positive
Going one step further, we once again use the New York Fed’s supply and demand decomposition to identify weeks when supply and/or demand was responsible for higher oil prices. Because we have more historical data for corporate bonds than for CPI swaps, this time we identify 340 weeks when both supply and demand drove the oil price higher, 123 weeks when only demand drove it higher and 142 weeks when only supply was responsible for the higher oil price (Table 4). Table 4Weekly Corporate Bond Excess Returns (BPs) When Brent Oil Price Increases
Bond Market Implications Of An Oil Supply Shock
Bond Market Implications Of An Oil Supply Shock
Results for the ‘Demand & Supply Driven’ and ‘Demand Driven’ scenarios show that higher oil prices boost excess returns to both investment grade and high-yield corporate bonds more than half the time. Energy bonds also tend to outperform their respective benchmark indexes in the ‘Demand & Supply Driven’ scenario, but perform roughly in-line with the benchmark in the ‘Demand Driven’ scenario. But once again, it is the ‘Supply Driven’ scenario that we are most interested in. Here, we see that an oil supply disruption that leads to higher oil prices also leads to lower corporate bond excess returns. This is true for both the investment grade and high-yield indexes and for energy bonds in both rating categories. However, we also note that high-yield energy debt significantly outperforms the overall junk index during these “risk off” periods. In contrast, investment grade energy debt is not a clear outperformer. Chart 10HY Energy Spreads Are Very Attractive
HY Energy Spreads Are Very Attractive
HY Energy Spreads Are Very Attractive
These results line up with our intuition. When oil prices are driven higher by demand it could simply be a sign of strong economic growth and not any specific trend related to the energy sector. As such, we’d expect all corporate bonds to perform well in those scenarios, but wouldn’t necessarily expect energy debt to outperform. However, supply disruptions in the Middle East directly benefit US shale oil players, whose debt is principally found in the high-yield energy sector. The investment grade energy sector is less exposed to the US shale space, and its documented outperformance in the ‘Supply Driven’ scenario is weaker as a result. We already recommend an overweight allocation to high-yield bonds and a neutral allocation to investment grade corporates. Within that overweight allocation to high-yield bonds, we recommend shifting some exposure toward the energy sector for two reasons. First, high-yield energy was severely beaten-down last year and is ripe for a rebound if global economic growth recovers, as we expect (Chart 10). Second, our analysis suggests that an allocation to energy will help mitigate losses in the event of a renewed flaring of US/Iranian tensions that removes oil supply from the market. Bottom Line: We recommend that investors initiate TIPS breakeven curve flatteners (or CPI swap curve flatteners) and add exposure to the high-yield energy sector. Both positions look attractive on their own terms, but will also help hedge the risk of an oil supply disruption if US/Iranian tensions flare back up in the months ahead. Ryan Swift US Bond Strategist rswift@bcaresearch.com Footnotes 1 The others are: the output gap, the US dollar and sentiment. For more details please see US Bond Strategy Weekly Report, “Bond Kitchen”, dated April 9, 2019, available at usbs.bcaresearch.com 2 The Markit index is used in the construction of the Global PMI shown in Chart 2, 3 For more details on the politics behind the US/Iran conflict please see Geopolitical Strategy Special Alert, “A Reprieve Amid The Bull Market In Iran Tensions”, dated January 8, 2020, available at gps.bcaresearch.com 4 Please see US Bond Strategy Special Report, “2020 Key Views: US Fixed Income”, dated December 10, 2019, available at usbs.bcaresearch.com 5 Please see Global Investment Strategy Weekly Report, “Elizabeth Warren And The Markets”, dated September 13, 2019, available at gis.bcaresearch.com 6 In the TIPS market, an example of a breakeven curve flattener would be to buy 2-year TIPS and short the 2-year nominal Treasury note, while also buying the 10-year nominal Treasury note and shorting the 10-year TIPS. 7 https://www.newyorkfed.org/research/policy/oil_price_dynamics_report 8 Please see US Bond Strategy Weekly Report, “Position For Modest Curve Steepening”, dated October 29, 2019, available at usbs.bcaresearch.com Fixed Income Sector Performance Recommended Portfolio Specification
Highlights Global Investment Strategy View Matrix
Time For A Breather
Time For A Breather
Receding trade tensions; diminished risks of a hard Brexit; reduced odds of a victory for Elizabeth Warren in the US presidential elections; liquidity injections by most major central banks; and improved sentiment about the state of the global economy all helped push stocks higher late last year. Some clouds have formed over the outlook since the start of the year, however. The December US ISM manufacturing index fell to the lowest level since 2009, while the PMIs in the euro area, UK, and Japan gave up some of their November gains. The conflict between the US and Iran also flared up. Although tensions have abated in recent days, BCA’s geopolitical strategists worry that the détente may not last. The US is seeking to shift its military focus towards East Asia in order to counter China’s ascendency. They argue that this could create a dangerous power vacuum in the Middle East. Stock market sentiment is quite bullish at the moment, which makes equities more vulnerable to any disappointing news. While we are maintaining our positive 12-month view on global equities and high-yield credit in anticipation that global growth will rebound convincingly later this year, we are downgrading our tactical 3-month view to neutral. Ho Ho Ho After handing investors a sack of coal last Christmas, Santa was back to his true self this past holiday season. Global equities rose 3.4% in December, finishing the year off with a stellar fourth quarter which saw the MSCI All-Country World index surge by 8.6%. Five forces helped push stocks higher: 1) Receding trade tensions; 2) Diminished risks of a hard Brexit; 3) Reduced odds of a victory for Elizabeth Warren in the US presidential elections; 4) Liquidity injections by the Fed, ECB, and the People’s Bank of China; and arguably most importantly 5) Improved sentiment about the state of the global economy. Tarrified No More Trade tensions subsided sharply after China and the US reached a “Phase One” agreement. The deal prevented tariffs from rising on December 15th on $160 billion of Chinese imports. It also rolls back the tariff rate from 15% to 7.5% on about $120 billion in imports that have been subject to levies since September (Chart 1). Chart 1The Evolution Of The US-China Trade War
The Evolution Of The US-China Trade War
The Evolution Of The US-China Trade War
In addition, the Trump Administration allowed the November 13th deadline on European auto tariffs to lapse. This suggests that the US is unlikely to impose tariffs under the Section 232 investigation of auto imports. The auto sector has been at the forefront of the global manufacturing slowdown, so any good news for that industry is welcome. To top it all off, the US House of Representatives ratified the USMCA, the successor to NAFTA, on December 19th. We expect it to be signed into law in the first quarter of this year. Brexit Risks Fading... Chart 2The Majority Of British Voters Aren't Keen On Brexit
The Majority Of British Voters Aren't Keen On Brexit
The Majority Of British Voters Aren't Keen On Brexit
Boris Johnson’s commanding victory in the UK elections has given him the votes necessary to push a withdrawal bill through parliament by the end of the month. The British government will then seek to negotiate a free trade agreement by the end of the year. A “no-deal” Brexit is unacceptable to the majority of British voters (Chart 2). As such, the Johnson government will have no choice but to strike a deal with the EU. ... While Trump Gains On the other side of the Atlantic, President Trump’s re-election prospects improved late last year despite (and perhaps because of) the ongoing impeachment process. There is an uncanny correlation between the probability that betting markets assign to a Trump victory and the value of the S&P 500 (Chart 3). Chart 3An Uncanny Correlation
An Uncanny Correlation
An Uncanny Correlation
Chart 4Who Will Win The 2020 Democratic Nomination?
Time For A Breather
Time For A Breather
It certainly has not hurt market sentiment that Elizabeth Warren’s poll numbers have been dropping recently (Chart 4). Warren’s best hope was to squeeze out Bernie Sanders as soon as possible, thereby leaving the far-left populist lane all to herself. That dream appears to have been dashed, which suggests that even if Trump loses, a centrist like Joe Biden could emerge as president. An Uneasy Truce It remains to be seen how President Trump’s decision to assassinate General Qassem Soleimani, a top Iranian commander, will affect the election outcome. A YouGov/HuffPost poll taken over the weekend revealed that 43% of Americans approved of the airstrike against Soleimani compared to 38% that disapproved.1 History suggests that the public’s patience for war will quickly wear thin if it results in American casualties or significantly higher gasoline prices. Neither side has an incentive to allow the conflict to spiral out of control. Foreign minister Mohammad Javad Zarif tweeted on Tuesday shortly after Iran lobbed missiles at two US military bases that Iran had “concluded” its retaliatory strike, adding that “We do not seek escalation or war.” Despite claims on Iranian public television that 80 “American terrorists” were killed in the attacks, no US troops were harmed. This suggests that the Iranians may be putting on a show for domestic consumption. The US economy is less vulnerable to spikes in oil prices than in the past. Nevertheless, plenty of things could still go wrong. BCA’s geopolitical team, led by Matt Gertken, has argued that the US is seeking to shift its military focus towards East Asia in order to counter China’s ascendency. This could create a dangerous power vacuum in the Middle East. There is also a risk that President Trump overplays his hand. Contrary to the President’s claims, Soleimani was quite popular in Iran (Chart 5). If Trump begins to mock the Iranian leadership’s feeble response, Iran will have no choice but to take more aggressive action. Chart 5Soleimani Was More Popular In Iran Than Trump Claims
Time For A Breather
Time For A Breather
Chart 6US Economy Is Less Vulnerable To Spikes In Oil Prices Than In The Past
US Economy Is Less Vulnerable To Spikes In Oil Prices Than In The Past
US Economy Is Less Vulnerable To Spikes In Oil Prices Than In The Past
One thing that could embolden Trump is that the US economy is less vulnerable to spikes in oil prices than in the past. US oil output reached as high as 12.9 mm b/d in 2019, allowing the country to become a net exporter of oil for the first time in history (Chart 6). Any increase in oil prices would incentivize further domestic production, which would help bring prices back down. The US economy has also become less energy intensive – it takes less than half as much oil to produce a unit of GDP today than it did in the early 1980s. Finally, unlike in the past, the Fed will not need to raise rates in response to higher oil prices due to the fact that inflation expectations are currently well anchored. In fact, as we discuss below, we expect the Fed and other central banks to continue to provide a tailwind for growth over the course of 2020. The Fed’s “It’s Not QE” QE Program The jump in overnight lending rates in mid-September torpedoed the Federal Reserve’s efforts to shrink its balance sheet. Thanks to a steady stream of Treasury bill purchases since then, the Fed’s asset holdings have swelled by over $400 billion, reversing more than half of the decline observed since early 2018 (Chart 7). Chart 7Fed's Asset Holdings Are Growing Anew
Fed's Asset Holdings Are Growing Anew
Fed's Asset Holdings Are Growing Anew
Chart 8The Fed's Balance-Sheet Expansion Helped Fuel The Dot-Com Bubble
The Fed's Balance-Sheet Expansion Helped Fuel The Dot-Com Bubble
The Fed's Balance-Sheet Expansion Helped Fuel The Dot-Com Bubble
The Fed has insisted that its latest intervention does not amount to a new QE program, stressing that it is buying short-term securities rather than long-dated bonds. In so doing, it is simply creating bank reserves, rather than seeking to suppress the term premium by altering the maturity structure of the private sector’s holdings of government debt. Nevertheless, even such straightforward interventions have proven to be powerful signaling tools. By growing its balance sheet, a central bank is implicitly promising to keep monetary policy very accommodative. It is worth remembering that the run-up in the NASDAQ in 1999 coincided with a significant balance-sheet expansion by the Fed in response to Y2K fears, which came on the heels of three “insurance cuts” in 1998 (Chart 8). Gentle Jay Paves The Way Chart 9Inflation Expectations Remain Muted
Inflation Expectations Remain Muted
Inflation Expectations Remain Muted
In 2000, the Fed moved quickly to reverse the liquidity injection it had orchestrated the prior year. We do not expect such a reversal anytime soon. Moreover, unlike in 2000, when the Federal Reserve kept raising rates – ultimately bringing the Fed funds rate up to 6.5% in May 2000 – the Fed is likely to stay on hold this year. The Fed’s ongoing strategic policy review is poised to move the central bank even closer towards explicitly adopting an average inflation target of 2% over the course of a business cycle. Since inflation tends to fall during recessions, this implies that the Fed will seek to target an inflation rate somewhat higher than 2% during expansions. Realized core PCE inflation has averaged only 1.6% since the recession ended. Both market-based and survey-based measures of long-term inflation expectations remain downbeat (Chart 9). This suggests that the bar for raising rates this year is quite high. More Monetary Easing In The Euro Area And China Chart 10Chinese Monetary Easing Should Help Global Growth Bottom Out
Chinese Monetary Easing Should Help Global Growth Bottom Out
Chinese Monetary Easing Should Help Global Growth Bottom Out
The ECB resumed its QE program in November after a 10-month hiatus. While the current pace of €20 billion in monthly asset purchases is well below the prior pace of €80 billion, the central bank did say it would continue buying assets for “as long as necessary” to bring inflation up to its target. The language harkens back to Mario Draghi’s 2012 “whatever it takes” pledge, this time applied to the ECB’s inflation mandate. Not to be outdone, the People’s Bank of China cut the reserve requirement ratio by 50 basis points last week, a move that will release RMB 800 billion ($US 115 billion) of fresh liquidity into the banking system. Historically, cuts in reserve requirements have led to faster credit growth and ultimately, to stronger economic growth both in China and abroad (Chart 10). The PBOC has also instructed lenders to adopt the Loan Prime Rate (LPR) as the new benchmark lending rate. The LPR currently sits 20bps below the old benchmark rate (Chart 11). Hence, the PBOC’s order amounts to a stealth rate cut. Our China strategists expect further reductions in the LPR over the next six months. In addition, the crackdown on shadow bank lending seems to be subsiding, which bodes well for overall credit growth later this year (Chart 12). Chart 11China: Stealth Monetary Easing
China: Stealth Monetary Easing
China: Stealth Monetary Easing
Chart 12Crackdown On Shadow Banking In China Is Easing
Crackdown On Shadow Banking In China Is Easing
Crackdown On Shadow Banking In China Is Easing
Rising Economic Confidence Chart 13Recession Fears Amongst Economists Began To Gather Steam At The Start Of Last Year
Recession Fears Amongst Economists Began To Gather Steam At The Start Of Last Year
Recession Fears Amongst Economists Began To Gather Steam At The Start Of Last Year
Chart 14The Wider Public Was Also Worried About A Downturn
The Wider Public Was Also Worried About A Downturn
The Wider Public Was Also Worried About A Downturn
At the start of 2019, nearly half of US CFOs thought the economy would be in a recession by the end of the year. Similarly, two-thirds of European CFOs and four-fifths of Canadian CFOs expected their respective economies to succumb to recession. Professional economists were equally dire (Chart 13). Households also became increasingly worried about a downturn. Google searches for “recession” spiked to near 2009-highs last summer (Chart 14). The mood has certainly improved since then. According to the latest Duke CFO survey, optimism about the economic outlook has increased. More importantly, CFO optimism about the prospects for their own firms has risen to the highest level in the 18-year history of the survey (Chart 15). Chart 15CFOs Have Become More Optimistic Of Late
CFOs Have Become More Optimistic Of Late
CFOs Have Become More Optimistic Of Late
Show Me The Money Going forward, global growth needs to accelerate in order to validate the improved confidence of CFOs and investors alike. We think that it will, thanks to the lagged effects from the easing in financial conditions in 2019, a turn in the global inventory cycle, a de-escalation in the trade war, easier fiscal policy in the UK and euro area, and re-upped fiscal/credit stimulus in China. For now, however, the economic data remains mixed. On the positive side, household spending is still robust across most of the world, a fact that has been reflected in the resilience of service-sector PMIs (Chart 16). Chart 16AThe Service Sector Has Remained Resilient (I)
The Service Sector Has Remained Resilient (I)
The Service Sector Has Remained Resilient (I)
Chart 16BThe Service Sector Has Remained Resilient (II)
The Service Sector Has Remained Resilient (II)
The Service Sector Has Remained Resilient (II)
Chart 17US Wage Growth Has Picked Up, Especially At The Bottom Of The Income Distribution
Time For A Breather
Time For A Breather
Chart 18US Housing Backdrop Is Solid
US Housing Backdrop Is Solid
US Housing Backdrop Is Solid
The US consumer, in particular, is showing little signs of fatigue. The Atlanta Fed GDPNow estimates that real personal consumption grew by 2.4% in the fourth quarter, having increased at an average annualized pace of 3% in the first three quarters of 2019. Both a strong labor market and housing market have buoyed US consumption. Payrolls have risen by an average of 200K per month for the past six months, double what is necessary to keep up with labor force growth. This week’s strong ADP release – which featured a 29K jump in jobs in goods-producing industries in December, the best since April – suggests that today’s jobs report will remain healthy. In addition, wage growth has picked up, particularly at the bottom of the income distribution (Chart 17). Residential construction has also been strong. Homebuilder sentiment reached the best level since June 1999 (Chart 18). Global Manufacturing: Too Early To Call The All-Clear The outlook for manufacturing remains the biggest question mark in the global economy. The US ISM manufacturing index dropped to 47.2 in December, its lowest level since June 2009. The composition of the report was poor, with the new orders-to-inventory ratio dropping close to recent lows. Chart 19Other US Manufacturing Gauges Are Not As Weak As The ISM
Other US Manufacturing Gauges Are Not As Weak As The ISM
Other US Manufacturing Gauges Are Not As Weak As The ISM
We would discount the ISM report to some extent. The regional Fed manufacturing indices have not been nearly as disappointing as the ISM (Chart 19). The Markit PMI, which tracks US manufacturing activity better than the ISM, clocked in at a respectable 52.4 in December, down only slightly from November’s reading of 52.6. Nevertheless, it is hard to be excited about the near-term outlook for US manufacturing, especially in light of Boeing’s decision to suspend production of the 737 Max temporarily. Most estimates suggest that the production halt will reduce real US GDP growth by 0.3%-to-0.5% in the first quarter. The euro area manufacturing PMI gave up some of its November gains, falling to 46.3 in December. While the index is still above its September low of 45.7, it has been under 50 for 11 straight months now. The UK and Japanese PMI also retreated. Chinese manufacturing has shown clearer signs of bottoming out. Despite dipping in December, the private sector Caixin manufacturing PMI remains near its 2017 highs. The official PMI published by the National Bureau of Statistics is less upbeat, but still managed to come in slightly above 50 in December. The production subcomponent reached the highest level since August 2018. Reflecting the positive trend in the Chinese economy, Korean exports to China rose by 3.3% in December, the first positive growth rate in 14 months (Chart 20). Taiwan’s exports have also rebounded. The manufacturing PMI rose above 50 in both economies in December. In Taiwan’s case, this was the first time the PMI moved into expansionary territory since September 2018. On balance, we continue to expect global manufacturing to recover in 2020. This is in line with our observation that global manufacturing cycles typically last three years, with 18 months of weaker growth followed by 18 months of stronger growth (Chart 21). That said, the weakness in European and US manufacturing (at least judged by the ISM) is likely to give investors pause. Chart 20Some Positive Signs Emerging From Korea And Taiwan
Time For A Breather
Time For A Breather
Chart 21A Fairly Regular Three-Year Manufacturing Cycle
A Fairly Regular Three-Year Manufacturing Cycle
A Fairly Regular Three-Year Manufacturing Cycle
Investment Conclusions We turned bullish on stocks in late 2018, having temporarily moved to the sidelines during the summer of that year. Global equities have gained 25% since our upgrade. We see another 10% of upside for 2020, led by European and EM bourses. Despite its recent gains, the real value of the MSCI All-Country World Index is only 3% above its prior peak in January 2018. The 12-month forward PE ratio of 16.3 is still somewhat lower than it was back then. The valuation picture is even more enticing if we compare equity earnings yields with bond yields, which is tantamount to computing a rough equity risk premium (ERP). The global ERP remains quite high by historic standards, especially outside the US where earnings yields are higher and bond yields are generally lower (Chart 22). Chart 22The Equity Risk Premium Is Fairly High, Especially Outside The US
The Equity Risk Premium Is Fairly High, Especially Outside The US
The Equity Risk Premium Is Fairly High, Especially Outside The US
Chart 23Stock Market Sentiment Is Quite Bullish
Stock Market Sentiment Is Quite Bullish
Stock Market Sentiment Is Quite Bullish
Nevertheless, sentiment is quite positive towards stocks at the moment (Chart 23). Elevated bullish sentiment, against the backdrop of ongoing uncertainty about the outlook for global manufacturing and an uneasy truce between the US and Iran, poses a near-term headwind to risk assets. As such, while we are maintaining our positive 12-month view on global equities and high-yield credit, we are downgrading our tactical 3-month view to neutral for the time being. We do not regard this as a major realignment of our views; we will turn tactically bullish again if stocks dip about 5% from current levels. Peter Berezin Chief Global Strategist peterb@bcaresearch.com Footnotes 1 Ariel Edwards-Levy, “Here's What Americans Think About Trump's Iran Policy,” TheHuffingtonPost.com (January 6, 2020). MacroQuant Model And Current Subjective Scores
Time For A Breather
Time For A Breather
Strategic Recommendations Closed Trades
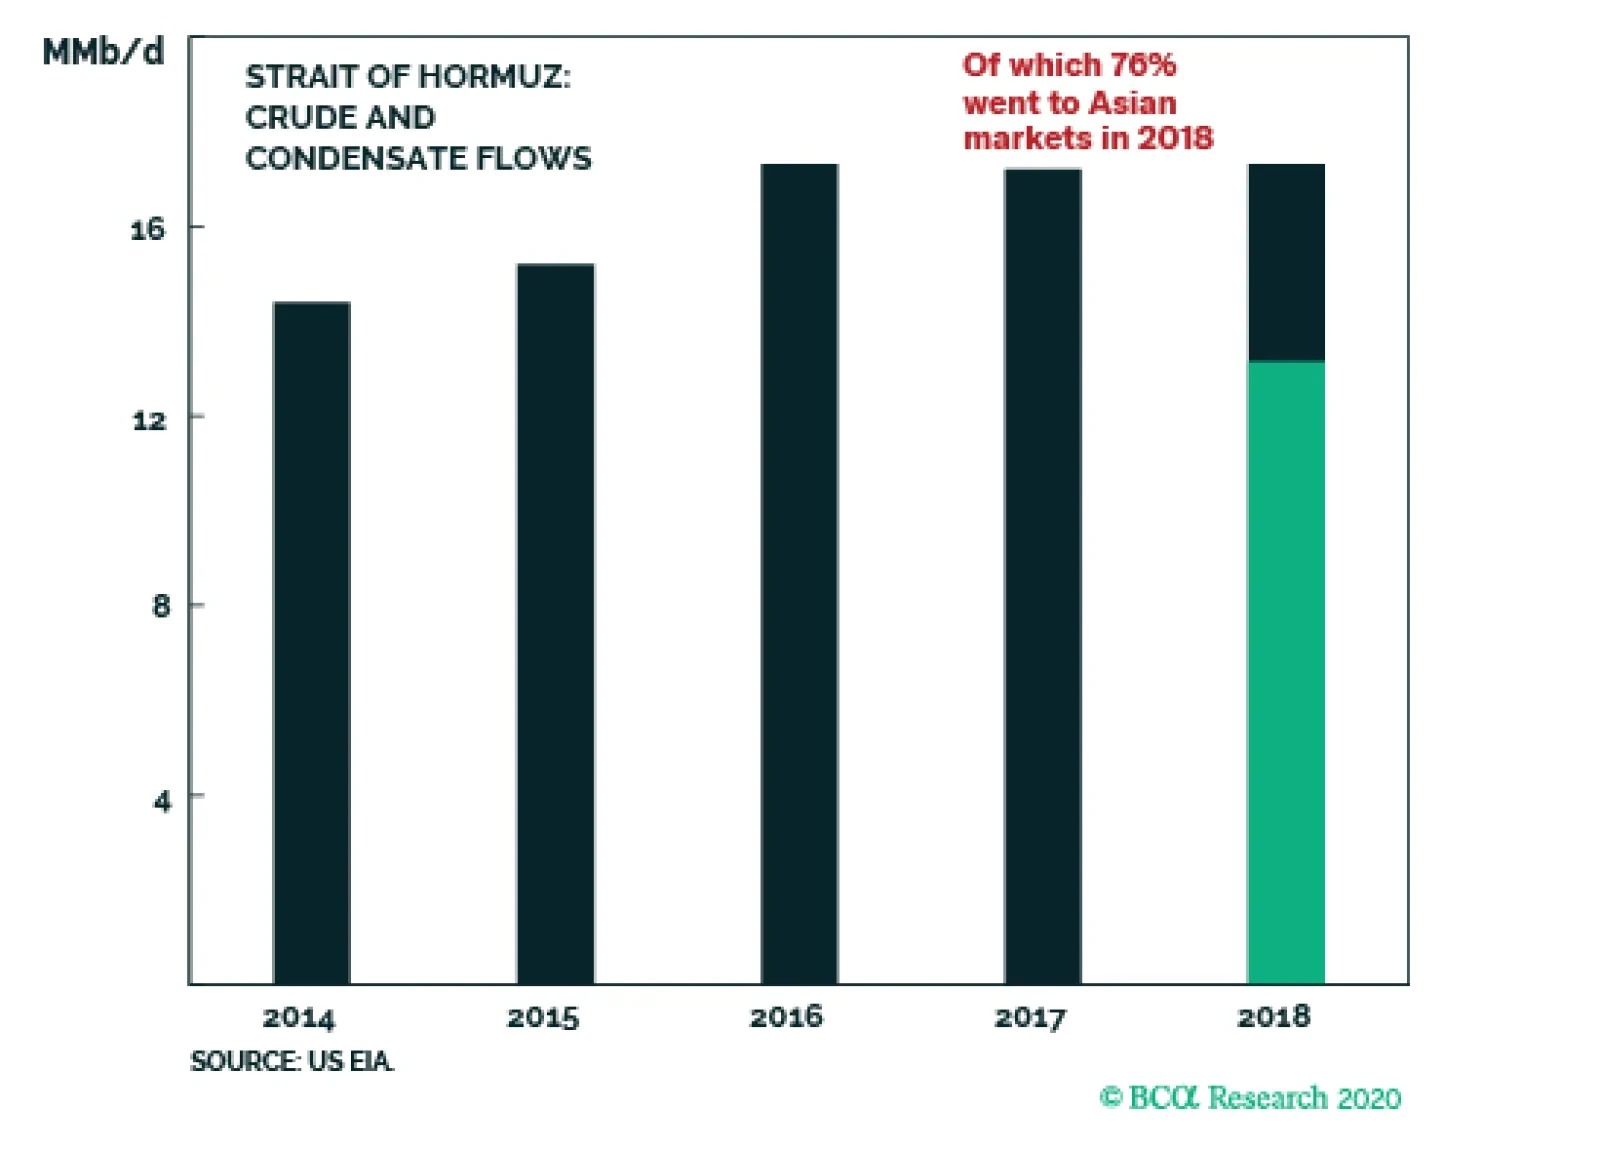
In the immediate aftermath of the Soleimani assassination, the oil market’s attention was drawn to the ever-present threat to shipping through the Strait of Hormuz. Some 20% of global oil supply transits the strait daily. Iran has repeatedly declared it would…
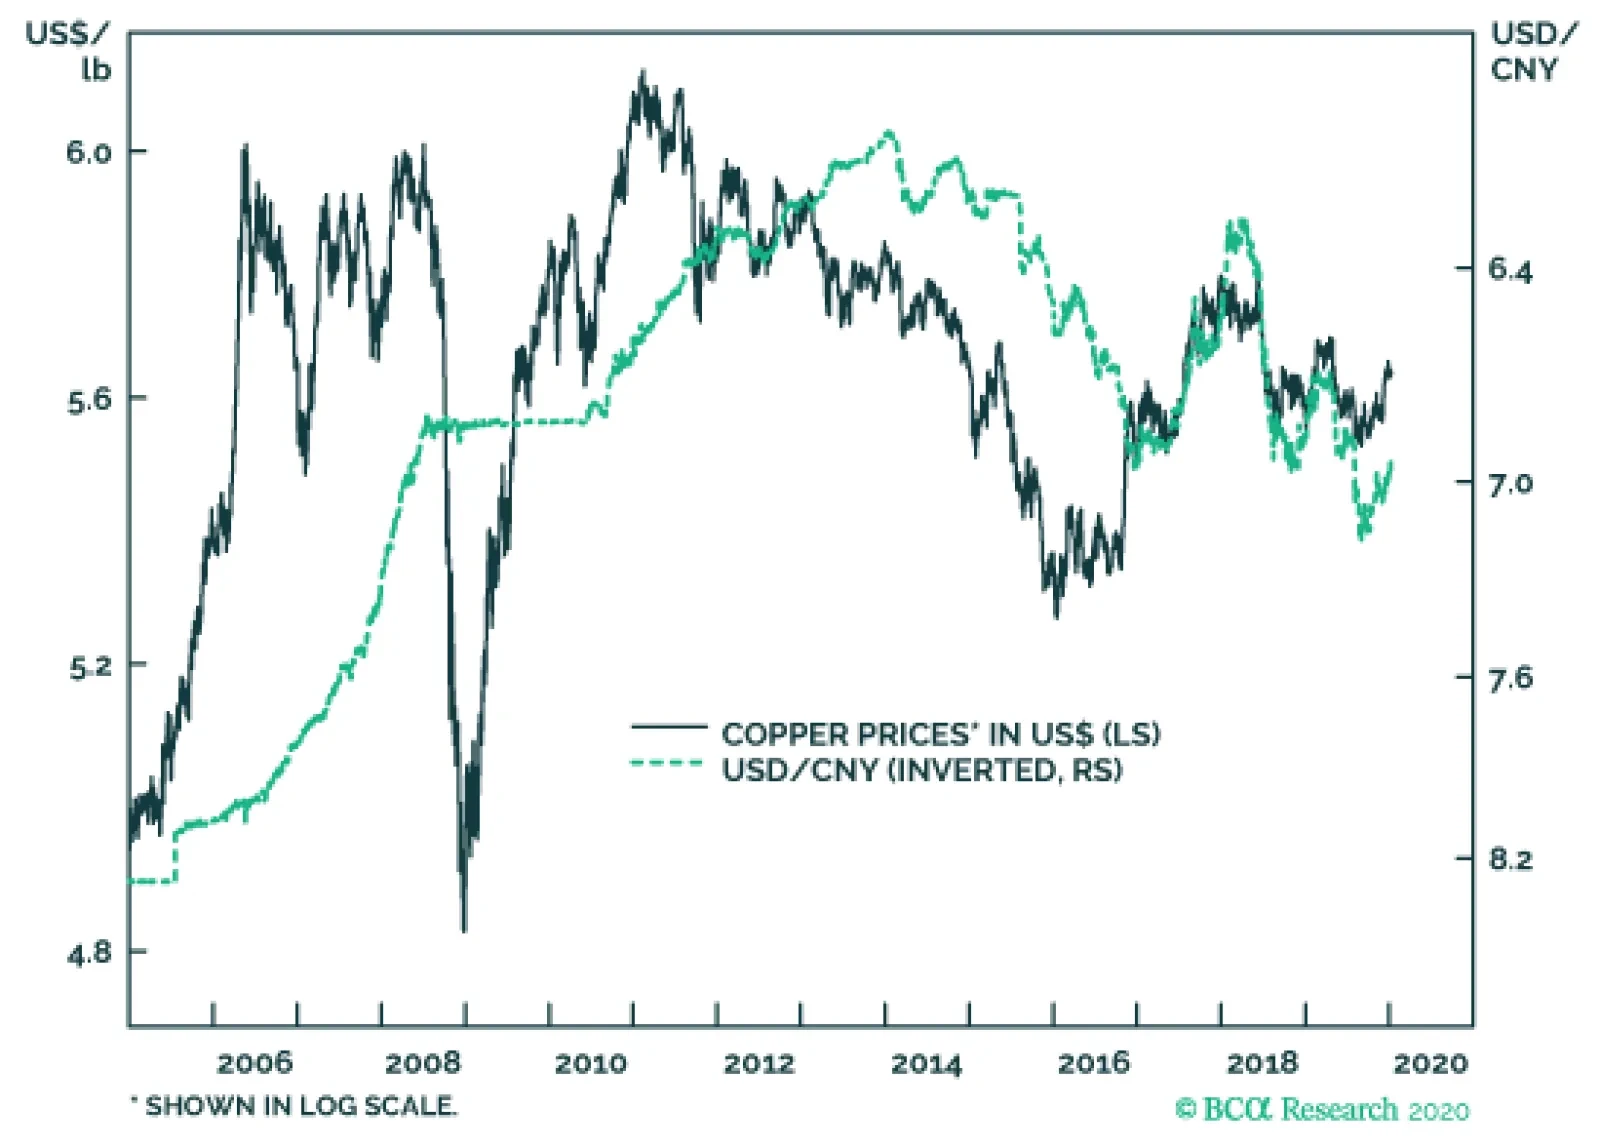
Global money and credit trends indicate that copper is poised for more upside. Our US financial liquidity index is rapidly escalating, which points toward a global economic recovery. Moreover, stronger global growth will harm the greenback, creating another…
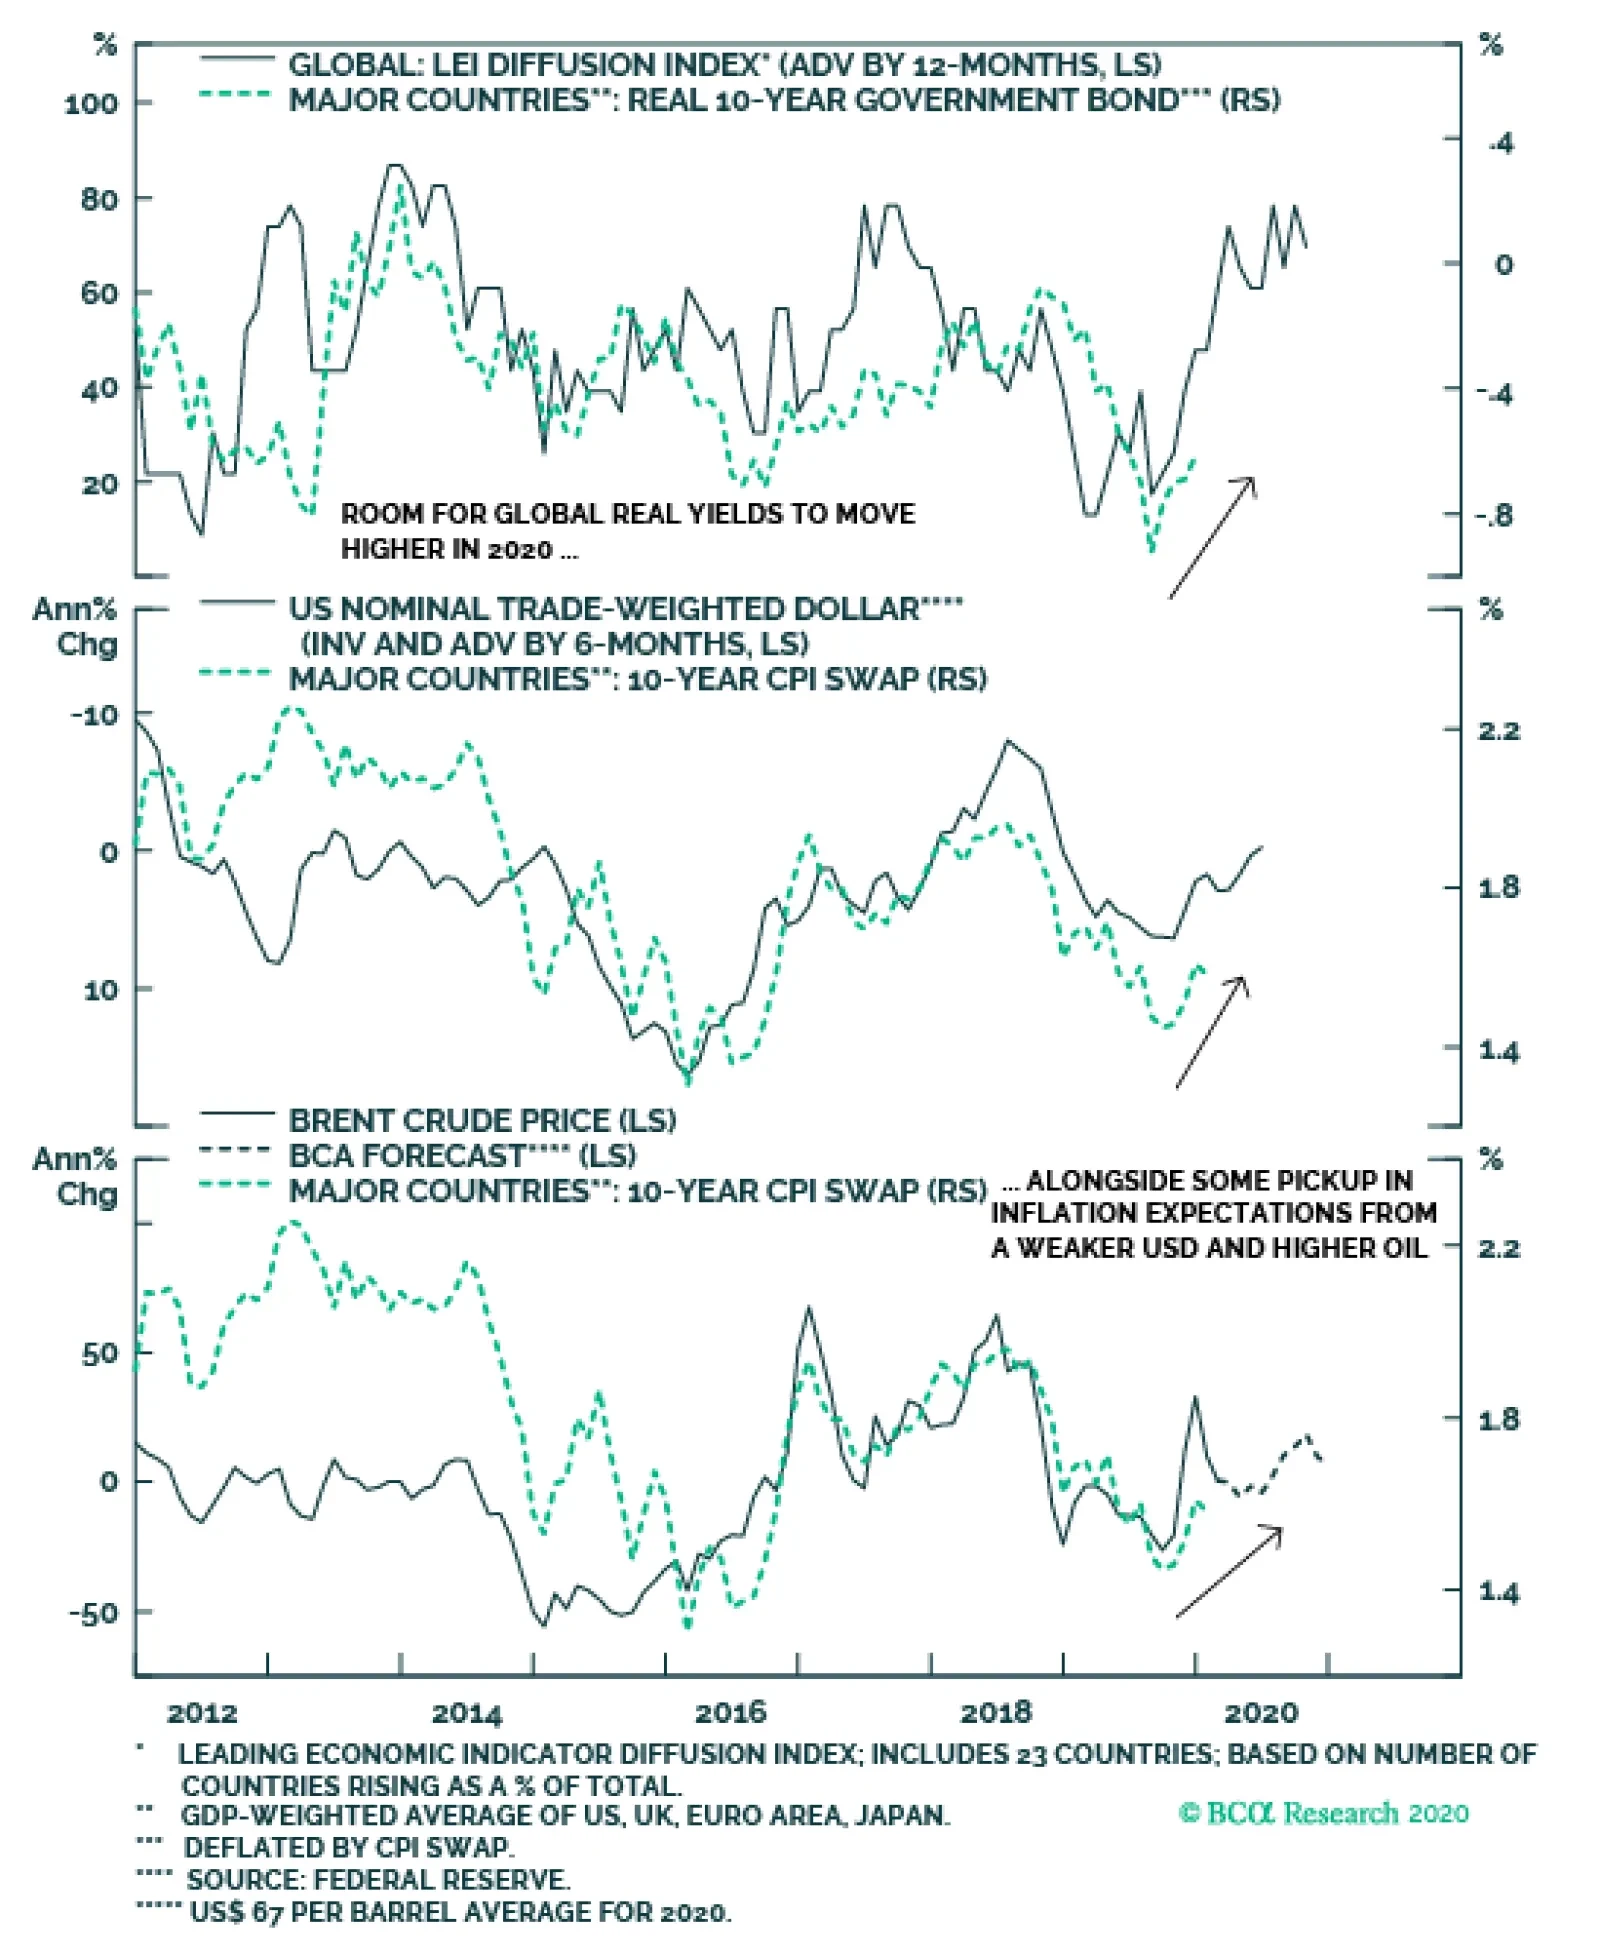
The expected improvement in global growth in 2020 would normally be anticipated to put upward pressure on the real component of global government bond yields. However, with all major developed market central banks now expressing a desire to keep policy as…
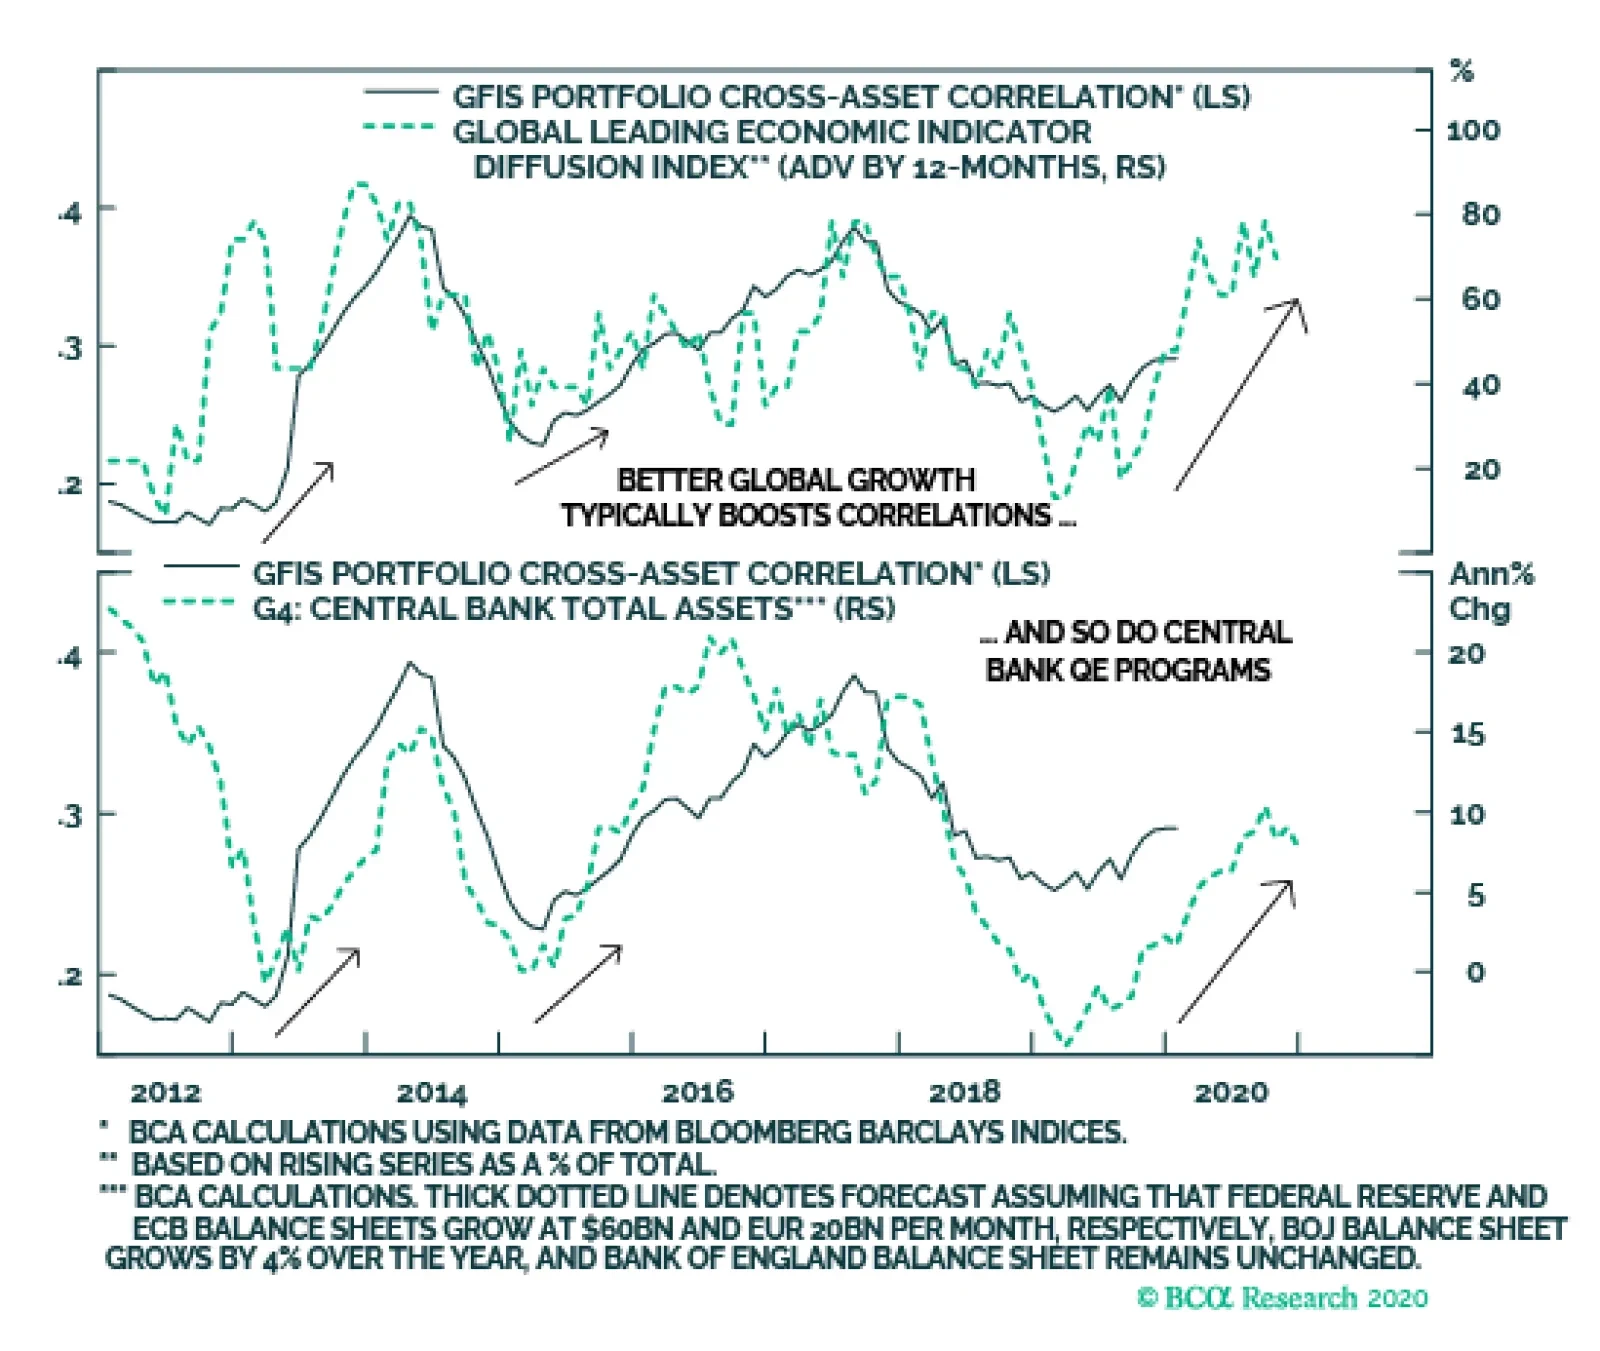
Cross-asset correlations across fixed income sectors should drift higher alongside a more broad-based upturn in global economic growth and expanding monetary liquidity. This pickup in correlations suggests that there is scope for markets that lagged the 2019…