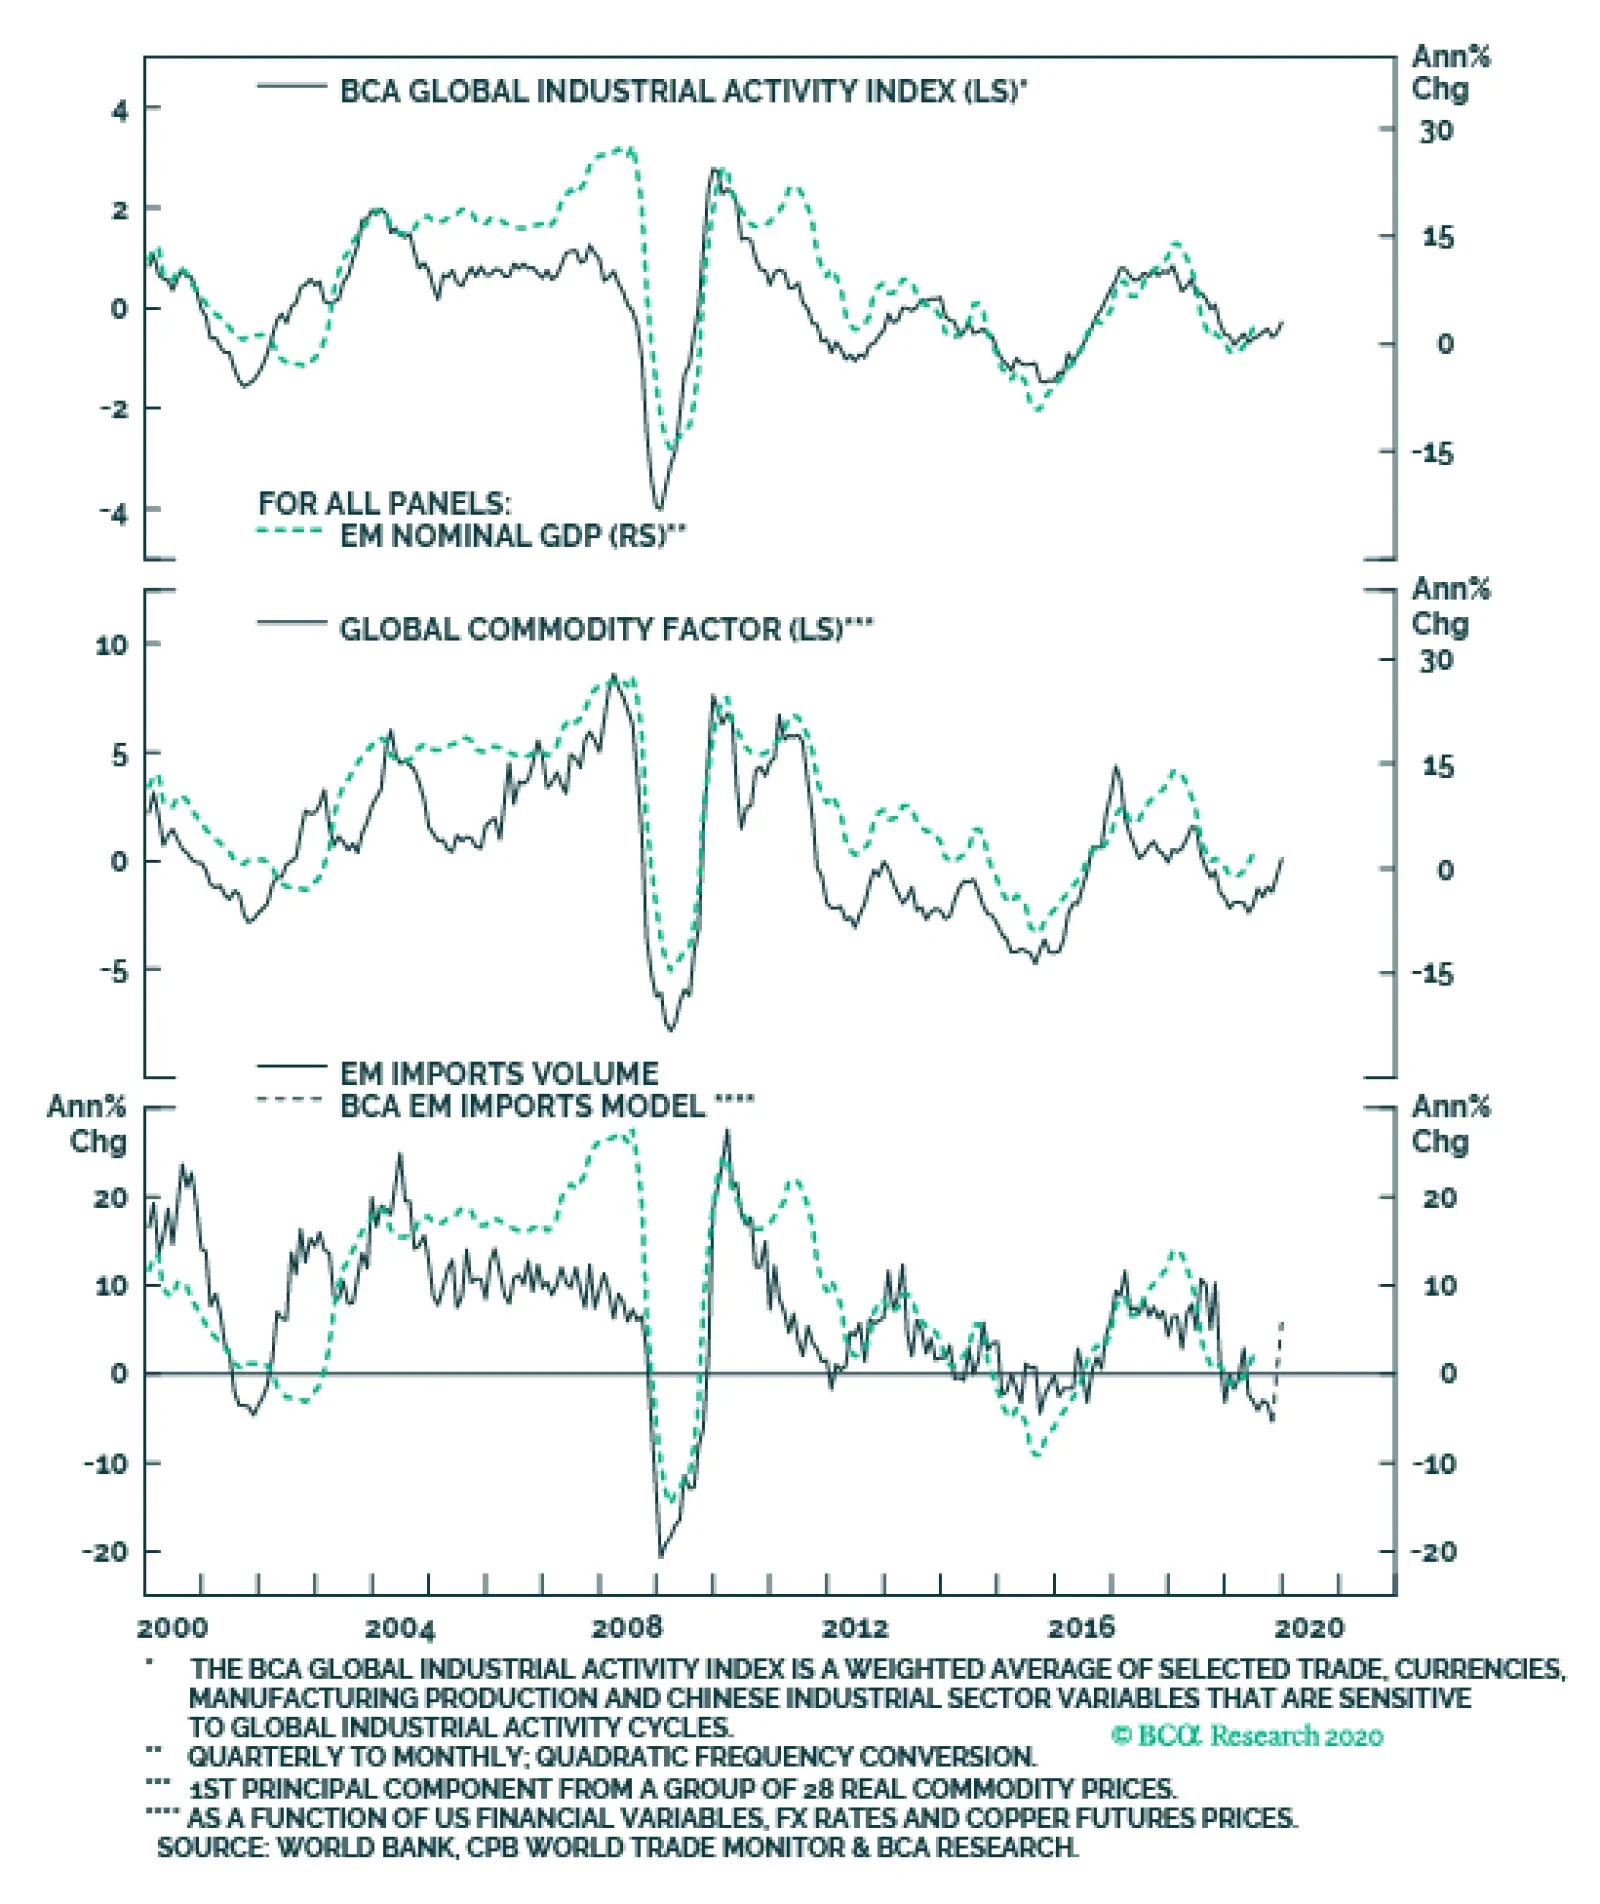
Global

Highlights Global growth is poised to accelerate this year, although the spread of the coronavirus could dampen spending in the very short term. History suggests that the likelihood of a recession rises when unemployment falls to very low levels. Three channels have been proposed to explain why that is: 1) Low unemployment can prompt households and businesses to overextend themselves, making the economy more fragile; 2) Faster wage growth stemming from a tight labor market can compress profit margins, leading to less capital spending and hiring; 3) Shrinking spare capacity can fuel inflation, forcing central banks to raise rates. The first channel is highly relevant for some smaller, developed economies where housing bubbles have formed and household debt has reached very high levels. However, it is not an immediate concern in the US, Japan, and most of the euro area. We would downplay the importance of the second channel, as faster wage growth is also likely to raise aggregate demand and incentivize firms to increase capital spending on labor-saving technologies. The third channel poses the greatest long-term risk, but is unlikely to be market-relevant this year. Investors should remain bullish on global equities over the next 12-to-18 months. A more prudent stance will be warranted starting in the second half of 2021. Global Equities: Sticking With Bullish Global equities are vulnerable to a short-term correction after having gained 16% since their August lows. Nevertheless, we continue to maintain a positive outlook on stocks for the next 12 months due to our expectation that global growth will gather steam over the course of the year. The latest data on global manufacturing activity has generally been supportive of our constructive thesis. The New York Fed Manufacturing PMI beat expectations, while the Philly Fed PMI jumped nearly 15 points to the highest level in eight months. The business outlook (six months ahead) component of the Philly Fed index rose to its best level since May 2018. European manufacturing should also improve this year. Growth expectations for Germany in the ZEW index surged in January, rising to the highest level since July 2015 (Chart 1). The Sentix and IFO indices have also moved higher. Encouragingly, euro area car registrations rose by 22% year-over-year in December. In the UK, business confidence in the CBI survey of manufacturers surged from -44 in Q3 of 2019 to +23 in Q4, the largest increase in the 62-year history of the survey. Fiscal stimulus and diminished risk of a disorderly Brexit should also bolster growth this year. Chart 1Some Green Shoots Emerging In The Euro Area
Some Green Shoots Emerging In The Euro Area
Some Green Shoots Emerging In The Euro Area
Chart 2EM Asia Is Rebounding
EM Asia Is Rebounding
EM Asia Is Rebounding
The manufacturing and trade data in Asia have been improving. Following last week’s better Chinese trade data, Korean exports recovered on a rate-of-change basis for a fourth month in a row. Japanese exports to China increased for the first time since last February. In Taiwan, industrial production increased by more than expected in December, as did export orders. Our EM Asia Economic Diffusion Index has risen to the highest level since October 2018 (Chart 2). Coronavirus: Nothing To Sneeze At? The outbreak of the coronavirus represents a potential short-term threat to the budding global economic recovery. Conceptually, outbreaks can affect the economy in two ways. One, they can reduce demand by curtailing spending on travel, entertainment, restaurants, or anything that requires close proximity to others. Two, they can reduce supply by causing people to avoid going to work. In practice, the first effect usually dominates the second. As a result, such outbreaks tend to have a deflationary impact. The Brookings Institution estimates that the 2003 SARS epidemic shaved about one percentage point from Chinese growth that year.1 The fact that this outbreak is happening during the Chinese New Year celebrations, when over 400 million people will be on the move, has the potential to exacerbate the transmission of the virus, and in the process, amplify the economic damage. That said, while it is from the same class of zoonotic viruses, early indications suggest that this particular strain is less lethal than SARS. In addition, the Chinese authorities have moved faster to address the risks than they did during the SARS outbreak. The government has effectively quarantined Wuhan, a city of 11 million people, where the virus appears to have originated. They have also sequenced the virus and shared the information with the global medical community. This has allowed the US Centers for Disease Control (CDC) to develop a test for the virus, which is likely to become available over the coming weeks. The Dark Side Of Low Unemployment Provided the coronavirus outbreak is contained, stronger global growth should continue to soak up lingering labor market slack. This raises the question of whether, at some point, declining unemployment could become counterproductive. The outbreak of the coronavirus represents a potential short-term threat to the budding global economic recovery. The unemployment rate in the OECD currently stands at 5.1%, below the low of 5.5% set in 2007 (Chart 3). In the US, the unemployment rate has dropped to a 50-year low. Chart 3Unemployment Rates Are Below Their Pre-Crisis Lows In Most Economies
Who’s Afraid Of Low Unemployment?
Who’s Afraid Of Low Unemployment?
No one would deny that the decline in unemployment since the financial crisis has been a welcome development. However, it does carry one major risk: Historically, the likelihood of a recession has risen when unemployment has fallen to very low levels (Chart 4). Chart 4Recessions Become More Likely When The Labor Market Begins To Overheat
Who’s Afraid Of Low Unemployment?
Who’s Afraid Of Low Unemployment?
Three channels have been proposed to explain this positive correlation: 1) Low unemployment can prompt households and businesses to overextend themselves, making the economy more fragile; 2) Faster wage growth stemming from a tight labor market can compress profit margins, leading to less capital spending and hiring; 3) Shrinking spare capacity can fuel inflation. This can force central banks to raise rates, choking off growth. Let’s examine each in turn. Unemployment And Irrational Exuberance Chart 5Growing Housing Imbalances In Some Economies
Growing Housing Imbalances In Some Economies
Growing Housing Imbalances In Some Economies
A strong economy promotes risk-taking. While some risk-taking is essential for capitalism, an excessive amount can lead to the buildup of imbalances, thereby setting the stage for an eventual downturn. In Australia, New Zealand, Canada, and the Scandinavian economies, the combination of low interest rates and strong economic growth has stoked debt-fueled housing bubbles (Chart 5, panel 3). As we discussed last week, higher interest rates in those economies could sow the seeds for economic distress.2 In most other countries, financial imbalances are not severe enough to trigger recessions. Chart 6 shows that the private-sector financial balance – the difference between what the private sector earns and spends – still stands at a healthy surplus of 3.4% of GDP in advanced economies. In 2007, the private-sector financial balance fell to 0.4% in advanced economies, reaching a deficit of 2% in the US. The private-sector balance also deteriorated sharply in the lead-up to the 2001 recession (Chart 7). Chart 6The Private Sector Spends Less Than It Earns In Most Economies
Who’s Afraid Of Low Unemployment?
Who’s Afraid Of Low Unemployment?
Chart 7The Private-Sector Surplus Is Larger Than It Was Before The End Of Previous Expansions
The Private-Sector Surplus Is Larger Than It Was Before The End Of Previous Expansions
The Private-Sector Surplus Is Larger Than It Was Before The End Of Previous Expansions
In the US, the personal savings rate has risen to nearly 8%, much higher than one would expect based on the level of household net worth (Chart 8). Despite growing at around 2.5% in 2018/19, real personal consumption has increased at a slower pace than predicted by the level of consumer confidence. This suggests that households have maintained a fairly prudent disposition. Consistent with this, the ratio of household debt-to-disposable income has declined by 32 percentage points since 2008. Chart 8Households Are Saving More Than One Would Expect
Households Are Saving More Than One Would Expect
Households Are Saving More Than One Would Expect
Granted, some credit categories have seen large increases (Chart 9). Student debt has risen to 9% of disposable income. Auto loans have moved back to their pre-recession highs. We would not worry too much about the former, as the vast majority of student debt is guaranteed by the government. Auto loans are more of a concern. However, it is important to keep in mind that the auto loan market is less than one-sixth as large as the mortgage market. Moreover, after loosening lending standards for vehicle loans between 2011 and 2016, banks have since tightened them. This adjustment appears to be largely complete. Lending standards did not tighten any further in the latest Senior Loan Officer Survey, while demand for auto loans rose at the fastest pace in two years. The share of auto loans falling into delinquency has been trending lower, which suggests that delinquency rates are peaking (Chart 10). Chart 9US Household Debt Levels Have Fallen, Despite Increases in Student And Auto Loans
US Household Debt Levels Have Fallen, Despite Increases in Student And Auto Loans
US Household Debt Levels Have Fallen, Despite Increases in Student And Auto Loans
Chart 10Auto Loans: Monitoring Trends In Credit Standards And Delinquency Rates
Auto Loans: Monitoring Trends In Credit Standards And Delinquency Rates
Auto Loans: Monitoring Trends In Credit Standards And Delinquency Rates
Lastly, we would point out that despite all the hoopla over the state of the auto market, auto loan asset-backed securities have performed well (Chart 11). While default rates have risen, lenders have generally set interest rates high enough to absorb incoming losses. Chart 11Securitized Auto Loans Have Performed Well
Securitized Auto Loans Have Performed Well
Securitized Auto Loans Have Performed Well
Will Falling Profit Margins Derail The Expansion? Profit margins usually peak a few years before the onset of a recessions (Chart 12, top panel). This has led some to speculate that falling margins could usher in a recession by curbing companies’ willingness to hire workers and invest in new capacity. Chart 12A Peak In Profit Margins: An Ominous Sign?
A Peak In Profit Margins: An Ominous Sign?
A Peak In Profit Margins: An Ominous Sign?
While it is an interesting theory, it does not stand up to closer scrutiny. Surveys of business sentiment clearly show that capital spending intentions are positively correlated with plans to raise wages (Chart 13, left panel). Far from cutting capital expenditures in response to rising wages, firms are more likely to boost capex if they are also planning to increase labor compensation. Chart 13AFaster Wage Growth, Increased Hiring, And More Capex Go Hand In Hand (I)
Faster Wage Growth, Increased Hiring, And More Capex Go Hand In Hand (I)
Faster Wage Growth, Increased Hiring, And More Capex Go Hand In Hand (I)
Chart 13BFaster Wage Growth, Increased Hiring, And More Capex Go Hand In Hand (II)
Faster Wage Growth, Increased Hiring, And More Capex Go Hand In Hand (II)
Faster Wage Growth, Increased Hiring, And More Capex Go Hand In Hand (II)
One reason for this is that rising wages make automation more attractive. By definition, automation requires more capital spending. However, that is not the entire story because firms also tend to hire more workers during periods when wage growth is rising (Chart 13, right panel). This implies that a third factor – strong economic growth – is responsible for both accelerating wages and rising hiring intentions. The fact that real business sales are strongly correlated with both employment growth and nonresidential investment is evidence for this claim (Chart 12, bottom panel). Falling Margins: A Symptom Of A Problem The discussion above suggests that faster wage growth is unlikely to dissuade firms from either hiring more workers or boosting capital spending. Indeed, the opposite is probably true: Since workers normally spend more of every dollar of income than firms do, an increase in the share of national income flowing to workers will lift aggregate demand. So why do profit margins usually peak before recessions? The answer is that declining labor market slack tends to push up unit labor costs, forcing central banks to hike interest rates in an effort to stave off rising inflation. Thus, falling margins are just a symptom of an underlying problem: economic overheating. Don’t blame lower margins for recessions. Blame central banks. Inflation Is Not A Threat... Yet For now, unit labor cost inflation remains reasonably well contained in the major economies (Chart 14). However, there is little evidence to suggest that the historic relationship between labor market slack and wage growth has broken down (Chart 15). Barring a major surge in productivity growth, inflation is likely to accelerate eventually as companies try to pass on higher labor costs to their customers. Chart 14AUnit Labor Costs Are Well Behaved For Now (I)
Unit Labor Costs Are Well Behaved For Now (I)
Unit Labor Costs Are Well Behaved For Now (I)
Chart 14BUnit Labor Costs Are Well Behaved For Now (II)
Unit Labor Costs Are Well Behaved For Now (II)
Unit Labor Costs Are Well Behaved For Now (II)
Chart 15Correlation Between Labor Market Slack And Wage Growth Remains Intact
Correlation Between Labor Market Slack And Wage Growth Remains Intact
Correlation Between Labor Market Slack And Wage Growth Remains Intact
We do not know exactly when such a price-wage spiral will emerge. Inflation is a notoriously lagging indicator (Chart 16). Our best guess is that inflation could become a serious risk for investors in late 2021 or 2022. Thus, investors should remain overweight global equities for the next 12-to-18 months, but be prepared to turn more cautious in the second half of 2021. Chart 16Inflation Is A Lagging Indicator
Who’s Afraid Of Low Unemployment?
Who’s Afraid Of Low Unemployment?
Peter Berezin Chief Global Strategist peterb@bcaresearch.com Footnotes 1 Jong-Wha Lee and Warwick J. McKibbin, “Globalization and Disease: The Case of SARS,” Brookings Institution, dated February 2004. 2 Please see Global Investment Strategy Weekly Report, “Bond Yields: How High Is Too High?” dated January 17, 2020. Global Investment Strategy View Matrix
Who’s Afraid Of Low Unemployment?
Who’s Afraid Of Low Unemployment?
MacroQuant Model And Current Subjective Scores
Who’s Afraid Of Low Unemployment?
Who’s Afraid Of Low Unemployment?
Strategic Recommendations Closed Trades
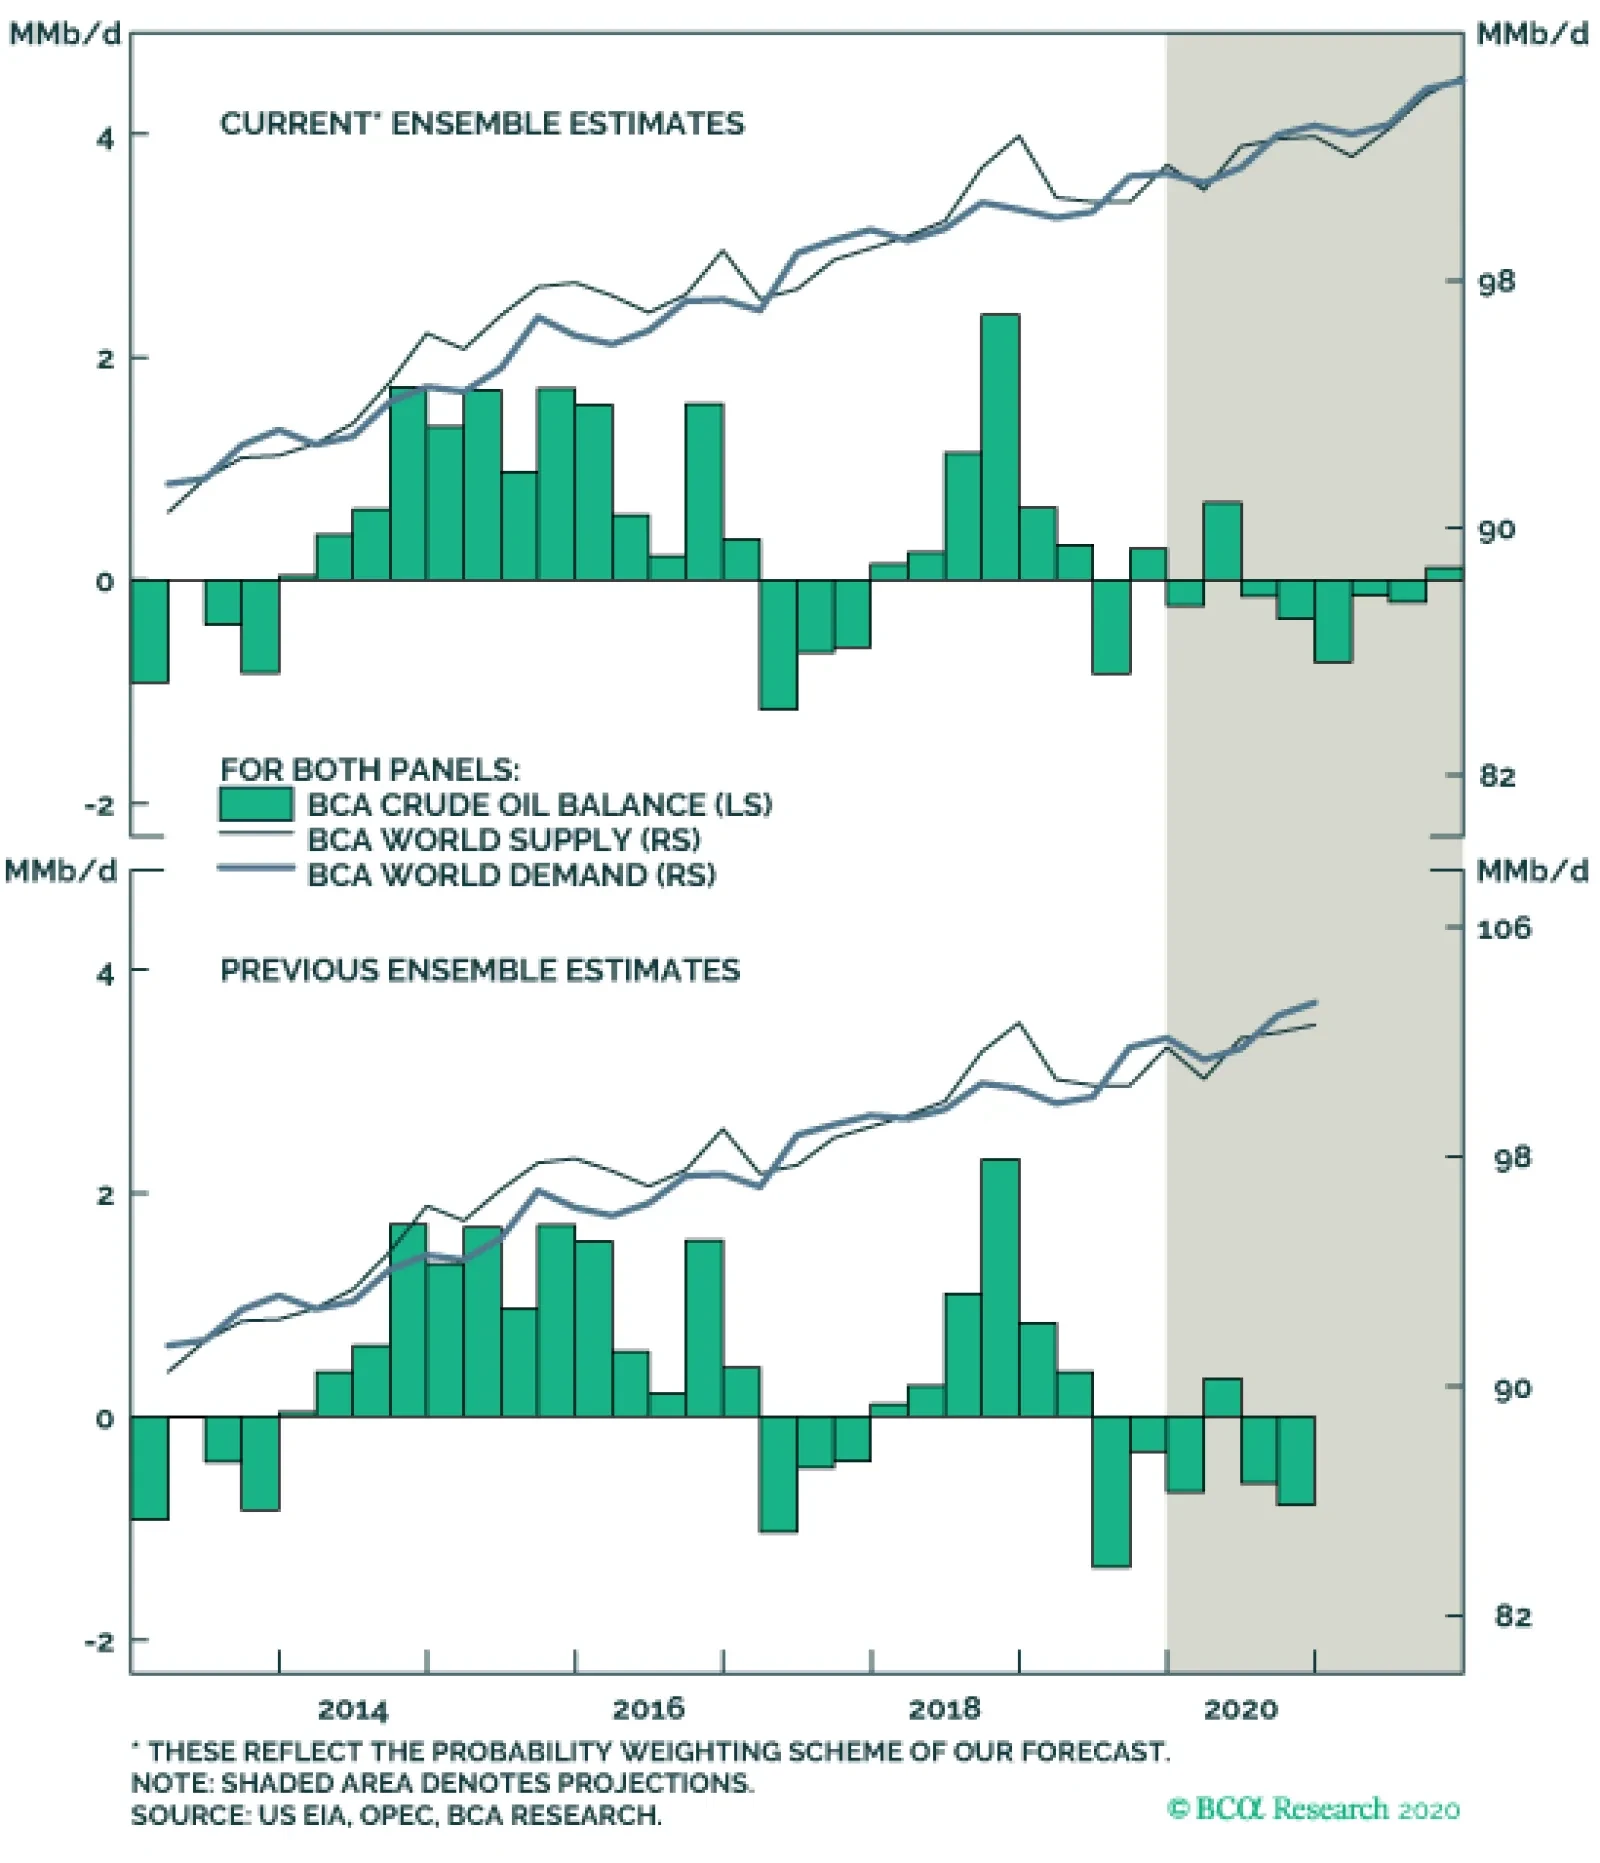
Crude oil fundamentals continue to favor higher prices. We continue to expect demand to grow 1.4mm b/d this year. For 2021, we expect growth of just under 1.5mm b/d, reaching 103.65mm b/d globally. For its part, the EIA is estimating growth of 1.34mm and…
Highlights The Wuhan coronavirus outbreak in China is now being priced into commodity markets, with comparisons to the 2003 SARS outbreak serving as an early benchmark.1 If it follows the SARS trajectory its impact likely will be limited, although oil demand could fall at the margin as global travel falls. The IMF expects growth in EM economies, the engine for commodity demand, to come in at 4.4% and 4.6% this year and next, respectively, down two-tenths of a percent from its previous forecast, but still up from 2019’s 3.7% rate. The Fund’s risk assessment tilts slightly to the upside, nonetheless, in the wake of global monetary and fiscal stimulus. We introduce our 2021 oil balances and price forecasts this week. We expect Brent crude oil to average $70/bbl next year, and for WTI to average $4/bbl below that. We are maintaining our $67/bbl Brent and $63/bbl WTI 2020 forecasts (Chart of the Week). Chart of the WeekCrude Oil Price Forecasts For 2020, 2021
Crude Oil Price Forecasts For 2020, 2021
Crude Oil Price Forecasts For 2020, 2021
Feature In its latest World Economic Outlook – Tentative Stabilization, Sluggish Recovery? – the IMF flags key risks to EM growth, which will continue to feed the economic policy uncertainty that dogs commodity demand.2 The Fund’s “downward revision primarily reflects negative surprises to economic activity in a few emerging market economies, notably India, which led to a reassessment of growth prospects over the next two years. In a few cases, this reassessment also reflects the impact of increased social unrest.” That said, the Fund sees the balance of risk slightly tilted to the upside versus its earlier assessment in October, in the wake of global monetary and fiscal stimulus. This is in line with our view that the effects of monetary stimulus – deployed over the better part of last year and still expected to remain accommodative this year – will boost growth this year. Our view remains tempered by risks we’ve been highlighting that keep political and economic policy uncertainty elevated – e.g., trade tensions, civil unrest, and the still-underappreciated risks to oil markets arising from US-Iran tensions and social unrest in Iraq, which remains high (Chart 2). The loss of 800k b/d from Libya is significant, but the world does not lack spare light-sweet crude oil production capacity – the US shales, in particular, abound in this type of crude oil. Chart 2Policy Uncertainty Will Trend Lower, But Continues To Dog Commodities
Policy Uncertainty Will Trend Lower, But Continues To Dog Commodities
Policy Uncertainty Will Trend Lower, But Continues To Dog Commodities
Oil Fundamentals Improving As is typically the case, we expect global oil-demand growth this year will be led by EM economies. Crude oil fundamentals continue to favor higher prices: Production management and capital discipline will constrain the rate of growth of oil supplies, and, as discussed above, demand will benefit from policy stimulus globally (Chart 3). Oil demand growth will recover this year, following a lower-than-normal rate of just 830k b/d last year, based on the US EIA’s most recent estimates of historical consumption. We continue to expect demand to grow 1.4mm b/d this year. For 2021, we expect growth of just under 1.5mm b/d, reaching 103.65mm b/d globally. For its part, the EIA’s estimating growth of 1.34mm and 1.37mm b/d for 2020 and 2021, respectively. As is typically the case, we expect global oil-demand growth this year will be led by EM economies, proxied by non-OECD oil consumption, of 1.26mm b/d. For next year, we expect EM demand growth to come in at 1.34mm b/d, or just over 90% of global oil consumption growth in 2021. On the supply side, we continue to expect OPEC 2.0 output to increase slightly in 2Q20 and return to levels consistent with its previous agreement to cut 1.2mm b/d of production. Our modeling also assumes this level of production remains flat for the rest of 2020. Chart 3Fundamental Supply-Demand Balances Support Higher Crude Oil Prices
Fundamental Supply-Demand Balances Support Higher Crude Oil Prices
Fundamental Supply-Demand Balances Support Higher Crude Oil Prices
Next year, we assume the producer coalition led by the Kingdom of Saudi Arabia (KSA) and Russia to increase production by 350k b/d in 1H21. In addition, we gradually remove 300k b/d of KSA’s overcompliance of 400k b/d next year, which moves its crude oil output in 2021 to 9.94mm b/d vs 9.76mm b/d this year. For Russia, we anticipate an increase in its condensate production, which it lobbied for last year. This will put our estimate of Russia’s crude and condensate production at 11.4mm b/d in 2020 and 11.64mm b/d in 2021.3 Most of the production cuts realized by OPEC 2.0 – ~ 2mm b/d – come at the expense of Venezuela and Iran, both of which are under sanctions limiting their production imposed by the US. We are holding Venezuela’s production at ~ 700k b/d in 2021, and will be monitoring this closely for any indication it is significantly changing. For Iran, we are keeping its production at 2.10mm b/d this year and next, assuming US sanctions remain in place. Oil production in both countries could be impacted by the outcome of US elections in November, and right now this is a near-impossible call to make. US Shales: No Longer A Growth Story? We continue to see slower production growth in the US than the EIA, particularly in the shales, as we expect capital markets to continue to discipline shale producers by only funding those firms that are able to return capital to shareholders or to deliver steady and increasing dividends. In our modeling, total US onshore production this year and next is expected to rise 800k b/d, and 310k b/d for 2021. We also continue to expect drilled-but-uncompleted (DUC) wells to continue to make significant contributions to overall shale-oil production in the US. Indeed, we expect DUCs to continue to offset part of the decline implied by lower rig counts, as they require less capex than drilling and completing new wells. We add ~ 500k b/d of production from DUCs completion over 2020 and 2021. Future production will depend heavily on the Majors and on productivity and lateral length. Our US crude and condensate production estimates for 2020 and 2021 reflect these constraints, and the slowing rate of growth being imposed by capital markets. For 2020, we expect total US crude and condensate production of 13.16mm b/d, of which 9.20mm b/d will come from the main shale basins led by the Permian.4 Tighter Fundamentals, Steeper Backwardations Our fundamental supply-demand balances are tighter than those assumed by the US EIA and the Paris-based IEA (Table 1). We expect US crude and liquids production to grow 1.6mm b/d this year, and only 500k b/d next year. We see global production growing 1.15mm b/d and 1.39mm b/d in 2020 and 2021, respectively. With demand growing 1.4mm b/d and close to 1.5mm b/d in 2020 and 2021, respectively, against this supply backdrop, our balances point to a deficit this year vs. the surplus expected by the IEA (Table 2 and Chart 4). Table 1Fundamentals Comparison
Despite New Demand Threat To Oil, Higher Prices Highly Likely In 2021
Despite New Demand Threat To Oil, Higher Prices Highly Likely In 2021
Table 2BCA Global Oil Supply - Demand Balances (MMb/d, Base Case Balances)
Despite New Demand Threat To Oil, Higher Prices Highly Likely In 2021
Despite New Demand Threat To Oil, Higher Prices Highly Likely In 2021
Chart 4BCA Research's Balances Estimates Point To Falling Inventories
BCA Research's Balances Estimates Point To Falling Inventories
BCA Research's Balances Estimates Point To Falling Inventories
Chart 5Tighter Storage, Steeper Backwardation
Tighter Storage, Steeper Backwardation
Tighter Storage, Steeper Backwardation
For this reason, we continue to anticipate a steepening in the Brent and WTI forward curves – i.e., more backwardation – which will support our long 2H20 Brent vs. short 2H21 Brent curve trade (Chart 5). As a result of the steeper backwardation, we expect higher volatility, and will be getting long 4Q20 Brent $65/bbl calls vs. short 4Q20 Brent $70/bbl calls (Chart 6). Bottom Line: We continue to expect crude oil markets to tighten, given persistent production restraint by OPEC 2.0, capital-market-imposed restraint on US shale-oil producers, and revived global demand growth in 2020 and 2021. The IMF’s assessment re the balance of risk being tilted to the upside, in the wake of global monetary stimulus, is broadly consistent with our maintained view. While we expect global policy uncertainty to fall following the so-called phase-one US-China trade deal and a definitive Brexit vote in the UK, geopolitical tension remains high, particularly in the Persian Gulf. Chart 6Steeper Backwardation To Higher Implied Volatility
Despite New Demand Threat To Oil, Higher Prices Highly Likely In 2021
Despite New Demand Threat To Oil, Higher Prices Highly Likely In 2021
We will be getting long 4Q20 Brent $65/bbl calls vs. short 4Q20 Brent $70/bbl calls, in anticipation of higher volatility in the wake of lower inventories. As a result, we are keeping our 2020 Brent forecast at $67/bbl, and are expecting 2021 Brent to trade at $70/bbl; WTI is expected to trade $4/bbl below Brent this year and next, on average. At tonight’s close, we will be getting long 4Q20 Brent $65/bbl calls vs. short 4Q20 Brent $70/bbl calls, in anticipation of higher volatility in the wake of lower inventories. Robert P. Ryan Chief Commodity & Energy Strategist rryan@bcaresearch.com Hugo Bélanger Senior Analyst Commodity & Energy Strategy HugoB@bcaresearch.com Commodities Round-Up Energy: Overweight Brent prices traded sideways ~ $64/bbl since last Tuesday, dismissing the US and China phase-one agreement and disruptions to Libyan production and exports which could total as much as 800k b/d. Over the weekend, concerns re the Wuhan coronavirus outbreak in China started being priced into commodities, particularly oil. Separately, the US Treasury Department renewed Chevron’s waiver to operate in Venezuela for another three months. The company is scheduled to export 1mm barrels of oil produced by PDVSA via a joint-venture, partially dodging US sanctions on Venezuelan oil.5 We expect the country’s output to stabilize close to its current level of 710 kb/d this year. Base Metals: Neutral On Tuesday Beijing reported more than 400 people had been infected with the Wuhan coronavirus, confirming person-to-person transmission of the virus. Concerns that a wider spread over the lunar New Year holidays starting this weekend will impact economic growth in the world’s top metal consumer brought copper prices down 1.8% on Tuesday. Zinc reached two-month highs this week amidst concerns of low LME warehouses stocks, now close to their 20-year lows at 50,900 MT (Chart 7). Supply concerns stemming from low iron ore stocked in China’s ports, along with good Chinese macro data, lifted iron-ore prices. Precious Metals: Neutral The US dollar is a key missing piece needed to propel gold prices higher from current levels. The 2.4% decline in the trade-weighted dollar index supported gold’s 5% increase since October 1, 2019 (Chart 8). We expect the dollar to continue depreciating in 2020, as global growth rebounds and the Fed remains accommodative, keeping gold prices well bid. Most precious metals have followed gold’s lead this year; palladium and platinum are up 17.63% and 3.15%, respectively. Chart 7
Zinc LME Inventories Are At Their Lowest In 20 years
Zinc LME Inventories Are At Their Lowest In 20 years
Chart 8
Despite New Demand Threat To Oil, Higher Prices Highly Likely In 2021
Despite New Demand Threat To Oil, Higher Prices Highly Likely In 2021
Ags/Softs: Underweight CBOT Corn and soybeans futures traded lower on Tuesday as markets awaited evidence of China purchasing additional U.S. agricultural goods, fulfilling its commitment to buy $32 billion of agricultural goods over two years per the phase-one deal negotiated between China and the US earlier this month. Corn traded lower, as US grain elevators have yet to confirm any Chinese buying. Soybeans, further weakened by expectations of a massive harvest in rival exporter Brazil. Wheat was the only ag posting gains early in the week on the back of strong Black Sea export demand. Footnotes 1 Please see CDC SARS Response Timeline, published by the US Centers for Disease Control and Prevention. The SARS outbreak was identified in February 2003 and lasted six months. The CDC noted: “Globally, WHO received reports of SARS from 29 countries and regions; 8,096 persons with probable SARS resulting in 774 deaths. In the United States, eight SARS infections were documented by laboratory testing and an additional 19 probable SARS infections were reported.” According to Chinese officials, there were 440 confirmed cases of the new coronavirus as of Wednesday; nine people were reported to have died thus far. The World Health Organization met Wednesday to assess the Wuhan coronavirus outbreak. The 2003 coronavirus outbreak was minor compared to the typical influenza outbreak: by way of comparison, every year there are an estimated one billion cases of influenza, resulting in 290,000 to 650,000 deaths, according to the International Federation of Pharmaceutical Manufacturers & Associations in Switzerland. 2 Economic policy uncertainty is a recurrent theme in our research. It has been driving safe-haven demand for the USD and gold for months, as we recently discussed in Iran Responds To US Strike; Oil Markets Remain Taut. It is available at ces.bcaresearch.com. 3 We use World Bank growth estimates to drive our EM demand forecasts. Earlier this month, the Bank forecast EM GDP growth of 4.1% for 2020 and 4.3% for next year. This will outpace last year’s growth rate of 3.5%. 4 US production growth, particularly in the Permian and Bakken basins, could be constrained by environmental restrictions, if state regulators crack down on the massive flaring occurring in both states. Please see Lingering Oil-Demand Weakness Will Fade, published November 21, 2019, where we discuss this risk in more depth. 5 Please see Exclusive: PDVSA's partners act as traders of Venezuelan oil amid sanctions - documents, published by reuters.com January 13, 2020. Investment Views and Themes Recommendations Strategic Recommendations Tactical Trades TRADE RECOMMENDATION PERFORMANCE IN 2019 Q4
Despite New Demand Threat To Oil, Higher Prices Highly Likely In 2021
Despite New Demand Threat To Oil, Higher Prices Highly Likely In 2021
Commodity Prices and Plays Reference Table Trades Closed in 2019 Summary of Closed Trades
Despite New Demand Threat To Oil, Higher Prices Highly Likely In 2021
Despite New Demand Threat To Oil, Higher Prices Highly Likely In 2021
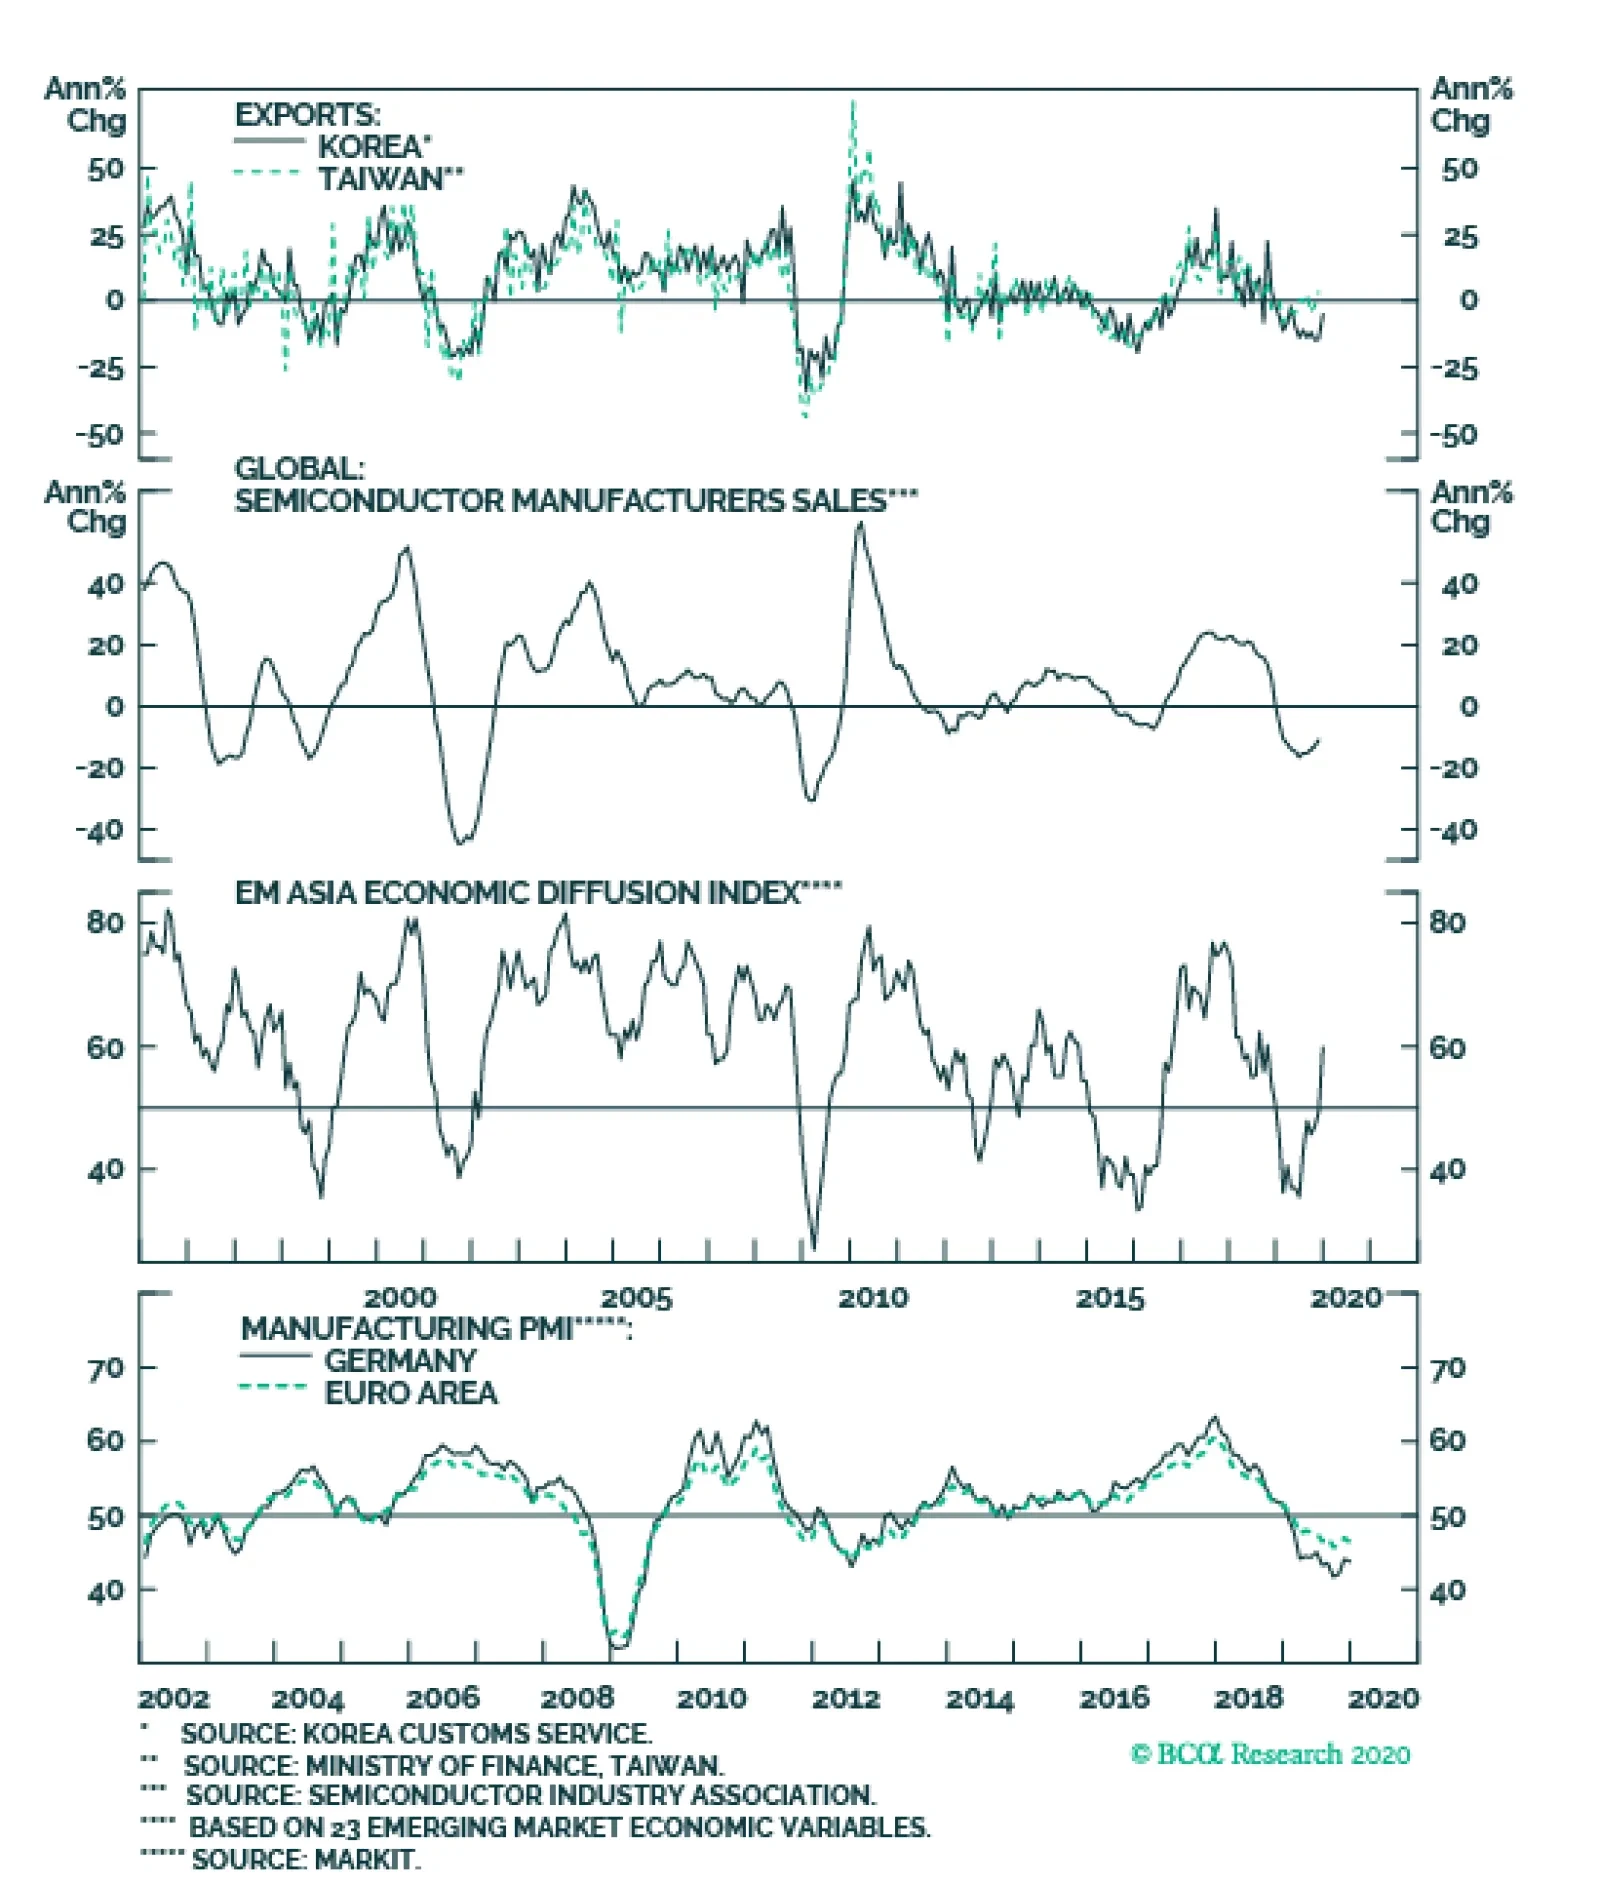
There has been an uptick in recent data which is promising for global growth. Korean and Taiwanese exports, which are highly sensitive to the global and Asian business cycles, are bottoming. Semiconductor sales have recently come up off their…
Highlights Global Corporates: The cyclical backdrop – accommodative monetary policies, improving global growth momentum, moderate inflation and subdued volatility – is supportive for the continued outperformance of global corporate bonds over sovereign debt in 2020. Corporate Bond Valuation: Extending a valuation framework we’ve introduced for US corporates to non-US credit – looking at volatility-adjusted spreads relative to both their own history and the “phase” of the monetary policy cycle - we calculate spread targets for non-US corporates in the euro area, UK and Canada. 2020 Opportunities: Current corporate spread levels are furthest above our targets (i.e. cheap) for US high-yield (most notably for Ba- and Caa-rated credit), UK high-yield and UK investment grade. Spreads are furthest below our targets (i.e. expensive) for euro area high-yield (mostly Ba-rated), US investment grade (all credit tiers) and Canadian investment grade. Feature Chart 1Deviations From Corporate Spread Targets
How To Find Value In Global Corporate Bonds
How To Find Value In Global Corporate Bonds
One of our main investment themes for 2020 is that accommodative monetary policies and faster economic growth will delay the peak in the aging global credit cycle, giving investors another year of corporate bond outperformance versus sovereign debt in the developed economies. Returns this year will be nowhere near as robust as in 2019, however, given rich valuation starting points for much of the global corporate universe. Against this backdrop, fixed income investors will have to be more selective in allocations by country, sector and credit quality in order to outperform. To that end, in this Special Report we extend a valuation framework for corporate bond spreads first introduced for US corporates by our sister service, US Bond Strategy, to non-US credit. This methodology looks at spreads on a volatility-adjusted basis, allowing comparison of valuations versus their own history and relative to similar stages of past monetary policy cycles. Chart 1 shows the deviations of current benchmark index option-adjusted spreads (OAS) from spread targets derived from our methodology for different countries (the US, euro area, the UK and Canada) and credit quality tiers (investment grade vs. high-yield). Positive deviations imply current spreads are above the targets derived from our framework – in other words, relatively undervalued - and vice-versa. Returns this year will be nowhere near as robust as in 2019, however, given rich valuation starting points for much of the global corporate universe. Against this backdrop, fixed income investors will have to be more selective in allocations by country, sector and credit quality in order to outperform. The conclusions are that there are still opportunities for additional spread tightening from current levels for lower-rated US high-yield and both UK investment grade and high-yield corporates. At the same time, valuations are looking most stretched for euro area high-yield, US investment grade (all credit tiers) and Canadian investment grade. A Brief Word On The Outlook For Global Corporate Credit In 2020 Chart 2Positive Backdrop For Corporate Bonds
Positive Backdrop For Corporate Bonds
Positive Backdrop For Corporate Bonds
The backdrop for global corporate bond markets will remain positive in 2020 for three main reasons: Global monetary policies will remain accommodative. Central bankers are now focusing more on boosting soft growth and low inflation expectations. Real policy interest rates in the US, euro area, UK and Canada are already below estimates of neutral like r-star (Chart 2, top panel), and will likely remain so throughout 2020. In the past, periods of credit market underperformance have occurred when monetary policy was restrictive, with real rates above neutral or government bond yield curves that were very flat or inverted (more on that later). Global growth momentum will improve. Recent data releases (global manufacturing PMIs, sentiment surveys like the global ZEW and German IFO) have shown that the 2019 global industrial downturn was in the process of bottoming out during the 4th quarter of the year. Additional improvement is likely in the coming months, based on the steady gains of the BCA Global Leading Economic Indicator (LEI). The elevated level of our global LEI diffusion index – measuring the share of individual country LEIs that are rising and which is itself a leading indicator of both the global LEI and corporate bond returns - suggests that additional outperformance of global corporates versus sovereign bonds is likely within the next 12 months (Chart 2, middle panel). Financial conditions are stimulative. Global equities and credit are off to a strong start in 2020, while market volatility is subdued across a variety of asset classes. For example, the US VIX index is now just above its 2019 low, which is consistent with narrow global corporate bond spreads (Chart 2, bottom panel). That low volatility backdrop – supported by market-friendly central bank policies - is helping keep financial conditions easy enough to lift economic growth, while also boosting investor risk appetite for corporate credit. The overall outlook for global corporate credit is still positive and investors should expect another year of corporate bond outperformance versus sovereign debt in the developed economies. Nonetheless, returns will be lower in 2020 than in 2019 due to expensive valuation starting points. As can be seen from Chart 3, global corporate bond spreads are already fairly tight relative to their long-term historical range. Also, outright index yields in many asset classes, like US high-yield, are now at new all-time lows. We interpret this as a sign that the “easy money” has already been made in being generally long corporate credit versus government bonds. Having the right tools to assess the relative values among differing credit markets will be critical to finding the best investment opportunities in this environment. Chart 3Rich Valuation Starting Points In Corporate Credit
How To Find Value In Global Corporate Bonds
How To Find Value In Global Corporate Bonds
We can use the breakeven spread as a valuation tool by looking at the percentile rank relative to its own history, effectively showing the percentage of time that the breakeven spread has been lower in the past. Bottom Line: The cyclical backdrop – accommodative monetary policies, improving global growth momentum, moderate inflation and subdued volatility – is supportive for the continued outperformance of global corporate bonds over sovereign debt in 2020. Valuations are likely to be more of a headwind for corporate bond returns, though. Using Breakeven Spreads As A Credit Valuation Tool As a reminder to existing readers (and to new clients), one of our main valuation tools for credit instruments is the 12-month breakeven spread. That is, the amount of spread widening required for corporate bond returns to break even with a duration-matched position in government bond securities over a 12-month horizon. It can be approximated by dividing the OAS of a bond (or a benchmark bond index) by its duration. More specifically, we can use the breakeven spread as a valuation tool by looking at the percentile rank relative to its own history, effectively showing the percentage of time that the breakeven spread has been lower in the past. We find this valuation tool to be superior to others for two main reasons: (i) using the breakeven spread rather than the average index OAS allows us to control for the changing average duration of the benchmark bond indices; and (ii) the percentile rank is often a better representation of credit spreads than the spread itself.1 BCA Research US Bond Strategy and Global Fixed Income Strategy have both regularly shown the percentile rankings of US investment grade and high-yield breakeven spreads as part of our discussion of US corporate bond markets. We have never produced such rankings for non-US credit, until now. InCharts 4- 7, we show those percentile ranks relative to history for credit in the US and, for the first time, the euro area, UK, Canada, Japan, Australia and Emerging Markets US dollar denominated corporates. We also provide the breakeven spread historical percentile ranks for each individual credit tier in the Appendix charts on pages 13-16. Chart 4US: Corporate Bond Breakeven Spreads
US: Corporate Bond Breakeven Spreads
US: Corporate Bond Breakeven Spreads
Chart 5Euro Area: Corporate Bond Breakeven Spreads
Euro Area: Corporate Bond Breakeven Spreads
Euro Area: Corporate Bond Breakeven Spreads
Chart 6UK: Corporate Bond Breakeven Spreads
UK: Corporate Bond Breakeven Spreads
UK: Corporate Bond Breakeven Spreads
Using these charts, we can gauge which markets offer the best (or worst) level of spread, adjusted by its own volatility and compared to its own history. The most attractive corporate credit spreads on a volatility-adjusted basis are: US high-yield (mostly Caa-rated and B-rated) Japan investment grade (mostly Baa-rated and A-rated) Canada Aaa-rated UK high-yield (excluding financials) Chart 7Other Countries: Corporate Bond Breakeven Spreads
More Corporate Bond Breakeven Spreads
More Corporate Bond Breakeven Spreads
The least attractive corporate credit spreads on a volatility-adjusted basis are: US investment grade (all credit tiers) UK Aaa-rated Canada Baa-rated Euro Area high-yield Using this metric, US Caa-rated junk bonds look most “undervalued”, with a volatility-adjusted spread in the upper 20% of all observations. Chart 8 displays the current breakeven spread historical percentile ranks across countries and credit quality, with high-yield markets shown in red. Using this metric, US Caa-rated junk bonds look most “undervalued”, with a volatility-adjusted spread in the upper 20% of all observations. While this chart provides a quick overview of which corporate bond markets are cheap/expensive with respect to their own history, it does not allow for comparisons of the relative cheapness between markets. To do this, we need to find a way to convert the percentile rankings into some measure of a “fair value” credit spread. Chart 8Global Corporate Bond 12-Month Breakeven Spreads By Percentile Rank (%)
How To Find Value In Global Corporate Bonds
How To Find Value In Global Corporate Bonds
Using Monetary Policy Cycles To Determine Corporate Spread Targets Our colleagues at BCA Research US Bond Strategy have come up with a novel approach for determining spread targets for US corporate credit, based on the breakeven spread percentile rankings.2 Essentially, the stance of US monetary policy, as measured by the slope of the US Treasury curve, is used to predict changes in the US credit cycle, helping to determine “cyclical” spread targets relative to the stance of monetary policy. The first step of this process is to group corporate bond excess returns (vs government debt) into buckets defined by the following “phases” of the US monetary policy cycle, measured by the yield differential between 10-year and 3-year Treasuries: Phase 1: from the end of the previous recession until the slope goes below 50 bps. Phase 2: from the time that the slope crosses below 50 bps until it inverts. Phase 3: from the time that the yield curve first inverts to the start of the next recession. Recessionary periods are not included in these phases, as all corporate credit exhibits the worst returns during those episodes. That is because economic growth and downgrade/default risks, and not the state of monetary policy, are the driving factor behind credit spread moves during recessions. Chart 9 shows the history of the US corporate bond markets broken down into “curve-defined” cycles.3 Dating back to 1974, the earliest date for investment grade bond index data, there have been five such cycles. Chart 9US Corporate Bond Performance And The Yield Curve
US Corporate Bond Performance And The Yield Curve
US Corporate Bond Performance And The Yield Curve
In Charts 10-12, we show the same phases for the euro area, the UK and Canada, using their own government bond yield curves to determine the phase of the monetary policy cycle in the same fashion as was done for the US.4 Once the phases of the monetary policy cycle are defined, we can then calculate corporate bond excess returns during each phase. Chart 10Euro Area: Corporate Bond Performance And The Yield Curve
Euro Area Corporate Bond Performance And The Yield Curve
Euro Area Corporate Bond Performance And The Yield Curve
Chart 11UK: Corporate Bond Performance And The Yield Curve
UK: Corporate Bond Performance And The Yield Curve
UK: Corporate Bond Performance And The Yield Curve
Chart 12Canada: Corporate Bond Performance And The Yield Curve
Canada: Corporate Bond Performance And The Yield Curve
Canada: Corporate Bond Performance And The Yield Curve
Table 1 shows the average corporate bond annualized excess returns under each phase across every cycle that can be defined with available data. Excess returns tend to be highest in Phase 1, quite low but still positive in Phase 2, and usually turn negative during Phase 3, once the yield curve has inverted. Table 1Corporate Bond Annualized Excess Returns* (%) Under Each Phase Of The Cycle
How To Find Value In Global Corporate Bonds
How To Find Value In Global Corporate Bonds
Currently, we are in Phase 2 in the US, euro area and UK, with yield curves that are relatively flat but still positively sloped. Historically, such periods have generated positive excess returns for corporate debt versus duration-matched government bonds, although of far smaller magnitudes compared to Phase 1 periods. Given our expectation that the Fed, ECB and Bank of England will maintain a dovish bias throughout 2020, we expect the no shift from Phase 2 for the US, euro area and the UK that would hurt corporate bond excess returns in those countries. With the Canadian yield curve now slightly inverted, however, Canada is now in Phase 3. This raises the risk that the recent strong outperformance of Canadian investment grade corporate bonds could end if the Bank of Canada does not deliver the monetary easing currently discounted in the Canadian yield curve. How We Determine Corporate Spread Targets Having defined the three phases of the monetary policy cycle, we then re-calculate our corporate bond breakeven spread percentile ranks within each phase. We then back-out a spread target for each credit tier by taking the median 12-month breakeven spread seen in similar monetary policy environments, as determined by the slope of the yield curve.5 Finally, we convert those “median” breakeven spreads into OAS targets using the current benchmark index duration and credit rating distribution. We are assuming that a reasonable spread target for any corporate bond market is determined by adjusting for both spread volatility AND the monetary policy cycle. So, essentially, we are assuming that a reasonable spread target for any corporate bond market is determined by adjusting for both spread volatility AND the monetary policy cycle. Charts 13-16 show the index OAS and their respective targets for the US (both investment grade and high-yield), euro area (both investment grade and high-yield), the UK (both investment grade and high-yield excluding financials), and Canada (only investment grade). Further, the spread targets for each individual credit tier are provided in the Appendix on pages 17-19. Chart 13US: Corporate Bond Spread Targets
US Corporate Bond Spread Targets
US Corporate Bond Spread Targets
Chart 14Euro Area: Corporate Bond Spread Targets
Euro Area: Corporate Bond Spread Targets
Euro Area: Corporate Bond Spread Targets
Chart 15UK: Corporate Bond Spread Targets
UK: Corporate Bond Spread Targets
UK: Corporate Bond Spread Targets
Chart 16Canada: Corporate Bond Spread Targets
Canada: Corporate Bond Spread Target
Canada: Corporate Bond Spread Target
For example, our spread target for US B-rated high-yield is 227bps, which is 80bps below the current index OAS. From the charts, we can make the following conclusions about the relative attractiveness of current spread levels: The largest deviations from our spread target (i.e. potentially most undervalued) are: US high-yield (mostly Caa-rated and B-rated) UK high-yield (excluding financials) The lowest deviations from our spread target (i.e. potentially most overvalued) are: Euro Area high-yield (mostly Ba-rated) Canada investment grade US investment grade (all credit tiers) This framework is an interesting way to derive corporate bond value, by adjusting for both the volatility and monetary policy backdrop. Of course, there are other factors that are more difficult to quantify that can keep spreads too tight or too wide versus these fair value levels, like investor risk tolerance or risk premia for political uncertainty. In terms of factors that are quantifiable, however, this spread target methodology is a useful way to get a sense of the richness or cheapness of global corporate debt. In terms of factors that are quantifiable, however, this spread target methodology is a useful way to get a sense of the richness or cheapness of global corporate debt. We will regularly update these targets in future BCA Research Global Fixed Income Strategy reports. Bottom Line: Current corporate spread levels are furthest above our targets (i.e. cheap) for US high-yield (most notably for Ba- and Caa-rated credit), UK high-yield and UK investment grade. Spreads are furthest below our targets (i.e. expensive) for euro area high-yield (mostly Ba-rated), US investment grade (all credit tiers) and Canadian investment grade. Jeremie Peloso Research Analyst jeremiep@bcaresearch.com Robert Robis, CFA Chief Fixed Income Strategist rrobis@bcaresearch.com Footnotes 1 This is because credit spreads often tighten to very low levels and then remain tight for an extended period. Thus, by showing the percentage of time that a given spread has been tighter than its current level, the percentile rank gives a better sense of this pattern than the actual spread. 2 Please see US Bond Strategy Special Report, “2019 Key Views: Implications For US Fixed Income”, dated December 11, 2018, available at usbs.bcaresearch.com. 3 Note that the Treasury curve used for this analysis is the spread between the 10-year Treasury and the 3-year Treasury yield. The more widely-followed 2-year Treasury was not used as there was more historical data available for the 3-year maturity. 4 Note that there are fewer cycles to analyze for these countries due to the shorter available history of corporate bond market data outside the US. 5 For more details on the spread targets please see US Bond Strategy Weekly Report, “Paid To Wait”, dated February 26, 2019, available at usbs.bcaresearch.com. Appendix Chart 1AUS: Investment Grade Breakeven Spreads
US: Investment Grade Breakeven Spreads
US: Investment Grade Breakeven Spreads
Chart 1BUS: High-Yield Breakeven Spreads
US: High-Yield Breakeven Spreads
US: High-Yield Breakeven Spreads
Chart 1CEuro Area: Investment Grade Breakeven Spreads By Credit Tiers
Euro Area: Investment Grade Breakeven Spreads
Euro Area: Investment Grade Breakeven Spreads
Chart 1DEuro Area: High-Yield Breakeven Spreads By Credit Tiers
Euro Area: High-Yield Breakeven Spreads
Euro Area: High-Yield Breakeven Spreads
Chart 1EUK: Investment Grade Breakeven Spreads
UK: Investment Grade Breakeven Spreads
UK: Investment Grade Breakeven Spreads
Chart 1FCanada: Investment Grade Breakeven Spreads
Canada: Investment Grade Breakeven Spreads
Canada: Investment Grade Breakeven Spreads
Chart 1GJapan: Investment Grade Breakeven Spreads
Japan: Investment Grade Breakeven Spreads
Japan: Investment Grade Breakeven Spreads
Chart 2AUS: Investment Grade Spread Targets
US: Investment Grade Spread Targets
US: Investment Grade Spread Targets
Chart 2BUS: High-Yield Spread Targets
US: High-Yield Spread Targets
US: High-Yield Spread Targets
Chart 2CEuro Area: Investment Grade Spread Targets By Credit Tiers
Euro Area: Investment Grade Spread Targets
Euro Area: Investment Grade Spread Targets
Chart 2DEuro Area: High-Yield Spread Targets By Credit Tiers
How To Find Value In Global Corporate Bonds
How To Find Value In Global Corporate Bonds
Chart 2EUK: Investment Grade Spread Targets By Credit Tiers
UK: Investment Grade Spread Targets
UK: Investment Grade Spread Targets
Chart 2FCanada: Investment Grade Spread Targets By Credit Tiers
Canada: Investment Grade Spread Targets
Canada: Investment Grade Spread Targets
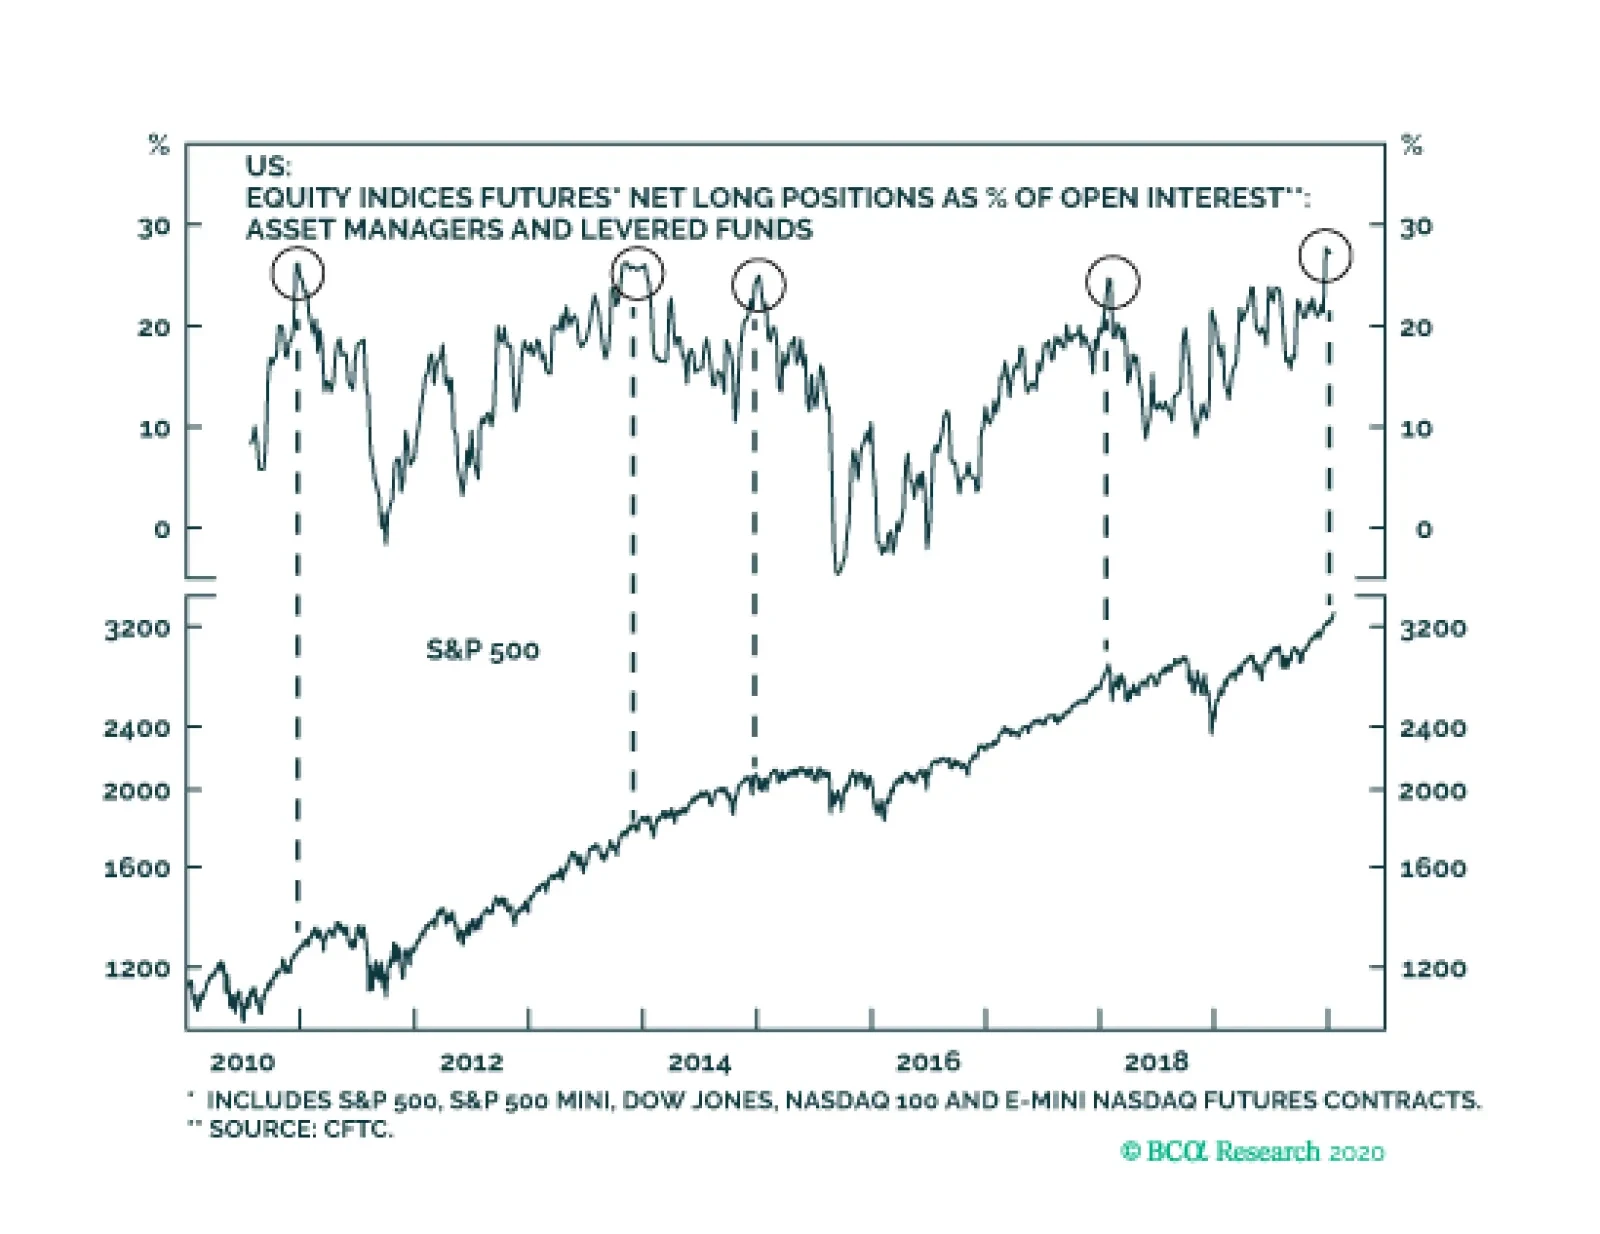
We recently downgraded our tactical three-month view on global equities from overweight to neutral on the grounds that stocks had run up too hard, too fast. Net long positions in equity futures among asset managers and levered funds are now at levels that…
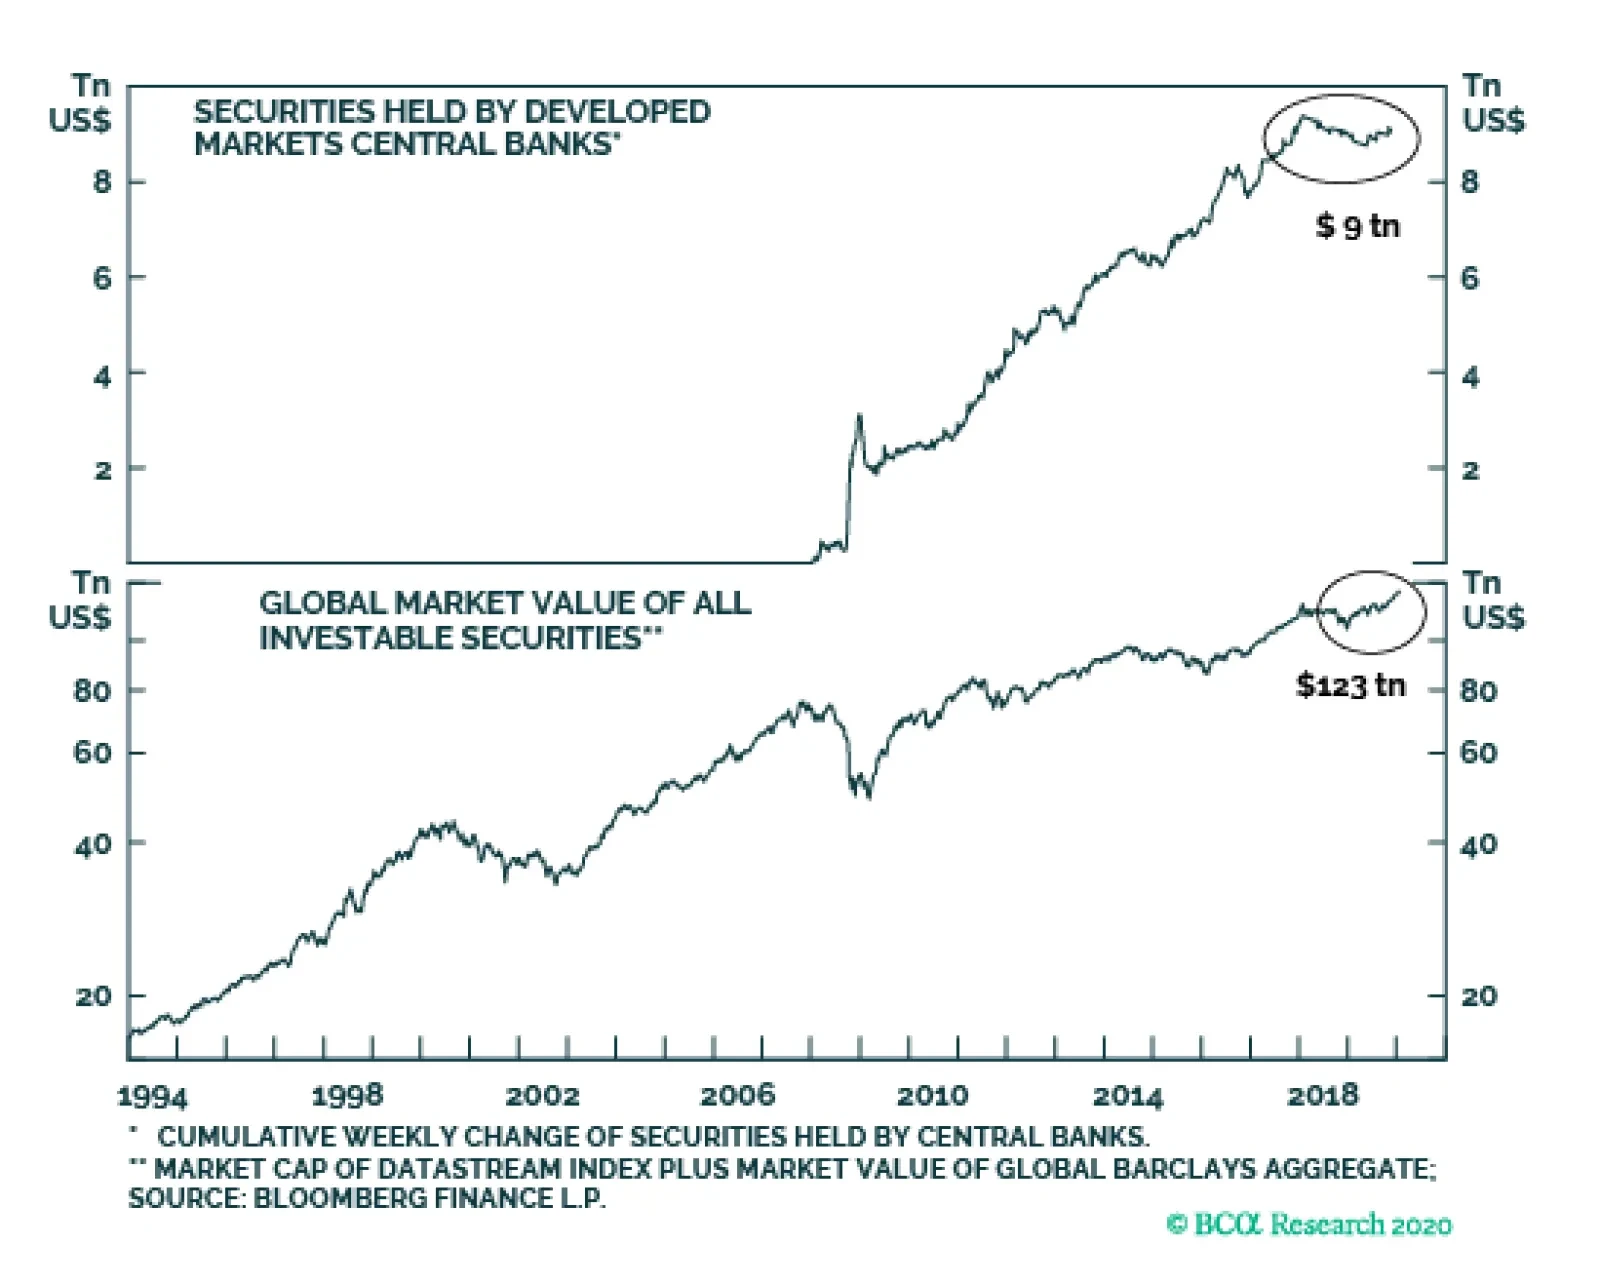
Yes, there is a shortage of financial assets relative to available liquidity. QE programs in advanced economies have removed high-quality financial assets – valued at about $9 trillion – from global markets. Yet, money supply has expanded. This has left…
The World Bank’s January 2020 Global Economic Prospects – Slow Growth, Policy Challenges stresses downside risks to markets arising from policy uncertainty. In contrast, we see upside risks arising from demand recovering sooner and stronger than…
Highlights We continue to have a positive view on global equities over the next 12 months, but see heightened risks of a near-term correction. Despite dwindling spare capacity, government bond yields are still lower today than they were shortly after the financial crisis. Many investors argue that bond yields cannot rise much because asset values would plunge if yields rose sharply, while debt burdens would quickly become unsustainable. We disagree. We think there is greater scope for yields to rise than is widely believed. Investors should maintain below-benchmark duration in fixed-income portfolios, favoring inflation-linked over nominal bonds and positioning for steeper yield curves. Gold should also do well next year. As long as bond yields are rising in response to stronger growth, as will be the case for the next two years, equities will fare well. The stock market will buckle, however, once stagflation sets in around 2022. Stocks Need To Work Off Overbought Conditions Before Moving Higher Again In last week’s report, entitled “Time For A Breather,” we downgraded our tactical three-month view on global equities from overweight to neutral on the grounds that stocks had run up too hard, too fast. Net long positions in equity futures among asset managers and levered funds are now at levels that have historically preceded corrections (Chart 1). Chart 1Stocks Are At A Heightened Risk Of A Correction
Stocks Are At A Heightened Risk Of A Correction
Stocks Are At A Heightened Risk Of A Correction
Chart 2Breadth Is Quite Narrow
Breadth Is Quite Narrow
Breadth Is Quite Narrow
Chart 3The Equity Risk Premium Is Fairly High, Especially Outside The US
The Equity Risk Premium Is Fairly High, Especially Outside The US
The Equity Risk Premium Is Fairly High, Especially Outside The US
The rally has been lopsided, characterized by very narrow breadth. The top five stocks in the S&P 500 (Apple, Microsoft, Alphabet, Amazon, and Facebook) now comprise 18% of market cap, a higher share than in the late 1999/early 2000s (Chart 2). As my colleague, Anastasios Avgeriou, has pointed out, Apple’s $30 billion one day market cap gain on January 9th was greater than the market cap of the median stock in the S&P 500 index. Despite our near-term concerns, we continue to maintain a positive 12-month view on global equities. Easier financial conditions, a turn in the global inventory cycle, modestly looser fiscal policy in the UK and euro area, and re-upped fiscal/credit stimulus in China should all support global growth this year. Faster growth, in turn, will lift corporate earnings. The equity risk premium also remains quite high, particularly outside the US (Chart 3). A Fragile Trade Truce A de-escalation in the trade war should provide a further tailwind to equities. The “phase one” agreement signed on Wednesday features a commitment by China to purchase an additional $200 billion in US goods and services over the next two years relative to 2017 levels. In return, the US will halve tariffs, to 7.5%, on the $120 billion tranche in Chinese imports and suspend any further tariff hikes. No firm schedule exists to begin “phase two” talks, and at this point, it is quite likely that no negotiations will take place until after the US presidential election. Nevertheless, the tail risk of an out-of-control trade war has receded for the time being, which is positive for stocks. Better Chinese Trade Data Adding to growing optimism over the global economy and diminished trade tensions, Chinese trade data surprised on the upside this week. Exports rose 7.6% in December, well above the consensus estimate of 2.9%. Imports surged 16.3%, easily surpassing the consensus estimate of 9.6%. While base effects explain some of the improvement, the overall tone of the trade data is consistent with the strengthening Chinese PMIs and improvement in industrial production and retail sales (Chart 4). Chart 4Chinese Trade Data Is Improving
Chinese Trade Data Is Improving
Chinese Trade Data Is Improving
Chart 5Better News Out Of China Has Propelled The Yuan Higher Versus The US Dollar
Better News Out Of China Has Propelled The Yuan Higher Versus The US Dollar
Better News Out Of China Has Propelled The Yuan Higher Versus The US Dollar
Better news out of China has pushed the yuan to the strongest level against the US dollar since last summer (Chart 5). The Chinese currency is the most important driver of other EM currencies. If the yuan continues to strengthen, as we expect, EM assets – particularly EM stocks and local-currency bonds – should do well this year. How High Can Bond Yields (Realistically) Go? Despite rising over the past few months, global government bond yields are lower today than they were shortly after the financial crisis ended (Chart 6). The decline in yields has occurred alongside dwindling spare capacity. In most countries, the unemployment rate today is below 2007/08 lows (Chart 7). Many investors argue that bond yields cannot rise much from current levels because asset values would plunge if yields rose sharply, while debt burdens would quickly become unsustainable. If such an unfortunate turn of events were to occur, central bankers would have to shelve any tightening plans, just as Jay Powell had to do in late 2018. Chart 6Bond Yields Are Lower Today Than They Were After The Great Recession
Bond Yields Are Lower Today Than They Were After The Great Recession
Bond Yields Are Lower Today Than They Were After The Great Recession
Chart 7Unemployment Rates Are Below Their Pre-Recession Lows In Most Economies
Bond Yields: How High Is Too High?
Bond Yields: How High Is Too High?
Convexity Fears One argument often heard these days is that asset prices have become hypersensitive to changes in interest rates. There is some basis for thinking this. As Box 1 explains, the relationship between asset returns and interest rates tends to be “convex,” meaning that any given change in interest rates will have a bigger effect on returns if rates are low to begin with, as they are today. The effect is particularly pronounced for long duration assets such as long-term bonds, equities, or real estate. Nevertheless, while the theoretical presence of convexity in asset returns is crystal clear, many commentators overstate its practical importance. As Chart 8 shows, the average maturity of government debt stands at seven years. At that level of maturity, the effects of convexity tend to be quite small.1 Chart 8Average Debt Maturity Is Below 10 Years In Most Countries
Bond Yields: How High Is Too High?
Bond Yields: How High Is Too High?
Granted, the overall stock of debt has increased in relation to GDP. However, much of that additional debt has been absorbed by central banks, reducing the amount of government debt available for the private sector. What about equities? The ratio of stock market capitalization-to-GDP has risen to 59%, up from a low of 24% in 2009, and close to its 2000 highs (Chart 9). Does that mean that stocks will sink if yields rise from current levels? Not necessarily. Remember that the discount rate is not the only thing that affects the present value of a stream of income. The expected growth rate of that income also matters. In fact, in the standard dividend discount model, it is simply the difference between the discount rate and the growth rate of dividends that determines how much a stock is worth. If higher bond yields coincide with rising growth expectations, stock prices do not need to fall at all. Chart 9Equity Market Cap Is Approaching Previous Highs
Equity Market Cap Is Approaching Previous Highs
Equity Market Cap Is Approaching Previous Highs
Chart 10 shows that the monthly correlation between equity returns and bond yields remains as high as ever. This suggests that favorable economic news, to the extent that it leads investors to revise up the expected growth rate for earnings, usually more than compensates for a rising discount rate (Chart 11). Chart 10Correlation Between Equity Returns And Bond Yields Remains High
Correlation Between Equity Returns And Bond Yields Remains High
Correlation Between Equity Returns And Bond Yields Remains High
Chart 11Earnings Estimates Tend To Move In Sync With Swings In Bond Yields
Earnings Estimates Tend To Move In Sync With Swings In Bond Yields
Earnings Estimates Tend To Move In Sync With Swings In Bond Yields
So why are so many investors worried that higher bond yields will undercut stocks? The answer has less to do with convexity and more to do with the fear that bond yields will reach a level that chokes off growth. The combination of a rising discount rate and a falling growth rate would be toxic for equities and other risk assets. Debt Worries Likewise, it is not so much that corporate bond investors are worried that rising yields will cause interest payments to swell. After all, interest costs are still quite low as a share of cash flows for most firms (Chart 12). Rather, the fear is that higher yields will imperil growth, causing those cash flows to evaporate. Government debt is also much less of a problem than often assumed, at least in countries that issue bonds in their own currencies. The standard rule for debt sustainability says that the debt-to-GDP ratio will always converge to a stable level if the interest rate is below the growth rate of the economy.2 This is easily the case in almost all economies today (Chart 13). Chart 12US Corporate Sector: Interest Payments Are Not A Worry
US Corporate Sector: Interest Payments Are Not A Worry
US Corporate Sector: Interest Payments Are Not A Worry
Chart 13Bond Yield Minus GDP Growth: Please Mind The Gap
Bond Yields: How High Is Too High?
Bond Yields: How High Is Too High?
The only places where central banks are severely constrained in raising rates are in economies such as Canada, Sweden, and Australia where debt-financed housing bubbles have formed (Chart 14). However, even in these countries, the quality of mortgage underwriting has generally been strong, implying that a banking crisis would likely be avoided. Chart 14Canada, Sweden, And Australia Stand Out As Having Very Frothy Housing Markets
Canada, Sweden, And Australia Stand Out As Having Very Frothy Housing Markets
Canada, Sweden, And Australia Stand Out As Having Very Frothy Housing Markets
It’s Really About The Neutral Rate The discussion above suggests that the main constraint to higher bond yields is the economy itself. If bond yields rise enough, the interest rate-sensitive sectors of the economy will weaken, and a recession will ensue. As long as bond yields are rising in response to stronger growth, as will be the case for the next two years, equities will be fine. Unfortunately, no one knows where the neutral rate – the interest rate demarcating the boundary between expansionary and contractionary monetary policy – really lies. Chart 15Rising Labor Share Of Income Occurring Alongside Labor Market Tightening
Rising Labor Share Of Income Occurring Alongside Labor Market Tightening
Rising Labor Share Of Income Occurring Alongside Labor Market Tightening
Slower trend growth has probably reduced the neutral rate, as has the shift to a more “capital-lite” economy. On the flipside, other forces have probably raised the neutral rate over the past few years. A tighter labor market has increased workers’ share of national income (Chart 15). Since workers spend more of every dollar of income than companies, this has raised aggregate demand. Fiscal policy has also been loosened, while elevated asset prices have likely incentivized some spending that would otherwise not have taken place. Even though we do not know the exact value of the neutral rate, we do know that the unemployment rate has been falling in most countries for the past 10 years, a period during which bond yields were generally higher than today. This suggests that monetary policy remains in expansionary territory. True, global growth did slow in 2018, just as the Fed was raising rates. However, this probably had more to do with the natural ebb and flow of the global manufacturing cycle, exacerbated by the Chinese deleveraging campaign and the brewing trade war. If global growth recovers this year, as we expect, estimates of the neutral rate will rise. This will allow equity prices to increase even in an environment of modestly higher bond yields. Inflation Is Coming… Eventually While stronger economic growth will lift bond yields this year, the big move in yields will only come when inflation breaks out. Core inflation tends to track unit labor costs (Chart 16). Unit labor cost inflation has remained range-bound for most of the recovery in the United States, which explains the failure of inflation to take flight. Unit labor cost inflation has been even more moribund elsewhere. Chart 16Core Inflation Tends To Track Unit Labor Costs
Core Inflation Tends To Track Unit Labor Costs
Core Inflation Tends To Track Unit Labor Costs
Chart 17Correlation Between Labor Market Slack And Wage Growth Remains Intact
Bond Yields: How High Is Too High?
Bond Yields: How High Is Too High?
Looking out, barring a major surge in productivity, rising wage growth should lead to accelerating unit labor cost inflation, first in the US and then in the rest of the world, which will translate into higher price inflation. We doubt that such a price-wage spiral will erupt this year. If anything, US wage growth has leveled off recently, with the year-over-year change in average hourly earnings falling back below the 3% mark. Nevertheless, the long-term correlation between labor market slack and wage growth remains intact (Chart 17). As wage growth reaccelerates, unit labor cost inflation will drift higher, setting the stage for a period of rising price inflation. Investors should maintain below-benchmark duration in global fixed-income portfolios, favoring inflation-linked over nominal bonds and positioning for steeper yield curves. Gold should also do well next year. As long as bond yields are rising in response to stronger growth, as will be the case for the next two years, equities will be fine. The stock market will buckle, however, once stagflation sets in around 2022. Box 1 Asset Prices And Interest Rates: The Role Of Convexity
Bond Yields: How High Is Too High?
Bond Yields: How High Is Too High?
Peter Berezin Chief Global Strategist peterb@bcaresearch.com Footnotes 1Assuming semi-annual compounding, the price of a 10-year bond with a 5% coupon rate falls by 7.9% if the yield increases from 1% to 2%, which is only slightly higher than the 7.6% decline that would be incurred if the yield increases from 4% to 5%. 2One might add that if the interest rate is below the growth rate of the economy, a higher starting point for the debt stock will allow for more debt issuance without leading to a higher debt-to-GDP ratio. As we have shown before, the steady-state debt-to-GDP ratio can be expressed as p/(r-g), where r is the interest rate, g is trend GDP growth, and p is the primary (i.e., non-interest) budget balance. Thus, for example, if the government wanted to achieve a stable debt-to-GDP ratio of 50% and r-g is -2%, it would need to run a primary budget deficit of 0.5*0.02=1% of GDP. However, if the government targeted a stable debt-to-GDP ratio of 200%, it could run a primary budget deficit of 2*0.02=4% of GDP. Global Investment Strategy View Matrix
Bond Yields: How High Is Too High?
Bond Yields: How High Is Too High?
MacroQuant Model And Current Subjective Scores
Bond Yields: How High Is Too High?
Bond Yields: How High Is Too High?
Strategic Recommendations Closed Trades
Next week, we will focus on the following key items: The Flash PMI in Japan, the US and Europe on Friday. After global manufacturing activity disappointed in December, recent indicators suggest that the PMIs should strengthen again in January. Without…