Global
Yesterday, BCA Research's Global Fixed Income Strategy service raised its overall global duration exposure to neutral on a tactical basis, as a hedge to owning risk assets like corporate bonds, where some value has opened up after last week’s selloff.…

Highlights Policy Responses To The Virus: Markets are now pricing in significant monetary policy easing in response to the growth shock from the COVID-19 outbreak and related financial market instability. It is not yet clear, however, that central banks will NOT ease by as much as currently discounted in the low level of bond yields – especially as risk assets will riot anew if policymakers are not dovish enough. Duration: Raise overall global duration exposure to neutral on a tactical basis (0-3 months) until there is greater clarity on the full magnitude of the hit to global growth from the virus. Spread Product: The widening of global corporate bond spreads during last week’s equity market correction was relatively modest, suggesting that the COVID-19 outbreak has not become a credit event that raises downgrade/default risks. Maintain an overall overweight allocation to global corporates versus government bonds. Downgrade US MBS to neutral, however, given the risk of higher prepayments from falling mortgage rates. Feature What a wild ride it has been for investors. Equity markets worldwide corrected sharply last week as investors were forced to downgrade global growth expectations with the COVID-19 outbreak spreading more rapidly outside of China. US equities were particularly savaged with the S&P 500 shedding -11% of its value in a mere five trading sessions, with the VIX index of implied equity volatility spiking over 40, evoking comparisons to some of the darkest days of the 2008 financial crisis. Chart of the WeekCOVID-19 Concerns Causing Market Jitters
COVID-19 Concerns Causing Market Jitters
COVID-19 Concerns Causing Market Jitters
Government bond yields have collapsed alongside plunging equity values, with the benchmark 10-year US Treasury yield hitting an all-time intraday low of 1.04% yesterday. Investors are betting on aggressive rate cuts by global central bankers to offset weak growth momentum and disinflationary pressures that were already in place before the arrival of COVID-19. At the same time, corporate credit spreads widened worldwide last week, but the moves were relatively subdued and do not signal growing concern over future default losses (Chart of the Week). In this report, we discuss how to best position a global bond portfolio given these competing messages from government bond and credit markets. We conclude that maintaining selective strategic (6-12 months) overweights in global spread product versus governments, while also maintaining a neutral tactical (0-3 months) overall duration exposure - as a hedge against a more “U-shaped” recovery from the virus-driven downturn in global growth - is the best way to position for a backdrop where policymakers will need to be as easy as possible in a more uncertain world. What To Do Next On … Duration Risk assets were staging a massive rebound yesterday as we went to press, after policymakers worldwide signaled the need for stimulus measures to offset the COVID-19 growth shock. Both Fed Chairman Jerome Powell and Bank of Japan (BoJ) Governor Haruhiko Kuroda promised to ease monetary policy, if necessary, to stabilize markets. Meanwhile, looser fiscal policy may finally be on the way in Europe. The government of virus-stricken Italy announced a €3.6 billion stimulus package, while the German Finance Minister has hinted at a temporary suspension of Germany’s constitutional “debt brake” on deficit spending. A true coordinated global easing of both monetary and fiscal policy, would be very bullish for beaten-down growth-sensitive assets like equities and industrial commodities that have been focused on the shutdown of China’s economy in February to combat the spread of the virus. A true coordinated global easing of both monetary and fiscal policy, would be very bullish for beaten-down growth-sensitive assets like equities and industrial commodities that have been focused on the shutdown of China’s economy in February to combat the spread of the virus (Chart 2). It’s a different story for government bonds, however, as a rebound in yields from current depressed levels is not assured, even if monetary policy is eased further. This is because central bankers must maintain a dovish bias until the virus-driven uncertainty over global growth begins to fade, or else risk assets will riot once again. It’s all about financial conditions now, especially in the US where COVID-19 and the stock market selloff have become front-page news in a presidential election year. Chart 2How Quickly Will China Rebound?
How Quickly Will China Rebound?
How Quickly Will China Rebound?
For example, the entire US Treasury curve now trades below the mid-point of the fed funds target range, with the market now pricing in a very rapid dovish move by the Fed (Chart 3). Chart 3A Big Grab For Global Duration
A Big Grab For Global Duration
A Big Grab For Global Duration
Yield curves are now very flat in other major developed market (DM) economies, as well. This is partly due to the risk aversion bid for safe assets, which is evident in the deeply negative term premium component of bond yields. Flat curves also reflect a more long-lasting component, with markets pricing in lower equilibrium rates in the future. Investors are not only demanding immediate rate cuts to boost growth and stabilize financial markets, but also see little chance of those cuts eventually being reversed in the future. Chart 4Markets Increasingly Pricing In Global ZIRP
Markets Increasingly Pricing In Global ZIRP
Markets Increasingly Pricing In Global ZIRP
Our simple proxy for the market expectation of the nominal terminal rate- the 5-year overnight index swap (OIS) rate, 5-years forward – is between 0-1% for all major DM countries (Chart 4). The implication is that investors are not only demanding immediate rate cuts to boost growth and stabilize financial markets, but also see little chance of those cuts eventually being reversed in the future. Chart 5Our Central Bank Monitors Say More Easing Is Needed
Our Central Bank Monitors Say More Easing Is Needed
Our Central Bank Monitors Say More Easing Is Needed
Chart 6Global Yields Reflect Dovish Rate Expectations
Global Yields Reflect Dovish Rate Expectations
Global Yields Reflect Dovish Rate Expectations
At the moment, our global Central Bank Monitors – a compilation of economic and financial variables that influence monetary policy decisions – are all signaling a need for rate cuts (Chart 5). This is a function of sluggish growth & weak inflation. The plunge in global government bond yields already reflects that dovish shift in market expectations for central banks. Our 12-month discounters, which measure the expected change in short-term interest rates over the next year as extracted from OIS curves, are all priced for lower policy rates in the US (-97bps as of last Friday’s close), the euro area (-15bps) the UK (-35bps), Japan (-17bps), Canada (-72bps) and Australia (-46bps) (Chart 6). In the US, the current level of the benchmark 10-year Treasury yield is consistent with the extended slump in US industrial activity – as measured by the fall in the ISM manufacturing index – and risk-off sentiment measures like the CRB Raw Industrials/Gold price ratio (Chart 7). Yet at the same time, financial conditions remain very accommodative despite last week’s selloff, suggesting that the US economy can potentially weather a bout of COVID-19 uncertainty – as long as the Fed does not disappoint by delivering fewer rate cuts than the market is demanding and creating another down leg in the equity market. Chart 7UST Yields Need To Stay Lower For Longer
UST Yields Need To Stay Lower For Longer
UST Yields Need To Stay Lower For Longer
Outside the US, other central banks that have non-zero policy rates – like the Bank of Canada, Reserve Bank of Australia and Bank of England – can deliver on the rate cuts discounted in their OIS curves to fight a COVID-19 global growth downturn, if needed. Chart 8UST Bullishness Still Not At Historical Extremes
UST Bullishness Still Not At Historical Extremes
UST Bullishness Still Not At Historical Extremes
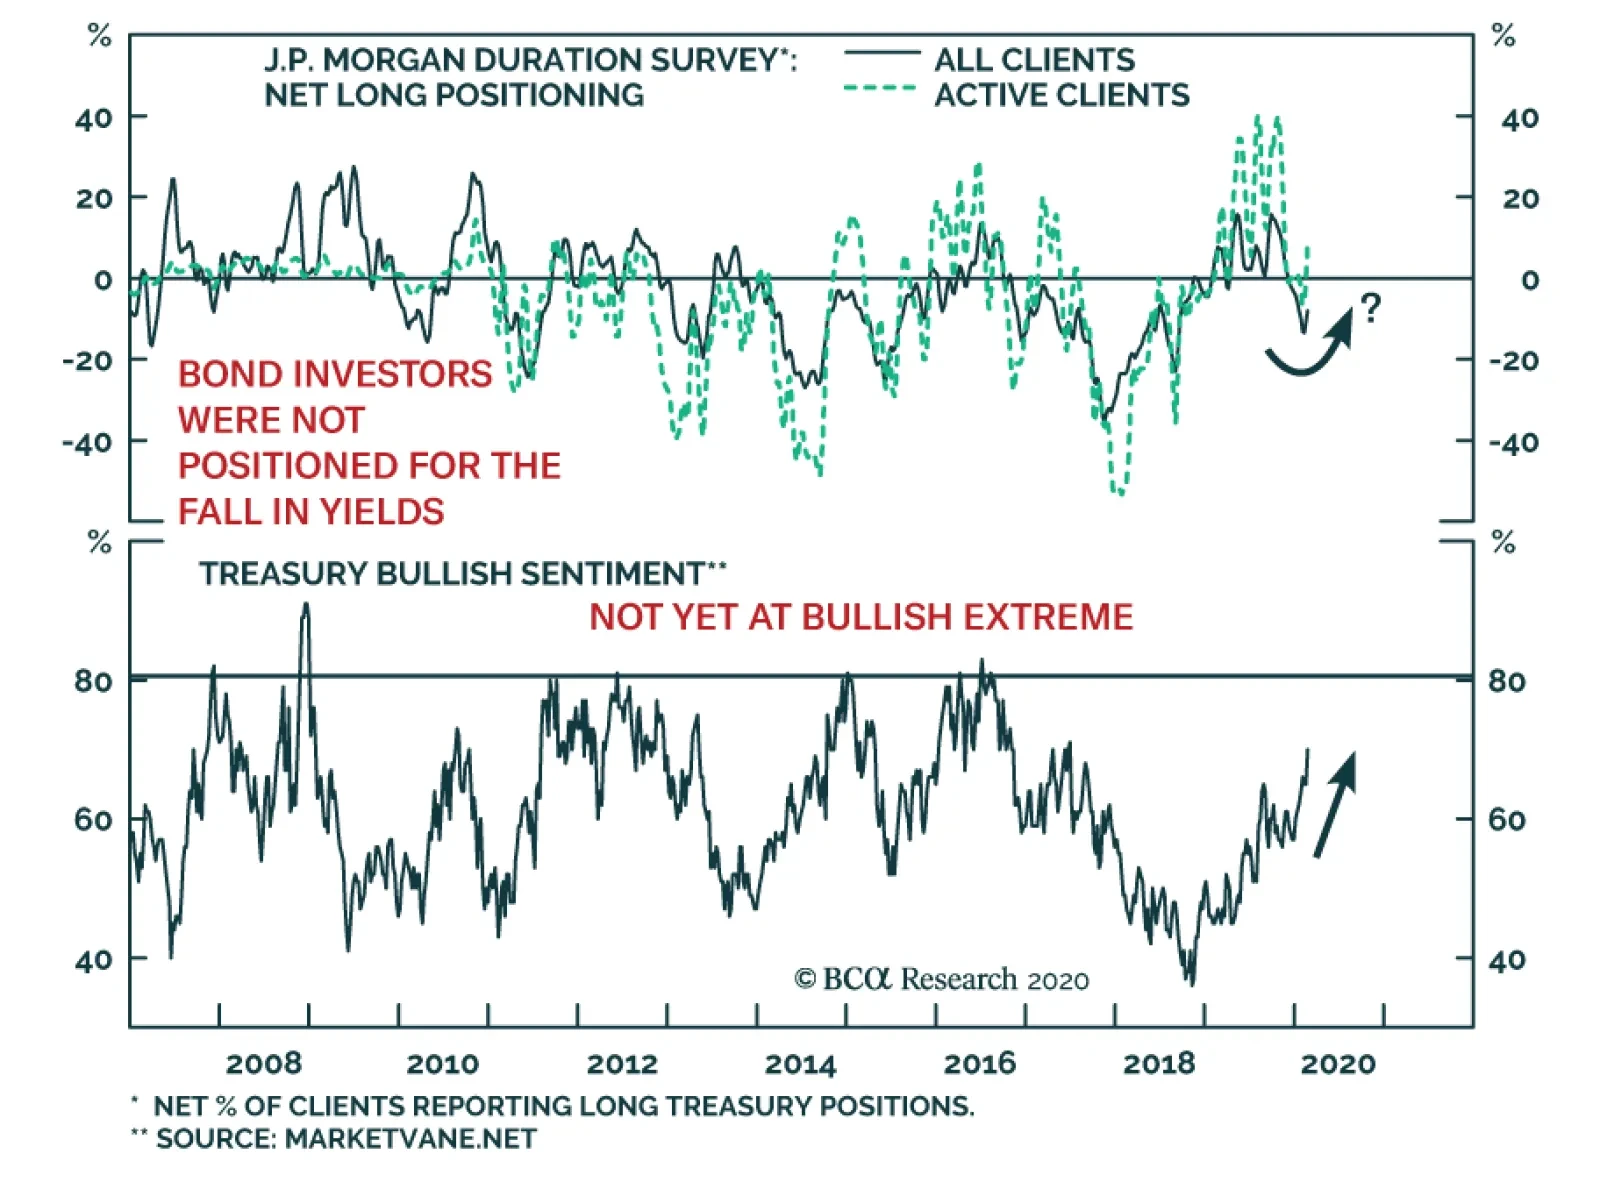
The negative rate club of the ECB and BoJ, however, is far less likely to actually cut rates and will rely on greater asset purchases and forward guidance to try and provide more policy stimulus. We prefer to view duration exposure – on a tactical basis – as a hedge to owning risk assets like corporate bonds, where we see some value now opening up after last week’s selloff, rather than a way to express a directional view on interest rates where we have less visibility and conviction. So what should a bond investor do with duration exposure? It is a difficult call with so many uncertainties on global growth momentum, the spread of the virus outside China, the size of any monetary or fiscal policy stimulus measures, and the degree of risk aversion still evident in financial markets. We prefer to view duration exposure – on a tactical basis – as a hedge to owning risk assets like corporate bonds, where we see some value now opening up after last week’s selloff, rather than a way to express a directional view on interest rates where we have less visibility and conviction. Therefore, we are raising our recommended overall duration exposure to neutral this week on a tactical basis. At the same time, we are maintaining an underweight stance on government bonds versus an overweight on corporate debt. We think a true bottom in yields will be reached when there are more decisive signs that bond positioning has reached a bullish extreme, according to indicators like the JP Morgan duration survey and the Market Vane US Treasury bullish sentiment index (Chart 8). In our model bond portfolio, we are expressing that extension of duration by shifting exposure from shorter maturity buckets to longer duration buckets in most countries. While also increasing exposure to “higher-beta” government bond markets like the US and Canada, at the expense of lower-beta Japanese government bonds. Bottom Line: Raise overall global duration exposure to neutral on a tactical basis (0-3 months) until there is greater clarity on the full magnitude of the hit to global growth from the COVID-19 outbreak. Increase allocations to countries with higher yield betas, like the US and Canada, at the expense of low-beta markets like Japan. What To Do Next On … Spread Product Allocations Chart 9US HY Selloff Was Focused On Energy Names
US HY Selloff Was Focused On Energy Names
US HY Selloff Was Focused On Energy Names
Last week’s equity market meltdown did spill over into corporate bond markets, with credit spreads widening for both investment grade and high-yield corporate debt in the US and Europe. In the US, however, the jump in high-yield spreads was particularly acute among Energy names, with the index option-adjusted spread (OAS) climbing over 1000bps as oil prices plunged (Chart 9). US high-yield ex-energy has been relatively more stable, with the spread climbing to 436bps, despite the surge in equity volatility. Stepping back and looking at US investment grade and high-yield corporates, more broadly, last week’s selloff has restored some value, most notably in high-yield. Stepping back and looking at US investment grade and high-yield corporates, more broadly, last week’s selloff has restored some value, most notably in high-yield. According to our framework for calculating spread targets for global credit, last week’s selloff pushed US investment grade spreads back to our spread targets from very expensive levels (Chart 10).1 Baa-rated US investment-grade moved slightly above our spread target, but we would describe investment grade spreads as now overall fairly valued. US high-yield spreads, on the other hand, have widened well in excess of our spread targets across all credit rating tiers (Chart 11). Chart 10US Investment Grade Spreads Now Fairly Valued
US Investment Grade Spreads Now Fairly Valued
US Investment Grade Spreads Now Fairly Valued
Chart 11US High-Yield Spreads Look Very Cheap
US High-Yield Spreads Look Very Cheap
US High-Yield Spreads Look Very Cheap
In our framework, the spread targets are determined by looking at 12-month breakeven spreads – the amount of spread widening necessary to eliminate the yield cushion of owning corporates over government bonds on a one-year horizon – relative to their long-run history. We group those spreads according to phases of the monetary policy cycle, as defined by the slope of the US Treasury yield curve. The spread target is then calculated based on the median breakeven spread for that phase of the cycle. Currently, we are in “Phase 2” of the policy cycle, which means that the Treasury yield curve (10-year minus 3-year) is positively sloped between 0 and 50bps. In Charts 10 & 11, we add a new wrinkle to our existing way to present the spread targets. We also calculate the targets using the 25th and 75th percentile observations for the breakeven spreads for that phase of the monetary policy cycle. This gives us a range for the spread target that encompasses more of the historical data. Given the improved valuations in US junk bonds, however, we think increasing allocations in our model bond portfolio makes sense. The spread widening in US high-yield has very clearly restored value to spreads, which are well above the upper level of our spread target range. The same cannot be said for US investment grade, where spreads are in the middle of the target range. Chart 12European Corporates Now Offer Better Value
European Corporates Now Offer Better Value
European Corporates Now Offer Better Value
Based on this analysis, we remain comfortable in maintaining our neutral recommended stance on US investment grade corporates and overweight stance on US high-yield. Given the improved valuations in US junk bonds, however, we think increasing allocations in our model bond portfolio makes sense. Thus, this week, we are adding to our recommended high-yield exposure (see Page 12). That increased allocation is “funded” by reducing our US Agency MBS exposure from overweight to neutral. Our colleagues at BCA Research US Bond Strategy are concerned that MBS spreads are likely to widen in the next few months to reflect the higher prepayment risk from the recent steep fall in US mortgage rates. One final note: our spread target framework for euro area corporates also indicates that last week’s global risk-off event also restored some value to European credit (Chart 12). Thus, we are maintaining our recommended overweights for both euro area investment grade and high-yield. Bottom Line: The widening of global corporate bond spreads during last week’s equity market correction was relatively modest, suggesting that the COVID-19 outbreak has not become a credit event that raises downgrade/default risks. Maintain an overall overweight allocation to global corporates versus government bonds. Downgrade US MBS to neutral, however, given the risk of higher prepayments from falling mortgage rates. Robert Robis, CFA Chief Fixed Income Strategist rrobis@bcaresearch.com Footnotes 1 We presented our framework for calculating global corporate spread targets, which builds on the work from our US Bond Strategy sister service, back in January. Please see BCA Research Global Fixed Income Strategy Special Report, "How To Find Value In Global Corporate Bonds", dated January 21, 2020, available at gfis.bcaresearch.com. Recommendations The GFIS Recommended Portfolio Vs. The Custom Benchmark Index
What Bond Investors Should Do After The "Great Correction"
What Bond Investors Should Do After The "Great Correction"
Duration Regional Allocation Spread Product Tactical Trades Yields & Returns Global Bond Yields Historical Returns
Last Friday, BCA Research's Global Investment Strategy service published a special alert upgrading their 3-month recommendation on global equities. In a worst-case scenario where the outbreak becomes a global pandemic, the resulting economic downturn will…
We published a report titled “Markets Too Complacent About The Coronavirus” before US stocks opened for trading on Friday, February 21st. In that piece, we argued that equities were at risk of swooning as investors came to grips with the severe near-term dislocations the COVID-19 outbreak would have on the global economy and the rising likelihood that the virus would spread around the world. Since then, global stocks have fallen by 13%. The S&P 500 has dropped 15%. We indicated in yesterday’s report that we would turn more bullish if global equities were to fall another 5%-to-8%. I wrote those words around noon Montreal time. As of 10:40 am EST today, global equities have sunk a further 6%, bringing us within the recommended buying range. No one knows how this virus will evolve. In a worst-case scenario where the outbreak becomes a global pandemic, the resulting economic downturn will be severe. However, it will also be quite brief. The fatality rate for people under the age of 60, who make up the vast majority of the global workforce, appears to be fairly low. Once all workers are in the same boat, the need for mass quarantines, business shutdowns, and travel bans will subside. Economic imbalances are generally smaller now than a decade ago. In most countries, including China, the private sector earns more than it spends. Monetary policy also remains highly accommodative. It is likely the Fed will lower rates next month, with an emergency cut quite possible before then. Market-based inflation expectations remain well below the Fed’s target zone. There is little reason not to ease. Granted, neither monetary nor fiscal stimulus can do much to address supply shocks. However, stimulus will prove very useful in jumpstarting growth once businesses resume operations. We downgraded our near-term view on risk assets on January 10th. Now that equity valuations have become more attractive and credit spreads have widened, we are upgrading our 3-month recommendation on global equities and spread product back to overweight. We are also downgrading our view on government bonds to underweight. Peter Berezin Chief Global Strategist peterb@bcaresearch.com
Dear Client, I participated in a webinar earlier this week with my fellow BCA Research strategists to discuss the coronavirus outbreak and other timely issues. A replay can be accessed from this link. In lieu of our regular report next week, we will be sending you a Special Report from Matt Gertken, BCA’s Research Chief Geopolitical Strategist. Matt will discuss the state of the Democratic Party’s presidential nomination process in the wake of “Super Tuesday” and address the market implications. Best regards, Peter Berezin, Chief Global Strategist Highlights The decline in the number of new infections in China suggests that the coronavirus can be contained, provided that governments are both able and willing to impose severe quarantine measures on their own citizens. It is far from clear whether all countries can introduce such measures. And even among those who can, the economic damage from prolonged work stoppages could end up being too much to bear. The spike in supplier delivery times in various purchasing manager indices suggests that the global supply chain is already showing signs of strain. If the outbreak morphs into a global pandemic, a recession on the scale of the 2008/09 downturn would likely ensue. The only economic consolation from such an outcome is that once everyone is in the same boat, the need for mass quarantines and business shutdowns will diminish. While stock valuations have improved markedly over the past week, we would still recommend that investors refrain from significantly adding to equity positions at the moment. Once COVID-19 cases start popping up all over the US, stocks could come under further pressure. That said, we would only become more constructive on the near-term outlook for global equities if prices were to fall another 5%-to-8% from current levels or if the risks of a pandemic recede. The Power Of Exponential Change Humans tend to think in linear rather than exponential terms. Thus, it is easy to forget that when dealing with exponential growth, what appears exceedingly slow at first can become exceedingly fast later on. Take the example of the COVID-19 outbreak. Suppose that R0 is 2, meaning that someone who contracts the virus will spread it to two other people on average. Also suppose that it takes one week to pass it on to someone else. In week 1, one person is infected; in week 2, two new people are infected; in week 3, four new people; in week 4, eight new people, and so on. If only a small percentage of people who are infected get sick enough to have to go to the hospital, it might not be until after the end of week 8, when 128 new people have been infected, that the authorities become aware of the epidemic. Once we reach this stage, the only two options left are to impose extreme quarantine measures in an effort to drive Ro below 1, or stand back and let the outbreak run its natural course. Not surprisingly, most governments have chosen the first approach in the hopes of limiting the outbreak to a few regional clusters. A vigilant approach also buys some time to develop a vaccine. Time will tell if this strategy succeeds. On the positive side, the number of new infections in China continues to trend lower. Outside of Hubei, only 66 new cases have been reported since February 22nd. This has allowed an increasing number of Chinese companies to resume operations. It is also encouraging that a few countries such as Japan, Singapore, and Thailand, which at one point seemed on track to experience major epidemics, have gotten the problem under some degree of control. Chart 1The Number Of New Cases Has Declined In China, But Has Jumped In South Korea, Italy, And Iran
Health Versus Growth
Health Versus Growth
On the negative side, the number of cases in South Korea, Iran, and Italy has surged (Chart 1). In South Korea, there are now 1261 confirmed cases, up from 31 early last week. South Korea’s population is less than 4% of China’s. If the current trend continues, the infection rate in Korea could surpass that of China over the next two weeks. The situation in Iran appears to be out of control. Two people from Iran have already tested positive in Canada. Bahrain has recorded 33 cases linked to Iran. In perhaps one of the most surreal moments of the crisis, Iranian deputy health minister Iraj Harirchi, who had been charged with leading the nation’s efforts to stem the epidemic, was filmed wiping his brow one day before it was confirmed he had contracted the virus. None of this prevented President Rouhani from declaring that Iran must “not allow enemies to convert the coronavirus into a weapon in their hand in order to disrupt work and production in Iran”. He went on to denounce the US for failing to “pay attention to the 16,000 American victims who died after having the influenza virus.” Worse Than The Swine Flu? Looking at the global data in aggregate, the number of confirmed cases is increasing in a manner more similar to the swine flu (H1N1) outbreak in 2009/10 than the SARS outbreak in 2003 (Chart 2). The H1N1 virus ended up infecting 61 million people in the US and between 700 million-to-1.4 billion globally. Chart 2COVID-19: More Like Swine Flu Than SARS?
Health Versus Growth
Health Versus Growth
Unlike SARS, the COVID-19 coronavirus appears to be extremely contagious and can be spread by people who show few or no symptoms. SARS was generally spread only by people who were already visibly ill. In terms of fatality rates, COVID-19 is not as lethal as SARS, but appears to be at least ten times as fatal as H1N1. At present, there are no effective vaccines for coronaviruses. While concerted efforts are underway to develop a vaccine for COVID-19, most medical professionals agree that it will take at least a year before one is widely available. Unfortunately, given the exponential dynamic described above, most of the people on the planet could be infected by then. Pandemic Risk No one knows what the probability of a pandemic is, but it is clearly not zero. As workers return to their jobs in China, the outbreak may flare up again, leading to a new wave of business closures. Countries that do not have the will or the means to quarantine their citizens on a massive scale may find themselves unable to keep the virus at bay. Investors are finally waking up to this reality. As we discussed in last week’s report entitled “Markets Too Complacent About The Coronavirus,” even in a best-case scenario where the virus is successfully corralled over the next month or so, sequential global growth will still fall to zero in the first quarter. If the outbreak is not contained and a full-fledged pandemic ensues, the world is likely to experience a recession on the scale of the 2008/09 downturn. Table 1COVID-19 Fatality Rates By Age
Health Versus Growth
Health Versus Growth
The only economic consolation from such an outcome is that once everyone is in the same boat, the need for mass quarantines and business shutdowns will diminish. Table 1 shows preliminary age-specific estimates of the fatality rate from the COVID-19 virus, provided by the Chinese Center for Disease Control and Prevention (China CDC).1 The results are based on 44,672 confirmed cases. Stocks Won’t Get Much Relief From Bonds Given that investors have known about the risks from the coronavirus for some time, why did it take so long for stocks to buckle? Part of the answer has to do with the sigh of relief investors breathed after the number of new COVID-19 cases peaked in China. As in the SARS episode, the peak in new cases marked a bottom in risk assets (Chart 3). Unfortunately, now that the number of cases has accelerated outside of China, this sanguine narrative has been dashed. Chart 3AJust As In The SARS Episode, Stocks Bottomed Around The Same Time The Number Of Infections Peaked...
Health Versus Growth
Health Versus Growth
Chart 3B… But The Number Of New Cases Outside China Has Surged
Health Versus Growth
Health Versus Growth
While the news flow about the coronavirus has been the dominant driver of stocks, there has also been another important factor at work. As Chart 4 shows, global bond yields have dropped sharply since the start of the year. Up until this week, equity investors clung to the hope that falling yields would cushion the blow to growth and earnings. They also figured that a decline in the discount rate applied to future cash flows would boost equity valuations. Not surprisingly, growth stocks, which are most sensitive to changes in the discount rate, led the charge higher (Chart 5). Chart 4Global Bond Yields Are Back Near Record Lows
Health Versus Growth
Health Versus Growth
Chart 5Growth Stocks Have Outperformed On Falling Yields
Health Versus Growth
Health Versus Growth
These rosy expectations could still be realized if the global outbreak is quickly contained. If it is not, there is not much more central banks can do. Easier monetary policy can help offset demand shocks. However, it cannot do much about supply shocks. Stocks sold off in late 2018 because investors concluded that the Fed had erred in raising interest rates four times over the course of nine months. As soon as the Fed pivoted in a more dovish direction, equities rallied. This time is different. The Fed is not responsible for the current sell-off; the virus is. Thus, while the Fed would almost certainly cut rates if the outbreak turns into a pandemic, this would have less of a soothing effect than it did in early 2019. Supply Chains At Risk The modern global economy is powered by an intricate division of labor. Widespread work stoppages across many countries would eviscerate the global supply chain. Ironically, investors were worried at the start of the year that manufacturing inventories were too high. As it turned out, excess inventories have proven to be a blessing rather than a curse because they have allowed companies to weather the supply shock longer than they could have otherwise. The grace period will expire soon. According to the latest PMI data, supplier delivery times have soared in the major economies. The latest Markit Flash Eurozone PMI noted “a marked lengthening of supplier delivery times, with delays for inputs the most widespread since December 2018, attributed in many cases to supply chain issues arising from the COVID-19 outbreak.” In the UK, Markit reported that UK manufacturers had disclosed the “the largest month-on-month slide in supply chain performance since the survey began in 1992, exceeding the previous record seen during the UK fuel protests in September 2000.” Monetary policy will come in handy only after the outbreak subsides. The dislocations caused by the virus could push many businesses towards the brink of bankruptcy. This could trigger a feedback loop of reduced spending, less hiring, and even lower spending. Timely stimulus would short-circuit this vicious cycle. That said, given that interest rates are already close to zero in most countries, much of the burden of preventing an extended downturn will have to fall on fiscal policy. It's Not Just About The Risk-Free Rate Chart 6Risk-Off Has Been On Fire
Health Versus Growth
Health Versus Growth
What about the valuation boost to stocks from falling bond yields? It is certainly true that, all things equal, lower bond yields are good for stocks. However, all things are rarely equal. We need to ask why yields have fallen. The value of the stock market does not just depend on the risk-free rate. It also depends on the additional return investors demand to hold stocks – the so-called equity risk premium – as well as expected earnings growth. If bond yields decline because skittish investors pile into safe-haven US Treasuries, while simultaneously cutting their earnings projections, this will almost certainly result in lower equity prices. What we have seen this past week is a classic risk-off event (Chart 6). Gold has surged to the highest level since 2013. Term premia in government bond markets have plunged. Tech stocks have underperformed other sectors despite the ostensible support from lower bond yields. The US dollar has rallied, even as interest rate differentials have moved against the greenback (Chart 7). Chart 7The Dollar Has Rallied, Even As Interest Rate Differentials Have Moved Against The Greenback
Health Versus Growth
Health Versus Growth
What are investors to do? While stock valuations have improved markedly over the past week, we would warn against deploying significant fresh capital to equities at the moment. Stocks were technically overbought going into this correction. Some degree of profit taking was likely no matter what transpired. Once COVID-19 cases start popping up all over the US, stocks could come under further pressure. Hence, we would only become more constructive on the near-term outlook for global equities if prices were to fall another 5%-to-8% from current levels or if the risks of a pandemic recede. Peter Berezin Chief Global Strategist peterb@bcaresearch.com Footnotes 1The Novel Coronavirus Pneumonia Emergency Response Epidemiology Team, "The Epidemiological Characteristics of an Outbreak of 2019 Novel Coronavirus Diseases (COVID-19) — China, 2020[J]," China CDC Weekly, 2020, 2(8): 113-122. Global Investment Strategy View Matrix
Health Versus Growth
Health Versus Growth
MacroQuant Model And Current Subjective Scores
Health Versus Growth
Health Versus Growth
Strategic Recommendations
Highlights Global growth will quickly recover if the Covid-19 outbreak is soon controlled. If the virus's spread doesn't slow, a worldwide recession will take hold in 2020. BCA remains cyclically bullish, but tactical caution is warranted as long as uncertainty around Covid-19 remains high. A strong dollar is generally good for the US, except for exporters. The dollar possesses greater cyclical upside, a trend that will affect global asset allocation. The dollar will correct in 2020, which could allow cyclical stocks and value stocks to outperform growth equities in the short term. Foreign equities will also temporarily outperform US stocks this year. Feature 10-year Treasury yields hit an all-time low of 1.26% this morning, and the S&P 500 finally buckled under the pressure. Meanwhile, the US dollar seems unstoppable and commodity prices are still hobbling near recent lows. The economic and financial outlook for 2020 is unusually divided. On the positive front, economic momentum slowly turned the corner after a soft 2019. Liquidity aggregates have been improving, economic sentiment is bottoming and inventories are melting away. However, if Covid-19 morphs into a global pandemic, then these nascent positives will disappear. Faced with mounting uncertainty, the S&P 500 could still face additional tactical downward pressure. However, if Covid-19 does not turn into a global pandemic, then equities should recover in the second quarter. Additionally, the dollar’s strength remains a great concern, and for 2020, it too will depend on Covid-19's continued spread. While the next 12 months are likely to be painful for the dollar, its cyclical highs still lie ahead. The dollar’s trend will affect relative sector and regional performance. Covid-19 Under Control? The Covid-19 outbreak is key to the 2020 outlook. If Covid-19 is contained, then global growth can recover after a dismal first quarter. However, if the recent uptick in cases outside of China continues to increase beyond the coming two to three weeks, 2020 will witness a quick but painful recession as governments will impose quarantines and consumer confidence will collapse. If Covid-19 is contained, then global growth can recover after a dismal first quarter. Our colleagues from BCA Research’s Global Investment Strategy service estimate that Covid-19 could easily curtail global growth by more than 1% this quarter. China’s economy is experiencing a severe contraction, which should result in negative seasonally adjusted quarterly growth in Q1.1 Live indicators, such as the number of traffic jams in Shanghai streets or daily coal consumption are very weak, standing 20% and 32% below last year’s levels. Moreover, China accounts for 19.3% of global GDP, and its imports account for 12.5% of the rest of the world’s exports. China’s weak domestic activity has a ripple effect around the world. Making matters worse, the recent factory closings are scuttling global supply chains, which further lowers non-Chinese output. Finally, Chinese tourism accounts for 4.7% of global service exports, which will be deeply negatively impacted by the current immobility of Chinese citizens. As severe as the impact of Covid-19 will be in Q1, it will be fleeting. Epidemics and natural disasters may stop economic activity for a finite time, but they create pent-up demand that boosts economic growth in the following quarters. In the case of SARS, the lost output was recovered over the subsequent two quarters. Excess money is expanding at a brisk pace, which confirms that both the quantity and price of global output can rebound quickly (Chart I-1). The same is true of various liquidity measures, such as BCA Research’s US Financial Liquidity Index, which has an excellent record of forecasting the Global Leading Economic Indicator, the US ISM, and EM export prices. Most importantly, deleveraging is a tertiary concern for Chinese policymakers for the next two years. PMIs show that inventory levels are rapidly falling around the world. A purge in inventory allows pent-up demand to boost economic activity. Nowhere is this trend more powerful than in Sweden. Manufactured goods, especially intermediate and capital goods, represent a large percentage of Sweden’s output and exports. Thus, Sweden sits early in the global supply chains. Today, the decline in Swedish inventories is so deep that the country’s new orders-to-inventories ratio is surging, which historically indicates increases in our Global Industrial Activity Nowcast as well as US and global capital expenditures (Chart I-2). Chart I-1Ample Liquidity Will Cushion The Blow
Ample Liquidity Will Cushion The Blow
Ample Liquidity Will Cushion The Blow
Chart I-2Positive Signal From Inventories
Positive Signal From Inventories
Positive Signal From Inventories
Improving liquidity and purged inventory bode very well for global economic activity. Our Global Growth Indicator, a variable mainly based on commodity prices and the bond yields of cyclical economies, has already predicted an improvement in global industrial production (Chart I-3). Our models showed that even Germany’s economy, which is largely driven by global economic gyrations, will experience a turnaround despite abysmal industrial production readings (Chart I-4). Chart I-3The Global Growth Indicator Continues To Rebound
The Global Growth Indicator Continues To Rebound
The Global Growth Indicator Continues To Rebound
Chart I-4There's Hope Even For Germany
There's Hope Even For Germany
There's Hope Even For Germany
The Federal Reserve is prepared to nurture the recovery. Falling job ads in the US, along with the New York Fed Underlying Inflation Gauge and BCA Research’s Pipeline Inflation Indicator point to a slowdown in core CPI (Chart I-5). Additionally, the FOMC wants to see inflation expectations recover toward the 2.3% to 2.5% zone reached when economic agents believe in the Fed’s capacity to sustain core PCE near 2%. BCA Research’s US Bond Strategy service’s adaptive expectations models show that based on current realized inflation trends, it would take a substantially long time for inflation expectations to move back into that zone. Chart I-5Disinflationary Pressures In The US
Disinflationary Pressures In The US
Disinflationary Pressures In The US
The current health crisis is unleashing a wave of global stimulus. EM central banks, particularly in the Philippines and Indonesia, are cutting rates, thanks to low global and domestic inflation. Fiscal stimulus is expanding. Singapore has announced an SGD 800 million package aimed at fighting the impact of Covid-19; South Korea, Malaysia and Indonesia are also boosting spending. Even Germany is considering fiscal stimulus to support its economy. In China, the PBoC has injected RMB 2.3 trillion so far this year and cut rates. Most importantly, deleveraging is a tertiary concern for Chinese policymakers for the next two years. Factions opposed to President Xi will use his handling of the virus crisis to capitalize on discontent and gain more seats on the Politburo and Central Committee at the 2022 Communist Party Congress. To combat this opposition, President Xi is abandoning the deleveraging campaign and is generously stimulating the economy to generate greater income gains. The news is not all positive however, as the risk of a global pandemic remains elevated. There is no consensus in the medical community as to whether or not the pandemic is in remission. Chinese factories are re-opening and people are on the move, which is giving the virus an opportunity to spread again. Worryingly, new clusters of cases have popped up in South Korea, Iran, and Italy. In the US too, an individual without any links to previously known cases has fallen ill. These developments must be monitored closely. As BCA Research’s Global Investment Strategy service recently showed, the 2009/10 H1N1 outbreak (known as swine flu) affected between 700 million and 1 billion people worldwide.2 According to the Lancet, it resulted in 151,700 to 575,400 deaths or a fatality rate of 0.01% to 0.08%, well below current estimates of 2.3% for Covid-19. Thus, if Covid-19 spreads as much as H1N1, it could kill between 16 and 23 million people worldwide in a short amount of time. If such an outcome comes to pass, then we are looking at a global recession. Factory closures will grow in length and prevalence, which will paralyze global supply chains. International tourism will collapse and consumers around the world will shun crowded public places, which will hurt consumption substantially. Prudence forces us to not be cavalier and protect ourselves against what would be an extremely adverse outcome if Covid-19 were to spread much further. The uncertainty around such binary outcomes is hard to price for markets. As we argued last month, investors must input large risk premia in asset prices to compensate for this lack of visibility. When we last wrote, we saw no such margin of safety in the S&P 500, but its 11.5% collapse since February 19 has gone a long way in adjusting this mispricing. In fact, some bargains in the industrial, energy or transport sectors have emerged. Bottom Line: Investors should continue to hedge their exposure to risk assets until the situation becomes clearer. For now, our central scenario remains that new cases will soon peak and economic activity will recover. In this case, stocks and bond yields now have very limited downside, and they will recover later this year. Equities will ultimately reach new highs. However, prudence forces us to not be cavalier and protect ourselves against what would be an extremely adverse outcome if Covid-19 were to spread much further. The US Benefits From A Strong Dollar Looking beyond Covid-19, BCA Research expects the US dollar to correct in 2020. However, we increasingly view this downdraft as a temporary phenomenon. The dollar’s cyclical highs remain ahead in the next two to three years. Ultimately, the US is a consumer-driven economy and households benefit from a firm currency. A higher dollar also acts as a tax cut for consumers. Surprisingly, the dollar does not have a negative impact on employment. The unemployment rate and the dollar are negatively correlated (Chart I-6). The 27% dollar rally since 2011 is not antithetical with a US unemployment rate at a 51-year low of 3.6%. Less than 10% of US jobs are in the manufacturing sector, compared with 14.4% and 15.8% in Europe and Japan respectively (Chart I-7). Moreover, 93.6% of jobs created since the labor market troughed in 2010 have been in the service sector. Given that the service sector is domestically driven and is immune to the deflationary impact of a stronger dollar, the low share of manufacturing in the US’s GDP means that the labor market is resistant to a firm USD. Chart I-6The Labor Market Does Not Abhor A Strong Dollar...
The Labor Market Does Not Abhor A Strong Dollar...
The Labor Market Does Not Abhor A Strong Dollar...
Chart I-7...Because The US Is Manufacturing Light
...Because The US Is Manufacturing Light
...Because The US Is Manufacturing Light
A higher dollar also acts as a tax cut for consumers. A dollar rally leads to a rapid decline in the share of disposable income spent on food and energy (Chart I-8). As a result, households have more discretionary disposable income to spend on services that generate domestic jobs. A strong dollar makes job creation less inflationary and permits the Fed to keep monetary policy easier for longer. A strengthening dollar redistributes income to the middle class, which supports consumption. When the dollar rallies, the share of salaries in national income increases because the dollar creates a headwind for profit margins (Chart I-9). Rich households garner more than 50% of their income from profits and rents. Therefore, if a stronger dollar increases the share GDP accounted for by wages, then a rising greenback redistributes income to middle-class households away from the rich. This redistribution is positive for consumption because middle-class households have a marginal propensity to consume of 90%, compared with 60% for households in the top decile of the income distribution. Furthermore, the more consumption can grow as a share of GDP, the more the economy can withstand a rallying currency. Chart I-8A Firm Dollar Cut "Taxes"
A Firm Dollar Cut "Taxes"
A Firm Dollar Cut "Taxes"
Chart I-9The Dollar Is A Redistributor
The Dollar Is A Redistributor
The Dollar Is A Redistributor
Chart I-10A Strong Dollar Boosts Real Incomes
A Strong Dollar Boosts Real Incomes
A Strong Dollar Boosts Real Incomes
A strong dollar also weighs on inflation, which has positive ramifications for consumers and the economy. By mid-2015, the dollar had rallied by an impressive 13.8%. While nominal wages grew at 2.2%, well below today’s rate of 3.8%, real wages were expanding at their highest rate in this cycle, courtesy of low inflation. Real consumption was also enjoying its largest gain in this cycle, expanding at 4.6% per annum (Chart I-10). A firm dollar also dampens inflation expectations (Chart I-11), allowing a flattening of the Phillips Curve, which links inflation to the unemployment rate. In other words, a strong dollar makes job creation less inflationary and permits the Fed to keep monetary policy easier for longer, delaying the inevitable date when the Fed kills the business cycle. Moreover, the disinflationary impact of a rising dollar puts downward pressure on interest rates (Chart I-12). In turn, lower rates keep financial conditions easier than would have otherwise been the case, which supports growth. Chart I-11A Hard Currency Dampens Inflation Expectations
A Hard Currency Dampens Inflation Expectations
A Hard Currency Dampens Inflation Expectations
Chart I-12A Strong Dollar Depresses Interest Rates
A Strong Dollar Depresses Interest Rates
A Strong Dollar Depresses Interest Rates
A counterargument to the view that a strong US dollar is good for the business cycle is that it will hurt capex. While true, it is easy to overestimate this impact on growth. Not only does capex represent a much lower share of GDP than consumption, it most often contributes less to changes in GDP than consumer spending (Chart I-13). Moreover, lower interest rates triggered by a firm dollar support residential activity, which in turn mitigates some of the drag created by lower corporate capex. Finally, as Chart I-14 illustrates, 74.7% of the US’s capex emanates from sectors that are minimally affected by the dollar, creating greater resilience to a stronger currency than many realize. Chart I-13Consumption Dominates Capex
Consumption Dominates Capex
Consumption Dominates Capex
Chart I-14Even Within Capex, The Dollar Is Not As Dominant As Believed
Even Within Capex, The Dollar Is Not As Dominant As Believed
Even Within Capex, The Dollar Is Not As Dominant As Believed
Chart I-15Symptoms Of US Resilience
Symptoms Of US Resilience
Symptoms Of US Resilience
The US economy is indeed robust in the face of the strong dollar. If the dollar was hurting the US, then Germany should benefit from a falling euro. However, German net exports are weakening. Moreover, US profits are not lagging European ones as US firms continue to benefit from stronger global pricing power than their European counterparts. Finally, capex intentions in the US are surprisingly resilient (Chart I-15). Three forces increase the US’s economic capacity to withstand a strong dollar this cycle. First, the structural improvement in the US’s energy trade balance allows the US current account to remain stable at -2.5% of GDP despite a widening non-oil trade deficit. Secondly, the Trump Administration’s profligate spending boosts demand and insulates the economy from a rising dollar. BCA Research’s Geopolitical Strategy service expects President Trump to win the election, albeit with a conservative probability of 55%, but also believes a Democratic victory would lead to larger spending increases than tax hikes. The current expansive fiscal policy set up will thus remain in place going forward. Finally, the Sino-US Phase One deal will provide a welcome relief valve for US manufacturers, who are victims of the stronger dollar. While economic reality probably will not allow the deal to boost China’s purchases of US goods by $200 billion vis-à-vis the higher water mark of $186 billion of 2017 (Chart I-16), nonetheless it will force China to substitute goods purchases away from Europe and Japan in favor of the US. A hard dollar can feed on itself by widening the gap between US and foreign growth, a trend currently underway. Our favorite structural valuation measure also does not suggest that the dollar is currently a major hurdle for the US economy. BCA Research's Foreign Exchange Strategy service’s Long-Term Fair Value models, which account for differences in the productivity and neutral rate of interest of the US and its trading partners, show that the dollar is still roughly fairly valued and that its equilibrium is trending up (Chart I-17). Chart I-16The Phase One Deal Is Ambitious
March 2020
March 2020
Chart I-17The Dollar Is Not Expensive Enough To Cause Pain
The Dollar Is Not Expensive Enough To Cause Pain
The Dollar Is Not Expensive Enough To Cause Pain
In this context, the US dollar has further cyclical upside. A strong dollar may not be as negative to the US economy as investors believe, but it hurts emerging economies. According to the Bank for International Settlements, there is more than US$12 trillion of USD-denominated foreign currency debt in the world. Therefore, a firm dollar tightens financial conditions outside the US. A hard dollar can feed on itself by widening the gap between US and foreign growth, a trend currently underway. Investment Implications For The Remainder Of The Cycle… Chart I-18The S&P 500 Likes A Firm Dollar
The S&P 500 Likes A Firm Dollar
The S&P 500 Likes A Firm Dollar
The dollar’s additional cyclical upside is good news for US capital markets over the next few years. The S&P 500 performs better when the dollar is firm (Chart I-18). US stocks generated average annual returns of 12% during the 53% dollar rally of 1978 to 1985, 12% during the 33% dollar rally of 1995 to 2002, and 11% as the USD appreciated 27% during the past nine years. This compares well to an annualized return of 4% when the dollar suffers cyclical bear markets. The following observations explain why the US stock market performs better when the dollar appreciates: A strong dollar allows interest rates to remain lower than would have been the case otherwise, which also allows stock multiples to remain elevated. A strong dollar elongates the US business cycle by delaying the Fed’s tightening of monetary conditions. A longer business cycle dampens volatility and invites investors to bid down the equity risk premium. A strong dollar supports the US corporate bond market. A robust dollar may negatively impact bonds issued by energy or natural resources companies, but it also keeps the Fed at bay, which prevents a generalized increase in volatility and spreads. Lower rates allow for easy financial conditions and plentiful buybacks, a helpful combination for equities. Chart I-19The Dollar Holds The Key To Growth Vs Value
The Dollar Holds The Key To Growth Vs Value
The Dollar Holds The Key To Growth Vs Value
A hard dollar is fundamental to the outperformance of US equities relative to global stocks. Global investors usually not do not hedge the currency component of equity returns. A firm USD automatically creates a powerful advantage for US stocks that invites greater inflows. In addition, a climbing dollar hurts value stocks (Chart I-19). Value stocks overweight cyclical sectors such as financials, industrials, materials and energy, sectors which depend on higher inflation, expanding EM economies and higher yields to outperform, three variables that suffer from an appreciating USD. An underperformance of value stocks also causes a poor outcome for foreign markets, which heavily overweight value over growth (Table I-1). Table I-1Key Overweights By Market
March 2020
March 2020
Chart I-20A Strong Dollar Fuels Tech Multiples
A Strong Dollar Fuels Tech Multiples
A Strong Dollar Fuels Tech Multiples
The tech sector also benefits from a firm dollar. Tech stocks generate long-term earnings growth and they are generally not as sensitive to the global business cycle as traditional cyclical equities are. When the global business cycle weakens, yields decline and the dollar appreciates, then earnings growth becomes scarce. In this environment, investors willingly bid up assets that can generate a structural earning expansion. Tech multiples become the prime beneficiary of that phenomenon (Chart I-20), which allows US stocks to meaningfully outperform the rest of the world when the dollar hardens. Bottom Line: A firm dollar will allow the business cycle to expand for longer, which suggests that the dollar will make greater highs over the coming two to three years. Within this time frame, US stocks will likely continue to outperform their global counterparts, despite their valuations disadvantage. … And For 2020 In 2020, the dominant driver for the US dollar will be global growth. The pickup in BCA’s Global Growth Indicator and the elevated chance of a rising Chinese combined credit and fiscal impulse will lift global activity and thus, force down the USD (Chart I-21). Additionally, existing trends in global money supply growth reinforce the near-term downside risk to the dollar, assuming Covid-19 does not become a global pandemic (Chart I-22). Chart I-21China Stimulus Will Lift Growth
chart 21
China Stimulus Will Lift Growth
China Stimulus Will Lift Growth
Chart I-22Bearish Monetary Dynamics For The Dollar In 2020
Bearish Monetary Dynamics For The Dollar In 2020
Bearish Monetary Dynamics For The Dollar In 2020
Chart I-23The Euro Is Not The Best Anti-Dollar Bet For 2020
The Euro Is Not The Best Anti-Dollar Bet For 2020
The Euro Is Not The Best Anti-Dollar Bet For 2020
The euro is unlikely to be the main beneficiary from a dollar correction. EUR/USD does not yet trade at a discount to our fair value estimates consistent with an intermediate-term bottom (Chart I-23). Moreover, the euro lags pro-cyclical currencies such as the AUD, CAD, NZD, or SEK, when global growth starts to recover but inflation remains weak. Finally, the Phase One Sino-US trade deal will create a drag on the positive impact of a Chinese recovery on European exports for machinery.3 Bottom Line: A dollar correction in 2020 is congruent with a period of underperformance for tech stocks relative to industrials, financials, materials and energy stocks. The correction also supports value relative to growth equities this year, as well as foreign bourses relative to the S&P 500. Investors who elect to bet against the dollar in 2020 should only do so with great caution as they will be betting against the broader cyclical trend. A correction in the dollar, by definition, is transitory. Thus, the aforementioned equity implications will also likely be temporary. Ultimately, the US economy remains the global growth leader in the post-2008 environment. Mathieu Savary Vice President The Bank Credit Analyst February 27, 2020 Next Report: March 26, 2020 II. Labor Strikes Back The balance of power in US labor negotiations has shifted infrequently in the industrial age. Successful strikes beget strikes. Key factors that have bolstered management for decades are poised to reverse. Public opinion has a significant impact on labor-management outcomes. Elections have consequences. Organized labor isn’t dead. Where will inflation come from, and when will it arrive? An investor who answers these questions will have advance notice of the end of the expansion and the bull markets in equities and credit. Per our base-case scenario, the expansion won’t end until monetary policy settings become restrictive, and the Fed won’t pursue restrictive policy unless inflation pressures force its hand. The fur flies when each party thinks the other should make the bulk of the concessions: labor negotiations over the next couple of years could be interesting. Inured by a decade of specious warnings that “money printing” would let the inflation genie out of the bottle, investors are skeptical that inflation will ever re-emerge. The inflation backdrop has become much more supportive in the last few years, however, upon the closing of the output gap, and the stimulus-driven jolt in aggregate demand. Output gaps in other major economies will have to narrow further (Chart II-1) for global goods inflation to gain traction, and mild inflation elsewhere in the G7 (Chart II-2) suggests that goods prices are not about to surge. Chart II-1There's Still Enough Spare Capacity ...
March 2020
March 2020
Chart II-2... To Restrain Global Goods Inflation
... To Restrain Global Goods Inflation
... To Restrain Global Goods Inflation
Services are not so easily imported, though, and services inflation is a more fully domestic phenomenon. Rising wages could be the spur for services inflation, and the labor market is tight on several counts: the unemployment rate is at a 50-year low; the broader definition of unemployment, also encompassing discouraged workers and the underemployed, reached a new all-time (25-year) low in December; the JOLTS job openings and quits rates at or near their all-time (19-year) highs; and the NFIB survey and a profusion of anecdotal reports suggest that employers are having a hard time finding quality candidates. With labor demand exceeding supply, wages for nonsupervisory workers have duly risen (Chart II-3). Gains in other compensation series have been muted, however, and investors have come to yawn and roll their eyes at any mention of the Phillips Curve. Chart II-3Wage Growth Is Solid, But It's Lost A Good Bit Of Momentum
Wage Growth Is Solid, But It's Lost A Good Bit Of Momentum
Wage Growth Is Solid, But It's Lost A Good Bit Of Momentum
Perhaps it’s not the Phillips Curve that’s broken, but workers’ spirits. A supine organized labor movement could explain why the Phillips Curve itself is so flat. As the old saying goes, if you don’t ask, you know what you’re going to get, and beleaguered unions and their memberships, cowed by two decades of woe coinciding with China’s entry into the WTO (Chart II-4), have been afraid to ask. Strikes are the most potent weapon in labor’s arsenal; if it can’t credibly wield them, it is sure to be steamrolled. Chart II-4Globalization Has Been Unkind To Labor
Globalization Has Been Unkind To Labor
Globalization Has Been Unkind To Labor
Two years of high-profile strike victories by public- and private-sector employees may suggest that the sands have begun to shift, however, and inspired our examination of labor’s muscle. An Investor’s Guide To US Labor History Let's begin our exercise with a review of US labor relations. The Colosseum Era (1800-1933) We view US industrial labor history as having three distinct phases. We label the first, which lasted until the New Dealers took over Washington, the Colosseum era (Figure II-1), because labor and management were about as evenly matched as the Christians and the lions in ancient Rome. Uprisings in textile mills, steel factories, and mines were swiftly squelched, often violently. Management was able to draw on public resources like the police and state National Guard units to put down strikes, or was able to unleash its own security or ad hoc militia forces on strikers or union organizers without state interference. The public, staunchly opposed to anarchists and Communists, generally sided with employers. Figure II-1Significant Events In The Colosseum Era
March 2020
March 2020
Unions won some small-bore victories during the period, but they nearly all proved fleeting as companies regularly took back concessions and public officials and courts failed to enforce the loose patchwork of laws aimed at ameliorating industrial workers’ plight. Labor inevitably suffered the brunt of the casualties when conflicts turned violent. Workers were hardly choir boys, and seem to have initiated violence as often as employers’ proxies, but they were inevitably outgunned, especially when police, guardsmen or soldiers were marshaled against them. Societal norms have changed dramatically since the Colosseum era, but the lore of past “battles” encourages an us-versus-them union mentality that occasionally colors negotiations. Employees and employers need each other, and their tether can only be stretched so far before it starts pulling them back together. The UAW Era (1933-1981) Established presumptions about the employer-employee relationship were upended when FDR entered the White House. Viewing labor organization as a way to ease national suffering, New Dealers passed the Wagner Act to grant private-sector workers unionization and collective bargaining rights, and created the National Labor Relations Board to ensure that employers respected them. The Wagner Act greatly aided labor organization, enabling unions to build up the heft to engage with employers on an equal footing. Unionized workers still fought an uphill battle in the wake of the Depression, but tactics like the sit-down strike (Box II-1) produced some early labor victories that paved the way for more. BOX II-1 David Topples Goliath: The Flint Sit-Down Strike The broad mass of factory workers had not been organized to any meaningful degree before the New Deal, and the United Auto Workers (UAW) was not formed until 1935. Despite federal protections, the fledgling UAW had to conduct its operations covertly, lest its members face employer reprisals. At the end of 1936, when it took on GM, only one in seven GM employees was a dues-paying member. The strike began the night of December 30th when workers in two of GM’s Flint auto body plants sat down at their posts, ignoring orders to return to work. The sit-down action was more effective than a conventional strike because it prevented GM from simply replacing the workers with strikebreakers. It also made GM think twice about attempting to remove them by force, lest valuable equipment be damaged. GM was unsure how to dislodge the workers after a court injunction it obtained on January 2nd went nowhere once the UAW publicized that the presiding judge held today’s equivalent of $4 million in GM shares. It turned off the heat in one of the plants on January 11th, before police armed with tear gas and riot guns stormed it. The police were rebuffed by strikers who threw bottles, rocks, and car parts from the plant’s upper windows while spraying torrents of water from its fire hoses. No one died in the melee, but the strike was already front-page news across the country, and the attack helped the strikers win public sympathy. Michigan’s governor responded by calling out the National Guard to prevent a rematch, shielding the strikers from any further violence. The strike was finally settled on February 11th when GM accepted the UAW as the workers’ exclusive bargaining agent and agreed not to hinder its attempts to organize its work force. The UAW signed a similar accord with Chrysler immediately after the Flint sit-down strike, and the CIO (the UAW’s parent union) swiftly reached an agreement with US Steel that significantly improved steelworkers’ pay and hours. Labor unions’ path wasn’t always smooth – Ford fiercely resisted unionization until 1941, and ten protesters were killed, and dozens injured, by Chicago police at a peaceful Memorial Day demonstration in support of strikers against the regional steelmakers that did not follow US Steel’s conciliatory lead – but it generally trended upward after the New Deal (Figure II-2). From the 1950 signing of the Treaty of Detroit, a remarkably generous five-year agreement between the UAW and the Big Three automakers, the UAW ran roughshod over the US auto industry for three-plus decades. The New Deal’s encouragement of unionization had given labor a fighting chance, and was the foundation on which all of its subsequent gains were built. Figure II-2Significant Events In The UAW Era
March 2020
March 2020
The Reagan-Thatcher Era (1981 - ??) The disastrous strike by the air traffic controllers’ union (PATCO) is the watershed event that heralded the end of unions’ golden age. Strikes by federal employees were illegal, so PATCO broke the law when it went on strike in April 1981, spurning the generous contract terms its leaders had negotiated with the Reagan administration. PATCO had periodically held the flow of air traffic hostage throughout the seventies to extract concessions from its employer, earning the lasting enmity of airlines, government officials and the public. Other unions were aghast at PATCO’s openly contemptuous attitude, and declined to support it with sympathy strikes, while conservatives blasted the new administration behind closed doors for the profligacy of its initial PATCO offer. President Reagan therefore had an unfettered opportunity to make an example out of the controllers, and he seized it, firing those who failed to return to work within 48 hours and banning them from ever returning to government employment. A fed-up public supported the president’s hard line, and employers and unions got the message that a new sheriff was in town. His deputies were not inclined to enforce labor-friendly statues, or investigate labor grievances, with much vigor, and they would not necessarily look the other way when public sector unions illegally struck. Management has been in the driver's seat, but the factors that have kept it there have a high risk of reversing. Unions also found themselves on the wrong side of the growing disaffection with bureaucracy that was bound up with the push for deregulation. The globalization wave further eroded labor’s power. Unskilled workers in the developed world would be hammered by the flat world that allowed people, capital and information to hopscotch around the globe. Eight years of a Democratic presidency brought no relief, as the “Third Way” Clinton administration embraced the free-market tide (Chart II-5), and the unionized share of employees has receded all the way back to mid-thirties levels (Chart II-6). Chart II-5Inequality Took Off ...
Inequality Took Off ...
Inequality Took Off ...
Chart II-6... As Unions Lost Their Way
... As Unions Lost Their Way
... As Unions Lost Their Way
A Fourth Phase? A handful of data points do not make a trend, especially in a series that stands out for its persistence, but the bargaining power pendulum could be shifting. Public school teachers won improbable statewide victories with illegal strikes in three highly conservative states in the first half of 2018 (Table II-1); a canny hotel workers union steered its members to big gains in their contract negotiations with Marriott in the second half of 2018; and the UAW bested General Motors and the rest of the Big Three automakers last fall. Unions may have more bargaining power than markets and employers realize, and they could be on the cusp of becoming more aggressive in flexing it. Table II-1Teachers' Unions Conquer The Red States
March 2020
March 2020
Takeaways (I) There are two key takeaways from our historical review: 1. US industrial history makes it clear that employees are unlikely to gain ground if government sides with employers. Employees no longer have to fear that the state will look the other way while strikers are beaten, or fail to prosecute those responsible for loss of life, but they face especially long odds when the government is inclined to favor employers. Its thumb weighs heavily on the scale when it drags its feet on enforcement; cuts funding to agencies policing workplace standards; and appoints agency or department heads that are conditioned to see things solely from employers’ perspective, shaped by long careers in management. 2. Successful strikes beget strikes, and the converse is also true. Withholding their labor is employees’ most powerful weapon, and when employers can’t replace them cheaply and easily, strikes often succeed. Striking is frightening for an individual, however, because it cuts off his or her income (or sharply reduces it, if the striker’s union has a strike fund) until the strike is over. If the strike fails, the employee may find him/herself blacklisted, impairing his/her long-term income prospects on top of his/her short-term losses. Prudent workers should therefore strike sparingly, with the due consideration that a prudent poker player exercises before going all-in. Companies will do whatever they perceive to be socially acceptable in conflicts with employees, but no more. When other unions facing comparable conditions pull off successful strikes, it makes it much easier for another union to take the leap, in addition to making success more likely, provided conditions truly are comparable. “Before they occur, successful strikes appear impossible. Afterward, they seem almost inevitable .”4 The retrospective inevitability stiffens the spine of potential strikers who observe successful outcomes, and raises the bar for action among potential strikers who observe failures. “Just as defeats in struggle lead to demoralization and resignation, victories tend to beget more victories .”5 Public opinion matters just as surely as momentum, and it proved decisive in the Flint sit-down strike and in the air traffic controllers’ showdown with President Reagan. According to Gallup’s annual poll, Americans now regard unions as favorably as they did before Thatcher and Reagan came to power (Chart II-7). Chart II-7Could Unions Make A Comeback?
Could Unions Make A Comeback?
Could Unions Make A Comeback?
Where Strikes Come From And Who Wins Them Since strikes are such an important determinant of the support for labor, what drives successful labor actions? The Origin Of Strikes Strikes (and lockouts) occur when labor and management cannot reach a mutually acceptable settlement, often because at least one side overestimates its bargaining power. It is easy to agree when labor and management hold similar views about each side’s relative power, as when both perceive that one of them is considerably stronger. In that case, a settlement favoring the stronger side can be reached fairly quickly, especially if the stronger side exercises some restraint and does not seek to impose terms that the weaker side can scarcely abide. Restraint is rational in repeated games like employer-employee bargaining, and when both parties recognize that relative bargaining positions are fluid, they are likely to exercise it. It's no surprise that unions have started to look pretty good to workers after a decade of sluggish growth and widening inequality. History shows that the pendulum between labor and management swings, albeit slowly, as societal views evolve6 and the business cycle fluctuates. As a general rule, management will have the upper hand during recessions, when the supply of workers exceeds demand, and labor will have the advantage when expansions are well advanced, and capacity tightens. A high unemployment rate broadly favors employers, and a low unemployment rate favors employees. Neither the number of work stoppages (Chart II-8, top panel), nor the number of workers involved (Chart II-8, middle panel) correlates very well with the unemployment gap (Chart II-8, bottom panel), in the Reagan-Thatcher era, however, as work stoppages have dwindled almost to zero. Chart II-8Swamped By The Legal And Regulatory Tide
Swamped By The Legal And Regulatory Tide
Swamped By The Legal And Regulatory Tide
Game theory is better equipped than simple regression models to offer insight into the origin of strikes. We posit a simple framework in which each side can hold any of five perceptions of its own bargaining power, resulting in a total of 25 possible joint perceptions. Management (M) can believe it is way stronger than Labor (L), M >> L; stronger than Labor, M > L; roughly equal, M ≈ L; weaker than Labor, L > M; or way weaker than Labor, L >> M. Labor also holds one of these five perceptions, and the interaction of the two sides’ perceptions establishes the path negotiations will follow. Limiting our focus to today’s prevailing conditions, Figure II-3 displays only the outcomes consistent with management’s belief that it has the upper hand. For completeness, the exhibit lists all of labor’s potential perceptions, but we deem the two in which labor is feeling its oats (circled) to be most likely, given the success of recent high-profile strikes.7 Management’s confidence follows logically from four decades of victories, but may prove to be unfounded if its power has already peaked. Figure II-3The Eye Of The Beholder
March 2020
March 2020
Strike outcomes turn on which side has overestimated its leverage. The broad factors we use to assess leverage are overall labor market slack; economic concentration; regulatory and legal trends; and the sustainability of either side’s accumulated advantage, which we describe as the labor-management rubber band. Other factors that matter on a case-by-case basis, but are beyond the scope of our analysis, include industry-level slack, a labor input’s susceptibility to automation, and the degree of labor specialization/skill involved in that input. For these micro-level factors, a given group of workers’ leverage is inversely related to the availability of substitutes for their input. Labor Market Slack Despite muted wage growth, the labor market is demonstrably tight. The unemployment rate is at a 50-year low, the broader definition of unemployment is at the lowest level in its 26-year history, and the prime-age employment-to-population ratio is back to its 2001 levels, having surpassed the previous cycle’s peak (Chart II-9). The job openings rate is high, indicating that demand for workers is robust, and so is the quits rate, indicating that employers are competing vigorously to meet it. The NFIB survey’s job openings and hiring plans series (Chart II-10) echo the JOLTS findings. Chart II-9Prime-Age Employment Is At An 18-Year High ...
Prime-Age Employment Is At An 18-Year High ...
Prime-Age Employment Is At An 18-Year High ...
Chart II-10... But There Are Still Lots Of Help Wanted Signs
... But There Are Still Lots Of Help Wanted Signs
... But There Are Still Lots Of Help Wanted Signs
The lack of labor market slack decisively favors workers’ negotiating position. It is a sellers’ market when demand outstrips supply, and labor victories tend to be self-reinforcing. Successful strikes beget strikes, and management volunteers concessions as labor peace becomes a competitive advantage during strike waves. Given that the crisis-driven damage to the labor force participation rate has healed as the gap between the actual part rate (Chart II-11, solid line) and its demographically-determined structural proxy has closed (Chart II-11, dashed line), the burden of proof rests squarely with those who argue that there is an ample supply of workers waiting to come off the sidelines. Chart II-11The Labor Force Participation Gap Has Closed
The Labor Force Participation Gap Has Closed
The Labor Force Participation Gap Has Closed
Economic Concentration The trend toward economic concentration (Chart II-12) has endowed the largest companies with greater market power, as evidenced by surging corporate profit margins. The greater the concentration of employment opportunities in local labor markets, the more closely they resemble monopsonies.8 Unfortunately for labor, monopsonies restrain prices just as monopolies inflate them. As we have shown,9 there is a robust inverse relationship between employment concentration and real wages (Chart II-13). Chart II-12Less Competition = More Power
March 2020
March 2020
Chart II-13One Huge Buyer + Plus Multiple Small Sellers = Low Prices
March 2020
March 2020
Economic concentration has been a major driver of management’s Reagan-Thatcher era dominance. Sleepy to indifferent antitrust enforcement has helped businesses capture market power, and it will continue to prevail through 2024 unless the Democrats take the White House in November. The silver lining for workers is that concentration could have the effect of promoting labor organization in services, where unions have heretofore made limited progress. The only way for employees to combat employers’ monopsony power is to organize their way to becoming a monopoly supplier of labor. Regulatory And Legal Trends Over the last four decades, unions have endured a near-constant drubbing from state capitols, federal agencies and the courts, as union and labor protections have been under siege from all sides. Since the air traffic controllers’ disastrous strike, labor’s regulatory and legal fortunes have most closely resembled the competitive fortunes of the Harlem Globetrotters’ beleaguered opposition. But the regulatory and legal tide has been such a huge benefit for management since the beginning of the Reagan administration that it cannot continue to maintain its pace. If the electorate has had enough of Reagan-Thatcher policies, elected officials will stop implementing them. Investors seem to assume that it will, however, to the extent that they think about it at all. It stands to reason that employers may be similarly complacent. We will look more closely at the presidential election and its potential consequences in Part 3, but labor concerns and inequality are capturing more attention, even among Republicans. With Republicans’ inclination to side with business only able to go in one direction, the chances are good that it has peaked. The Labor-Management Rubber Band For all of the romantic allure of labor’s battles with management in the Colosseum era, employees and employers have a deeply symbiotic relationship. One can’t exist without the other, and pursuing total victory in negotiations is folly. Even too many incremental wins can prove ruinous, as the UAW discovered to its chagrin in 2008. A half-century of generous compensation and stultifying work rules saddled Detroit automakers with a burden that would have put them out of business had the federal government not intervened. Table II-2Average Salaries Of Public School Teachers By State
March 2020
March 2020
We think of labor and management as being linked by a tether with a finite range. Since neither side can thrive for long if the other side is suffering, the tether pulls the two sides closer together when the gap between them threatens to become too wide. When labor does too well for too long at management’s expense, profit margins shrink and the company’s viability as a going concern is threatened. When management does too well, deteriorating living standards drive the best employees away, undermining productivity and profitability. Before the low-paying entity’s work force becomes a listless dumping ground for other firms’ castoffs, it may rise up and strike out of desperation. Teachers’ unions might have appeared to be setting themselves up for a fall in 2018 by illegally striking in staunchly conservative West Virginia, Oklahoma and Arizona, but desperate times call for desperate measures. Per the National Education Association’s data for the 2017-18 academic year, average public school teacher pay in West Virginia ranked 50th among the 50 states and the District of Columbia, Oklahoma ranked 49th and Arizona ranked 45th (Table II-2). Adjusting the nominal salaries for cost disparities across states, West Virginia placed 41st, Oklahoma 44th and Arizona 48th. Given that real teacher salaries had declined by 8% and 9% since 2009-10 in West Virginia and Arizona, respectively, the labor-management rubber band had stretched nearly to the breaking point. Consolidating The Macro Message Parties to negotiations derive leverage from the availability of substitutes. When alternative employment opportunities are prevalent, workers have a lot of leverage, because they can credibly threaten to avail themselves of them. Teaching is a skill that transfers easily, and every state has a public school system, so teachers in low-salary states have a wealth of ready alternatives. The converse is true for low-salary states; despite much warmer temperatures, it is unlikely that teachers from top-quintile states will be willing to take a 25-33% cost-of-living-adjusted pay cut to decamp to Arizona (Table II-3). Table II-3Cost Of Living-Adjusted Public School Teacher Salaries By State
March 2020
March 2020
It is easy to see from Figure II-4 why management has had the upper hand. Economic concentration and the legal and regulatory climate have increasingly favored it for decades. The immediate future seems poised to favor labor, however, as the legal and regulatory climate cannot get materially better for employers, and the labor-management rubber band has become so stretched that some sort of mean reversion is inevitable. We have high conviction that labor’s one current advantage, a tight labor market, will remain in its column over the next year or two. On a forward-looking basis, the macro factors as a whole are poised to support labor. Figure II-4Macro Drivers Of Negotiating Leverage
March 2020
March 2020
Takeaways (II) We think it is more likely than not that the labor movement in the United States will remain weak relative to its 1950s to 1970s heyday. We do think, however, that the probability that unions could rise up to exert the leverage that accrues to workers in a tight labor market is considerably larger than the great majority of investors perceive. Alpha – market-beating return – arises from surprises. An investor captures excess returns when s/he successfully anticipates something that the consensus does not. If the disparity involves a trivial outcome, then any excess return is likely to be trivial, but if the outcome is significant, the investor who zigged when the rest of the market zagged stands to separate him/herself from the pack. We think the outcome of a shift in leverage from employers to employees would be very large indeed. We would expect that aggregate wage gains of 4% or higher would quickly drive the Fed to impose restrictive monetary policy settings, eventually inducing the next recession and the end of the bull markets in equities, credit and property. A union revival may be a low-probability event, but it would have considerable impact on markets and the economy. Given our conviction that the probability, albeit low, is much greater than investors expect, we think the subject is well worth sustained attention. The Public-Approval Contest The last question to approach is how does labor or management win in the court of public opinion? Capturing Hearts And Minds Public opinion has shaped the outcomes of labor-management contests throughout US labor relations history. Labor was continually outgunned before the New Deal, coming up against private security forces, local police and/or the National Guard when they struck. Employers were able to turn to hired muscle, or request the deployment of public resources on their behalf, because the public had few qualms about using force to break strikes. College athletes were even pressed into service as strikebreakers after the turn of the century for what was viewed at the time as good, clean fun.10 Public opinion is not immutable, however, and by the time of the Flint sit-down strike, it had begun to shift in the direction of labor. The widespread misery of the Depression went a long way to overcoming Americans’ deep-seated suspicion of the labor movement and the fringe elements associated with it. Some employers were slow to pick up on the change in the public mood, however, and Ford’s security force thuggishly beat Walter Reuther and other UAW organizers while they oversaw the distribution of union leaflets outside a massive Ford plant just three months after Flint. Ford won the Battle of the Overpass, but its heavy-handed, retrograde tactics helped cost it the war. Reuther, who later led the UAW in its ‘50s and ‘60s golden age, was a master strategist with a knack for public relations. Writing the playbook later used to great effect by civil rights leaders, Reuther invited clergymen, Senate staffers and the press to accompany the largely female team of leafleteers. When the Ford heavies commenced beating the men, and roughly scattering the women, photographers were on hand to document it all.11 The photos helped unions capture public sympathy, just as televised images of dogs and fire hoses would later help secure passage of landmark civil rights legislation. Unions’ Fall From Grace Figure II-5Unions' 1980s Public Opinion Vortex
March 2020
March 2020
Labor unions enjoyed their greatest public support in the mid-fifties, and largely maintained it well into the sixties, until rampant corruption and ties to organized crime undermined their public appeal. The shoddy quality of American autos further turned opinion against the UAW, the nation’s most prominent union, and a college football star named Brian Bosworth caused a mid-eighties furor by claiming that he had deliberately sought to prank new car buyers during his summer job on a Chevrolet assembly line. Bosworth later retracted the claim that GM workers had shown him how to insert stray bolts in inaccessible parts of car bodies to create a maddening mystery rattling, but the fact that so many Sports Illustrated readers found it credible eloquently testified to the UAW’s image problem. President Reagan accelerated the trend when he successfully stood up to the striking air traffic controllers, but his administration could not have taken such a hard line if unions hadn’t already been weakened by declining public support. Together, the public’s waning support for unions and the Reagan administration’s antipathy for them were powerfully self-reinforcing, and they fueled a vicious circle that powered four decades of union reversals (Figure II-5). As a prescient November 1981 Fortune report put it, “‘Managers are discovering that strikes can be broken, … and that strike-breaking (assuming it to be legal and nonviolent) doesn’t have to be a dirty word. In the long run, this new perception by business could turn out to be big news.’”12 Emboldened by the federal government’s replacement of the controllers, and the growing public perception that unions had devolved into an insular interest group driving the cost of living higher for everyone else, businesses began turning to permanent replacement workers to counter strikes.13 As an attorney that represented management in labor disputes told The New York Times in 1986, “If the President of the United States can replace [strikers], this must be socially acceptable, politically acceptable, and we can do it, also.”14 Labor’s New Face … Polling data indicate that unions have been recovering in the court of public opinion since the crisis, when the public presumably soured on them over the perception that the UAW was selfishly impeding the auto industry bailout. Their image got a boost in 2018 (Chart II-14), as striking red-state teachers embodied the shift from unions’ factory past to their service-provider present. “The teachers, many of them women, are redefining attitudes about organized labor, replacing negative stereotypes of overpaid and underperforming blue-collar workers with a more sympathetic face: overworked and underappreciated nurturers who say they’re fighting for their students as much as they’re fighting for themselves.”15 Chart II-14Feeling The Bern?
Feeling The Bern?
Feeling The Bern?
Several commentators have heard organized labor’s death knell in US manufacturing’s irreversible decline. Unions gained critical mass on docks, factory floors, steel mills and coal mines, but few of today’s workers make their living there. Those who remain have little recourse other than to accept whatever terms management offers, as their jobs can easily be outsourced to lower-cost jurisdictions. The decline in private-sector union membership has traced the steady diminution of factory workers’ leverage (Chart II-15). Chart II-15Tracking Manufacturing's Slide
Tracking Manufacturing's Slide
Tracking Manufacturing's Slide
Service workers represent unions’ future, and they have two important advantages over their manufacturing counterparts: many of their functions cannot be offshored, and a great deal of them are customer-facing. When MGM’s chairman was ousted from his job after clashing with Las Vegas’ potent UNITE-HERE local over the new MGM Grand Hotel’s nonunion policy, his successor explained why he immediately came to terms with the union. “‘The last thing you want is for people who are coming to enjoy themselves to see pickets and unhappy workers blocking driveways. … When you’re in the service business, the first contact our guests have is with the guest-room attendants or the food and beverage servers, and if that person’s [sic] unhappy, that comes across to the guests very quickly.’”16 … Management’s New Leaf … The Business Roundtable’s latest statement on corporate governance principles laid out a new stakeholder vision, displacing the Milton Friedman view that corporations are solely responsible for maximizing shareholder wealth. The statement itself is pretty bland, but the preamble in the press release accompanying it sounds as if it had been developed with labor advocates’ help (Box II-2). It is a stretch to think that the ideals in the Roundtable’s communications will take precedence over investment returns, but they may signal that management fears the labor-management rubber band has been stretched too far.17 The Environmental, Social and Governance (ESG) movement has the potential to improve rank-and-file workers’ wages and working conditions. ESG proponents have steadily groused about outsized executive pay packages, but if asset owners and institutional investors were to begin pushing for higher entry-level pay to narrow the income-inequality gap, unions could gain some powerful allies. BOX II-2 Farewell, Milton Friedman America’s economic model, which is based on freedom, liberty and other enduring principles of our democracy, has raised standards of living for generations, while promoting competition, consumer choice and innovation. America’s businesses have been a critical engine to its success. Yet we know that many Americans are struggling. Too often hard work is not rewarded, and not enough is being done for workers to adjust to the rapid pace of change in the economy. If companies fail to recognize that the success of our system is dependent on inclusive long-term growth, many will raise legitimate questions about the role of large employers in our society. With these concerns in mind, Business Roundtable is modernizing its principles on the role of a corporation. Since 1978, Business Roundtable has periodically issued Principles of Corporate Governance that include language on the purpose of a corporation. Each version of that document issued since 1997 has stated that corporations exist principally to serve their shareholders. It has become clear that this language on corporate purpose does not accurately describe the ways in which we and our fellow CEOs endeavor every day to create value for all our stakeholders, whose long-term interests are inseparable. We therefore provide the following Statement on the Purpose of a Corporation, which supersedes previous Business Roundtable statements and more accurately reflects our commitment to a free market economy that serves all Americans. This statement represents only one element of Business Roundtable’s work to ensure more inclusive prosperity, and we are continuing to challenge ourselves to do more. Just as we are committed to doing our part as corporate CEOs, we call on others to do their part as well. In particular, we urge leading investors to support companies that build long-term value by investing in their employees and communities. … And The Public’s Left Turn Chart II-16Help!
Help!
Help!
As our Geopolitical Strategy colleagues have argued since the 2016 primaries, the median voter in the US has been moving to the left as the financial crisis, the hollowing out of the middle class and the widening wealth gap have dimmed the luster of Reagan-Thatcher free-market policies.18 Globalization has squeezed unskilled labor everywhere in the developed world, and white-collar workers are starting to look over their shoulders at artificial intelligence programs that may render them obsolete as surely as voice mail and word processing decimated secretaries and typists. Banding together hasn’t sounded so good since the Depression, and nearly half of all workers polled in 2017 said they would join a union if they could (Chart II-16). Millennials are poised to become the single biggest voting bloc in the country. They were born between 1981 and 1996, and their lives have spanned two equity market crashes, the September 11th attacks, and the financial crisis, instilling them with a keen awareness of the way that remote events can upend the best-laid plans. Many of them emerged from college with sizable debt and dim earnings prospects. They would welcome more government involvement in the economy, and their enthusiastic embrace of Bernie Sanders and Elizabeth Warren (Chart II-17) indicates they’re on unions’ side. Chart II-17No 'Third Way' For Millennials
March 2020
March 2020
Elections Have (Considerable Regulatory) Consequences Electoral outcomes influence the division of the economic pie between employers and employees. Labor-friendly presidents, governors and legislatures are more likely to expand employee protections, while more vigilantly enforcing the employment laws and regulations that are already on the books. The White House appoints top leadership at the Labor Department, the National Labor Review Board (NLRB), and the Occupational Safety and Health Administration (OSHA), along with the attorney general, who dictates the effort devoted to anti-trust enforcement. The differences can be stark. Justice Scalia’s son would no more have led the Obama Department of Labor than Scott Pruitt (EPA), Wilbur Ross (Commerce) or Betsy Devos (Education) would have found employment anywhere in the Obama administration. McDonald’s has good reason to be happy with the outcome of the 2016 election; its business before the NLRB wound up being resolved much more favorably in 2019 than it would have been when it began in 2014 (Box II-3). At the state level, Wisconsin public employees suffered a previously unimaginable setback when Scott Walker won the 2010 gubernatorial election, along with sizable legislative majorities (Box II-4). BOX II-3 The Right Referee Makes All The Difference The Fight for $15 movement that began in 2012 aimed to nearly double the median fast-food worker’s wages. A raise of that magnitude would pose an existential threat to fast-food’s business model, and McDonald’s and its franchisees sought to stymie the movement’s momentum. The NLRB opened an investigation in 2014 following allegations that employees were fired for participating in organizing activities. McDonald’s vigorously contested the case in an effort to avoid the joint-employer designation that would open the door for franchise employees to bargain collectively with the parent company. (Absent a joint-employer ruling, a union would have to organize the McDonald’s work force one franchise at a time.) When the case was decided in McDonald’s favor in December, the headline and sub-header on the Bloomberg story reporting the outcome crystallized our elections-matter thesis: McDonald’s Gets Win Under Trump That Proved Elusive With Obama Board led by Trump appointees overrules judge in case that threatened business model BOX II-4 Wisconsin Guts Public-Sector Unions Soon after Wisconsin Governor Scott Walker took office in January 2011, backed by sizable Republican majorities in both houses of the legislature, he sent a bill to legislators that would cripple the state’s public-sector unions. Protestors swarmed Madison and filled the capitol building every day for a month to contest the bill, and Democratic legislators fled the state to forestall a vote, but it eventually passed nonetheless. The bill struck at a rare union success story; nearly one-third of public-sector employees are union members and that ratio has remained fairly steady over the last 40 years (Chart II-18). Wisconsin’s public-sector unions now do little more than advocate for their members in disciplinary and grievance proceedings, and overall union membership in the state has fallen by a whopping 43% since the end of 2009. Judicial appointments make a difference, too. The Supreme Court’s Janus decision in April 2018, banning any requirement that public employees pay dues to the unions that bargain for them on not-so-readily-apparent First Amendment grounds,19 was widely viewed as a body blow to public-sector unions. The 5-4 decision would certainly have gone the other way had President Obama’s nominee to succeed the late Justice Scalia been confirmed by the Senate. Chart II-18Public-Sector Union Membership Has Held Up Well
Public-Sector Union Membership Has Held Up Well
Public-Sector Union Membership Has Held Up Well
Final Takeaways We do not anticipate that organized labor will regain the position it enjoyed in the fifties and sixties, when global competition was weak and shareholders and consumers were anything but vigilant about corporate operations. Even a more modest flexing of labor muscle that pushes wages higher across the entire economy has a probability of less than one half. Investors seem to think the probability is negligible, though, and therein lies an opportunity. Elected officials deliver what their constituents want, as do the courts, albeit with a longer lag. Society’s view of striking/strikebreaking tactics heavily influences how they’re deployed and whether or not they’ll be successful. We believe that public opinion is beginning to coalesce on employees’ side as labor puts on a more appealing face; as businesses increasingly fret about inequality’s consequences; and as millennials swoon over progressives, undeterred by labels that would have left their Cold War ancestors reaching for weapons. The median voter theory has importance beyond predicting future outcomes; it directly influences them. As the center of the electorate leans to the left, elected officials will have to deliver more liberal outcomes if they want to keep their jobs. If the electorate has given up on Reagan-Thatcher principles, organized labor is bound to get a break from the four-decade onslaught that has left it shrunken and feeble. There is one overriding market takeaway from our view that a labor recovery is more likely than investors realize: long-run inflation expectations are way too low. Although we do not expect wage growth to rise enough this year to give rise to sustainable upward inflation pressures that force the Fed to come off of the sidelines, we do think investors are overly complacent about inflation. We continue to advocate for below-benchmark duration positioning over a cyclical timeframe and for owning TIPS in place of longer-maturity Treasury bonds over all timeframes. Watch the election, as it may reveal that labor’s demise has been greatly exaggerated. Doug Peta, CFA Chief US Investment Strategist Bibliography Aamidor, Abe and Evanoff, Ted. At The Crossroads: Middle America and the Battle to Save the Car Industry. Toronto: ECW Press (2010). Allegretto, S.A.; Doussard, M.; Graham-Squire, D.; Jacobs, K.; Thompson, D.; and Thompson, J. Fast Food, Poverty Wages: The Public Cost of Low-Wage Jobs in the Fast-Food Industry. Berkeley, CA. UC-Berkeley Center for Labor Research and Education, October 2013. Bernstein, Irving. The Lean Years: A History of the American Worker, 1920-1933. Boston: Houghton Mifflin (1960). Blanc, Eric. Red State Revolt: The Teachers’ Strike Wave and Working-Class Politics. Brooklyn, NY: Verso (2019). Emma, Caitlin. “Teachers Are Going on Strike in Trump’s America.” Politico, April 12, 2018, accessed January 20, 2020. Finnegan, William. “Dignity: Fast-Food Workers and a New Form of Labor Activism.” The New Yorker, September 15, 2014 Greenhouse, Steven. Beaten Down, Worked Up: The Past, Present and Future of American Labor. New York: Alfred A. Knopf (2019). Greenhouse, Steven. “The Return of the Strike.” The American Prospect, Winter 2019 Ingrassia, Paul. Crash Course: The American Auto Industry’s Road from Glory to Disaster. New York: Random House (2010). King, Gilbert. “How the Ford Motor Company Won a Battle and Lost Ground.” smithsonianmag.com, April 30, 2013, accessed January 24, 2020. Loomis, Erik. A History of America in Ten Strikes. New York: The New Press (2018). Manchester, William. The Glory and the Dream: A Narrative History of America, 1932-1972. New York: Bantam (1974). Norwood, Stephen H. “The Student As Strikebreaker: College Youth and the Crisis of Masculinity in the Early Twentieth Century. Journal of Social History Winter 1994: pp. 331-49. Sears, Stephen W. “Shut the Goddam Plant!” American Heritage Volume 33, Issue 3 (April/May 1982) Serrin, William. “Industries, in Shift, Aren’t Letting Strikes Stop Them.” The New York Times, September 30, 1986 Wolff, Leon. “Battle at Homestead.” American Heritage Volume 16, Issue 3 (April 1965) *Current newspaper and Bloomberg articles omitted. III. Indicators And Reference Charts Last month, we warned that the S&P 500 rally looked increasingly vulnerable from a tactical perspective and that the spread of Covid-19 was likely to be the catalyst of a pullback that could cause the S&P 500 to retest its October 2019 breakout. Since then, the S&P 500 has corrected significantly. As long as new cases of Covid-19 continue to grow quickly outside of China, the S&P 500 can suffer additional downside. Limited inflationary pressures, accommodative global central banks, and the potential for a large policy easing in China suggest that stocks have significant upside once Covid-19 becomes better contained. Nonetheless, despite the positive signals from our Willingness-To-Pay measure or our Monetary and Composite Technical Indicators, we recommend a cautious tactical stance on equities. Our BCA Composite Valuation index is not depressed enough to warrant closing our eyes when the risk of a recession caused by a global pandemic remains as high as it is today. Either valuations will have to cheapen further or Covid-19 will have to be clearly contained before we buy stocks without strong fears. 10-year Treasurys yields remain extremely expensive. However, our Composite Technical Indicator suggests that in such an uncertain climate, yields can fall a little more. Nonetheless, Treasurys seem like an asset that has nearly fully priced in the full impact of Covid-19, and thus, any downside in yield will be very limited. The rising risk premia linked to the coronavirus is also helping the dollar right now, but as we have highlighted before, many signs show that global growth was in the process of bottoming before the outbreak took hold. As a result, we anticipate that the dollar could suffer plentiful downside if Covid-19 passes soon. Moreover, the rising probability that Senator Bernie Sanders wins the Democratic nomination could hurt the greenback over the remainder of the year. Finally, commodity prices have corrected meaningfully in response to the stronger dollar and the growth fears created by the spread of Covid-19. However, they have not pullback below the levels where they traded when they broke out in late 2019. Moreover, the advanced/decline line of the Continuous Commodity Index remains at an elevated level, indicating underlying strength in the commodity complex. Natural resources prices will likely become the key beneficiaries of both the eventual pullback in virus-related fears and the weaker dollar. EQUITIES: Chart III-1US Equity Indicators
March 2020
March 2020
Chart III-2Willingness To Pay For Risk
March 2020
March 2020
Chart III-3US Equity Sentiment Indicators
March 2020
March 2020
Chart III-4Revealed Preference Indicator
March 2020
March 2020
Chart III-5US Stock Market Valuation
March 2020
March 2020
Chart III-6US Earnings
March 2020
March 2020
Chart III-7Global Stock Market And Earnings: Relative Performance
March 2020
March 2020
Chart III-8Global Stock Market And Earnings: Relative Performance
March 2020
March 2020
FIXED INCOME: Chart III-9US Treasurys And Valuations
March 2020
March 2020
Chart III-10Yield Curve Slopes
March 2020
March 2020
Chart III-11Selected US Bond Yields
March 2020
March 2020
Chart III-1210-Year Treasury Yield Components
March 2020
March 2020
Chart III-13US Corporate Bonds And Health Monitor
March 2020
March 2020
Chart III-14Global Bonds: Developed Markets
March 2020
March 2020
Chart III-15Global Bonds: Emerging Markets
March 2020
March 2020
CURRENCIES: Chart III-16US Dollar And PPP
March 2020
March 2020
Chart III-17US Dollar And Indicator
March 2020
March 2020
Chart III-18US Dollar Fundamentals
March 2020
March 2020
Chart III-19Japanese Yen Technicals
March 2020
March 2020
Chart III-20Euro Technicals
March 2020
March 2020
Chart III-21Euro/Yen Technicals
March 2020
March 2020
Chart III-22Euro/Pound Technicals
March 2020
March 2020
COMMODITIES: Chart III-23Broad Commodity Indicators
March 2020
March 2020
Chart III-24Commodity Prices
March 2020
March 2020
Chart III-25Commodity Prices
March 2020
March 2020
Chart III-26Commodity Sentiment
March 2020
March 2020
Chart III-27Speculative Positioning
March 2020
March 2020
ECONOMY: Chart III-28US And Global Macro Backdrop
March 2020
March 2020
Chart III-29US Macro Snapshot
March 2020
March 2020
Chart III-30US Growth Outlook
March 2020
March 2020
Chart III-31US Cyclical Spending
March 2020
March 2020
Chart III-32US Labor Market
March 2020
March 2020
Chart III-33US Consumption
March 2020
March 2020
Chart III-34US Housing
March 2020
March 2020
Chart III-35US Debt And Deleveraging
March 2020
March 2020
Chart III-36US Financial Conditions
March 2020
March 2020
Chart III-37Global Economic Snapshot: Europe
March 2020
March 2020
Chart III-38Global Economic Snapshot: China
March 2020
March 2020
Mathieu Savary Vice President The Bank Credit Analyst Footnotes 1 Non-seasonally adjusted growth is always negative in Q1, due to the impact of the Chinese Lunar New Year Celebration. This is why we emphasize the seasonal adjustment. 2 Please see Global Investment Strategy Weekly Report "Markets Too Complacent About The Coronavirus," dated February 21, 2020, available at gis.bcaresearch.com 3 Please see The Bank Credit Analyst "February 2020," dated January 30, 2020 available at bca.bcaresearch.com 4 Blanc, Eric. Red State Revolt: The Teachers’ Strike Wave and Working-Class Politics, Verso: New York (2019), p. 204. 5 Ibid, p. 209. 6 We will discuss public opinion, and its impact on elected officials and courts, in Part 3. 7 Please see the January 13, 2020 US Investment Strategy Special Report, “Labor Strikes Back, Part 1: An Investor’s Guide To US Labor History,” available at www.bcaresearch.com. 8 A monopsony is a market with a single buyer, akin to a monopoly, which is a market with only one seller. 9 Please see the July 2019 Bank Credit Analyst Special Report, “ The Productivity Puzzle: Competition Is The Missing Ingredient,” available at bcaresearch.com. 10 Students were excused from classes and exams and sometimes even received academic credit for their work. 11 King, Gilbert, “How The Ford Motor Company Won a Battle and Lost Ground,” Smithsonian.com, April 30, 2013. 12 Greenhouse, Steven, Beaten Down, Worked Up, Alfred A. Knopf: New York (2019), pp. 137-8. 13 High unemployment, in addition to declining respect for unions, helped erase the stigma of crossing picket lines. 14 Serrin, William, “Industries, in Shift, Aren’t Letting Strikes Stop Them,” New York Times, September 30, 1986, p. A18. 15 Emma, Caitlin, “Teachers Are Going on Strike in Trump’s America,” Politico, April 12, 2018. 16 Greenhouse, p. 44. 17 Please see the January 20, 2020 US Investment Strategy Special Report, “Labor Strikes Back, Part 2: Where Strikes Come From And Who Wins Them,” available at usis.bcaresearch.com. 18 Please see the June 8, 2016 Geopolitical Strategy Monthly Report, “Introducing The Median Voter Theory,” available at gps.bcaresearch.com. 19 The Court found for the plaintiff in Janus, who bridled at the closed-shop law that forced him to join the union that bargained on his and his colleagues’ behalf, because the union’s espousal of views with which he disagreed constituted a violation of his free-speech rights as guaranteed by the First Amendment.
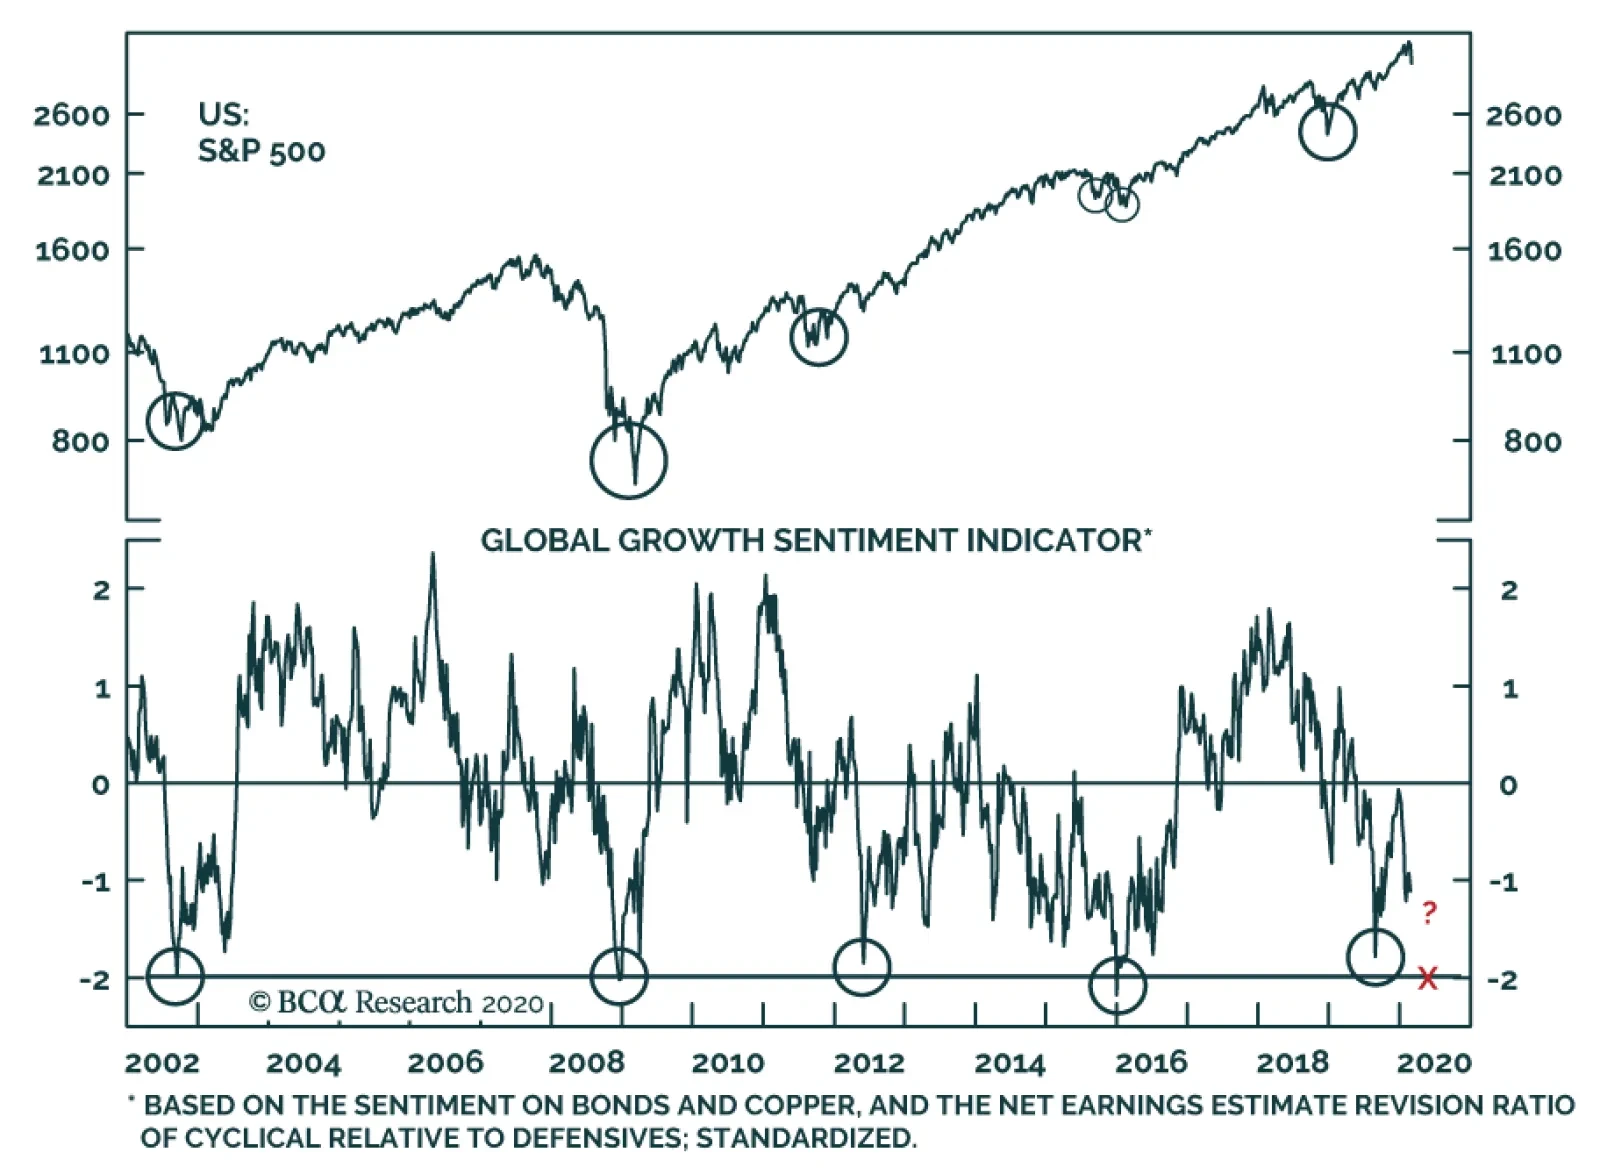
BCA Research’s Global Growth Sentiment Indicator tries to capture how pessimistic or optimistic are investors’ expectations of global growth. It includes sentiment on copper and bonds as well as the earnings revision ratio for cyclical relative to defensive…
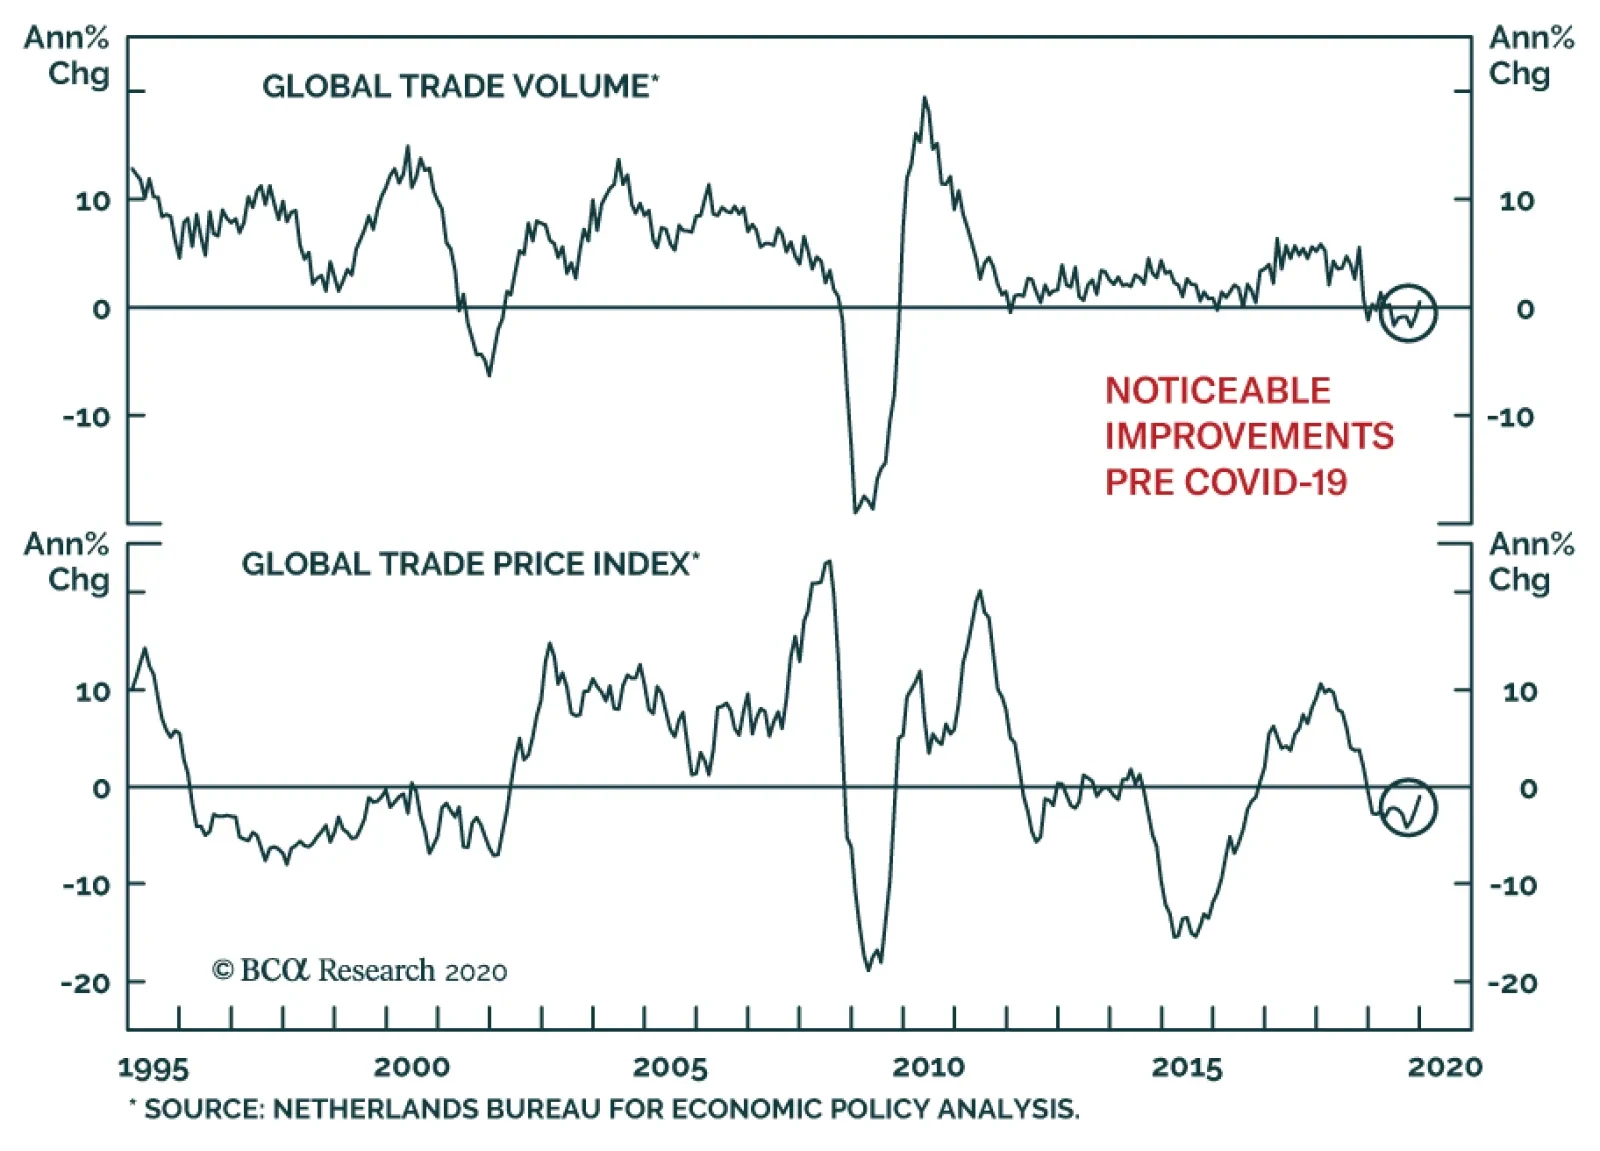
According to the Netherlands Bureau of Economic Policy Analysis World Trade monitor, global export volumes increased by 0.5% on an annual basis this December. This indicates that before the disturbance linked to Covid-19, the global manufacturing sector had…
Highlights Dear Client, This week, we had originally planned to publish a Special Report introducing a framework for modeling and selecting global yield curve trades. In light of the market turbulence of the past few days, however, we felt the need to provide a short note updating our current thoughts on the expanding threats to the global economy and financial markets from the coronavirus (a.k.a. 2019-nCoV, COVID-19). Thus, this week, you will be receiving two reports from BCA Research Global Fixed Income Strategy. Kind regards, Robert Robis Feature The news of more occurrences of the COVID-19 virus in countries outside China – South Korea, Italy, Iran, and Israel – has created a new wave of fear among investors who had started to see signs that the spread of the virus was losing some momentum in China. The appearance of COVID-19 infections in countries like Italy, where there was no obvious connection to the epicenter in China, raised new concerns that the outbreak could turn into a true global pandemic that would be a major negative shock to global growth. The latest market moves fit the profile of a major risk-off move driven by higher uncertainty. Global equities have sold off sharply over the past two trading sessions, and volatility measures like the VIX have spiked. The 10-year US Treasury yield reached a new all-time low (on an intraday basis) of 1.35% yesterday, leaving it -18bps below the 3-month US Treasury bill rate. That curve inversion has occurred alongside falling TIPS breakevens and rising expectations of Fed rate cuts in 2020, in a familiar parallel to the “tariff war shock” of 2019 that prompted the Fed to lower the funds rate by a cumulative 75bps. We see some similarities today to a more recent “black swan” event: the June 2016 UK Brexit vote, which was when the previous intraday all-time low in US Treasury yields was reached. Yield movements have been somewhat smaller in other countries where yields were already very low to begin with, like the 10-year German bund reaching -0.49% and 10-year UK Gilt hitting 0.54% yesterday. Global credit markets have also underperformed, with corporate bond spreads widening alongside spiking equity market volatility in the US and Europe. Amidst the fear, investors have been searching for a potential roadmap to follow, for economies and financial markets, based on past viral outbreaks like the 2003 SARS epidemic and the 2009 global swine flu (H1N1) pandemic. We see some similarities today to a more recent “black swan” event: the June 2016 UK Brexit vote, which was when the previous intraday all-time low for US Treasury yields was reached. After that stunning electoral outcome, investors worldwide tried to process the potential negative implications of an unexpected political outcome. Risk assets sold off and government bonds rallied sharply. Global policymakers responded with various easing measures, both direct (rate cuts and fresh QE from the Bank of England) and indirect (delayed Fed rate hikes, more QE from the ECB). This all came at a time when global growth momentum was already picking up before the Brexit vote, stoked by large-scale fiscal and monetary stimulus in China (Chart 1). In the end, the supportive monetary/fiscal backdrop, and not the political uncertainty, won out and the global economy – along with risk assets and bond yields – all recovered over the second half of 2016. Chart 1Doomsday? Or 2016 Revisited?
The Pandemic Panic
The Pandemic Panic
Today, policymakers are starting to mobilize to fight the threat to growth from COVID-19, hinting at potential monetary easing measures. China is already set to deliver more monetary and fiscal easing, although it is not clear if those will be on the same massive scale as 2015/16. While the scale of the shock to global growth from a potential pandemic is obviously far different than the political uncertainty of Brexit, stimulus measures in 2020 could generate a similar positive response from financial markets if the coronavirus impacts growth less than currently feared. So what should investors expect next? We admit that we do not have a strong conviction level on near-term market moves, given how the coronavirus outbreak has set off an unpredictable chain of events that has gone against our base case expectation of a global growth rebound in 2020. Yet amidst all the uncertainty and fear, we can hazard a few guesses as to the potential future moves in global bond markets. For riskier borrowers, the ability to service debt is what matters most, and the majority of borrowers can still meet their interest payments with global borrowing costs near all-time lows. DURATION: A lot of bad news is discounted in current global bond yield levels, both in terms of absolute levels and expected rate cuts. Yet until there are signs of the virus being contained, both within and outside China, investors will continue to seek out hedges for the uncertainty. That means the any challenge to the current downward momentum in yields may not become evident until the economic data releases begin to show signs of a Q2 recovery from what is assuredly going to be an awful Q1 for the global economy. YIELD CURVE: A continuation of the risk-off momentum in global equity markets will put additional bull-flattening pressure on developed market government bond yield curves in the near term. The more medium-term move, however, should be towards steeper yield curves. Either the viral outbreak becomes contained and/or the growth shock is minimized, triggering a reversal of the latest risk-off bull flattening into risk-on bear-steepening; or the economic downturn and risk asset selloff intensifies and central banks deliver rate cuts that will bull-steepen global yield curves. CREDIT: Global corporate bond spreads should remain under upward pressure in the near term until the spread of the coronavirus outbreak begins to ease. However, the cumulative spread widening in credit markets could turn out to be surprisingly modest. The conditions that are typically in place before credit bear markets and periods of sustained spread widening – tight monetary policy and rapidly deteriorating corporate financial health – are not currently in place. This is true in both the US and Europe for high-yield, where our bottom-up Corporate Health Monitors are still sending a neutral message – thanks largely to interest coverage ratios that are still above typical pre-recessionary levels (Chart 2). For riskier borrowers, the ability to service debt is what matters most, and the majority of borrowers can still meet their interest payments with global borrowing costs near all-time lows - even in the event of a sharp, but short, global economic slowdown. Chart 2Low Yields Supporting High-Yield Borrowers
The Pandemic Panic
The Pandemic Panic
Robert Robis, CFA Chief Fixed Income Strategist rrobis@bcaresearch.com
Hunker Down
Hunker Down
Overweight Global bourses broke down yesterday, succumbing to immense pressure from the coronavirus epidemic gripping South Korea, Italy and Iran. Finally, lower profit growth expectations are weighing on extreme equity market optimism. We remain cautious on the prospects of the broad US equity market and reiterate our January 13 boost to overweight in the global gold mining index versus the MSCI All Country World Index. This portfolio position is already up 16% since the mid-January inception and more gains are in store on the back of the collapse in interest rates and increasing likelihood of fed funds rate cuts. Importantly, in order to gauge the relative attractiveness of this portfolio position at the current juncture, it is instructive to juxtapose global versus US policy uncertainty. Historically, this ratio has been closely correlated with relative share prices and signals that the path of least resistance is higher for gold miners compared with the broad market. Shinning global gold miners are impressive especially given the recent spike in the greenback. As a reminder, the US dollar also flexes its muscles when global uncertainty trumps US uncertainty (bottom panel). Finally, the recent hook up in US economic surprises versus the rest of the world also underpins relative share prices (middle panel). Bottom Line: Stay overweight the global gold mining index via the long GDX:US / short ACWI:US exchange traded funds. From a risk management perspective and in order to protect profits we are setting a trailing stop at the 10% return mark, since inception.