Global
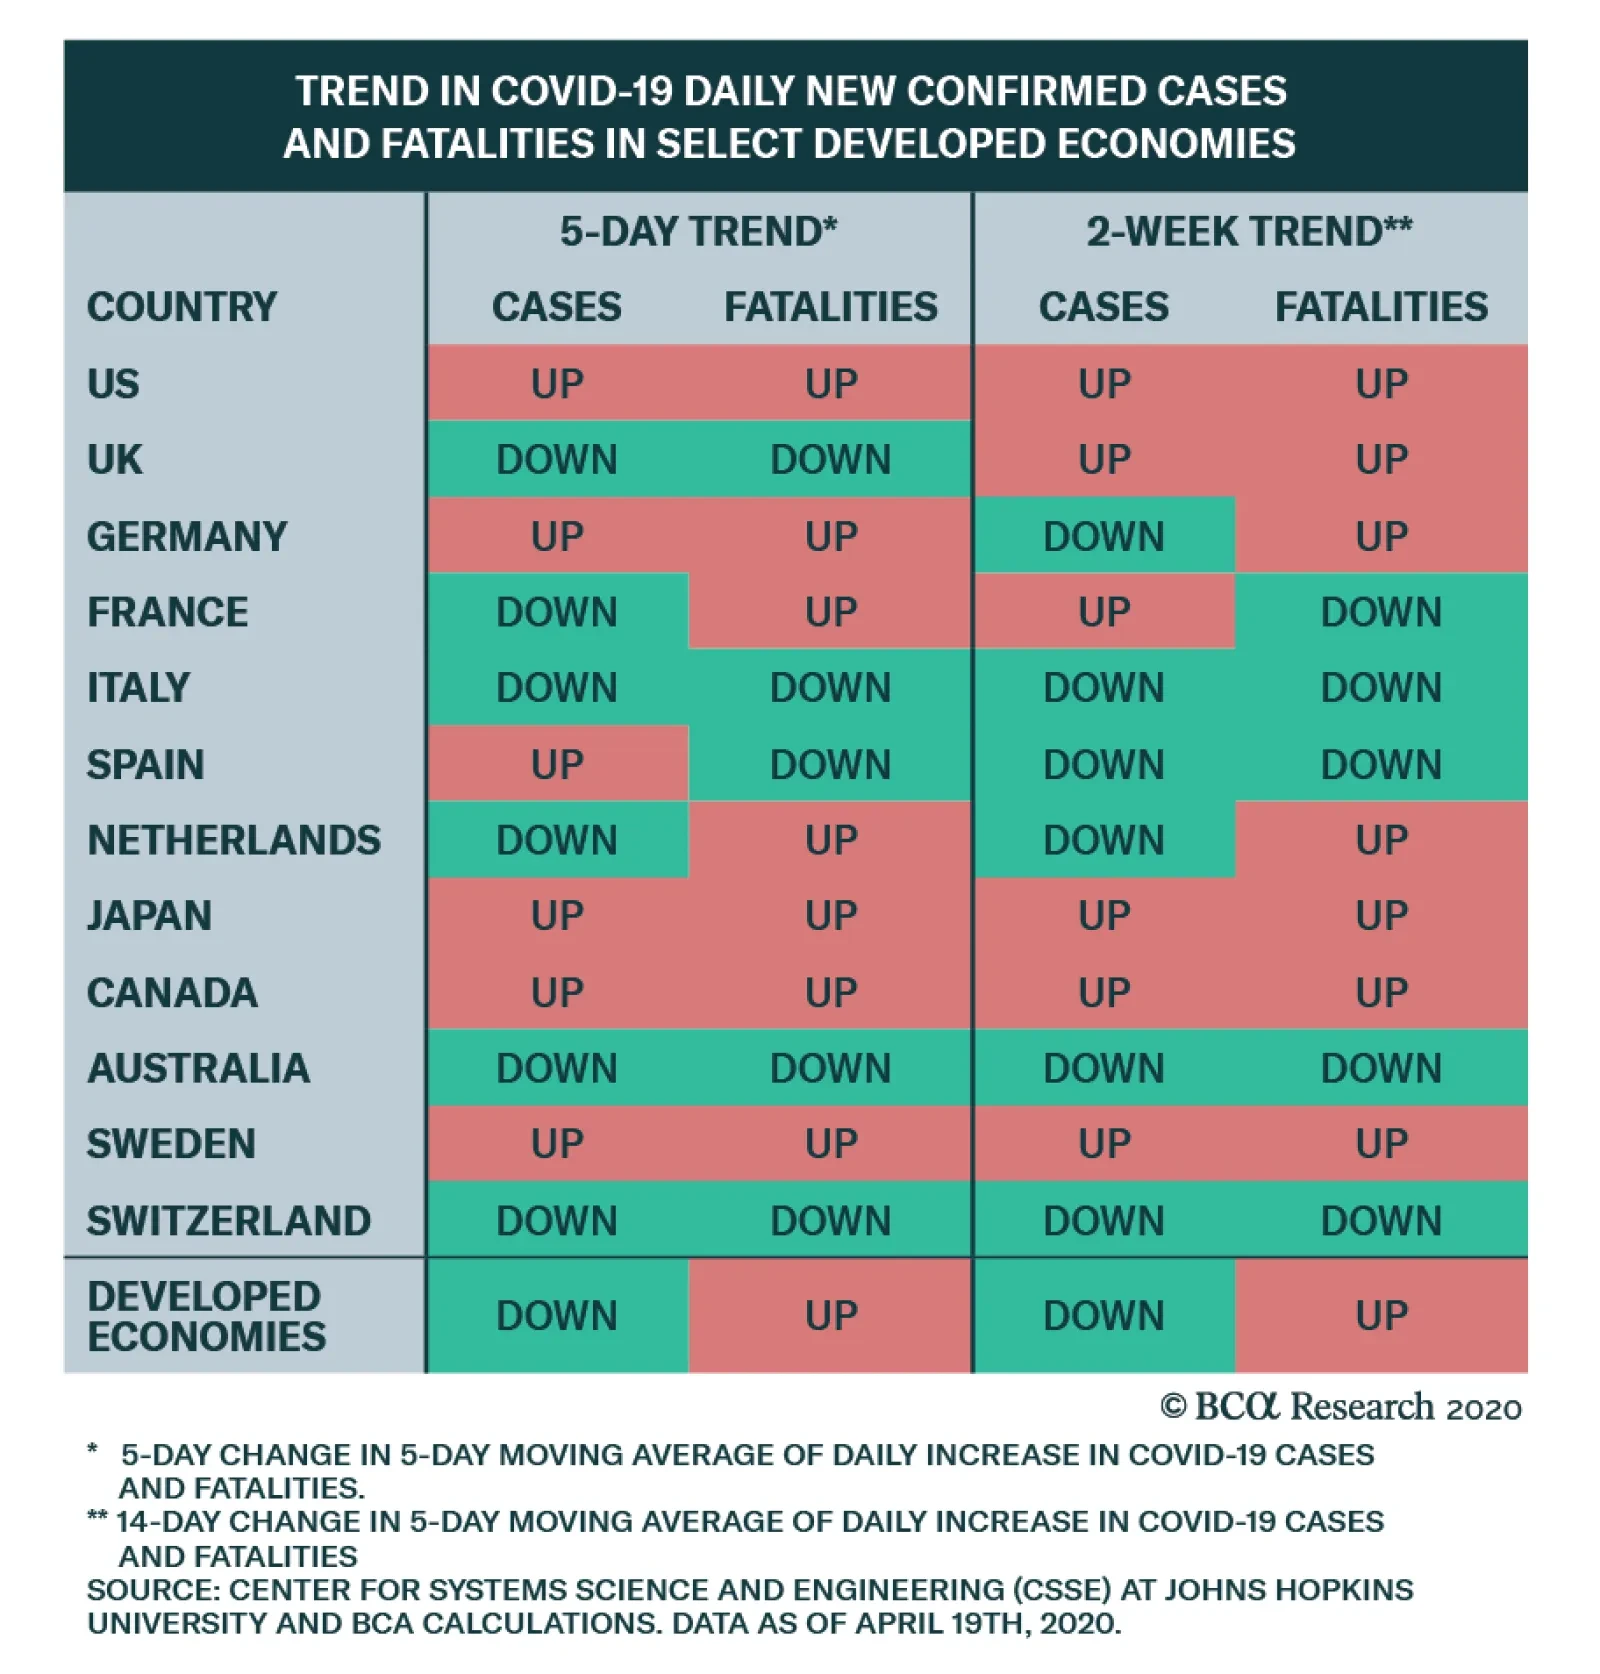
The global economy continues to be held hostage by the COVID-19 pandemic. Economic activity has plunged in countries around the world, owing to the severe containment measures enacted by policymakers to slow the spread of the disease.
…

WTI crude oil delivered to Cushing in May 2020 is trading below $0.00/bbl as this note is typed, and falling fast (Chart 1). This is an historical print. WTI for June delivery is trading at ~ $22.00/bbl. What we are observing is the last of the May 2020 futures longs getting out of their positions before the contract goes off the board tomorrow. People tend to forget that the so-called WTI "paper" market – i.e., futures – is actually a market in which contracts for physical delivery at Cushing, OK, actually change hands. If you are left long when the contract for May delivery stop trading – tomorrow at the close of business – you will have to stand for physical delivery. If you are short, you must deliver physical barrels. These are binding, legal contracts. Chart 1Crude Oil In Extremis
Crude Oil In Extremis
Crude Oil In Extremis
Liquidity is extremely low, as most everyone with any exposure in May 2020 WTI is out of their position. Storage is scarce. Anyone with storage can name their price – literally – as most of the storage in Cushing obviously is close to being full. Refiners are drastically reducing runs, and refined products are sitting in storage, as the US remains in shut-down. What we are observing is the physical market pricing a near-complete lack of storage in Cushing. Physical-market participants also are aware there’s 12mm barrels of crude from Saudi Arabia arriving in the US Gulf, following KSA’s chartering of 19 very large crude carriers (VLCCs) in March, six of which are bound for the US Gulf. There is no place to store the crude that’s going to be arriving in the Gulf and that’s backed up in Cushing. This situation should begin to reverse on May 1, as the COVID-19 demand destruction levels off and the global economy starts to return to normal. On the supply side, the OPEC 2.0 producers begin cutting production next month, and highly levered unhedged producers will be forced to shut in production and file for bankruptcy. The lower prices go in the short term – and the more damage this causes on the production side – the sharper the recovery later this year. Robert P. Ryan Chief Commodity & Energy Strategist rryan@bcaresearch.com
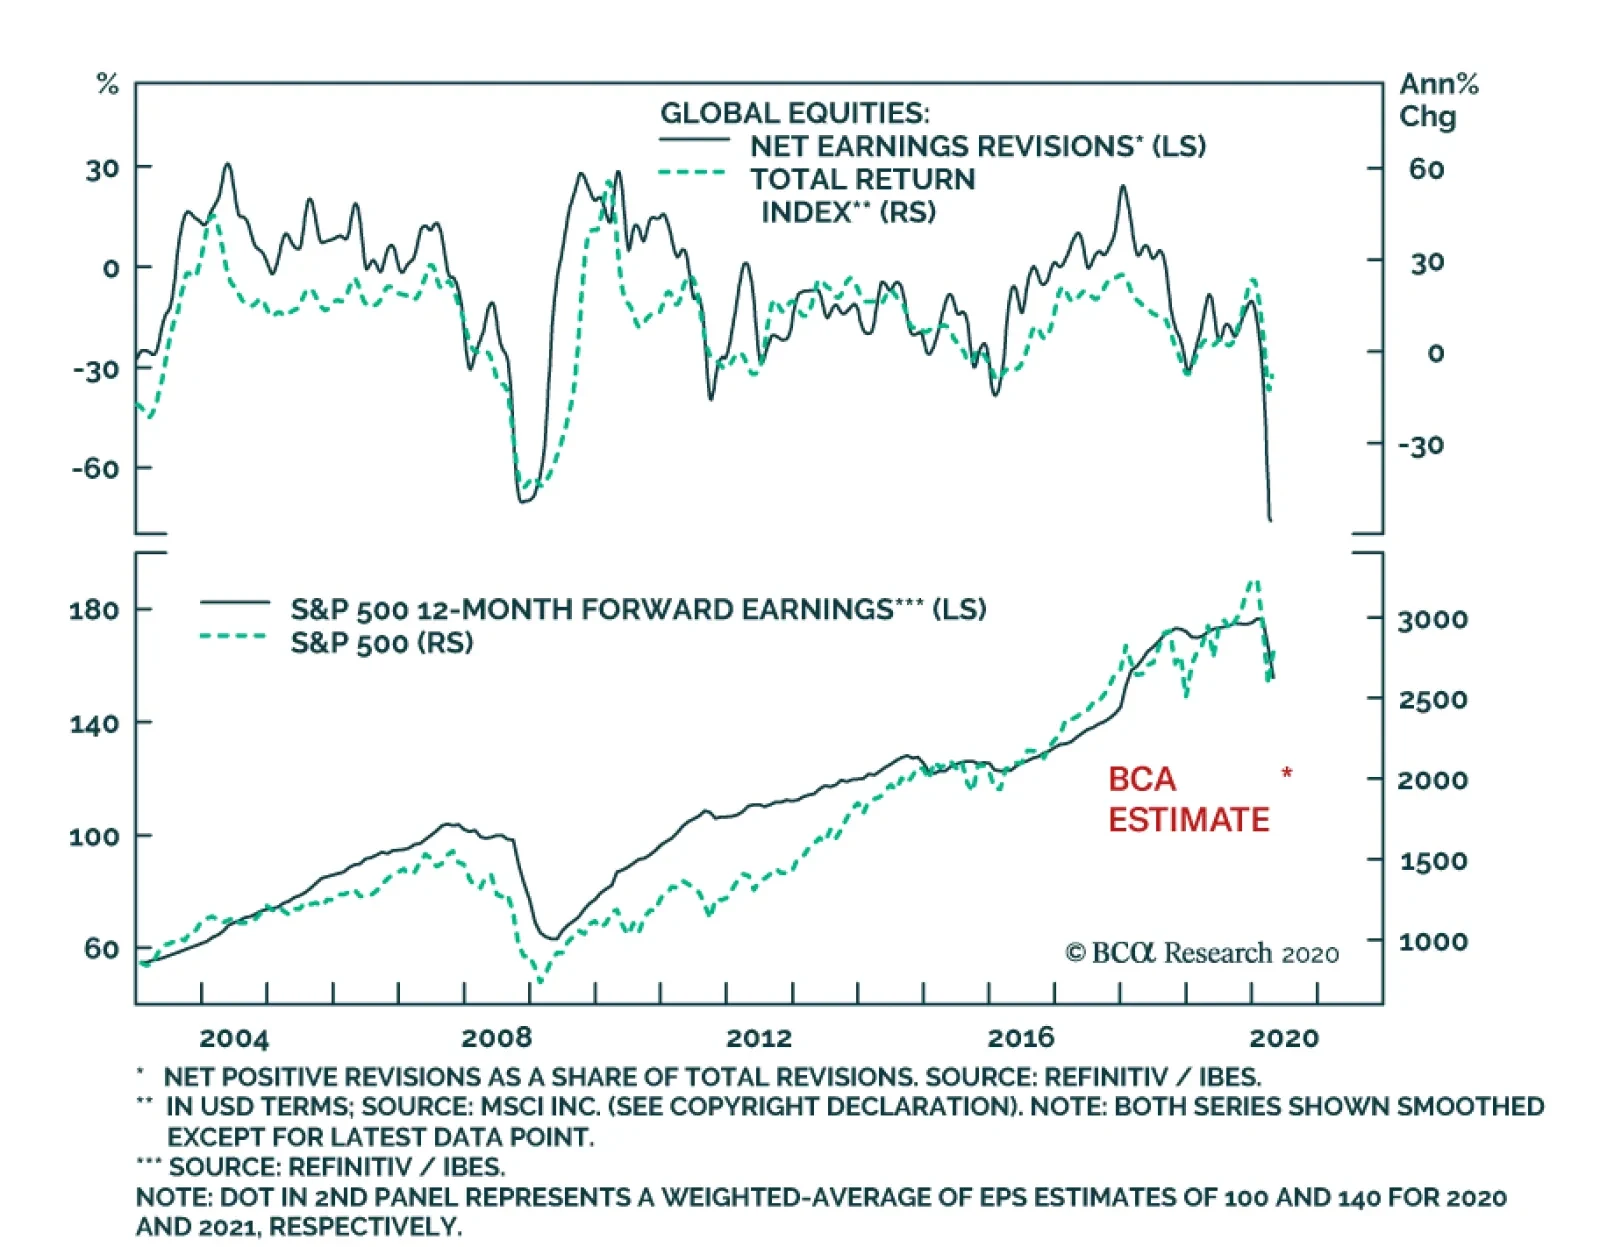
Last Friday, BCA Research's Global Investment Strategy service continued to recommend that investors favor global equities over bonds on a 12-month horizon, despite some near-term risks. Growth is likely to recover in the latter half of 2020 as COVID-19…
Highlights With interest rates near zero around the world, balance sheet policy will become an important driver for currencies. Should the global economy need another dose of monetary stimulus, yield curve control (YCC) and direct financing of governments will increasingly be the policy tool of choice. This will lead to more bloated central bank balance sheets. The dollar will initially rally, as it did in 2008, since the conditions needed for even more central bank stimulus is a deeper than perceived contraction in global growth. Once the dust settles, the global economy will be awash with liquidity, which will light a fire under procyclical currencies, akin to 2009. An important barometer will be the velocity of money. We continue to recommend a barbell strategy for now – a basket of the cheapest currencies together with some save havens. Shorting EUR/JPY is a good insurance policy. Feature Quantitative easing affects the economy and currency markets through three major channels: By lowering interbank spreads and boosting commercial bank excess reserves, the credit channel is widened. Purchases of securities along the yield curve also lowers long-term borrowing costs for economic agents. Central bank purchases of government securities crowds out private concerns. As these funds are redirected out the risk curve, this loosens financial conditions. This is the portfolio balance effect. Part of the flows from portfolio rebalancing leave the country, especially if interest rates are too low for bond investors. This lowers the exchange rate, boosting imported inflation, which further lowers domestic real rates. During isolated crises, the QE exchange rate channel works like a charm. Chart I-1 shows that for most of the post-2008 period when the euro area was engulfed in a crisis, the EUR/USD exchange rate oscillated with the relative balance sheet impulse1 between the Federal Reserve and the European Central Bank. The story in Japan was similar after the Fukushima crisis in 2011 and the subsequent adoption of Abenomics. In short, the more aggressive a central bank is with quantitative easing, the bigger the impact on currency markets. Chart I-1QE And EUR/USD
QE And EUR/USD
QE And EUR/USD
The dollar seems to be following this narrative. Ever since hitting a March 19 high near 103, the DXY index has been in a broad-based consolidation phase, currently trading around 100. Swap lines are running full throttle as foreign central banks have tapped into the Fed’s liquidity provisions (Chart I-2). Despite this, our contention is that the dollar could still retest its recent highs before ultimately cresting. Chart I-2Improving Liquidity
Improving Liquidity
Improving Liquidity
When V Is Collapsing Everywhere Currencies move on relative fundamentals. So, if one country is in a crisis and precipitously drops interest rates, then its currency should collapse relative to its trading partners. However, when interest rates are collectively plummeting around the world, they lose their relative anchor for currencies. In such times, correlations shift to 1, volatility spikes and valuations are thrown out the window (Chart I-3). As a reserve currency, the dollar benefits. When interest rates are collectively plummeting around the world, they lose their relative anchor for currencies. Many countries have announced QE in one form or another, and their balance sheets are set to explode higher, led by the Fed (Chart I-4). But akin to 2008, the dollar can still tick higher as markets remain in the belly of a liquidity trap. In these situations, technical indicators can help. But more often than not, it is usually instructive to sit back and gauge the signal from the velocity of money (or V), especially after interest rates have collapsed to zero. Chart I-3Life At Zero
Life At Zero
Life At Zero
Chart I-4The QE Club
The QE Club
The QE Club
V can be summarized by Irving Fisher’s classical equation MV=PQ, where P is the price level in the economy, Q is output, and M is the money supply. In other words, V=PQ/M. A few observations are clear from the equation: If output or PQ is collapsing, then the only way the authorities can stabilize demand is by driving up the money supply. It is an open debate as to whether V is stable or not. Over the last decade or so, V has been collapsing (Chart I-5). Meanwhile, the fact there has been no correlation between prices and money supply suggests that V may have a life of its own. Finally, as the collapse in V accelerates, there is a window in which policymakers can be behind the curve. In this window, zero rates and QE could still be insufficient to stem the decline in output. Chart I-5A Collapse Of V Everywhere
A Collapse Of V Everywhere
A Collapse Of V Everywhere
It becomes clear that observing V can provide valuable information for the economy and currency markets. A rising V means that central bank liquidity injections are being turned over into real economic activity, either through rising prices, output or a combination of the two. In a sense, a turnaround in V is a signal that the precautionary demand for money is falling. This is usually synonymous with higher interest rates. Chart I-6Watch The Yield Curve
Watch The Yield Curve
Watch The Yield Curve
In a general sense, V can be viewed as the interest rate required by the underlying economy (the neutral rate), since it is measured using economic variables. Once economic agents start to increase the turnover of money in the system as activity improves, it is an endogenous sign that the economy has escaped a liquidity trap and can handle higher rates. Over the longer term, exchange rates should fluctuate along with the ebb and flow of V, or the relative neutral rate of interest between two countries. Herein lies the problem. The velocity of money is observed ex-post, meaning it is not very useful as a forecasting tool. We already know from the drop in interest rates that the velocity of money is collapsing everywhere. Therefore, how can one gauge for tentative signs of a reversal? One method is to look at financial variables. The yield curve is one example. Whenever the fed funds target rate falls below the neutral rate of interest in the US, the yield curve usually steepens (Chart I-6). A steepening yield curve usually signifies borrowing costs are well below the structural growth rate of the economy. As such, banks do well in this environment. Another barometer, and our favorite, is the ratio of industrial commodities to financial ones, or more precisely, the gold-to-silver ratio. A steepening yield curve usually signifies borrowing costs are well below the structural growth rate of the economy. Bottom Line: With interest rates near zero in the developed world, proxies for the velocity of money become important in gauging when we exit the belly of the liquidity trap. Gold Versus Silver Chart I-7Watch The Gold/Silver Ratio
Watch The Gold/Silver Ratio
Watch The Gold/Silver Ratio
The gold/silver ratio (GSR) provides important information on the battleground between easing financial conditions and a pick-up in economic (or manufacturing) activity. The GSR tends to rally ahead of an economic slowdown, but then peaks when growth is still weak but financial conditions are easy enough to lift the economy out of a liquidity trap. Of course, a key assumption is that the global economy fends off a deeper recession, which would otherwise sustain a high and rising GSR. Just like gold, silver benefits from low interest rates, plentiful liquidity, and the incentive for fiat money debasement. However, today, silver has much more industrial uses than gold, allowing it to sniff out any shift in the economic landscape. Silver fabrication demand benefits from new industries such as solar and a flourishing “cloud” orbit that are capturing the new manufacturing landscape. As a result, the dollar tends to be positively correlated with the gold/silver ratio (Chart I-7). The gold/silver ratio has been a good confirming indicator on when to rebuy procyclical currencies. The gold/silver ratio (GSR) broke above major overhead resistance at 100 just as the dollar liquidity crunch was intensifying and is now showing tentative signs of a reversal. The history of these reversals is that they tend to be powerful but extremely volatile. More importantly, the ratio has been a good confirming indicator on when to rebuy procyclical currencies (Chart I-8). Given that the ratio is close to its highest level in 120 years, the odds are that the forces of mean reversion will continue to push it lower. A break in the ratio below 100 will be a positive development (Chart I-9). Chart I-8Tentative Signs Of Improvement
Tentative Signs Of Improvement
Tentative Signs Of Improvement
Chart I-9Watch The 100 Level
Watch The 100 Level
Watch The 100 Level
The ratio of the velocity of money between the US and China has tended to track both the gold/silver ratio and the dollar closely. Given the epicenter of the crisis was China, a falling GSR will also signify Beijing has been successful in rekindling animal spirits, as the economy reopens for business. Bottom Line: A falling GSR will be consistent with a peak in the dollar and upside for pro-cyclical currencies. Housekeeping We continue to recommend a barbell strategy for now – a basket of the cheapest currencies together with some save havens. Investors can seek such protection by selling EUR/JPY. EUR/JPY should continue to sell off in the short term. First, the yen tends to do well when volatility is high, as is the case now. Second, given that Japan is closer to the Asean economies who were first hit with Covid-19, it will probably see activity recover a little faster relative to the West. In addition, real rates are higher in Japan relative to Europe. Lastly, consistent with our thesis above, place a sell-stop on GSR at 100. Chester Ntonifor Foreign Exchange Strategist chestern@bcaresearch.com Footnotes 1 Given that GDP is a flow concept, and central bank balance sheets are a stock concept, the impulse is calculated as follows: 1) Take the 12-month change in the balance sheet, to convert it to a flow. 2) Show the 12-month change of this flow as a % of GDP to gauge the impulse of stimulus. Currencies U.S. Dollar Chart II-1USD Technicals 1
USD Technicals 1
USD Technicals 1
Chart II-2USD Technicals 2
USD Technicals 2
USD Technicals 2
Recent data in the US have been negative: Headline inflation fell sharply from 2.3% to 1.5% year-on-year in March. Core inflation dropped by 0.3% to 2.1%. Export and import prices both contracted by 3.6% and 4.1% year-on-year, respectively in March. NY Empire State manufacturing index plunged from -21.5 to -78.2 in April. Retail sales slumped by 8.7% month-on-month in March, down from -0.4% the previous month. Initial jobless claims increased by 5,245K last week, above the expectations of 5,105K. The DXY index increased by 0.3% this week on the back of safe-haven demand. The break above the psychological overhead resistance at 100 means we can begin to see a flurry of buy orders, as traders move to hedge positions. The Fed’s Beige Book reported sharp contraction in Q1, which should carry on into Q2. Leisure, hospitality and retail were the hardest-hit industries. Report Links: Capitulation? - April 3, 2020 The Dollar Funding Crisis - March 19, 2020 Are Competitive Devaluations Next? - March 6, 2020 The Euro Chart II-3EUR Technicals 1
EUR Technicals 1
EUR Technicals 1
Chart II-4EUR Technicals 2
EUR Technicals 2
EUR Technicals 2
Recent data in the euro area have been negative: March consumer prices were released across the euro area: the headline inflation rate was stable at 1.3% year-on-year in Germany and 0.1% in Italy. It increased from 0.7% to 0.8% in France while falling from 0.1% to 0 in Spain. Industrial production contracted by 1.9% year-on-year in February. The euro fell by 0.5% against the US dollar this week. As the anti-dollar and a global growth barometer, trends in the euro will primarily be dictated by what happens to the greenback. The IMF April 2020 World Economic Outlook forecasted global output to contract by 3% in 2020. Moreover, it predicted the Euro area to be hit the hardest, with output shrinking by 7.5% this year, in comparison to 5.9% in the US, 6.5% in the UK, and 5.2% in Japan. Report Links: On The DXY Breakout, Euro, And Swiss Franc - February 21, 2020 Updating Our Balance Of Payments Monitor - November 29, 2019 On Money Velocity, EUR/USD And Silver - October 11, 2019 Japanese Yen Chart II-5JPY Technicals 1
JPY Technicals 1
JPY Technicals 1
Chart II-6JPY Technicals 2
JPY Technicals 2
JPY Technicals 2
Recent data in Japan have been negative: Machine tool orders kept contracting by 41% year-on-year in March, worse than the 30% decline in February. Money supply (M2) increased by 3.3% year-on-year in March, up from 3% the previous month. The Japanese yen rose by 1% against the US dollar this week. The BoJ Governor Haruhiko Kuroda said that the central bank will not hesitate to further ease monetary policy depending on COVID-19 developments. Possible solutions to support corporate funding include more purchases of corporate bonds and commercial paper, as well as easing collateral standards. More importantly, the government unveiled a 108 trillion yen fiscal package, amounting to 20% of GDP. Report Links: The Near-Term Bull Case For The Dollar - February 28, 2020 Building A Protector Currency Portfolio - February 7, 2020 Currency Market Signals From Gold, Equities And Flows - January 31, 2020 British Pound Chart II-7GBP Technicals 1
GBP Technicals 1
GBP Technicals 1
Chart II-8GBP Technicals 2
GBP Technicals 2
GBP Technicals 2
Recent data in the UK have been negative: Retail sales contracted by 3.5% year-on-year in March. The British pound has been flat against the US dollar this week. The BoE’s Credit Conditions Survey showed growing concerns from banks about the outlook during the COVID-19 health crisis. The BoE said that “Overall availability of credit to the corporate sector was unchanged for all business sizes in Q1, but was expected to increase for all business sizes in Q2.” British banks now expect to lend more to businesses in the next three months, more so than to the household sector. Report Links: Updating Our Balance Of Payments Monitor - November 29, 2019 A Few Trade Ideas - Sept. 27, 2019 United Kingdom: Cyclical Slowdown Or Structural Malaise? - Sept. 20, 2019 Australian Dollar Chart II-9AUD Technicals 1
AUD Technicals 1
AUD Technicals 1
Chart II-10AUD Technicals 2
AUD Technicals 2
AUD Technicals 2
Recent data in Australia have been negative: NAB business confidence crashed from -2 to -66 in March. Business conditions also dropped from 2 to -21. Westpac consumer confidence plunged from -3.8 to -17.7 in April. The unemployment rate inched up from 5.1% to 5.2% in March, lower than the expected 5.5%. 6K jobs were created in March, down from 26K the previous month, while well above the consensus of 40K job loss. However, the Australian Bureau of Statistics pointed out that the monthly data mostly only covers the first two weeks of March. AUD/USD fell by 0.6% this week. With Australian GDP now forecasted to shrink by 7% in Q2, and another 1% in Q3, the Australian economy is destined for its first recession in three decades. Prime Minister Scott Morrison has pledged A$130 billion subsidy for employers to prevent further layoffs. Report Links: On AUD And CNY - January 17, 2020 Updating Our Balance Of Payments Monitor - November 29, 2019 A Contrarian View On The Australian Dollar - May 24, 2019 New Zealand Dollar Chart II-11NZD Technicals 1
NZD Technicals 1
NZD Technicals 1
Chart II-12NZD Technicals 2
NZD Technicals 2
NZD Technicals 2
Recent data in New Zealand have been negative: Visitor arrivals declined by 11% year-on-year in February, down from an increase of 3% the previous month. This trend will likely worsen in March. House prices increased by 0.7% month-on-month in March, down from the last reading of 3.1%. The New Zealand dollar fell by 2% against the US dollar this week. On Thursday, the RBNZ Governor Adrian Orr said that the New Zealand financial institutions were strong and in a position to be part of the solution, while acknowledging that the soaring unemployment and high mortgage debts could pose a big challenge to the economy. Moreover, he said that the current central bank interventions to mitigate COVID-19 damage are just the beginning, and that negative interest rates are not off-the-table. Report Links: Updating Our Balance Of Payments Monitor - November 29, 2019 Place A Limit Sell On DXY At 100 - November 15, 2019 USD/CNY And Market Turbulence - August 9, 2019 Canadian Dollar Chart II-13CAD Technicals 1
CAD Technicals 1
CAD Technicals 1
Chart II-14CAD Technicals 2
CAD Technicals 2
CAD Technicals 2
Recent data in Canada have been negative: Existing home sales slumped 14.3% month-on-month in March, down from 5.9% the prior month. Bloomberg Nanos confidence kept falling to 38.7 from 42.7 for the week ended April 10. The Canadian dollar kept falling by 1.2% against the US dollar this week. On Wednesday, the BoC kept interest rates steady at 0.25%, after having lowered it by 150 bps over the past three weeks. Moreover, the BoC has announced additional measures to weather the crisis, including new purchases of provincial bonds by up to C$50 billion and corporate bonds by up to C$10 billion. The Bank has also enhanced its term repo facility to permit funding for up to 24 months. Report Links: A New Paradigm For Petrocurrencies - April 10, 2020 The Loonie: Upside Versus The Dollar, But Downside At The Crosses Updating Our Balance Of Payments Monitor - November 29, 2019 Swiss Franc Chart II-15CHF Technicals 1
CHF Technicals 1
CHF Technicals 1
Chart II-16CHF Technicals 2
CHF Technicals 2
CHF Technicals 2
Recent data in Switzerland have been mixed: Total sight deposits increased to CHF 634 billion for the week ended April 10, up from the previous reading of CHF 627 billion. Producer prices fell by 2.7% year-on-year in March, lower than the expected -2.5%. The Swiss franc fell by 0.3% against the US dollar this week, amid broad US dollar strength. While USD/CHF remains under parity, investors seeking cover from US dollar strength did not find shelter in the franc. Switzerland’s Federal Council has offered emergency loans to almost 80,000 small businesses, far more than other European countries. The most recent IMF World Economic Outlook is now forecasting the Swiss GDP to slump 6% in 2020, followed by a rebound of 3.8% next year. This compares favorably with the slated euro area contraction of 7.5% this year. Report Links: On The DXY Breakout, Euro, And Swiss Franc - February 21, 2020 Currency Market Signals From Gold, Equities And Flows - January 31, 2020 Portfolio Tweaks Before The Chinese New Year - January 24, 2020 Norwegian Krone Chart II-17NOK Technicals 1
NOK Technicals 1
NOK Technicals 1
Chart II-18NOK Technicals 2
NOK Technicals 2
NOK Technicals 2
Recent data in Norway have been negative: The trade surplus tumbled to NOK 2.5 billion in March from NOK 18.5 billion the same month last year. After having rebounded by 15% from its March lows, the Norwegian krone fell again by 3% against the US dollar this week, making it the worst-performing G10 currency. The trading pattern of the Norwegian krone in recent weeks has mirrored that of emerging market currencies, warranting intervention by the central bank. OPEC has agreed over the weekend to cut production by 9.7 million barrels per day in May and June, which represents approximately 10% of global supply. Despite the production cut, oil prices slipped this week over growing COVID-19 demand fears and supply concerns. Report Links: A New Paradigm For Petrocurrencies - April 10, 2020 Building A Protector Currency Portfolio - February 7, 2020 On Oil, Growth And The Dollar - January 10, 2020 Swedish Krona Chart II-19SEK Technicals 1
SEK Technicals 1
SEK Technicals 1
Chart II-20SEK Technicals 2
SEK Technicals 2
SEK Technicals 2
Recent data in Sweden have been negative: Headline inflation declined from 1% to 0.6% year-on-year in March, while in line with expectations, this is the lowest inflation rate since May 2016. The Swedish krona fell by 0.8% against the US dollar this week. Sweden’s COVID-19 death toll just passed 1000 this week. While its fatality rate is still well below that in Italy and the UK, it’s much higher than its Scandinavian neighbors, which adds more criticism surrounding Sweden’s decision to ignore the lockdown measures imposed elsewhere. Prime Minister Stefan Lofven has said that stricter measures may be needed going forward, which will pose more threat to the economy. Report Links: Updating Our Balance Of Payments Monitor - November 29, 2019 Where To Next For The US Dollar? - June 7, 2019 Balance Of Payments Across The G10 - February 15, 2019 Trades & Forecasts Forecast Summary Core Portfolio Tactical Trades Limit Orders Closed Trades
Highlights The May-June WTI spread settled earlier in the week at a $7.29/bbl contango, the widest level since February 2009 during the GFC. This reflects an extraordinarily tight storage market in the US Gulf and Midcontinent. WTI for May delivery breached $20/bbl Wednesday, touching a 18-year low (Chart of the Week). Output cuts starting in May agreed by OPEC 2.0 over the weekend will remove 6.1mm b/d on average for May-December vs. 1Q20 levels. Additional losses outside OPEC 2.0 will reduce global supply 4.5mm b/d y/y. We raised our estimate of COVID-19-induced demand destruction in 2Q20 to 14.6mm b/d from 12.1mm b/d. We expect demand to fall ~ 8mm b/d in 2020 vs. our previous estimate of 4mm b/d, as global fiscal and monetary stimulus revives growth in 2H20. We expect 2021 demand to rise 7.7mm b/d, averaging 100.6mm b/d. In our updated forecast, Brent is expected to average $39/bbl – slightly above our earlier $35/bbl estimate – as incremental supply losses offset lower demand. Our Brent forecast for 2021 remains ~ $65/bbl. WTI will trade $2-$4/bbl lower. Feature April is the cruellest month … - T.S. Eliot, The Waste Land1 Global oil logistical capacity will be tested in extremis this month, as cargoes laden with oil arrive in ports that have no need for ready supply and few storage options to hold the crude until its needed. This is filling traditional global storage, inland pipelines and ships, which, as typically occurs in extremis, are used as floating storage (Chart 2). Chart of the WeekCrude Oil In Extremis
Crude Oil In Extremis
Crude Oil In Extremis
Chart 2Floating Storage Volumes Soar As Terminals and Pipelines Fill
Floating Storage Volumes Soar As Terminals and Pipelines Fill
Floating Storage Volumes Soar As Terminals and Pipelines Fill
The most extreme testing of global logistics likely will occur in this cruel month, to borrow once again from the laureate, as markets are forced to absorb the production surge from OPEC 2.0 – mostly from KSA and its allies. Repeated excursions to and through $10/bbl in physical markets, as already have been registered in Canada and US shale basins, can be expected this month (Chart 3). Indeed, we expect price pressures to reduce US oil ouput – mostly in the shales – by 1.5mm b/d or more.2 Beginning in May, OPEC 2.0 will begin cutting production, with its putative leaders – KSA and Russia – accounting for 1.3mm b/d and 2.1mm b/d, respectively, of the coalition’s total pledged cuts of 7.6mm b/d vs. 1Q20 production levels. (Based on OPEC 2.0’s October 1, 2018, reference level – except for KSA and Russia, both of which are cutting from a nominal 11mm b/d level – the cuts amount to 9.7mm b/d for May-June, and 7.7mm b/d for 2H20).3 Chart 3Cash Markets Pressing /bbl
Cash Markets Pressing $10/bbl
Cash Markets Pressing $10/bbl
While the official OPEC communique notes the coalition also will implement a 6mm b/d cut from January 2021 to April 2022, we doubt this will be necessary. The coalition meets again in June, and KSA’s Energy Minister, Prince Abdulaziz bin Salman, said the Kingdom is prepared to increase its cuts if needed.4 Based on historical experience, we expect KSA to over-deliver on cuts, and for Russia to gradually meet its pledged volumes. We are haircutting other states’ production cuts based on historical observation, and are projecting cuts of ~ 75% for 2020 and 70% for 2021 compliance (Table 1). Additional losses outside OPEC 2.0 will reduce global supply 4.5mm b/d y/y on average. Table 1BCA Global Oil Supply - Demand Balances (MMb/d, Base Case Balances)
US Storage Tightens, Pushing WTI Lower
US Storage Tightens, Pushing WTI Lower
Lowering Our Demand Forecast The COVID-19 pandemic, which, owing to the global lockdowns, has literally shut the majority of the world’s economies down, and produced a global GDP contraction far greater than the recession the Global Financial Crisis (GFC) produced in 2008. Our estimate of COVID-19-induced demand destruction in 2Q20 is now 14.6mm b/d, up from 12.1mm b/d. For all of 2020, we expect demand to fall 7.9mm b/d in our base case vs. our previous estimate of 4mm b/d. These estimates are highly conditional on the trajectory of the containment of the COVID-19 pandemic, which, owing to the global lockdowns, has literally shut the majority of the world’s economies down, and produced a global real GDP contraction far greater than the recession the Global Financial Crisis (GFC) produced in 2008 (Chart 4). Nonetheless, we believe the massive global fiscal and monetary stimulus now being deployed will restore growth beginning in 2H20 and carrying through to expect 2021 demand to rise 7.7mm b/d, and to average 100.6mm b/d (Chart 5). Chart 4COVID-19 Real GDP Hits Dwarf 2009 GFC Recession
US Storage Tightens, Pushing WTI Lower
US Storage Tightens, Pushing WTI Lower
Chart 5Massive Stimulus Will Revive Demand
US Storage Tightens, Pushing WTI Lower
US Storage Tightens, Pushing WTI Lower
We assume OPEC 2.0 will be required to raise production in 2021 to keep prices from accelerating too fast. While our demand expectations are slightly weaker, in our modeling we see supply being curtailed sufficiently to produce a physical deficit beginning in 3Q20 (Chart 6). Our supply-demand trajectory projects a peak in OECD storage of 3.7 billion barrels in May, after which inventories fall sharply (Chart 7). Indeed, we assume OPEC 2.0 will be required to raise production in 2021 to keep prices from accelerating too fast. Chart 6Oil Supply-Demand Balances Point To Physical Deficit By 4Q20
Oil Supply-Demand Balances Point To Physical Deficit By 4Q20
Oil Supply-Demand Balances Point To Physical Deficit By 4Q20
Chart 7Inventories Spike, Then Draw Sharply
Inventories Spike, Then Draw Sharply
Inventories Spike, Then Draw Sharply
Two-Way Price Risk Our forecast assumes the COVID-19 pandemic is contained and that fiscal and monetary stimulus re-energizes global growth. In our updated forecast, we see Brent averaging $39/bbl this year – slightly above our earlier $35/bbl estimate – as incremental supply losses offset lower demand. Next year, our expectation remains ~ $65/bbl. WTI will trade $2-$4/bbl lower (Chart 8). As noted above, our forecast assumes the COVID-19 pandemic is contained and that fiscal and monetary stimulus re-energizes global growth. However, as the pandemic spreads deeper into less-developed EM economies without robust public-health infrastructures, or social security systems providing a basic income in the event of job loss due to recessions the risk of widespread infection rises significantly.5 Chart 8Stronger Price Recovery Expected
Stronger Price Recovery Expected
Stronger Price Recovery Expected
No amount of fiscal or monetary stimulus will allow an economy to weather such a storm. This is a clear and present danger to the global recovery and to a recovery in commodities generally, oil in particular. Investment Implications Our expectation for prices is reflected in Chart 8, premised, again, on COVID-19 being contained and fiscal and monetary stimulus reviving global growth. We are retaining our long exposure to the market, expecting the supply and demand policies set in motion will be effective. However, there is no way of accurately assessing the likelihood of an uncontained pandemic hitting EM markets, and, from there, re-entering other markets that presumably have dealt with the coronavirus. Robert P. Ryan Chief Commodity & Energy Strategist rryan@bcaresearch.com Hugo Bélanger Associate Editor Commodity & Energy Strategy HugoB@bcaresearch.com Fernando Crupi Research Associate Commodity & Energy Strategy FernandoC@bcaresearch.com Commodities Round-Up Energy: Overweight Global oil inventories will be filled rapidly in 2Q20 as major economies remain in lockdowns. High-cost Canadian oil sand producers will be severely hit as their output is landlocked, distant from key demand centers, and facing storage and pipeline infrastructure constraints. More than 500k b/d of production will be shut-in in April and May as crude-by-rail collapses, local and US refinery runs are reduced, and Alberta’s limited inventory moves closer to its maximum capacity – estimated at ~ 90mm bbls (Chart 9). Separately, a €20/MT stop to our EUA futures recommendation was triggered on April 14, 2020, leaving us with a 14.2% gain. Base Metals: Neutral China’s iron ore imports fell to 85.9mm MT in March, a decline 0.6% y/y, after growing 1.5% in January and February. This came as steel mills arranged maintenance or slowed production to deal with record-high inventories after the COVID-19 pandemic curtailed construction and industrial activities. However, in the long run the outlook for iron ore and steel appears to be improving. Mysteel data for China indicates utilization rates at blast furnaces have been rising for four weeks and are now at ~ 79%. Chinese Steel exports also picked up in March, up 2.4% from a year earlier, but are now facing new anti-dumping duties on stainless steel in the EU. Precious Metals: Neutral Gold continues to trade above $1700/oz – reaching its highest level since October 2012 – supported by easing fiscal and monetary policy in the US and fear of a prolonged economic slowdown. A lower US dollar – the DXY index fell back below 100 last week – and depressed real rates supported gold’s move higher (Chart 10). Dollar debasement risks and negative real rates increase gold’s attractiveness as a safe asset. Ags/Softs: Underweight China’s March soybean imports came in at 4.28mm MT y/y, the lowest level since February 2015. Rains in Brazil delayed that country’s exports to China. The fall also reflects a 6% contraction in soymeal (i.e., the “crush”) consumed by livestock – as the African Swine Fever slashed China’s pig herd by more than 40% and shortages forced operations to grind to a halt. Similarly, meat suppliers in the US and Canada are closing plants temporarily due to COVID-19 cases among employees. As a result, Chicago soybean futures traded 0.8% lower on Tuesday. Chart 9Limited Storage Capacity In Alberta
Limited Storage Capacity In Alberta
Limited Storage Capacity In Alberta
Chart 10Lower US Rates And Dollar Support Gold
Lower US Rates And Dollar Support Gold
Lower US Rates And Dollar Support Gold
Footnotes 1 The Waste Land, by T.S. Eliot, originally was published in 1922 in The Criterion, which was founded and edited by Eliot. 2 The Texas Railroad Commission held day-long hearings April 14 to consider returning to its historic roll as an oil-production regulator on Tuesday. As we went to press no ruling on the petition to revive pro-rationing was delivered. The Oklahoma Corporation Commission will hold similar hearings next month. Please see Texas and Oklahoma weigh production quotas for oil published by washingtonpost.com April 13, 2020. 3 Please see The 10th (Extraordinary) OPEC and non-OPEC Ministerial Meeting concludes, posted by OPEC April 12, 2020. 4 Please see Saudi energy minister leaves door open for more cuts in June, published by worldoil.com April 13, 2020. 5 Please see National governments have gone big. The IMF and World Bank need to do the same. This op-ed by Gordon Brown and Larry Summers, published by washingtonpost.com April 14, 2020, lays out some of the issues that elevate downside risk to a COVID-19 recovery. Investment Views and Themes Recommendations Strategic Recommendations Tactical Trades Trade Recommendation Performance In 2019 Q4
US Storage Tightens, Pushing WTI Lower
US Storage Tightens, Pushing WTI Lower
Commodity Prices and Plays Reference Table Trades Closed in 2020 Summary of Closed Trades
US Storage Tightens, Pushing WTI Lower
US Storage Tightens, Pushing WTI Lower
Highlights As government bond yields have fallen to zero or below, many of our clients have asked us how to obtain income from other asset classes. In this report we analyze three income opportunities in the equity market: high-dividend yield stocks, dividend growth stocks, and preferred shares. High-dividend yield stocks have a large style bias to the value factor. Thus, investors who wish to invest in high-dividend yield stocks might be better served by investing in dividend plays in the non-value universe. Dividend growth stocks – such as the ones in the S&P 500 Dividend Aristocrats index – are historically less likely to cut their dividends, thanks to their defensive nature and corporate incentives. The Aristocrats should continue increasing dividends during this crisis. Our screening points to the following as the most attractive: ExxonMobil, Franklin Resources, 3M, Procter & Gamble, AT&T, and Genuine Parts. We would not buy US preferred shares, given that they are heavily weighted to Financials, a sector that will do poorly in an environment of low interest rates. Feature As the crisis caused by COVID-19 has battered risk assets, many of our clients have asked us how to obtain income in this current environment. In the past, investors could rely on a consistent coupon provided by government bonds. However, this is no longer the case. The crisis has dragged DM government bond yields around the world to below or near zero, which means that investors looking for income opportunities must search outside of government bonds, in riskier asset classes. One such asset class is equities. Over the last 50 years, income return has accounted for roughly a third of the total return of global equities (Chart 1, top panel). Moreover, in contrast to other sources of equity return such as earnings growth or multiple expansion, income return is always positive, making it much more consistent through time as well as resilient to recessions (Chart 1, middle and bottom panels). However, there are a couple of drawbacks to equities as income-generating assets: The income yield of equities is not particularly high, especially when one compares them with asset classes such as corporate debt which have similar or lower volatility (Chart 2, top panel). As opposed to fixed-income assets, where a set income return is guaranteed provided there is no default and the security is held to maturity, companies can actually cut their equity dividends when they come under stress. As a consequence, while trailing dividend yield is often an accurate indicator of future income return, it can overestimate it during bear markets (Chart 2, bottom panel). Chart 1Dividends Make Up A Substantial Portion Of Equity Returns
Dividends Make Up A Substantial Portion Of Equity Returns
Dividends Make Up A Substantial Portion Of Equity Returns
Chart 2The Income Return Of Equities Is Low And Can Be Deceiving During Bear Markets
Dividend Strategies: Exploring Income Opportunities In Equity Markets
Dividend Strategies: Exploring Income Opportunities In Equity Markets
In this report we examine two different dividend strategies that try to address the issues above: high-dividend yield stocks and dividend growth stocks. In addition to these strategies within the common equity space, we also explore whether preferred shares can be an attractive income opportunity. For each of these three income strategies we try to answer the following questions: How are these dividend indices constructed? How has each strategy performed historically? How has it performed during bear markets? What is the sector composition of each strategy? How are valuations now? To answer these questions, we examine the MSCI High-Dividend Yield indices, the S&P Dividend Aristocrat indices and the iShares Preferred Shares indices. Moreover, based on our analysis, we also make some recommendations as to which is the best income strategy in equity markets for the current environment. Please see our Investment Implications section for more details. High-Dividend Yield Stocks As their name suggests, high-dividend yield indices select for stocks with the highest dividend yields. In practice however, many more screening criteria are imposed. In order to ensure some stability in dividend payout, MSCI excludes REITs, payout outliers, negative dividend growth stocks, low-quality stocks, and low-performance stocks. Once all of these screening criteria are applied, MSCI selects for stocks which have a dividend yield that is at least 30% higher than its benchmark. Table 1 shows details on these screening criteria. Table 1Criteria For MSCI High-Dividend Yield Indices
Dividend Strategies: Exploring Income Opportunities In Equity Markets
Dividend Strategies: Exploring Income Opportunities In Equity Markets
How has the MSCI High-Dividend index performed historically? Since 1996, high-dividend yield stocks have outperformed the benchmark at the global level by 50% (Chart 3, top panel). This outperformance has been mostly a result of the income advantage this index provides, given that price return has outperformed only by a paltry 3%. It is also worth noting that price performance has been particularly poor since the Financial Crisis, and has actually caused high-dividend yield stocks to underperform on a total return basis over the past decade. Relative performance has been flat to down, even in those markets where high-dividend yield had been very successful previously such as Canada, Japan, and Emerging Markets (Chart 3, bottom panel). What has caused this underperformance? One reason is the low allocation that the high-yield index has to Technology (Chart 4, panel 1). Another reason is style tilt. Factor analysis reveals that the high-dividend yield index has a very strong value bias1 (Chart 4, panel 2). This strong style tilt is likely responsible for the poor relative price performance of high-dividend yield stocks, as value has been notorious for underperforming over the past decade (Chart 4, panel 3). Chart 3High-Dividend Yield Stocks Have Not Outperformed In The Past Decade
High-Dividend Yield Stocks Have Not Outperformed In The Past Decade
High-Dividend Yield Stocks Have Not Outperformed In The Past Decade
Chart 4The High-Dividend Yield Index Has A Strong Value Bias
The High-Dividend Yield Index Has A Strong Value Bias
The High-Dividend Yield Index Has A Strong Value Bias
But while high-dividend yield stocks are an implicit bet on value, there is evidence that investing in high-dividend yield stocks within the non-value universe is a profitable strategy. In the paper “What Difference Do Dividends Make?”, Coronover et al. found that high-dividend yield companies actually outperform their low-dividend yield counterparts in the high and median price-to-book universes2 (Table 2). Additionally, they found that high-dividend yield stocks also performed better vis-à-vis low-dividend yield stocks in the mid-cap and large-cap universes. Table 2High-Dividend And Low-Dividend Yield Stocks Sorted By Price-To-Book And Market Cap
Dividend Strategies: Exploring Income Opportunities In Equity Markets
Dividend Strategies: Exploring Income Opportunities In Equity Markets
Dividend Growth Stocks Dividend growth stocks are securities that have increased their dividend for a certain number of consecutive years. In the US, companies with a track record of at least 25 years of dividend increases are usually called “dividend aristocrats”, while companies with a 10-year track record are known as “dividend achievers”.3 However, the requirements to be classified as a dividend aristocrat or a dividend achiever are not uniform across index providers, and even within providers they are not uniform across different countries, which means that investors need to pay attention to selection criteria when investing in a dividend growth index (Table 3). In this report we will focus on the best-known dividend growth index: the S&P 500 Dividend Aristocrats index. Table 3Different Criteria To Become A Dividend Aristocrat In Different Countries
Dividend Strategies: Exploring Income Opportunities In Equity Markets
Dividend Strategies: Exploring Income Opportunities In Equity Markets
How has this index performed historically? The S&P 500 Dividend Aristocrats index has outperformed the S&P 500 by nearly 60% since 1995 in total-return terms and by more than 30% in price terms. Additionally, it has enjoyed less volatility and has outperformed significantly during recessions (Chart 5, panel 1). Chart 5Dividend Aristocrats Outperform During Bear Markets
Dividend Aristocrats Outperform During Bear Markets
Dividend Aristocrats Outperform During Bear Markets
The main difference between the benchmark and the Aristocrats index comes down to sector tilt and leverage. The second panel of Chart 5 shows that the Aristocrats index has a large overweight in Consumer Staples and a large underweight in Technology relative to the S&P 500. Meanwhile, while valuations are not that different, and equity profitability is actually lower, the companies in the Aristocrats index are significantly less levered than those of the S&P 500, a testament to their defensive nature (Table 4). Table 4Dividend Aristocrats Have Low Leverage
Dividend Strategies: Exploring Income Opportunities In Equity Markets
Dividend Strategies: Exploring Income Opportunities In Equity Markets
But are dividend aristocrats really a more reliable source of income than the rest of the market? Empirically, they have been. In the US, the likelihood of a dividend increase in any given year has historically been a function of how many consecutive dividend increases a company has done before (Chart 6). Beyond the strong balance sheets and stable business models that dividend aristocrat companies have, this is most likely a result of the incentives created by the asymmetry of the index: A multi-decade policy of dividend increases is a significant investment of time and resources to signal stability to the market. However, the status obtained by this policy – and all the resources devoted to it– is immediately lost the moment dividends are cut, with no possibility of reclaiming it in at least a quarter century.4 Importantly, the longer a company raises dividends the bigger the investment becomes, creating a very high incentive to not cut dividends. That being said, sometimes this incentive is not enough to overcome extreme business conditions, such as those that occurred in 2008. Chart 7 shows that the members of the S&P Dividend Aristocrats index declined by roughly a third during the Financial Crisis, mostly as a result of previously reliable banks that had to cut their dividends in 2008 and 2009.5 Chart 6The Likelihood Of A Dividend Increase Is Higher For Dividend Aristocrats
Dividend Strategies: Exploring Income Opportunities In Equity Markets
Dividend Strategies: Exploring Income Opportunities In Equity Markets
Chart 7Extreme Business Conditions Can Force Some Aristocrats Off The Index
Dividend Strategies: Exploring Income Opportunities In Equity Markets
Dividend Strategies: Exploring Income Opportunities In Equity Markets
Preferred Shares Preferred shares are securities which have traits of both debt and common equity: Like debt, they have a par value, no voting rights, and they provide a prespecified cash flow. Nevertheless, they do not have a maturity date and they represent an ownership stake in the company, just like common equity. Analyzing the historical performance of preferred shares is difficult since most indices begin only around the Financial Crisis. However, from the limited data we have, we can make some observations: Preferred shares in the US have underperformed common equity, investment- grade debt and high-yield debt since 2004 (Chart 8). They also experienced very deep selloffs during recessions, often similar to the selloffs that common equities have experienced (Table 5). However, preferred shares do seem to have similar return drivers to corporate credit. In particular, much like corporate credit, they tend to fall whenever yields on corporate debt rise (Chart 9). Chart 8Preferred Equity Has Underperformed Credit And Common Equity
Preferred Equity Has Underperformed Credit And Common Equity
Preferred Equity Has Underperformed Credit And Common Equity
Table 5Preferred Equity Has Similar Drawdowns To Common Equity During Recessions
Dividend Strategies: Exploring Income Opportunities In Equity Markets
Dividend Strategies: Exploring Income Opportunities In Equity Markets
Chart 9US Preferred Shares React Negatively To Rising Credit Yields
US Preferred Shares React Negatively To Rising Credit Yields
US Preferred Shares React Negatively To Rising Credit Yields
Chart 10US Preferred Shares Are Heavily Tilted To Financials
Dividend Strategies: Exploring Income Opportunities In Equity Markets
Dividend Strategies: Exploring Income Opportunities In Equity Markets
In theory, the co-movement of preferred equity and corporate debt is not that surprising. Much like credit, preferred shares are fixed-income securities which are subject to credit risk. Whenever yields on risky credit rise, these fixed-income securities become relatively less attractive, making their price fall. Chart 11Canadian Preferred Shares Are An Oil Play
Canadian Preferred Shares Are An Oil Play
Canadian Preferred Shares Are An Oil Play
However, what is surprising is that preferred shares have underperformed both investment-grade and high-yield credit. How could an asset that technically has more risk – and thus should offer a better rate of return – underperform for such a long time? One plausible explanation is sector skew. Preferred shares are heavily skewed to Financials, a sector that has underperformed significantly over the past decade (Chart 10). While Financials tend to dominate most preferred indices, other factor may also affect returns. In Canada, the preferred share index is most sensitive to changes in the price of oil – a consequence of both the relatively high weight of Energy in the index, and the importance of the commodity for the Canadian economy (Chart 11). There are many types of preferred shares which include rate-resets, perpetuals, and variable rate. We do not analyze them in this report since indices tracking most of these securities have a very short history. We do advise our clients to be wary of compositional differences between indices, since sector composition could be a larger driver of returns than the type of preferred equity itself. Finally, while it is outside the scope of this report, it is worth remembering that preferred shares might still be worth looking at for taxable investors, given that dividends and interest income are often not taxed at the same rates. Investment Implications Dividend Growth Stocks Investors should consider including dividend growth stocks in their portfolios. Their defensive nature means that they should be able to weather the recession brought about by the coronavirus lockdowns better than the overall market, while their long-term dividend policy implies that these companies will be more reluctant to cut dividends. One drawback of the S&P 500 Dividend Aristocrat index is that it is yielding less than 3%. Thus, investors would be better served by selecting individual securities within the index. In order to help with this exercise, we have ranked the companies in the S&P 500 Dividend Aristocrat index according to our own GAA Income Score. The score is based on the following three traits: Raw Income: the company’s current dividend yield. Yield Stability: the number of consecutive years the company has raised its dividend. Attractiveness: The company’s current score from the BCA Equity Trading Strategy service. Please find the ranking of the S&P 500 Dividend Aristocrats in Appendix A. According to our GAA Income Score the best S&P 500 Dividend Aristocrats are ExxonMobil, Franklin Resources, 3M, Procter & Gamble, AT&T, and Genuine Parts. High-Dividend Yield Stocks What about high-dividend yield stocks? The MSCI All-Country World High-Dividend Yield index is currently yielding a formidable 5%, making it an attractive income opportunity. However, investors should remember that high-dividend yield stocks have a significant exposure to the value factor. GAA is currently neutral on value versus growth, but we are concerned that value continued to underperform when equities were falling and has not been able to outperform in recent weeks as equities rebounded. For those who do not want to take on value exposure, overweighting high-dividend yield within non-value stocks and mid and large caps might be a better option. Preferred Equity Currently preferred shares have a dividend yield of roughly 5%. Do they make an attractive income opportunity? We don’t believe so. Low interest rates and tepid loan growth even after the quarantines are over will likely weigh on Financials – the sector which preferred shares are most exposed to. Moreover, its strong similarity to corporate debt makes this asset somewhat redundant for investors who already own credit. Appendix
Dividend Strategies: Exploring Income Opportunities In Equity Markets
Dividend Strategies: Exploring Income Opportunities In Equity Markets
Juan Correa Ossa Associate Editor juanc@bcaresearch.com Footnotes 1 This is in part by construction. The MSCI Value index uses dividend yield as one of its variables to asses value. 2 Mitchell Coronover, Gerald R. Jensen, and Marc W. Simpson, “What Difference Do Dividends Make?”, Financial Analyst Journal, Volume 72, Number 6 (2016). 3 Companies which have increased their dividend for at least 50 years are sometimes called “dividend kings”. 4 Eberner Asem and Ahamsul Alam, “The Market’s Reaction To Consecutive Dividend Increases,” (December 2017). 5 Not all companies exit the index due to dividend cuts. Some companies exit because of corporate restructurings or because they no longer meet the minimum market capitalization to qualify.
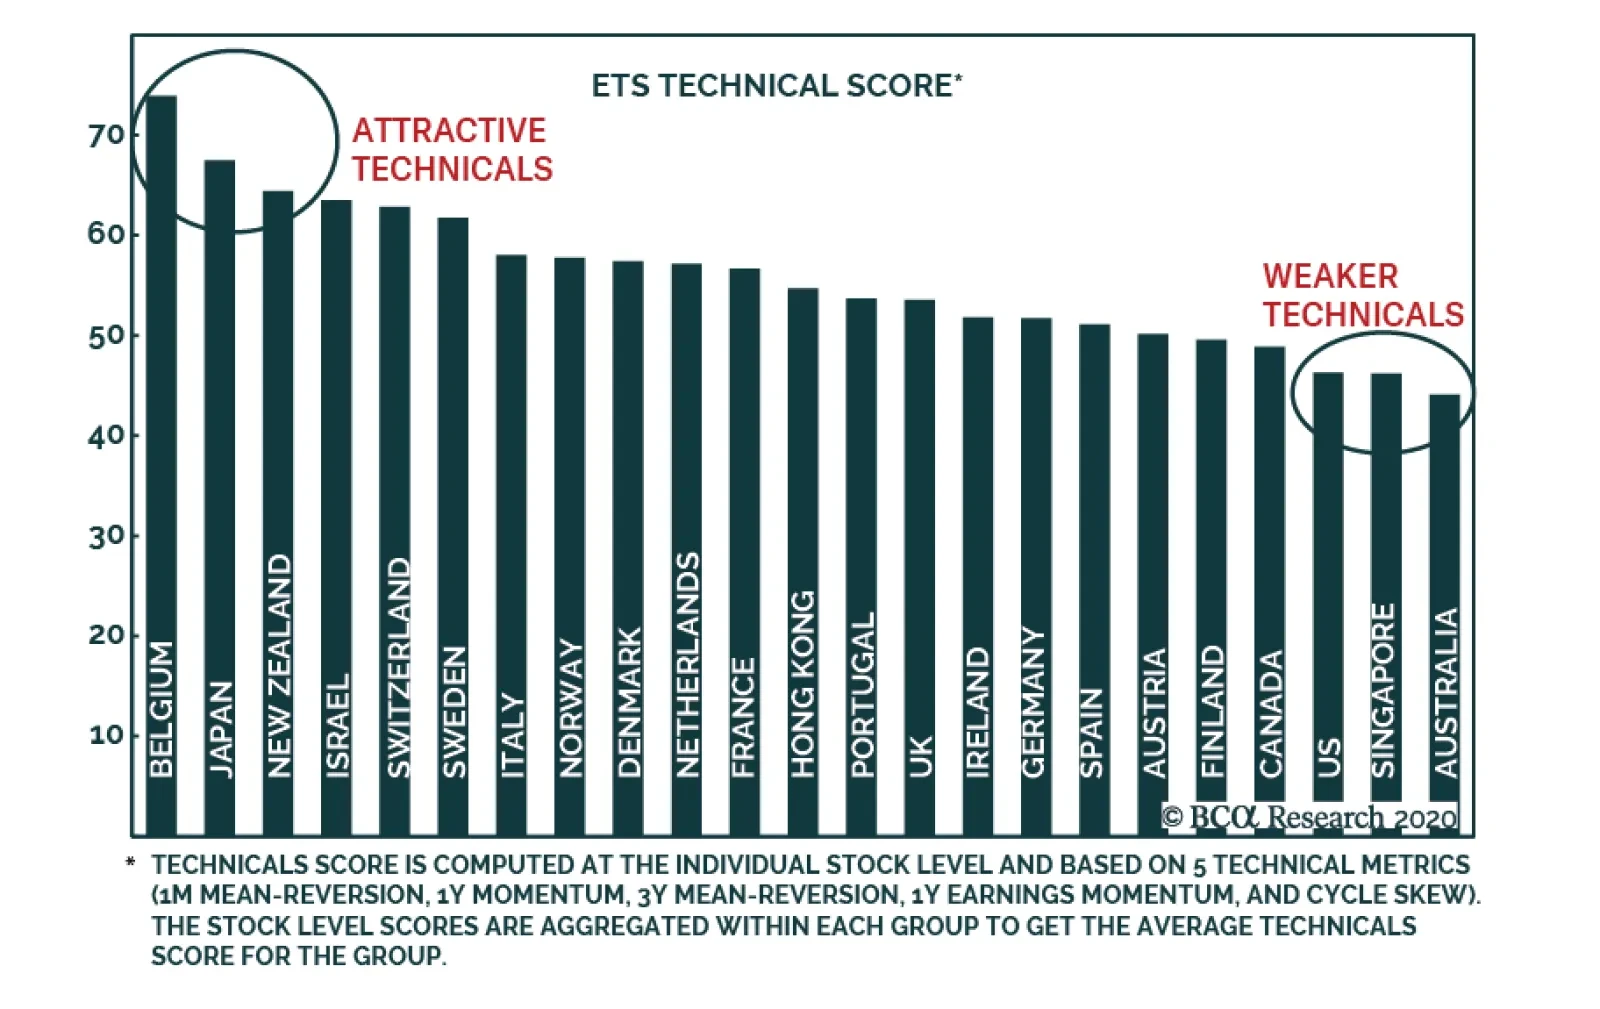
Last week, we used the output of BCA Research’s Equity Trading Strategy to generate a bottom-up ranking of markets based on their value factor. This week, we are using the same tool to generate a bottom-up ranking of markets with the most attractive technical…
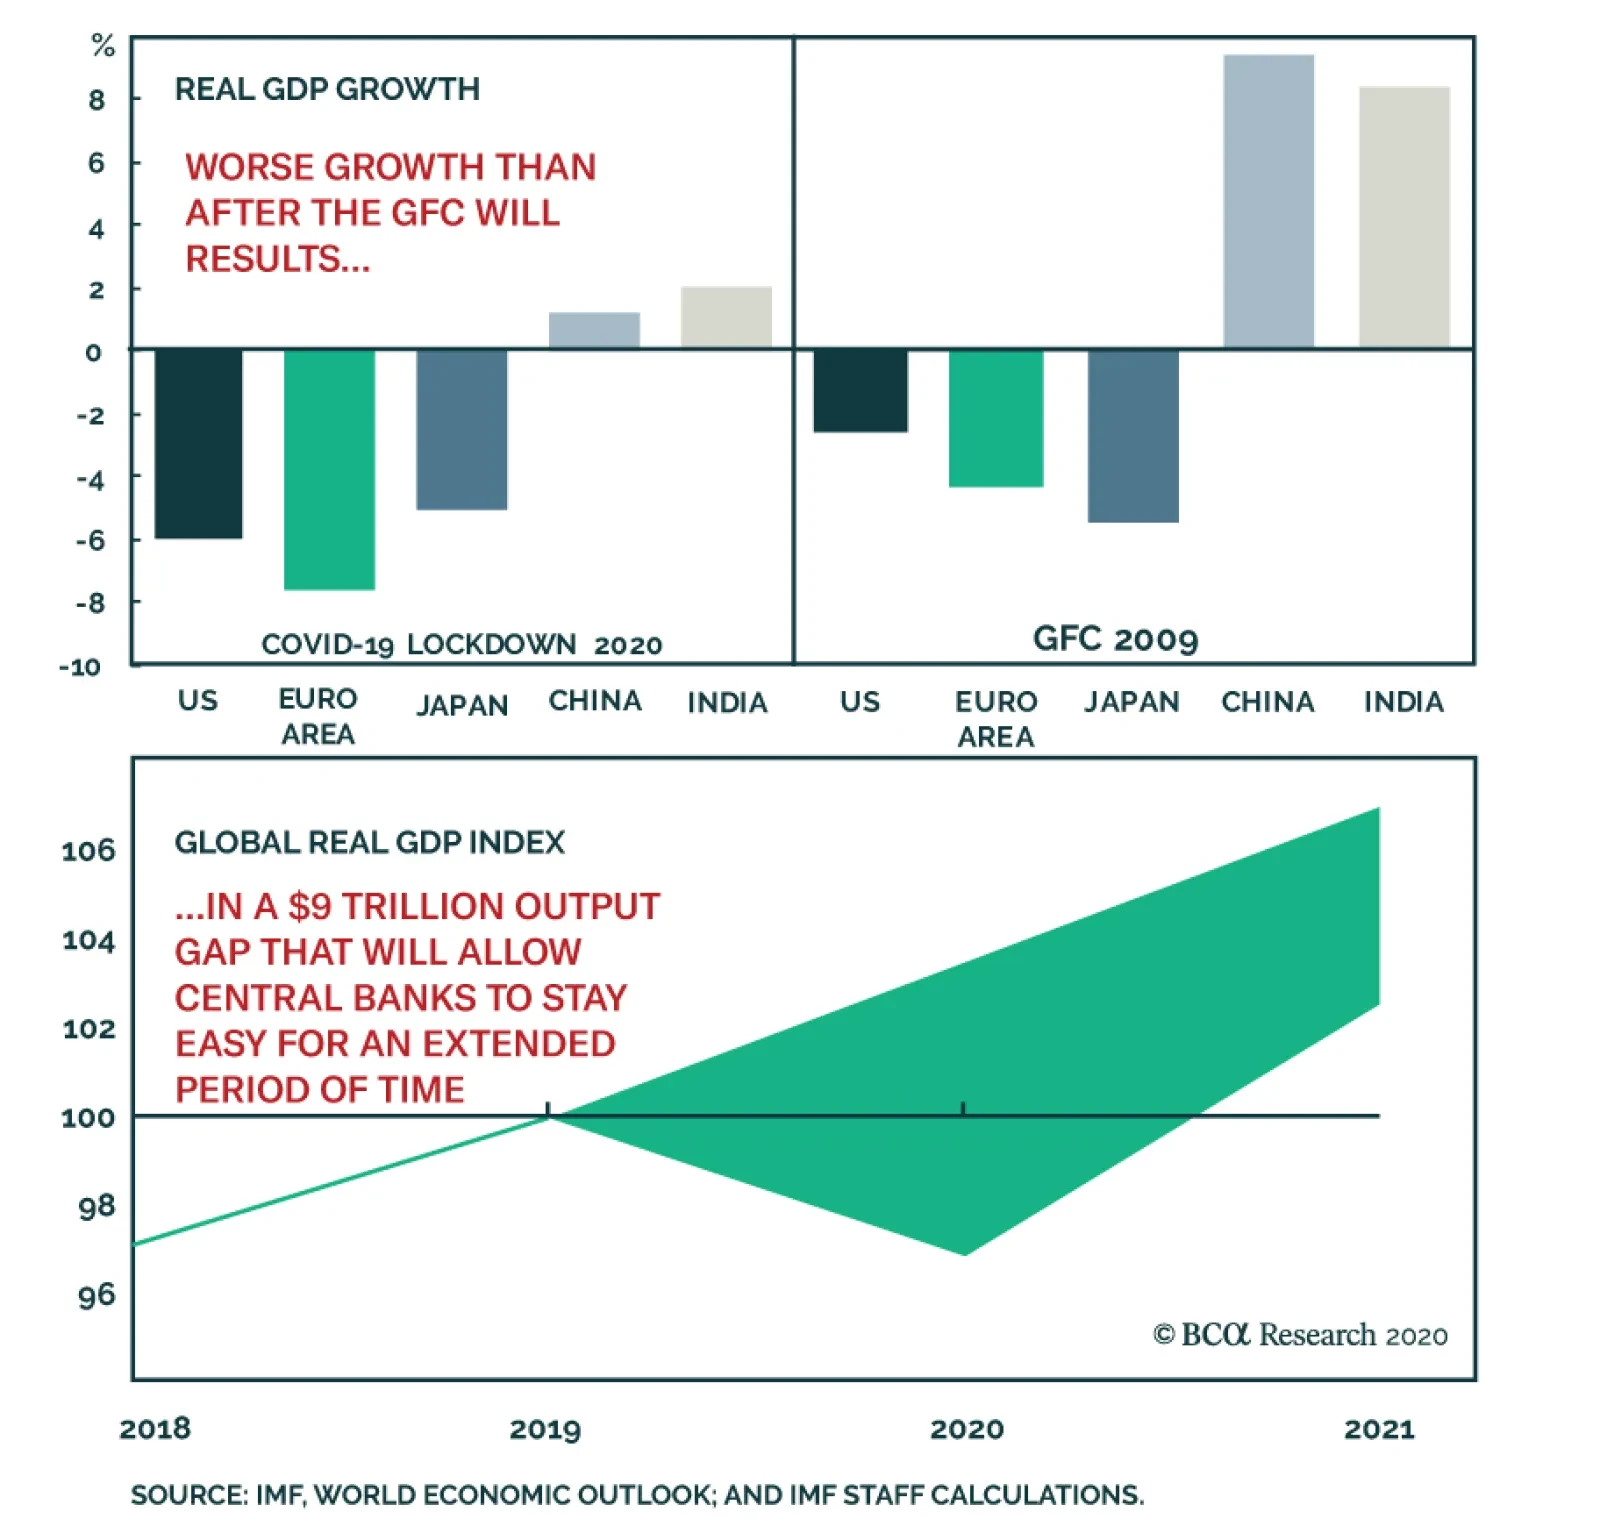
The IMF just updated its global growth forecasts and the results are sobering. Global GDP is expected to contract by 3% in 2020, which is a much deeper contraction than the 0.1% recorded in the wake of the Great Financial Crisis. Moreover, this poor outcome…
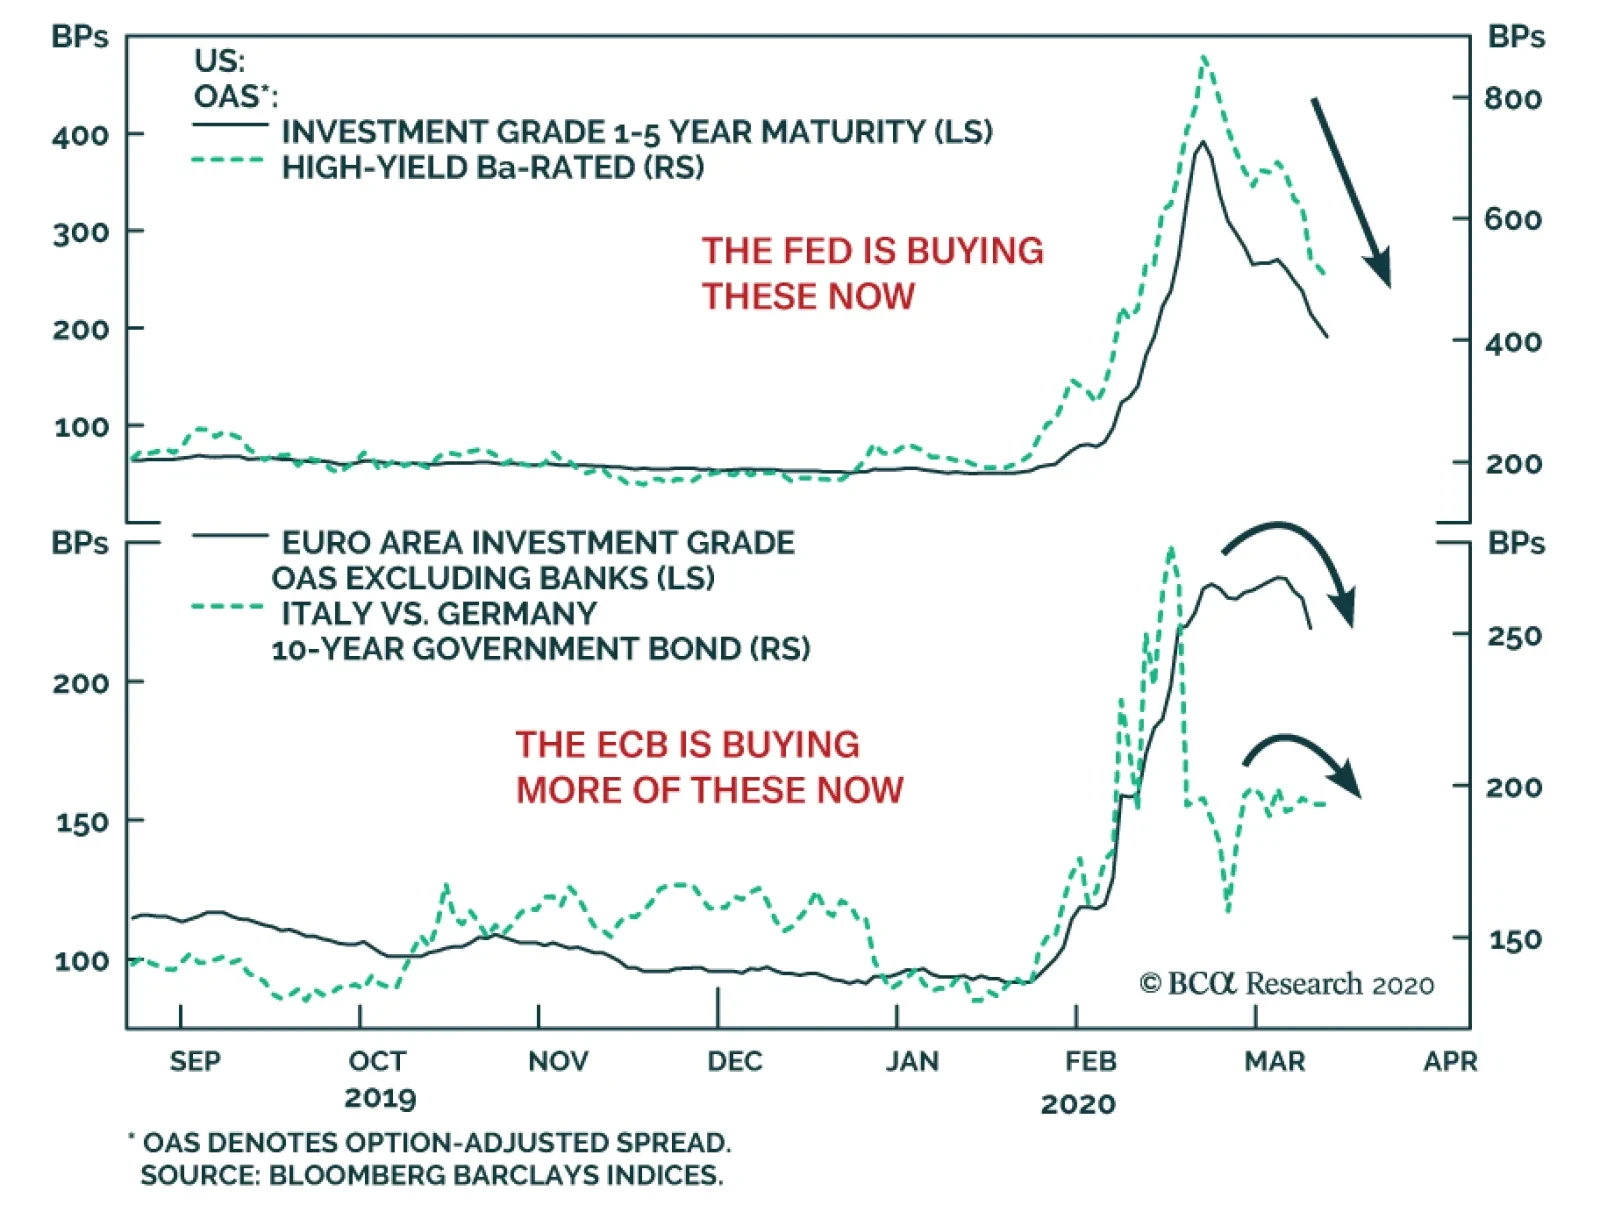
Yesterday, BCA Research's Global Fixed Income Strategy service asserted that central banks have become best friends with corporate bond investors. The actions of policymakers worldwide to help mitigate the severe economic shock from the COVID-19…
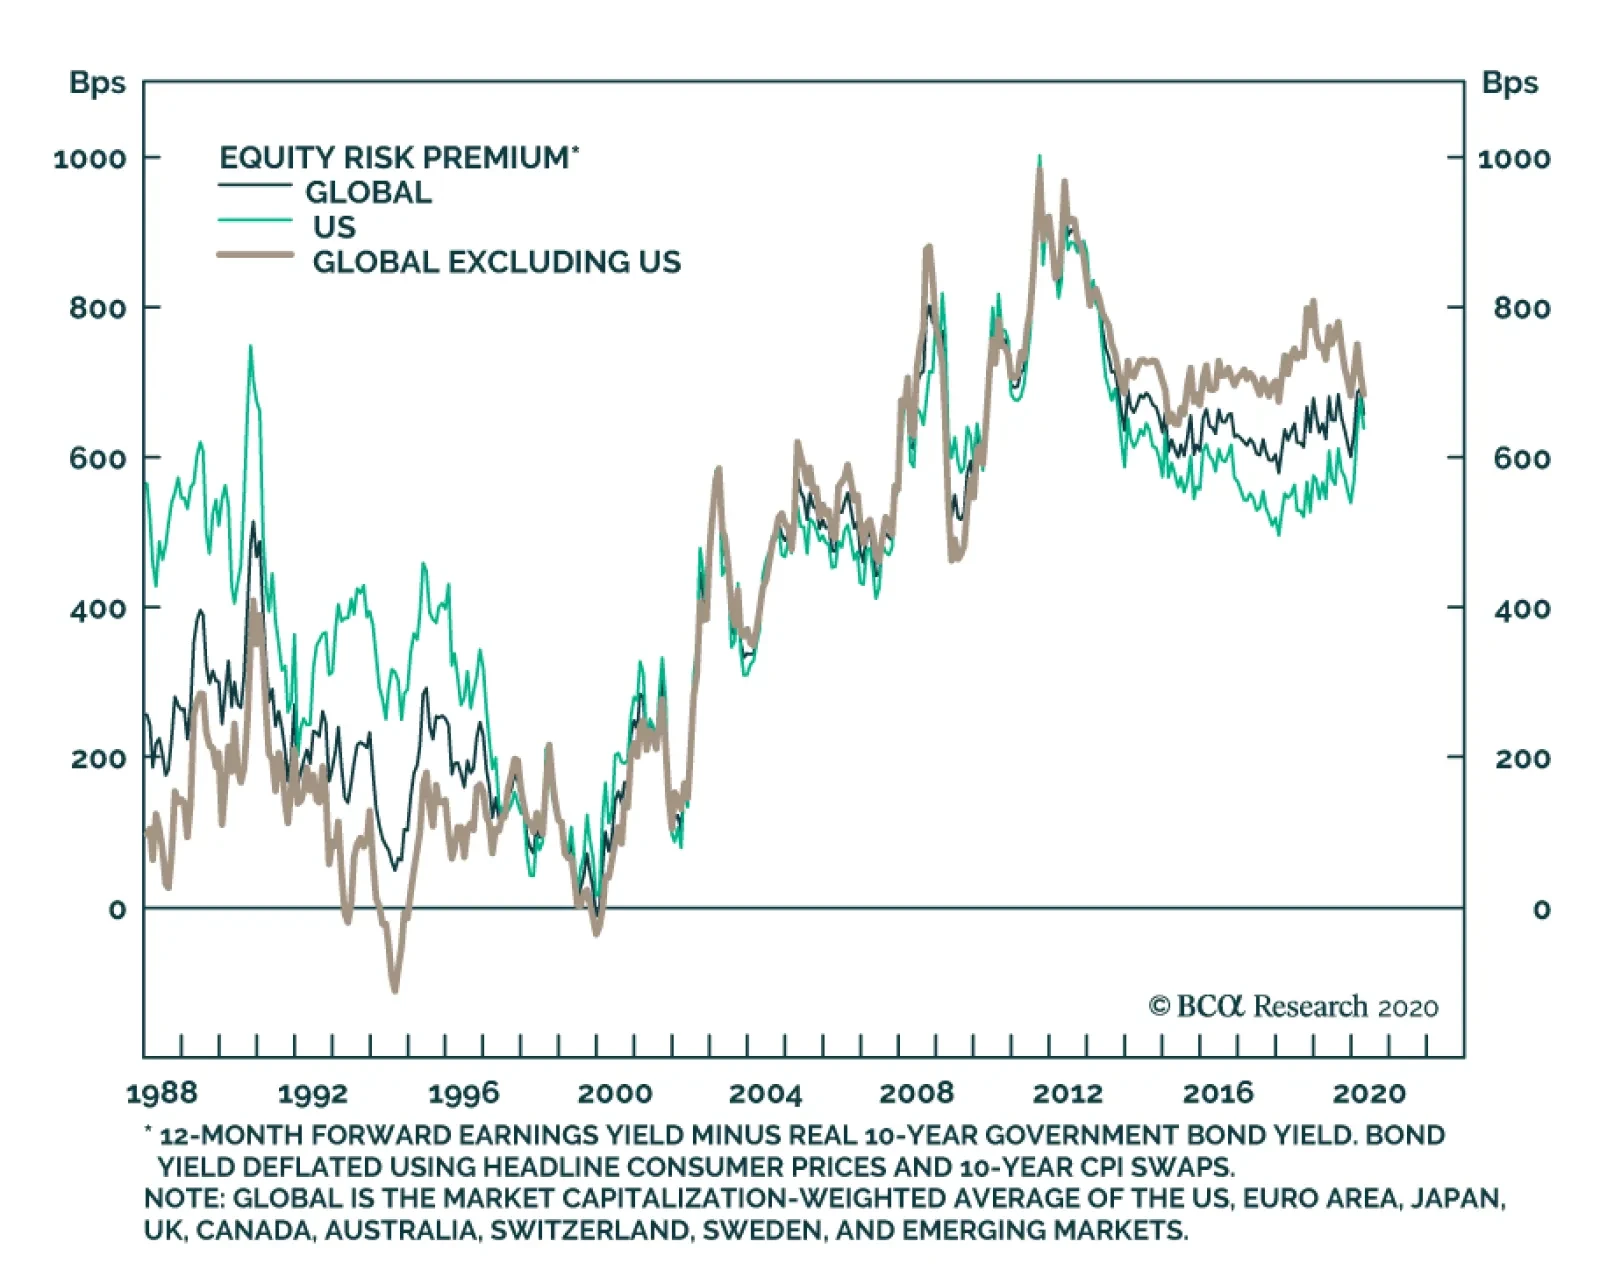
BCA Research's Global Investment Strategy service remains positive on stocks on a 12-month horizon but downgraded global equities to neutral on a tactical 3-month view. The equity risk premium is quite high at present, which warrants overweighting equities…