Global

Highlights Base metals are rebounding faster than oil in 2Q20, reflecting China’s first-in-first-out recovery from the global GDP hit caused by the COVID-19 pandemic (Chart of the Week). By 3Q20, the rebound in oil markets could be stronger than expected and surpass the base metals’ recovery, if the IMF’s latest EM GDP growth projections prove out. We examine a higher-growth scenario for non-OECD oil consumption – our proxy for EM demand – using the Fund’s projections. In it, EM oil consumption rises to 54.9mm b/d by 4Q20 and 56.4mm b/d by 4Q21. This would exceed our current estimates by 6.6% this year and 2.1% in 2021, if realized. Stronger EM consumption, coupled with global crude-oil production cuts would cause crude and product inventories to draw sooner and faster than expected, if these trends continue. Global policy uncertainty – economic and political – remains the critical risk to our metals and oil price outlooks, as it could retard a revival of growth and trade. The US and China appear to be on a collision course once again. Serious risks to global public health remain, particularly in light of a recently disclosed mutation to COVID-19. Feature Base metals are rebounding faster than oil in 2Q20, reflecting China’s first-in-first-out recovery from the global GDP hit caused by the COVID-19 pandemic. Prices for base metals likely will continue rebounding from the global hit to GDP caused by COVID-19 and its associated lockdowns, recovering more of the ground lost to the pandemic in 2Q20 than crude oil prices. This is largely a reflection of China’s first-in-first-out recovery from the global pandemic and the aggregate demand destruction following in its wake. This is the signal coming from our updated market-driven indicators shown in the Chart of the Week.1 China accounts for ~ half of the demand for refined base metals worldwide, and a comparable share of the supply side for refined metals and steel (Chart 2). Chart of the WeekBase Metals Rebounding Faster Than Crude Oil
Base Metals Rebounding Faster Than Crude Oil
Base Metals Rebounding Faster Than Crude Oil
We use principal components analysis to extract common factors driving industrial commodity prices in real time from trading markets, which allows us to get a preliminary estimate of the recovery in base metals and crude oil demand. The two indicators shown in the Chart of the Week use daily stock and commodity prices, and other daily economic data. These indicators are called the Metals Demand Component and the Oil Demand Component. The former is largely dependent on the recovery in China/EM industrial activity, and also affects all cyclical commodities, including oil. Chart 2China Dominates Base Metals Supply And Demand
First Metals Then Crude
First Metals Then Crude
Chart 3Policy Stimulus Will Restore Profitability In China
Policy Stimulus Will Restore Profitability In China
Policy Stimulus Will Restore Profitability In China
The base metals’ rebound likely will continue throughout 2H20 as China’s economic activity gradually normalizes, fiscal and monetary stimulus kick in, and firms’ profitability recovers (Chart 3). “China’s industrial sector should get a boost from an acceleration in infrastructure investment and producer prices should turn moderately positive later in Q3,” based on the analysis of our colleagues in BCA’s China Investment Strategy.2 A weaker USD will start showing up in stronger indications of global growth – particularly in the EM markets – which will reverse the downtrend in our data-driven indicators of economic activity (Chart 4). However, given the lags in the release of these data, this will take time. Currently, our Metals Demand Component suggests the trend in base metals demand is upward and established, while our Oil Demand Component is still quite volatile and not yet decisively upward. Nonetheless, our oil indicator does highlight what appears to be a bottom in oil demand. Chart 4A Weaker USD Will Reverse Lagging Indicators Of Activity
A Weaker USD Will Reverse Lagging Indicators Of Activity
A Weaker USD Will Reverse Lagging Indicators Of Activity
EM Demand Surge Will Revive Oil Prices The EM oil-demand growth forecast derived from the IMF’s GDP projections indicate growth could rise to as much as 54.9mm b/d by 4Q20 and 56.4mm b/d by 4Q21. This would exceed our current estimates by 6.6% this year and 2.1% in 2021, if realized. Over the short term, oil prices could diverge from demand until storage builds are contained and the market moves into a deficit. The logistics of moving and storing oil remains the primary driver of its price over the very short term, especially for landlocked crudes. The drain in storage could occur earlier than we expected in our forecast last month, if the IMF’s global growth trajectory play out in line with its latest projections.3 Using the Fund’s projections for EM GDP, we examine a scenario in which non-OECD oil demand grows significantly more than we estimated last month. Indeed, the EM oil-demand growth forecast derived from the IMF’s GDP projections indicate growth could rise to as much as 54.9mm b/d by 4Q20 and 56.4mm b/d by 4Q21. This would exceed our current estimates by 6.6% this year and 2.1% in 2021 (Chart 5), if realized. EM growth is the critical variable for global oil-demand growth, accounting for ~ 80% of global consumption growth in the past five years. As we’ve noted for some time, the massive fiscal and monetary stimulus being deployed globally will fuel the recovery of commodity demand (Chart 6). The oil-demand scenario driven by the IMF’s latest GDP projections, and the EIA’s April forecast share a common view of a sharp recovery in the level of non-OECD demand, with the former seeing demand destruction reversed by September, and the latter expecting EM consumption to return to pre-COVID-19 levels toward the end of this year, slightly ahead of us.4 Chart 5EM Oil Demand Could Surge On The Back Of Massive Global Stimulus
EM Oil Demand Could Surge On The Back Of Massive Global Stimulus
EM Oil Demand Could Surge On The Back Of Massive Global Stimulus
Chart 6Global Fiscal and Monetary Stimulus Will Surge In 2020 And 2021
First Metals Then Crude
First Metals Then Crude
A surge in EM oil-demand growth – should it play out as expected – will occur against the backdrop of sharply lower global production levels this year. OPEC 2.0 pledged to cut ~ 8mm b/d starting this month vs. its 1Q20 levels, with its putative leaders – KSA and Russia – accounting for ~ 1.5mm b/d and 2mm b/d, respectively, of the reductions. (Based on OPEC 2.0’s October 1, 2018, reference level – except for KSA and Russia, both of which are cutting from a nominal 11mm b/d level – the cuts amount to almost 10mm b/d for May-June, and 7.7mm b/d for 2H20).5 In addition, the US likely will lose close to 2.5mm b/d from involuntary cuts between now and the end of 2021 due to the global oil price collapse (Chart 7).6 Chart 7US Shale-Oil Output Could Fall ~ 2.5mm b/d
US Shale-Oil Output Could Fall ~ 2.5mm b/d
US Shale-Oil Output Could Fall ~ 2.5mm b/d
OPEC 2.0 Might Have To Lift Production The demand surge implied by the IMF’s expected EM GDP recovery this year and next almost surely would be met by higher output in OPEC 2.0 production. The demand surge implied by the IMF’s expected EM GDP recovery this year and next almost surely would be met by higher output in OPEC 2.0 production, to keep prices from charging ahead too sharply in 2H20 and in 2021. The increase in the coalition’s spare capacity – consisting of the production taken off the market through production cuts and the 2.5mm b/d or so that it had prior to the COVID-19-induced demand destruction – will allow OPEC 2.0 to quickly meet any supply shortfalls as demand recovers before the US shale-oil producers can ramp production. All the same, the market could experience episodic volatility on the upside, if our EM demand calculations based on IMF GDP projections and those of the EIA are correct. It is highly likely, in our view, OPEC 2.0 will be the direct beneficiary of the massive fiscal and monetary stimulus of the DM and EM economies– oil being a derived demand that depends on the income available to firms and households. This means the odds of seeing $80/bbl Brent is more likely than not next year: Importantly, EM and DM consumers will be better equipped to absorb higher oil prices with the massive stimulus sloshing around the global economy next year. For now, we are maintaining our expectation of $65/bbl average prices for Brent next year, but we will continue to watch EM GDP growth in upcoming World Bank and IMF research (Chart 8). Chart 8Upside Risks in Oil Prices As GDP Growth Prospects Improve
Upside Risks in Oil Prices As GDP Growth Prospects Improve
Upside Risks in Oil Prices As GDP Growth Prospects Improve
Oil Price Risks Abound An upside surprise in EM oil-demand growth – consistent with the IMF’s revised GDP projections – could cause us to increase our demand expectation when we update balances and forecasts this month. Two-way price risk abounds in the oil markets. Even if options volatility on the CBOE is considerably lower than its recent record-setting peak, it still is close to 100% on an annualized basis (Chart 9). On the upside, as we’ve discussed above, if EM GDP growth is in the neighborhood projected by the IMF, demand could surge, based on our calculations. We have no doubt OPEC 2.0 can cover any shortfall, but it can’t do it immediately, so we would expect episodic volatility this year and next. Chart 9Oil Price Risk Abounds
Oil Price Risk Abounds
Oil Price Risk Abounds
On the downside, the COVID-19 pandemic could enter a second wave just as governments around the world are removing lockdown orders and phasing in a return to normal commerce. Of particular note in this regard is the emergence of a mutation of the original strain of the COVID-19 virus that is more contagious, and now constitutes the dominant strain in the world. The mutated form of the virus appeared in Europe and quickly spread to the US east coast, and then the rest of the planet.7 Also, the risk that “animal spirits” will not re-emerge in businesses and consumers globally remains elevated. Despite the large increase in global money supply, confidence needs to be restored for the money multiplier to move up. In addition to that, signs of another round in the Sino-US trade war in the offing could restrain growth and trade. Bottom Line: Our base case remains a resumption in global growth in 2H20, with base metals recovering most of their lost ground in 2Q20 and oil following in 3Q20. An upside surprise in EM oil-demand growth – consistent with the IMF’s revised GDP projections – could cause us to increase our demand expectation when we update balances and forecasts this month. However, serious risks to global public health remain, and trade tensions between the US and China once again are percolating. Robert P. Ryan Chief Commodity & Energy Strategist rryan@bcaresearch.com Hugo Bélanger Associate Editor Commodity & Energy Strategy HugoB@bcaresearch.com Commodities Round-Up Energy: Overweight Refinery runs in the US collapsed by 25% this year in the wake of the COVID-19-induced economic shutdown. Still, WTI prices rose 30% this week – from a very low level – as oil supply in the US – and globally – is adjusting rapidly to lower demand (Chart 10). Wells shut-ins are accelerating throughout North America. In the Bakken Basin, shut-ins reportedly reached 400k b/d this week.8 Moreover, the effect of the 50% YTD decline in US rig count will be visible over the coming weeks. The rig count is now well below the level necessary to keep production flat. Precious Metals: Neutral Gold prices remained above $1,700/oz as of Tuesday’s close, supported by elevated economic uncertainty. Virus-related uncertainty will gradually wane as economies reopen. This could pull gold down temporarily as safe-asset demand is reduced. Nonetheless, our Geopolitical team believes risk and uncertainty will partly shift to the geopolitical arena in the run-up of the US election.9 Additionally, the massive stimulus by the US Fed and Treasury will become an important driver of the yellow metal’s price going forward. Gold will trend higher as US rates remain stuck at zero, as it did in 2008 (Chart 11). Ags/Softs: Underweight Following lockdown easing measures in different parts of the world, hopes of a rebound in ethanol demand helped push CBOT Corn futures 0.5% higher on Tuesday. Additionally, continuing drought conditions in Brazil will limit the country’s yields and support corn prices in the near term. Soybeans climbed 3¢/bu on Tuesday, backed by China’s booking of 378k tons of the oilseed as it seeks to fulfill the US trade deal obligations. Gains throughout corn and soybeans were mitigated by a strong planting progress as reported by the USDA. Wheat ended slightly higher after field assessments conducted by Oklahoma State University Extension projected the state harvest down by 13.5 Mn bushels year-on-year. Chart 10Crude Recouping Some Ground
Crude Recouping Some Ground
Crude Recouping Some Ground
Chart 11Fed Rates Stuck At Zero Will Push Gold Higher
Fed Rates Stuck At Zero Will Push Gold Higher
Fed Rates Stuck At Zero Will Push Gold Higher
Footnotes 1 Given the importance of the daily prices in these indicators, we are explicitly assuming trading markets are continually processing fundamental information on supply, demand, inventories, and financial and economic conditions in industrial commodity markets and reflecting them in prices. This is especially important when an exogenous event like the COVID-19 pandemic hits global markets. Market participants have to work out the implications of the shock and its resolution in real time, which can make for exceptionally volatile prices. Lags in the economic data provided by the likes of the World Bank, the IMF, EIA, IEA and OPEC make the time series we typically rely on to model fundamentals and their expected evolution less effective in estimating the current state of commodity markets. Their forecasts, however, remain extremely useful, as they are developed by analysts with particular expertise in global macroeconomic forecasting, in the case of the World Bank and IMF, and oil markets, in the case of the EIA, IEA and OPEC. 2 Please see A Slow And Rocky Path To Recovery published by BCA Research’s China Investment Strategy April 29, 2020. It is available at cis.bcaresearch.com. 3 Please see US Storage Tightens, Pushing WTI Lower for our most recent supply-demand balances and oil price forecasts, which were published April 16, 2020. We use the global growth forecasts of the IMF and the World Bank as inputs to our fundamental modeling to estimate oil demand. In particular, we’ve found a parsimonious relationships between OECD, non-OECD and world oil demand and DM and EM GDP. Chapter 1 of the Fund’s advance forecast was published last month in its World Economic Outlook under the title “The Great Lockdown.” 4 Assuming the Fund’s projections of EM GDP are approximately correct, the impact on oil demand is quite large as can be seen in the comparisons shown in Chart 5. However, the IMF’s estimate for oil prices is sharply below our estimate, which was made last month assuming lower levels of EM oil demand. We expect Brent crude oil prices to average $39/bbl this year and $65/bbl next year, vs. the Fund’s estimate of $35.61/bbl in 2020 and $37.87/bbl in 2021. The EIA’s estimate of non-OECD demand is comparable to our, as seen in Chart 6, but its price forecasts for this year and next – $33/bbl and $46/bbl – also are below ours. 5 Please see US Storage Tightens, Pushing WTI Lower, where we outline OPEC 2.0’s cuts. 6 Please see our April 30 report entitled Stand By For Heavy Rolls: June WTI Could Go Below $0.00/bbl for additional discussion. 7 Please see The coronavirus has mutated and appears to be more contagious now, new study finds published by cnbc.com May 5, 2020. 8 Please see 'Like watching a train wreck': The coronavirus effect on North Dakota shale oilfields published by reuters.com May 4, 2020. 9 Please see #WWIII published by BCA Research’s Geopolitical Strategy May 1, 2020. It is available at gps.bcaresearch.com. Investment Views and Themes Recommendations Strategic Recommendations Tactical Trades Trade Recommendation Performance In 2020 Q1
First Metals Then Crude
First Metals Then Crude
Commodity Prices and Plays Reference Table Trades Closed In 2020 Summary of Closed Trades
First Metals Then Crude
First Metals Then Crude
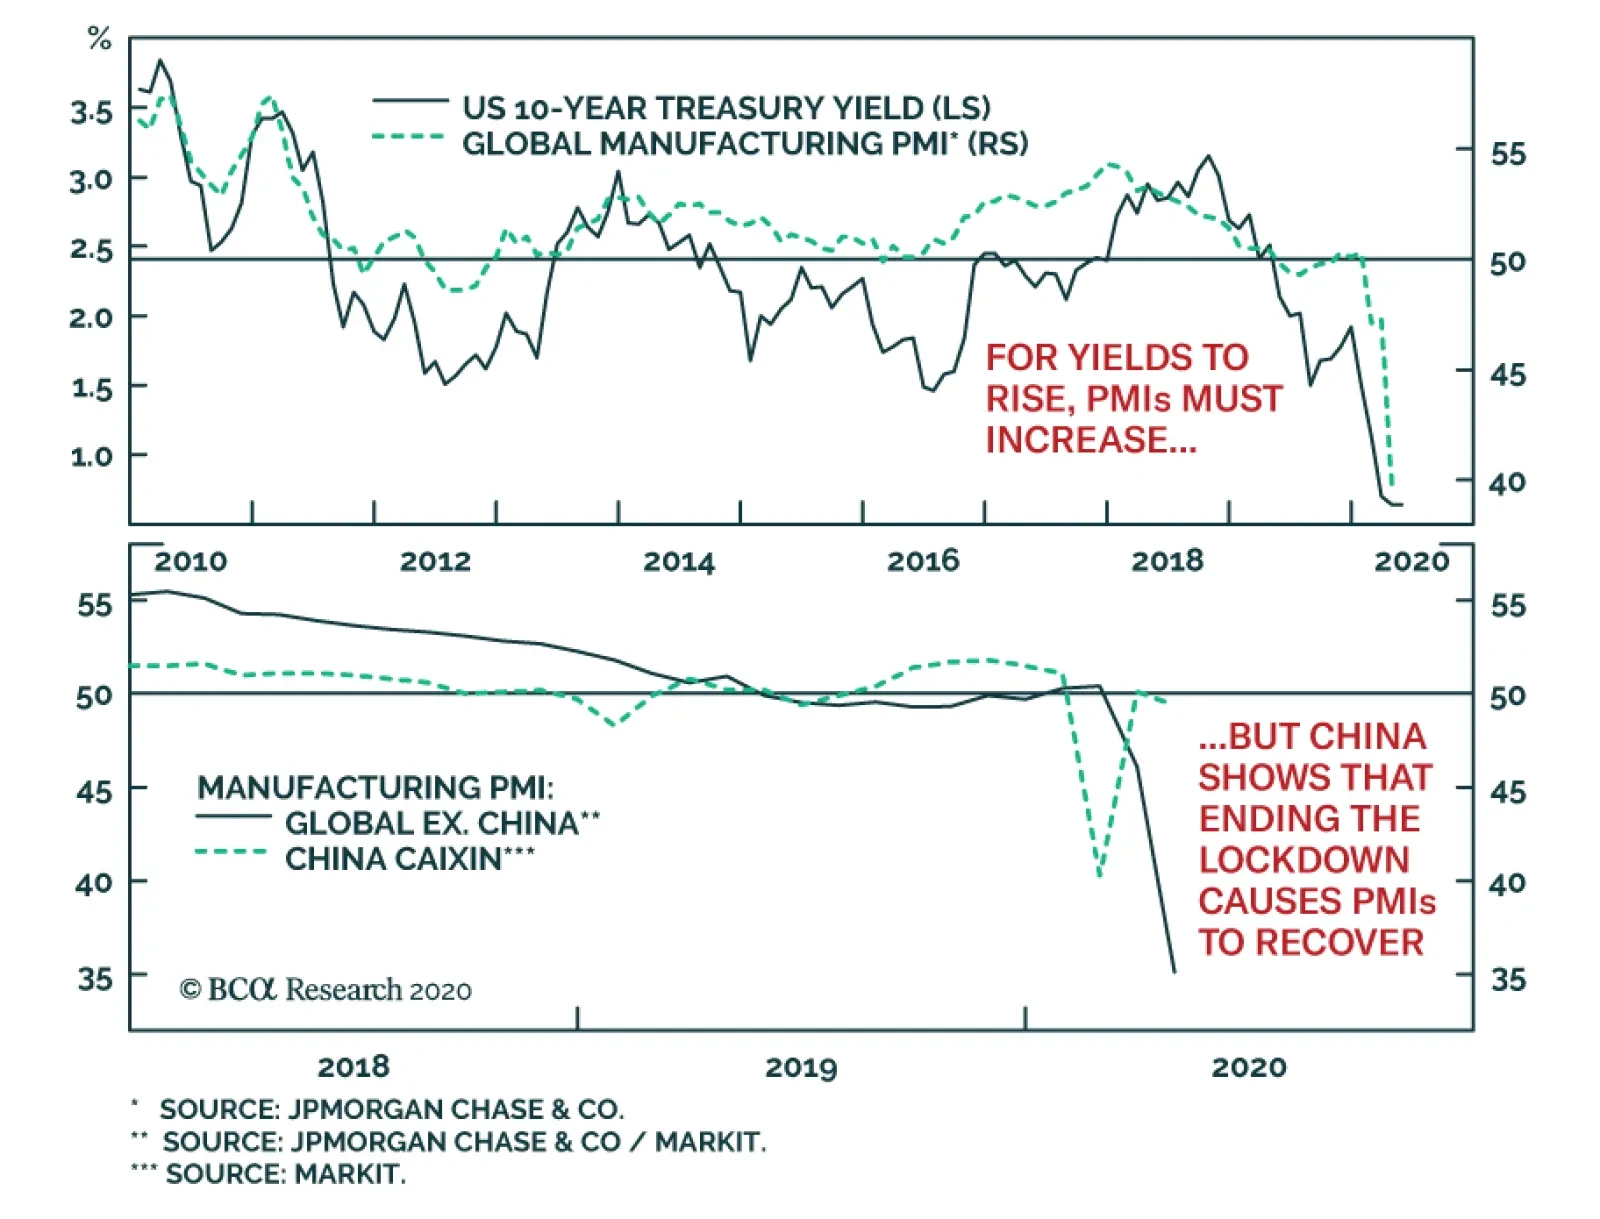
The Global Manufacturing PMI fell to 39.8 in April, an all-time low. This is a direct consequence of the lockdowns implemented around the world to fight COVID-19. The economic weakness directly caused the collapse in yields around the world, including the US.…
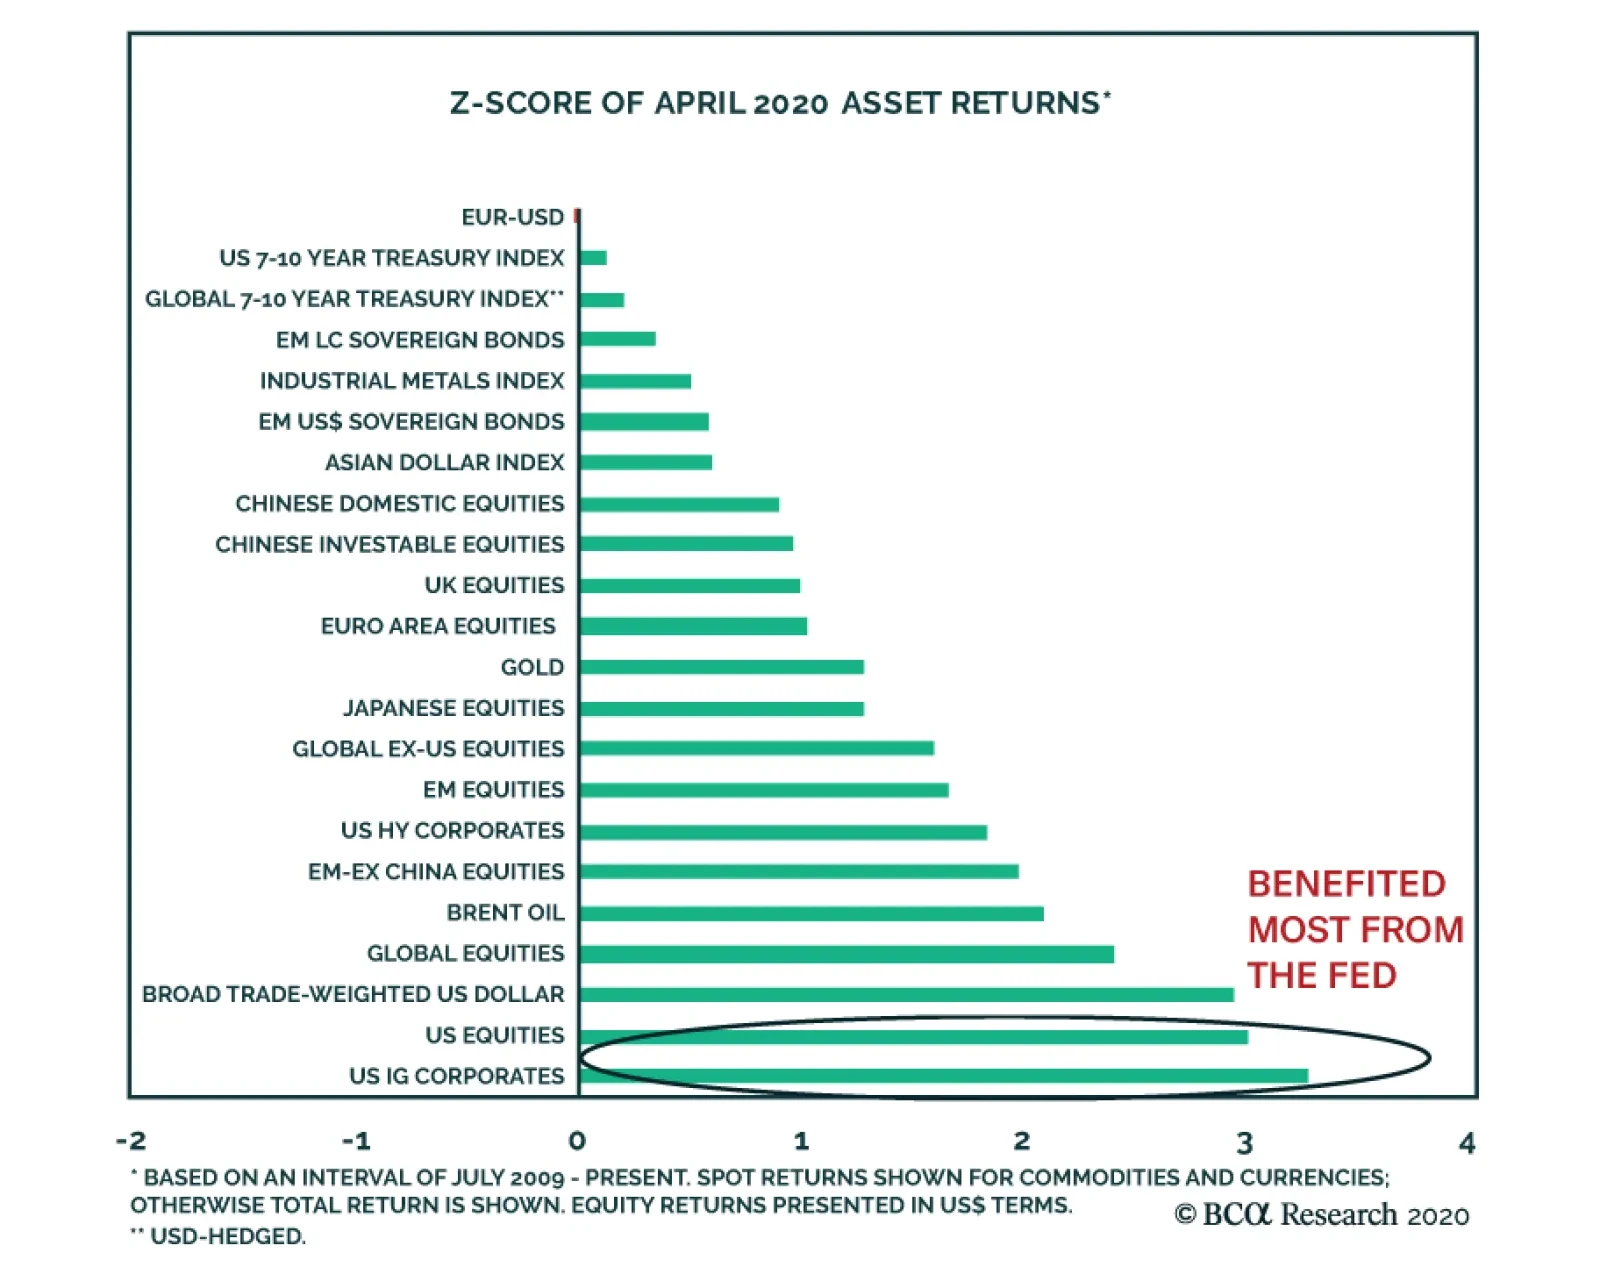
In the month of April, the performance of markets strongly bore the imprint of central banks' actions. The Fed was the most aggressive central bank in the world, thus assets directly exposed to the Fed’s programs experienced the largest abnormal returns. For…
Highlights Our COVID Unrest Index reveals that Turkey, the Philippines, Brazil, and South Africa are the major emerging markets most at risk of significant social unrest. China, Russia, Thailand, and Malaysia are the least at risk – in the short run. Stay tactically overweight developed market equities relative to emerging markets. Go tactically short a basket of “EM Strongmen” currencies relative to the EM currency benchmark. Short the rand as well. Feature Chart 1Stimulus-Fueled Markets Ignore Reality
Stimulus-Fueled Markets Ignore Reality
Stimulus-Fueled Markets Ignore Reality
With global fiscal stimulus now estimated at 7% of GDP, and central banks in full debt monetization mode, the S&P 500 is at 2940 and rallying toward 3000. It is not only largely ignoring the global pandemic and recession. It is as if the trade war never occurred, China is not shrinking, and WTI crude oil prices have never gone negative (Chart 1). In recent reports we have argued that “geopolitics is the next shoe to drop” – specifically that President Trump’s electoral challenges and the vulnerability of America’s enemies make for a volatile combination. But there are also more mundane geopolitical consequences of the recession that asset allocators must worry about. Such as government change and regime failure. COVID-19 and government lockdowns have exacted a heavy economic toll on households and political systems now face heightened risk of unrest. In many cases emerging market countries were already vulnerable, having witnessed outbreaks of civil unrest in 2019. Fear of contracting the virus, plus various isolation measures, will tend to suppress street movements in the near term. This year’s “May Day” protests will be minor compared to what we will see in coming years. But significant unrest will sprout as the containment measures are relaxed and yet economic problems linger. And bear in mind that the biggest bouts of unrest in the wake of the 2008 crisis did not occur until 2011-13. In this report we introduce our “COVID Unrest Index” for emerging economies, which shows that Turkey, the Philippines, Brazil, and South Africa face substantial unrest that can trigger or follow upon market riots. Introducing The COVID Unrest Index At any point in time, social and political instability depends on economic conditions such as unemployment and inflation, structural problems such as inequality, and governance issues such as corruption. In the post-COVID recessionary environment, additional factors such as health care capacity also carry weight. To identify markets that are most likely to face unrest, we created a COVID Unrest Index (Table 1). The overall ranking is determined by five factors: Table 1Our COVID-19 Social Unrest Index
Where Will Social Unrest Explode?
Where Will Social Unrest Explode?
Initial Economic Conditions: A proxy for economic policy’s ability to respond to the crisis. This factor includes the fiscal balance and sovereign debt – which determine "fiscal space" – as well as the current account balance, public foreign currency debt as a percent of GDP, foreign debt obligations as a percent of exports, and foreign funding requirements as a percent of foreign currency reserves. Health Capacity And Vulnerability: A proxy for both a population’s vulnerability to COVID and its health care capabilities. Vulnerability to the pandemic is captured by COVID-19 deaths per million, share of the population over the age of 65, and likelihood of dying from an infectious disease. Health infrastructure is measured by life expectancy at age 60 and health expenditure per capita. Economic Vulnerability To Pandemic: A proxy for the magnitude of the COVID-specific shock to the individual economy. This factor takes into account a country’s dependence on revenue from tourism and its dependence on inflows from remittances. Household Grievances: A proxy for economic hardship faced by households, captured by the GINI index, which measures income inequality, and the “misery index,” which consists of the sum of inflation and unemployment. Governance: A proxy the captures the quality of governance from the World Bank’s World Governance Indicators – specifically the ability to participate in selecting government, likelihood of political instability or politically-motivated violence, and perceptions of corruption. The country ranking for the COVID Unrest Index is constructed by first standardizing the variables, then transforming them such that higher readings are associated with more favorable conditions. Finally, the five factors are averaged for each country to produce individual scores. Turkey: A Shambles On Europe’s Doorstep Turkey is the most likely to face mass discontent in the near future. It has all the ingredients for unrest: poor standing across all factors and the weakest governance score. From an economic standpoint, its foreign currency reserves are critically low while its foreign debt obligations are relatively elevated (Chart 2). This spells trouble for the lira, which will only further add to the grievances of households already burdened by a high misery index. Chart 2AEmerging Markets Face Debt Troubles Even With The Fed’s Help
Where Will Social Unrest Explode?
Where Will Social Unrest Explode?
Chart 2BEmerging Markets Face Debt Troubles Even With The Fed’s Help
Where Will Social Unrest Explode?
Where Will Social Unrest Explode?
President Erdogan has rejected suggestions of aid from the IMF. Fearing a revival of the main opposition Republican People’s Party (CHP), especially in the wake of his party’s losses in the 2019 municipal elections, he has banned cities that are run by the CHP from raising funds toward virus response efforts. This right is reserved only for cities run by his Justice and Development Party (AKP). Given that Erdogan does not face reelection until 2023, the move to suppress the opposition reflects general weakness and portends a long period of suppression and political conflict. Erdogan’s handling of the outbreak has also seen its share of failures. While he has opted for only a partial lockdown, a 48-hour full lockdown was announced on April 10 only hours in advance, resulting in crowds of people rushing to purchase necessities. Interior minister Suleyman Soylu tried to resign, but was prevented by Erdogan, breeding speculation about Soylu’s motives. Soylu may have sought to distance himself from the president’s handling of the crisis to preserve his image as a potential successor to the president, rivaling Erdogan’s son-in-law, Finance Minister Berat Albayrak. The point is that Erdogan is already facing greater political competition. Former ally and minister of foreign affairs and economy Ali Babacan recently launched a new party, the Democracy and Progress Party (DEVA). He has criticized the government’s stimulus package and decision to hold back on requesting IMF aid. Erdogan is also challenged by his former prime minister Ahmet Davutoglu, who broke away from the AKP to form his own Future Party late last year. The obvious risk to Erdogan is that these opposition groups create a viable political alternative that voters can flock to – and they could form a united front amid national economic collapse. Brazil and South Africa have large twin deficits. Erdogan’s response, repeatedly, has been to harden his stance and double down on populist and unorthodox policies. These have not helped his popular standing, as we have chronicled over the past several years. At home his policies are generating excessive money supply and a large budget deficit (Chart 3). Abroad he has gotten the military more deeply involved in Syria, Libya, and maritime conflicts. The result is stagflation with the potential for negative political surprises both at home and abroad. Chart 3Twin Deficits Flash Red For Emerging Markets
Where Will Social Unrest Explode?
Where Will Social Unrest Explode?
Chart 4Turkish Political Risk Has Room To Rise
Turkish Political Risk Has Room To Rise
Turkish Political Risk Has Room To Rise
Our GeoRisk Indicator for Turkey shows that risks are rising as the lira falls relative to its underlying economic fundamentals (Chart 4). But it will fall further from here. Positive signs would be accepting IMF aid, cutting off the foreign adventures, selling off government assets, and restoring fiscal and monetary orthodoxy. But it is just as likely that Erdogan resorts to even more desperate moves, including a greater confrontation with Greece and Europe by encouraging more refugee flow-through into Europe. Erdogan has always been more popular than his Justice and Development Party, but after ruling since 2003, and now facing a nationwide crisis, his rule is increasingly in jeopardy. His scramble to survive the election in 2023 will be all the more dangerous to governance. Bottom Line: We booked gains on our short lira trade earlier this year but the fundamental case for the short remains intact, so we include it in our short “EM Strongmen” currency basket discussed at the end of this report. The Philippines: Yes, Governance Matters The Philippines is next at risk of instability. It is particularly vulnerable to a pandemic recession due to its dependence on remittance inflows and tourism for foreign currency (Chart 5) as well as its poor health infrastructure (Chart 6). While it is not in a vulnerable position in terms of foreign currency obligations, its double deficit (see Chart 3) means that significant stimulus will come at the expense of the currency. Chart 5Pandemics Hurt Tourism, Recessions Hurt Remittances
Where Will Social Unrest Explode?
Where Will Social Unrest Explode?
Chart 6AEmerging Markets Face COVID-19 Without Developed Market Health Systems
Where Will Social Unrest Explode?
Where Will Social Unrest Explode?
Chart 6BEmerging Markets Face COVID-19 Without Developed Market Health Systems
Where Will Social Unrest Explode?
Where Will Social Unrest Explode?
President Rodrigo Duterte remains extremely popular even though the Philippines is suffering one of the worst outbreaks in Asia. Socioeconomic Planning Secretary Ernesto Pernia has resigned from his post due to disagreement over containment measures. Pernia’s vision of a partial lockdown contrasted with Duterte’s militarized containment approach – which includes the granting of extraordinary emergency powers.1 Meanwhile the lockdowns imposed on the capital and southern Luzon provinces will remain in place until at least May 15 after which Duterte indicated it will be gradually lifted. While Duterte will in all likelihood remain in power until the end of his term in 2022, he is using his popularity to secure a preferred successor. He is less capable of getting through a constitutional amendment that extends presidential term limits – he has the votes in Congress, but a popular referendum is not a sure bet given the economic crisis. He is widely believed to be grooming his daughter Sara or former aide Senator Bong Go for the presidential post, with speculation that he may run as vice president on the same ticket. Turkey and the Philippines have poor governance, putting them alongside international rogue states. Any hit to his popularity that upends his succession plan poses existential risks to Duterte as he has racked up many influential enemies and could face criminal charges if an opposing administration succeeds him. This risk will likely induce him to tighten control further in an attempt to maintain order and crack down on dissent. Autocratic moves will weigh on the Philippines’ governance score which is already among the poorest in our pool of emerging countries (Chart 7). Chart 7Governance Matters For Investors Over The Long Run
Where Will Social Unrest Explode?
Where Will Social Unrest Explode?
Chart 8Duterte Signaled Top In Philippine Equity Outperformance
Duterte Signaled Top In Philippine Equity Outperformance
Duterte Signaled Top In Philippine Equity Outperformance
Does governance matter? Yes, at least in the case of strongmen in regimes with weak institutions. Look at Philippine equities relative to emerging market equities since Duterte first rose onto the scene, prompting us to go short (Chart 8). Duterte obliterated the country’s current account surplus just as we expected and its currency has suffered as a result. For now, the Philippines’ misery index is not yet at a level that strongly implies widespread unrest (Chart 9), but the general context does, especially if constitutional maneuvers backfire. At 4% of GDP, the proposed COVID-19 stimulus package comes on top of the fact that Duterte’s “build, build, build” infrastructure plan already required massive fiscal spending. But the weak currency and higher unemployment will increase the misery index and chip away at the president’s popularity. If the people turn against Duterte, they will remove him in a “people power” movement, as with previous leaders. Chart 9Inequality, Unemployment, And Inflation Are A Deadly Brew
Where Will Social Unrest Explode?
Where Will Social Unrest Explode?
The Philippines is also highly vulnerable to the emerging cold war between the US and China. Administrations are now flagrantly aligned with one great power or the other. This means that foreign meddling should be expected. Duterte could get Chinese assistance, which erodes Philippine sovereignty and its security alliance with the United States, or he could eventually suffer from anti-Chinese sentiment, which invites Chinese pressure tactics. Either course will inject a risk premium over the long run. The US is popular in the Philippines, especially with the military, and overt Chinese sponsorship will eventually trigger a backlash. Bottom Line: The lack of legislative or popular constraints on Duterte makes it more likely that he will undertake autocratic moves to stay in power – economic orthodoxy will suffer as a result. The Philippines will also see a sharp increase in policy uncertainty directly as a consequence of the secular rise in US-China tensions in the coming months and years. Brazil: Will Bolsonaro Become A Kamikaze Reformer? Chart 10Bolsonaro’s Handling Of Pandemic Gets Panned
Where Will Social Unrest Explode?
Where Will Social Unrest Explode?
In Brazil, President Jair Bolsonaro’s “economy first” approach and dismissal of the pandemic as a “little flu” has not improved his popularity (Chart 10). His approval rating is languishing in the 30% range, lower than all modern presidents save the interim government of Michel Temer in the previous episode of the country’s ongoing national political crisis. The pandemic, and Bolsonaro’s response, have fractured his cabinet and precipitated a new episode in the crisis. The clash between the president and the country’s state governors and national health officials, who enjoy popular support, has led to the dismissal of Health Minister Luiz Henrique Mandetta and the resignation of the popular Justice Minister Sergio Moro. We have highlighted Moro as a linchpin of Bolsonaro’s anti-corruption credibility and hence one of the three pillars of his political capital. This pillar is now cracking, making Bolsonaro’s administration less capable going forward. Bolsonaro’s firing of the head of the federal police, Mauricio Valeixo, the catalyst for Moro’s resignation, has led to a Supreme Court authorization for an investigation into whether Valeixo’s dismissal can be attributed to corruption or obstruction of justice. A guilty verdict could force Congress to take up impeachment, an issue on which Brazilians are split. Earlier this week the president was forced to withdraw the appointment of Alexandre Ramagem – a Bolsonaro family friend – as the new head of the federal police after a minister of the supreme federal court blocked the appointment due to his close personal relationship with the president. Brazil’s structural reform and fiscal discipline are on the backburner given the need for massive emergency spending to shore up GDP growth. Reforms are giving way to the “Pro-Brazil Plan,” which seeks to restore the economy through investments in infrastructure. The absence of the economy minister, Paulo Guedes, from the unveiling of this plan has led to speculation over Guedes’ future. Guedes is the key reformer in Bolsonaro’s cabinet and as important for the administration’s economic credibility as Moro was for its anti-corruption credibility. Brazil’s macro context is egregious. Its large public debt load – mostly denominated in local currency – raises the odds that the central bank will monetize the debt at the expense of the exchange rate, which has already weakened since the beginning of the year. Moreover, Brazil’s ability to pay near term debt service obligations is in a precarious position as the pullback in export revenues will weigh on its ability to service debt (see Chart 2). Our Emerging Markets Strategy estimates that Brazil is spending 16% of GDP on fiscal measures that will push gross public debt-to-GDP ratio well above 100% by the end of 2020 (Chart 11). Chart 11Highly Indebted Emerging Markets Have Limited Fiscal Room For Maneuver
Where Will Social Unrest Explode?
Where Will Social Unrest Explode?
Given that Brazil already suffers from a relatively elevated misery index (see Chart 9), these macro challenges will translate into greater pain for Brazilian households and hence a political backlash down the road. The three pillars of Bolsonaro’s political capital have cracked: order, anti-corruption, and structural reform. The hope for investors interested in Brazil now rests on Bolsonaro becoming a kamikaze reformer. That is, after the immediate crisis subsides, his low popularity may force him to try painful structural reforms that no leader with political aspirations would attempt. So far he is taking the populist route of short-term measures to try to stay in power. Chart 12Bolsonaro's Meltdown Portends Melt-Up In Brazilian Political Risk
Bolsonaro's Meltdown Portends Melt-Up In Brazilian Political Risk
Bolsonaro's Meltdown Portends Melt-Up In Brazilian Political Risk
Another sign of worsening governance is that military influence in civilian politics is partially reviving. This element of the country’s recent political turmoil has flown under the radar but will become more prominent if the administration falls apart and the only officials with sufficient credibility to fill the vacuum are military officials such as Vice President Hamilton Mourão. Financial markets may force leaders to make tough decisions to stave off a debt crisis, but risk assets will sell in the meantime as the lid on the country’s political risk has blown off and currency depreciation is the most readiest way to boost nominal GDP growth. Our political risk gauge will continue spiking – this reflects currency weakness relative to fundamentals (Chart 12). Bottom Line: Last fall we argued that Brazil was “just above stall speed” and that we would give the Bolsonaro administration the benefit of the doubt if it maintained three pillars of political capital: civil order, corruption crackdown, and structural reform. All three are collapsing amid the current crisis. As yet there is no sign that Bolsonaro is taking the “kamikaze reform” approach – that may be a positive catalyst but would require his administration to break down further. South Africa: Quantitative Easing Comes To EM South Africa faces an 8%-10% contraction in growth for 2020 and President Cyril Ramaphosa has overseen a large monetary and fiscal stimulus. The South African Reserve Bank has committed to quantitative easing in a bid to boost liquidity in the local financial market. South Africa’s highly leveraged households and those who mostly participate in the formal economy will find relief in lower debt-servicing costs and better access to credit. However, the large informal economy, and the rising number of unemployed, will not reap the same benefit from accommodative measures. This last group will benefit more from fiscal policy measures, such as social grants to low-income households. Ramaphosa recently announced a fiscal spending package totaling R500 billion, or 10% of GDP. Social grants to the poor and unemployed are all set to increase, which should help reduce the economic burden low-income households will face over the short term. The problem is that South Africa is extremely vulnerable to this crisis. Well before COVID the country suffered from low growth, persistently high unemployment, rising debt levels, and an increasing cost of social grants. The pandemic has increased dependency on these grants. South Africa is the most unequal society in the world (Chart 9 above) and runs large twin deficits on its fiscal and current accounts (see Chart 3). As the government’s financing needs rise, its ability to keep providing to low-income households will diminish. Yet the ruling African National Congress (ANC) is required to keep up social payments to stave off discontent and maintain its voter base – which consists of poor, mostly rural voters. The ANC must decide whether to implement stricter austerity measures after the immediate crisis to contain the fiscal fallout, which will bring unrest forward, or continue on an unsustainable path and face a market revolt. The latter option is clear from the decision to embrace quantitative easing, which further undermines the currency. Political pressure is mostly stemming from the left-wing – the Economic Freedom Fighters – which prevents Ramaphosa from taking a hard line on economic and fiscal policy. Bottom Line: There have been isolated protests across the country against the government’s draconian lockdown, and social grievances have the potential to boil over in the coming years given the long rule of the ANC and the country’s dire economic straits. Investment Implications It is too soon to buy into risky emerging market assets at a time when a deep recession is spreading across the world, extreme uncertainty persists over the COVID-19 pandemic, and the political and geopolitical fallout is transparently negative for major emerging markets. Remain overweight developed market equities relative to emerging market equities, at least over a tactical (three-to-six month) time horizon. Emerging market losers are countries with poor macro fundamentals, weak health care systems, specific competitive disadvantages during a global pandemic, high levels of inflation and unemployment, and ineffective social and political institutions. Turkey, the Philippines, and Brazil rank high on our list both because of their problems and because they are major markets. Chart 13Short Our 'EM Strongman' Currency Basket
Short Our 'EM Strongman' Currency Basket
Short Our 'EM Strongman' Currency Basket
Not coincidentally these countries each have “strongman” leaders who have pursued unorthodox polices and ridden roughshod over institutional checks and balances. In each case, the leader is doubling down on populism while exacerbating structural weaknesses that already existed. Apparently greater financial punishment is necessary before policies are adjusted and buying opportunities emerge. Thus we recommend investors short our “EM Strongman Basket” consisting of the Turkish lira, the Brazilian real, and the Philippine peso, relative to the EM currency benchmark, over a tactical horizon. These currencies outperformed the EM benchmark until 2016 when they began to underperform – a trend that looks to continue (Chart 13). These leaders could get away with a lot more during a global bull market than during a bear market. It will take time for Chinese and global growth to revive this year. And their policies suggest bad news will precede good news. We would also recommend tactically shorting the South African rand on the same basis. While Russia, China, and Thailand also have strongman leaders, their countries have much better fundamentals, as our COVID Unrest Index shows. However, we do not have a bright outlook for these countries’ political stability over the long run. Russia, like all oil producers, stands to suffer in this crisis, despite its positive score on our index. In a previous report, “Drowning In Oil,” we highlighted how the petro-states face serious risks of government change, regime failure, and international conflict. This is clear with Iran and Venezuela in the above charts, and also includes Iraq, Algeria, Angola, and Nigeria. Our preferred emerging markets – from the point of view of political risk as well as macro fundamentals – are Thailand, Malaysia, South Korea, and Mexico. We warn against Taiwan due to geopolitical risk, although its fundamentals are positive. We are generally constructive on India, but it is susceptible to unrest, which we will assess in future reports. Roukaya Ibrahim Editor/Strategist Geopolitical Strategy roukayai@bcaresearch.com Matt Gertken Vice President Geopolitical Strategist mattg@bcaresearch.com Footnotes 1 On April 16, Duterte ordered quarantine violators be arrested without warning. According to the UN, over one hundred thousand people have been arrested for violating curfew orders. The Philippines along with China, South Africa, Sri Lanka, and El Salvador were singled out by the UN High Commissioner for Human Rights are using unnecessary force to enforce the lockdowns and committing human rights violations in the veil of coronavirus restrictions. Duterte’s greenlight on a “shoot to kill” order against those participating in protests in violation of lockdown followed small-scale demonstrations in protest of Duterte’s handling of COVID-19.
GAA DM Equity Country Allocation Model Update The GAA DM Equity Country Allocation model is updated as of April 30, 2020. The model has not made significant changes this month. Now Spain, Australia, Sweden and the US are the top four overweight countries, while Japan, the UK, France and Switzerland remain the four underweight countries, as shown in Table 1. Table 1GAA DM Model Vs. MSCI World
GAA Quant Model Updates
GAA Quant Model Updates
As shown in Table 2 and Charts 1, 2 and 3, the overall model outperformed the MSCI World benchmark in April by 105 bps. The Level 1 model outperformed by 32 bps because of the overweight in the US. The Level 2 model outperformed by 241 bps thanks to the overweight of Australia and Canada, and the underweight in Japan, the UK, France and Switzerland. Since going live, the overall model has outperformed by 105 bps, with 135 bps of outperformance by the Level 2 model, and 29 bps of outperformance from the Level 1. Chart 2Performance (Total Returns In USD %)
GAA Quant Model Updates
GAA Quant Model Updates
Chart 1GAA DM Model Vs. MSCI World
GAA DM Model Vs. MSCI World
GAA DM Model Vs. MSCI World
Chart 2GAA US Vs. Non US Model (Level 1)
GAA US Vs. Non US Model (Level 1)
GAA US Vs. Non US Model (Level 1)
Chart 3GAA Non US Model (Level 2)
GAA Non US Model (Level 2)
GAA Non US Model (Level 2)
For more on historical performance, please refer to our website https://www.bcaresearch.com/site/trades/allocation_performance/latest/G…. For more details on the models, please see Special Report, “Global Equity Allocation: Introducing The Developed Markets Country Allocation Model,” dated January 29, 2016, available at https://gaa.bcaresearch.com. Please note that the overall country and sector recommendations published in our Monthly Portfolio Update and Quarterly Portfolio Outlook use the results of these quantitative models as one input, but do not stick slavishly to them. We believe that models are a useful check, but structural changes and unquantifiable factors need to be considered as well when making overall recommendations. GAA Equity Sector Selection Model The GAA Equity Sector Model (Chart 4) is updated as of April 30, 2020. Chart 4Overall Model Performance
Overall Model Performance
Overall Model Performance
The model’s relative tilts between cyclicals and defensives have changed compared to last month. The model turned negative on cyclical sectors in the beginning of March as the COVID-19 crisis intensified and growth indicators deteriorated. Throughout March, April and now May, the model continues to tilt towards defensive sectors. This has helped mitigate the shortfall in early March. However, that came at a cost as the model underperformed the benchmark by 33 basis points over the past month. The global growth proxy used in our model remains negative. This will continue to make the model's positioning focused on less cyclical sectors. The momentum component led the model to overweight Consumer Discretionary over the past month at the expense of Utilities. The unprecedented global monetary measures taken by global central banks should keep the liquidity component favouring a mixed bag of cyclical and defensive sectors. The valuation component remains muted across all sectors except Energy. However, we continue to highlight that the Info Tech’s valuation component has broken into overweight territory (yet the model awaits a downwards confirming momentum signal to recommend an underweight). The model is now overweight four sectors in total, two cyclical sector versus two defensive sectors. These are Information Technology, Consumer Discretionary, Consumer Staples, and Health Care. For more details on the model, please see the Special Report “Introducing the GAA Equity Sector Selection Model”, dated July 27, 2016, as well as the Sector Selection Model section in the Special Alert “GAA Quant Model Updates,” dated March 1, 2019 available at https://gaa.bcaresearch.com. Table 3Overall Model Performance
GAA Quant Model Updates
GAA Quant Model Updates
Table 4Current Model Allocations
GAA Quant Model Updates
GAA Quant Model Updates
Xiaoli Tang Associate Vice President xiaoliT@bcaresearch.com Amr Hanafy Senior Analyst amrh@bcaresearch.com
Feature Global equities have seen an astonishing rally since mid-March, rising by 28%. This leaves them only 13% below their level at the beginning of the year. This is particularly remarkable given the unprecedented decline in economic activity with, for example, US GDP shrinking by an annualized 4.8% quarter-on-quarter in Q1, and the consensus forecasting it to fall by as much as 30% in Q2. Given this, risk assets are pricing in a highly optimistic trajectory over the coming months: a rapid return to normalcy, a V-shaped economic recovery, and minimal side-effects from the sudden stop to the world economy. In our Q2 Quarterly, we wrote we would turn more cautious if the S&P 500 moved quickly above 2,750.1 With it now at 2910, we are therefore lowering our recommendation on global equities on a 12-month horizon from Overweight to Neutral. The balance of probabilities – and the possibility of a second wave of the pandemic, rising corporate defaults, and problems among EM borrowers – simply does not justify an outright risk-on stance. Bear markets typically end 3-4 months before the economy bottoms (Table 1). If March was the low for stocks, therefore, this implies that the recession will end in June or July. BCA Research’s view is that the recovery is more likely to be U-shaped than V-shaped. Table 1Stocks Bottom On Average 3-4 Months Before The Recession Ends
Monthly Portfolio Update: The Balance Of Probabilities
Monthly Portfolio Update: The Balance Of Probabilities
Chart 1New COVID-19 Cases Have Peaked
New COVID-19 Cases Have Peaked
New COVID-19 Cases Have Peaked
What triggered the rally? Most notably, it anticipated a peaking of new COVID-19 cases in the world outside China (Chart 1). Several countries, notably Spain and Italy, have already felt able to ease quarantine rules, and others will do so during May. This raises the possibility that the pandemic will largely be over by July (except perhaps in a few developing countries, such as Brazil, where strict containment was shunned). The rally was fueled by unprecedented fiscal and monetary measures taken by the authorities everywhere. In the US, for example, the various new Federal Reserve liquidity programs add up to $4.2 trillion (20% of GDP) (Chart 2). The balance-sheets of major global central banks, particularly the Fed's, have ballooned in just a few weeks (Chart 3). As a result, US money supply and dollar liquidity have soared (Chart 4). Normally, when there is a flood of liquidity over and above what is needed to fund the real economy, that excess liquidity flows into asset markets, weakens the dollar, and boosts commodities and Emerging Markets. But these are not normal times. Liquidity injections amid deteriorating economic conditions cushion the downside but do not necessarily improve the outlook immediately – as we witnessed in 2007-2008. Chart 2Multiple New Stimulus Programs…
Monthly Portfolio Update: The Balance Of Probabilities
Monthly Portfolio Update: The Balance Of Probabilities
Chart 3...Made Central Bank Balance-Sheets Balloon...
...Made Central Bank Balance-Sheets Balloon...
...Made Central Bank Balance-Sheets Balloon...
Chart 4...And Dollar Liquidity Soar
...And Dollar Liquidity Soar
...And Dollar Liquidity Soar
Chart 5Pandemics Usually Have Several Waves
Pandemics Usually Have Several Waves
Pandemics Usually Have Several Waves
The biggest risk is that the pandemic lingers. Epidemiologists agree that COVID-19 will not disappear until (1) a vaccine is available, likely to be 12-18 months (if one is possible at all – there is still no vaccine for HIV or SARS), or (2) 65-80% of the population has had the disease, creating “herd immunity”. Maybe a vaccine will be ready sooner, or a therapeutic treatment will drastically lower the mortality rate – but investors should not bet on it. It is worth remembering that the last big pandemic, the Spanish ‘flu of 1918-1919, had several waves, with the second the deadliest (Chart 5). It is possible that each time governments ease containment measures, the number of new cases will rise again. And even if they don’t, how likely is it that consumers will go back to shopping, eating in restaurants, or travelling as before? Big data from China show a general return to work but not to going out for entertainment (Chart 6). This is likely to remain a drag on the economy for a considerable period. Chart 6Chinese Remain Reluctant To Go Out
Monthly Portfolio Update: The Balance Of Probabilities
Monthly Portfolio Update: The Balance Of Probabilities
Moreover, the fiscal and stimulus packages will help to tide over households and companies in advanced economies during the toughest times – replacing lost wages, and providing bridging loans – but they do not solve the fundamental problem for firms that have lost most of their revenues. US corporate debt is at its highest percentage of GDP in recent history – and the ratio is even higher in parts of Europe, Japan, and China (Chart 7). Bankruptcies are likely to rise, which will make banks more cautious about lending, further tightening credit conditions. Moreover, stimulus packages won’t help Emerging Market borrowers, which have around $4 trillion of outstanding foreign-currency-denominated debt. With the sharp rise in EM credit spreads and fall in currencies over the past three months, many will struggle to service and repay this debt (Chart 8). Chart 7Corporate Debt Is At A Worrying Level
Corporate Debt Is At A Worrying Level
Corporate Debt Is At A Worrying Level
Chart 8EM Dollar Borrowers Will Struggle
EM Dollar Borrowers Will Struggle
EM Dollar Borrowers Will Struggle
Portfolio construction is about probabilities. The scenario priced into risk assets currently – a rapid return to the status quo ante – could turn out to be correct. But there is a significant probability that it does not. We therefore recommend taking some risk off the table. We would not switch into quality government bonds as a hedge, since current yields would give little return even in a disastrous economic scenario – and could produce very negative returns if inflation picks up. We, rather, recommend Overweights in cash and gold, and a relatively low-beta tilt within equities. Equities: Valuations, especially in the US, have not hit typical market-bottom levels. The price/book ratio for US equities, for example, troughed only at 2.9 in March, compared to a bear-market low of 1.5 in 2009 (Chart 9). Earnings will probably be revised down further: the consensus still expects only a 12% decline in S&P 500 EPS in 2020 (and a 21% jump next year); earnings revisions are usually closely correlated to stock prices (Chart 10). We, therefore, remain cautious in our regional equity positioning, with an Overweight on US stocks, and a somewhat defensive sector tilt (Overweights in IT and Healthcare, along with Industrials as a play on Chinese stimulus). One factor to watch: any sustained pickup in value and small-cap stocks, which showed some signs of appearing in late April (Chart 11). This has historically signaled the beginning of a bull market. Chart 9US Valuations Are Not At Usual Bottom Lows
US Valuations Are Not At Usual Bottom Lows
US Valuations Are Not At Usual Bottom Lows
Chart 10Weak Earnings Can Drag Markets Down Further
Weak Earnings Can Drag Markets Down Further
Weak Earnings Can Drag Markets Down Further
Chart 11When Will Value And Small Caps Pick Up?
When Will Value And Small Caps Pick Up?
When Will Value And Small Caps Pick Up?
Fixed Income: Quality government bonds look highly unattractive at current yields. Our calculations suggest only an 6.7% return from 10-year US Treasuries and 4.6% from Bunds even if their yields fall to the lowest possible level, 0% and -1% respectively. Inflation-linked bonds, especially in the US, the UK, Australia and Canada, look very undervalued, however.2 US 10-year breakevens have fallen to as low as 1.1% (Chart 12). In spread product, the best strategy at the moment is to buy what central banks are buying. That means investment-grade bonds in the US and Europe, Fallen Angels3 (since both the Fed and ECB will backstop bonds that were downgraded to junk in the past month), US Aaa CMBS and ABS, Agency CMBS, and munis. But the riskier end of the junk-bond universe looks unattractive. Even a moderate default cycle (with a 9% default rate for junk bonds – compared to 15% in the last recession – and a 25% recovery rate) would point to an excess return from B-rated corporate bonds of -20% over the next 12 months (Chart 13). Chart 12TIPS Look Very Cheap
TIPS Look Very Cheap
TIPS Look Very Cheap
Chart 13Avoid The Lower End Of Junk
Monthly Portfolio Update: The Balance Of Probabilities
Monthly Portfolio Update: The Balance Of Probabilities
Currencies: The dollar has moved sideways on a trade-weighted basis over the past two months. We remain Neutral, since in the short term the dollar could face upward pressure as a safe-haven play, especially versus Emerging Market currencies, if investors start to worry again about growth. In the longer run, however, the dollar looks expensive relative to purchasing power parity (Chart 14), and interest-rate differentials no longer favor it as they have done over much of the past decade (Chart 15). BCA Research’s FX strategists recommend a barbell strategy in currencies, with Overweights in cheap cyclical currencies such as the Canadian dollar and Norwegian krone, as well as safe havens such as the yen.4 Chart 14Dollar Is Expensive...
Dollar Is Expensive...
Dollar Is Expensive...
Chart 15...And No Longer Benefits From Higher Rates
...And No Longer Benefits From Higher Rates
...And No Longer Benefits From Higher Rates
Commodities: After the extraordinary behavior of near-month WTI futures in April, the crude price should settle down. BCA Research’s energy strategists argue that renewed production cuts from Saudi Arabia and Russia, combined with a near-normalization in demand in H2, should push crude-oil balances back into a supply deficit by Q3 (Chart 16). Chart 16Oil Price Should Rise In H2
Oil Price Should Rise in H2
Oil Price Should Rise in H2
They forecast Brent to rise to $42 a barrel by the end of 2020, compared to $24 now. Industrial metals prices have generally remained depressed, despite the recovery in risk assets (Chart 17). But the effects of Chinese stimulus, combined with a weaker dollar, should cause them to recover later in the year (Chart 18). Gold remains a good hedge against further economic shocks or an eventual resurgence in inflation. Chart 17Metal Prices Haven't Recovered...
Metal Prices Haven't Recovered...
Metal Prices Haven't Recovered...
Chart 18...But Should Soon Benefit From Chinese Stimulus
...But Should Soon Benefit From Chinese Stimulus
...But Should Soon Benefit From Chinese Stimulus
Garry Evans, Senior Vice President Global Asset Allocation garry@bcaresearch.com Footnotes 1 Please see Global Asset Allocation, “Quarterly Portfolio Outlook: Playing The Optionality,” dated April 1, 2020. 2 Please see Global Fixed Income Strategy, "Global Inflation Expectations Are Now Too Low," dated April 28, 2020. 3 Bonds that have recently been downgraded from investment grade to sub-investment grade. 4 Please see Foreign Exchange Strategy, "QE And Currencies," dated April 17, 2020. GAA Asset Allocation
Highlights WTI futures contracts delivering into Cushing, Oklahoma, in June could trade or go off the board below $0.00/bbl next month, just as the May contracts did this month, when they changed hands at a low of -$40.32/bbl last week. Oil storage at this critical hub is approaching its practical limit of 80% full, raising the odds of sub-zero pricing (Chart of the Week). Pricing pressures will accelerate the rate of oil-supply destruction in the US, particularly in the prolific shale-oil basins. We are revising our estimate of US production losses upward to 1.6mm b/d this year, and to 2.3mm b/d from January 2020 to December 2021. Retail speculation – in the US via ETFs and long-only index exposure, and in China via bank wealth-management products – is compounding WTI price volatility. The CME Group, which operates the NYMEX WTI futures and options markets, will be forced to address storage constraints in Cushing, and will have to better manage retail-spec positioning: These factors increase the probability of negative pricing and exacerbate price volatility as contracts go off the board. Feature The stunning -$40.32/bbl print for May 2020 WTI futures last week marks the first time this global oil benchmark has traded below $0.00/bbl. Negative prices are nothing new to non-storable commodities. In electricity markets, for example, wholesale prices go negative to force generation offline to balance supply and demand so that markets clear.1 Negative pricing also is seen in natural gas markets. It is occurring in the Permian basin with greater frequency, due to insufficient pipeline take-away capacity for all of the associated gas being produced there as oil output in the basin soars. This leaves no alternative to producers but to either shut in oil production or flare the associated gas. Indeed, forward natgas prices at the Waha Hub in Pecos County, Texas, recently have traded below zero for prolonged periods, owing to the surge in Permian oil production (Chart 2).2 Chart of the WeekCushing Approaches Crude Storage Limit
Stand By For Heavy Rolls: June WTI Could Go Below $0.00/bbl
Stand By For Heavy Rolls: June WTI Could Go Below $0.00/bbl
Chart 2Lack Of Storage Pushes Natgas Prices Below Zero
Lack Of Storage Pushes Natgas Prices Below Zero
Lack Of Storage Pushes Natgas Prices Below Zero
Markets once again were reminded WTI futures are far more than electronic blips on computer screens: They are binding legal contracts to physically deliver light-sweet West Texas Intermediate (WTI) crude oil into the Cushing, Oklahoma, pipeline and storage hub. The stunning -$40.32/bbl print for May 2020 WTI futures last week marks the first time this global oil benchmark has traded below $0.00/bbl since the 1983 introduction of the NYMEX crude oil futures (Chart 3). Markets once again were reminded WTI futures are far more than electronic blips on computer screens: They are binding legal contracts to physically deliver light-sweet West Texas Intermediate (WTI) crude oil into the Cushing, Oklahoma, pipeline and storage hub. Going off the board long requires contract holders to take delivery into a pipeline or storage facility; going off short requires contract holders to make delivery. Chart 3WTI June Futures Could Go Below $0.00/bbl
WTI June Futures Could Go Below $0.00/bbl
WTI June Futures Could Go Below $0.00/bbl
Owing to structural flaws in the delivery mechanism for WTI futures, and what appears to be a lapse in monitoring positions in the spot-month contract as May 2020 WTI was going off the board last week, the likelihood June 2020 WTI contracts pricing below $0.00/bbl is high. These flaws must be addressed by the CME Group’s NYMEX division and federal regulators, given the WTI futures contract’s importance to the global physical market and the capital at risk. Implications Of Negative WTI Prices Storage at Cushing is, for all intents and purposes, full. Cushing accounts for ~ 15% of the total 653mm barrels of US crude oil storage, which was only at 60% of capacity in mid-April, based on the US EIA’s reckoning. However, Cushing is the delivery point of the physically settled WTI futures contracts traded on the NYMEX. With close to 80% of capacity filled – ~ 58mm barrels of the total capacity of ~ 76mm barrels – the operational limit of storage has been reached at Cushing. This is amply seen in the June-vs-July intermonth spread between futures, which, earlier this week, settled at more than $5/bbl – i.e., more than 10x the then-elevated 50 cents/bbl/month being charged to store oil in Cushing in March (Chart 4). Intermonth spreads are used as proxies for the cost of storage for physically delivered contract that actually can be stored, like oil. If physical surpluses cannot be moved out of regions where storage is full – and pipelines also are full – prices are forced lower and lower until enough production is shut in to allow storage to drain and inventories to return to normal levels. This is happening now in Oklahoma and the prolific Texas shale basins, and other shale basins in the US where horizontal rigs are being laid down and drilling crews are being laid off (Chart 5). Chart 4Intermonth-Spread Blow Out Indicates Full Cushing Storage
Intermonth-Spread Blow Out Indicates Full Cushing Storage
Intermonth-Spread Blow Out Indicates Full Cushing Storage
Chart 5Texas Horizontal Rig Counts Collapse
Texas Horizontal Rig Counts Collapse
Texas Horizontal Rig Counts Collapse
We are revising our estimate of US production losses upward for this year, and to 2.3mm b/d from January 2020 to December 2021. In our most recent modeling of US shale-oil production, we expect these pricing pressures to accelerate the rate of oil-supply destruction, particularly in the prolific shale-oil basins. In fact, we are revising our estimate of US production losses upward for this year, and to 2.3mm b/d from January 2020 to December 2021 (Chart 6). Depending on how long WTI prices stay depressed in the key producing basins, this supply destruction could be even more pronounced. The same is true of global storage: Kpler, the oil-storage tracker, last week estimated global onshore inventories were 85% full.3 Until sufficient supply destruction occurs to offset the COVID-19-induced demand destruction, inventories cannot draw. Floating storage also is surging, as the crude and product forward curves fall deeper into contango, and incentivize holding stocks on the water (Chart 7). Chart 6Lower Prices Will Push US Oil Output Lower
Lower Prices Will Push US Oil Output Lower
Lower Prices Will Push US Oil Output Lower
Chart 7Floating Storage Volumes Surge
Floating Storage Volumes Surge
Floating Storage Volumes Surge
Price will go low enough – negative if needs be – to clear surplus supply to rebalance markets. Storage acts as a shock absorber for physical commodities like crude oil – when there is more supply than demand, the physical surplus is moved to storage until it is needed, and vice versa when there is a physical deficit. When inventories fill in Cushing – arguably the most important crude-oil delivery hub in the world, given WTI is the most liquid crude oil futures contract in the world – it is as if there is no storage at all there. At this point, market for WTI behaves a lot like electricity, which cannot be stored (at least at utility scale), or natgas at Waha, where storage and pipeline takeaway capacity are in very short supply. In such circumstances, price will go low enough – negative if needs be – to clear surplus supply to rebalance markets. This appears to be what spooked markets last week when WTI futures for May delivery traded as low as -$40.32/bbl. Retail Specs Push WTI Volatility Higher Speculators perform a vital and necessary function in futures markets – they willingly accept risk hedgers want to shed. Natural longs – i.e., producers – do not want to sell when prices are low, which is when natural shorts want to buy. Likewise, natural shorts – i.e., consumers – don’t want to buy when prices are high, which is when natural longs want to sell. Speculators provide the liquidity that allows producers and consumers to hedge. When prices are relatively high, they can provide a bid to oil producers looking to hedge production – they may be short-term traders or have a view prices are going higher, or they may be getting out of short positions they put on earlier. When prices are low, speculators provide offers – selling futures because they are short-term traders, or have a view prices are going lower, or they are getting out of long positions. Speculators trade on information and typically never stand for delivery of futures like WTI, which means they typically are out of prompt-month contracts before they are getting ready to go off the board. At that point, only physical-market participants – producers, consumers and physical traders – are left in the market balancing their physical books. When speculators find themselves trading WTI futures as they are getting ready to go to delivery, something in their risk-management systems has gone terribly wrong. Not only do they not trade the physical oil, but they don’t know who to call to take them out of their risk. Something also has gone terribly wrong at the regulatory level: At the CME, which, as the operator of the NYMEX oil trading markets, and at the US Commodity Futures Trading Commission (CFTC) in Washington, D.C. The CME is the self-regulatory organization responsible for ensuring its rules are followed and markets trade in an orderly fashion, and, at the federal level, the CFTC exercises oversight and enforces laws and regulations. It appears Bank of China (BOC), the fourth largest bank in China and the world, has found itself holding long positions in WTI futures delivering in May on the last two days of trading last week. These contracts supported wealth-management products – known as “bao” or treasure – the state-owned bank offered its retail clients.4 Other banks in China also offer such products, but it appears BOC was the only one that did not roll out of its delivery exposure in a timely manner.5 The exposure BOC was trying to trade out of was not huge by normal standards, but after settling its open May futures at -$37.63/bbl, BOC clients apparently lost close to $1.3 billion.6 How the CME or the CFTC allowed a commercial bank with no capability to take delivery of WTI in Cushing against a long NYMEX WTI futures contract as it was going off the board is a mystery. Markets will have to wait for a detailed post-mortem to determine what exactly happened, and how. Retail Piles Into WTI Exposure The experience of BOC – and, most likely, the shock of such deeply negative WTI prices realized upon settlement of these contracts – and a change in US regulations on spot-month position limits for futures used by commodity-pool operators prompted a wholesale exodus from spot-month WTI futures – the June 2020-delivery WTI futures that deliver in Cushing – this week. As a result, the commodity-pool operator running the United States Oil Fund (USO) ETF and S&P Dow Jones, which designs and markets long-only commodity index products for investors – e.g., the S&P GSCI index – rolled their June WTI futures into July and later months in an effort to avoid holding length in the June contract out of fear these futures could trade negative.7 USO is geared to retail investors, and inflows are negatively correlated with front-month WTI futures prices – when prices tank retail investors pile into the ETF (Chart 8). This can dramatically increase the number of futures the fund has to buy to provide its product to retail investors. Chart 8Retail Piles Into WTI Futures Exposure
Stand By For Heavy Rolls: June WTI Could Go Below $0.00/bbl
Stand By For Heavy Rolls: June WTI Could Go Below $0.00/bbl
Markets were exceptionally volatile early in the week as these fire sales were being executed. The $3.6 billion USO ETF, in particular, apparently was ordered to spread its spot-month exposure (June WTI) across the forward curve by the CME over the first three days of this week. This action was taken to keep the USO ETF from exceeding new position-limit levels in the spot-month contract, which go into effect May 1, and state no entity can have more than 25% of total open interest in the WTI spot contract.8 Markets were exceptionally volatile early in the week as these fire sales were being executed. This rolling out of June WTI exposures should reduce – but not eliminate – the selling pressure on front-month WTI futures contracts by providers of retail and institutional commodity exposure as June goes off the board next month. However, if storage at Cushing remains at tank tops, the rolling by these ETFs that source futures liquidity to hedge their exposures could again push spot prices below $0.00/bbl as the June WTI futures go off the board May 19.9 That said, it is difficult to ascertain exactly what exposure retail investors are getting now when they buy the USO ETF – its WTI futures now span contracts into next year, based on news reports. This could prompt investors to jettison positions, setting up another round of fire sales in WTI futures. Markets also will expect a post-mortem explaining how the CME and CFTC allowed this retail-focused fund could exceed position limits in spot-month WTI futures contracts so significantly at any point in time, let alone when Cushing infrastructure is so extraordinarily taxed. WTI Futures Contract Flaws Contribute To Volatility The CME has failed to find a way to ensure those holding futures that are going off the board are bona fide hedgers capable of making and taking delivery, as the BOC experience showed. The CME Group has not acquitted itself well in the termination of May 2020 futures trading. And, as researchers at the Oxford Institute for Energy Studies note, the past couple of weeks have exposed deep flaws in the WTI futures contracts’ physical-delivery mechanisms, which have been persistent.10 The lack of sufficient storage at Cushing to accommodate the volume of trading in WTI futures is not a new problem. In 2009, the Kingdom of Saudi Arabia changed its pricing benchmark for US sales to the Argus Sour Crude Index for its crudes sold into the US Gulf, because the WTI contract detached from fundamentals then owing to infrastructure constraints at Cushing. The CME has failed to find a way to ensure those holding futures that are going off the board are bona fide hedgers capable of making and taking delivery, as the BOC experience showed. In addition, the CME has shown it has no institutionalized automatic delivery procedures that kick in when Cushing storage is full – e.g., making and taking delivery, say, in the US Gulf using a WTI contract loaded for export, as the OIES researchers observe. Lastly, as of April 22, the CME is using an options-pricing model based on the original theory on random walks developed by the great Louis Bachelier in 1900, which assumes prices are normally distributed and can go below zero, vs. its previous methodology using Fischer Black’s commodity option pricing model, which assumes prices are log-normally distributed and have a lower boundary of zero.11 We’ll be exploring this in further research. Robert P. Ryan Chief Commodity & Energy Strategist rryan@bcaresearch.com Commodities Round-Up Energy: Overweight Exports from OPEC countries increased by more than 2mm b/d in April – led by Saudi Arabia and UAE – according to Petro-Logistics – a seaborne oil trade analytics company. This is flooding global markets while global demand is expected to drop to its lowest level since 2Q03 this month. Separately, we are revising up our Canadian oil sands shut-in estimates to ~ 800k b/d in 2Q20 from ~ 500k b/d, as US demand for Canadian oil will be hit more severely than we previously anticipated and local storage is filling rapidly. Rystad Energy now expects Canadian capex to fall 41% y/y in 2020. This will have a lasting impact on the industry’s production capacity. Base Metals: Neutral The LMEX rose 3% since the start of April – led by nickel and copper prices moving up by ~ 6%. Base metals – chiefly aluminum and copper – are poised to rebound in 2Q20 if China’s economy continues to improve and is not hit by a second wave of COVID-19 infections. According to BCA’s China Investment Strategy, the country’s fiscal response is now expected to reach 10% of its GDP this year. This will support further upside in base metals prices (Chart 9). Precious Metals: Neutral Despite the record fiscal and monetary stimulus deployed globally, consumer and market-based inflation expectations remain low, as markets focus on the deflationary effects of the COVID-19 shock and the uncertainty about the speed of the recovery (Chart 10). The low realized inflation post-GFC stimulus could influence investors’ expectations down. We see inflation risks as materially higher which will warrant larger protection in a diversified portfolio over the coming year. Inflation expectations will normalize later this year and next, boosting inflation hedges. Nominal bonds’ protection will remain expensive as rates in major DM countries are expected to stay low for a prolonged period. Chart 9
Stand By For Heavy Rolls: June WTI Could Go Below $0.00/bbl
Stand By For Heavy Rolls: June WTI Could Go Below $0.00/bbl
Chart 10
Inflation Expectations Remain Low
Inflation Expectations Remain Low
Footnotes 1 Please see Bajwa, Maheen and Joseph Cavicchi, “Growing Evidence of Increased Frequency of Negative Electricity Prices in U.S. Wholesale Electricity Markets.” IAEE Energy Forum, 4th Quarter 2017. 2 Please see U.S. Gas Prices Turn Negative at Texas Waha Hub published by the Pipeline & Gas Journal March 3, 2020. The article notes, “The first swing to negative spot prices in almost seven months occurred due to pipeline constraints and as mild weather cut heating demand. Prices in the forward market have been trading below zero for weeks on expectations there will not be enough pipelines to transport record amounts of gas from the region’s shale oil fields. That gas that comes from oil wells, called associated gas in the industry, helped propel U.S. gas output to record highs, driving prices to their lowest in years as production outpaces demand for the fuel. Analysts expect gas prices in 2020 to fall to their lowest since 1999.” 3 Please see Oil prices sink as world runs low on storage capacity amid frail demand published by reuters.com April 28, 2020. The IEA estimates total onshore storage globally at close to 7 billion barrels, according to the Center for Strategic & International Studies in Washington, D.C. Please see The Oil Inventory Challenge published by the CSIS April 20, 2020, which notes the US has ~ 1.3 billion barrels of storage, while China has an estimated 1.5 billion barrels. Of that ~ 7 billion barrels of nameplate capacity, ~ 80%, or ~ 5.6 billion barrels, represents the operational limit. 4 Please see The world's 100 largest banks published by S&P Global Market Intelligence April 5, 2019. 5 Please see China's ICBC closes commodity-linked products to new investment published by reuters.com April 27, 2020. 6 Please see Bank of China says main investors to settle crude oil product at -$37 published by reuters.com on April 22, 2020. 7 Please see Futures contract moves endangering WTI prices again published by worldoil.com April 28, 2020. 8 Please see USO ETF pushes oil futures exposure out to June 2021 published by etfstrategy.com April 27, 2020. Earlier this month, the USO ETF has accounted for close to 30% of June WTI futures. Please see Biggest Oil ETF Shakes Up Structure published by etf.com April 17, 2020. 9 The USO ETF is not the only fund sourcing futures liquidity to provide retail exposure to WTI, but it is by far the largest. Please see Oil ETF roils already volatile crude markets published April 27, 2020, by investmentnews.com. 10 Please see Oil Benchmarks Under Stress published by OIES April 28, 2020. 11 Please see Davis, Mark, and Alison Etheridge. Louis Bachelier's Theory of Speculation: The Origins of Modern Finance. Princeton University Press, 2006; and Black, Fischer, “The Pricing of Commodity Contracts,” Journal of Financial Economics, Vol. 3, (1976), pp. 167-79, reprinted with permission in Interrelations Among Futures, Option, and Futures Option Markets (1992), the Board of Trade of the City of Chicago publisher. Investment Views and Themes Recommendations Strategic Recommendations Tactical Trades Trade Recommendation Performance In 2020 Q1
Stand By For Heavy Rolls: June WTI Could Go Below $0.00/bbl
Stand By For Heavy Rolls: June WTI Could Go Below $0.00/bbl
Commodity Prices and Plays Reference Table Trades Closed In 2020 Summary of Closed Trades
Stand By For Heavy Rolls: June WTI Could Go Below $0.00/bbl
Stand By For Heavy Rolls: June WTI Could Go Below $0.00/bbl
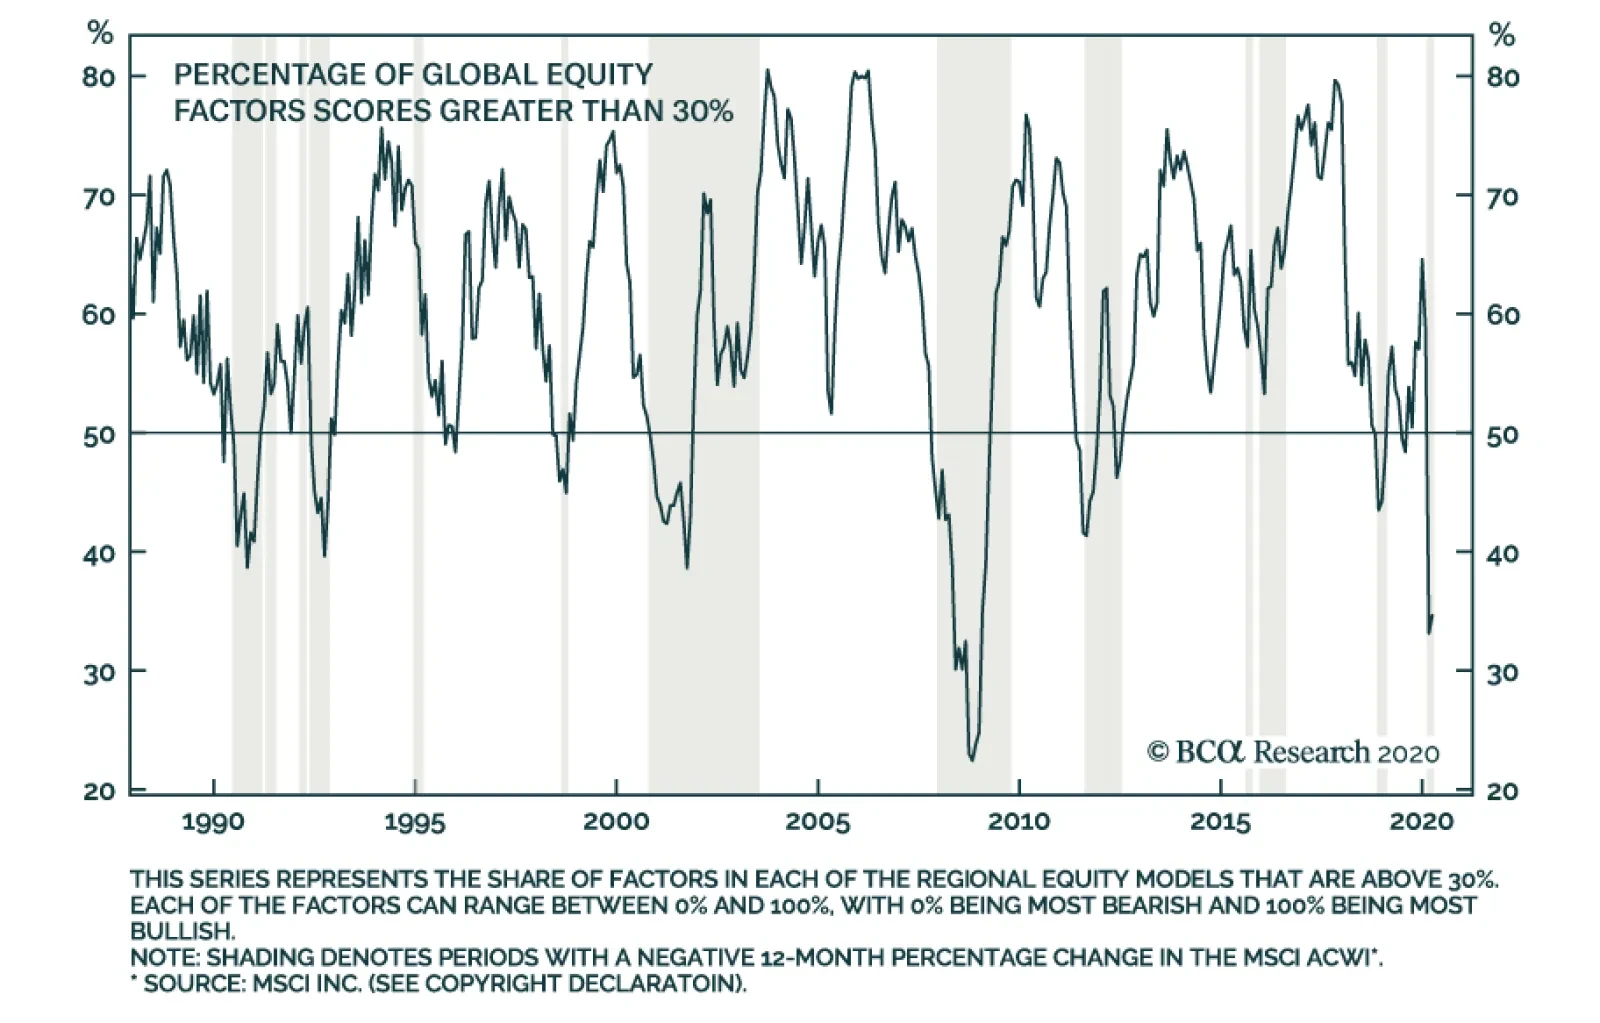
Global equities have risen nearly 30% from their low (in US dollar terms), arrayed against a continued severe deterioration in economic data around the world. Meanwhile, MacroQuant, our soon to be released macroeconomic quantitative model, has maintained a…
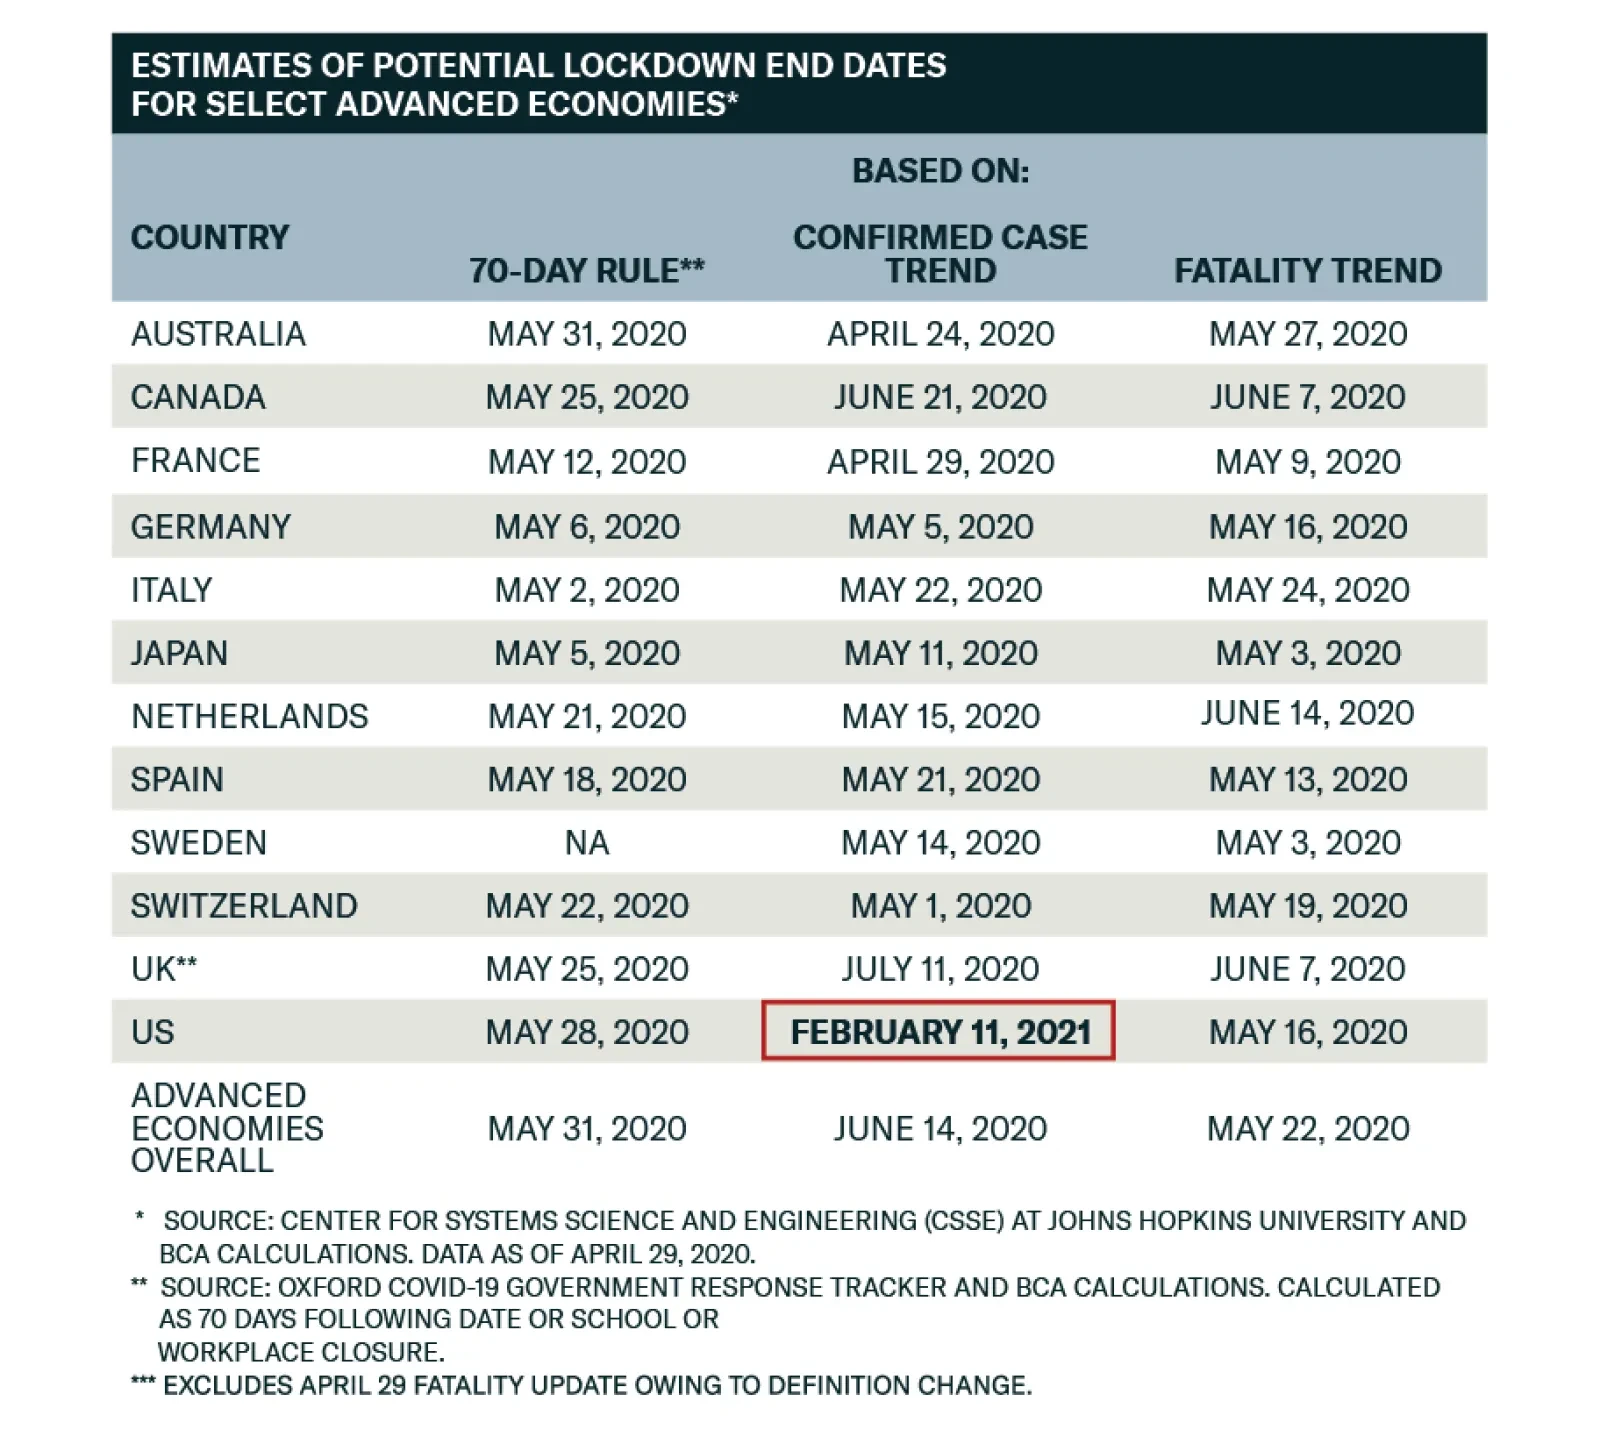
Several countries and US states have already announced some reductions in their pandemic containment restrictions, but the question of how comprehensive these measures can be without risking a second period of prolonged stay-at-home orders looms large.
…
Highlights In this Special Report we explore in detail the fiscal response amongst advanced economies, with the goal of judging whether the response is large enough to prevent an “L-shaped” recession. The crisis remains in its early days and new information about the size and character of the response, as well as the magnitude of the economic shock, continues to emerge on a near-daily basis. As such, our conclusions may change over the coming weeks in line with incoming data. Even when narrowly-defined, the announced (or likely) fiscal response of the US, China, and Germany is quite large and appears to be adequate to prevent the direct and indirect effects of the lockdowns from causing an “L-shaped” event. This is not the case, however, in other euro area economies (France, Italy, and Spain), or in emerging markets. Our analysis also suggests that the global fiscal response will need to increase if the global economy faces a W-shaped shock caused by another round of aggressive containment measures later this year. This underscores the importance of ensuring that the “Great Lockdown” succeeds at reducing the spread of the disease to a point that does not necessitate widespread renewed restrictions on economic activity. Feature The global economic expansion that began in 2009 has come to an abrupt end due to the COVID-19 pandemic. Aggressive containment measures necessary to control the spread of the disease and prevent the collapse in health care systems around the world have caused a large and sudden stop in global economic activity, which has prompted unprecedented responses from governments around the world. In this Special Report we explore in detail the fiscal response amongst advanced economies, with the goal of judging whether the response is large enough to prevent an “L-shaped” recession (characterized by a very prolonged return to trend growth). The crisis remains in its early days and new information about the size and character of the response, as well as the magnitude of the economic shock, continues to emerge on a near-daily basis. As such, our conclusions may change over the coming weeks in line with incoming data. But for now, we (tentatively) conclude that the fiscal response appears to be adequate to prevent the direct and indirect effects of the lockdowns from causing an “L-shaped” event. However, there are two important caveats. First, while Germany has provided among the strongest fiscal responses globally, measures in France, Italy, and Spain are still lacking and must be stepped up. Second, the announced fiscal measures will not be sufficient if the global economy faces a W-shaped shock caused by another round of aggressive containment measures later this year – more will have to be done. For policymakers, this underscores the importance of ensuring that the “Great Lockdown” succeeds at reducing the spread of the disease to a point that does not necessitate widespread renewed restrictions on economic activity. In this regard, the gradual re-opening of several US states by early-May, while positive for economic activity in the short-run, is a non-trivial risk to the US and global economic outlooks over the coming 6-12 months. This risk must be closely watched by investors. The Global Fiscal Response: Comparing Across Countries And Across Measures The flurry of policy announcements from national governments over the past six weeks has led to a great degree of confusion about the size and disposition of the global COVID-19 fiscal response. Our analysis is based heavily on the IMF’s tracking of these measures, albeit with a few adjustments. We also rely on analysis from Bruegel, a prominent European macroeconomic think-tank, as well as our own Geopolitical Strategy team and a variety of news reports. Chart II-1 presents the IMF’s estimate of the total fiscal response to the crisis across major countries, as of April 23rd, broken down into “above-the-line” and “below-the-line” measures. Above-the-line measures are those that directly impact government budget balances (direct fiscal spending and revenue measures, usually tax deferrals), whereas below-the-line measures typically involve balance sheet measures to backstop businesses through capital injections and loan guarantees. Chart II-1The Global Fiscal Response Is Huge When Including All Measures
May 2020
May 2020
Chart II-1 makes it clear that the fiscal response of advanced economies is enormous when including both above- and below-the-line measures. By this metric, the response of most developed economies is on the order of 10% of GDP, and well above 30% in the case of Italy and Germany. However, using the sum of above- and below-the-line measures to gauge the fiscal response of any country may not be the ideal approach, given that below-the-line measures are contingent either on the triggering of certain conditions or on the provision of credit to households and firms from the financial system. Below-the-line measures also likely increase the liability position of the private sector, thus raising the odds of negative second-round effects. Instead, Chart II-2 compares the countries shown in Chart 1 based only on the IMF’s estimate of above-the-line measures, and with a 4% downward adjustment to Japan’s reported spending to account for previously announced measures.8 The chart shows that countries fall into roughly three categories in terms of the magnitude of their above-the-line response: in excess of 4% of GDP (Australia, the US, Japan, Canada, and Germany), 2-3% (the UK, Brazil, and China), and sub-2% (all other countries shown in the chart, including Spain, Italy, and France). Chart II-2The Picture Changes When Excluding Below-The-Line Measures
May 2020
May 2020
Analysis by Bruegel provides somewhat different estimates of the global COVID-19 fiscal response for select European countries as well as the US (Table II-1). Bruegel breaks down discretionary fiscal measures that have been announced into three categories: those involving an immediate fiscal impulse (new spending and foregone revenues), those related to deferred payments, and other liquidity provisions and guarantees. Bruegel distinguishes between the first and second categories because of their differing impact on government budget balances. Deferrals improve the liquidity positions of individuals and companies but do not cancel their obligations, meaning that they result only in a temporary deterioration in budget balances. Table II-1The Type Of Fiscal Response Varies Significantly Across Countries
May 2020
May 2020
Table II-1 highlights that Bruegel’s estimates of the sum of above- and below-the-line measures are similar to the IMF’s estimates for the US, the UK, and Spain, but are smaller for Italy and larger for France and Germany (particularly the latter). These differences underscore the extreme uncertainty facing investors, who have to contend not only with varying estimates of the magnitude of government policies but also a torrent of news concerning the evolution of the pandemic itself. Chart II-3 presents our best current estimate of the above-the-line fiscal response of several countries (the measure we deem to be most likely to result in an immediate fiscal impulse), by excluding loans, guarantees, and non-specified revenue deferrals to the best of our ability.2 Chart II-3 is based on a combination of data from the IMF, Bruegel analysis, and BCA estimates and news analysis. Chart II-3When Narrowly Defined, Several Countries Are Responding Forcefully, But Many Countries Are Not
May 2020
May 2020
Overall, investors can draw the following conclusions from Charts II-1 – II-3 and Table II-1: When measured as the total of above- and below-the-line measures, nearly all large developed market countries have responded with sizeable measures. Emerging market economies are the clear laggards. Excluding below-the-line measures and using our approach, Australia, the US, China, Germany, Japan, and Canada appear to be spending the most relative to the size of their economies. While Japan’s “headline” fiscal number was inflated by including previously-announced spending, it is still decently-sized after adjustment. Outside of Germany, the rest of Europe appears to be providing a middling or poor above-the-line fiscal response. The UK appears to be providing between 4-5% of GDP as a fiscal impulse, whereas the fiscal response in Italy, Spain, and France looks more like that of emerging markets than of advanced economies. Measuring The Stimulus Against The Shock Despite the substantial amount of new information over the past six weeks concerning the evolution of the pandemic and the attendant policy response, it remains extremely difficult to judge what the balance between shock and stimulus will be and what that means for the profile of growth. Nonetheless, below we present a framework that investors can use to approach the question, and that can be updated as new information emerges concerning the impact of the shutdowns and the extent of the response. Our approach involves analyzing four specific questions: What is the size of the initial shock? What are the likely second-round effects on growth? What is the likely multiplier on fiscal spending? Will the composition of fiscal spending alter its effectiveness? The Size Of The Initial Shock Chart II-4 presents the OECD’s estimates of the initial impact of partial or complete shutdowns on economic activity in several countries. The OECD first used a sectoral approach to estimating the impact on activity while lockdowns are in effect, assuming a 100% shutdown for manufacturing of transportation equipment and other personal services, a 50% decline in activity for construction and professional services, and a 75% decline for retail trade, wholesale trade, hotels, restaurants, and air travel. Chart II-4 illustrates the total impact of this approach for key developed and emerging economies. Chart II-4Annual GDP Will Be 1.5%-2.5% Lower For Each Month Lockdowns Are In Effect
May 2020
May 2020
The OECD’s approach provides a credible estimate of the impact of aggressive containment policies, and implies that annual real GDP is likely to be 1.5-2.5% lower for major countries for each month that lockdown policies are in effect. This implies that output in major economies is likely to fall 3.5% - 6% for the year from the initial shock alone, assuming an aggressive 10-week lockdown followed by a complete return to normal. Estimating Potential Second Round Effects Chart II-5 presents projections from the Bank for International Settlements on the spillover and spillback potential of a 5% initial shock to the level of global GDP from the COVID-19 pandemic (equivalent to a 20% impact on an annualized basis). Chart II-5Additional Lockdown Events Are A Greater Risk Than First Wave After-Effects
May 2020
May 2020
The chart shows that the cumulative impact of the initial shock rises to 7-8% by the end of this year for the US, euro area, and emerging markets, and 6% for other advanced economies. These estimates account for both domestic second round effects of the initial shock, as well as the reverberating impact of the shock on global trade. Chart II-5 also shows the devastating effect that a second wave of COVID-19 emerging in the second half of the year would have after including spillover and spillback effects, assuming that only partial lockdowns would be required. In this scenario, the level of GDP would be 10-12% lower at the end of the year depending on the region, suggesting that investors should be more concerned about the possibility of additional lockdown events than they should be about the after-effects of the first wave of infections (more on this below). Will Fiscal Multipliers Be High Or Low? When examining the academic literature on fiscal multipliers, the first impression is that multipliers are likely to be extremely large in the current environment. Tables II-2 and II-3 present a range of academic multiplier estimates aggregated by the IMF, categorized by the stage of the business cycle and whether the zero lower bound is in effect. Table II-2Fiscal Multipliers Are Much Larger During Recessions Than Expansions
May 2020
May 2020
Table II-3Models Suggest The Multiplier Is Quite High At The Zero Lower Bound
May 2020
May 2020
The tables tell a clear story: multipliers are typically meaningfully larger during recessions than during expansions, and extremely large when the zero lower bound (ZLB) is in effect. However, there are at least two reasons to expect that the fiscal multiplier during this crisis will not be as large as Tables II-2 and II-3 suggest. First, it is obviously the case that the multiplier will be low while full or even partial lockdowns are in effect, as consumers will not have the ability to fully act in response to stimulative measures. This will be partially offset by a burst of spending once lockdowns are removed, but the empirical multiplier estimates during recessions shown in Table II-2 have not been measured during a period when constraints to spending have been in effect, and we suspect that this will have at least somewhat of a dampening effect on the efficacy of fiscal spending relative to previous recessions (even once regulations concerning store closures are removed). Second, Table II-3 likely overestimates the multiplier at the ZLB. These estimates have been based on models rather than empirical analysis, and appear to be in reference to the prevention of large subsequent declines in output following an initial shock. The modeled finding of a large multiplier at the ZLB occurs because increased deficit spending will not lead to higher policy rates in a scenario where the neutral rate has fallen below zero. But it seems difficult to believe that the fiscal multiplier during ZLB episodes, defined as the impact of fiscal spending on the path of output relative to the initial shock (not relative to a counterfactual additional shock), is larger than the highest empirical estimates of the multiplier during recessions. The only circumstance in which we can envision this being the case is an environment where long-term bond yields are capped and remain at zero, alongside short-term interest rates, as the economy improves. The IMF has provided a simple rule of thumb approach to estimating the fiscal multiplier for a given country. The IMF’s approach involves first estimating the multiplier under normal circumstances based on a series of key structural characteristics that have been shown to influence the economy’s response to fiscal shocks. Then, the “normal” multiplier is adjusted higher or lower depending on the stage of the business cycle, and whether monetary policy is constrained by the ZLB. For the US, the IMF’s approach suggests that a multiplier range of 1.1 – 1.6 is reasonable, assuming the highest cyclical adjustment but no ZLB adjustment (see Box II-1 for a description of the calculation). Given the unprecedented nature of this crisis, we are inclined to use the low end of this range (1.1) as a conservative assumption when judging whether fiscal responses to the crisis are sufficient. For investors, this means that governments should be aiming, at a minimum, for fiscal packages that are roughly 90% of the size of the expected shock of their economies, using our US fiscal multiplier assumption as a guide. Box II-1 The “Bucket” Approach To Estimating Fiscal Multipliers The IMF “bucket” approach to estimating fiscal multiplier involves determining the multiplier that is likely to apply to a given country during “normal” circumstances, based on a set of structural characteristics associated with larger multipliers. This “normal” multiplier is then adjusted based on the following formula: M = MNT * (1+Cycle) * (1+Mon) Where M is the final multiplier estimate, MNT is the “normal times” multiplier derived from structural characteristics, Cycle is the cyclical factor ranging from −0.4 to +0.6, and Mon is the monetary policy stance factor ranging from 0 to 0.3. The Cycle factor is higher the more a country’s output gap is negative, and the Mon factor is higher the closer the economy is to the zero lower bound. Table II-B1 applies the IMF’s approach to the US, using the same structural score as the IMF presented in the note that described the approach. The table highlights that the approach suggests a US fiscal multiplier range of 1.1 – 1.6 given the maximum cycle adjustment proscribed by the rule, which we feel is reasonable given the unprecedented rise in US unemployment. We make no adjustment to the range for the zero lower bound. Table II-B1A Multiplier Estimate Of 1.1 – 1.6 Seems Reasonable For The US
May 2020
May 2020
The Composition Of The Response: Helping Or Hurting? The last of our four questions deals with the issue of composition and whether the form of a country’s fiscal response is likely to alter its effectiveness. We implicitly addressed the first element of composition, whether measures are above-the-line or below-the-line, by comparing Charts II-1 - II-3 on pages 28-31. Our view is that above-the-line measures are far more important than below-the-line measures, as the former provides direct income and liquidity support. Below-the-line measures are also important, as they are likely to help reduce business failure and household bankruptcies. The fiscal multiplier on these measures has to be above zero, but it is likely to be much lower than that of an above-the-line response. The second element of composition concerns the appropriate distribution of aid among households, businesses, and local governments. On this particular question, it remains extremely challenging to analyze the issue on a global basis, owing to a frequent lack of an explicit breakdown of fiscal measures by recipient. Chart II-6Much Of The US Fiscal Response Is Going To Households And Small Businesses
May 2020
May 2020
For now, we limit our distributional analysis to the US, and hope to expand our approach to other countries in future research. Chart II-6 presents a breakdown of the US fiscal response by recipient, which informs the following observations. Households: Chart II-6 highlights that US households will receive approximately $600 billion as part of the CARES Act, roughly half of which will occur through direct payments (i.e. “stimulus checks”) and another 40% from expanded unemployment benefits. In cases where the federal household response has been criticized by members of the public as inadequate, it has often been compared to income support programs of other countries. The Canada Emergency Response Benefit (“CERB”) is a good example of a program that seems, at first blush, to be superior: it provides $2,000 CAD in direct payments to individuals for a 4 week period, for up to 16 weeks (i.e. a maximum of $8,000 CAD), which seems better than a $1,200 USD stimulus check. However, Table II-4 highlights that this comparison is mostly spurious. First, the CERB is not universal, in that it is only available to those who have stopped or will stop working due to COVID-19. At a projected cost of $35 billion CAD, the CERB program represents 1.5% of Canadian GDP. By comparison, $600 billion USD in overall household support represents 2.75% of US GDP; this number drops to 1.75% when only considering support to those who have lost their jobs, but this is still higher as a share of the economy than in Canada. Moreover, there is little question that Congress is prepared to pass more stimulus for additional weeks of required assistance. The discrepancy between the perception and reality of US household sector support appears to be rooted in the speed of payments. Speed is the one area where Canada’s household sector response appears to have legitimately outperformed the US; CERB payments are received by applicants within three business days for those registered for electronic payment, and in some cases they are received the following day. By contrast, it has taken some time for US States to start paying out the additional $600 USD per week in expanded unemployment benefits, but as of the middle of last week nearly all states had started making these payments. Table II-4US Household Relief Is Just As Generous As Seemingly Better Programs
May 2020
May 2020
Firms: On April 16th the Small Business Administration announced that the Paycheck Protection Program (“PPP”) had expended its initial budget of $350 billion. While additional funds of $320 billion have subsequently been approved (plus $60 billion in small business emergency loans and grants), the run on PPP funds was, to some investors, an implicit sign that the CARES Act was inadequately structured. However, the fact that the initial funds ran out in mid-April simply reflects the reality that social distancing measures had been in place for 3-4 weeks by the time that the program began taking applications. Table II-5 highlights that $350 billion was large enough to replace nearly 90% of lost small business income for one month, assuming that overall small business revenue has fallen by 50% and that small businesses account for 44% of total GDP. The Table also shows that a combined total of $730 billion is enough to replace almost 80% of lost small business income for 10 weeks, given these assumptions. With loan forgiveness at least partially tied to small businesses retaining employees on payroll for an 8-week period, the PPP is also essentially an indirect form of household income support. Table II-5Help For Small Businesses Will Replace A Significant Amount Of Lost Income
May 2020
May 2020
Chart II-7Persistent State & Local Austerity Must Be Avoided This Time
Persistent State & Local Austerity Must Be Avoided This Time
Persistent State & Local Austerity Must Be Avoided This Time
State & Local Governments: The magnitude of support for state & local (S&L) governments appears to be the least-well designed element of the US fiscal response. The CARES Act provides for $170 billion in support to S&L, which at first blush seems large as it is approximately 25% of S&L current receipts in Q4 2019 (i.e. it stands to cover a 25% loss in revenue for one quarter). However, this does not account for the significant reported increase in S&L costs to combat the pandemic, nor does it provide S&L governments with any revenue certainty beyond June 30th when most of the assistance from CARES must be spent. Unlike households or firms, who also face significant uncertainty, nearly all US states are subject to balanced budget requirements, which prevent them from spending more than they collect in revenue. When faced even with projected revenue losses in the second half of this year and into 2021, states are likely to aggressively and immediately cut costs in order to avoid budgetary shortfalls. Chart II-7 highlights that S&L austerity was a significant element of the persistent drag on real GDP growth from overall government expenditure and investment in the first 3-4 years of the post-GFC economic expansion. A repeat of this episode would significantly raise the odds of an “L-type” recession (and thus should certainly be avoided). This is why Congress is moving to pass larger state and local aid. Our Geopolitical Strategy team argues that neither President Trump nor Senate Majority Leader Mitch McConnell will prevent the additional financial assistance that US states will require, despite their rhetoric about states going bankrupt.3 A near-term, temporary standoff may occur, but Washington will almost certainly act to provide at least additional short-term funding if state employment starts to fall due to budget pressure. So while we recognize that the state & local component of the US fiscal response is currently lacking, it does not seem likely to represent a serious threat to an eventual economic recovery in the US. Putting It All Together: Will It Be Enough? Chart II-8 reproduces Chart II-3 with an assumed fiscal multiplier of 1.1, and with shaded regions denoting the likely initial and total impact on GDP from aggressive containment measures (based on the OECD and BIS’ estimates). Based on our analysis of the US fiscal response, we make no adjustments for the composition of the measures beyond defining the fiscal response on a narrow basis (i.e. excluding loans, guarantees, and non-specified revenue deferrals). The chart highlights that the narrowly-defined fiscal response of three key economies driving global demand, the US, China, and Germany, is either at the upper end or above the total impact range. Thus, for now, we tentatively conclude that the fiscal response that has or will happen appears to be adequate to prevent the direct and indirect effects of the lockdowns from causing an “L-shaped” event, especially since Chart II-8 explicitly excludes below-the-line measures. However, there are two important caveats to this conclusion. First, Chart II-8 makes it clear that measures in France, Italy, and Spain are still lacking and must be stepped up. Italy and France have provided a substantial below-the-line response, but it is far from clear that a debt-based response or one that only temporarily improves access to cash for households and businesses will be enough to prevent a prolonged fallout from the sudden stop in economic activity and income. Chart II-8Several Important Countries Seem To Be Doing Enough, But More Is Needed In Europe Ex-Germany
May 2020
May 2020
Second, our analysis suggests that the announced fiscal measures will not be sufficient if the global economy faces a W-shaped shock caused by another round of aggressive containment measures later this year or if these measures remain in place at half-strength for many months. This underscores how sensitive the adequacy of announced fiscal measures are to the amount of time economies remain under full or partial lockdown. As such, it is crucial for investors to have some sense of when advanced economies may be able to sustainably end aggressive containment measures. When Can The Lockdowns Sustainably End? Several countries and US states have already announced some reductions in their restrictions, but the question of how comprehensive these measures can be without risking a second period of prolonged stay-at-home orders looms large. Table II-6 presents two different methods of estimating sustainable lockdown end dates for several advanced economies. First, we use the “70-day rule” that appears to have succeeded in ending the outbreak in Wuhan, calculated from the first day that either school or work closures took effect in each country.4 Second, using a linear trend from the peak 5-day moving average of confirmed cases and fatalities, we calculate when confirmed cases and fatalities may reach zero. Table II-6By Re-Opening Soon, The US May Be Risking A Damaging Second Wave
May 2020
May 2020
The table highlights that these methods generally prescribe a reopening date of May 31st or earlier, with a few exceptions. The UK’s confirmed case count and fatality trends are still too shallow to suggest an end of May re-opening, as is the case in Canada. In the case of Sweden, no projections can truly be made based on the 70-day rule because closures never formally occurred. But the most problematic point highlighted in Table II-6 is that US newly confirmed cases are only currently projected to fall to zero as of February 2021. Chart II-9 highlights that while new cases per capita in New York state are much higher than in the rest of the country, they are declining whereas they have yet to clearly peak elsewhere. Cross-country case comparisons can be problematic due to differences in testing, but with several US states having already begun the gradual re-opening process, this underscores that US policymakers may be allowing a dangerous rise in the odds of a secondary infection wave. Chart II-9No Clear Downtrend Yet Outside Of New York State
May 2020
May 2020
Investment Conclusions Our core conclusion that an “L-shaped” global recession is likely to be avoided is generally bullish for equities on a 12-month horizon. However, uncertainty remains extremely elevated, and the recent rise in stock prices in the US (and globally) has been at least partially based on the expectation that lockdowns will sustainably end soon, which at least in the case of the US appears to be a premature conclusion given the current lack of large-scale virus testing capacity. As such, we are less optimistic towards risky assets tactically, and would recommend a neutral stance over a 0-3 month horizon. As noted above, our cross-country comparison of narrowly-defined fiscal measures suggested that euro area countries (excluding Germany) will likely have to do more in order to prevent a long period of below-trend growth. In the case of highly-indebted countries like Italy, this raises the additional question of whether a significantly increased debt-to-GDP ratio stemming from an aggressive fiscal impulse will cause another euro area sovereign debt crisis similar to what occurred from 2010-2014. Chart II-10Italy's Debt Sustainability Hurdle Is Lower Than It Used To Be
Italy's Debt Sustainability Hurdle Is Lower Than It Used To Be
Italy's Debt Sustainability Hurdle Is Lower Than It Used To Be
Government debts are sustainable as long as interest rates remain below economic growth, and from this vantage point Italy should spend as much as needed in order to ensure that nominal growth remains above current long-term government bond yields. Chart II-10 highlights that, despite a widening spread versus German bunds, Italian 10-year yields are much lower today than they were during the worst of the euro area crisis, meaning that the debt sustainability hurdle is technically lower. However, we have also noted in previous reports that high-debt countries often face multiple government debt equilibria; if global investors become fearful that that high-debt countries may not be able to repay their obligations without defaulting or devaluing, then a self-fulfilling prophecy will occur via sharply higher interest rates (Chart II-11). Chart II-11Multiple Equilibria In Debt Markets Are Possible Without A Lender Of Last Resort
May 2020
May 2020
Chart II-12Italy's Structural Budget Balance Has Improved
Italy's Structural Budget Balance Has Improved
Italy's Structural Budget Balance Has Improved
For now, we view the risk of a renewed Italian debt crisis from significantly increased spending related to COVID-19 as minimal, and it is certainly lower than the status quo as the latter risks causing a sharp gap between nominal growth and bond yields like what occurred from 2010 – 2014. First, Chart II-12 highlights that Italy has succeeded in somewhat reducing its structural balance, which averaged -4% for many years prior to the euro area crisis. Assuming an adequate global response to the crisis and that economic recovery ensues, it is not clear why global bond investors would be concerned that Italian structural deficits would persistently widen. Second, the ECB is purchasing Italian government bonds as part of its new Pandemic Emergency Purchase Program, which will help cap the level of Italian yields. Chart II-13Italy's Debt Service Ratio Won't Go Up Much, If Yields Are Unchanged
Italy's Debt Service Ratio Won't Go Up Much, If Yields Are Unchanged
Italy's Debt Service Ratio Won't Go Up Much, If Yields Are Unchanged
Third, Chart II-13 shows what will occur to Italy’s government debt service ratio (general government net interest payments as a percent of GDP) in a scenario where Italy’s gross debt to GDP rises a full 20 percentage points and the ratio of net interest payments to debt remains unchanged. The chart shows that while debt service will rise, it will still be lower than at any point prior to 2015. So not only should Italy spend significantly more to combat the severely damaging nature of the pandemic, we would expect that Italian spreads would fall, not rise, in such an outcome. Jonathan LaBerge, CFA Vice President Special Reports Footnotes 1 Skeptical economists call Japan’s largest-ever stimulus package ‘puffed-up’, Keita Nakamura, The Japan Times, April 8, 2020. 2 Please note that Chart II-3 differs somewhat from a chart that has been frequently shown by our Geopolitical Strategy service. Both charts are accurate; they simply employ different definitions of the fiscal response to the pandemic. 3 Indeed, McConnell has already walked back his comments that states should consider bankruptcy. President Trump is constrained by the election, as are Senate Republicans, and the House Democrats control the purse strings. Hence more state and local funding is forthcoming. At best for the Republicans, there may be provisions to ensure it goes to the COVID-19 crisis rather than states’ unfunded pension obligations. See Geopolitical Strategy, “Drowning In Oil (GeoRisk Update),” April 24, 2020, www.bcaresearch.com. 4 School and work closure dates have been sources from the Oxford COVID-19 Government Response Tracker.