Global
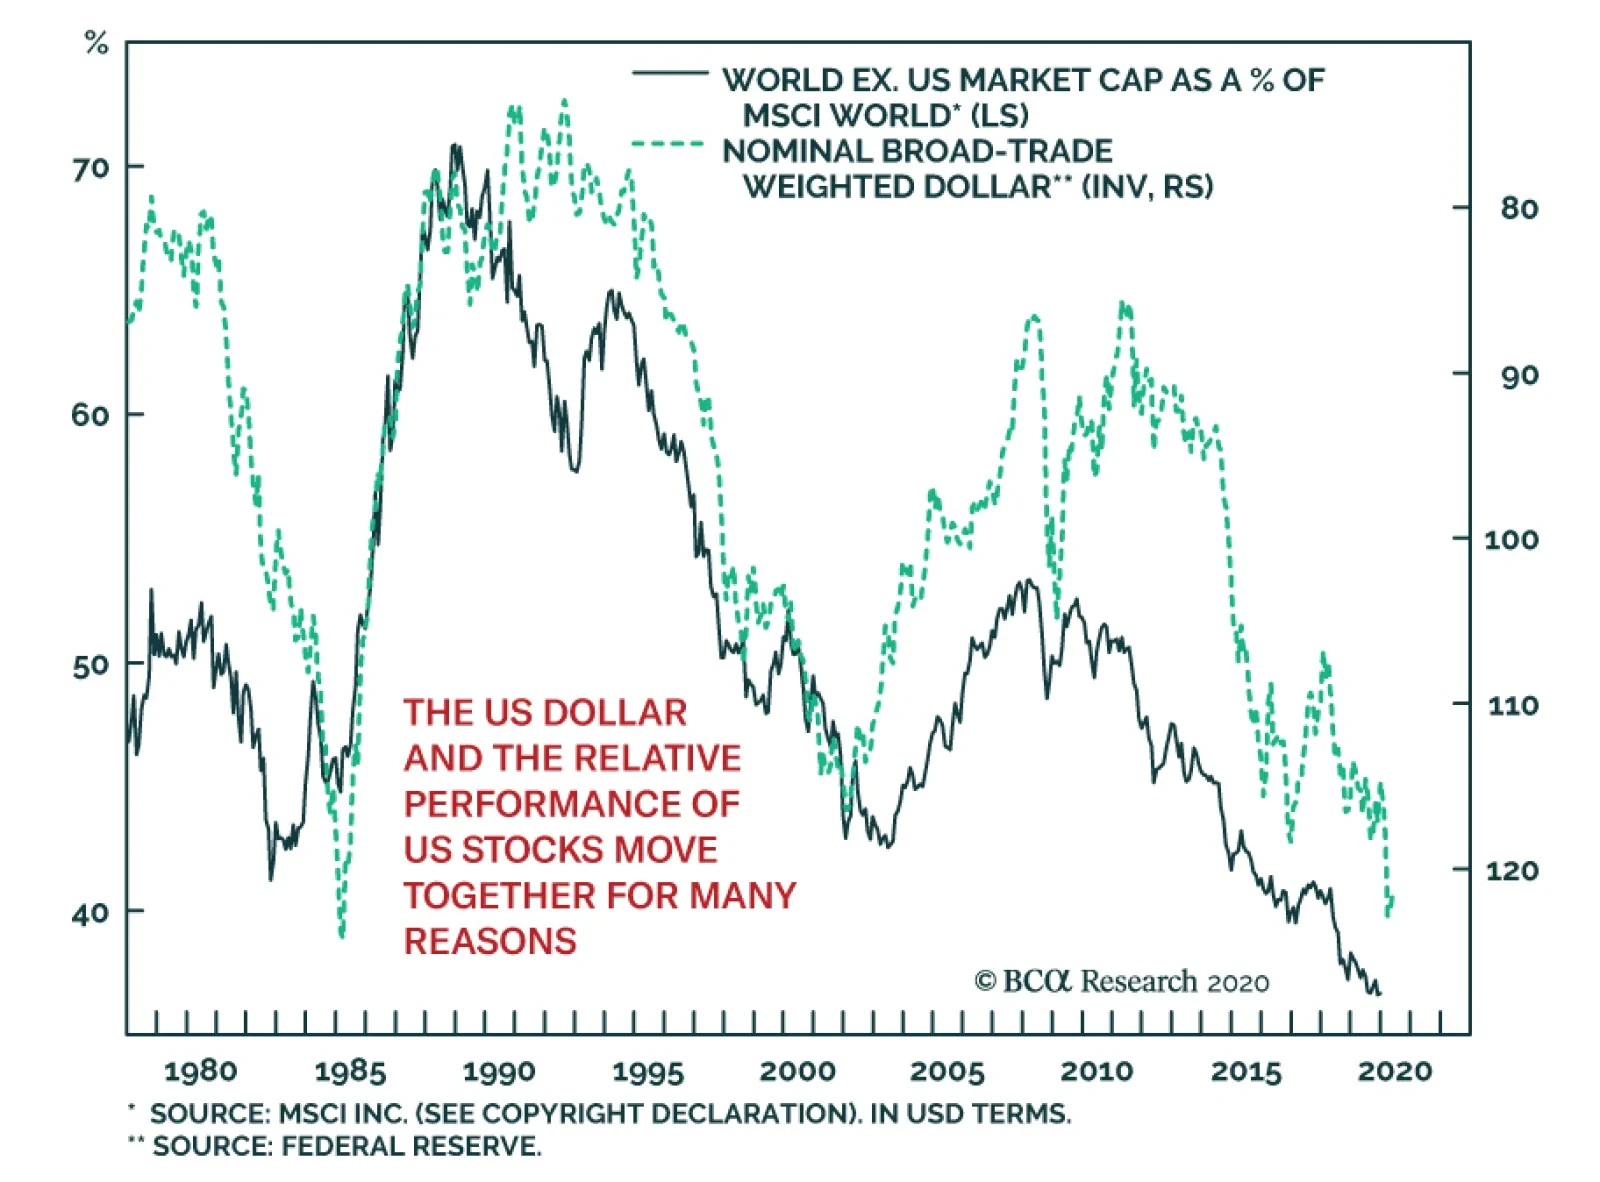
The continued weakness in the dollar since mid-May raises the prospect of a temporary end to the outperformance of US equities. US equities tend to do better when the dollar is strong. Arithmetic plays a role in this relationship. When the dollar…
The stock market offers an increasingly tenuous reward/risk proposition after its incredible run from March 23 to last Friday. The put-to-call ratio is flashing an elevated risk of an imminent correction and rising bond yields increasingly put the high…

Dear Client, In lieu of our regular report this week, we are sending you a Special Report from my colleague Jonathan LaBerge. Jonathan examines the global effectiveness of recent pandemic containment measures to judge both the odds of a second infection wave and what policy responses are likely to be effective in countering one were it to occur. In addition, I will take part in a discussion on the longer-term outlook for inflation alongside my colleagues Robert Robis and Robert Ryan in a live webcast this Friday, June 5 at 8:00 AM EDT (1:00 PM BST, 2:00 PM CEST, 8:00 PM HKT). Best regards, Peter Berezin, Chief Global Strategist Highlights In this report we examine the effectiveness of COVID-19 containment measures across 30 of the largest global economies to determine which measures best explain cross-country “success” at fighting the pandemic. Our findings are generally consistent with the recommendations of health experts today and the historical experience of the Spanish flu. The speed at which measures were deployed appears to have been a very important factor contributing to success, and the most economically-damaging measures seem to have been among the most effective in combating the spread of the disease. This underscores that fighting a secondary infection wave, were one to occur, would be enormously costly even if more effective and less blunt containment measures succeeded at preventing uncontrolled spread. Equity investors are thus making a risky bet in extrapolating early reopening. We recommend a tactically neutral allocation towards equities versus bonds, within the context of a cyclically-overweight stance. Feature Global equities have rallied 38% from their March 23 low, and remain only 9% below this year’s high. The rally in stocks reflects, in part, the very aggressive response that has occurred from both fiscal and monetary authorities. But it also reflects the view that pandemic containment measures have succeeded in controlling the spread of the disease in the western world, and that developed countries will be able to continue to progressively roll back containment measures and restart their stalled economies. In this report we investigate the effectiveness of recent pandemic containment measures across 30 of the largest economies in the world, based on data sourced from the Oxford COVID-19 Government Response Tracker. The goal of the report is to determine which of the measures best explain cross-country “success” at fighting the pandemic, in order to judge both the likelihood of a second wave of COVID-19 infections and what policy responses are likely to be effective in countering one were it to occur. Our findings are generally consistent with the recommendations of health experts today and the historical experience of the Spanish flu. The speed at which authorities responded to COVID-19 appears to be among the most important factors contributing to the relative success among countries in combating the pandemic, and the most economically-damaging containment measures (school and workplace closures, event cancellation, and travel restrictions) appear to have been among the most effective in combating the pandemic, depending on the measure of success in question. For investors, this underscores that fighting a secondary infection wave, were one to occur, would be enormously costly even if more effective and less blunt containment measures succeeded at preventing uncontrolled spread. In this regard, it appears that equity investors are making a risky bet in extrapolating early reopening, arguing for a tactically neutral allocation towards equities versus bonds within the context of a cyclically-overweight stance. Measuring Government Responses To COVID-19 Chart 1The Forcefulness Of Government Responses To COVID-19 Over Time
COVID-19 Containment Measures: The Evidence On Effectiveness, And What It Means For Investors
COVID-19 Containment Measures: The Evidence On Effectiveness, And What It Means For Investors
The COVID-19 Government Response Tracker (OxCGRT) was launched by the University of Oxford’s Blavatnik School of Government in late-March as a tool to track and compare policy responses of governments tackling the coronavirus outbreak. The tracker originally included 11 indicators of how governments were responding: 7 measures of closures & containment, 2 measures tracking the economic response, and 2 measures of investment in health care and vaccine research. The original 7 measures of closures & containment were combined into an aggregate measure dubbed the Government Response Stringency Index (Chart 1), which has been widely cited over the past two months. OxCGRT was updated in late-April, and the changes included both new indicators (bringing the total to 18) and amendments to the way in which some of the original indicators were defined. Table 1 provides a list of the closure/containment and health indicators as well as their definitions, along with the codes or scores used to denote the different levels of stringency in each indicator. In the charts shown in this report, indicator values are shown rescaled to be between 0 – 100; as an example, a score of 2 out of 4 for international travel would show up as a rescaled value of 50. Table 1Description Of The Oxford Government Response Stringency Index Components Pertaining To Closures & Containment And Health
COVID-19 Containment Measures: The Evidence On Effectiveness, And What It Means For Investors
COVID-19 Containment Measures: The Evidence On Effectiveness, And What It Means For Investors
Among the measures shown in Table 1, we test the power of 11 indicators (all 8 closure/containment and 3 public health measures) to explain the cross-country “success” of 30 countries in fighting the COVID-19 pandemic. “Success” is defined in three ways: limiting the magnitude of the virus’ spread (peak per capita cases and fatalities), limiting the time to the peak in new cases and fatalities, and the speed at which new cases and fatalities decline following a peak. Finally, we make our own adjustment to OxCGRT’s indicators by penalizing targeted measures rather than providing a bonus to general measures (as is done when calculating the official Stringency Index). We then combine these adjusted measures into our own index using the same equally-weighted methodology as employed when calculating the official Stringency Index. Our adjusted index has a somewhat stronger relationship with our three measures of success than OxCGRT’s Stringency Index, validating our approach to reducing the score of any given indicator by half when the measure is targeted rather than general in nature. Explaining The Magnitude Of The Cross-Country Spread For the 30 countries included in our analysis, Chart 2 illustrates the relationship between the degree of the virus’ spread (both in terms of current per capita confirmed cases and fatalities) and the average level of our adjusted stringency index in the early phase of each country’s outbreak. Chart 2At First Blush, Stringency Does Not Appear To Predict The Ultimate Magnitude Of The Spread…
COVID-19 Containment Measures: The Evidence On Effectiveness, And What It Means For Investors
COVID-19 Containment Measures: The Evidence On Effectiveness, And What It Means For Investors
Given the persistent findings from epidemiological models that efforts to contain pandemics must occur quickly, we define this early phase as the first six weeks following the day in which a country reached five confirmed cases. This point was reached in late-January in most Asian countries, Australia, the US, and some parts of Europe, and in February for almost all of the remaining developed economies that we examined. Emerging market economies reached this point in the first half of March. The chart makes it clear that the average stringency of containment measures during this early phase has little power to predict the ultimate magnitude of the spread when considering all 30 countries. However, the charts also highlight that several European countries – Belgium, Italy, the Netherlands, Spain, and Switzerland – are significant outliers, especially in terms of per capita fatalities. Chart 3 removes these outlying nations, and underscores that the degree to which the virus ultimately spread across countries is better explained for the remaining countries by the early stringency of their response. The higher the stringency of the measures, the lower the current (or peak) number of per capita cases and deaths. Chart 3…But The Relationship Is Stronger After Excluding Outlying European Nations
COVID-19 Containment Measures: The Evidence On Effectiveness, And What It Means For Investors
COVID-19 Containment Measures: The Evidence On Effectiveness, And What It Means For Investors
Table 2 shows the R-squared values for each of the individual measures, including and excluding the five outlying countries noted above. The first noteworthy point from Table 2 is that the indicators appear to have a better ability to predict fatalities than confirmed cases, which is true for nearly all of the indicators across all three measures of success that we examine in this report. To us, this emphasizes a point that has become apparent over the past two months, namely that the meaningfulness of confirmed case data varies significantly across countries due to differences in testing practices and availability. To use the parlance of global macro analysts, confirmed cases are “soft data,” whereas fatalities (and hospitalizations) represent “hard data.” Of course, as is also the case in global macro analysis, the soft data tends to lead the hard data, which helps explain why confirmed cases of the disease will remain an important leading indicator for the US economy until they largely capture asymptomatic and mild cases that are not likely to lead to hospitalization or death. Table 2School Closures, Canceling Public Events, And International Travel Restrictions Seem To Explain Lower Fatalities
COVID-19 Containment Measures: The Evidence On Effectiveness, And What It Means For Investors
COVID-19 Containment Measures: The Evidence On Effectiveness, And What It Means For Investors
The second noteworthy point is that while none of the measures have particularly strong predictive power for all countries, several do when the outliers are removed. Importantly, strong restrictions on international travel during the early outbreak phase show up as being the most important predictor of reduced fatalities per capita, followed closely by school closures. The cancellation of public events, public information campaigns, and domestic travel restrictions also appear to be relatively important predictors. Notably, cross-country differences in testing policies and the comprehensiveness of contact tracing do not seem to explain the variation in per capita cases and fatalities. As a final point on the magnitude of the spread of COVID-19, it is not immediately clear why the five European countries that we highlighted have been such sizeable outliers in the direction of higher per capita cases and fatalities despite seemingly stringent measures. At present, we have two theories: Given the importance of early and strong restrictions on travel highlighted in Table 2, it is possible that the efficacy of these restrictions has somehow been lower in these countries. It is possible that higher cases and fatalities in these countries can be explained by differences in the management of nursing homes and other elder care facilities, a factor that is not directly measured in the OxCGRT data. On the latter point, data from the Canadian province of Quebec underscores the impact of managing (or mismanaging) long-term care facilities. While Chart 3 highlights that Canada’s experience as a whole appears to be reasonably well-explained by the fairly low stringency of its response during the early phase of its outbreak, the province of Quebec has incurred a particularly high per capita fatality rate that is on par with the outlying European countries that we noted. Chart 3…But The Relationship Is Stronger After Excluding Outlying European Nations
COVID-19 Containment Measures: The Evidence On Effectiveness, And What It Means For Investors
COVID-19 Containment Measures: The Evidence On Effectiveness, And What It Means For Investors
Chart 4Mismanaging Elder Care Facilities Significantly Affects The Fatality Rate
COVID-19 Containment Measures: The Evidence On Effectiveness, And What It Means For Investors
COVID-19 Containment Measures: The Evidence On Effectiveness, And What It Means For Investors
Chart 4 presents a breakdown of cumulative Quebec COVID-19 fatalities by place of residence, which clearly demonstrates the impact of public and private nursing homes on the overall fatality rate. The death toll in publicly-funded homes has been particularly high, which even after accounting for the higher proportion of elderly residents in these types of facilities points to mismanagement and/or inadequate funding as key drivers of the disease’s spread (and thus fatalities given that nursing home residents face high risk from the disease). Similar dynamics may exist in the European countries that we cited, which could help explain their outlier status. Evidence On Hastening A Peak, And Post-Peak Decline, In New Cases & Fatalities Chart 5 presents the relationship between the amount of time needed to reach a peak in new cases and fatalities and the measure we used to predict the virus’ spread: the average level of our adjusted stringency index in the early phase of each country’s outbreak. Chart 5Stringent Early Measures Shorten The Time To A Peak In New Cases And Fatalities
COVID-19 Containment Measures: The Evidence On Effectiveness, And What It Means For Investors
COVID-19 Containment Measures: The Evidence On Effectiveness, And What It Means For Investors
Table 3School Closures, Workplace Closures, And Canceling Public Events Seem To Explain Lower Days To Peak Cases And Fatalities
COVID-19 Containment Measures: The Evidence On Effectiveness, And What It Means For Investors
COVID-19 Containment Measures: The Evidence On Effectiveness, And What It Means For Investors
The charts support the argument that stringent early measures shorten the number of days to a peak in new cases and fatalities. Table 3 presents the predictive power of the individual measures, which highlights some differences in the effectiveness of the measures to hasten the time to peak compared with their ability to predict the ultimate magnitude of the spread of the disease: Workplace closures appear to be somewhat better, and school closures somewhat worse, at predicting the speed at which countries reached a peak in new cases and fatalities than they were at predicting the ultimate magnitude of the spread. Closing public transport and restricting domestic travel were modestly successful at predicting the degree of spread but have essentially no power to predict the variation in the time to peak. Finally, restricting international travel was the strongest predictor of the degree of spread but also had essentially no power to predict the amount of time needed to reach a peak in new cases. As noted above, we use the average level of our adjusted stringency index as a predictor for both the prevalence of the disease and the time needed to reach a peak in new cases and deaths. Since it is an average of a given period of time, this variable measures a combination of the stringency of the restrictions as well as how early they were deployed. To test the relative importance of the severity of the measures versus the speed at which they occur, we apply the same approach as in Chart 5 but we replace OxCGRT’s score of each measure’s value for each country with a dummy variable (0 for no measures or 1 for any measures, again rescaled to be between 0 - 100) while retaining the penalty for targeted measures described above. In simple terms, we abstract from whether the severity of the measures is low or high and instead focus simply on whether any measures were applied and when. Chart 6 and Table 4 present the results. With the exception of a country’s testing policy’s ability to predict confirmed cases, the charts and table show that there is little difference between the full indicators and the dummy versions. This suggests that where general (rather than targeted) measures to reduce the spread of the virus have been effective, they have been so because of the speed of their deployment rather than their strictness. Chart 6The Deployment Speed Of Containment Measures Seems More Important Than Their Strictness
COVID-19 Containment Measures: The Evidence On Effectiveness, And What It Means For Investors
COVID-19 Containment Measures: The Evidence On Effectiveness, And What It Means For Investors
Table 4Small Differences Between The Full Measures And Those Focused Only On The Existence Of Any Response
COVID-19 Containment Measures: The Evidence On Effectiveness, And What It Means For Investors
COVID-19 Containment Measures: The Evidence On Effectiveness, And What It Means For Investors
Finally, Chart 7 and Table 5 present the ability of the various (full) indicators to predict how successful various countries have been at reducing new cases and fatalities following a peak. The chart and table underscore that the measures have not been particularly successful at explaining the degree to which countries have reduced new cases and deaths, with the exception of two measures: the cancellation of public events and contact tracing. And in the case of the latter, the prevalence of contact tracing appears to help explain greater reductions in new cases, but only weakly explains reduced fatalities. Chart 7Overall, Stringency Does Not Predict Success At Reducing New Cases And Fatalities Following A Peak
COVID-19 Containment Measures: The Evidence On Effectiveness, And What It Means For Investors
COVID-19 Containment Measures: The Evidence On Effectiveness, And What It Means For Investors
Table 5Canceling Public Events And Contact Tracing Appear To Have Some Success At Hastening A Post-Peak Decline
COVID-19 Containment Measures: The Evidence On Effectiveness, And What It Means For Investors
COVID-19 Containment Measures: The Evidence On Effectiveness, And What It Means For Investors
Key Takeaways Correlation does not necessarily imply causation, and thus the ability of a particular containment measure to predict differences in COVID-19 outcomes across countries may not always reflect the effectiveness of the measure. Nonetheless, there are several important takeaways from the evidence provided above: The speed at which authorities responded to COVID-19 appears to be among the most important factors contributing to the relative success among countries in combating the pandemic. Implementing general rather than targeted measures does seem to be important, but beyond that stringency does not appear to be the key driver differentiating outcomes across countries. Worryingly, the most economically-damaging containment measures (school and workplace closures, event cancellation, stay-at-home orders, and travel restrictions) appear to have been among the most effective measures in combating the pandemic, depending on the measure of success in question. While containment measures appear to have succeeded in bringing about a peak in new cases and fatalities in most developed economies, the evidence shown above highlights how long painful measures need to be in place in order to have an impact. For example, Chart 8 illustrates the relationship between workplace closure and the time to peak in new fatalities; with the exception of Hong Kong, even in the countries that acted quickly and forcefully to close workplaces it took over a month to reach a peak. To the extent that global policymakers are aware of the relative importance of restrictions on international travel in limiting the ultimate spread of the disease in the countries we examined, that may suggest that international borders will remain closed or severely restricted for some time or will reoccur very quickly if evidence of a secondary infection wave were to emerge later this year. Chart 8Reaching A Peak In Fatalities Is Costly Even For Countries That Act Quickly
COVID-19 Containment Measures: The Evidence On Effectiveness, And What It Means For Investors
COVID-19 Containment Measures: The Evidence On Effectiveness, And What It Means For Investors
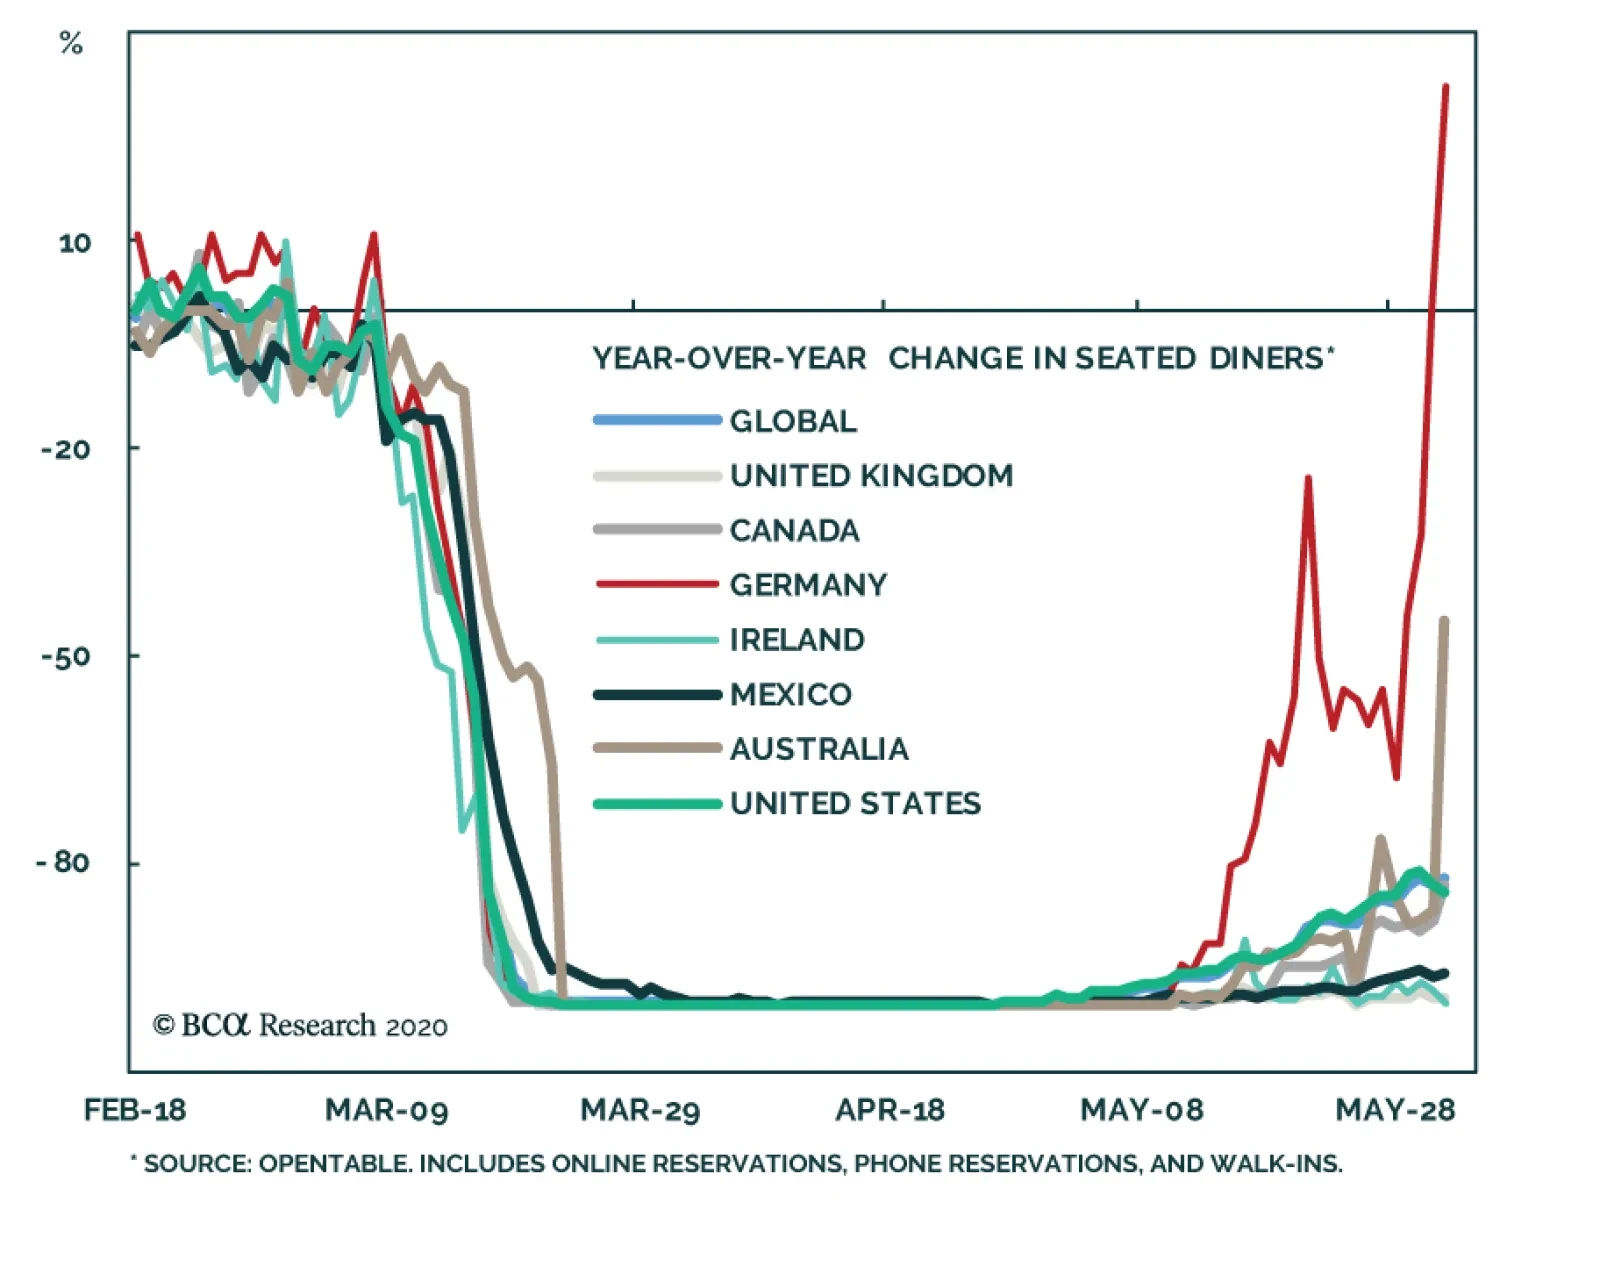
There is another important insight for investors that is not immediately apparent from our work, but emerges when we examine two surprising findings. Looking closely, investors can infer that the public’s awareness and fear of the disease has contributed to successes in combating COVID-19, in ways that are not readily captured by the OxCGRT’s data. To us, the key observation is that both closures of public transportation and the forcefulness of stay-at-home orders showed themselves to be mediocre-to-poor predictors, when it seems straightforward to see that reduced crowding on buses and subways and physical distancing have very likely helped reduce the spread of the virus. This seeming discrepancy is likely resolved by the fact that the public acted themselves to take these measures out of fear of getting sick, meaning that cross-country differences in rules pertaining to these measures have not been especially relevant in predicting outcomes. Chart 9 supports this point by highlighting that subway ridership in New York city fell well before the city issued a mandatory stay at home order, as did the median year-over-year growth rate in US seated restaurant diners before the first stay at home order was issued in the US (Chart 10). Chart 9New York City Subway Ridership Fell Well Before The Stay-At-Home Order Was Issued
COVID-19 Containment Measures: The Evidence On Effectiveness, And What It Means For Investors
COVID-19 Containment Measures: The Evidence On Effectiveness, And What It Means For Investors
Chart 10Diners Started Avoiding Restaurants Before Any Stay-At-Home Orders Were Issued
COVID-19 Containment Measures: The Evidence On Effectiveness, And What It Means For Investors
COVID-19 Containment Measures: The Evidence On Effectiveness, And What It Means For Investors
Chart 11Sweden Is A Very Big Outlier In Terms Of Where The Stringency Of Its Measures Peaked
COVID-19 Containment Measures: The Evidence On Effectiveness, And What It Means For Investors
COVID-19 Containment Measures: The Evidence On Effectiveness, And What It Means For Investors
The importance of public behavior in altering the spread of COVID-19 is also evident from Sweden’s experience, albeit in a different way than has been commonly discussed. The charts above highlighted that Sweden has indeed been somewhat of an outlier in terms of its experience with COVID-19 relative to the stringency of its early response, but there have been a few other countries with similar experiences. Where Sweden has been a very significant outlier is the level at which its Stringency Index peaked, at least compared with other advanced economies (Chart 11). And yet, Sweden appears to have achieved a peak in new fatalities based on the data available today. Swedish policymakers have cited the country’s high levels of social trust and cohesion as part of the reason why more strict measures were not absolutely necessary to prevent an uncontrollable/exponential spread of the disease, and we see no reason to doubt that this has been an important, if not crucial, factor – Scandinavian countries have long ranked highly on these types of characteristics. Investment Conclusions The first important point for investors is that our findings are generally consistent with the recommendations of health experts today and the historical experience of the Spanish flu. One of the key lessons of the Spanish flu is that removing or relaxing measures too early can lead to a renewed rise in mortality rates,1 and it thus seems clear that the reopening of economies before the first wave of infections has fully dissipated increases the odds of a second wave. In this regard, it appears that US equity investors are making a risky bet in extrapolating early reopening. Second, the fact that the public's behavior can significantly alter COVID-19 outcomes across countries has both potentially positive and negative implications for the odds of a secondary infection wave and for near-term economic growth. For the economy, it implies the possibility of sustainable economic reopening alongside a controllable risk of renewed spread if the public can be convinced to treat the ongoing risk of the disease very seriously without fearing it. This outcome may be more likely if mask wearing in public – a variable not captured in OxCGRT’s data – becomes and remains widespread in advanced, western economies. At the same time, it may also suggest that the “Swedish approach” of accepting higher fatalities in exchange for lighter containment measures within the context of a “controlled” spread of the disease may not be possible in other countries, if Sweden does indeed enjoy higher levels of social trust and cohesion compared with other countries and if these factors have been key in preventing the disease from spreading there at an exponential rate. Finally, our analysis has underscored that fighting a secondary infection wave, were one to occur, would be enormously costly even if more effective and less blunt containment measures succeeded at preventing uncontrolled spread. Given this, and the higher risk of increased infections introduced by economic reopening and the recent widespread protests in the US, we recommend that investors remain tactically neutral equities versus bonds within the context of a cyclically-overweight stance. Jonathan LaBerge, CFA, Vice President Special Reports jonathanl@bcaresearch.com Footnotes 1 Please see Global Asset Allocation Special Report, “Lessons From The Spanish Flu,” dated May 20, 2020. Global Investment Strategy View Matrix
COVID-19 Containment Measures: The Evidence On Effectiveness, And What It Means For Investors
COVID-19 Containment Measures: The Evidence On Effectiveness, And What It Means For Investors
Current MacroQuant Model Scores
COVID-19 Containment Measures: The Evidence On Effectiveness, And What It Means For Investors
COVID-19 Containment Measures: The Evidence On Effectiveness, And What It Means For Investors

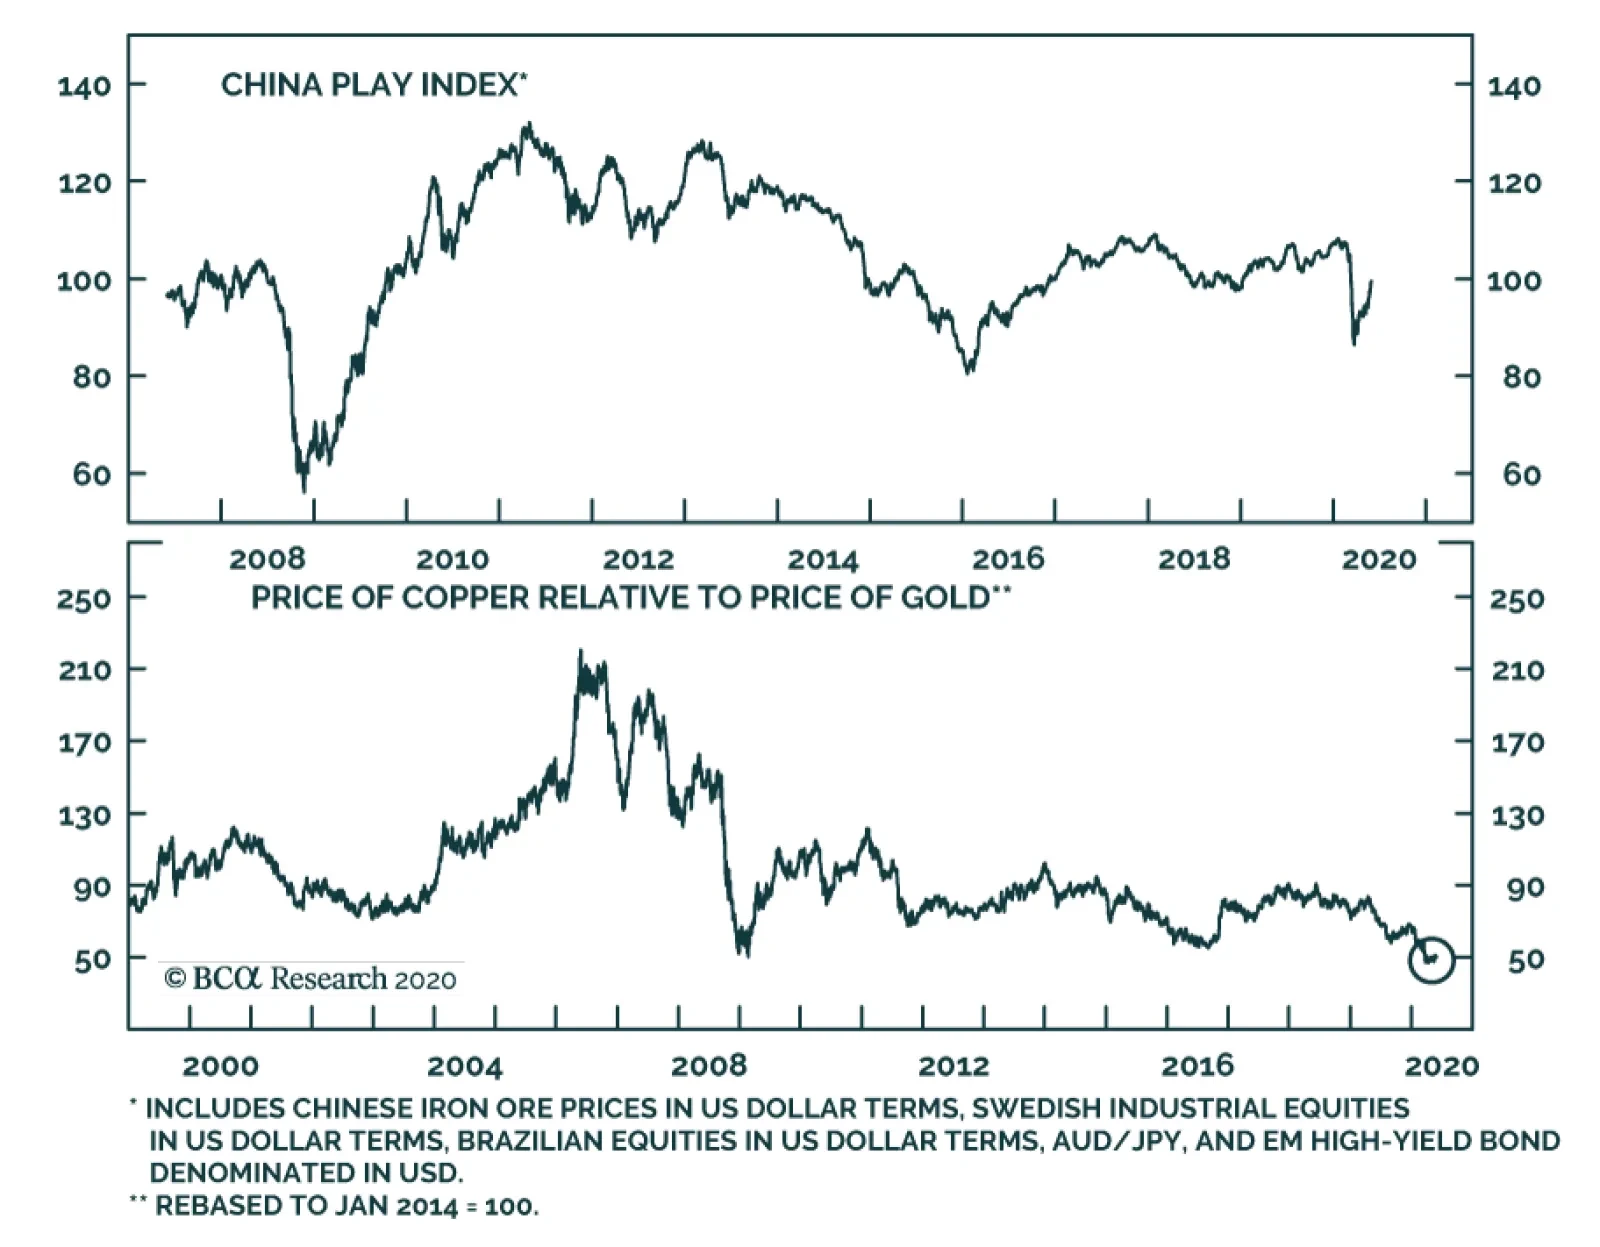
BCA Research's Commodity & Energy Strategy service expects copper prices to rise further this year, despite tactical worries. Copper prices will end the year higher versus current levels. However, uncertainty remains elevated. Assessing the…
A common refrain is that equities have moved fast ahead of any reasonable expectation of the speed of the recovery. At first glance, this argument is compelling, but the reality is more complex. The stock-to-bond ratio is pricing in a quick recovery from…
Germany and Australia offer an optimistic glimpse into the outlook for growth among advanced economies. Along with New Zealand, they stand at the vanguard of economies re-opening after painful lockdowns. The service sector has been hard hit by the…
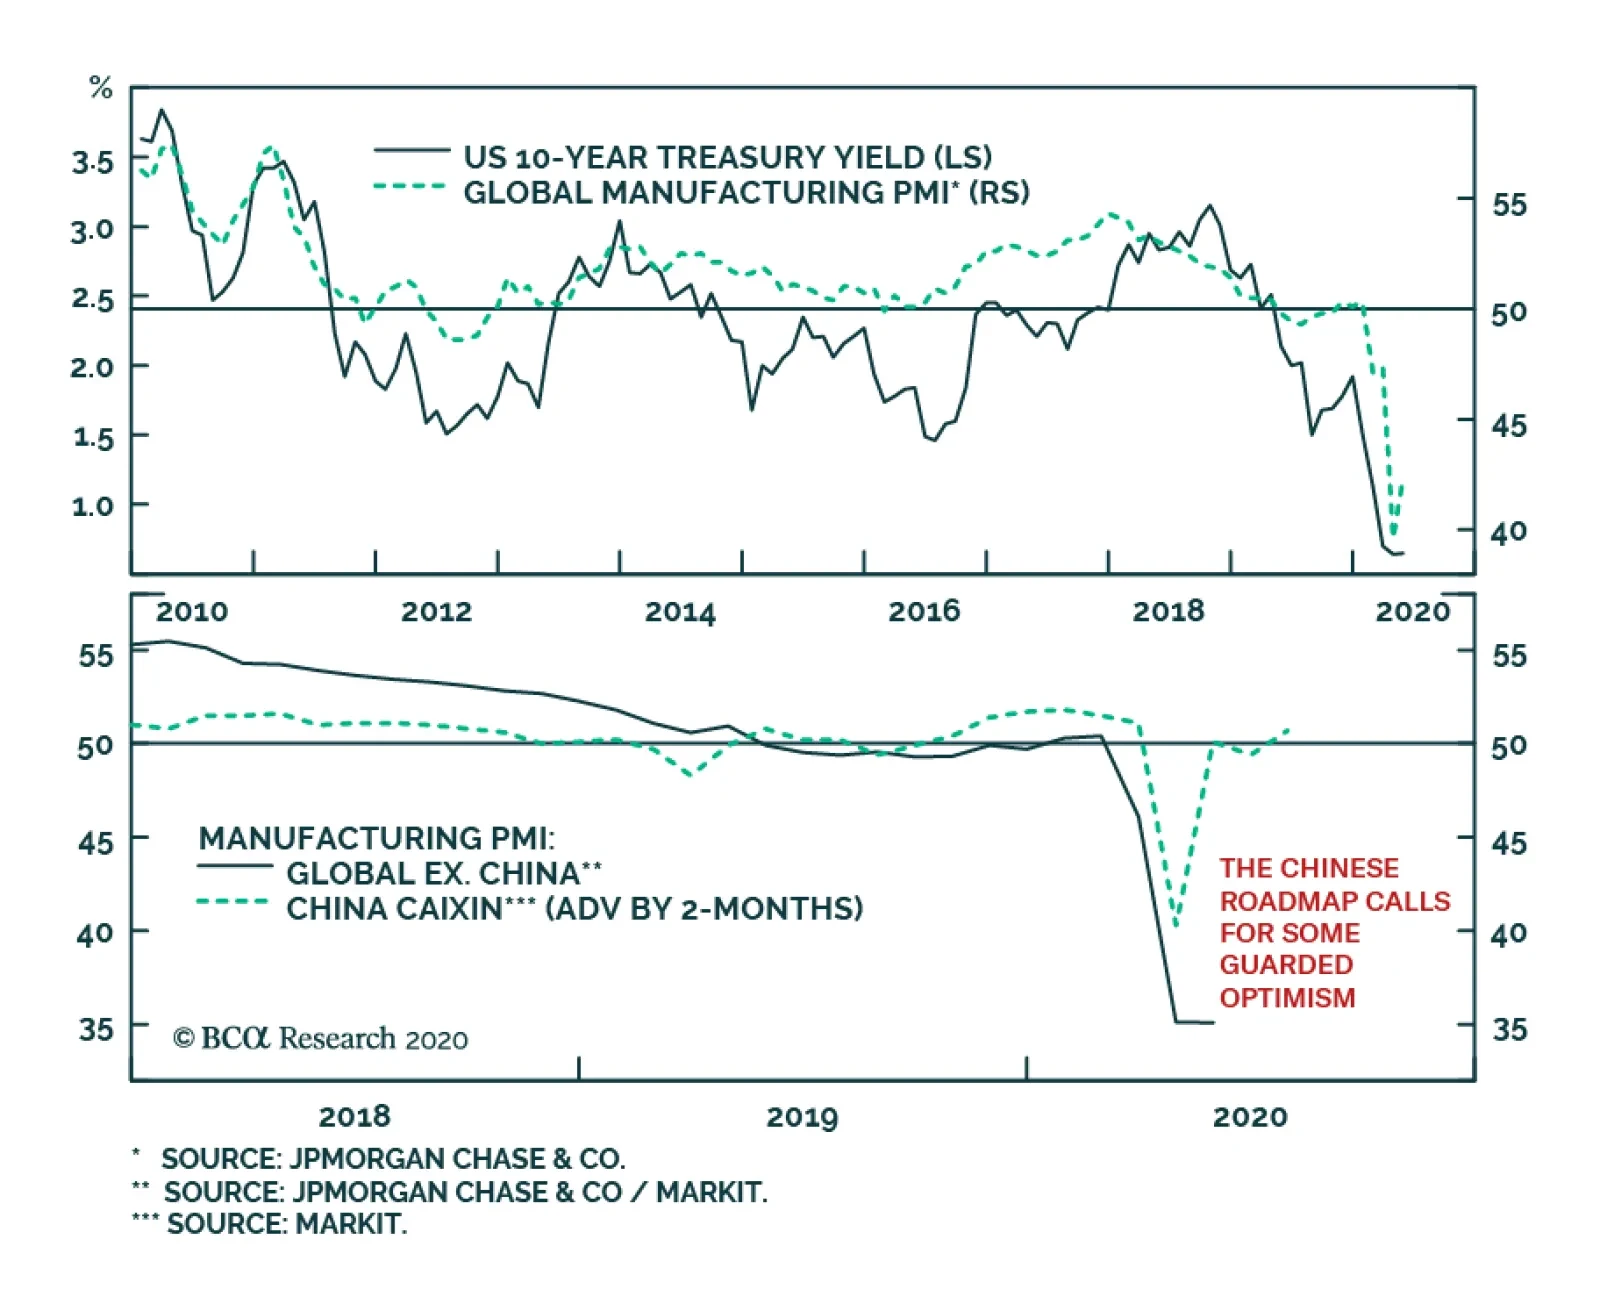
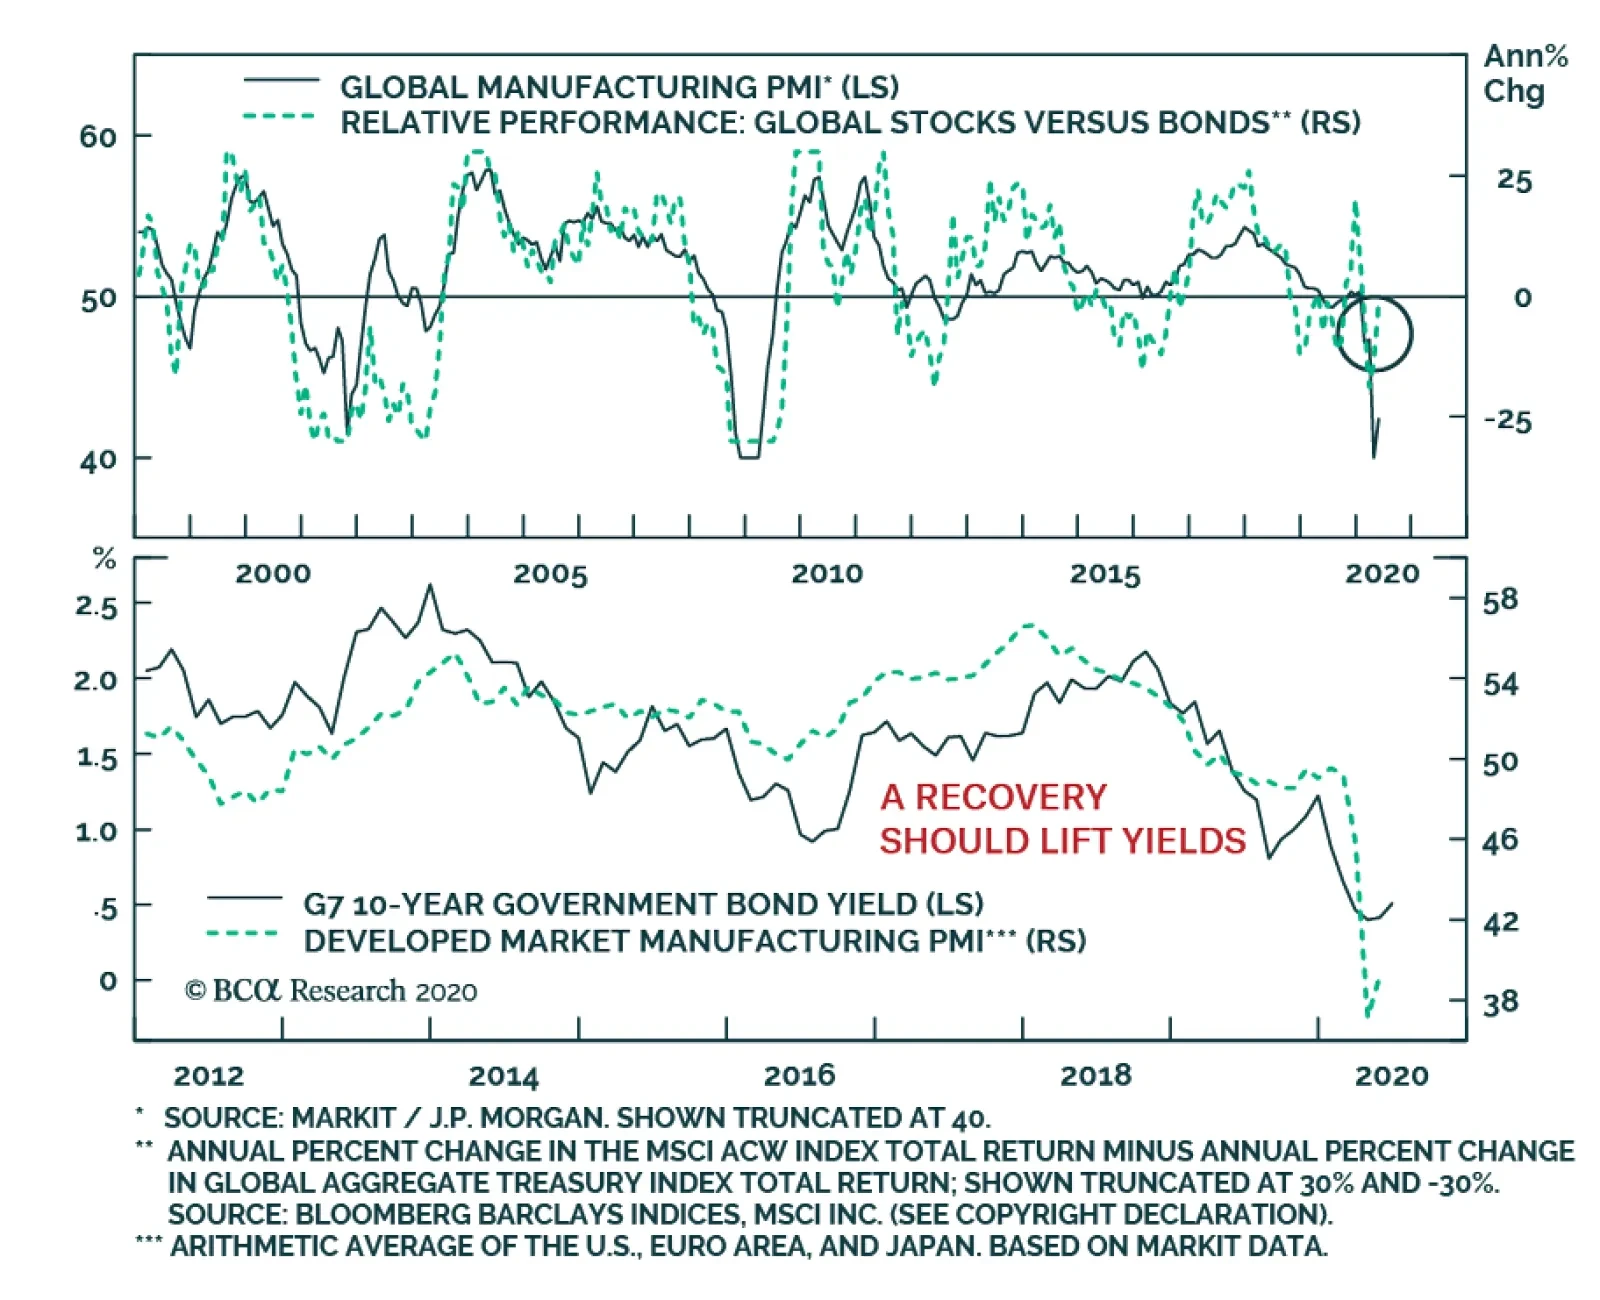
The global manufacturing PMI has begun to pick up, rising to 42.4 in May from its April record lows of 39.6. This improvement is nothing major yet, but it will gather momentum. On this front, the experience of China is very instructive. PMI’s quickly…
The GAA DM Equity Country Allocation model is updated as of May 29, 2020. The model has not made any significant change this month. It has kept the same order for the top four overweight countries (Spain, Australia, Sweden, and the US) as well as the four large underweight countries (Japan, the UK, France, and Switzerland), as shown in Table 1. Table 1Model Allocation Vs. Benchmark Weights
GAA Quant Model Updates
GAA Quant Model Updates
As shown in Table 2 and Charts 1, 2 and 3, the overall model outperformed the MSCI World benchmark in May by 29 bps. The Level 1 model outperformed 2 bps because of the overweight in the US. The Level 2 model outperformed by 85 bps thanks to the overweight of Sweden, Germany and the Netherlands, as well as the underweight in the UK and Switzerland. Since going live, the overall model has outperformed its MSCI World benchmark by 180 bps, with 246 bps of outperformance from the Level 2 model, and 33 bps of outperformance from the Level 1 model. Table 2Performance (Total Returns In USD %)
GAA Quant Model Updates
GAA Quant Model Updates
Chart 1GAA DM Model Vs. MSCI World
GAA DM Model Vs. MSCI World
GAA DM Model Vs. MSCI World
Chart 2GAA US Vs. Non US Model (Level 1)
GAA US Vs. Non US Model (Level 1)
GAA US Vs. Non US Model (Level 1)
Chart 3GAA Non US Model (Level 2)
GAA Non US Model (Level 2)
GAA Non US Model (Level 2)
For more on historical performance, please refer to our website https://www.bcaresearch.com/site/trades/allocation_performance/latest/G…. For more details on the models, please see Special Report, “Global Equity Allocation: Introducing The Developed Markets Country Allocation Model,” dated January 29, 2016, available at https://gaa.bcaresearch.com. Please note that the overall country and sector recommendations published in our Monthly Portfolio Update and Quarterly Portfolio Outlook use the results of these quantitative models as one input, but do not stick slavishly to them. We believe that models are a useful check, but structural changes and unquantifiable factors need to be considered as well when making overall recommendations. GAA Equity Sector Selection Model Chart 4Overall Model Performance
Overall Model Performance
Overall Model Performance
The GAA Equity Sector Model (Chart 4) is updated as of May 29, 2020. The model’s relative tilts between cyclicals and defensives have changed compared to last month. The model reversed its defensive stance implemented throughout March and April and is now tilted towards cyclical sectors. However, the semi-defensive tilt led the model to outperform its benchmark by 21 basis points during May. Year-to-date, the model has outperformed its benchmark by 88 basis points, and 86 basis points since inception. The model’s global growth proxy improved – mostly driven by EM currencies and commodity prices, and therefore turned positive on various cyclical sectors and reversed its defensive stance implemented in March. Global monetary easing and low rates should keep the liquidity component favouring a mixed bag of cyclical and defensive sectors. The valuation component remains muted across all sectors except Energy. However, multiple sectors are approaching expensive and cheap territories – mainly Info Tech (expensive), and Real Estate (cheap). The model awaits confirming momentum signals to change recommendations for that component. The model is now overweight five sectors in total, four cyclical sectors versus one defensive sectors. These are Information Technology, Consumer Discretionary, Communication Services, Materials and Health Care. Table 3Overall Model Performance
GAA Quant Model Updates
GAA Quant Model Updates
For more details on the model, please see the Special Report “Introducing the GAA Equity Sector Selection Model”, dated July 27, 2016, as well as the Sector Selection Model section in the Special Alert “GAA Quant Model Updates,” dated March 1, 2019 available at https://gaa.bcaresearch.com. Table 4Current Model Allocations
GAA Quant Model Updates
GAA Quant Model Updates
Xiaoli Tang Associate Vice President xiaoliT@bcaresearch.com Amr Hanafy Senior Analyst amrh@bcaresearch.com
Feature The key to how markets will move over the coming 12 months is whether the coronavirus pandemic turns out to be a short-term (albeit severe) disruption to the world economy, or something more fundamentally damaging. Markets currently – with global equities up by 34% since March 23 – are clearly pricing in the former. They seem to be saying that the sudden stop to the economy – with US employment, for example, rising to a post-war high in just two months (Chart 1) – is not a problem, since most of the unemployed are furloughed and will quickly return to work once businesses reopen. Enormous stimulus (direct fiscal spending in G20 countries of 4.6% of GDP, even if loans and guarantees are excluded – Chart 2) and aggressive monetary policy (major central banks’ balance sheets have ballooned by $4.7trn since March – Chart 3) will tide us over until normality returns, and then provide a big boost to risk assets. Unprecedented efforts by drugs companies will soon produce a vaccine against COVID-19. Recommended Allocation
Monthly Portfolio Update: Disruptive Or Damaging?
Monthly Portfolio Update: Disruptive Or Damaging?
Chart 1Can Unemployment Come Down As Quickly?
Can Unemployment Come Down As Quickly?
Can Unemployment Come Down As Quickly?
Chart 2Unprecedented Fiscal…
Monthly Portfolio Update: Disruptive Or Damaging?
Monthly Portfolio Update: Disruptive Or Damaging?
Chart 3...And Monetary Stimulus
...And Monetary Stimulus
...And Monetary Stimulus
All this is possible. Certainly, the amount of excess liquidity being pumped into the economy by central banks (Chart 4) could dramatically boost economic activity and asset prices once the world returns to normal. The newsflow over coming months may largely be positive, with a gradual easing of lockdowns, a rebound in economic data (it cannot mathematically get any worse), and an abatement of the pandemic during the northern hemisphere summer. Many investors remain pessimistic (Chart 5) and so may be pulled into markets if stocks continue to rise. In this environment – and with the alternatives so unattractive (10-year US Treasurys at 0.6% anyone?) – we wouldn’t want to take a bet against equities. Chart 4Liquidity Will Boost Assets - Eventually
Liquidity Will Boost Assets - Eventually
Liquidity Will Boost Assets - Eventually
But is the market ignoring the risks? Easing of lockdown could lead to a flare-up of new COVID-19 cases: China has already had to reintroduce some containment measures when this happened (Chart 6). Chart 5Retail Investors Remain Bearish
Retail Investors Remain Bearish
Retail Investors Remain Bearish
Chart 6What Happens When Lockdowns Are Eased?
Monthly Portfolio Update: Disruptive Or Damaging?
Monthly Portfolio Update: Disruptive Or Damaging?
While COVID-19 cases have peaked in Asia, Europe, and North America, there is a new wave in Emerging Markets, particularly those such as Brazil which were lax in implementing containment measures (Chart 7). Even where the pandemic has waned, consumers seem highly reluctant to go to restaurants (Chart 8) or fly on airplanes (Chart 9). Chart 7The Pandemic Is Shifting To Emerging Economies
The Pandemic Is Shifting To Emerging Economies
The Pandemic Is Shifting To Emerging Economies
Consumer-facing companies may no longer see revenues down by 70% or 80% over the next few months, but they could still be 10% or 20% below normal levels. How many business models are robust enough to survive that? As for a vaccine, it is worth remembering that no vaccine has ever been developed for a coronavirus in humans. We may have to learn to live with the disease. Chart 8Consumers Are Not Yet Going To Restaurants...
Consumers Are Not Yet Going To Restaurants...
Consumers Are Not Yet Going To Restaurants...
Chart 9…Or On Planes
Monthly Portfolio Update: Disruptive Or Damaging?
Monthly Portfolio Update: Disruptive Or Damaging?
The longer the pandemic lasts, the more damaging will be its second-round effects. Already banks are turning more cautious about lending (Chart 10), and rating agencies are rapidly downgrading companies (Chart 11). We are likely to see a wave of corporate defaults, Emerging Market borrowers struggling to service their foreign-currency debts, and banks getting into trouble as a result – though monetary and fiscal bridging programs may defer these problems for a while. Chart 10Banks Are Turning More Cautious...
Banks Are Turning More Cautious...
Banks Are Turning More Cautious...
Chart 11...And Companies Are Being Downgraded
...And Companies Are Being Downgraded
...And Companies Are Being Downgraded
The US/China relationship is also a concern in the run-up to November’s US presidential election. It will be tempting for President Trump to turn tough on China, a policy that could be popular with the US electorate, which has become more anti-China in recent months (Chart 12). Problems over Hong Kong, China failing to hit the import targets it promised in January’s trade agreement, and action against Huawei (whose license expires in mid-August) mean that the conflict could escalate quickly. China would also much prefer Joe Biden as US president, and will do nothing to help President Trump get reelected. Chart 12Being Tough On China Is Popular In The US
Monthly Portfolio Update: Disruptive Or Damaging?
Monthly Portfolio Update: Disruptive Or Damaging?
Chart 13The Dollar Has Not Reacted To The Risk-On Rally
The Dollar Has Not Reacted To The Risk-On Rally
The Dollar Has Not Reacted To The Risk-On Rally
In this environment of unusual uncertainty, we continue to leaven our benchmark-weight position in global equities with relatively cautious tilts: overweight the lower-beta US market and structural-growth sectors such as Healthcare and Tech. We maintain our large position in cash, and would continue to hold gold as a hedge against tail risks. The risk to this view is that over coming months – if the environment continues to stabilize – there is a vicious rotation into pure cyclical plays, perhaps driven by a fall in the US dollar (which has until recently been surprisingly stable during the past two months’ risk-on rally – Chart 13), a rise in commodity prices, and higher long-term interest rates. This scenario would trigger outperformance by Emerging Markets and eurozone stocks, and value-oriented sectors such as Materials and Financials. This might be possible for a short period but, given the risks highlighted above, we would not recommend long-term investors to shift their portfolios in this direction. Equities: Our “minimum volatility” approach has worked well: US equities and structural growth sectors such as Healthcare and Tech continued to outperform both during the sell-off in February and March and in the subsequent rebound (Chart 14). For now, we prefer to stick to this cautious stance on a 12-month investment horizon. It is possible, though, that there could be some short-term rotation into value and small cap stocks if the environment improves further over the next couple of months (Chart 15). We are partially hedged against this sort of upside surprise through our overweight in Industrials (which would benefit from a ramp-up in Chinese infrastructure spending, in particular) and neutral on Emerging Markets and Australia. Chart 14"Min Vol" Equities Have Outperformed
"Min Vol" Equities Have Outperformed
"Min Vol" Equities Have Outperformed
Chart 15Could There Be A Shift To Value And Small Caps?
Could There Be A Shift To Value And Small Caps?
Could There Be A Shift To Value And Small Caps?
Fixed Income: Government bond yields have not risen despite the risk-on rally, and we expect this to remain the case. Continuing uncertainty, central bank insistence that easy monetary policies will stay in place for a long time, and deflationary pressures over coming months warrant a neutral stance on duration – though returns from high-quality government bonds will be around zero. In the longer-run, however, the pandemic is likely to prove inflationary: like in a post-war environment, excess liquidity, supply constraints, and pent-up demand could push up consumer prices in 12 months’ time. Consumers are already noticing that the goods they are actually buying now (as opposed to the weightings in the consumption basket used to measure inflation) are rising in price (Chart 16). We recommend TIPS as a hedge, particularly given how cheap they are (with the 10-year breakeven at only 1.2%). Corporate credits that are supported by central bank buying remain attractive, although with spreads having already contracted the easy money has been made (Chart 17). BCA Research’s fixed-income strategists prefer US and UK investment-grade and BB-rated corporate bonds in the Media, Financials and Energy sectors.1 Chart 16Consumers Are Sniffing Out Inflation
Consumers Are Sniffing Out Inflation
Consumers Are Sniffing Out Inflation
Chart 17The Easy Money Has Been Made In Credit
The Easy Money Has Been Made In Credit
The Easy Money Has Been Made In Credit
Currencies: It will pay to watch the US dollar. It is overvalued and no longer supported by interest rate differentials, but as a safe haven currency has seen inflows given global economic uncertainty. For now, we remain neutral. Emerging Market currencies are likely to remain under pressure, particularly since EM central banks have followed the example of their Developed Market counterparts and for the first time embarked on QE to boost their economies (Chart 18). This could lead to rising inflation in some EMs, as central banks essentially monetize government debt. Chart 18EM Central Banks Are Starting QE Too
EM Central Banks Are Starting QE Too
EM Central Banks Are Starting QE Too
Commodities: China has quietly been ramping up its credit growth, and this will eventually have a positive impact on industrial metals prices, which have showed tentative signs of bottoming (Chart 19). The rebound in oil prices has further to run. OPEC oil production is likely to fall by around 4 million barrels/day from its Q4 2019 level, with further output drops from capital-constrained North American shale producers (Chart 20). Chart 19Industrial Commodities Bottoming?
Industrial Commodities Bottoming?
Industrial Commodities Bottoming?
Harder to predict is how quickly demand – currently down around 15% year-on-year – will recover. BCA Research’s oil strategists, based on an assumption of a strong demand revival in H2, forecast Brent crude to rise above $50 a barrel by end-2020. Chart 20Oil Supply Has Fallen Significantly
Oil Supply Has Fallen Significantly
Oil Supply Has Fallen Significantly
Garry Evans, Senior Vice President Global Asset Allocation garry@bcaresearch.com Footnotes 1 Please see Global Fixed Income Strategy, "Hunting For Alpha In The Global Corporate Bond Jungle," dated May 27, 2020, available at gfis.bcaresearch.com. Recommended Asset Allocation
BCA Research's Geopolitical Strategy team analyzed some near-term geopolitical risks to the rally. They recommend a tactically defensive stance. The rally faces significant near-term risks because of the potential for tumultuous political and geopolitical…