Global
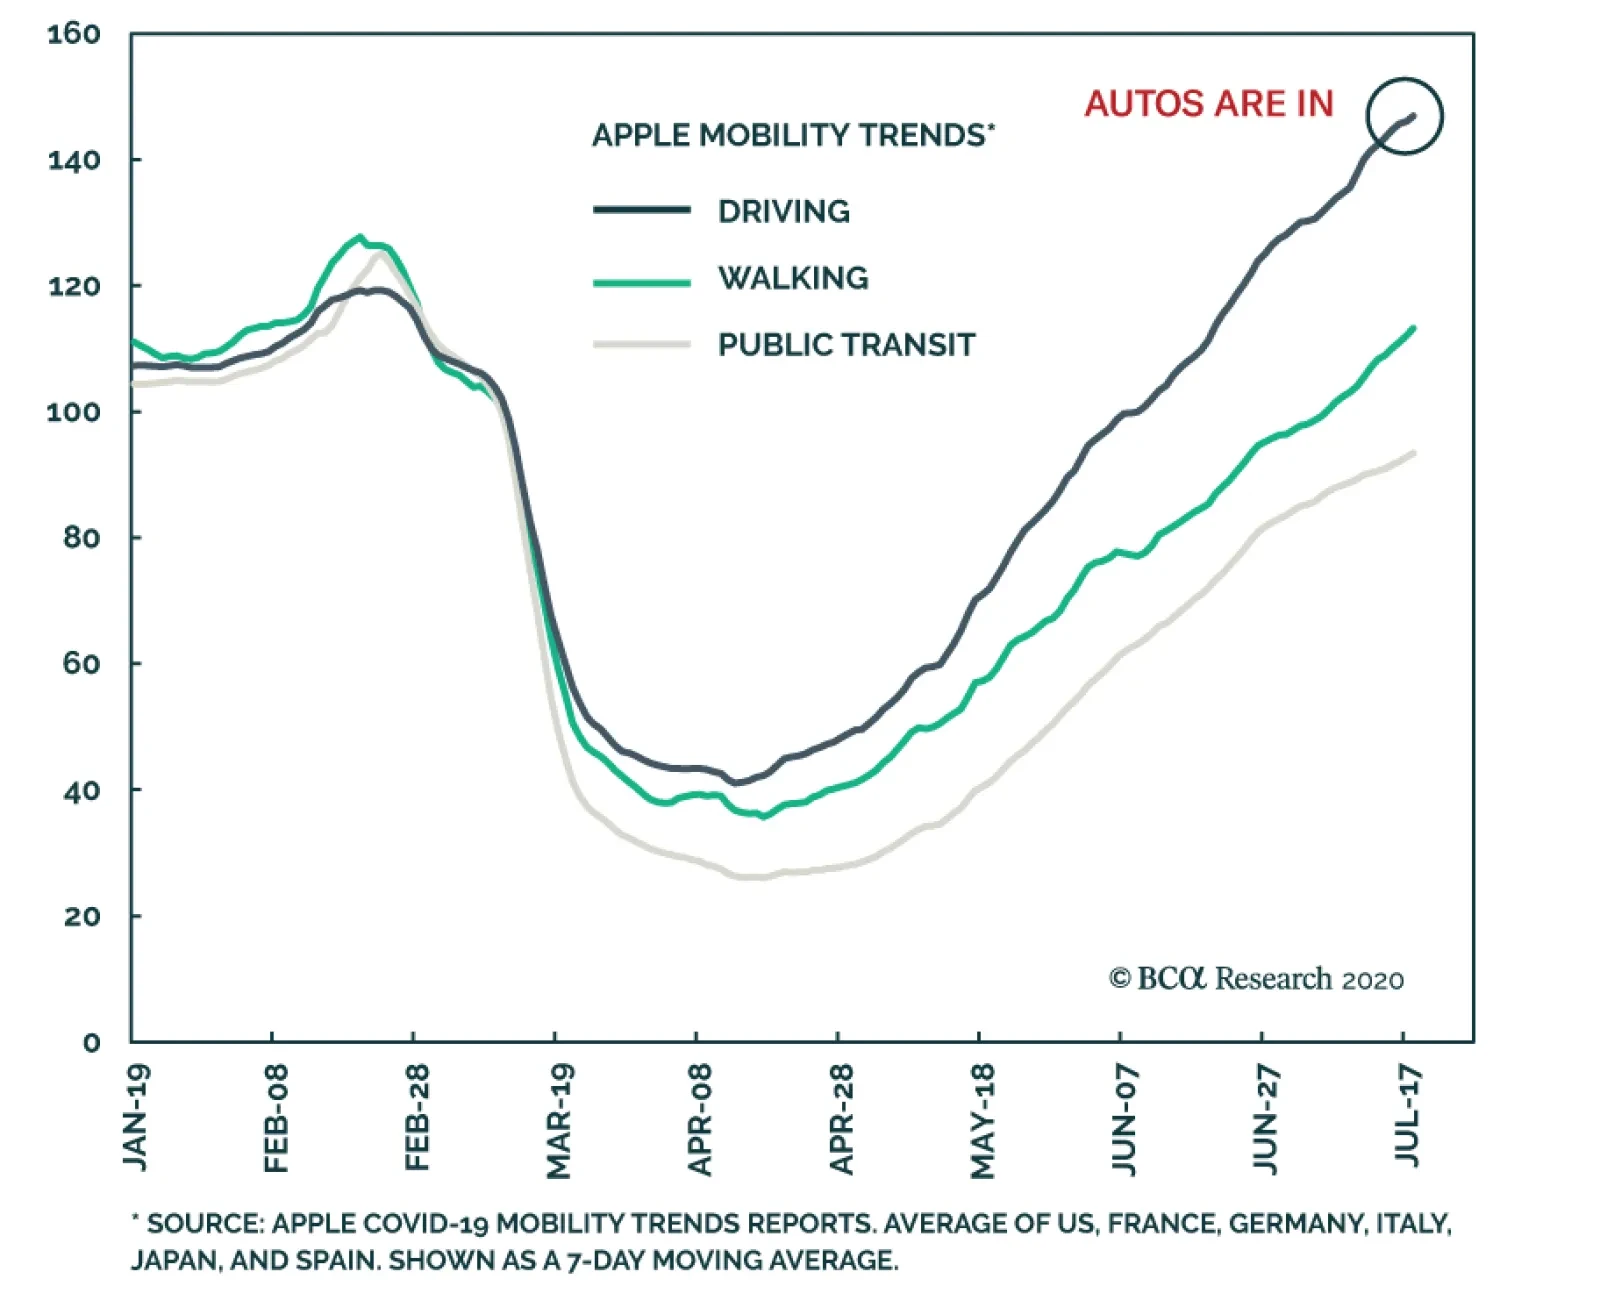
As economies re-open, the mobility of citizens is picking up around the world. According to Apple Mobility data, while people are walking more than they did prior to the pandemic, they are using public transportation significantly less. This is unsurprising,…

Highlights US consumer spending will stall this summer in response to the rising number of Covid cases. Worries about the looming fiscal cliff could also dampen sentiment. Markets are likely to trade nervously over the coming days, but ultimately, stocks will resume their uptrend. The number of new cases already seems to be peaking in some southern US states, and there is no political will to rescind fiscal stimulus. Many institutional investors missed out on the equity rally and will be keen to “buy the dip” on any opportunity. The drop in government bond yields since the start of the year has more than offset the decline in earnings expectations. As odd as it sounds, the pandemic may have raised the fair value of equities. If one wants to challenge this conclusion, one needs to demonstrate that: 1) earnings estimates have not fallen enough; 2) government bond yields have been artificially suppressed; or 3) the post-pandemic world justifies a higher equity risk premium. While there is some truth to all three arguments, they are unlikely to hold much sway over the next 12 months, provided that global growth rebounds and governments and central banks maintain ultra-accommodative fiscal and monetary policies. Investors should remain overweight global equities, while tilting their exposure to beaten-down cyclically-geared stocks and non-US markets. The equity bull market will only end when central banks get panicky about rising inflation, which is unlikely to happen for the next three years. From ROMO To FOMO People often talk about FOMO (the Fear of Missing Out). But for many institutional investors, the past four months has been more about ROMO – the Reality of Missing Out. Chart 1Many Investors Are Bearish On Stocks
Many Investors Are Bearish On Stocks
Many Investors Are Bearish On Stocks
Many investment professionals missed the rally that began in March, and not much has changed since then. The July BofA Merrill Lynch Survey of Fund managers revealed that fund managers are almost one standard deviation overweight cash and nearly one standard deviation underweight equities. In fact, cash allocations increased further since June. The latest sentiment survey conducted by the American Association of Individual Investors (AAII) tells a similar story. Bears exceeded bulls by 15 points in this week’s tally, one of the highest spreads on record (Chart 1). This is not what market tops look like. Near-Term Worries Granted, risks abound. The Google Mobility Index has hooked lower, reflecting the worsening Covid outbreak in the sunbelt states and parts of the Midwest. This real time index tends to track economic activity quite well (Chart 2). At this point, it is reasonable to expect the recovery in US consumer spending to stall this summer. Chart 2Covid Outbreak Is Weighing On Spending
Global Equities Can Still Go Higher
Global Equities Can Still Go Higher
Worries about the fiscal cliff could also dampen sentiment. Unemployment benefits for the average American worker are set to fall by more than 60% at the end of July. The funds in the Paycheck Protection Program for small businesses are also running out. To make matters worse, many state and local governments, which began their fiscal year in July, are facing a severe cash crunch due to evaporating tax revenues and rising social spending obligations. Meanwhile, the US elections are only four months away. If the Democrats win the White House and take control of the Senate, the Trump tax cuts will be in jeopardy. Joe Biden has pledged to lift corporate tax rates halfway back to their original levels. This would reduce S&P 500 EPS by about 6%. Risks In Perspective While the discussion above suggests that stocks could trade nervously over the coming days, we should keep things in perspective. The number of new Covid cases has been trending lower in Arizona over the past week and may be close to peaking in the other southern states (Chart 3). Positive news on the vaccine front could also buoy sentiment. Chart 3A Snapshot Of The Number Of New Cases In The Most Afflicted US States
Global Equities Can Still Go Higher
Global Equities Can Still Go Higher
With respect to the fiscal cliff, there is a very high probability that Congress will reach a deal on a new aid package worth around $2.5 trillion. Table 1 shows stimulus remains politically popular nationwide and, more importantly, in the swing states. Table 1There Is Much Public Support For Fiscal Stimulus
Global Equities Can Still Go Higher
Global Equities Can Still Go Higher
If Democrats prevail in November and raise corporate taxes, most of the revenue gained will be plowed back into the economy. Given that empirical estimates suggest that the spending multiplier from the corporate tax cuts was quite small, the net effect will probably be stimulative.1 The risk of an all-out trade war with China would also decline under a Biden administration, which is something the stock market would welcome. Some might contend that stocks are already pricing in a very rosy outlook. However, as we argue below, it is far from clear that this is the case. Has All The Good News Been Priced In? An NPV Analysis The fair value of the stock market can be represented as the expected stream of cash flows that shareholders will receive, deflated by an appropriate discount rate. The discount rate, in turn, can be expressed as a risk-free rate plus an equity risk premium (ERP). The ERP compensates investors for holding riskier stocks compared to safer government bonds. At the start of the year, Wall Street analysts expected S&P 500 earnings to increase by 9% in 2020 and by 11% in both 2021 and 2022. Today, analysts expect earnings to shrink by 23% in 2020, but then rebound by 29% in 2021. This would essentially take earnings back to last year’s levels. Looking further out, analysts expect earning to recover a further 17% in 2022, which would put them on track to reach their pre-pandemic trend by 2024. In contrast, market participants see little scope for a recovery in bond yields (Chart 4). According to the forward curve, the US 10-year is poised to rise from 0.62% at present to just 1.3% in five years’ time. At the start of 2020, investors thought the 10-year yield would be 2.5% in 2025. Along the same vein, the 30-year bond yield is down 106 bps since the start of the year. The 30-year TIPS yield has fallen by 82 bps. Since stocks are a long duration asset, the TIPS yield is a good proxy for the inflation-adjusted, risk-free component of the discount rate. Chart 4After Nosediving, Bond Yields Aren’t Expected To Rise By Much
After Nosediving, Bond Yields Aren't Expected To Rise By Much
After Nosediving, Bond Yields Aren't Expected To Rise By Much
Chart 5 shows that if we combine the change in analyst earnings expectations with the drop in the TIPS yield, the net present value (NPV) of S&P 500 earnings has risen by a staggering 16.2% since the start of the year. Chart 5The Present Value Of Earnings: A Scenario Analysis
Global Equities Can Still Go Higher
Global Equities Can Still Go Higher
Really? It might seem preposterous to conclude that the fair value of the S&P 500 may have increased at a time when the US and the rest of the world have plunged into the deepest recession since the 1930s. Yet, it naturally flows from the premise that the hit to earnings from the pandemic will be temporary, while the decline in bond yields will be much longer lasting. If one wants to challenge this conclusion, one needs to demonstrate that: 1) earnings estimates have not fallen enough; 2) government bond yields have been artificially suppressed; or 3) the post-pandemic world justifies a much higher equity risk premium. Let us examine all three arguments in turn. Are Earnings Estimates Too Optimistic? The short answer is yes. However, this does not say very much. As Chart 6 shows, analysts are usually too optimistic. They typically start every year with overinflated estimates, and subsequently have to scale them down. This happens even during economic expansions. Thus, if estimates end up being trimmed over the coming months, this will not necessarily prevent stocks from moving higher. Chart 6Earnings Estimates Tend To Be Revised Down Even In The Best Of Times
Are Earnings Estimates Too Optimistic? Earnings Estimates Tend To Be Revised Down Even In The Best Of Times
Are Earnings Estimates Too Optimistic? Earnings Estimates Tend To Be Revised Down Even In The Best Of Times
Of course, magnitudes matter a lot. If analysts end up having to revise estimates down more than usual, this could hurt stocks. But will they? That is far from a foregone conclusion. Earnings usually follow the path of nominal GDP. The Congressional Budget Office (CBO) expects the level of nominal GDP to be just half a percentage point lower in 2021 than it was in 2019. In this light, the notion that earnings next year will be on par with last year’s levels does not seem that farfetched. Moreover, one should also note that health care and technology are highly overrepresented on Wall Street compared to Main Street. Together, they account for 42% of S&P 500 market capitalization. Outside these two sectors, S&P 500 earnings are expected to be 9% lower in 2021 relative to 2019. In any case, the conclusion that the pandemic has increased the fair value of equities would not change much if we were to assume that earnings recover more slowly than anticipated. The red colored bar in Chart 5 shows the impact on the NPV in a scenario where earnings only return to their pre-pandemic trend by 2030: the NPV still rises by 13.5%. Even if we assume that earnings permanently remain 5% below their pre-pandemic forecast, the NPV would still increase by 9.2% (blue colored bar). In order to push down the NPV by a considerable amount, one would need to assume that the pandemic will not only reduce the level of corporate earnings, but it will reduce the growth rate of earnings as well. For example, if the pandemic reduces earnings growth by one percentage point, this would cause the NPV to fall by 7.5% (gray colored bar). Is this a sensible assumption, however? We don’t think so. While the pandemic will reduce capital spending temporarily, it is unlikely to damage the long-term growth rate of either productivity or the labor force, the two key drivers of potential output. Chart 7 shows that even after the Great Depression, per capita income eventually returned to its long-term trend. Chart 7No Clear Evidence That The Great Depression Lowered Long-Term Trend Growth
No Clear Evidence That The Great Depression Lowered Long-Term Trend Growth
No Clear Evidence That The Great Depression Lowered Long-Term Trend Growth
Are Bond Yields Distorted To The Downside? The notion that the pandemic may have increased the fair value of the stock market hinges critically on the view that the discount rate has fallen substantially this year. We will get to the question of what the appropriate level of the equity risk premium should be in a moment, but let us first examine the risk-free component of the discount rate. Many pundits argue that central bank bond purchases have pushed down yields below where they ought to be. That may be true, but it is not clear why that matters. If one is making present value calculations, one should look at the actual bond yield, not the yield that accords with one’s preconception of what is appropriate. Granted, if bond yields were to rise sharply in the future, the present value of future earnings would probably end up falling. However, this is unlikely to occur anytime soon. It will take a while for unemployment to return to pre-pandemic levels, during which time inflation will remain dormant. And even once inflation starts rising, central banks will likely refrain from hiking rates because they have been concerned about excessively low inflation for nearly two decades. Central banks could also face pressure from governments to keep rates low in order to suppress interest costs. As a result, real rates could fall initially, which would be supportive of stocks. The bull market in equities will only end when inflation reaches a level that makes markets nervous that central banks will have to raise rates. This is unlikely to happen for the next three years. The Equity Risk Premium Is More Likely To Fall Than Rise Chart 8Non-US Stocks Look Cheaper Than Their US Peers In Both Absolute Terms And In Relation To Bond Yields
Non-US Stocks Look Cheaper Than Their US Peers In Both Absolute Terms And In Relation To Bond Yields
Non-US Stocks Look Cheaper Than Their US Peers In Both Absolute Terms And In Relation To Bond Yields
As noted above, there are many risks confronting investors. The key question is whether the stock market’s perception of these risks will subside or intensify. If it is the former, the equity risk premium will probably shrink, pushing stocks higher. If it is the latter, stocks will fall. Our bet is on the former. We have already learned a lot about the virus. We will learn even more over the coming months. This should reduce the cone of uncertainty investors are facing. On the economic side, central bank asset purchases, combined with large-scale fiscal stimulus, have reduced the tail risk of another market meltdown. If policy stays supportive for the next few years, as we expect, the equity risk premium will shrink. Starting points matter, too. Globally, the equity risk premium, which we calculate by subtracting the real bond yield from the cyclically-adjusted earnings yield, was quite high at the start of the year and is even higher now (Chart 8). This suggests that investors should favor stocks over bonds. A Weaker Dollar Will Give Non-US Stocks An Edge The ERP is particularly elevated outside the US. Thus, valuations tend to favor non-US stocks. Of course, it helps to have factors other than valuations on your side when making investment decisions. In the case of regional and sector allocation, the outlook for the US dollar is critical. Chart 9 shows that cyclical stocks tend to outperform defensives when the dollar is weakening, while non-US stocks tend to do better than their US peers. There are five reasons to expect the US dollar to depreciate over the next 12 months. First, as a countercyclical currency, a revival in global growth should hurt the dollar (Chart 10). Second, the US has been harder hit by the virus over the past few months than most other economies. Thus, the spread between overseas growth and US growth is likely to widen more than usual (Chart 11). Chart 9Cyclical Sectors Should Outperform Defensives As Global Growth Recovers... And A Weaker Dollar Should Also Help Non-US Stocks
Cyclical Sectors Should Outperform Defensives As Global Growth Recovers... And A Weaker Dollar Should Also Help Non-US Stocks
Cyclical Sectors Should Outperform Defensives As Global Growth Recovers... And A Weaker Dollar Should Also Help Non-US Stocks
Chart 10A Revival In Global Growth Should Hurt The Dollar
A Revival In Global Growth Should Hurt The Dollar
A Revival In Global Growth Should Hurt The Dollar
Chart 11The Dollar Will Also Weaken On The Widening Gap Between Overseas Growth And US Growth
The Dollar Will Also Weaken On The Widening Gap Between Overseas Growth And US Growth
The Dollar Will Also Weaken On The Widening Gap Between Overseas Growth And US Growth
Chart 12Interest Rate Differentials No Longer Favor The Dollar
Interest Rate Differentials No Longer Favor The Dollar
Interest Rate Differentials No Longer Favor The Dollar
Third, interest rate differentials no longer favor the dollar, now that the Fed has brought rates down to zero (Chart 12). Fourth, momentum is not on the greenback’s side anymore (Chart 13). Fifth, the dollar is expensive based on measures such as purchasing power parity exchange rates (Chart 14). Chart 13Momentum Is Not On The Greenback’s Side
Global Equities Can Still Go Higher
Global Equities Can Still Go Higher
The right trade over the past few years was to be long the dollar and overweight US stocks. It is time to flip this trade and do the opposite. Peter Berezin Chief Global Strategist peterb@bcaresearch.com Chart 14USD Is Not Cheap
USD Is Not Cheap
USD Is Not Cheap
Footnotes 1 An IMF analysis of the use of funds of listed companies found that only about one fifth of the increase in corporate cash since the adoption of the Tax Cuts and Jobs Act (TCJA) was used for capex and R&D. The rest was utilized for share buybacks, dividend payouts, and other activities. The same study also noted that actual GDP and business investment growth in 2018 fell short of the predicted impact of the TCJA based on empirical studies of postwar US tax changes. Please see Emanuel Kopp, Daniel Leigh, Susanna Mursula, and Suchanan Tambunlertchai, "U.S. Investment Since the Tax Cuts and Jobs Act of 2017," IMF Working Paper, May 31, 2019. Global Investment Strategy View Matrix
Global Equities Can Still Go Higher
Global Equities Can Still Go Higher
Current MacroQuant Model Scores
Global Equities Can Still Go Higher
Global Equities Can Still Go Higher

A positive signs has emerged from the more cyclical corners of the global asset markets: Copper has broken out of its downward-slopping trend line in place since 2011. So has the relative performance of global material stocks. These are important signals…
Even at the current low level of yields, government bonds still have a place in a balanced portfolio as a source of diversification against equity and credit risk. However, are govies attractive as standalone assets? In aggregate, our valuation models show…
Highlights Q2/2020 Performance Breakdown: Our recommended model bond portfolio outperformed the custom benchmark by +11bps during the second quarter of the year. Winners & Losers: The government bond side of the portfolio outperformed by +8bps, led by overweights in the US (+4bps), Canada (+4bps) and Italy (+3bps). Spread product generated a small outperformance (+3bps), with overweights in US investment grade (+43bps) offsetting underweights in emerging market debt (-35bps). Scenario Analysis For The Next Six Months: We are sticking close to benchmark on overall duration and spread product exposure, focusing more on relative value between countries and sectors to generate outperformance amid economic uncertainties caused by the growing spread of COVID-19. We continue favoring markets where there is direct buying from central banks, but we are also increasing our recommended exposure to EM USD-denominated debt versus US investment grade corporates. Feature The first half of 2020 has been one of rapid market moves and regime shifts for global fixed income markets. In the first quarter, developed market government debt provided the best returns as bond yields plunged with central banks racing to support collapsing economies through rate cuts and liquidity injections. In Q2, corporate credit delivered the top returns, as economies started to emerge from the COVID-19 lockdowns and, more importantly, the Fed and other major central banks delivered direct support to frozen credit markets through asset purchases. Now, even as an increasing number of global growth indicators are tracing out a "V"-shaped recovery, new cases of COVID-19 are surging though the southern US and major emerging economies like Brazil and India. This raises new challenges for investors for the second half of 2020. A second wave of the coronavirus could jeopardize the nascent global economic recovery, even after the massive easing of monetary and fiscal policies, at a time when valuations on many risk assets appear stretched. In this report, we review the performance of the BCA Research Global Fixed Income Strategy (GFIS) model bond portfolio during the second quarter of 2020. We also present our recommended portfolio positioning for the next six months. Given the lingering uncertainties from the renewed spread of COVID-19, we continue to take a more measured approach in our portfolio allocations. That means focusing more on relative value between countries and sectors while staying closer to benchmark on overall global duration and spread product exposure versus government bonds (Table 1). Table 1GFIS Model Bond Portfolio Recommended Positioning For The Next Six Months
GFIS Model Bond Portfolio Q2/2020 Performance Review & Current Allocations: Selective Optimism
GFIS Model Bond Portfolio Q2/2020 Performance Review & Current Allocations: Selective Optimism
As a reminder to existing readers (and to new clients), the model portfolio is a part of our service that complements the usual macro analysis of global fixed income markets. The portfolio is how we communicate our opinion on the relative attractiveness between government bond and spread product sectors. We do this by applying actual percentage weightings to each of our recommendations within a fully invested hypothetical bond portfolio. Q2/2020 Model Portfolio Performance Breakdown: Slight Outperformance For Both Sovereigns And Credits Chart 1Q2/2020 Performance: Modest Gains From Relative Positioning
Q2/2020 Performance: Modest Gains From Relative Positioning
Q2/2020 Performance: Modest Gains From Relative Positioning
The total return for the GFIS model portfolio (hedged into US dollars) in the second quarter was 3.22%, modestly outperforming the custom benchmark index by +11bps (Chart 1).1 In terms of the specific breakdown between the government bond and spread product allocations in our model portfolio, the former generated +8bps of outperformance versus our custom benchmark index while the latter outperformed by +3bps. That government bond return includes the small gain (+2bps) from inflation-linked bonds, which we added as a new asset class in our model portfolio framework on June 23.2 In a world of very low bond yields (Table 2), our preference for the higher-yielding government bond markets in the US, Canada, the UK and Italy was the main source of outperformance, delivering a combined excess return of +13bps (including inflation-linked bonds). Our underweight in Japan delivered a surprising positive excess return of +4bps as longer-dated JGB yields – which do not fall under the Bank of Japan’s yield curve control policy – rose during the quarter. Underweights in the low-yielding core euro area countries of Germany and France were a drag on the portfolio (a combined -10bps), particularly the latter where longer-maturity French bonds enjoyed a very strong rally in Q2. Table 2GFIS Model Bond Portfolio Q2/2020 Overall Return Attribution
GFIS Model Bond Portfolio Q2/2020 Performance Review & Current Allocations: Selective Optimism
GFIS Model Bond Portfolio Q2/2020 Performance Review & Current Allocations: Selective Optimism
In spread product, our overweights in US investment grade corporates (+43bps), UK investment grade corporates (+7bps) and US commercial MBS (+5bps) squeezed out a combined small gain versus underweights in emerging markets (EM) USD-denominated credit (-35bps), euro area high-yield (-8bps) and lower-rated US high-yield (-6bps). In a world of very low bond yields (Table 2), our preference for the higher-yielding government bond markets in the US, Canada, the UK and Italy was the main source of outperformance. That modest outperformance of the model bond portfolio versus the benchmark is in line with our cautious recommended stance on what are always the largest drivers of the portfolio returns: overall duration exposure and the relative allocation between government debt and spread product. We have stuck close to benchmark exposures on both, eschewing big directional bets on bond yields or credit spreads while focusing more on relative opportunities between countries and sectors. This conservative approach is how we are approaching what we have dubbed “The Battle of 2020” between the opposing forces of coronavirus contagion (which is bullish for government bonds and bearish for credit) and policy reflation (vice versa).3 The bar charts showing the total and relative returns for each individual government bond market and spread product sector are presented in Charts 2 & 3. Chart 2GFIS Model Bond Portfolio Q2/2020 Government Bond Performance Attribution
GFIS Model Bond Portfolio Q2/2020 Performance Review & Current Allocations: Selective Optimism
GFIS Model Bond Portfolio Q2/2020 Performance Review & Current Allocations: Selective Optimism
Chart 3GFIS Model Bond Portfolio Q2/2020 Spread Product Performance Attribution By Sector
GFIS Model Bond Portfolio Q2/2020 Performance Review & Current Allocations: Selective Optimism
GFIS Model Bond Portfolio Q2/2020 Performance Review & Current Allocations: Selective Optimism
The most significant movers were: Biggest Outperformers Overweight US investment grade industrials (+28bps) Overweight US investment grade financials (+12bps) Overweight UK investment grade corporates (+7bps) Overweight US CMBS (+5bps) Underweight Japanese government bonds with maturity greater than 10 years (+5 bps) Biggest Underperformers Underweight EM USD denominated corporates (-24bps) Underweight EM USD denominated sovereigns (-10bps) Underweight EUR high-yield corporates (-8bps) Underweight French government bonds with maturity greater than 10 years (-5bps) Underweight US B-rated high-yield corporates (-4bps) Chart 4 presents the ranked benchmark index returns of the individual countries and spread product sectors in the GFIS model bond portfolio for Q2/2020. Returns are hedged into US dollars (we do not take active currency risk in this portfolio) and adjusted to reflect duration differences between each country/sector and the overall custom benchmark index for the model portfolio. We have also color coded the bars in each chart to reflect our recommended investment stance for each market during Q2/2020 (red for underweight, dark green for overweight, gray for neutral).4 Ideally, we would look to see more green bars on the left side of the chart where market returns are highest, and more red bars on the right side of the chart were returns are lowest. Chart 4Ranking The Winners & Losers From The GFIS Model Bond Portfolio In Q2/2020
GFIS Model Bond Portfolio Q2/2020 Performance Review & Current Allocations: Selective Optimism
GFIS Model Bond Portfolio Q2/2020 Performance Review & Current Allocations: Selective Optimism
The top performing sectors in our model bond portfolio universe in Q2 were all spread product: EM USD-denominated sovereign (+12.9% in USD-hedged terms, duration-matched to the custom model portfolio benchmark index), EM USD-denominated corporate debt (+12.6%), UK investment grade corporates (+11.3%), US investment grade corporates (+10.9%), and high-yield corporates in the euro area (+6.7%) and US (+5.6%). The top performing sectors in our model bond portfolio universe in Q2 were all spread product. During the quarter, we maintained relative exposures to those sectors within an overall small above-benchmark allocation to global spread product – overweight US and UK investment grade versus underweight emerging market credit, neutral overall US high-yield (favoring Ba-rated debt) versus underweight euro area high-yield. Those allocations were motivated by our theme of “buying what the central banks are buying”, like the Fed purchasing US investment grade corporates. Importantly, we had limited exposure to the worst performing sectors during Q2: underweight government bonds in Japan (index return of -0.47% in USD-hedged, duration-matched terms) and Germany (+0.47%), a neutral allocation to Australian sovereign debt (-0.07%) and an underweight in US Agency MBS (+0.20%). The latter two positions came after we downgraded US MBS to underweight in early April and cut our long-held overweight in Australia to neutral in mid-May. Bottom Line: Our model bond portfolio modestly outperformed its benchmark index in the second quarter of the year by +11bps – a positive result driven by our relative positioning that favored higher yielding government debt and spread product sectors directly supported by central bank purchases. Future Drivers Of Portfolio Returns Chart 5Overall Portfolio Allocation: Slightly Overweight Credit Vs Governments
GFIS Model Bond Portfolio Q2/2020 Performance Review & Current Allocations: Selective Optimism
GFIS Model Bond Portfolio Q2/2020 Performance Review & Current Allocations: Selective Optimism
Typically, in these quarterly performance reviews of our model bond portfolio, we make return forecasts for the portfolio based off scenario analysis and quantitative predictions of various fixed income asset classes. However, the current environment is unprecedented because of the COVID-19 outbreak. Not only is there now elevated economic uncertainty, but central banks are running extreme monetary policies in response - including direct intervention in markets through purchases of both government bonds and spread product. Thus, we are reluctant to rely on historical model coefficients and correlations to estimate expected fixed income returns. Instead, we will focus on the logic behind our current model portfolio allocations and the expected contribution to overall portfolio performance over the next six months. At the moment, the main factors that will drive the performance of the model bond portfolio over the next six months are the following: Our recommended overweight stance on relatively higher-yielding sovereigns like the US, Canada and Italy versus low-yielders like Germany, France and Japan; Our allocation to inflation-linked bonds out of nominal government debt in the US, Italy and Canada; Our recommended overweight stance on spread product backstopped by central bank purchases - US investment grade corporates, US Agency CMBS, US Ba-rated high-yield, and UK investment grade corporates; Our recommended underweight stance on riskier spread product - euro area high-yield, US B-rated and Caa-rated high-yield, and EM USD-denominated corporates and sovereigns. The portfolio currently has a small aggregate overweight allocation to spread product relative to government bonds, equal to three percentage points (Chart 5). We feel that is an appropriate allocation to credit versus sovereigns in an environment that is still highly uncertain concerning the spread of COVID-19 and how global growth will evolve over the next 6-12 months. This also leaves room to increase the spread product allocation should the news on the virus and the global economy take a turn for the better. We also remain neutral on overall portfolio duration exposure. Our Global Duration Indicator, which contains growth data like our global leading economic indicator and the global ZEW expectations index, has rebounded sharply and is signaling that bond yields should bottom out in the second half of 2020 (Chart 6). A rise in yields will take longer to develop, however, with virtually all major central banks signaling that policy rates will stay near 0% for an extended period. Chart 6Our Global Duration Indicator Says Bond Yields Will Bottom Out In H2/2020
Our Global Duration Indicator Says Bond Yields Will Bottom Out In H2/2020
Our Global Duration Indicator Says Bond Yields Will Bottom Out In H2/2020
Chart 7Within Governments, Overweight Inflation-Linked Bonds Vs. Nominals
Within Governments, Overweight Inflation-Linked Bonds Vs. Nominals
Within Governments, Overweight Inflation-Linked Bonds Vs. Nominals
The recent moves in developed market government bonds are interesting in terms of the underlying drivers of yields – real yields and inflation expectations. Longer-maturity inflation breakevens – the spread between the yields of nominal and inflation-linked government debt – have drifted higher since late March after major central banks began rapidly easing monetary conditions. At the same time, the actual yields on inflation-linked bonds, i.e. real yields, have moved lower and largely offset the gains in inflation breakevens (Chart 7). Nominal yields have been stuck in very narrow ranges as a result. We do not see that dynamic changing, at least in the near term. Inflation breakevens are too low on our models across all developed markets, and are likely to continue inching higher in the coming months on the back of a pickup in global growth and rising energy prices. At the same time, central banks will be staying on hold for longer while continuing to buy large quantities of nominal bonds, helping push real yields lower. Given these opposing forces on nominal government bond yields, we think it is far too soon to contemplate reducing overall duration – even with equity and credit markets having rallied sharply off the lows and global economic indicators rebounding. Thus, we are maintaining an overall duration exposure close to benchmark in the model portfolio (Chart 8). At the same time, we are playing for wider breakevens and lower real bond yields through allocations to markets where our models indicate better value in being long breakevens: US TIPS, Italian inflation-linked BTPs, and Canadian Real Return Bonds. Within the government bond side of the model bond portfolio, we continue to recommend focusing more on country allocation to generate outperformance. That means concentrating exposures in relatively higher yielding markets like the US, Canada and Italy while maintaining underweights in low-yielding core Europe and Japan. Turning to spread product allocations, we continue to recommend focusing more on policymaker responses to the COVID-19 recession, and its uncertain recovery, rather than the downturn itself. The now double-digit year-over-year growth in global central bank balance sheets - which has led global high-yield and investment grade excess returns by one year in the years after the Global Financial Crisis (Chart 9) – is pointing to additional global corporate bond market outperformance versus governments over the next 6-12 months. Chart 8Overall Portfolio Duration: Close To Benchmark
Overall Portfolio Duration: Close To Benchmark
Overall Portfolio Duration: Close To Benchmark
In other words, we are focusing on global QE rather than global recession, while maintaining a modest recommended overall weighting on global spread product. That allocation could be larger, but we suggest picking the lowest hanging fruit in the credit universe rather than going for the highest beta credit markets like Caa-rated US high-yield that have already seen significant spread compression relative to higher-rated US junk bonds (bottom panel). Chart 9Global QE Supporting Credit Markets
Global QE Supporting Credit Markets
Global QE Supporting Credit Markets
Chart 10Overall Credit Allocation: Keep Buying What The Central Banks Are Buying
Overall Credit Allocation: Keep Buying What The Central Banks Are Buying
Overall Credit Allocation: Keep Buying What The Central Banks Are Buying
We continue to focus our recommended spread product allocations on the parts of global credit markets where central banks are directly buying. We continue to focus our recommended spread product allocations on the parts of global credit markets where central banks are directly buying (Chart 10). In the US, that means overweighting US investment grade corporate bonds (particularly those with maturities of less than five years), US Ba-rated high-yield that the Fed can hold in its corporate bond buying program, US Agency CMBS that is also supported by Fed programs, and UK investment grade corporate bonds that the Bank of England is buying. We also put Italian government bonds into this category, with the ECB buying greater amounts of BTPs as part of its COVID-19 monetary support efforts. What about emerging market debt? We have expressed reservations in recent months about upgrading EM USD-denominated sovereign and corporate debt, even within our portfolio theme of being “selectively opportunistic” about recommended spread product allocations. We have long felt that the time to buy those markets would be when the US dollar had clearly peaked and global growth had clearly bottomed. The latter condition now appears to be in place, and the strong upward momentum in the US dollar is starting to weaken. This forces us to reconsider our stance on EM debt in the model portfolio. Even after the powerful Q2 rally in EM corporate and sovereign debt, EM credit spreads still look relatively attractive using one of our favorite credit valuation metrics – the percentile rankings of 12-month breakeven spreads. Those breakeven spreads are calculated, as the amount of spread widening that would make the return of EM credit equal to duration-matched US Treasuries over a 12-month horizon. We then compare those spreads to their own history to determine how attractive current spread levels are now on a “spread volatility adjusted” basis. Current 12-month breakeven spreads for EM USD-denominated sovereigns and corporates are in the upper quartile of their own history. This compares favorably to other spread products in our model bond portfolio universe, particularly US investment grade corporates where the 12-month breakevens are now just below the long-run median (Chart 11). Chart 11A Comparison Of Credit Sectors Using 12-Month Breakeven Spreads
GFIS Model Bond Portfolio Q2/2020 Performance Review & Current Allocations: Selective Optimism
GFIS Model Bond Portfolio Q2/2020 Performance Review & Current Allocations: Selective Optimism
The current Bloomberg Barclays EM corporate benchmark index option-adjusted spread (OAS) is around 300bps above that of the US investment grade corporate index OAS. That spread still has room to compress further if global growth continues to rebound and the US dollar softens versus EM currencies. Leading growth indicators like the China credit impulse, which has picked up sharply as Chinese authorities have ramped up economic stimulus measures, are now back to levels last seen in 2016 when EM credit strongly outperformed US investment grade corporates (Chart 12). Chart 12Upgrade EM Credit Versus US Investment Grade
Upgrade EM Credit Versus US Investment Grade
Upgrade EM Credit Versus US Investment Grade
Chart 13Overall Portfolio Yield: Close To Benchmark
Overall Portfolio Yield: Close To Benchmark
Overall Portfolio Yield: Close To Benchmark
This week we are upgrading our weighting on EM USD-denominated corporates and sovereigns to neutral, from underweight, in our model bond portfolio. Although we acknowledge that the EM story has been made more complicated by the rapid spread of COVID-19 through the major EM economies, an underweight stance – particularly versus US investment grade credit – is increasingly unwarranted. Therefore, this week we are upgrading our weighting on EM USD-denominated corporates and sovereigns to neutral, from underweight, in our model bond portfolio (see the updated table on pages 17-18). That new allocation will be “funded” by reducing our overweight in US investment grade corporates. Model bond portfolio yield and tracking error considerations Importantly, the selective global government bond and credit allocations we have just outlined do not come at a cost in terms of forgone yield. The portfolio yield after our upgrade of EM debt will be slightly above that of the custom benchmark index (Chart 13), indicating no “negative carry” even when avoiding parts of the US and euro area high-yield markets. Chart 14Overall Portfolio Risk: Moderate
Overall Portfolio Risk: Moderate
Overall Portfolio Risk: Moderate
Finally, turning to the risk budget of the model portfolio, we are aiming for a “moderate” overall tracking error, or the gap between the portfolio’s volatility and that of the benchmark index. The portfolio volatility has fallen dramatically from the surge seen during the global market rout in March, moving lower alongside realized market volatility. The tracking error now sits at 64bps, well below our self-imposed limit of 100bps and within the 50-70bps range we are targeting as a “moderate” level of overall portfolio risk (Chart 14). Bottom Line: We are sticking close to benchmark on overall duration and spread product exposure, focusing more on relative value between countries and sectors to generate outperformance amid economic uncertainties caused by the growing spread of COVID-19. We continue favoring markets where there is direct buying from central banks. We are also increasing our recommended exposure on EM USD-denominated debt to neutral, funded by a reduced allocation to US investment grade corporates where valuations are less attractive. Robert Robis, CFA Chief Fixed Income Strategist rrobis@bcaresearch.com Ray Park, CFA Research Analyst ray@bcaresearch.com Footnotes 1 The GFIS model bond portfolio custom benchmark index is the Bloomberg Barclays Global Aggregate Index, but with allocations to global high-yield corporate debt replacing very high quality spread product (i.e. AA-rated). We believe this to be more indicative of the typical internal benchmark used by global multi-sector fixed income managers. 2 Please see BCA Global Fixed Income Strategy Weekly Report, "How To Play The Revival Of Global Inflation Expectations'", dated June 23 2020, available at gfis.bcaresearch.com. 3 Please see BCA Global Fixed Income Strategy Weekly Report, "Contagion Vs. Reflation: The Battle Of 2020 Rages On", dated June 30, 2020, available at gfis.bcaresearch.com. 4 Note that sectors where we made changes to our recommended weightings during Q2/2020 will have multiple colors in the respective bars in Chart 4. Recommendations The GFIS Recommended Portfolio Vs. The Custom Benchmark Index
GFIS Model Bond Portfolio Q2/2020 Performance Review & Current Allocations: Selective Optimism
GFIS Model Bond Portfolio Q2/2020 Performance Review & Current Allocations: Selective Optimism
Duration Regional Allocation Spread Product Tactical Trades Yields & Returns Global Bond Yields Historical Returns
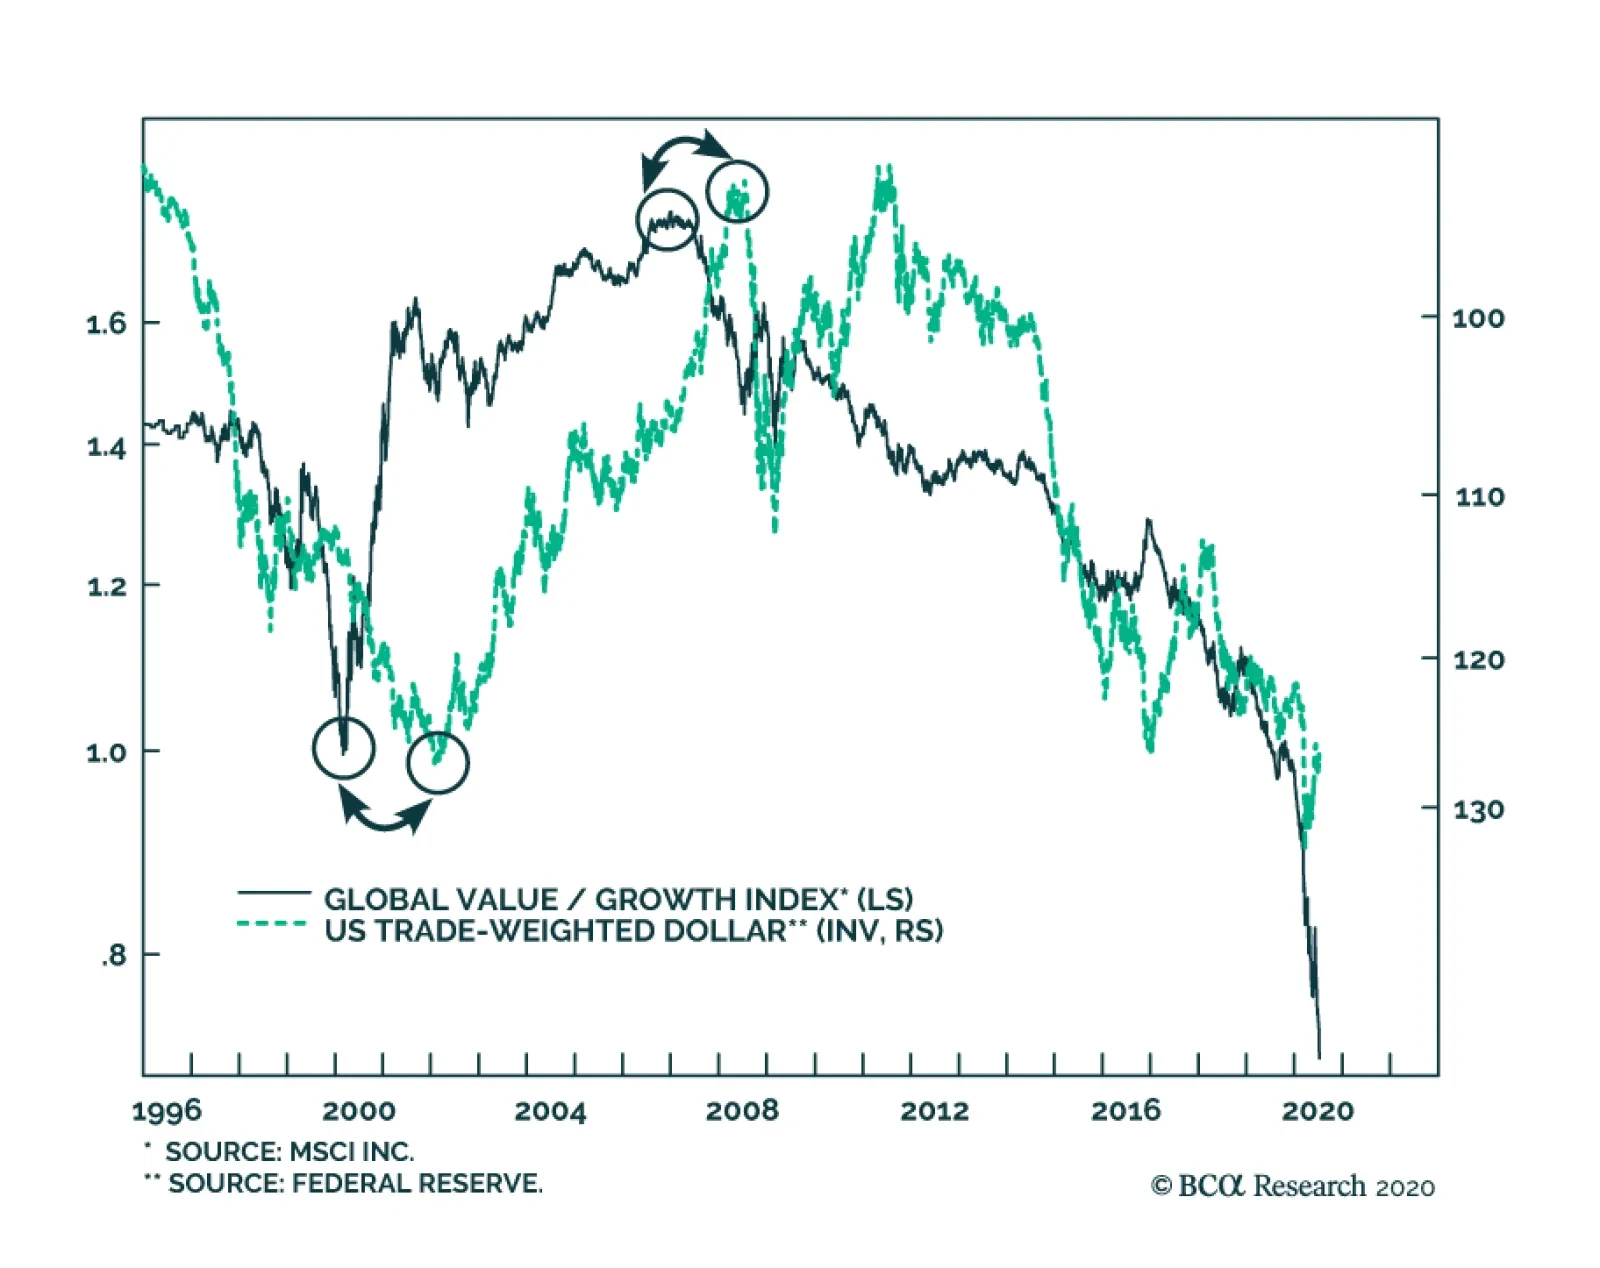
BCA Research's Foreign Exchange Strategy and Equity Trading Strategy services conclude that the underperformance of value versus growth has been an important contributor to the dollar’s strength. Two trends become apparent when plotting the global value…
Highlights Silver will outperform gold in 2H20, as industrial production and consumer-product demand revives on the back of the massive global stimulus deployed to reverse the hit to aggregate demand inflicted by the COVID-19 pandemic. Silver’s physical supply growth largely is a by-product of base-metals mining, specifically copper, zinc and lead. As mining capex for these base metals is reduced in response to weaker demand, silver’s physical surplus will continue to contract. On the demand side, a pick-up in industrial activity will benefit silver more than gold, given its relatively higher share of industrial consumption. The gold/silver ratio most likely contracts from its current level of 99 over the remainder of the year, given our expectation gold will appreciate 7% in 2H20 and finish the year at $1,900/oz, while silver is expected to appreciate ~ 16% ending 2020 at $21/oz. Elevated economic and political uncertainty – chiefly escalating US-China and US-Europe trade tensions – likely will keep a bid under gold and the USD. This could limit the rally in commodities (ex-gold) generally. We are getting long December 2020 COMEX silver at tonight’s close. Feature While silver is sensitive to the same financial variables driving gold’s performance – chiefly real rates, the broad trade-weighted USD, inflation and inflation expectations – it is far more responsive to the evolution of the real economy. When investors seek a safe haven in especially volatile or highly uncertain markets, silver is not their first choice. Nor is it the go-to portfolio diversifier investors seek out to hedge against higher inflation or inflation expectations. Investors typically turn to the USD and gold when risks rise (Chart of the Week).1 While silver is sensitive to the same financial variables driving gold’s performance – chiefly real rates, the broad trade-weighted USD, inflation and inflation expectations – it is far more responsive to the evolution of the real economy than gold: More than half of silver’s demand is accounted for by industrial applications – e.g., solar panels, batteries and electronics, vs. ~ 10% for gold (Chart 2). Chart of the WeekUSD, Gold Attract Investors In Volatile, Uncertain Markets
USD, Gold Attract Investors In Volatile, Uncertain Markets
USD, Gold Attract Investors In Volatile, Uncertain Markets
Chart 2Silver Is More Responsive To the Real Economy Than Gold
Silver Likely Outperforms Gold In 2H20
Silver Likely Outperforms Gold In 2H20
Gold is a far deeper market than silver (Chart 3). Greater two-way flow on the bid and offer – augmented by the greater involvement of institutions and central banks in those flows – makes the gold market more efficient in terms of processing financial and economic information. Because of this, gold prices and gold options’ implied volatility are useful parameters for following investors’ (and central banks’) assessments of future economic conditions. Silver tends to overshoot and undershoot in its response to the arrival of new economic and financial information – e.g., economic shocks like the COVID-19 outbreak (Chart 4).2 Chart 3Gold Market Is Deeper Than Silver ...
Gold Market Is Deeper Than Silver ...
Gold Market Is Deeper Than Silver ...
Chart 4... Making Gold Less Volatile Relative To Silver
... Making Gold Less Volatile Relative To Silver
... Making Gold Less Volatile Relative To Silver
Because silver is sensitive to the same financial variables driving gold, it can attract more retail speculative interest when the larger investment narrative favors gold as a portfolio hedge. All the same, because silver is sensitive to the same financial variables driving gold, it can attract more retail speculative interest when the larger investment narrative favors gold as a portfolio hedge. For this reason, it is difficult to recommend silver as a long-term portfolio hedge. It is, however, useful in expressing a view on short-term economic and financial expectations. Supply Growth Will Be Subdued Mining output of silver is largely a by-product of copper, zinc and lead mining, as the white metal often is found in deposits of these ores. Because of the COVID-19-induced base-metals demand destruction, miners most likely will reduce capex at least for this year (Chart 5).3 This will cause mine production to fall, which will reduce the rate of growth in supply, even with recycling remaining fairly constant (Chart 6). As a result, the white metal’s physical surplus is expected to continue contracting relative to demand this year (Chart 7). Chart 5Expect Lower Base-Metals Capex To Reduce Silver Supply Growth
Silver Likely Outperforms Gold In 2H20
Silver Likely Outperforms Gold In 2H20
Chart 6Falling Supplies Of Silver Will Tighten Physical Balances
Silver Likely Outperforms Gold In 2H20
Silver Likely Outperforms Gold In 2H20
Chart 7Silver’s Supply Surplus Likely Will Contract
Silver Likely Outperforms Gold In 2H20
Silver Likely Outperforms Gold In 2H20
Demand Follows The Real Economy Slightly more than half of silver demand is accounted for by industrial applications (Chart 8). Gold’s industrial-applications share is ~ 10%, as noted above. This keeps the silver-to-gold ratio closely aligned with global industrial production (Chart 9). Chart 8Industrial Usage Dominates Silver Demand
Silver Likely Outperforms Gold In 2H20
Silver Likely Outperforms Gold In 2H20
Chart 9Silver Prices Closely Tied To Global Industrial Production
Silver Prices Closely Tied To Global Industrial Production
Silver Prices Closely Tied To Global Industrial Production
The massive fiscal and monetary stimulus deployed by governments and central banks globally certainly raises the odds of an overshoot, as demand revives and miners are reducing capex (Chart 10).4 Against this backdrop, a better-than-expected recovery in commodity demand cannot be ruled out. However, it is important to emphasize that – given the profound uncertainty dogging commodities generally – a severe undershoot also is possible. Chart 10Massive Global Stimulus Could Cause Metals (Silver Included) To Overshoot
Silver Likely Outperforms Gold In 2H20
Silver Likely Outperforms Gold In 2H20
Silver Poised To Outperform In modeling prices, we capture silver’s safe-haven vs. industrial demand using precious and industrial metals prices (Chart 11). Historically, silver has been as substitute to gold for investors seeking lower-cost exposure to precious metals. This implies silver will follow gold in times of decreasing real rates, rising inflation and/or increasing economic uncertainty. Following a sharp increase in gold prices, silver becomes an attractive safe-haven asset and gets bid up until the disequilibrium between both variables closes. These series are cointegrated in the long-run. On the other hand, silver prices are more responsive to the global industrial cycle than gold. Thus, it partly follows the same underlying trend as industrial metals – mainly copper – prices. Chart 11BCA's Silver Model: Rally Expected
BCA's Silver Model: Rally Expected
BCA's Silver Model: Rally Expected
The model shown in Chart 11 leads us to expect silver prices will outperform gold prices in 2H20. We expect silver to end the year at $21/oz, a 16% increase over the next six months, versus $1,900/oz for gold (up 7%). Given our assessment of these respective markets, we are recommending a long December 2020 COMEX silver position at tonight’s close. We are remaining long gold, as it is more likely to respond favorably to the additional fiscal and monetary stimulus such a turn of events would prompt. Bottom Line: Silver is a thinner market than gold and is more subject to higher volatility. In an environment of historically high global economic policy uncertainty, rising Sino-US and -European trade tensions, and the economic destruction wrought by the COVID-19 pandemic, this amounts to a significant risk for investors (Chart 12). While our modeling indicating silver should outperform gold in 2H20 inclines us to go long December 2020 silver, this could be upended by another wave of COVID-19-induced lockdowns in systematically important economies. This would stop a global economic recovery dead in its tracks. For this reason, we are remaining long gold, as it is more likely to respond favorably to the additional fiscal and monetary stimulus such a turn of events would prompt. Chart 12Heightened Economic Uncertainty Elevates Risk To Silver Positions
Heightened Economic Uncertainty Elevates Risk To Silver Positions
Heightened Economic Uncertainty Elevates Risk To Silver Positions
Robert P. Ryan Chief Commodity & Energy Strategist rryan@bcaresearch.com Hugo Bélanger Associate Editor Commodity & Energy Strategy HugoB@bcaresearch.com Commodities Round-Up Energy: Overweight Expectations of a deal allowing Libya’s National Oil Corporation (NOC) to resume oil production at some of its fields have increased, following reports of discussions between the Government of National Accord (GNA), the NOC and regional countries overseen by the United Nations and the United States.5 Nonetheless, restarting production will be gradual, as the lack of elementary maintenance since the start of the conflict left pipelines corroding and storage facilities collapsing. Base Metals: Neutral The Baltic Dry Index (BDI) rebounded by more than 300% from its May 2020 low, led by rising iron ore exports to China (Chart 13). As Chinese economic growth resumes, iron ore and base metals demand is expected to increase in 2H20. However, some of the recent support to shipping markets is due to China’s restocking of iron ore, which will fade as inventories return to desired levels. While we expect the BDI to end the year higher, a near-term pullback is possible, given iron ore and freight rates appear to have overshot to the upside. Precious Metals: Neutral The risk of an incessantly strong US dollar remains a headwind to gold and silver prices. The dollar benefits from mounting global economic uncertainty. Thus, the risk of a severe second COVID-19 infection wave, escalating Sino-US and US-European tensions, and the upcoming US election could increase economic and market volatility in 2H20 and keep the dollar in its bull market, which began in 2011, intact (Chart 14). Ags/Softs: Underweight The USDA this week reported farmers rated 73% of corn planted this season in good to excellent condition for the week ended Jun 28, vs. 56% last year. Soybeans were rated 71% vs 54% in good to excellent condition last year. Winter wheat bucked the year-on-year improvement trend, with 52% of the crop in good to excellent condition vs. 63% last year. Chart 13BDI Rebounding Sharply
BDI Rebounding Sharply
BDI Rebounding Sharply
Chart 14Elevated Policy Uncertainty Supports Gold
Elevated Policy Uncertainty Supports Gold
Elevated Policy Uncertainty Supports Gold
Footnotes 1 We have noted the anomalous correlation between the broad trade-weighted USD and gold during periods of elevated uncertainty in pervious research. See, e.g., Global Economic Policy Uncertainty Lifts Gold And USD Together, which we published October 24, 2019, prior to the COVID-19 pandemic’s outbreak. This correlation has increased in the wake of the pandemic. 2 For an excellent discussion of information processing by markets, please see Timmerman, Allan and Clive W.J. Granger (2004), “Efficient market hypothesis and forecasting,” International Journal of Forecasting, 20:1, pp. 15 27. 3 Please see PwC’s Mine 2020, Resilient and Resourceful, June 2020 report for discussion of miners’ capex intensions. 4 We would note in passing OPEC 2.0 – the oil-production coalition led by the Kingdom of Saudi Arabia (KSA) and Russia – faces a similar problem in our estimation: It is attempting to sharply lower crude oil output against a highly stimulative global fiscal and monetary backdrop. The risk that the stimulus is insufficient to revive demand is very real, but a faster-than-expected recovery would spike prices to the upside if demand revives before the producer coalition can increase supply sufficiently to absorb that demand. 5 Please see Libya's NOC confirms international talks on resuming oil output published by reuters.com June 29, 2020.. Investment Views and Themes Recommendations Strategic Recommendations Tactical Trades Trade Recommendation Performance In 2020 Q1
Silver Likely Outperforms Gold In 2H20
Silver Likely Outperforms Gold In 2H20
Commodity Prices and Plays Reference Table Trades Closed In 2020 Summary of Trades Closed Trades
Silver Likely Outperforms Gold In 2H20
Silver Likely Outperforms Gold In 2H20
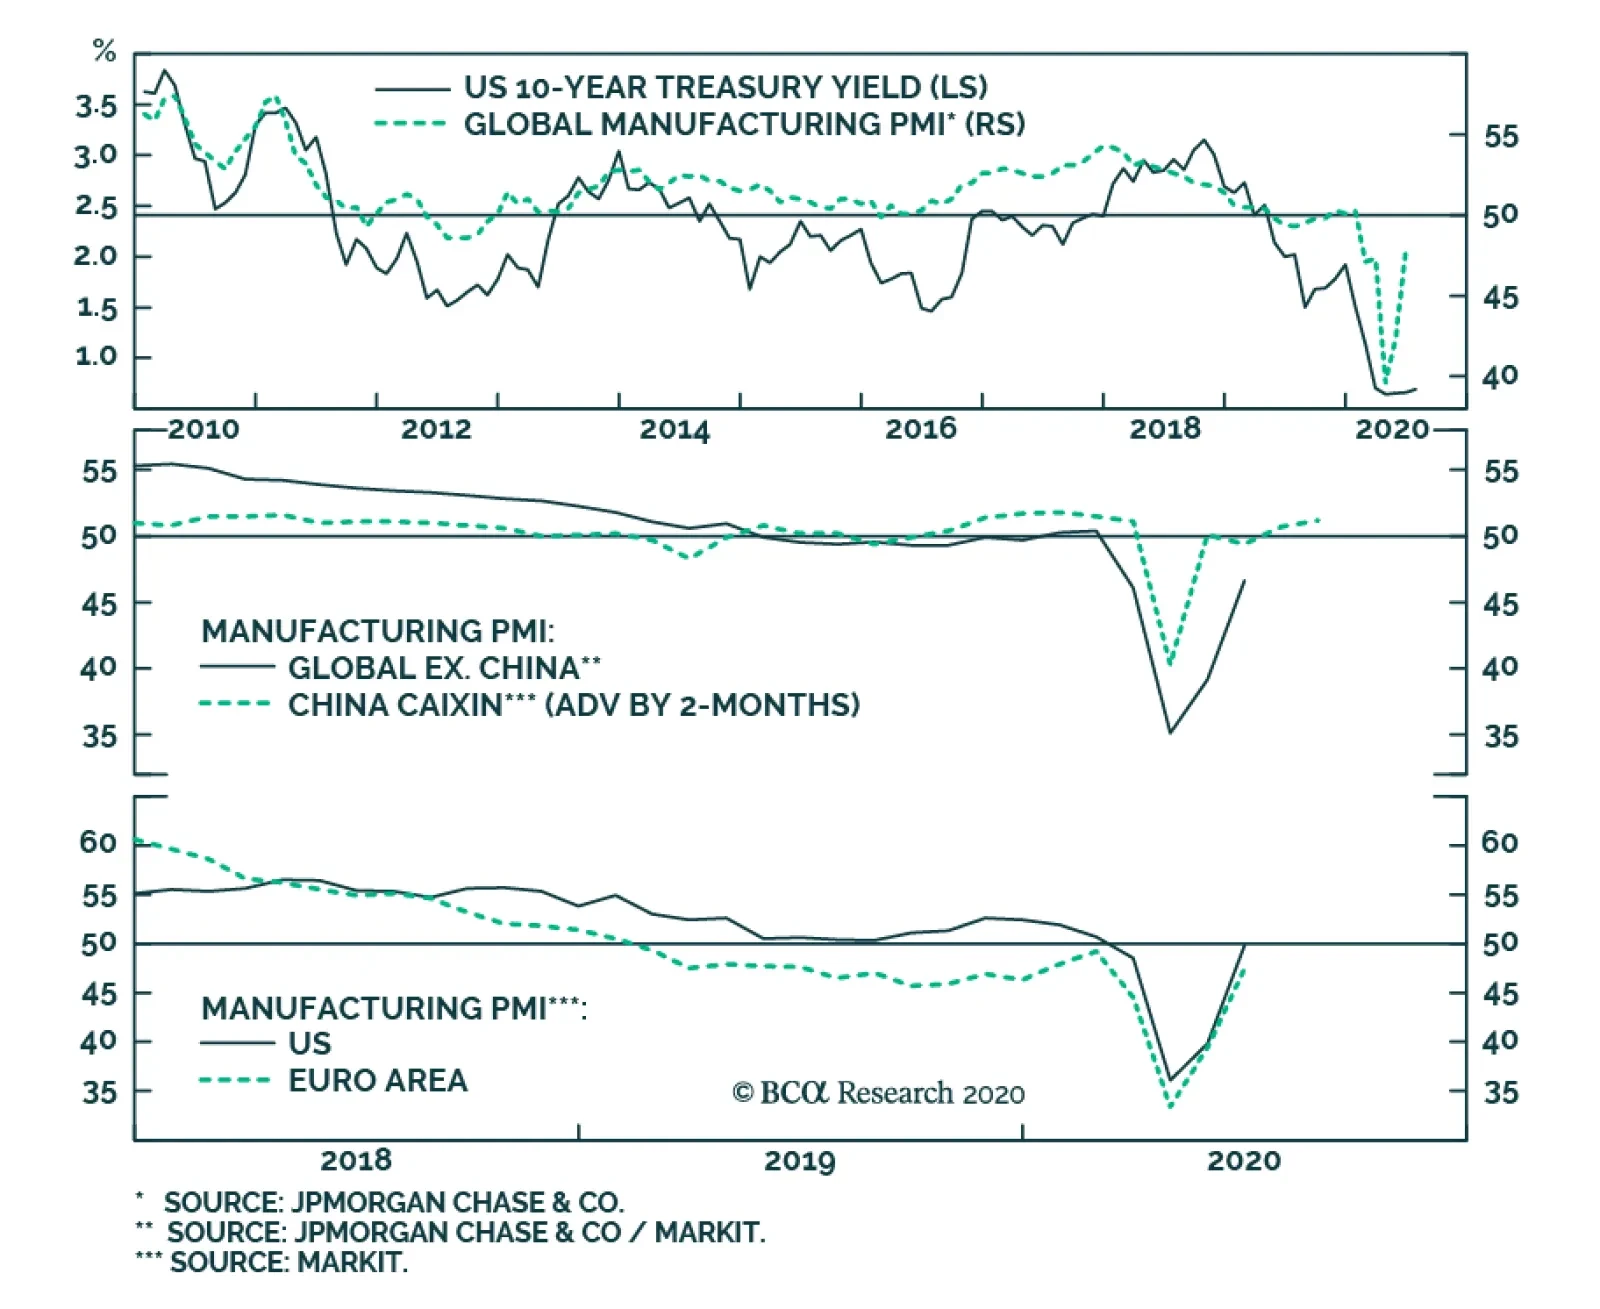
The global manufacturing contraction eased markedly in June, with the purchasing manager’s index (PMI) rising from 42.4 to 47.8, a record 5.4 monthly jump that brings the overall index within reach of the 50 boom-bust line. This print confirms the global…
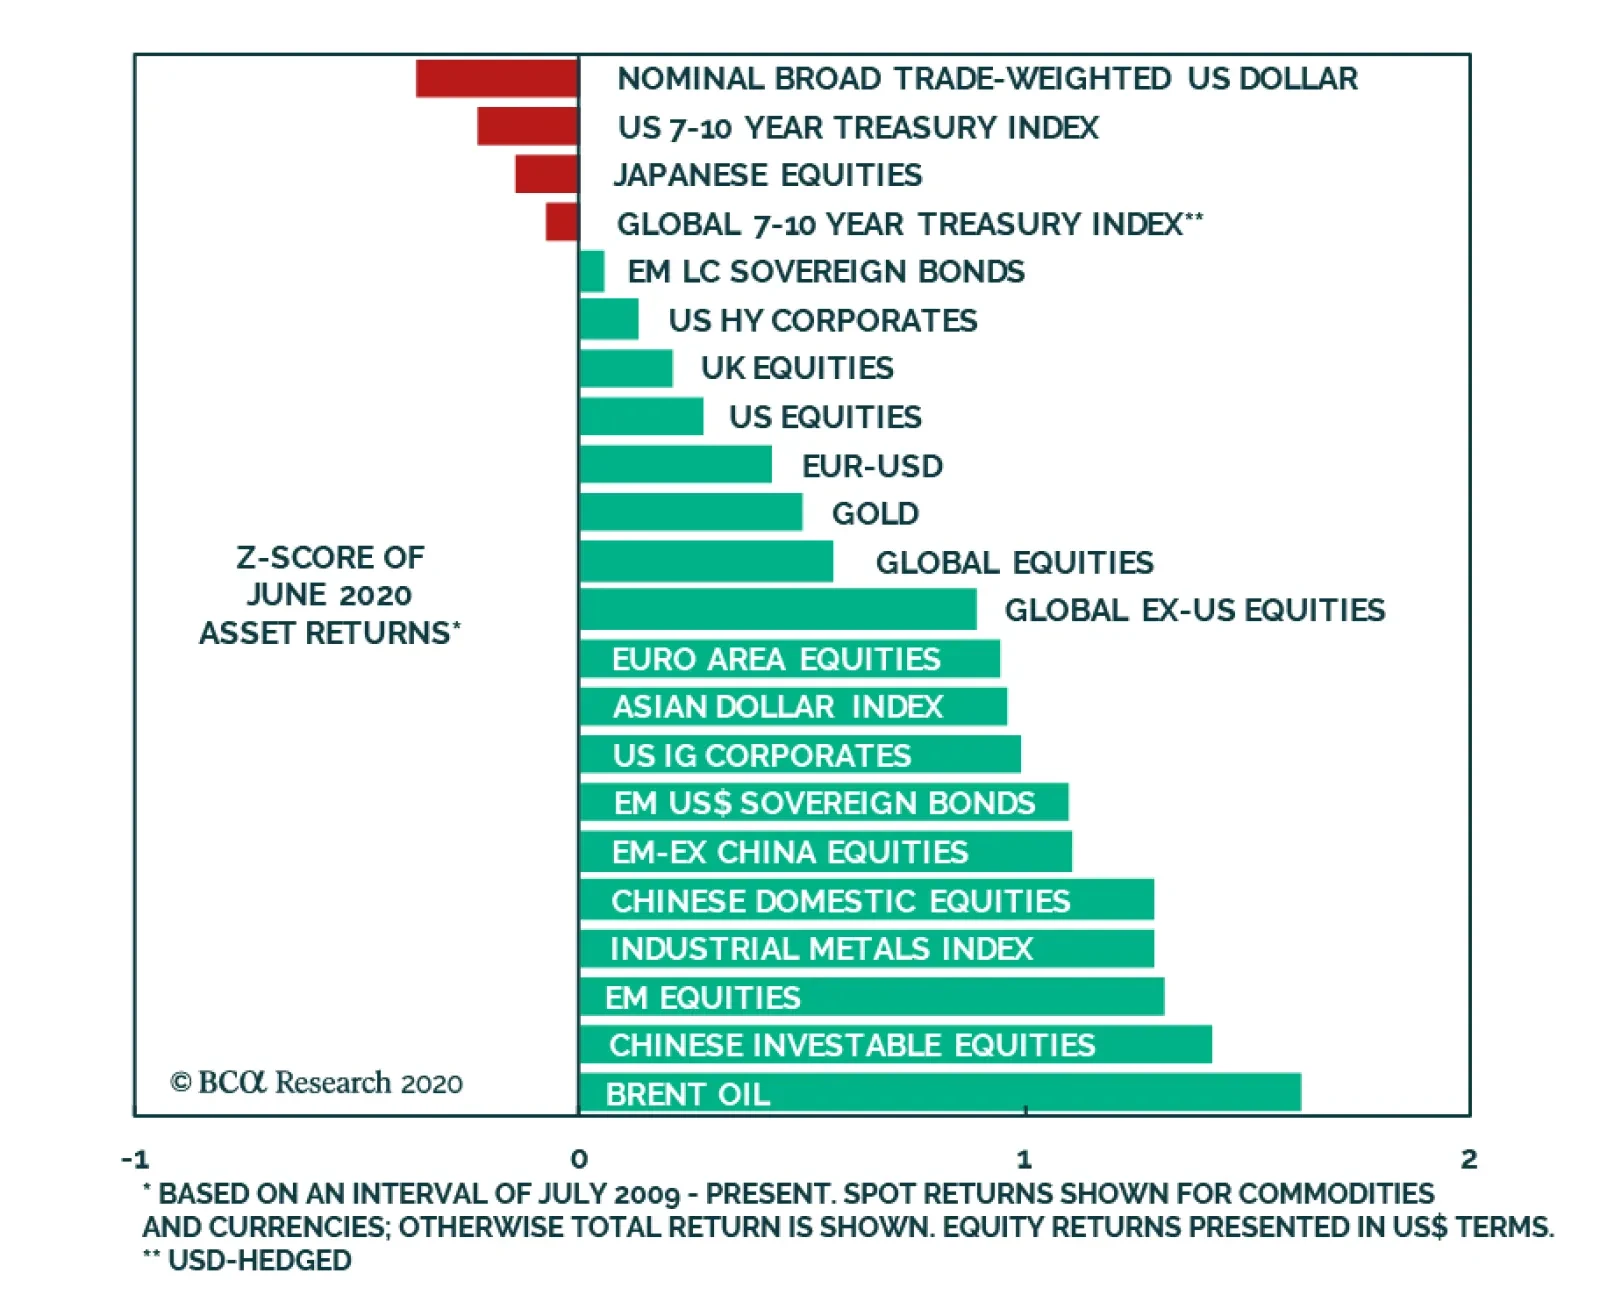
June was the second month in a row to be characterized by expectations of global growth. A cross-sectional review of asset returns shows that the US dollar and treasuries performed the worst, while Brent crude oil, industrial metals, and emerging market…
Highlights Recommended Allocation
Quarterly Portfolio Outlook: Cash Injections Versus COVID Infections
Quarterly Portfolio Outlook: Cash Injections Versus COVID Infections
The coronavirus pandemic is not over. Enormous fiscal and monetary stimulus will soften the blow to the global economy, but there remain significant risks to growth over the next 12 months. The P/E ratio for global equities is near a record high. This suggests that the market is pricing in a V-shaped recovery, and ignoring the risks. We can, therefore, recommend no more than a neutral position on global equities. But government bonds are even more expensive, with yields having largely hit their lower bound. Stay underweight government bonds, and hedge downside risk via cash. The US dollar is likely to depreciate further: It is expensive, US liquidity has risen faster than elsewhere, interest-rate differentials no longer favor it, and momentum has swung against it. A weakening dollar – plus accelerating Chinese credit growth – should help commodities. We raise the Materials equity sector to neutral, and put Emerging Market equities on watch to upgrade from neutral. Corporate credit selectively remains attractive where central banks are providing a backstop. We prefer A-, Baa-, and Ba-rated credits, especially in the Financials and Energy sectors. Defensive illiquid alternative assets, such as macro hedge funds, have done well this year. But investors should start to think about rotating into private equity and distressed debt, where allocations are best made mid-recession. Overview Cash Injections Vs. COVID Infections The key to where markets will move over the next six-to-nine months is (1) whether there will be a second wave of COVID-19 cases and how serious it will be, and (2) how much appetite there is among central banks and fiscal authorities to ramp up stimulus to offset the damage the global economy will suffer even without a new spike in cases. A new wave of COVID-19 in the northern hemisphere this fall and winter is probable. It is not surprising, after such a sudden stop in global activity between February and May, that economic data is beginning to return to some sort of normality. PMIs have generally recovered to around 50, and in some cases moved above it (Chart 1). Economic data has surprised enormously to the upside in the US, although it is lagging in the euro zone and Japan (Chart 2). Chart 1Data Is Rebounding Sharply
Data Is Rebounding Sharply
Data Is Rebounding Sharply
Chart 2US Data Well Above Expectations
US Data Well Above Expectations
US Data Well Above Expectations
New COVID-19 cases continue to rise alarmingly in some emerging economies and in parts of the US, but in Europe and Asia the pandemic is largely over (for now) and lockdown regulations are being eased, allowing economic activity to resume (Chart 3). Nonetheless, consumers remain cautious. Even where economies have reopened, people remain reluctant to eat in restaurants, to go on vacation, or to visit shopping malls (Chart 4). While shopping and entertainment activities are now no longer 70-80% below their pre-pandemic levels, as they were in April and May, they remain down 20% or more (Chart 5). Chart 3Few COVID-19 Cases Now In Europe And Asia
Few COVID-19 Cases Now In Europe And Asia
Few COVID-19 Cases Now In Europe And Asia
Chart 4Consumers Still Reluctant To Go Out
Quarterly Portfolio Outlook: Cash Injections Versus COVID Infections
Quarterly Portfolio Outlook: Cash Injections Versus COVID Infections
Chart 5Spending Well Below Pre-Pandemic Levels
Quarterly Portfolio Outlook: Cash Injections Versus COVID Infections
Quarterly Portfolio Outlook: Cash Injections Versus COVID Infections
So how big is the risk of further spikes in COVID-19 cases? Speaking on a recent BCA Research webcast, the conclusion of Professor Peter Doherty, a Nobel prize-winning immunologist connected to the University of Melbourne, was that, “It’s not unlikely we’ll see a second wave.”1 But experts can’t be sure. It seems that the virus spreads most easily when people group together indoors. That is why US states where it is hot at this time of the year, such as Arizona, have seen rising infections. This suggests that a new wave in the northern hemisphere this fall and winter is probable. Offsetting the economic damage caused by the coronavirus has been the staggering amount of liquidity injected by central banks, and huge extra fiscal spending. Major central bank balance-sheets have grown by around 5% of global GDP since March, causing a spike in broad money growth everywhere (Chart 6). Fiscal spending programs also add up to around 5% of global GDP (Chart 7), with a further 5% or so in the form of loans and guarantees. Chart 6Remarkable Growth In Money Supply...
Remarkable Growth In Money Supply...
Remarkable Growth In Money Supply...
Chart 7...And Unprecedented Fiscal Spending
Quarterly Portfolio Outlook: Cash Injections Versus COVID Infections
Quarterly Portfolio Outlook: Cash Injections Versus COVID Infections
But is it enough? Considerable damage has been done by the collapse in activity. Bankruptcies are rising (Chart 8) and, with activity still down 20% in consuming-facing sectors, pressure on companies’ business models will not ease soon – particularly given evidence that banks are tightening lending conditions. Household income has been buoyed by government wage-replacement schemes, handout checks, and more generous unemployment benefits (Chart 9). But, when these run out, households will struggle if the programs are not topped up. Central banks are clearly willing to inject more liquidity if need be. But the US Congress is prevaricating on a second fiscal program, and the Merkel/Macron proposed EUR750 billion spending package in the EU is making little progress. It will probably take a wake-up call from a sinking stock market to push both to take action. Chart 8Companies Feeling The Pressure
Quarterly Portfolio Outlook: Cash Injections Versus COVID Infections
Quarterly Portfolio Outlook: Cash Injections Versus COVID Infections
Considerable damage has been done by the collapse in activity. We lowered our recommendation for global equities to neutral from overweight in May. We are still comfortable with that position. Given the high degree of uncertainty, this is not a market in which to take bold positioning in a portfolio. When you have a high conviction, position your portfolio accordingly; but when you are unsure, stay close to benchmark. With stocks up by 36% since their bottom on March 23rd, the market is pricing in a V-shaped recovery and not, in our view, sufficiently taking into account the potential downside risks. P/E ratios for global stocks are at very stretched levels (Chart 10). Chart 9Households Dependent On Handouts
More Stimulus Forthcoming? Households Dependent On Handouts
More Stimulus Forthcoming? Households Dependent On Handouts
Chart 10Global Equities Are Expensive...
Global Equities Are Expensive...
Global Equities Are Expensive...
Nonetheless, we would not bet against equities. Simply, there is no alternative. Most government bond yields are close to their effective lower bound. Gold looks overbought (in the absence of a significant spike in inflation which, while possible, is unlikely for at least 12 months). No sensible investor in, say, Germany would want to hold 10-year government bonds yielding -50 basis points. Assuming 1.5% average annual inflation over the next decade, that guarantees an 18% real loss over 10 years. The only investors who hold such positions have them because their regulators force them to. Chart 11...But They Are Cheap Against Bonds
...But They Are Cheap Against Bonds
...But They Are Cheap Against Bonds
The Sharpe ratio on 10-year US Treasurys, which currently yield 70 BPs, will be 0.16 (assuming volatility of 4.5%) over the next 10 years. A simple calculation of the likely Sharpe ratio for US equities (earnings yield of 4.5% and volatility of 16%) comes to 0.28. One would need to assume a disastrous outlook for the global economy to believe that stocks will underperform bonds in the long run. Though equities are expensive, bonds are even more so. The equity risk premium in most markets is close to a record high (Chart 11). With such mathematics, it is hard for a long-term oriented investor to be underweight equities. Garry Evans, Senior Vice President Chief Global Asset Allocation Strategist garry@bcaresearch.com What Our Clients Are Asking Chart 12Premature Opening Of The Economy Is Risky
Quarterly Portfolio Outlook: Cash Injections Versus COVID Infections
Quarterly Portfolio Outlook: Cash Injections Versus COVID Infections
COVID-19: How Risky Is Reopening? Countries around the world are rushing to reopen their economies, claiming victory over the pandemic. It is hard to be sure whether a second wave of COVID-19 will hit. What is certain, however, is that a premature relaxation of measures is as risky as a tardy initial response. That was the lesson from our Special Report analyzing the Spanish Flu of 1918. The risk is certainly still there: Herd immunity will require around 70% of the population to get sick, and a drug or vaccine will (even in an optimistic scenario) not be available until early next year. China and South Korea, for example, after reporting only a handful of daily new cases in early May, were forced to impose new restrictions over the past few weeks as COVID-19 cases spiked again (Chart 12, panel 1). We await to see if other European countries, such as Italy, Spain, and France will be forced to follow. Some argue that even if a second wave hits, policy makers – to avoid a further hit to economic output – will favor the “Swedish model”: Relying on people’s awareness to limit the spread of the virus, without imposing additional lockdowns and restrictions. This logic, however, is risky since Sweden suffered a much higher number of infections and deaths than its neighboring countries (panel 2). The US faces a similar fate. States such as Florida, Arizona, and Texas are recording a sharp rise in new infections as lockdowns are eased. In panel 3, we show the daily number of new infections during the stay-at-home orders (the solid lines) and after they were lifted (dashed lines). To an extent, increases in infections are a function of mass testing. However, what is obvious is that the percentage of positive cases per tests conducted has started trending upwards as lockdown measures were eased (panel 4). Our base case remains that new clusters of infections will emerge. Eager citizens and rushed policy decisions will fuel further contagion. If the Swedish model is implemented, lives lost are likely to be larger than during the first wave. Chart 13W Or U, Says The OECD
Quarterly Portfolio Outlook: Cash Injections Versus COVID Infections
Quarterly Portfolio Outlook: Cash Injections Versus COVID Infections
What Shape Will The Recovery Be: U, V, W, Or Swoosh? The National Bureau of Economic Research (NBER) Business Cycle Dating Committee has already declared that the US recession began in March. The economists’ consensus is that Q2 US GDP shrank by 35% QoQ annualized. But, after such a momentous collapse and with a moderate move back towards normalcy, it is almost mathematically certain that Q3 GDP will show positive quarter-on-quarter growth. So does this mean that the recession lasted only one quarter, i.e. a sharp V-shape? And does this matter for risk assets? The latest OECD Economic Outlook has sensible forecasts, using two “equally probable” scenarios: One in which a second wave of coronavirus infections hits before year-end, requiring new lockdowns, and one in which another major outbreak is avoided.2 The second-wave scenario would trigger a renewed decline in activity around the turn of 2020-21: a W-shape. The second scenario looks more like a U-shape or swoosh, with an initial rebound but then only a slow drawn-out recovery, with OECD GDP not returning to its Q4 2019 level before the end of 2021 (Chart 13). Chart 14Unemployment Will Take A Long Time To Come Down
Unemployment Will Take A Long Time To Come Down
Unemployment Will Take A Long Time To Come Down
Why is it likely that, in even the absence of a renewed outbreak of the pandemic, recovery would be faltering? After an initial period in which many furloughed workers return to their jobs, and pent-up demand is fulfilled, the damage from the sudden stop to the global economy would kick in. Typically, unemployment rises rapidly in a recession, but recovers only over many years back to its previous low (Chart 14). This time, many firms, especially in hospitality and travel, will have gone bust. Capex plans are also likely to be delayed. Chart 15Sub-Potential Output Can Be Good For Risk Assets
Sub-Potential Output Can Be Good For Risk Assets
Sub-Potential Output Can Be Good For Risk Assets
However, a slow recovery is not necessarily bad for risk assets. Periods when the economy is recovering but remains well below potential (such as 2009-2015) are typically non-inflationary, which allows central banks to continue accommodation (Chart 15). Is This Sharp Equity Rebound A Retail Investor Frenzy? The answer to this question is both Yes and No. From a macro fundamental perspective, the answer is No, because coordinated global reflationary policies and medical developments to fight the coronavirus have been the key drivers underpinning this equity rebound. “COVID-on” and “COVID-off” have been the main determinants for equity rotations. Chart 16Active Retail Participation Lately
Retail Investors Have Driven Up Trading Volumes Active Retail Participation Lately
Retail Investors Have Driven Up Trading Volumes Active Retail Participation Lately
But at the individual stock level, the answer is Yes. Some of the unusual action in beaten-down stocks over the past few weeks may have its origin in an upsurge of active retail participation (Chart 16). Retail investors on their own are not large enough to influence the market direction. Many online brokerages do not charge any commission for trades, but make money by selling order flows to hedge funds. As such, the momentum set in motion by retail investors may have been amplified by fast-money pools of capital. Retail participation in some beaten-down stocks has also provided an opportunity for institutions to exit. BCA’s US Investment Strategy examined the change in institutional ownership of 12 stocks in three stressed groups between February 23 and June 14, as shown in Table 1. In the case of these stocks, retail investors have served as liquidity providers to institutional sellers seeking to exit their holdings. The redeployment of capital by institutions into large-cap and quality names may have pushed up the overall equity index level. Table 1Individuals Have Replaced Institutions
Quarterly Portfolio Outlook: Cash Injections Versus COVID Infections
Quarterly Portfolio Outlook: Cash Injections Versus COVID Infections
How Will Inflation Behave After COVID? Some clients have asked us about the behavior of inflation following the COVID epidemic. Over the very short term, inflation could have more downside. However, this trend is likely to reverse rapidly. Headline inflation is mainly driven by changes in the oil price and not by its level. Thus, even if oil prices were to stay at current low levels, the violent recovery of crude from its April lows could bring headline inflation near pre-COVID levels by the beginning of 2021 (Chart 17, top panel). This effect could become even larger if our Commodity strategist price target of 65$/barrel on average in 2021 comes to fruition. Chart 17Rising Oil Prices And Fiscal Stimulus Will Boost Inflation
Rising Oil Prices And Fiscal Stimulus Will Boost Inflation
Rising Oil Prices And Fiscal Stimulus Will Boost Inflation
But will this change in inflation be transitory or will it prove to be sustainable? We believe it will be the latter. The COVID crisis may have dramatically accelerated the shift to the left in US fiscal policy. Specifically, programs such as universal basic income may now be within the Overton window3 of acceptable fiscal policy, thanks to the success of the CARES Act in propping up incomes amid Depression-like levels of unemployment (middle panel). Meanwhile there is evidence that this stimulus is helping demand to recover rapidly: Data on credit and debit card trends show that consumer spending in the US has staged a furious rally, particularly among low-income groups, where spending has almost completely recovered (bottom panel). With entire industries like travel, restaurants and lodging destroyed for the foreseeable future, the political will to unwind these programs completely is likely to be very low, given that most policymakers will be queasy about an economic relapse, even after the worst of the crisis has passed. Such aggressive fiscal stimulus, coupled with extremely easy monetary policy will likely keep inflation robust on a cyclical basis. Global Economy Overview: March-May 2020 will probably prove to be the worst period for the global economy since the 1930s, as a result of the sudden stop caused by the coronavirus pandemic and government-imposed restrictions on movement. As the world slowly emerges from the pandemic, data has started to improve. But there remain many risks, and global activity is unlikely to return to its end-2019 level for at least another two years. That means that further fiscal and monetary stimulus will be required. The speed of the recovery will be partly determined by how much more aggressively central banks can act, and by how much appetite there is among fiscal authorities to continue to bail out households and companies which have suffered a catastrophic loss of income. US: The economy has shown signs of a strong rebound from the coronavirus slump in March and April. Q2 GDP probably fell around 35% quarter-on-quarter annualized, but Q3 will almost certainly show positive growth. The Economic Surprise Index (Chart 18, panel 1) has bounced to a record high, after stronger-than expected May data, for example the 16% month-on-month growth in durable goods orders, and 18% in retail sales. But the next stage of the recovery will be harder: continuing unemployment claims in late June were still 19.5 million. Bankruptcies are rising, and banks are tightening lending conditions. One key will be whether Congress can pass a further fiscal program before the emergency spending runs out in July. Euro Area: Although pandemic lockdowns ended in Europe earlier than in the US, recovery has been somewhat slower. The euro zone PMI rebounded to close to 50 in June but, given that activity had collapsed in February-May, it is surprising (since the PMI measures month-on-month change) that it is not well above 50 (Chart 19, panel 1). Fiscal and monetary stimulus, while large, has not been as aggressive as in the US. The ECB remains circumscribed (as least psychologically) by the German constitutional court’s questioning the justification for previous QE. Germany and France have agreed a EUR750 billion additional package to help the periphery, but this has still to be finalized, due to the opposition of some smaller northern EU members. Chart 18Economic Data Has Started To Surprise To The Upside...
Economic Data Has Started To Surprise To The Upside...
Economic Data Has Started To Surprise To The Upside...
Chart 19...But From Dramatically Low Levels
...But From Dramatically Low Levels
...But From Dramatically Low Levels
Japan: Although Japan escaped relatively easily from pandemic deaths and lockdowns, its economy remains notably weak. New machinery orders in April were still falling 18% YoY, and exports in May were down 28% YoY. The poor economic performance is due to its dependence on overseas demand, distrust in the government, the lingering effects of the ill-timed consumption tax rise last October, and limited room for manoeuvre by the Bank of Japan. The government has announced fiscal stimulus equal to a barely credible 40% of GDP, but much of this is double-counting, and less than half of the household and small-company income-replacement handouts announced in March have so far been paid out. Emerging Markets: India, Brazil, and other Latin American countries are now bearing the brunt of the coronavirus pandemic. Economies throughout Emerging Markets have weakened dramatically as a result. Two factors may come to their aid, though. China is again ramping up monetary stimulus, with a notable acceleration of credit growth over the past three months. Its economy has stabilized as a result, as PMIs show (panel 3). And the US dollar has begun to depreciate, which will take pressure off EM borrowers in foreign currencies, and boost commodities prices. The biggest risk is that many EM central banks have now resorted to printing money, which could result in currency weakness and inflation at a later stage. Interest Rates: Central banks in advanced economies have lowered policy rates to their effective lower bound. It is unlikely the Fed will cut into negative territory, having seen the nefarious effects of this on the banking systems in Japan and the euro zone, and particularly due to the large money-market fund industry in the US, which is unviable with negative rates. Reported inflation everywhere, both headline and core, has fallen sharply, but this is somewhat misleading since the price of items that households in lockdown have actually been buying has risen sharply. Markets have started to sniff out the possibility of inflation once the pandemic is over, and inflation expectations have begun to rise (panel 4). For now, deflation is likely to be the bigger worry and so we do not expect long-term rates to rise much this year. But a sharp pickup in inflation is a definite risk on the 18-24 month time horizon. Global Equities Chart 20Stretched Valuation
Has Earnings Growth Bottomed?
Has Earnings Growth Bottomed?
Valuation Concern: Global equities staged an impressive rebound of 18% in Q2 after the violent selloff in Q1, thanks to the “whatever-it-takes” support from central banks, and massive fiscal stimulus packages around the globe. Within equities, our country allocation worked well, as the US outperformed both the euro Area and Japan. Our sector performance was mixed: The overweight in Info Tech and underweight in Utilities and Real Estate generated good profits, but the overweights in Industrials and Healthcare and the underweight in Materials suffered losses. As shown in Chart 20, even before the pandemic-induced profit contraction, forward earnings were already only flattish in 2019. The sharp selloff in Q1 brought the valuation multiple back down only to the same level as at the end of 2018. Currently, this valuation measure stands at the highest level since the Great Financial Crisis after a 37% increase in Q2 2020 alone. Such a rapid multiple expansion was one of the key reasons why we downgraded equities to Neutral in May at the asset-class level. Going forward, BCA’s house view is that easy monetary policies and stimulative fiscal policies globally will help to revive economic activity, and that a weakening US dollar will give an additional boost to the global economy, especially Emerging Markets. Consequently, we upgrade global Materials to neutral from underweight and put Emerging Market equities (currently neutral) on an upgrade watch (see next page). Warming To Reflation Plays Chart 21EM On Upgrade Watch
EM On Upgrade Watch
EM On Upgrade Watch
Taking risk where risks will most likely be rewarded has been GAA’s philosophy in portfolio construction. As equity valuation reaches an extreme level, the natural thing to do is to rotate into less expensive areas within the equity portfolio. As shown in panel 2 of Chart 21, EM equities are trading at a 31% discount to DM equities based on forward P/E, which is 2 standard deviations below the average discount of past three years. Valuation is not a good timing tool in general, but when it reaches an extreme, it’s time to pay attention and check the fundamental and technical indicators. We are putting EM on upgrade watch (from our current neutral stance, and also closing the underweight in Materials given the close correlation of the two (Chart 21, panel 1). Three factors are on our radar screen: First, reflation efforts in China. The change in China’s total social financing as a % of GDP has been on the rise and BCA’s China Investment Strategy Team expects it to increase further. This bodes well for the momentum of the EM/DM performance, which is improving, albeit still in negative territory (panel 3). Second, a weakening USD is another key driver for EM/DM and the Materials sector relative performance as shown in panel 4. According to BCA’s Foreign Exchange Strategy, the US dollar is likely to churn on recent weakness before a cyclical bear market fully unfolds.4 Last but not least, the recent surge in the number of the coronavirus infections in EM economies, especially Brazil and India, has increased the likelihood of a second wave of lockdowns. Government Bonds Chart 22Bottoming Bond Yields
Bottoming Bond Yields
Bottoming Bond Yields
Maintain Neutral Duration. Global bond yields barely moved in Q2 as the global economy rebounded from the COVID-induced recession low (Chart 22, panel 1). The upside surprise in economic data releases implies that global bond yields will likely go up in the near term (panel 2). For the next 9-12 months, however, the upside in global bond yields might be limited given the increasing likelihood of a new set of COVID-19 lockdowns due to the recent surge in new infections globally, especially in the US, Brazil, and India. As such, a neutral duration stance is still appropriate (Chart 22). Chart 23Inflation Expectations On The Rise
Inflation Expectations On The Rise
Inflation Expectations On The Rise
Favor Linkers Vs. Nominal Bonds. To fight off the risk of an extended recession, policymakers around the world are determined to continue to use aggressive monetary and fiscal stimulus to boost the global economy. The combined effect of extremely accommodative policy settings and the rebound in global commodity prices, especially oil prices, will push up inflation expectations (Chart 23). Higher inflation expectations will no doubt push up nominal bond yields somewhat, but according to BCA’s Global Fixed Income Strategy (GFIS), positioning for wider inflation breakevens remains the “cleaner” way to profit for the initial impact of policy reflation.5 According to GFIS valuation models, inflation-linked bonds in Canada, Italy, Germany, Australia, France, and Japan should be favored over their respective nominal bonds. Corporate Bonds Chart 24Better Value In A-rated and Baa-rated Credit
Better Value In A-rated and Baa-rated Credit
Better Value In A-rated and Baa-rated Credit
Investment-grade: Since we moved to overweight on investment-grade credit within the fixed-income category, it has produced 8.8% in excess returns over duration-matched government bonds. We remain overweight, given that the Federal Reserve has guaranteed to rollover debt for investment-grade issuers, essentially eliminating the left tail of returns. Moreover, the Fed has begun buying both ETFs and individual bond issues, in an effort to keep financial stress contained during the pandemic. However, there are some sectors within the investment-grade space that are more attractive than others. Specifically, our Global Fixed Income Strategy team has shown that A-rated and Baa-rated bonds are more attractive than higher-rated credits (Chart 24). Meanwhile, our fixed-income strategist are overweight Energy and Financials at the sector level.6 High-yield: High-yield bonds – where we have a neutral position - have delivered 11.5% of excess return since April. We are maintaining our neutral position. At current levels, spreads no longer offer enough value to justify an overweight position, specially if one considers that defaults in junk credits could be severe, since the Fed doesn’t offer the same level of support that it provides for investment-grade issuers. Within the high-yield space, we prefer Ba-rated credit. Fallen angels (i.e. bonds which fell to junk status) are particularly attractive given that most qualify for the Fed’s corporate buying program, since issuers which held at least a Baa3 rating as of March 22 are eligible for the Fed’s lending facilities.7 Commodities Chart 25Commodity Prices Will Rise As Growth Revives
Commodity Prices Will Rise As Growth Revives
Commodity Prices Will Rise As Growth Revives
Energy (Overweight): A near-complete lack of storage led WTI prices to go into freefall and trade at -$40 in mid-April: The largest drawdown in oil prices over the past 30 years (Chart 25, panel 1). Since then, oil prices have picked up, reaching their pre-“sudden stop” levels, as the OPEC 2.0 coalition slashed production. Nevertheless, excess supply remains a key issue. Crude inventories have been on the rise as global crude demand weakens. Year-to-date inventories have increased by over 100 million barrels, and current inventories cover over 40 days of supply (panel 2). As long as the OPEC supply cuts hold and demand picks up over the coming quarters, the excess inventories are likely to be worked off. BCA’s oil strategists expect Brent crude to rise back above $60 by year-end. Industrial Metals (Neutral): Last quarter, we flagged that industrial metals face tailwinds as fiscal packages get rolled out globally – particularly in China where infrastructure spending is expected to increase by 10% in the latter half of the year. Major industrial metals have yet to recover to their pre-pandemic levels but, as lockdown measures are lifted and activity is restored, prices are likely to start to rise strongly (panel 3). Precious Metals (Neutral): The merits of holding gold were not obvious during the first phase of the equity sell-off in February and March. Gold prices tumbled as much as 13%, along with the decline in risk assets. Since the beginning of March, however, there have been as many positive return days as there has been negative (panel 4). However, given the uncertainty regarding a second wave of the pandemic, and the rise in geopolitical tensions between the US and China, as well as between India and China, we continue to recommend holding gold as a hedge against tail risks. Currencies Chart 26Momentum For The Dollar Has Turned Negative
Momentum For The Dollar Has Turned Negative
Momentum For The Dollar Has Turned Negative
US Dollar: The DXY has depreciated by almost 3% since the beginning of April. Currently, there are multiple forces pushing the dollar lower: first, interest-rate differentials no longer favor the dollar Second, liquidity conditions have improved substantially thanks to the unprecedented fiscal and monetary stimulus, as well as coordinated swap lines between the Fed and other central banks to keep USD funding costs contained. Third, momentum in the DXY – one of the most reliable indicators for the dollar – has turned negative (Chart 26– top & middle panel). Taking all these factors into account, we are downgrading the USD from neutral to underweight. Euro: The euro should benefit in an environment where the dollar weakens, and global growth starts to rebound. Moreover, outperformance by cyclical sectors as well as concerns about over-valuation in US markets should bring portfolio flows to the Euro area. Therefore, we are upgrading the euro from neutral to overweight. Australian dollar: Last quarter we upgraded the Australian dollar to overweight due to its attractive valuations, as well as the effect of the monetary stimulus coming out of China. This proved to be the correct approach: AUD/USD has appreciated by a staggering 13% since our upgrade – the best performance of any G10 currency versus the dollar this quarter (bottom panel). Overall, while we believe that Chinese stimulus should continue to prop up the Aussie dollar, valuations are no longer attractive with AUD/USD hovering around PPP fair value. This means that the risk-reward profile of this currency no longer warrants an overweight position. Thus, we are downgrading the AUD to neutral. Alternatives Chart 27Opportunities Will Emerge In Private Equity
Opportunities Will Emerge In Private Equity
Opportunities Will Emerge In Private Equity
Return Enhancers: Over the past year, we have flagged that hedge funds, particularly macro funds, will outperform other risk assets during recessions and periods of high market stress. This played out as we expected: macro hedge funds’ drawdown from January to March 2020 was a mere 1.4%, whereas other hedge funds’ drawdown ranged between 9% and 19% and global equities fell as much as 35% from their February 2020 peak. (Chart 27, panel 1). However, unlike other recessions, the unprecedented sum of stimulus should place a floor under global growth. Given the time it takes to move allocations in the illiquid space, investors should prepare for new opportunities within private equity as global growth bottoms in the latter half of this year. In an earlier Special Report, we stressed that funds raised in late-cycle bull markets tend to underperform given their high entry valuations. If previous recessions are to provide any guidance, funds raised during recession years had a higher median net IRR than those raised in the latter year of the preceding bull market (panel 2). Inflation Hedges: Over the past few quarters, we have been highlighting commodity futures as a better inflation hedge relative to other assets (e.g. real estate). Within the asset class, assuming a moderate rise in inflation over the next 12-18 months as we expect, energy-related commodities should fare best (panel 3). This corroborates with our overweight stance on oil over the next 12 months (see commodities section). Volatility Dampeners: We have been favoring farmland and timberland since Q1 2016. While both have an excel track record of reducing volatility, farmland’s inelastic demand during slowdowns will be more beneficial. Investors should therefore allocate more to farmland over timberland (panel 4). Risks To Our View The risks are skewed to the downside. After such a big economic shock, damage could appear in unexpected places. Banking systems in Europe, Japan, and the Emerging Markets (but probably not the US) remain fragile. Defaults are growing in sub-investment grade debt; mortgage-backed securities are experiencing rising delinquencies; student debt and auto loans are at risk. Emerging Market borrowers, with $4 trn of foreign-currency debt, are particularly vulnerable. The length and depth of recessions and bear markets are determined by how serious are the second-round effects of a cyclical slowdown. If the current recession really lasted only from March to July, and the bear market from February to March, this will be very unusual by historical standards (Chart 28). Chart 28Can The Recession And Bear Market Really Be All Over Already?
Can It Really Be Over Already?
Can It Really Be Over Already?
Upside surprises are not impossible. A vaccine could be developed earlier than the mid-2021 that most specialists predict. But this is unlikely since the US Food and Drug Administration will not fast-track approval given the need for proper safety testing. If economies continue to improve and newsflow generally remains positive over the coming months, more conservative investors could be sucked into the rally. Evidence suggests that the rebound in stocks since March was propelled largely by hedge funds and individual day-traders. More conservative institutions and most retail investors remain pessimistic and have so far missed the run-up (Chart 29). One key, as so often, is the direction of US dollar. Further weakness in the currency would be a positive indicator for risk assets, particularly Emerging Market equities and commodities. In this Quarterly, we have moved to bearish from neutral on the dollar (see Currency section for details). Momentum has turned negative, and both valuation and relative interest rates suggest further downside. But it should be remembered that the dollar is a safe-haven, counter-cyclical currency (Chart 30). Any rebound in the currency would not only signal that markets are entering a risk-off period, but would cause problems for Emerging Market borrowers that need to service debt in an appreciating currency. Chart 29Many Investors Are Still Pessimistic
Many Investors Are Still Pessimistic
Many Investors Are Still Pessimistic
Chart 30Dollar Direction Is Key
Dollar Direction Is Key
Dollar Direction Is Key
Footnotes 1 Please see BCA Webcast, "The Way Ahead For COVID-19: An Expert's Views," available at bcaresearch.com. 2 OECD Economic Outlook, June 2020, available at https://www.oecd-ilibrary.org/economics/oecd-economic-outlook/volume-2020/issue-1_0d1d1e2e-en 3 The Overton window, named after Joseph P. Overton, is the range of policies politically acceptable to the mainstream population at a given time. It frames the range of policies that a politician can espouse without appearing extreme. 4 Please see Foreign Exchange Strategy Weekly Report, “DXY: False Breakdown Or Cyclical Bear Market?” dated June 5, 2020 available at fes.bcaresearch.com 5 Please see Global Fixed Income Strategy Weekly Report, “How To Play The Revival Of Global Inflation Expectations” dated June 23, 2020 available at gfis.bcaresearch.com 6 Please see Global Fixed Income Strategy, "Hunting For Alpha In The Global Corporate Bond Jungle," dated May 27, 2020, available at gfis.bcaresearch.com. 7 Fallen angels also outperform during economic recoveries. Please see Global Asset Allocation Special Report, "Even Fallen Angels Have A Place In Heaven," dated November 15, 2020, available at gaa.bcaresearch.com. GAA Asset Allocation