Global
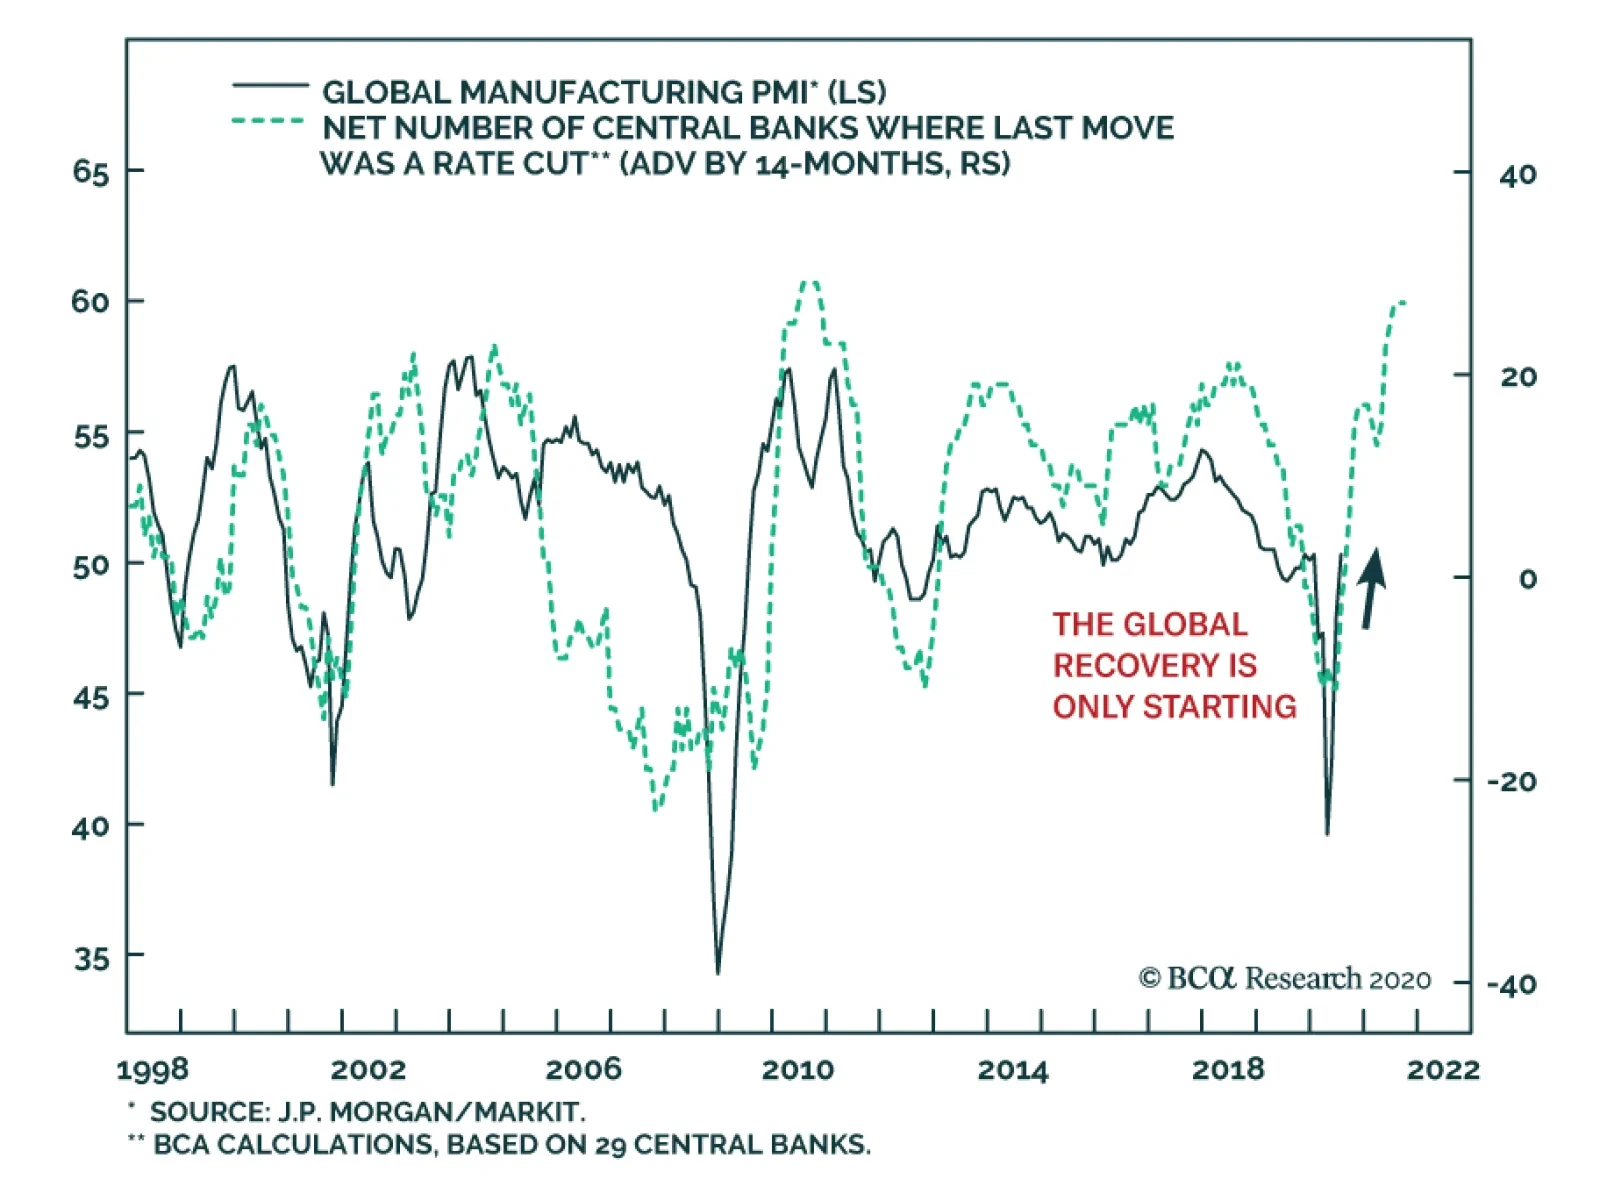
The global Manufacturing PMI continues to recover. Positively, this recovery has much further to run, which will underpin risk assets for the next year, at least. Five factors point toward additional increases in the global PMI. First, global policy…

Highlights Global Bond Yields: The growing divide between falling negative real bond yields and rising inflation expectations in the US and other major developed economies may be a sign of investors pricing in slower long-run potential economic growth in the aftermath of the COVID-19 recession – and, thus, lower equilibrium real interest rates. Stay overweight inflation-linked bonds versus nominal equivalents. Currency-hedged spread product: A broad ranking of currency-hedged global spread product yields, adjusted for volatility and credit quality, shows that the most attractive yields (hedged into USD, EUR, GBP and JPY) are on offer in emerging market USD-denominated investment grade corporates and high-yield company debt in the US and UK. Feature Global bond yields are testing the downside of the narrow trading ranges that have persisted since May. As of last Friday, the yield on the Bloomberg Barclays Global Treasury index was at 0.41%, only 3 basis points (bps) above the 2020 low seen back in March. The 10-year US Treasury yield closed yesterday at 0.56%, only 6bps above the year-to-date low. Chart of the Week
A Massive Shock To Growth ... And Interest Rates
A Massive Shock To Growth ... And Interest Rates
Concerns about global growth, with the number of new COVID-19 cases still surging in the US and new breakouts occurring in countries like Spain and Australia, would seem to be the logical culprit for the decline in yields. The first reads on global GDP data for the 2nd quarter released last week were historically miserable, with declines of -33% (annualized) in the US and -10% in the euro area (non-annualized). That represents a very deep hole of lost output, literally wiping out several years of growth. Even with the sharp improvements seen recently in cyclical indicators like global manufacturing PMIs, especially in China and Europe, a return to pre-pandemic levels of global economic output is many years away. Central banks will have no choice but to keep policy rates near 0% for at last the next couple of years, as is the current forward guidance provided by the Fed, ECB and others. Lower global bond yields may simply be reflecting the reality that it will take a long time to heal the economic wounds from the pandemic. However, there may be a more insidious reason why bond yields are falling. Investors may be permanently marking down their expectations for long-term potential economic growth, and equilibrium interest rates, in response to the devastation caused by the COVID-19 recession. Last week, Fitch Ratings lowered its estimates for long-term potential GDP growth, used to determine sovereign credit ratings, by 0.5 percentage points for the US (now 1.4%), 0.5 percentage points for the euro area (now 0.7%) and 0.7 percentage points in the UK (now 0.7%).1 These are declines similar in magnitude to the plunge in the OECD’s potential growth rate estimates seen after the 2009 Great Recession (Chart of the Week). Bond yields in the US and Europe witnessed a fundamental repricing in response, with nominal 5-year yields, 5-years forward breaking 200bps below the 4-6% range that prevailed in the US and Europe during the decade prior to the Great Recession. A similar re-rating of global bond yields to structurally lower levels may now be happening, with investors now believing that central banks will have difficulty raising rates much (if at all) in the future - even after the pandemic has ended. The Message From Declining Negative Real Bond Yields Chart 2The Real Rate/Breakevens Divergence Continues
The Real Rate/Breakevens Divergence Continues
The Real Rate/Breakevens Divergence Continues
The typical signals about economic growth from government bond yields are now less clear because of the aggressive policy responses to the COVID-19 crisis. 0% policy rates, dovish forward guidance on the timing of any future rate increases, large scale asset purchases (QE), and more extreme measures like yield curve control to peg bond yields, have all acted to suppress the level and volatility of nominal global bond yields. Within those calm nominal yields, however, the dynamic that has been in place since May - rising inflation breakevens and falling real bond yields – is growing in intensity. The 10-year US TIPS real yield is now at a new all-time low of -1.02%, while the 10-year TIPS breakeven is now up to 1.58%, the highest since February before the pandemic began to roil financial markets (Chart 2). Similar trends are evident in most other major developed economy bond markets, with the gap between falling real yields and widening breakevens growing at a notably faster pace in Canada and Australia. More often than not, longer-term real yields tend to move in the same direction as inflation expectations when economic growth is improving. The former responds to faster economic activity, often with an associated pick up in private sector credit demand. At the same time, rising inflation expectations discount higher economic resource utilization (i.e. lower unemployment) and confidence that inflation will start to pick up. A deeply negative correlation between longer-term real yields and inflation expectations is unusual, but not unprecedented. A deeply negative correlation between longer-term real yields and inflation expectations is unusual, but not unprecedented. In Chart 3, we show the range of rolling three-year correlations between 10-year inflation-linked (real) government bond yields and 10-year inflation breakevens in the US, Germany, France, Italy, the UK, Japan, Canada and Australia for the post-crisis period. The triangles in the chart are the latest three-year correlation, while the diamonds are a more recent measure showing the 13-week correlation. There are a few key takeaways from this chart: Chart 3Negative Real Yield/Breakevens Correlations Are Not Unprecedented
Are Bond Markets Throwing In The Towel On Long-Term Growth?
Are Bond Markets Throwing In The Towel On Long-Term Growth?
All countries shown have experienced a sustained period of negative correlation between real yields and inflation breakevens; The correlation has mostly been positive in Australia and has always been negative in Japan; Most importantly, the deeply negative correlations seen over the past three months – with rising breakevens all but fully offsetting falling real yields – are at or below the range of historical experience for all countries shown. Chart 4TIPS Yields May Stay Negative For Some Time
TIPS Yields May Stay Negative For Some Time
TIPS Yields May Stay Negative For Some Time
In the current virus-stricken world, where many businesses that have closed during the pandemic may never reopen, there will be abundant spare global economic capacity for several years. In the US, measures of spare capacity like the unemployment gap (the unemployment rate minus the full-employment NAIRU rate) have been a reliable leading directional indicator of the long-run correlation between real TIPS yields and TIPS breakevens over the past decade (Chart 4). The surge in US unemployment seen since the spring, which has pushed the jobless rate into double-digit territory, suggests that the current deeply negative correlation between US real yields and inflation breakevens can persist over the next 6-12 months. Given the large increases in unemployment seen in other countries, the negative correlations between real yields and inflation breakevens should also continue outside the US. As for inflation expectations, those remain correlated in the short-run to changes in oil prices and exchange rates in all countries. On that front, there is still some room for breakevens to widen to reach the fair value levels implied by our models.2 A good conceptual way to think about inflation breakevens on a more fundamental level, however, is as a “vote of confidence” in a central bank’s monetary policy stance. If investors perceive policy settings to be too tight, markets will price in slower growth and lower inflation expectations, and vice versa. Every developed market central bank is now setting policy rates near or below 0% - and promising to keep them there until at least the end of 2022. Thus, the trend of rising global inflation breakevens can continue as a reflection of very dovish central banks that will be more tolerant of increases in inflation and not tighten policy pre-emptively. Currently, real 10-year inflation-linked bond yields are below the New York Fed’s estimates of the neutral real short-term rate, or “r-star”, in the US and the UK (Chart 5), as well as in the euro area and Canada (Chart 6).3 In the US and euro area, real yields have followed the broad trend of r-star, but the gap between the two is relatively moderate with r-star estimated to be only 0.5% in the US and 0.2% in the euro zone (where the ECB is setting a negative nominal interest rate on European bank deposits at the central bank – a policy choice that the Fed has been very reluctant to consider). Chart 5Negative Real Bond Yields Are Below R* In The US & UK ...
Negative Real Bond Yields Are Below R* In The US & UK ...
Negative Real Bond Yields Are Below R* In The US & UK ...
Chart 6... As Well As In The Euro Area & Canada
... As Well As In The Euro Area & Canada
... As Well As In The Euro Area & Canada
A more interesting study is in the UK where 10yr inflation-linked Gilt yields have fallen below -2.5%, but without the Bank of England implementing any negative nominal policy rates. In the UK, inflation expectations have been relatively high – running in the 2.5-3% range prior to the COVID-19 recession – as the Bank of England has consistently kept overnight interest rates below actual CPI inflation since the 2008 financial crisis. Thus, nominal Gilt yields have stayed relatively low for longer, as real yields and inflation expectations have remained negatively correlated for a long period with the Bank of England maintaining a consistently negative real policy rate. Chart 7Spillovers From Negative TIPS Yields Into Other Assets
Spillovers From Negative TIPS Yields Into Other Assets
Spillovers From Negative TIPS Yields Into Other Assets
If the Fed were to do the same in the US, keeping the funds rate very low even as inflation rises, then a similar dynamic could take place where real TIPS yields continue to fall and TIPS breakevens continue to rise as the market prices in a sustained negative real fed funds rate. That may already be happening, with Fed Chair Jerome Powell hinting last week that the Fed is in the process of completing its inflation strategy review – with a shift towards rate hikes occurring only after realized inflation has sustainably increased to the Fed’s 2% target. A forecast of inflation heading to 2% because of falling unemployment will no longer be enough.4 Other factors may be at work depressing real bond yields while boosting inflation expectations, such as the massive QE bond buying programs of the Fed, ECB and other central banks. Yet even QE programs are essentially an aggressive form of forward guidance designed to drive down longer-term bond yields by lowering expectations of future interest rates. In sum, it is increasingly likely that the current phase of negative global real bond yields may become longer lasting if markets believe that equilibrium real policy rates are now negative. Bond investors will expect central banks to sit on their hands and do nothing in that environment, even if inflation starts to increase. This not only has implications for bond markets, but other asset classes as well based on what is happening in the US. The steady decline in the in the 10-year US TIPS yield has boosted the valuation of assets that typically have been considered inflation hedges, like equities and gold (Chart 7). The fall in TIPS yields also suggests that more weakness in the US dollar is likely to come over the next 6-12 months – another reflationary factor that should help lift global inflation expectations and boost the attractiveness of inflation-linked bonds. The current phase of negative global real bond yields may become longer lasting if markets believe that equilibrium real policy rates are now negative. Bottom Line: The growing divide between falling negative real bond yields and rising inflation expectations in the US and other major developed economies may be a sign of investors pricing in slower long-run potential economic growth in the aftermath of the COVID-19 recession – and, thus, lower equilibrium real interest rates. Stay overweight inflation-linked bonds versus nominal equivalents. Searching For Value In Global Spread Product Last week, we looked at the impact of currency hedging on the attractiveness of government bond yields across the developed markets.5 We concluded that US Treasuries still offered superior yields to most other countries’ sovereign bonds, even with the US dollar in a weakening trend and after hedging out currency risk. We also presented a cursory look at the relative attractiveness of the major global spread product categories in that report, but without factoring in any considerations on the relative credit quality or volatility between sectors. This week, we will look at the relative value of global spread products hedged into USD, GBP, EUR and JPY, but after controlling for those credit and volatility risks. We conducted a similar analysis in early 2018,6 ranking the currency-hedged yields for a wide variety of global spread products by the ratio of yields to trailing volatility. This time, instead of looking at the just that simple valuation metric, we use regression models to make a judgment on how under- or over-valued spread products are relative to their “fair value”. To recap the methodology of this analysis, we take the Bloomberg Barclays index yield-to-maturity (YTM) for each spread product category, hedged into the four currencies used in this analysis, and divide it by the annualized trailing volatility of those yields over both short-term (1-year) and long-term (3-year) windows. In order to hedge the yields into each currency, we used the annualized differentials between spot and 3-month forward exchange rates, which is the all-in cost of hedging. We then compare those currency-hedged, volatility-adjusted yields to two measures of risk: the index credit rating and duration times spread (DTS) for each spread product. Table 1 summarizes the attractiveness of each product when hedged into different currencies. The rank is based on the average of four different valuation measures.7 The higher the rank, the more attractive the sector is in terms of yield relative to risk measures such as both short-term and long-term volatilities, credit ratings, and DTS. Table 1Ranking Currency-Hedged, Risk-Adjusted Global Spread Product Yields
Are Bond Markets Throwing In The Towel On Long-Term Growth?
Are Bond Markets Throwing In The Towel On Long-Term Growth?
A few interesting points come from the table: Emerging market (EM) USD-denominated investment grade (IG) corporate debt ranks at or near the top of the rankings, for all currencies; the opposite holds true for EM USD-denominated sovereign bonds Almost all European spread products rank poorly for non-euro denominated investors US & UK high-yield (HY) rank highly for all currencies US real estate related assets (MBS and CMBS) also rank well for all investor groups In general, US products are more attractive than European credit sectors. This is mainly because US spread products offer higher yields than European ones even after accounting for volatility and the weakening US dollar. Almost all European spread products rank poorly for non-euro denominated investors. Chart 8 shows the unhedged YTM on the x-axis and the option-adjusted spread (OAS) on the y-axis (Table 2 contains the abbreviations used in this chart and all remaining charts in this report). Unsurprisingly, the YTM and OAS follow a very tight linear relationship. However, when yields are hedged into different currencies and risk measures are factored in, the result changes. Chart 8Global Spread Product Yields & Spreads
Are Bond Markets Throwing In The Towel On Long-Term Growth?
Are Bond Markets Throwing In The Towel On Long-Term Growth?
Charts 9A to 12B show the details of spread product analysis with different currency hedges and risk factors. To limit the number of charts shown, we show only currency-hedged yields adjusted by long-term trailing volatility (the rankings do not change significantly when using a shorter-term volatility measure). The y-axis in all charts shows the volatility-adjusted yields, while the x-axis shows credit ratings and DTS. Sectors that are close to upper-right in each chart are more attractive (undervalued), while spread products that are close to bottom-left are less attractive (overvalued). Chart 9AGlobal Spread Product Yields, Hedged Into USD, Adjusted For Credit Quality
Are Bond Markets Throwing In The Towel On Long-Term Growth?
Are Bond Markets Throwing In The Towel On Long-Term Growth?
Chart 9BGlobal Spread Product Yields, Hedged Into USD, Adjusted For Duration-Times-Spread
Are Bond Markets Throwing In The Towel On Long-Term Growth?
Are Bond Markets Throwing In The Towel On Long-Term Growth?
Chart 10AGlobal Spread Product Yields, Hedged Into EUR, Adjusted For Credit Quality
Are Bond Markets Throwing In The Towel On Long-Term Growth?
Are Bond Markets Throwing In The Towel On Long-Term Growth?
Chart 10BGlobal Spread Product Yields, Hedged Into EUR, Adjusted For Duration-Times-Spread
Are Bond Markets Throwing In The Towel On Long-Term Growth?
Are Bond Markets Throwing In The Towel On Long-Term Growth?
Chart 11AGlobal Spread Product Yields, Hedged Into GBP, Adjusted For Credit Quality
Are Bond Markets Throwing In The Towel On Long-Term Growth?
Are Bond Markets Throwing In The Towel On Long-Term Growth?
Chart 11BGlobal Spread Product Yields, Hedged Into GBP, Adjusted For Duration-Times-Spread
Are Bond Markets Throwing In The Towel On Long-Term Growth?
Are Bond Markets Throwing In The Towel On Long-Term Growth?
Chart 12AGlobal Spread Product Yields, Hedged Into JPY, Adjusted For Credit Quality
Are Bond Markets Throwing In The Towel On Long-Term Growth?
Are Bond Markets Throwing In The Towel On Long-Term Growth?
Chart 12BGlobal Spread Product Yields, Hedged Into JPY, Adjusted For Duration-Times-Spread
Are Bond Markets Throwing In The Towel On Long-Term Growth?
Are Bond Markets Throwing In The Towel On Long-Term Growth?
Table 2Global Spread Products In Our Analysis
Are Bond Markets Throwing In The Towel On Long-Term Growth?
Are Bond Markets Throwing In The Towel On Long-Term Growth?
An interesting result is that when comparing the three major high-yield products (US-HY, EMU-HY and UK-HY), US-HY is the most attractive in USD terms, but UK-HY is more attractive when hedged into GBP, EUR, and JPY. Another observation is that higher quality bonds such as government-related and agency debt in the US and euro area are overvalued and less attractive given how low their yields are, regardless of their low volatility. The results from this analysis may differ from our current recommendations. For example, we currently only have a neutral recommendation on EM corporates, but based on this analysis, EM corporates offer the most attractive return in USD terms. This analysis is purely based on YTM and traditional risk factors without considering other concerns that could make EM assets riskier such as the spread of COVID-19 in major EM countries. However, these rankings do line up with our major spread product call of overweighting US IG and HY corporate debt versus euro area equivalents. Based on this analysis, EM corporates offer the most attractive return in USD terms. Bottom Line: A broad ranking of currency-hedged global spread product yields, adjusted for volatility and credit quality, shows that the most attractive yields (hedged into USD, EUR, GBP and JPY) are on offer in emerging market USD-denominated investment grade corporates and high-yield company debt in the US and UK. Robert Robis, CFA Chief Fixed Income Strategist rrobis@bcaresearch.com Ray Park, CFA Research Analyst ray@bcaresearch.com Footnotes 1https://www.fitchratings.com/research/sovereigns/coronavirus-impact-on-gdp-will-be-felt-for-years-to-come-27-07-2020 2 Please see BCA Global Fixed Income Strategy Weekly Report, "How To Play The Revival Of Global Inflation Expectations", dated June 23, 2020, available at gfis.bcaresarch.com. 3 We use the French 10-year inflation-linked bond as the proxy for the entire euro area, as this is the oldest inflation-linked bond market in the region and thus has the most data history. 4https://www.wsj.com/articles/fed-weighs-abandoning-pre-emptive-rate-moves-to-curb-inflation-11596360600?mod=hp_lead_pos6 5 Please see BCA Research Weekly Report, “What A Weaker US Dollar Means For Global Bond Investors”, dated July 28, 2020, available at gfis.bcaresarch.com. 6 Please see BCA Global Fixed Income Strategy Weekly Report, "Policymakers Are Now Selling Put Options On Volatility, Not Asset Prices", dated March 6, 2018, available at gfis.bcareseach.com. 7 Hedged YTM/Short-term trailing volatility vs. Credit Rating; Hedged YTM/Long-term trailing volatility vs. Credit Rating; Hedged YTM/Long-term trailing volatility vs. Duration; Hedged YTM/Long-term trailing volatility vs. Duration. Recommendations The GFIS Recommended Portfolio Vs. The Custom Benchmark Index
Are Bond Markets Throwing In The Towel On Long-Term Growth?
Are Bond Markets Throwing In The Towel On Long-Term Growth?
Duration Regional Allocation Spread Product Tactical Trades Yields & Returns Global Bond Yields Historical Returns
BCA Research's Global Investment Strategy service concludes that bank shares should start to do better as yield curves steepen and faster economic growth reduces concerns over non-performing loans. Gauging the outlook for financials is tricky. Credit…
Dear Client, There will be no Weekly Report on August 10, as the US Equity Strategy team will be on vacation for the week. Our regular publication schedule will resume on Monday August 17, 2020 with a Special Report by my colleague Chester Ntonifor, BCA’s Chief FX Strategist on the interplay of the style bias and the US Dollar. We trust that you will find this Report both informative and insightful. Kind Regards, Anastasios Feature Before getting to our analysis on why cyclicals will best defensives, we want to address our definition of cyclicals and defensives, where we think tech stands and why, discuss what our current positioning is and what time horizon we are targeting for this portfolio bent. Cyclicals And Defensives Definition Table 1 is a stripped down version of our current recommendations table and shows that our cyclicals definition is one of deep cyclicals including industrials, materials, energy and the information technology sector. Utilities, consumer staples, health care and telecom services (which is currently categorized as a GICS2) comprise our defensives universe. Table 1US Equity Strategy's Cyclicals Vs. Defensives Current Recommendations
Top 10 Reasons To Start Nibbling On Cyclicals At The Expense Of Defensives
Top 10 Reasons To Start Nibbling On Cyclicals At The Expense Of Defensives
Tech Is Still Cyclical Importantly, we still consider the tech sector a deep cyclical and not a safe haven sector. While the COVID-19 fallout has acted as an accelerant especially to a faster absorption of goods and services of the tech titans, that is not a de facto change in the behavior of these still cyclical stocks. As a reminder tech stocks have 60% export exposure or 20 percentage points higher than the broad market. The implication is that US tech trends should follow the ebbs and flows of the global economy. Contrary to popular belief that technology equities behaved defensively recently, empirical evidence gives credence to our hypothesis that technology stocks remain cyclical: from the Feb 19 SPX peak until the March trough the IT sector underperformed all four defensive sectors (Chart of the Week). In marked contrast, tech has left in the dust defensive sectors since the March bottom, cementing its cyclical status. Chart of the WeekTech Remains A Cyclical Sector
Tech Remains A Cyclical Sector
Tech Remains A Cyclical Sector
Current Positioning With regard to our broader technology positioning, we are currently neutral the S&P tech sector, overweight the S&P internet retail index (which Amazon dominates) that sits under the S&P consumer discretionary sector and underweight the S&P interactive media & services index (which includes Alphabet and Facebook) that falls under the newly formed S&P communications services sector. Thus, our broadly defined tech sector exposure remains neutral. Meanwhile, last week we boosted the S&P materials sector to overweight and that move pushed our cyclicals/defensives bent marginally to preferring deep cyclicals to defensives (please see market cap weights in Table 1). Timing Is Key This portfolio bent may run into some near-term trouble as we expect a flare up of (geo)political risks (please see here and here), but once the election uncertainty lifts, hopefully in late-November/early-December, from that point onward and on a 9-12 month time horizon cyclicals should really start to flex their muscles versus defensives. The purpose of this Special Report is to identify the top ten drivers of the looming cyclicals versus defensives outperformance phase on a cyclical time horizon. What follows is one page one chart per key reason, in no particular order of importance. 1.) Dollar The Reflator Time and again we have highlighted the boost that internationally exposed sectors get from a weakening greenback. Cyclicals are the primary beneficiaries of such a backdrop as a lot of these deep cyclical companies garner over 50% of their sales from abroad. We recently updated in a Special Report the breakdown of GICS1 sectors’ foreign sourced revenues and more importantly their performance during US dollar bear markets. Cyclicals clearly have the upper hand. Chart 1 shows this tight inverse correlation, irrespective of what USD index we use. Finally, looking ahead a falling greenback will act as a relative profit reflator (US dollar shown inverted, bottom panel, Chart 1), especially given that most of the defensive sectors are landlocked in the US and do not get a P&L fillip from positive translation gains. Chart 1CHART 1
CHART 1
CHART 1
2.) Global Growth Recovery Not only does the debasing of the US dollar bode well for Income Statement (I/S) relative translation gains, but also serves as a tonic to global growth. In other words, a final demand recovery is in the works on the back of a pending virtuous cycle: a depreciating dollar lifts global growth, and an increase in trade brings more US dollars in circulation further weakening the greenback (top panel, Chart 2). Our Global Trade Activity Indicator also corroborates the USD message and underscores a global growth recovery into 2021 (second panel, Chart 2). Tack on the meteoric rise in the G10 economic surprise index (third panel, Chart 2) and factors are falling into place for a synchronized global economic recovery including a V-shaped US rebound from the depths of the recession in Q2 (ISM manufacturing survey shown advanced, bottom panel, Chart 2). Chart 2CHART 2
CHART 2
CHART 2
3.) US Capex To The Rescue The latest GDP report made for grim reading. US capex collapsed 27% last quarter in line with the fall it suffered in Q1/2009. Not even bulletproof software investment escaped unscathed and contracted for the first time in seven years, albeit modestly. However, if the looming recovery resembles the GFC episode when real non-residential investment soared 40 percentage points from that nadir in the subsequent five quarters, then a slingshot rebound will ensue by the end of 2021. Importantly, our US capex indicator has an excellent track record in leading the relative share price ratio and confirms that a capex trough is already in store, tracing out the bottom hit during the Great Recession (top panel, Chart 3). Regional Fed surveys also signal that a capex boom looms in the coming quarters (middle panel, Chart 3). And, so do cheery CEOs that expect a sizable investment recovery in the next six months, according to the Conference Board survey (bottom panel, Chart 3). All of this is a harbinger of a cyclicals outperformance phase at the expense of defensives. Chart 3CHART 3
CHART 3
CHART 3
4.) Chinese Capex On The Upswing (Fiscal Easing) Across the pacific, Chinese excavator sales have gone vertical. While we take Chinese data with a grain of salt, Komatsu hydraulic excavator demand growth in China has averaged 45% on a year-over-year basis in the quarter ending in June. This Japanese company’s data, which has been unaffected by the US/Sino trade war, corroborates the Chinese official statistics (top panel, Chart 4). Infrastructure spending is also on the rise in China following an abrupt halt in projects started early in 2020. This revving of the investment spending engine is bullish for the broad commodity complex including US cyclicals (bottom panel, Chart 4). Chart 4CHART 4
CHART 4
CHART 4
5.) Chinese Monetary Easing None of the above investment recovery would have been possible had the Chinese authorities not opened up the liquidity spigots. Monetary easing via the sinking reserve-requirement-ratio (RRR) has been instrumental in engineering an economic rebound (RRR shown inverted, third panel, Chart 5). The credit-easing channel has been also important in funneling cash toward investment, and the climbing Li Keqiang index is evidence that sloshing liquidity is being put to good use (bottom & second panels, Chart 5). Finally, Chinese loan demand data also confirms that an economic recovery is in the offing and heralds a US cyclicals versus defensives portfolio tilt (top panel, Chart 5). Chart 5CHART 5
CHART 5
CHART 5
6.) Firming Financial Market Data (Chinese And EM Equity Market Outperformance) Typically, financial market data are early in sniffing out a turn in economic data. This anticipatory nature of financial markets is currently signaling that EM in general and Chinese economic growth in particular will make a significant comeback in the coming quarters. Importantly, Chinese bourses and the MSCI EM equity index (in USD) have recently started to outperform the ACWI and the SPX (Chart 6). Both of these equity markets are more cyclically exposed than the defensive US and global indexes because of the respective sector composition and have paved the way for a sustainable rise in the US cyclicals/defensives share price ratio (Chart 6). Chart 6CHART 6
CHART 6
CHART 6
7.) Transition From Deflation To Inflation Similarly to the EM and Chinese equity market outperformance of their DM peers, commodity prices are putting in a bottom and forecasting a brighter global trade backdrop for the rest of the year (top panel, Chart 7). The depreciating US dollar is also underpinning the commodity complex and this should serve as a catalyst for an exit from the recent global disinflationary backdrop, especially corporate wholesale price deflation. Domestically, the prices paid subcomponent of the ISM manufacturing survey is firming and projecting that relative pricing power will favor cyclicals versus defensives (bottom panel, Chart 7). Chart 7CHART 7
CHART 7
CHART 7
8.) Profit Expectations Have Turned The Corner Sell-side extreme pessimism has given way to mild optimism as depicted by the now positive relative Net Earnings Revisions (NER) ratio (third panel, Chart 8). Importantly, despite the spike in the relative NER ratio, the bar has not risen enough both on a relative profit growth and revenue growth basis in order to short circuit the recovery in the relative share price ratio (second & bottom panels, Chart 8). Chart 8CHART 8
CHART 8
CHART 8
9.) Alluring Valuations The relative Valuation Indicator remains below the neutral zone offering a cushion to investors that are contending to execute a cyclicals versus defensives portfolio bent (Chart 9). Chart 9CHART 9
CHART 9
CHART 9
10.) Enticing Technicals Lastly, cyclicals are still unloved compared with defensives as our relative Technical Indicator (TI) highlights in Chart 10. In fact, our relative TI also hovers below the neutral zone, near a level that has marked previous playable recovery rallies (bottom panel, Chart 10). Chart 10CHART 10
CHART 10
CHART 10
But Monitor Three Key Risks Over the coming 12 to 18 months, investors should prepare their portfolios for an outperformance phase of cyclical sectors relative to defensives. Nonetheless, we are closely monitoring a number of key risks that can put our view offside. First, the relentless rise of ex-Vice President Biden in the polls on PREDICTIT, the rapidly increasing probability of a “Blue Sweep” in the upcoming elections, and the non-negligible risk of a contested election (as discussed in a joined Special Report with our sister Geopolitical Strategy service last week), all pose a short-term threat to the benign election backdrop priced into stocks. Were a risk-off phase to materialize in the next three months, as we expect, then cyclicals would take the back seat versus defensives, at least temporarily (bottom panel, Chart 11). Second, what worries us most is that Dr. Copper and crude oil (another global growth barometer), especially compared with gold, have yet to confirm the global growth recovery. In other words, the fleeting oil-to-gold and copper-to-gold ratios underscore that the liquidity-to-growth handoff has gone on hiatus. While we are not ready to throw in the towel yet, these relative commodity signals are disconcerting, and were they to deteriorate further, they would definitely undermine our optimistic view on global growth (top and second panels, Chart 11). Finally, it is disquieting that our relative profit growth models have no pulse. They represent a significant risk to the relative earnings-led rebound which the rest of the indicators we track are anticipating (third panel, Chart 11). Chart 11Three Key Risks We Are Monitoring
Three Key Risks We Are Monitoring
Three Key Risks We Are Monitoring
Bottom Line: On balance, a looming global growth recovery and pending global capex upcycle, a softening US dollar, commodity price inflation and Chinese monetary easing will more than offset the trifecta of rising election-related risks, the current unresponsiveness of our relative profit growth models and the lack of confirmation of a liquidity-to-growth transition. This will pave the way for a cyclicals outperformance phase at the expense of defensives. Anastasios Avgeriou US Equity Strategist anastasios@bcaresearch.com
Markets have shrugged off the rise in COVID-19 cases in the US and new clusters in other places such as Spain, Hong Kong, Melbourne, and Tokyo (Chart 1). The MSCI All-Country World Index is now only 4% off its all-time high in February. We don’t see the markets ignoring reality for much longer. Economic activity remains very subdued (Chart 2), which will eventually cause a significant rise in bankruptcies and problems for banks. Nevertheless, the unprecedented monetary and fiscal stimulus will be increased further in coming weeks, which should prevent a big shift towards pessimism for a while. The crunch time will come in the northern-hemisphere winter, when COVID cases in North America and Europe are likely to rise sharply again. Risk assets at their current levels are not pricing in those risks. Recommended Allocation
Monthly Portfolio Update: Winter Is Coming – But Maybe Not Yet
Monthly Portfolio Update: Winter Is Coming – But Maybe Not Yet
Chart 1COVID Cases Are Still On The Rise
COVID Cases Are Still On The Rise
COVID Cases Are Still On The Rise
Chart 2Activity Remains Subdued
Monthly Portfolio Update: Winter Is Coming – But Maybe Not Yet
Monthly Portfolio Update: Winter Is Coming – But Maybe Not Yet
Markets are driven by the second derivative of growth. It is not surprising, then, that equities began to rally in March, exactly when economic data stopped deteriorating, even though it remained atrocious (Chart 3). Real interest rates have also continued to fall, even as risk assets rallied; this further fueled the rally, since the theoretical value of equities rises as the rate at which they are discounted falls (Chart 4). Chart 3Data Stopped Deteriorating In March
Data Stopped Deteriorating In March
Data Stopped Deteriorating In March
Chart 4Real Interest Rates Have Continued To Fall
Real Interest Rates Have Continued To Fall
Real Interest Rates Have Continued To Fall
But the question now is: Can the data continue to improve? PMIs will fall back towards 50, and economic releases are unlikely to surprise so strongly on the upside. In the US, as a result of the rise in COVID-19 cases and renewed (albeit mostly moderate) government restrictions on activity, consumer confidence has started to weaken again and initial unemployment claims to pick up (Charts 5 and 6). Even though the Fed will remain ultra-dovish, real rates will not fall much further from their current level, which is the lowest since TIPS started trading in the late 1990s. Chart 5Consumer Confidence Is Weakening Again
Consumer Confidence Is Weakening Again
Consumer Confidence Is Weakening Again
Chart 6The Jobs Market Has Stopped Improving
The Jobs Market Has Stopped Improving
The Jobs Market Has Stopped Improving
Chart 7Will Money Supply Growth Peak?
Will Money Supply Growth Peak?
Will Money Supply Growth Peak?
Money supply growth has grown rapidly, as a result of the increase in central-bank balance-sheets and the rush of companies to borrow to shore up their cash positions (Chart 7). The increase in excess liquidity has also been a force behind the rise in risk assets. But money supply growth is likely to slow from now. At least partly offsetting these risks will be further fiscal stimulus. BCA Research’s Geopolitical strategists see Congress approving a big new package of around $2.5 trillion, mainly because of widespread popular support for an extension of more generous unemployment benefits (Table 1). Agreement should come before the scheduled recess on August 10 (if it doesn’t, this would trigger a market selloff). The recent agreement between European Union leaders on a EUR750 billion fiscal package was a major breakthrough, since it represented joint borrowing backed by the rich northern European countries to provide transfers to the poorer periphery. Table 1There Is Much Public Support For Fiscal Stimulus
Monthly Portfolio Update: Winter Is Coming – But Maybe Not Yet
Monthly Portfolio Update: Winter Is Coming – But Maybe Not Yet
Further upside may come as the many investors who have missed the rally since March capitulate and buy risk assets. Investor sentiment is currently unusually polarized. Speculative individuals and hedge funds are very bullish (Chart 8). But more conservative pension funds, wealth managers, and individual investors, mostly remain cautious, as evidenced by the AAII weekly survey, in which many more investors say they expect the stock market to fall over the next six months than to rise (Chart 9). Cash levels remain high by historical standards (Chart 10). Although only a minority of investors turned positive in March, a recent academic study demonstrated how hedge funds and small active institutions have a disproportionate influence on price movements (Chart 11). A downside risk, then, would be if these investors decided to take profits or turned more bearish. Chart 8Hedge Funds Are Bullish...
Hedge Funds Are Bullish...
Hedge Funds Are Bullish...
Chart 9...But Retail Investors Very Cautious
...But Retail Investors Very Cautious
...But Retail Investors Very Cautious
Chart 10Cash Holdings Remain Elevated
Cash Holdings Remain Elevated
Cash Holdings Remain Elevated
Chart 11Some Smaller Investors Have A Big Impact
Monthly Portfolio Update: Winter Is Coming – But Maybe Not Yet
Monthly Portfolio Update: Winter Is Coming – But Maybe Not Yet
We have argued, since the pandemic began, that investors should not take high-conviction bets in such an uncertain environment. They should, rather, design portfolios which are robust under various scenarios. After the 43% rise in global equities since March, we cannot recommend an above-benchmark weighting, since downside risks are not priced in. We remain neutral on global equities. However, fixed-income instruments look even more unattractive at the current low level of rates; we remain underweight. We recommend hedging via a large overweight in cash, which leaves dry powder for when a better buying opportunity arises. Currencies: A key (as always) to the macro view is what happens to the US dollar. Many of the drivers of the dollar – interest-rate differentials, valuation, momentum, and relative money-supply growth – point to it weakening further (Chart 12). The trade-weighted dollar is already off 9% from its March peak. We turned bearish on the USD in our Quarterly published at the beginning of July. It is too early, however, to declare that the dollar bull market, which began in 2012, is definitely over. Chart 12Dollar Indicators Are Bearish...
Dollar Indicators Are Bearish...
Dollar Indicators Are Bearish...
Chart 13…But Short USD Is Now A Consensus
Monthly Portfolio Update: Winter Is Coming – But Maybe Not Yet
Monthly Portfolio Update: Winter Is Coming – But Maybe Not Yet
A new downturn in the global economy would push the dollar back up again, since it is a safe-haven currency. Shorting the dollar, especially against the euro, is now a consensus position, and so a near-term reversal is quite likely (Chart 13). But, over the next 12-18 months, a move above 1.22 for the euro and towards 100 for the yen is possible. We will continue to analyze whether the dollar could be entering a bear market, since this would necessarily make us more structurally positive on commodities and emerging markets. Equities: A pickup in global growth and a weakening US dollar might prove positive for cyclicals and value stocks in the long run, which would cause European and EM equities to outperform. Given the current uncertainty, however, we cannot recommend that stance and therefore continue to prefer “growth defensives” such as Health Care and Technology, which implies an overweight on the overall US market. Valuations in the Health Care sector remain attractive (Chart 14). Companies in the (broadly defined) Tech sector are beneficiaries of the pandemic, generally have robust balance-sheets, and should continue to see strong earnings growth for some years. And, while Technology is clearly expensive, valuations are still nowhere as excessive as in 2000 (Chart 15). For Tech to crash would require either that it go ex-growth, or that there is significant regulatory action. Chart 14Health Care Still Attractively Valued
Health Care Still Attractively Valued
Health Care Still Attractively Valued
Chart 15Tech Still Way Below Bubble Levels
Tech Still Way Below Bubble Levels
Tech Still Way Below Bubble Levels
Chart 16Europe No Longer So Dominated By Financials
Europe No Longer So Dominated By Financials
Europe No Longer So Dominated By Financials
Neither of these seems likely for now. Euro zone equities are less dominated than they were by Financials, but remain more cyclical than the US, with very few internet-related names (Chart 16). Fixed Income: Central banks will remain very dovish and, as Fed chair Jerome Powell has emphasized, are not even thinking about thinking about tightening policy. This suggests that nominal rates will rise only moderately, even if growth continues to pick up. The Fed still has plenty of room to ease further if needed, since the programs it rolled out in March have barely been taken up yet (Table 2). We thus recommend a neutral position on duration. We find TIPS attractive as a hedge against an eventual spike in inflation. The 10-year breakeven inflation rate implied in TIPS remains around 100 basis points below being compatible with the Fed achieving its 2% PCE inflation target in the long run (Chart 17). The announcement in September of the results of the Fed’s 18-month review of its policy framework, which is likely to intensify its efforts to achieve the inflation target, could push breakevens up a bit further. In credit, we continue to recommend buying whatever central banks are buying, mostly investment-grade corporate bonds and the top end of the US junk bond market. Though spreads have fallen a long way, they are still well above end-2019 levels, and look attractive in a world of such low government bond yields (Chart 18). Table 2Usage Of The 2020 Federal Reserve Emergency Lending Facilities
Monthly Portfolio Update: Winter Is Coming – But Maybe Not Yet
Monthly Portfolio Update: Winter Is Coming – But Maybe Not Yet
Chart 17TIPS Still Pricing Low Inflation For A Decade
TIPS Still Pricing Low Inflation For A Decade
TIPS Still Pricing Low Inflation For A Decade
Chart 18Credit Spreads Could Fall Further
Credit Spreads Could Fall Further
Credit Spreads Could Fall Further
Commodities: The weakening US dollar and continued expansion of Chinese stimulus (Chart 19) should be positive for industrial metals prices over the next six to nine months. Oil prices also have some further upside, since the OPEC 2.0 agreement to restrict supply is being adhered to, and demand will gradually pick up (although air travel will remain depressed, more commuters are using their cars as they avoid public transport). BCA Research’s Energy Service forecasts Brent crude to average $44 in the second half of this year, and $65 in 2021 (up from the current $43). Gold has already run up a lot and is now close to a record high price in real terms, with sentiment very optimistic (Chart 20). Chart 19China Stimulus Positive For Metals
China Stimulus Positive For Metals
China Stimulus Positive For Metals
Nonetheless, in an environment of very low real rates, it represents a good hedge against extreme tail risks, and therefore we continue to recommend a moderate position as an insurance. Chart 20Gold Looking Rather Toppish
Gold Looking Rather Toppish
Gold Looking Rather Toppish
Garry Evans, Senior Vice President Global Asset Allocation garry@bcaresearch.com Recommended Asset Allocation
GAA DM Equity Country Allocation Model Update The GAA DM Equity Country Allocation model is updated as of July 31, 2020. The model has not made any meaningful adjustment to the top overweight countries with the top four remaining the US, Spain, Australia, and Sweden. Within the underweight countries, however, the UK has dropped out of the top four, replaced by Germany. Japan, France, and Switzerland remain in the top 4 underweight countries, as shown in Table 1. Table 1Model Allocation Vs. Benchmark Weights
GAA Quant Model Updates
GAA Quant Model Updates
As shown in Table 2 and Charts 1, 2 and 3, the overall model outperformed the MSCI World benchmark by 73 bps in July, with positive contributions from both the Level 1 and the Level 2 models. The Level 2 model outperformed its benchmark by 176 bps, thanks largely to the underweight in Japan and the UK, as well as the overweight in Sweden. The Level 1 model outperformed by 27 bps due to the large overweight in the US. Since going live, the overall model has outperformed its MSCI World benchmark by 390 bps, with 714 bps of outperformance from the Level 2 model, and 74 bps of outperformance from the Level 1 model. Table 2Performance (Total Returns In USD %)
GAA Quant Model Updates
GAA Quant Model Updates
Chart 1GAA DM Model Vs. MSCI World
GAA DM Model Vs. MSCI World
GAA DM Model Vs. MSCI World
Chart 2GAA US Vs. Non US Model (Level 1)
GAA US Vs. Non US Model (Level 1)
GAA US Vs. Non US Model (Level 1)
Chart 3GAA Non US Model (Level 2)
GAA Non US Model (Level 2)
GAA Non US Model (Level 2)
GAA Equity Sector Selection Model The GAA Equity Sector Model (Chart 4) is updated as of July 31, 2020. The model’s relative tilts between cyclicals and defensives did not change compared to last month. The model continues to maintain its cyclical stance driven by an improvement in its global growth proxy and remains exposed to cyclical sectors. Over the past month, the model outperformed its benchmark by 32 basis points. Year-to-date, the model has outperformed its benchmark by 144 basis points, and 149 basis points since inception. Chart 4Overall Model Performance
Overall Model Performance
Overall Model Performance
Table 3Overall Model Performance
GAA Quant Model Updates
GAA Quant Model Updates
The model’s global growth proxy improved – driven by appreciating EM currencies and rising metal prices, and therefore continues to remain positive on cyclical sectors. Global monetary easing and low rates should keep the liquidity component favoring a mixed bag of cyclical and defensive sectors. The valuation component remains muted across all sectors except Energy. However, multiple sectors continue to be near the expensive and cheap zones – mainly Info Tech and Consumer Discretionary (expensive), and Real Estate and Consumer Staples (cheap). The model awaits confirming momentum signals to change recommendations for those sectors. Table 4Current Model Allocations
GAA Quant Model Updates
GAA Quant Model Updates
The model is now overweight four cyclical sectors in total. These are Information Technology, Consumer Discretionary, Communication Services, and Materials. For more details on the model, please see the Special Report “Introducing the GAA Equity Sector Selection Model”, dated July 27, 2016, as well as the Sector Selection Model section in the Special Alert “GAA Quant Model Updates”, dated March 1, 2019 available at https://gaa.bcaresearch.com. Xiaoli Tang Associate Vice President xiaoliT@bcaresearch.com Amr Hanafy Senior Analyst amrh@bcaresearch.com
Highlights The tech sector is in a manic phase. This mania has further room to run because inflation will remain low for at least the next two years and global central banks will maintain very easy policy conditions, which will cap the upside in bond yields. Tech will have its day of reckoning when inflation can rise and the sector’s weight will drag down the market. Bubbles are prone to severe corrections; this one is no exception. In the near term, tech earnings will probably miss lofty embedded expectations. The falling dollar is a problem for the sector and the election season introduces great risks. In the near term, inflation breakeven rates, the silver-to-gold ratio and the deep cyclicals-to-defensives ratio will all rise further. Industrials have a window to outperform technology. Feature The S&P 500 continues its ascent, increasingly driven higher by surging tech stocks. The extreme resilience of a few tech titans has resulted in an incredibly concentrated equity market, in which the capitalization of Google, Amazon, Microsoft, Apple and Facebook equals that of 224 deep and early cyclical stocks in the S&P 500. Such a narrow market raises three questions: is the tech sector in a bubble? What will pop this bubble? If the tech bubble bursts, will the S&P 500 shrug it off or decline with giant technology firms? We believe that tech stocks are in a bubble and the mania will expand further as long as inflation remains low and monetary conditions stay accommodative, despite occasional pullbacks. Moreover, the broad market will suffer when the bubble eventually bursts. Each Decade Has Its Bubble BCA Research’s Emerging Market Strategy team recently demonstrated that each decade in the past 60 years has experienced its own financial excess (Chart I-1).1 Three forces fueled each of these manias: an extended phase of easy monetary policy; a narrative that drove funds towards fashionable assets; and an extended period of superior returns that accentuated the inevitability of participating in the bubble. Chart I-1Each Decade Has Its Bubble
August 2020
August 2020
In the 1960s, the mania surrounded the so-called “Nifty 50” stocks, as exemplified by Disney. The Nifty 50 were large-cap companies with solid franchises and a proven track record of dividend growth. Meanwhile, the period of low inflation from 1960 to 1966 allowed the US Federal Reserve to keep the unemployment rate below NAIRU, which indicated that policy was accommodative. When inflation began to rise in 1966, the Fed lifted interest rates to 7.75% in 1973, and the bubble evaporated with the recession started that year. In the 1970s, the mania involved precious metals, such as gold and silver. Precious metals benefited from the 33% fall in the dollar, the surge in inflation from 2.9% in 1970 to 14.7% in 1980, and the Fed’s incapacity to get ahead of the inflation curve through most of the decade. Then-Fed Chair Paul Volcker burst this bubble when he boosted interest rates to 19% in 1981 to kill off inflation, which also started the 93% dollar rally that culminated in 1985. Tech stocks are in a bubble and the mania will expand further as long as inflation remains low and monetary conditions stay accommodative. In the 1980s, the mania centered on Japan. The Japanese economy experienced a miraculous post-war expansion, with real GDP per capita surging by a cumulative average growth rate of 7% between 1945 and 1980. By the mid-1980s, the prevailing belief was that Japanese firms would dominate every industry. Moreover, after the Ministry of Finance allowed the yen to surge following the September 1985 Plaza Accord, the Bank of Japan (BoJ) cut interest rates by 2.5%, creating very easy domestic monetary conditions. This lax policy setting unleashed a surge in credit and asset valuations that pushed up the Nikkei-225 five times by the end of the decade and resulted in an 860% increase in the value of Japanese banks. The BoJ lifted interest rates by 3.5 percentage points between 1987 and 1990. The market peaked in December 1989 and the Nikkei collapsed by 82% during the next 19 years. In the 1990s, tech stocks and the NASDAQ captured investors’ imagination. The internet, computing power and software, all drove an increase in productivity growth to a two-decade high and investors understood that the sector’s earnings prowess was only beginning. Moreover, as inflation fell through the 1990s, then-Fed Chairman Alan Greenspan kept policy rates more or less flat for four years before cutting the fed funds rate by 75 basis points in 1998. Additionally, around the turn of the millennium, the Fed increased the size of its balance sheet by $90 billion as a precautionary measure against Y2K. Consequently, with the ensuing euphoria, investors pushed the NASDAQ’s valuation to a P/E ratio of 72, extrapolating far into the future much-too-strong earnings growth. The bubble imploded when the Fed normalized policy. We are not even thinking about thinking about raising rates. In the 2000s, the dominant story was the unstoppable upswing of the Chinese economy, the nation’s rapid urbanization and insatiable thirst for commodities. The lack of investment in commodity extraction through the 1990s exacerbated the rally in natural resources. The easy Fed policy implemented in the wake of the tech crash of 2000 to 2003, and the dollar’s 40% plunge between 2002 and 2008 added to the bullish mix in favor of resources. Commodity indices surged and iron ore, which derives a particularly large share of demand from construction in China, increased 12-fold between 2000 and 2011. The rise in the broad trade-weighted dollar that began in 2011 along with a slowdown in Chinese growth initiated in 2010 ultimately quashed commodities. Is The Tech Bubble About To End? Chart I-2The Drivers Of The Tech Bubble
The Drivers Of The Tech Bubble
The Drivers Of The Tech Bubble
Historically, bubbles often abort at the end of the decade in which they materialize. Will the ongoing mania suffer the same fate as its predecessors? For now, the pillars of the tech bubble remain intact. The strength of tech stocks reflects both their superior ability to generate cash flow growth and the structural decline in bond yields (Chart I-2). It is easy to understand why superior cash flow growth would result in strong tech performance, but the role of lower yields is not obvious. Tech stocks derive a large proportion of their intrinsic value from long-term deferred earnings and the terminal value of those cash flows. These distant profits are sensitive to fluctuations in the discount rate and, therefore, their present value soars when bond yields fall. The ability of tech to generate expanding earnings remains intact. Companies have curtailed capital expenditures due to the COVID-19 crisis, but they continue to spend on their software and hardware needs (Chart I-3). The growing prevalence of work-from-home arrangements and the proliferation of global cyberattacks (see Section II) will only feed the tech sector’s profit outperformance. Crucially, easy money and low interest rates will endure for an extended period. As Fed Chair Jerome Powell stated, “We are not even thinking about thinking about raising rates.” Our BCA Fed Monitor confirms this message (Chart I-4). Chart I-3Robust Tech Spending
Robust Tech Spending
Robust Tech Spending
Chart I-4Easy Money As Far As The Eye Can See
Easy Money As Far As The Eye Can See
Easy Money As Far As The Eye Can See
Chart I-5Inflation Is The Tech Slayer
Inflation Is The Tech Slayer
Inflation Is The Tech Slayer
Ultimately, much will depend on inflation. As BCA Research’s Equity Sector Strategy service recently demonstrated, the tech sector abhors rising inflation.2 Even during the seemingly unstoppable technology surge in the 1990s, the sector’s outperformance ended following an increase in core CPI (Chart I-5). Tech’s business model is optimized for deflationary conditions, especially when compared with other cyclical industries. Moreover, rising inflation puts upward pressure on interest rates and ultimately requires greater real interest rates to control accelerating CPI increases. Climbing real interest rates disproportionally hurt growth stocks, due to their heightened sensitivity to discount rates. Inflation will stay low as long as the labor market remains far from full employment. The slow progress in employment indicators suggests that the unemployment rate will be above NAIRU for at least two to three years (Chart I-6). Moreover, our Global CPI diffusion Index is also consistent with extended muted inflation (Chart I-7, top panels). The slowdown in money velocity and the weakness in the demand (as approximated by the smoothed growth rate of retail sales relative to average weekly earnings) will only exacerbate low inflation in the coming year or two (Chart I-7, bottom panels). Chart I-6Far From Full Employment
Far From Full Employment
Far From Full Employment
Chart I-7For Now, Disinflation Dominates
For Now, Disinflation Dominates
For Now, Disinflation Dominates
In this context, valuations have room for more expansion. The NASDAQ may be pricey, but it is far from the 1990s’ nosebleed levels when nominal 10-year yields stood at 6.8% compared with today’s 0.55%, and 10-year TIPS yielded 4.3% and not their current -0.9%. In effect, both the equity risk premium and long-term expected growth rates embedded in tech stocks are much more conservative than in the late 1990s. The equity risk premium and long-term expected growth rates embedded in tech stocks are much more conservative than in the late 1990s. Finally, investors have largely missed the rally in stocks, which implies that a large proportion of the gains in tech stocks have not accrued to many investors. Since 2010, companies have been the main buyers of stocks while households and pension plans have constantly sold the asset class (Chart I-8). Additionally, investor sentiment remains firmly bearish and cash holdings of investors and households have surged in the wake of the COVID-19 pandemic (Chart I-9). Thus, there is a lot of pent-up demand for financial assets. TINA (‘there is no alternative’) will invite investors to pour funds into equities with 10-year yields stuck near 0.6% and short rates at zero. Tech stocks will benefit from this trend. Chart I-8Households And Pension Plans Have Divested
Households And Pension Plans Have Divested
Households And Pension Plans Have Divested
Chart I-9Not A Generalized Euphoria...
Not A Generalized Euphoria...
Not A Generalized Euphoria...
Practical Considerations For Investors Bubbles are highly dangerous for investors. A lack of participation in a mania often results in disastrous underperformance for institutional investors, but staying invested in the bubbly asset too long can be even more lethal for a portfolio’s performance. This dichotomy means that as long as there is low inflation and accommodative policy, we cannot underweight or overweight tech stocks. BCA Research’s equity strategists are neutral on tech, but within the sector they overweight the more defensive software and services components relative to the high-beta hardware and equipment industry groups.3 Three potential risks that can crystalize a period of correction in tech stocks over the remainder of 2020. Another risk inherent to bubbles is that they are often volatile; the current tech exuberance will not be different. In the second half of the 1990s, the NASDAQ experienced ten 10% or more corrections and tumbled by more than 20% in 1998 before leaping to new highs. Currently, we monitor three potential risks that can crystalize a period of correction in tech stocks over the remainder of 2020. Risk 1: Tech Earnings Do Not Meet The Hype Chart I-10...But A Localized Euphoria
...But A Localized Euphoria
...But A Localized Euphoria
Today, tech stocks are vulnerable to a sharp pullback because investors are willing to bid up these shares in light of their perceived high growth rate (Chart I-10). This sector-specific euphoria increases the likelihood that if second-quarter tech earnings disappoint, then a significant correction will occur in widely held companies. The stock prices of Microsoft, Netflix and Snapchat have been punished following disappointing Q2 results. Retail investors indirectly amplify the risk created by potential earnings disappointments. Users of free trading apps (e.g.: Robinhood) are the marginal buyers, but more importantly their order flows are sold to large institutional houses who front-run these small players. Large investors with immense buying power can swing the price of the stocks popular with retail investors. Hence, when small investors unload due to bad news, a selling deluge ensues. Risk 2: A Weak Dollar Tech stocks thrive with a strong dollar because it is synonymous with low inflation and low yields. Consequently, a rising USD puts upward pressure on tech multiples. Moreover, a depreciating dollar is linked to robust global growth, which lifts the earnings prospects of other deep cyclical stocks more than tech equities, hurting the latter’s relative performance. The US election also creates a serious risk for tech stocks. The dollar is falling prey to a confluence of factors. The outlook for the US balance-of-payments is deteriorating sharply as the twin deficit explodes higher. Moreover, the national savings rate will remain in a downtrend after 2020 (Chart I-11). The US fiscal deficit will narrow from its current level of at least 18% of GDP, but it will not return for many years to the 4.6% of GDP that prevailed in 2019. The unemployment rate will stay above NAIRU for at least two to three years and the median voter increasingly favors economic populism. These two forces will generate high levels of spending. Meanwhile, a negative nominal output gap will weigh on tax revenues. Concerning private savings, the household savings rate will normalize from its April high of 33% of disposable income because consumer confidence will improve, thanks to strong consumer balance sheets and a limited decline in household net worth (Chart I-12). Chart I-11Vanishing US Savings
Vanishing US Savings
Vanishing US Savings
Chart I-12Household Balance Sheets Are Alright
Household Balance Sheets Are Alright
Household Balance Sheets Are Alright
Chart I-13Forget The Breakup Songs For Now
Forget The Breakup Songs For Now
Forget The Breakup Songs For Now
A poor balance of payments would not be a hurdle for the dollar if US real interest rates were high and foreign investors had confidence in the US economy, but neither of these conditions exists. US real interest rates have fallen relative to the rest of the world and the economic impact of the second wave of COVID-19 infections in the US partly explains the strength in the euro. Moreover, the recently agreed EUR750 billion of common bond issuance by the EU will curtail the probability of a euro breakup, which will compress European risk premia (Chart I-13). This development is highly positive for the euro, which could quickly move toward the 1.20 to 1.25 zone. The global economic recovery amplifies the negative impulse for the dollar. We have often argued that the USD is a countercyclical currency (Chart I-14).4 Hence, the recent uptick in Chinese stimulus and the positive outlook for the global industrial cycle bodes poorly for the US dollar. Moreover, a weak dollar can unleash a feedback loop that supercharges global growth. According to the Bank for International Settlements, foreign issuers have emitted $12-$14 trillion of USD-denominated liabilities. A weak dollar would diminish the cost of servicing this debt and ease global financial conditions, which would boost the world’s economic outlook. The brightening outlook would further feed the dollar’s weakness and underpin its momentum behavior (Chart I-14, bottom panel). Shifting international flows create the last major headwind for the US dollar. Fund repatriation by US economic agents has been a critical driver of the dollar since 2014. The USD rallied in tandem with a surge of repatriation in the wake of the Tax Cuts and Jobs Act of 2017, despite the lack of appetite for US assets by foreigners (Chart I-15). Now that the effect of the tax cuts has passed, repatriations are dwindling from their 2019 peak. Meanwhile, foreign investors’ appetite for dollar assets is not returning, especially as flows into US Treasurys are collapsing (Chart I-15, bottom panel). Chart I-14The Dollar Feedback Loop
The Dollar Feedback Loop
The Dollar Feedback Loop
Chart I-15Flows Are Turning Against The Greenback
Flows Are Turning Against The Greenback
Flows Are Turning Against The Greenback
The dollar’s recent rally runs the risk of a short-term pause. Our USD Capitulation Index is at a level consistent with a short-term rebound (Chart I-16). Nonetheless, the list of dollar-bearish factors noted above suggests that any rebound in the dollar would be temporary. Risk 3: The Election Run-Up The US election also creates a serious risk for tech stocks. President Trump’s approval rating remains in tatters despite the vigorous rebound in equities since March 23 (Chart I-17). His support at this stage of the presidential cycle clearly lags that of previous presidents who were re-elected (Chart I-17, bottom panel). Consequently, our Geopolitical Strategy team assigns a subjective probability of 35% that he will remain in the White House next January.5 This creates two problems for investors. When cornered, President Trump often lashes out at foreign economies, which leads to geopolitical tensions. The heated rhetoric toward China will likely worsen in the coming three months, which raises the prospect of another leg in the US-Sino trade war, with negative effects for tech firms that extract 58% of their revenues from abroad. Furthermore, if former Vice-President Joe Biden clinches the presidency, then the Senate will turn Democrat. The Democrats will likely reverse Trump’s corporate tax cuts, which would hurt all stocks and prompt some liquidation in tech holdings. Chart I-16A Temporary Dollar Bounce Is Likely
A Temporary Dollar Bounce Is Likely
A Temporary Dollar Bounce Is Likely
Chart I-17President Trump"s Disapproval Rating Is A Danger
President Trump"s Disapproval Rating Is A Danger
President Trump"s Disapproval Rating Is A Danger
The tech industry remains an attractive target for populist ire because of its wide profit margins and elevated concentration and market power. During the run-up to November 3rd, investors will be reminded that politicians on both sides of the aisle want to regulate tech. Investors will need to raise the equity risk premium for the sector as these voices get louder. Implications For The Broad Market The strength of the tech sector will be tested in the coming two quarters. Any short-term interruption to the mania prompted by the three aforementioned risks will cause a correction in the S&P 500 because the tech sector (including Google, Amazon, Facebook and Netflix) represents 40% of the index’s market capitalization (Chart I-18). As our equity strategist recently highlighted, without its five largest components (Apple, Microsoft, Amazon, Google and Facebook), the S&P 500 would have increased by only 23% in the past five years instead of its current 54% return. To add color to those numbers, these five tech titans have added $4.8 trillion to the S&P 500 market capitalization versus $3.8 trillion added by the next 495 companies.6 Any short-term interruption to the mania will cause a correction in the S&P 500. Despite this risk, we continue to anticipate that the S&P 500 will find a floor between 2800 and 2900.7 Some crucial factors underpin equities. Global monetary policy remains extraordinarily accommodative, China is stimulating aggressively, Washington will not let a large fiscal cliff destroy the recovery ahead of a presidential election, and the weaker dollar has a reflationary impact on global economic activity. Additionally, we still expect the second wave of COVID-19 to be less deadly than the first and result in much more limited lockdowns compared with March and April. BCA’s neutral stance on tech remains appropriate even after the short-term dynamics discussed above are factored in. The absence of inflationary pressures in the next two years or so and the position of global central banks that they will maintain loose monetary conditions until inflation has overshot a 2% target indicate that conditions persist for an expanding tech mania. Moreover, the dollar’s weakness is unlikely to last more than 12 to 18 months. The US still possesses a higher trend growth rate than the rest of the G-10 and sports a higher neutral rate of interest (Chart I-19). Additionally, China will ultimately rein in its ongoing credit expansion, which will hurt the global industrial cycle. Hence, the deterioration of interest rate differentials between the US and the rest of the world is temporary. Chart I-18The 1% Vs The 99%
The 1% Vs The 99%
The 1% Vs The 99%
Chart I-19The US Still Has Stronger Trend Growth
The US Still Has Stronger Trend Growth
The US Still Has Stronger Trend Growth
The Return Of The Inflation Trade Chart I-20Will Yields Move Up?
Will Yields Move Up?
Will Yields Move Up?
To navigate what will remain a trendless but volatile market until the presidential election, we still favor trades levered to the global economic recovery. Inflation breakeven rates can climb further. The inflation trade is back in fashion, with an increase in gold and commodity prices. The weakness in the dollar and the fall in real interest rates are both reflationary, and they will accelerate the uptick in inflation expectations, especially because global central banks have promised to stay behind the inflation curve as the economy recovers. Mounting inflation expectations will also create some near-term upside risks for nominal bond yields. Since the Global Financial Crisis (GFC), an average of the ISM manufacturing survey and its prices paid component have provided useful early signals for yields. This indicator has turned sharply higher (Chart I-20). Moreover, commercial banks are quickly accumulating securities on their balance sheets, which is creating a lot of liquidity. Banks have been able to increase their book value despite generous loan-loss provisions, therefore, they will be able to transform this liquidity into loans when the economic outlook clears enough to ease credit standards. Bond yields will sniff out this situation ahead of time. Central banks want to maintain loose monetary conditions, but there is a limit to how much additional easing they will tolerate as the economy recovers and fiscal support remains generous. Hence, while inflation breakeven rates can move up, the decline in real yields has reached an advanced stage. In this context, if central banks do not provide further accommodation and inflation expectations go up, then real interest rates will cease to decline and nominal rates will start to drift higher. Silver will continue to outperform gold. While we have been positive on gold and gold stocks since June 2019,8 more recently we have strongly favored silver. Industrial uses constitute a larger share of the demand for silver than that of gold. As a result, the silver-to-gold ratio is highly pro-cyclical. While gold is vulnerable to an increased improvement in economic sentiment (Chart I-21), silver will continue to shine in an environment where inflation expectations increase further and economic activity is recovering. We continue to like global deep cyclical equities relative to defensive ones. We continue to like global deep cyclical equities relative to defensive ones. The pickup in China’s economic activity, as captured by our China Economic Diffusion Index, remains consistent with upside to this trade (Chart I-22). Domestic growth will accelerate further in the second half of 2020 because China’s credit flows continue to increase as a share of GDP, especially when companies have yet to spend the funds borrowed in the second quarter. Additionally, infrastructure spending will continue to expand as local governments have only issued 50% of their annual quota of special bonds (Chart I-22, bottom panel). Chart I-21A Risk For Gold
A Risk For Gold
A Risk For Gold
Chart I-22China Is On The Go
China Is On The Go
China Is On The Go
An outperformance of deep cyclicals relative to defensive equities is also consistent with higher inflation expectations, a rising silver-to-gold ratio and a weaker US dollar (Chart I-23). The near-term outlook also supports buying industrial equities relative to tech stocks. While we have been positive on both materials and industrials, the former has lagged tech. However, our BCA Technical Indicator for US industrial stocks is massively oversold relative to the tech sector (Chart I-24). In light of a declining dollar, rising inflation breakeven rates, strengthening commodity prices and accelerating Chinese credit flows, the probability that industrials outperform tech for three to six months is rapidly escalating. Chart I-23The Inflation Trades
The Inflation Trades
The Inflation Trades
Chart I-24Long Industrials / Short Tech
Long Industrials / Short Tech
Long Industrials / Short Tech
Our relative profits indicator between the industrial and tech sectors is rebounding from depressed readings. The global economic recovery will lift industrials’ revenues more than it will help the tech sector’s income because it will allow weak industrial production levels to improve relative to stable IT spending. Moreover, the industrial wage bill is well contained compared with the tech wage bill. The probability that industrials outperform tech for three to six months is rapidly escalating. Finally, our valuation indicator also favors industrials. Relative to tech stocks, industrial equities are trading at their largest discount since the aftermath of the GFC, suggesting that there is little downside left in this price ratio, at least as long as the dollar is correcting. Mathieu Savary Vice President The Bank Credit Analyst July 30, 2020 Next Report: August 27, 2020 II. Russia And Cyber Security After COVID-19 Dear Clients, This month we offer you a Special Report on Russia and cyber security by our colleague and friend, Elmo Wright. Elmo recently retired from US Army civil service after 43 years working in intelligence, either on active duty, reserves, or as a civilian. From 2018 to 2020, he served as the senior civilian executive at the US Army National Ground Intelligence Center. He has served on five continents and provided analysis of the most pressing global trends in national security and intelligence. In this Special Report with BCA’s Geopolitical Strategy team, Elmo analyzes Russia’s cyber capabilities and argues that structural and cyclical factors, including COVID-19, will ensure the continued salience of Russian and global cyber security challenges in the coming years. His thesis reinforces our recommendation that investors buy cyber security equities. Elmo’s work for this report is in his personal capacity and does not represent any position of the US government. Only publicly available information was used as background research material for Elmo’s contribution to the report. All very best, Matt Gertken Vice President Geopolitical Strategy Mathieu Savary Vice President The Bank Credit Analyst As the US elections come closer, there will be a return to news about Russia and its potential interference via social media. Russia will continue to use cyber, both state sponsored attacks, and in coordination with criminal groups, to advance Russian national security objectives. In contrast to nuclear doctrine, there is no commonly accepted framework for cyber warfare between Russia and other nations that provides understandable signals for escalation, de-escalation, appropriate targets, or goals. US efforts to conduct military operations against Russia or China would likely be countered by Russian or Chinese cyber operations before any physical military operations could be initiated. Cyber security stocks offer a way for investors to capitalize on our long-term themes of nationalism, multipolarity, and de-globalization. The ISE Cyber Security Index offers value relative to the broad NASDAQ and S&P 500 indexes as well as the S&P tech sector. Chart II-1Russian Cyber Interference Resurfaces Around US Elections
Russian Cyber Interference Resurfaces Around US Elections
Russian Cyber Interference Resurfaces Around US Elections
As the national elections in the US come closer, there will be a return to news about Russia and its potential interference via social media. Indeed Russia is making headlines even as we go to press. This report aims to provide context for Russian cyber capabilities in general as a contributor to overall geopolitical instability (Chart II-1). We forecast Russia will continue to use cyber, both state sponsored attacks, and in coordination with criminal groups, to advance Russian national security objectives. As background, the word cyber is commonly accepted to be derived from cybernetics, a phrase attributed to Norbert Wiener, an MIT scientist. The phrase itself is related to the ancient Greek word for steering or helmsman, in other words, control. Chart II-2Russian Excellence In Math Makes It Competitive In Cybernetics
August 2020
August 2020
Russia has a long history of excellence in science, especially theoretical work in mathematics and physics (Chart II-2). Those fields can explain natural phenomena in formulas and mathematical relationships. The Soviets believed that centralized state planning that manipulated data in formulas could lead to better outcomes in all aspects of the society. Although central state economic planning did not work out for the Soviet economy, Soviet military science built on the concept of data relationships in formulas to develop its theory of troop control, a derivative of reflexive control, that is, the presenting of data to the recipient, either friendly or enemy, in order to get that recipient to act in a way favorable to Soviet military plans. One can see the Soviets embraced the idea of cybernetics as very congruent to their desire for top down control. Russia, as the core part of the Soviet Union, retained significant numbers of scientists and mathematicians who were naturally drawn to the ability of computers to take data and manipulate that data according to formulas. Other Russian scientists and mathematicians emigrated to the West where their expertise was rewarded in the rise in the use of computers to manipulate data. Over time, the term cyber has come to be associated with many aspects of computers, especially the intellectual and physical structures hidden behind the direct interface of a person with a keyboard and screen. Russian expertise in the use of computers to do cyber work was not limited to working for the State. As the Soviet Union broke apart and many people lost their jobs working for the State, there were those persons who took their talents to criminal ventures. And in the symbiotic nature of society in Russia, many of those who went into criminal ventures were former intelligence and security personnel who could maintain their connection to the official organizations that were successors to the KGB, the GRU, and others. Russia is the source of the most sophisticated cyber threats to the US. Senior Russian military officials, such as General Valery Gerasimov, Chief of the General Staff of the Russian Federation armed forces, equivalent to the US Chairman of the Joint Chiefs of Staff, have noted the growth of nonmilitary means of achieving strategic goals, and specifically in the information space. Gerasimov, in an article in 2013, has been widely quoted that all elements of national power have to be harnessed, including cyber capabilities. One Soviet and Russian military concept that relates to the information space is maskirovka, the use of camouflage, deception, and disinformation to confuse the enemy. Maskirovka is intimately connected with the Soviet/Russian concept of “active measures”. Active measures include actions taken generally by intelligence services to provide propaganda, false information, and otherwise sow discord and confusion among the enemy ranks at all levels of war as well as in the political, economic, and social spheres. In today’s time period, cyber, especially social media, offers the opportunity for the wide spread of aspects of maskirovka and active measures to all users, as well as targeted groups (Chart II-3). Reporting indicates a continued Russian emphasis on cyber as a means for active measures concealed by maskirovka. Chart II-3Social Media Offers Russia An Opportunity For The Spread Of Maskirovka
August 2020
August 2020
Wikileaks has provided a platform for the dissemination of information normally hidden from the general public. It is noteworthy how much of the information on the Wikileaks platform relates to the US and the West, and relatively little on Russia. Possible factors that explain that characteristic include the disparity in penalties for disclosing information between the US and the West versus Russia; the greater number of journalists and other persons involved in the media, both for profit and personal reasons, in the West; and the language barriers involved in understanding Russian versus English. A final possible factor in Wikileaks greater dissemination of Western information might be an aspect of active measures undertaken by Russia. There are numerous actions attributed to Russian state actors in the cyber field in the recent past (Table II-1). They include a distributed denial of service attack on Estonia (2007); hacking the Ministry of Defense in the country of Georgia during a military conflict (2008); attacks on Ukrainian energy infrastructure (2015); and the hacking of the Democratic National Committee (2016). Chancellor Angela Merkel recently publicly named and shamed Russia for a cyber-attack on Germany circa 2015 (Appendix). Table II-1Russian State Actors Responsible For Many Of This Year’s Cyber Attacks
August 2020
August 2020
Chart II-4Russian Use Of Cyber Is A Top Threat To The US
August 2020
August 2020
Senior US officials have cited Russia as the source of the most sophisticated cyber threats to the US, both for espionage and state sponsored attacks against US national security capabilities such as energy, transportation, and telecommunications infrastructure; as well as for criminal activity such as ransom ware and identity theft. Russian use of cyber, both state sponsored and sponsoring criminal actors, has been the top threat to the US in each of the US intelligence community’s annual threat assessments for 2017, 2018, and 2019 (Chart II-4). Although the 2020 annual threat assessment was not made public in Congressional testimony, there’s little reason to suspect that Russian use of cyber would not continue to be cited as the top threat. Other nation states have state sponsored cyber capabilities which are of national security concern to the US, including China, Iran, and North Korea. These nation states are called out in the US intelligence community Annual Threat Assessments. Each of these nation states has been identified as committing intelligence and economic cyber attacks against the US and other Western nations. The recent speech by the Director of the Federal Bureau of Investigation designates China as the top threat. Given the nature of the internet, the pathway of a cyber attack will likely bounce around multiple countries before reaching its intended target. As the Director notes, forensic identification of the source of a cyber attack takes time and expertise. However, there is a clear record of specifically identifying the state sponsored entity that commits attacks on US or Western government information technology and infrastructure. More likely than confusing one state sponsored cyber actor from one country to another would be the potential blending of criminal elements across national boundaries. In this case, cyber criminal elements with Russian backgrounds or connections are clearly the most capable. Cyber-crime is rising despite deterrence. The stages of cyber conflict include reconnaissance, penetration, mapping, exfiltration, and operations. The US National Security Agency has an extensive technical cyber threat framework which goes into much detail. Cyber security professionals note the ongoing actions in cyber space and the attempts by elements suspected to be linked to Russia to gain and maintain access to US networks for potential military operations, or to exfiltrate data for criminal or other purposes. Part of the frustration of cyber security experts is the lack of transparency and timely reporting of those affected by malign cyber activities. Although some cyber activities may go on for multiple months, the exfiltration of data, or the emplacement of malware may only take a few seconds. Many networks lack the ability to detect penetration and mapping. Companies with large resources devoted to cyber security may have that investment negated if they have affiliations with other companies with lax cyber security which can allow for hostile intrusions into the connected network. Chart II-5Unlike Nuclear Doctrine, Cyber Lacks A Framework To Control Escalation
August 2020
August 2020
Unfortunately, public and open attribution for cyber attacks has lagged. As an example, although the attack on the Democratic National Committee email servers was noted in 2016, it was not until 2018 that specific Russian individuals were charged with the crime. Factors that cause lags in public and open attribution include the difficulty of tracing specific computer code through cyberspace; the disjointed nature of the internet; the lack of an easy and accepted mechanism for involvement of US intelligence agencies in providing assistance to private sector parties; and the reticence of individuals and organizations negatively affected by cyber attacks to publicly disclose their injuries. Doctrine for the use of nuclear weapons developed over a period of years in the US and the West and in the Soviet bloc. The Soviets developed a coherent doctrine for the use of nuclear weapons that was understandable to the West. Arms control agreements between nuclear powers established mechanisms for controlling escalation of tensions (Chart II-5). The Soviet doctrine was adopted by the Russians after the breakup of the Soviet Union. Russia and Western nations continue to have a common understanding of the role of nuclear weapons in military affairs that allows for discussion of escalation and de-escalation. In contrast to nuclear doctrine, there is no commonly accepted framework for cyber warfare between Russia and other nations that provides understandable signals for escalation, de-escalation, appropriate targets, or goals. This is reflected in the Russian information security doctrine of 2016 which notes “The absence of international legal norms regulating inter-State relations in the information space…” The US Director of National Intelligence also noted this lack of agreement in his annual threat assessment testimony of 2017. Chart II-6Rapid Growth Of Internet Raises Vulnerability To Harmful Actions
August 2020
August 2020
The rapid growth of the internet, and reliance on it by government and private sectors reflects its founding as an open system, vulnerable to negative actors and actions (Chart II-6). The intermingling of hardware and software, the information infrastructure used both by individuals and states, by the private sector and by government, makes separating doctrine and practice for cyberwar from legitimate use very difficult. Since non-cyber military capabilities, both conventional, and nuclear, rely upon the use of commercial information technology infrastructure, the use of offensive cyber is subject to the problem of blowback. As the NotPetya incident of 2018 indicated, damage from malware installed on one computer can rapidly spread across networks, industries, and international boundaries. The code for StuxNet and the code released by the more recent hack of CIA cyber tools have been noted in other cases of cyber attacks. The view of the international cyber environment by Russia is very similar to views in the US and the West. The Russian national security doctrine of 2015 notes “... An entire spectrum of political, financial-economic, and informational instruments have been set in motion in the struggle for influence in the international arena. Increasingly active use is being made of special services' potential … The intensifying confrontation in the global information arena caused by some countries' aspiration to utilize informational and communication technologies to achieve their geopolitical objectives, including by manipulating public awareness and falsifying history, is exerting an increasing influence on the nature of the international situation.” Although much of the Russian information security doctrine of 2016 is concerned with noting threats to Russia’s information space, what might be called counterintelligence in other documents, there are key comments that note the suitability of using attacks in the information space as an effective means of projecting Russian power, such as “… improving information support activities to implement the State policy of the Russian Federation …” As per usual Soviet and Russian state doctrinal documents, the 2016 doctrine notes all the negative activity of other actors in this field. This practice is consistent with historical Soviet and Russian open press documents which ascribe to other states the activities in which Russia engages or plans to engage. Chart II-7Cyber Attacks Are On The Rise
August 2020
August 2020
Unlike other forms of national security alliances, such as for intelligence, there is little public literature on cyber alliances, especially for offensive action. For example, the US and Israel have never publicly acknowledged a government alliance to emplace the StuxNet virus into the Iranian nuclear development program. Should there be offensive cyber alliances in the West, it is likely they fall along traditional intelligence and defense lines. There is no public reporting on any sort of offensive cyber alliances that involve Russia. There are public efforts at common standards for information technology security, but these efforts are foundering on citizen and government concerns over privacy, as well as commercial proprietary advantage. It is an open question as to whether cyber alliances among friendly nations would deter would-be cyber attackers or hackers. Certainly the growth of complaints to the FBI’s Internet Crime Complaint Center would indicate that statements of deterrence and even prosecutions are failing to reduce cyber attacks (Chart II-7). Both the US national intelligence community and private sector cybersecurity companies agree Russia has a sophisticated state sponsored effort to acquire intelligence via hacking and insert favorable themes into cyberspace via the use of social media. There is also agreement that Russia state elements have a close relationship with criminal elements which can provide a plausibly deniable means of engaging in cyber warfare activities favorable to Russia, as well as engaging in activities for illegal economic advantage. For example, see this quote from the CYBEREASON Intel team: “The crossing of official state sponsored hacking with cybercriminal outfits has created a specter of Russian state hacking that is far larger than their actual program. This hybridization of tools, actors, and missions has created one of the most potent and ill-defined advanced threats that the cybersecurity community faces. It has also created the most technically advanced and bold cybercriminal community in the world. When, as a criminal, your patronage is the internal security service that is charged with tracking and arresting cybercrime, your only concern becomes staying within their defined bounds of acceptable risk and not what global norms, laws, or even domestic Russian law states.” The US Department of Justice in June 2020 noted a Russian national was sentenced to prison for malicious cyber activities. Key points of his illegal activity were the operation of websites open only to Russian speakers, and the vetting or recommendation of other criminals before allowing entry to the websites. One analysis of this situation notes the ties to Russian state security organs and personnel which likely held up the Russian national’s extradition for trial in the US. Government leaders in the US have noted the potential for major cyber attacks in the US affecting physical infrastructure and causing significant economic and social damage, including further attacks on the political election process. However, they have been reticent to state any explicit sort of retaliation. The US Cyber Command notes it is actively combatting hostile cyber actors. Therefore, the question remains open as to what level of cyber attacks would be considered serious enough to be treated as an act of war by the US. There has been public speculation of both Russian and Chinese implants of malware into the US information technology infrastructure that might be activated in the case of open hostilities. US efforts to conduct military operations against Russia or China would likely be countered by Russian or Chinese cyber operations before any physical military operations could be initiated, especially since US based forces would have to transit oceans, taking many days, when cyber operations could happen in seconds. China, Russia, and Iran will also increasingly become victims of cyber attacks. Russian “gray zone” tactics, that is, actions short of large scale conventional war, many of which involve cyber attacks, active measures, and maskirovka, are the subject of much Department of Defense planning and action. To combat such gray zone activity analysis from the RAND Corporation notes the need for a spectrum of diplomatic, informational, military, and economic actions, which would involve commercial partners and allied nations. The difficulty of coordinating such counter action is one reason the Russians continue their gray zone efforts. Russia’s unique characteristics, some of which are weaknesses compared to the US and the West, are indicative of why Russia engages in state sponsored as well as criminal cyber activities (Chart II-8). Russian scientific history, the intertwining of state and criminal elements, and continent-spanning location are factors which promote the use of cyber. Russia’s economic position vis-à-vis the US, Russia’s relative lack of military power projection capability beyond the states on its borders (the Near Abroad), except for its nuclear forces, and Russia’s declining demographic situation are negative factors which push Russia to use cyber as a cost effective means of advancing national security and economic policy (Chart II-9). Despite US and Western imposed sanctions on Russia for past misdeeds, none of the factors noted above will be changed in the near future. Therefore, those factors, and published Russian doctrine should indicate to Western governments and businesses that Russia will continue to use cyber as a means to advance Russian national security objectives, as well as a means to siphoning off wealth from the West via criminal activities. Chart II-8Russia's Relative Weakness Drives Engagement In Cyber Activities
Russia's Relative Weakness Drives Engagement In Cyber Activities
Russia's Relative Weakness Drives Engagement In Cyber Activities
Chart II-9Deteriorating Demographics Also Drive Russia’s Cyber Activities
August 2020
August 2020
US preparedness for Russian cyber activity in the upcoming months should be greater given several factors. First, there is clearly awareness of a Russian cyber threat to US interests across government and in the private sector. Second, the US has established new organizations, shifted resources of money and people, and had practice defending against cyber attacks since the 2016 US election cycle. However, the US information technology infrastructure is vast and porous, making it hard to protect against every threat. Russian cyber actors, both state sponsored and criminal, are smart and persistent. Investment Takeaways Cyber security companies offer a way for investors to capitalize on major themes arising from the COVID-19 crisis and its aftermath. These themes include not only changes in worker behavior, e-commerce, corporate culture, and network security, but also our major geopolitical themes like nationalism and the retreat from globalization. Reports as we go to press that Russian hackers have targeted vaccine developers in the US, UK, and Canada underscore the point. The trend is not limited to Russia or COVID-19 vaccines. It is all too apparent from the actions of Russia and China – as well as the increasing efforts by the US and its allies to patrol their own cyber realms, IT systems, and ideological discourse – that governments view the Internet as a frontier to be conquered and fortified rather than as a free space of human exchange in which globalization can operate unfettered (Map II-1). Map II-1Governments View The Internet As A Frontier To Be Conquered
August 2020
August 2020
Formal measures of country risk are inadequate but provide some perspective as to which countries and companies are least prepared. The International Telecommunication Union (ITU) is the United Nations body charged with monitoring information technology and communications. It ranks countries according to their commitment to cyber security and their exposure to cyber security risks (Chart II-10). Chart II-10Countries Have An Imperative To Strengthen Cyber Security
August 2020
August 2020
We take these rankings with a grain of salt knowing that advanced countries like the US and UK rank near the top of the list, and yet are the prime targets of hackers and thus face enormous cyber security risks. What is clear is that no country is safe and every country has an economic and national security imperative to strengthen its cyber security. These indexes also suggest that several European countries are less well prepared than one would think and that emerging markets are grossly underprepared. China, Russia and Iran should not be thought of only as aggressors – they will increasingly become targets as the West seeks to counteract them. As Russia expands operations it becomes a target of cyber counter-strikes as well as economic sanctions. And as China accelerates its drive to become a high tech giant, it encourages economic decoupling from the West and retaliation for its use of cyber-theft and state-based hacking. There are two main cyber security equity indexes – the NASDAQ CTA Cybersecurity Index (NQCYBR) and NASDAQ ISE Cyber Security Index (HXR). These indexes trade in line with each other and have rallied extensively since the COVID-19 crisis (Chart II-11). Investors are aware that the surge in working from home and companies conducting operations off-site, as well as geopolitical great power struggle, have created extensive new vulnerabilities and capex requirements. On April 24, we recommended that investors go long the ISE index relative to the S&P 500 information technology sector. We are also going long the ISE index relative to the NASDAQ on a strategic horizon. Tech has been the prime beneficiary of the COVID-19 crisis while the necessary corollary of the tech companies’ continued success is the need for security of their information, property, and customers (Chart II-12). We also favor the ISE index because it has a slightly heavier cyclical component due to the fact that 13% of its companies are in the industrial sector, compared to 10% for the CTA index. The industrial side should benefit more as economies reopen and recover. Chart II-11Cyber Security Stocks Have Benefited From COVID-19 ...
Cyber Security Stocks Have Benefited From COVID-19 ...
Cyber Security Stocks Have Benefited From COVID-19 ...
Chart II-12... But Not So Much Relative To Broad Tech Sector
... But Not So Much Relative To Broad Tech Sector
... But Not So Much Relative To Broad Tech Sector
These indexes are tracked by two ETFs. The First Trust NASDAQ Cybersecurity ETF (CIBR) tracks the NASDAQ CTA index with an emphasis on larger companies, while the ETFMG Prime Cyber Security ETF (HACK) tracks the ISE index, companies with market capitalization lower than $250 million, and a slightly lower exposure to the communications sector as opposed to IT and software. The HACK ETF has lagged the CIBR this year so far and offers an opportunity for investors to invest in data protection and up-and-coming firms. Over the past ten years cyber security has proven to be a volatile investment space with rapidly increasing competition for market share. But the secular tailwinds are powerful and a diversified exposure to the sector will be rewarding for investors positioning for the post-COVID-19 world. Elmo Wright Consulting Editor Matt Gertken Vice President Geopolitical Strategy mattg@bcaresearch.com Appendix Appendix Table II-1Major Cyber-Attacks Over The Past Decade
August 2020
August 2020
Works Cited Coats, Dan. “Statement For The Record Worldwide Threat Assessment Of The Us Intelligence Community,” May 23, 2017. Coats, Dan. “Statement For The Record Worldwide Threat Assessment Of The Us Intelligence Community,” March 6, 2018. Coats, Dan. “Annual Threat Assessment Opening Statement,” January 29, 2019. CyberReason Intel Team, “Russia And Nation-State Hacking Tactics: A Report From Cybereason Intelligence Group,” cybereason.com, June 5, 2017. Department of Justice, “Russian National Sentenced To Prison For Operating Websites Devoted To Fraud And Malicious Cyber Activities”, June 26, 2020. Department of Justice, “U.S. Charges Russian FSB Officers And Their Criminal Conspirators For Hacking Yahoo And Millions Of Email Accounts, Fsb Officers Protected, Directed, Facilitated And Paid Criminal Hackers”, March 15, 2017. Gerasimov, Vasily. “The Value Of Science In Prediction,” Military Industrial Courier, Feb 27, 2013. Federal Bureau of Investigation, “Internet Crime Complaint Center Marks 20 Years From Early Frauds to Sophisticated Schemes, IC3 Has Tracked the Evolution of Online Crime,” May 8, 2020. Fedorov, Yuriy Ye. “Arms Control In The Information Age” Symposium “Emerging Challenges In The Information Age,” 23 January 2002, Arlington, Virginia. Galeotti, Mark. “The ‘Gerasimov Doctrine’ And Russian Non-Linear War,” In Moscow’s Shadows, July 6, 2014. Greenberg, Andy. “The Untold Story Of Notpetya, The Most Devastating Cyberattack In History,” Wired Magazine, August 22, 2018. Krebs, Brian. “Why Were the Russians So Set Against This Hacker Being Extradited?,” Krebs on Security, Nov 18, 2019. Lusthaus, Jonathan. “Cybercrime in Southeast Asia Combating a global threat locally,” May 20, 2020. Mattis, James. Department of Defense, “Summary Of The 2018 National Defense Strategy Of The United States Of America”. Meakins, Joss. “Living in (Digital) Denial: Russia’s Approach To Cyber Deterrence,” Russia Matters, July 2018. Ministry of Foreign Affairs of the Russian Federation. “Doctrine Of Information Security Of The Russian Federation,” Dec 5, 2016. Nakasone, Paul. “Cybercom Commander Briefs Reporters At White House,” Department of Defense video briefing, Aug 2, 2018. National Security Agency, “NSA/CSS Technical Cyber Threat Framework V2”, a report from: Cybersecurity Operations The Cybersecurity Products And Sharing Division, 29 November 2018. Pettijohn and Wasser. “Competing In The Gray Zone,” RAND Corporation, 2019. Putin, Vladimir. “Strategy of National Security of the Russian Federation,” Office of the President of the Russian Federation, Dec 31, 2015. Russian National Security Strategy 31 Dec 2015, Russia Matters. Snegovaya, Maria. “Putin’s Information Warfare In Ukraine: Soviet Origins Of Russia's Hybrid Warfare,” Institute for the Study of War, Sep 22, 2015. Tsygichko, V. N. “About Categories of “Correlation Of Forces” for Potential Military Conflicts in the New Era,” Symposium “Emerging Challenges In The Information Age,” 23 January 2002, Arlington, Virginia. Wiener, Norbert, Cybernetics: Or Control and Communication in the Animal and the Machine. Cambridge, Massachusetts: MIT Press, (1948). III. Indicators And Reference Charts We continue to favor stocks at the expense of bonds, but the risk of a tech-led correction has only grown. Moreover, the number of new COVID-19 cases in the US remains elevated and similarly disturbing trends are beginning to take shape in Europe. The recovery could hit a temporary pothole. Finally, as the November election approaches, political and geopolitical risks will come back on investors’ radar screens. Nonetheless, global monetary conditions remain highly accommodative and the risk of inflation in the short-term is minimal. Also, fiscal policy is extremely loose, and despite some procrastination, Congress will pass another large package by August 10, which will protect the economy against a violent relapse. Hence, the worst outcome over the coming three to five months is for the S&P 500 to retest of the 2800-2900 zone. On a cyclical basis, the same indicators that made us willing buyers of stocks since late March remain broadly in place. Stocks are expensive, but monetary conditions are extremely accommodative. Our Speculation Indicator continues to send a benign signal, which indicates that from a cyclical perspective, the market is not especially vulnerable. Finally, our Revealed Preference Indicator continues to flash a strong buy signal. Tactical indicators suggest that equities must digest the gains made since March 23. Both our Tactical Strength Indicator and the share of NYSE stocks trading above their 10-week moving average are elevated. Additionally, positioning in the derivatives market indicates some degree of vulnerability. Nonetheless, these risks must be put into perspective. Our Composite Sentiment Indicator is not flagging a top in the market and the AAII survey shows a predominance of bears over bulls. As a result, any correction should be limited to 10%. According to our Bond Valuation Index, Treasurys remain extremely expensive. Additionally, our Composite Technical Indicator continues to lose momentum. Guided by the FOMC’s communications, the market has decided that the recovery will lift inflation but that the Fed will stand pat. Consequently, yields are not moving up, but real rates are declining as inflation expectations inch higher. This trend is likely to be at a late stage, and the passage of additional fiscal support as well as a weak dollar will put a floor under real yields. In this context, Treasury yields should begin to rise in the closing months of 2020. The dollar breakdown has now fully taken shape. The greenback is expensive and its counter-cyclicality is a major handicap during a global economic recovery. Additionally, the US twin deficits are increasingly problematic. Fiscal deficits remain exceptionally wide and the household savings rate will not remain as elevated as it is today. The current account deficit is therefore bound to widen. The continued low level of real interest rates will complicate financing this deficit and to equilibrate the funding of US liabilities, the dollar will depreciate. Technically, our Composite Technical Indicator for the dollar has also broken down, which warns that a period of cyclical weakness has begun for the greenback. Nonetheless, our Dollar Capitulation Index is now in oversold territory, and a countertrend bounce is very likely in the coming weeks. Commodities are gaining traction. The Advance / Decline line for the Continuous Commodity Index has broken out to the upside, which suggests that the CCI could punch above its pre-COVID levels by yearend. A weak dollar, low real yields and a global industrial recovery are highly positive for natural resource prices. Within that asset class, gold has made new all-time highs. Gold is especially sensitive to lower real rates and a weak dollar. Sentiment and positioning for the yellow metal are stretched. Any rebound in economic sentiment could push real rates higher, which would cause gold to correct meaningfully in the near future, even if it remains in a cyclical uptrend. A dollar rebound is another tactical risk for gold. EQUITIES: Chart III-1US Equity Indicators
US Equity Indicators
US Equity Indicators
Chart III-2Willingness To Pay For Risk
Willingness To Pay For Risk
Willingness To Pay For Risk
Chart III-3US Equity Sentiment Indicators
US Equity Sentiment Indicators
US Equity Sentiment Indicators
Chart III-4Revealed Preference Indicator
Revealed Preference Indicator
Revealed Preference Indicator
Chart III-5US Stock Market Valuation
US Stock Market Valuation
US Stock Market Valuation
Chart III-6US Earnings
US Earnings
US Earnings
Chart III-7Global Stock Market And Earnings: Relative Performance
Global Stock Market And Earnings: Relative Performance
Global Stock Market And Earnings: Relative Performance
Chart III-8Global Stock Market And Earnings: Relative Performance
Global Stock Market And Earnings: Relative Performance
Global Stock Market And Earnings: Relative Performance
FIXED INCOME: Chart III-9US Treasurys And Valuations
US Treasurys And Valuations
US Treasurys And Valuations
Chart III-10Yield Curve Slopes
Yield Curve Slopes
Yield Curve Slopes
Chart III-11Selected US Bond Yields
Selected US Bond Yields
Selected US Bond Yields
Chart III-1210-Year Treasury Yield Components
10-Year Treasury Yield Components
10-Year Treasury Yield Components
Chart III-13US Corporate Bonds And Health Monitor
US Corporate Bonds And Health Monitor
US Corporate Bonds And Health Monitor
Chart III-14Global Bonds: Developed Markets
Global Bonds: Developed Markets
Global Bonds: Developed Markets
Chart III-15Global Bonds: Emerging Markets
Global Bonds: Emerging Markets
Global Bonds: Emerging Markets
CURRENCIES: Chart III-16US Dollar And PPP
US Dollar And PPP
US Dollar And PPP
Chart III-17US Dollar And Indicator
US Dollar And Indicator
US Dollar And Indicator
Chart III-18US Dollar Fundamentals
US Dollar Fundamentals
US Dollar Fundamentals
Chart III-19Japanese Yen Technicals
Japanese Yen Technicals
Japanese Yen Technicals
Chart III-20Euro Technicals
Euro Technicals
Euro Technicals
Chart III-21Euro/Yen Technicals
Euro/Yen Technicals
Euro/Yen Technicals
Chart III-22Euro/Pound Technicals
Euro/Pound Technicals
Euro/Pound Technicals
COMMODITIES: Chart III-23Broad Commodity Indicators
Broad Commodity Indicators
Broad Commodity Indicators
Chart III-24Commodity Prices
Commodity Prices
Commodity Prices
Chart III-25Commodity Prices
Commodity Prices
Commodity Prices
Chart III-26Commodity Sentiment
Commodity Sentiment
Commodity Sentiment
Chart III-27Speculative Positioning
Speculative Positioning
Speculative Positioning
ECONOMY: Chart III-28US And Global Macro Backdrop
US And Global Macro Backdrop
US And Global Macro Backdrop
Chart III-29US Macro Snapshot
US Macro Snapshot
US Macro Snapshot
Chart III-30US Growth Outlook
US Growth Outlook
US Growth Outlook
Chart III-31US Cyclical Spending
US Cyclical Spending
US Cyclical Spending
Chart III-32US Labor Market
US Labor Market
US Labor Market
Chart III-33US Consumption
US Consumption
US Consumption
Chart III-34US Housing
US Housing
US Housing
Chart III-35US Debt And Deleveraging
US Debt And Deleveraging
US Debt And Deleveraging
Chart III-36US Financial Conditions
US Financial Conditions
US Financial Conditions
Chart III-37Global Economic Snapshot: Europe
Global Economic Snapshot: Europe
Global Economic Snapshot: Europe
Chart III-38Global Economic Snapshot: China
Global Economic Snapshot: China
Global Economic Snapshot: China
Mathieu Savary Vice President The Bank Credit Analyst Footnotes 1 Please see Emerging Markets Strategy Weekly Report "EM Equities: Concentration And Mania Risks," dated July 16, 2020, available at ems.bcaresearch.com 2 Please see US Equity Strategy Special Report "Revisiting Equity Sector Winners And Losers When Inflation Climbs," dated June 1, 2020, available at uses.bcaresearch.com 3 Please see US Equity Strategy Special Report “US Dollar Bear Market: What To Buy & What To Sell," dated June 22, 2020, available at uses.bcaresearch.com 4 Please see The Bank Credit Analyst Monthly Report “January 2020," dated December 20, 2019, available at bca.bcaresearch.com 5 Please see Geopolitical Strategy Special Report "What Is The Risk Of A Contested US Election?," dated July 27, 2020, available at gps.bcaresearch.com 6 Please see US Equity Strategy Insight Report "S&P 5 Versus S&P 495," dated July 23, 2020, available at uses.bcaresearch.com 7 Please see The Bank Credit Analyst Monthly Report "July 2020," dated June 25, 2020, available at bca.bcaresearch.com 8 Please see The Bank Credit Analyst Monthly Report "June 2019," dated May 30, 2019, available at bca.bcaresearch.com
Highlights Equities and other risk assets face near-term headwinds from the surge in Covid cases in the US Sun Belt and the looming fiscal cliff. We think these problems will be resolved, but the next few weeks could be rough sledding for markets. Government bond yields have moved sideways-to-down since late March even though inflation expectations have rebounded. The resulting decline in real yields has been an important, if rather overlooked, driver of higher equity prices. The failure of government bond yields to rise in line with higher inflation expectations can be attributed to the ongoing dovish shift in monetary policy. Nominal yields are likely to increase modestly over the next two years as growth recovers. However, inflation expectations should rise even more. Hence, real yields may fall further, justifying an overweight position in TIPS and a generally positive medium-term view on equities. As long as there is spare capacity in the economy, fiscal stimulus will not push up real yields. This is because bigger budget deficits tend to raise overall savings, thus creating the resources with which to finance the deficits. Once economies return to full employment in about three years, the fiscal free lunch will end. At that point, the combination of easy monetary and fiscal policies could cause inflation to accelerate. Central banks will welcome higher inflation initially. However, they will eventually be forced to hike rates aggressively if inflation continues to march upwards. When this happens, bond yields will rise sharply, while stocks will tumble. A Curious Divergence Government bond yields have moved sideways-to-down in most developed economies since stocks bottomed in late March (Chart 1). In contrast, inflation expectations have risen. As a result, real yields have declined. In the US, TIPS yields have fallen into negative territory across all maturities (Chart 2). Chart 1Nominal Yields Have Moved Sideways-To-Down, Inflation Expectations Have Risen, And Real Yields Have Declined
Nominal Yields Have Moved Sideways-To-Down, Inflation Expectations Have Risen, And Real Yields Have Declined
Nominal Yields Have Moved Sideways-To-Down, Inflation Expectations Have Risen, And Real Yields Have Declined
Chart 2TIPS Yields Have Fallen Into Negative Territory Across The Board
TIPS Yields Have Fallen Into Negative Territory Across The Board
TIPS Yields Have Fallen Into Negative Territory Across The Board
The decline in real yields has been one of the unsung drivers of higher equity prices this year. The forward P/E ratios of the major US indices have moved closely in line with real yields (Chart 3). Gold prices have also risen, as they are often wont to do when real yields go down (Chart 4). Chart 3Lower Real Yields Have Lifted Stock Multiple
Lower Real Yields Have Lifted Stock Multiple
Lower Real Yields Have Lifted Stock Multiple
Chart 4Gold Prices Have Risen On The Back Of Falling Real Yields
Gold Prices Have Risen On The Back Of Falling Real Yields
Gold Prices Have Risen On The Back Of Falling Real Yields
It is fairly uncommon for inflation expectations to rise without a commensurate increase in nominal bond yields (Chart 5). As a rule of thumb, when the economic data surprise to the upside, as has occurred over the past few months, bond yields go up (Chart 6). Chart 5It Is Unusual For Inflation Expectations To Rise Without A Corresponding Increase In Nominal Bond Yields
It Is Unusual For Inflation Expectations To Rise Without A Corresponding Increase In Nominal Bond Yields
It Is Unusual For Inflation Expectations To Rise Without A Corresponding Increase In Nominal Bond Yields
Chart 6Bond Yields Usually Rise When Economic Data Surprise To The Upside
Bond Yields Usually Rise When Economic Data Surprise To The Upside
Bond Yields Usually Rise When Economic Data Surprise To The Upside
An important exception to this rule occurs when monetary policy is becoming more expansionary. Bond yields tend to follow the path of expected policy rates (Chart 7). When central banks guide rate expectations lower, bond yields can fall, even as the reflationary impulse from lower yields delivers an upward kick to inflation projections. Chart 7ABond Yields Tend To Follow The Path Of Expected Policy Rates
Bond Yields Tend To Follow The Path Of Expected Policy Rates
Bond Yields Tend To Follow The Path Of Expected Policy Rates
Chart 7BBond Yields Tend To Follow The Path Of Expected Policy Rates
Bond Yields Tend To Follow The Path Of Expected Policy Rates
Bond Yields Tend To Follow The Path Of Expected Policy Rates
The last time such a divergence between yields and inflation expectations occurred was in early 2019. The stock market crash in late 2018 forced the Fed to abandon its plans to hike rates. Jay Powell’s dovish pivot occurred just three months after he said that rates were “a long way” from neutral. The Fed would go on to cut rates by 75 bps over the course of 2019. Real Yields Could Fall Further Chart 8Inflation Expectations Are Still Quite Depressed In Most Countries
Will Bond Yields Ever Go Up?
Will Bond Yields Ever Go Up?
The key question for investors is how much longer the pattern of rising inflation expectations and stable bond yields can persist. Our sense is that nominal bond yields will rise modestly over the next few years as growth recovers. However, inflation expectations are likely to rise even more, justifying an overweight position in TIPS relative to nominal bonds. Inflation expectations are still quite depressed in most countries (Chart 8). If global growth rebounds, both actual and expected inflation should edge higher. Chart 9 shows that the US ISM manufacturing index leads core inflation by about 12-to-18 months. Higher oil prices should also lift inflation expectations (Chart 10). Will global growth recover? The answer is “yes” if we are talking about a horizon of 12 months or so. That said, as we discuss below, there are some near-term risks to growth. This implies that equities and other risk assets could trade nervously over the next few weeks. Chart 9Global Growth Recovery Will Lead To Higher Inflation Down The Line
Global Growth Recovery Will Lead To Higher Inflation Down The Line
Global Growth Recovery Will Lead To Higher Inflation Down The Line
Chart 10Inflation Expectations And Oil Prices Move In Lockstep
Inflation Expectations And Oil Prices Move In Lockstep
Inflation Expectations And Oil Prices Move In Lockstep
Near-Term Risks To Global Growth The two biggest threats to global growth over the coming months are the Covid outbreaks in a number of countries and the possibility that fiscal stimulus will be rolled back, especially in the US, where a “fiscal cliff” is looming. Despite progress in suppressing the virus in Europe, Japan, and most of East Asia, the number of reported daily infections continues to rise globally (Chart 11). In the developed world, the US remains a major hotspot. Although the number of cases appears to have peaked in Arizona, it is still rising in the other Sun Belt states (Chart 12). Among emerging markets, the epicenter has moved from Brazil and Russia to India (Chart 13). Chart 11Despite Progress In Europe, Japan, And Most Of East Asia, The Number Of Covid Infections Continues To Rise Globally
Will Bond Yields Ever Go Up?
Will Bond Yields Ever Go Up?
Chart 12A Second Wave Is A Key Macro Risk
Will Bond Yields Ever Go Up?
Will Bond Yields Ever Go Up?
Chart 13BRICs: Covid Leaving No Stone Unturned
Will Bond Yields Ever Go Up?
Will Bond Yields Ever Go Up?
While efforts to contain the virus will boost growth in the long run, they will weigh on economic activity in the near term. Over half of the US population lives in states that have either reversed or suspended reopening plans (Chart 14). Chart 14Not So Fast
Will Bond Yields Ever Go Up?
Will Bond Yields Ever Go Up?
Google data on visits to shopping malls, recreation centers, public transport facilities, and office destinations have dipped in recent weeks. The decline in visits has occurred alongside a decrease in the New York Fed’s high-frequency economic activity indicator (Chart 15). Initial unemployment claims also rose this week. At this point, it looks likely that the recovery in US consumer spending will stall in July and August. Chart 15Covid Outbreak Is Weighing On Spending
Will Bond Yields Ever Go Up?
Will Bond Yields Ever Go Up?
While it is difficult to know what will happen starting in September, our guess is that the pandemic will ebb in the southern states, just like it did in the northeast. This is partly because mask-wearing is becoming more widespread. Back in early March, when most mainstream news sources were tweeting out misinformation such as “Oh, and face masks? You can pass on them,” we noted that both logic and evidence suggest that masks are an effective tool against the virus. Increased testing should also help identify asymptomatic people before they have had the chance to spread the virus to many others. Meanwhile, improved medical care should also help reduce the mortality and morbidity rates from the disease. Just this week, scientists presented the results of a double-blind clinical trial showing that the inhalation of interferon beta, a cytokine used to treat multiple sclerosis, reduced the risk of developing severe Covid symptoms by nearly 80%. Fiscal Cliff Ahead? In addition to the pandemic, investors have to grapple with uncertainty over whether fiscal policy will remain sufficiently accommodative to reflate the economy. Unlike the EU, which managed to cobble together a framework for creating a 750 billion euro pandemic relief fund earlier this week, the US Congress remains deadlocked on the size and complexion of a new stimulus bill. Under current law, US households will stop receiving expanded unemployment benefits at the end of July. These benefits were legislated as part of the original CARES Act and currently total over 4% of GDP. The Paycheck Protection Program for small businesses is also nearly drained, while state and local governments are facing a major cash crunch due to evaporating tax revenues and higher pandemic-related spending needs. We estimate that about $2-to-$2.5 trillion in new stimulus will be necessary to keep fiscal policy from turning unduly restrictive. Senate Majority Leader Mitch McConnell has been floating a number of $1.3 trillion. If McConnell gets his way, risk assets will likely sell off. Our guess is that he will not prevail, however. President Trump favors a larger stimulus bill, as do the Democrats. Critically, more than four out of five voters, both nationwide and in swing states, support extending benefits (Table 1). Thus, there is a high probability that Senate Republicans will agree on a much larger package than what they are currently proposing. Table 1There Is Much Public Support For Fiscal Stimulus
Will Bond Yields Ever Go Up?
Will Bond Yields Ever Go Up?
Fiscal Stimulus And Bond Yields Could continued fiscal stimulus deplete national savings, leading to significantly higher real yields? For the next few years, the answer is no. National savings depend not just on how much people spend, but on how much they earn. To the extent that fiscal stimulus raises GDP, it also raises national income. For the global economy as a whole, savings must equal investment. If fiscal stimulus in the major economies prompts firms to undertake more investment spending than they would have otherwise, overall savings will rise. How can that be? The answer is that fiscal stimulus raises private savings by more than it reduces government savings when an economy is operating below its full capacity. From the perspective of the bond market, this means that currently, large budget deficits are self-financing. Bigger budget deficits will produce an even bigger pool of private income, allowing the private sector to buy more government bonds. Indeed, a premature pullback in fiscal support would almost certainly raise real rates by depressing inflation expectations. If that sounds far-fetched, recall that this is precisely what happened in March. Full Employment And Beyond Chart 16Government Debt Levels Have Surged In The Wake Of The Pandemic
Government Debt Levels Have Surged In The Wake Of The Pandemic
Government Debt Levels Have Surged In The Wake Of The Pandemic
The fiscal free lunch will end only when economies return to full employment. At that point, bigger budget deficits will no longer be able to raise output since everyone who wants to work will already have found a job. Rather, increased government borrowing will crowd out private-sector investment. National savings will decline. If monetary and fiscal policy stay accommodative, inflation could accelerate. Central banks will probably welcome the initial burst of inflation, since they have been lamenting below-target inflation for many years now. However, if inflation continues to march higher, central banks may get spooked and start talking up the prospect of rate hikes. Higher rates would create a lot of problems for debt-saddled governments (Chart 16). It would not be at all surprising if politicians leaned on central banks to keep rates low. Governments could also end up forcing central banks to buy more debt in order to keep long-term yields from rising. In the extreme case, governments could even force central banks to cap yields. While such measures would prevent bond prices from tumbling, this would be cold comfort for bondholders. If central banks were to keep bond yields below their equilibrium level, inflation would rise even further, thus eroding the purchasing power of the bonds. In the end, central banks would still have to raise rates, probably more than they would have had they acted more swiftly to quell inflation. Investment Conclusions To answer the question posed in the title of this report, yes, bond yields will eventually go up. However, they are not likely to rise very much until inflation reaches intolerably high levels. That point is at least three years away. Despite the near-term risks posed by the pandemic and the looming fiscal cliff, investors should remain overweight equities over a 12-month horizon. Given the run-up in some of the large cap US tech names, we suggest shifting equity exposure to other parts of the stock market. The cyclically-adjusted price-earnings ratio is significantly lower outside the US, implying that international stocks are well placed to outperform their US peers over the coming decade (Chart 17). A weaker dollar should also help non-US stocks as well as the more cyclical equity sectors (Chart 18). Chart 17Non-US Stocks: The Place To Be Over The Coming Decade
Non-US Stocks: The Place To Be Over The Coming Decade
Non-US Stocks: The Place To Be Over The Coming Decade
Chart 18A Weaker Dollar Should Boost Non-US Stocks Along With The More Cyclical Equity Sectors
A Weaker Dollar Should Boost Non-US Stocks Along With The More Cyclical Equity Sectors
A Weaker Dollar Should Boost Non-US Stocks Along With The More Cyclical Equity Sectors
Peter Berezin Chief Global Strategist peterb@bcaresearch.com Global Investment Strategy View Matrix
Will Bond Yields Ever Go Up?
Will Bond Yields Ever Go Up?
Current MacroQuant Model Scores
Will Bond Yields Ever Go Up?
Will Bond Yields Ever Go Up?
Highlights We reiterate our longstanding overweight on healthcare equities for the next 12 months and possibly beyond. The macro environment, as well as underlying demand factors, will continue to drive the sector’s outperformance. Within healthcare equities, we favor biotechnology and healthcare technology over pharmaceuticals. Healthcare corporate bonds, however, are not especially attractive, and therefore warrant no more than a neutral position. Feature Chart 1Healthcare Has Outperformed Over The Past Decade...
Healthcare Has Outperformed Over The Past Decade...
Healthcare Has Outperformed Over The Past Decade...
Over the past decade, global health care stocks have been clear outperformers, alongside information technology and consumer discretionary stocks, rising by almost 50% relative to the broad market (Chart 1). Not only have they benefited from increased demand from an aging population in developed economies and a growing middle class in emerging markets, they have also provided a downside cushion during recessions and bear markets, given their defensive, non- cyclical nature. The COVID-19 pandemic leads us to reiterate our longstanding overweight position on global healthcare equities over the next 12 months and possibly beyond. Favorable tailwinds will continue to drive healthcare outperformance. It is likely that government spending on healthcare will increase over the coming years. Innovative solutions in healthcare technology (healthtech), as well as increased overall research and development (R&D), the shift to value-based healthcare delivery, the focus on preventive medicine, and a low risk of substantial regulatory change and reform (at least in the US, assuming former Vice President Biden is elected president this November) should continue to support the sector’s outperformance. In this Special Report, we analyze whether our long-term overweight position on healthcare equities remains valid. In a later section, we also review healthcare-related investments in bonds and private equity. Why We Like Healthcare BCA Research’s Global Asset Allocation (GAA) service has been positive on global healthcare stocks for over five years. The main reason is that we see demand for healthcare services continuing to rise, as life expectancy increases, populations age – people over 65 will comprise 25% of the developed world’s population by 2040, up from 15% in 2020 – and the middle class in emerging economies becomes richer (Charts 2&3). As people live longer, healthcare spending should rise since, after the age of 65 (retirement), it tends to squeeze out discretionary spending (Chart 4). Chart 2...As The Global Population Grew Older...
...As The Global Population Grew Older...
...As The Global Population Grew Older...
Chart 3...And Richer
...And Richer
...And Richer
Healthcare spending everywhere represents a large proportion of GDP, but the percentage varies considerably between countries. In the US for example, healthcare spending comprises 16.9% of GDP, higher than in other advanced economies, where it averages 9.9%, and substantially higher than in emerging economies (average 6.5% of GDP) (Chart 5). It is likely that these figures will increase over the next few years. Chart 4Healthcare Expenditure Dominates Late-Life Spending
Healthcare Expenditure Dominates Late-Life Spending
Healthcare Expenditure Dominates Late-Life Spending
Chart 5Spending On Healthcare Will Rise
Spending On Healthcare Will Rise
Spending On Healthcare Will Rise
A strong case can be made for serious outbreaks of infectious diseases becoming more common, and therefore governments will have to increase their readiness. The number of countries experiencing a significant outbreak has almost doubled over the past decade, after being on a declining trend during the prior 15 years (Chart 6). The World Health Organization (WHO) warns that, while pandemics are rare, highly disruptive regional and local outbreaks are becoming more frequent and causing more economic damage.1 The non-cyclical nature of healthcare demand makes the industry less vulnerable to economic downturns. In times of below-trend growth, investors rush into defensive-growth stocks. Over the past two recessions, the drawdown of healthcare equities was, respectively, 20% and 27% less than the broad market. Chart 6Number Of Countries Experiencing Serious Outbreak Of Infectious Disease
The Healthcare Revolution: The Case For Staying Overweight
The Healthcare Revolution: The Case For Staying Overweight
Chart 7The Defensive Side Of Healthcare
The Defensive Side Of Healthcare
The Defensive Side Of Healthcare
However, the sector is not totally cyclically insensitive, given its capital intensity and reliance on debt. In the US, healthcare sector debt amounts to almost $500 billion (Chart 7). This also leaves it vulnerable to rising interest rates. Nevertheless, the current macro outlook should keep a lid on interest rates for some time. The healthcare industry has lagged in digitalization (Chart 8). This offers wide-ranging opportunities for the sector, particularly in healthtech, biotechnology, and pharmaceuticals. Innovative solutions in robotics, artificial intelligence (AI), and genomics will drive the industry in the years to come. Digitalization will accelerate productivity and improve profitability. Chart 8The Healthcare Sector Is Way Behind In Digitalization
The Healthcare Revolution: The Case For Staying Overweight
The Healthcare Revolution: The Case For Staying Overweight
Lastly, valuations for healthcare equities in most countries remain attractive, close to their long-run averages. The only exceptions are the UK and Japan, which are two standard deviations above the historical mean relative to their respective markets (Chart 9). The Future Of Healthcare Every crisis provides insights into what went wrong, what needs to be changed, and what areas should be explored. The COVID-19 pandemic is no exception. The pandemic has highlighted supply-chain fragilities, particularly a shortage of some healthcare equipment and drugs, the production of which is outsourced. In the US, for example, according to the Food and Drug Administration (FDA), over 70% of facilities producing essential medicines for the US are located abroad (Chart 10). Chart 9Valuations Remain Reasonable
Valuations Remain Reasonable
Valuations Remain Reasonable
Chart 10Supply Chain Fragilities
The Healthcare Revolution: The Case For Staying Overweight
The Healthcare Revolution: The Case For Staying Overweight
Some argue that reshoring healthcare production is essential. Joe Biden, favored to be the next US president, has highlighted this in his plan to rebuild US supply chains.2 This could, however, lead to higher healthcare costs. This would either require increased government spending to subsidize medical expenses, or lead to fewer people being able to afford adequate healthcare. This effect would be pronounced in economies where a large percentage of the population is uninsured, around 10% in the US, and much more so in some emerging economies where healthcare quality is poor. This might be less of a risk for pharmaceutical and biotechnology companies, where the largest cost of bringing a new drug to market is R&D and marketing, rather than manufacturing. In the first months of the outbreak, resources such as ventilators, hospital and ICU beds, and basic personal protective equipment (PPE) quickly became scarce. Inventories of such items and overall hospital capacity will need to increase. This will entail massive investments to boost the public healthcare infrastructure and increase the number of healthcare workers. Chart 11COVID-19 Unveiled Poor Health Standards...
The Healthcare Revolution: The Case For Staying Overweight
The Healthcare Revolution: The Case For Staying Overweight
The pandemic also underlined weaknesses in social and health standards. The excessive number of deaths from COVID-19 in nursing homes in some developed economies emphasizes the need for investment in this area. For example in Quebec, Canada, a staggering 80% of the province’s deaths occurred in nursing homes and senior residences (both public and private), illustrating the mismanagement and lack of funding (Chart 11). Most notably, care homes run for profit (approximately 70% of the total in the US) have seen almost four times as many COVID-19 infections as those not. The quality ratings of for-profit nursing homes, as measured by the Centers for Medicare and Medicaid Services (CMS), are much lower on average than those of non-profit or government-run facilities (Chart 12). This could imply the mass nationalization of nursing homes. However, this is unlikely. A better option would be to impose higher standards on privately run homes, reducing the sector to a smaller number of high-quality providers. Chart 12...In Most For-Profit Nursing Homes
The Healthcare Revolution: The Case For Staying Overweight
The Healthcare Revolution: The Case For Staying Overweight
Chart 13The Evolution Of Genome Sequencing Is Illustrated In The Price
The Healthcare Revolution: The Case For Staying Overweight
The Healthcare Revolution: The Case For Staying Overweight
More positively, there remains a large gap to be filled by a new era of technology-driven, integrated, and online healthcare. Investments in biotechnology – particularly related to genetic information – are also likely to increase, as DNA sequencing becomes cheaper (Chart 13). The way patients interact with physicians will also change. The American Medical Association (AMA) surveyed more than 1000 physicians on the use of digital tools in their practices. Reliance on digital tools for monitoring and clinical support has increased significantly over the past three years. The largest jump however was in the number of practices using telemedicine and virtual visits (Chart 14). Chart 14The Transition To A Digital-Driven Healthcare Model
The Healthcare Revolution: The Case For Staying Overweight
The Healthcare Revolution: The Case For Staying Overweight
“Contact tracing” is a term that has been widely used during the coronavirus outbreak. The ability to track those infected and monitor their interactions to limit the spread of the virus is seen as a crucial step to mitigate further contagion. This would help not only to eradicate the virus, but might be developed into a long-lasting technology. Similar to how security screening equipment was developed after 9/11, there should be investment opportunities in the medical-screening segment. Breaking Down Healthcare Equities It is important to note that not all healthcare equities are equal: Different regions and industries have performed differently. In this report, we distinguish between the industry groups and subgroups, based on the GICS Level 2 and Level 3 classifications. We also look at the nine largest regions in the MSCI indexes to see if certain regions provide more favorable opportunities. Healthcare equities are broken down into two industry groups, which in turn break down into six industries: Healthcare equipment & services Healthcare equipment & supplies Healthcare providers & services Healthcare technology Pharmaceuticals, biotechnology & life sciences Pharmaceuticals Biotechnology Life sciences tools & services In Table 1, we drill down the constituent weights of the MSCI healthcare indexes. This allows us not only to analyze the size of the sector and its parts, but also to gain multiple insights. For example, a bet on Swiss healthcare stocks is essentially a bet on pharmaceuticals, given the greater-than-80% weighting of that industry. Exposure to the overall Danish equity index is by default a play on healthcare stocks, since they comprise almost 60% of the index. Table 1Global Healthcare Weights
The Healthcare Revolution: The Case For Staying Overweight
The Healthcare Revolution: The Case For Staying Overweight
Chart 15Healthcare Has Outperformed Broad Indices Globally...
Healthcare Has Outperformed Broad Indices Globally...
Healthcare Has Outperformed Broad Indices Globally...
As noted earlier, global healthcare stocks have outperformed the broad index by almost 50% over the past decade. This is true across all regions. However, several distinctions can be made. US, Swiss, and Danish healthcare equities have outperformed the global healthcare benchmark over the past decade, but their counterparts in the euro area, UK, and Japan have lagged (Chart 15). On a risk-adjusted basis, Danish healthcare equities have been the best performer with a Sharpe-ratio of 0.84 and an annualized return of 18% since 2000 (Table 2). Table 2...However Not All Healthcare Stocks Are Alike
The Healthcare Revolution: The Case For Staying Overweight
The Healthcare Revolution: The Case For Staying Overweight
Investment Opportunities Chart 16Within Healthcare Equities, Favor Biotechnology and Healthcare Technology...
Within Healthcare Equities, Favor Biotechnology and Healthcare Technology...
Within Healthcare Equities, Favor Biotechnology and Healthcare Technology...
Viewing healthcare as a set of separate segments, rather than as a single industry, highlights pockets of opportunity. A selective approach might be preferable for asset allocators in the coming years. As discussed in The Future Of Healthcare section, the sector is likely to shift to a model that relies more on technology, is data-driven, and harnesses the power of digitization, robotics, and AI. The patient will be at the center of the new healthcare model. We divide our overview of investment opportunities into three categories: equities, corporate bonds, and private investments. Equities: Based on our view of the future of healthcare and the structure of the GICS equity classifications, we favor biotechnology and healthcare technology, and would have only a benchmark allocation to pharmaceuticals. There are insights to be drawn from the fundamentals, historical performance, and valuation metrics. Historically, pharmaceutical equities stand out as the worst performers within the sector. Over the past decade, they have underperformed the global healthcare benchmark by 20%, whereas biotechnology and healthcare technology stocks have outperformed by 59% and 127%, respectively (Chart 16). The outperformance of biotechnology has predominantly been earnings-driven, whereas pharmaceuticals’ and healthcare technology stock prices appear to be detached from earnings (Chart 17). It is worth nothing that despite the fact that valuations for those industries appear expensive relative to the broad market, we remain positive on their outlook. As we drill deeper into Level 3 industries, the small number of constituents within the index makes relying on valuations challenging (Chart 18). Chart 17..Despite A Detachment From Earnings...
..Despite A Detachment From Earnings...
..Despite A Detachment From Earnings...
Chart 18...And Elevated Valuations
...And Elevated Valuations
...And Elevated Valuations
Chart 19No Attractive Opportunities Within Healthcare Corporate Bonds
No Attractive Opportunities Within Healthcare Corporate Bonds
No Attractive Opportunities Within Healthcare Corporate Bonds
Corporate Bonds: Within the corporate bond universe, we favor those that qualify for central banks’ purchase programs: Investment-grade bonds and the highest tranche of high-yield. BCA Research’s US fixed-income strategists have an overweight recommendation on US healthcare corporate bonds, though their recommendations are based on a six-to-12 month investment horizon rather than the longer perspective that we are taking in this report.3 Both healthcare and pharmaceuticals bonds, similar to their equity counterparts, trade defensively, outperforming the broad corporate index when spreads widen and underperforming as they tighten (Chart 19). This applies to both investment-grade and high-yield bonds. The credit risk measure favored by our US bond strategists is the duration-times-spread (DTS) ratio. This measure confirms the sector’s defensive nature: A value below 1 implies credit risk lower than the market. However, the recent uptick in the DTS ratio of healthcare investment-grade bonds shows the sector has become riskier and as such may trade more cyclically in the short term. Nevertheless, the macro environment should remain favorable. Pricing power is still strong, with medical care services rising by almost 6.0%, and drug prices rising by 1.4% on a year-over-year basis, outpacing overall consumer prices (Chart 20). Neither segment within the investment-grade space offers an attractive spread advantage over the broad index. However, the risk outlook for healthcare remains better than that for pharmaceuticals, particularly related to political risk (as discussed later in the Risks section). Private Investments: Venture-capital investments in healthtech reached a quarterly record high of $8.2 billion in Q1 2020. The recent pandemic is likely only to push this trend higher. Moreover, large private-equity investments in recent years have been targeted at biopharma.4 According to Bain & Company, global biopharma private-equity deals where value was disclosed, reached $40.7 billion in 2019, up from $16.5 billion the prior year.5 The number of biotech firms going public is also trending up, despite slipping to 48 in 2019 from 58 in 2018 (Chart 21). To date (as of early June), 21 out of 43 US IPOs this year are healthcare-related. Chart 20Pricing Power Remains Favorable
Pricing Power Remains Favorable
Pricing Power Remains Favorable
Chart 21More Biotech IPOs Are Coming To Market
The Healthcare Revolution: The Case For Staying Overweight
The Healthcare Revolution: The Case For Staying Overweight
Additionally, M&A activity has been increasing, particularly within the biotechnology segment, although the economic shutdown has slowed the deal flow recently. The number of M&A deals peaked in March 2020, when the average premium is 45% (Chart 22). The long-term rising trend is likely to persist. Over the next year, firms with drugs or vaccines related to COVID-19 would be clear targets for acquisitions and should outperform. Over the long term, we also expect to see some industry consolidation. Risks We see the following as the biggest risks to our overall positive outlook for healthcare investments: Quicker-Than-Expected Economic Growth Rebound: As we highlighted, the healthcare sector is defensive – outperforming the broad market during recessions and economic slowdowns. However, if growth rebounds more quickly, driven by further fiscal and monetary stimulus, the upside for healthcare performance could be challenged. Political Risk: Joe Biden might swing to the left in the run-up to the US presidential election to bring on board supporters of Elizabeth Warren and Bernie Sanders. Nevertheless, we see that particular risk for healthcare as relatively small (Chart 23). Biden’s approach is to restore and expand Obamacare (the Affordable Care Act, or ACA), shifting some of the burden of healthcare spending from individuals to the government. Overall, this should be positive for healthcare spending, particularly for insurers and healthcare providers. However, pharmaceutical companies may face headwinds if the administration imposes price caps on drug prices. Chart 22Secondary Market Activity Is Also Strong
Secondary Market Activity Is Also Strong
Secondary Market Activity Is Also Strong
Chart 23Political Risk Has Waned As Biden's Chances Of Election Have Increased
Political Risk Has Waned As Biden's Chances Of Election Have Increased
Political Risk Has Waned As Biden's Chances Of Election Have Increased
Chart 24Reliance On Inorganic Growth Might Prove Unsustainable
Reliance On Inorganic Growth Might Prove Unsustainable
Reliance On Inorganic Growth Might Prove Unsustainable
Lack Of Innovation: Over the past two decades, the healthcare sector has shifted to relying on inorganic growth, driven by takeovers, rather than on research and development. Capital expenditure as a percentage of sales by both pharmaceutical and biotechnology firms fell sharply in the 2000s and has stagnated around 2% and 4%, respectively since (Chart 24). Only A Few Make It: While more IPOs in the healthcare sector is a sign of improving innovation, it is worth noting that only a few newly listed companies are successful. Over the past decade, only 3% of the 349 biotech IPOs had positive earnings at the time of their IPO. This nevertheless is a consequence of the nature of the industry: Companies tend to list while they await a big breakthrough in product development or regulatory approval. Conclusion We continue to recommend investors hold an above-benchmark allocation to healthcare-related investments on a long-term basis. Aging populations, the need to improve the quality of global healthcare, a likely increase in government spending, the shift to digitalized healthcare, and demand which is non-cyclical all support this stance. Healthcare equities in general, and particularly biotechnology and healthcare technology, should perform well over the coming years. For investors with global mandates, allocations to US, Swiss, and Danish healthcare equities should outperform those in the euro area, Japan, and the UK. Corporate bonds do not offer any advantage over the broad corporate US bond index. Political risks for the US healthcare sector should be limited even if the Democrats win the White House. However, the risk is highest for pharmaceuticals, in the event where the government imposes price caps. Amr Hanafy Senior Analyst amrh@bcaresearch.com Footnotes 1 "World Economic Forum, Outbreak Readiness and Business Impact, Protecting Lives and Livelihoods across the Global Economy," January 2019. 2 For more info please see Joe Biden https://joebiden.com/supplychains/ 3 Please see US Bond Strategy, "Assessing Healthcare & Pharma Bonds In A Pandemic," dated June 9, 2020.available at usbs.bcaresarch.com. 4 Biotech refers to manufactured products that rely on using living systems and organisms. The biopharma industry is backed by biotechnology, the science, which allows products to be manufactured biologically. 5 Bain & Company, Global Healthcare Private Equity and Corporate M&A Report 2020.
Highlights Monetary Policy: Central bankers worldwide are promising to keeping policy rates near 0% for at least the next two years, even if inflation begins to rise again. This is an obvious form of forward guidance designed to keep borrowing costs as low as possible until the COVID-19 pandemic ends. It may also be the start of a true shift in policymaker strategy, tolerating a rise in inflation just as many of the secular forces that have dampened global inflation are fading. Bond Strategy: The recent divergence of inflation expectations and real bond yields can persist if central banks commit to their dovish forward guidance. Stay overweight inflation-linked bonds versus nominal government debt, particularly in the US, Canada and Italy. Feature “We’re not thinking about raising rates. We’re not even thinking about thinking about raising rates.” – Fed Chairman Jerome Powell Central bankers have emptied their bags of tricks in recent months, providing extreme monetary policy accommodation to fight the deflationary impacts of the COVID-19 recession. 0% policy interest rates, large-scale asset purchases and liquidity support programs have all been implemented in some form by the major developed market central banks. Even more extreme options like yield curve control have been contemplated in the US and implemented in Australia. Perhaps the most important tool used by policymakers, however, is the most simple of all – dovish forward guidance on future interest rate moves. The Fed, European Central Bank (ECB), Bank of Japan (BoJ) and others are now committing to keep rates at current levels for at least the next two years. Additional “state-based” guidance, tying future rate hikes only to a sustainable return of inflation back to policymaker targets, is the likely next step, with the Bank of Canada already making that connection at last week’s policy meeting. Given how difficult it has been for central banks to reach those targets, policy rates can now potentially stay lower for much longer. Interest rate markets have already discounted such an outcome, with overnight index swap (OIS) curves pricing in no change in policy rates in the US, Europe, UK, Japan, Canada or Australia until at least mid-2022 and only very mild increases afterward (Chart of the Week). It remains to be seen if policymakers will actually follow through on their promises to sit on their hands and do nothing for that long, even as global growth and inflation continue what will likely be an extended and choppy recovery from the deep COVID-19 recession. Chart of the WeekAggressive Forward Guidance Is Working
Can Central Bankers Credibly Be Not Credible?
Can Central Bankers Credibly Be Not Credible?
However, if central bankers are truly serious about keeping interest rates low even if inflation picks up, in an attempt to “catch up” from previous undershoots of inflation targets, that has major implications for global bond investors – in particular, raising the value of maintaining core holdings of inflation-linked bonds in fixed-income portfolios. The First Step To Higher Inflation: Stop Talking About Rate Hikes Central bankers are increasingly using the same arguments, and even the same language, to justify their current hyper-accommodative policy stance. Here are some examples, taken from speeches and policy meetings that took place last week: ECB President Christine Lagarde: “We expect interest rates to remain at their present or lower levels until we have seen the inflation outlook robustly converge to a level sufficiently close to, but below, 2% within our projection horizon and such convergence has been consistently reflected in underlying inflation dynamics.” Federal Reserve Governor Lael Brainard: “Looking ahead, it likely will be appropriate to shift the focus of monetary policy from stabilization to accommodation by supporting a full recovery in employment and a sustained return of inflation to its 2 percent objective […] policy should not preemptively withdraw support based on a historically steeper Phillips curve that is not currently in evidence.” Bank of Canada Governor Tiff Macklem: "As the economy moves from reopening to recuperation, it will continue to require extraordinary monetary policy support. The Governing Council will hold the policy interest rate at the effective lower bound until economic slack is absorbed so that the 2 percent inflation target is sustainably achieved.” Chart 2Global Growth Expectations Have Rebounded
Global Growth Expectations Have Rebounded
Global Growth Expectations Have Rebounded
We could have switched the names on those three quotes and the message would be the same. Policy rates will stay at current levels until inflation has sustainably returned to the 2% target. Raising rates on the back of a forecast of higher inflation, driven by an expectation of lower unemployment, will not be enough this time for policymakers that have been repeatedly burned by their belief in the Phillips Curve. Bond investors have taken note of the central bankers’ message and now expect both stable policy rates and higher inflation expectations. The latest data from the ZEW survey of economic and financial market sentiment, that was published last week and covers the period to mid-July, shows this shift in expectations. On the economy, the current conditions indices for the euro area, US, UK and Japan have stopped falling, while the expectations data have all soared to the highest levels seen since 2015 (Chart 2). The ZEW also poses questions on expectations for interest rates and inflation, and there the answers are more interesting for bond investors. The net balances on expectations for long-term interest rates have bottomed out for the US, euro area and UK, as have expectations for inflation over the next twelve months (Chart 3). At the same time, expectations for short-term interest rates have lagged the moves seen in the other two series, with the net balances hovering around zero for all four countries. One possible interpretation of this data is that a greater number of the financial professionals who take part in the ZEW survey are starting to “get the hint” about central bankers’ dovish messages, expecting higher inflation and bond yields but with no change in short-term policy rates. Bond investors have taken note of the central bankers’ message and now expect both stable policy rates and higher inflation expectations. We see similar pricing in inflation-linked bond markets. While nominal bond yields have stayed stable, the mix between inflation expectations and real bond yields has shifted. Breakevens on 10-year bonds have been slowly climbing across the major developed markets since the end of March, while real yields have fallen roughly the same amount as breakevens have widened (Chart 4). Chart 3Global Inflation Expectations Are Drifting Higher
Global Inflation Expectations Are Drifting Higher
Global Inflation Expectations Are Drifting Higher
Chart 4Inflation Breakevens & Real Yields: Mirror Images
Inflation Breakevens & Real Yields: Mirror Images
Inflation Breakevens & Real Yields: Mirror Images
This is a relatively unusual development in the global inflation-linked bond universe. More often, breakevens and real yields move in the same direction. Inflation expectations tend to rise when economic growth is improving, which also puts upward pressure on real bond yields – often in tandem with markets pricing in higher policy rates at the short end of yield curves. That is not the case today. The latest fall in real bond yields may simply be markets pricing in slower potential economic growth, and lower equilibrium real interest rates, in a world where the COVID-19 pandemic is likely to leave lasting scars. That would be consistent with Bloomberg growth and inflation forecasts for the major developed economies, which expect unemployment rates to remain above pre-COVID levels in 2022, with inflation rates struggling to reach 2% (Chart 5). Chart 5The Consensus Expects A Slow Global Recovery
Can Central Bankers Credibly Be Not Credible?
Can Central Bankers Credibly Be Not Credible?
In a recent report, we presented some basic Taylor Rule estimates of the “appropriate” level of policy rates for the US, euro area, UK, Japan, Canada and Australia after the collapse in growth seen in response to the COVID-19 lockdowns. We used the most basic formulation of the Taylor Rule that put equal weight on deviations of headline inflation from central bank target levels, and deviations of unemployment from full-employment NAIRU measures. Chart 6Taylor Rules Suggest Rates Will Need To Head Higher
Can Central Bankers Credibly Be Not Credible?
Can Central Bankers Credibly Be Not Credible?
Given the surge in unemployment and collapse in inflation due to the COVID-19 recession, Taylor Rule estimates were calling for negative nominal interest rates across the developed economies (Chart 6). The estimates were most severe in the US, where a fed funds rate of -3.8% is deemed “appropriate” with an unemployment rate of 11% and headline CPI inflation at 0.6%. When the Bloomberg consensus forecasts for the next two years are put into the Taylor Rule, a rising path for interest rates is projected but with rates remaining below pre-COVID levels. However, if policymakers stick to their current pledge to keep rates on hold for longer to ensure that inflation not only returns to 2%, but also stays there without the help from very easy monetary policy, then the implication is that a “below-appropriate” interest rate will be maintained for an extended period. Interest rate markets have already come to that conclusion. 5-year OIS rates, 5-years forward are trading between 0% and 1% across the developed economies – levels that are below the neutral interest rate estimates we are using in our Taylor Rule forecasts (Chart 7). Chart 7Markets Priced For An Extended Period Of Below-Neutral Rates
Markets Priced For An Extended Period Of Below-Neutral Rates
Markets Priced For An Extended Period Of Below-Neutral Rates
With interest rates already at or near the zero bound, any rise in inflation from current levels also near 0% will result in real policy rates turning negative if central banks do nothing. This would be consistent with the messages sent by the ZEW survey, and global inflation linked bond markets where real yields are falling deeper into negative territory. That would be a major shift of global policymaker behavior, designed as a planned erosion of inflation-fighting credibility. This is especially true for the likes of the Fed, which has a well-established history of turning hawkish at the first sign of rising inflation pressures. The Fed has already hinted that it is considering shifting its policy strategy to allow overshoots of inflation after periods of undershooting the 2% target. Other central banks, like the ECB, have announced similar reviews of their inflation targets and strategy. Such a move to tolerate higher levels of inflation is a logical response to a global pandemic and deep global recession, coming on the heels of several years of low inflation. The timing may actually be ideal to run more dovish policies to boost inflation, with many of the structural factors that have helped restrain global inflation starting to turn in a more inflationary direction. That would be a major shift of global policymaker behavior, designed as a planned erosion of inflation-fighting credibility. Bottom Line: Central bankers worldwide are promising to keep policy rates near 0% for at least the next two years, even if inflation begins to rise again. This is an obvious form of forward guidance designed to keep borrowing costs as low as possible until the COVID-19 pandemic ends. It may also be the start of a true shift in policymaker strategy, becoming more tolerant of faster inflation. Potential Reasons Why Inflation Could Return Central bankers are talking a good game right now, pledging not to turn too hawkish, too soon and allowing inflation to move back above policy targets. It remains to be seen if they would actually follow through and do nothing if realized inflation rates were to start climbing back to 2% or even higher. It is unlikely that policymakers will be facing that choice anytime soon. The COVID-19 pandemic is showing no signs of slowing in the US and large emerging market countries, global growth remains fragile and heavily reliant on monetary and fiscal policy support, and inflation rates worldwide are currently closer to 0% than 2%. Yet at the same time, there are structural disinflationary forces now changing in a way that may create a more inflationary world after the threat of the pandemic has faded. Demographics Chart 8Demographics Have Turned Less Disinflationary
Demographics Have Turned Less Disinflationary
Demographics Have Turned Less Disinflationary
BCA Research Global Investment Strategy has noted that the global demographic trends that helped restrain inflation in recent decades are shifting.1 The ratio of the number of global workers to the number of global consumers – the global support ratio - peaked back in 2013 and is now steadily falling (Chart 8). There are structural disinflationary forces now changing in a way that may create a more inflationary world after the threat of the pandemic has faded. A rising support ratio implies there are more people producing through work than consuming which, on the margin, is disinflationary. Now, with baby boomers leaving the labor force in droves and becoming consumers in retirement (especially consuming services like health care), the support ratio is falling and becoming a potentially more inflationary force. Globalization Chart 9Globalization Has Turned Less Disinflationary
Globalization Has Turned Less Disinflationary
Globalization Has Turned Less Disinflationary
One of the biggest disinflationary forces of the past quarter-century has been the rapid increase in global trade. As trade barriers fell and global supply chains expanded, companies were able to lower their costs of production. This allowed companies to widen profit margins without resorting to large price increases, helping to dampen overall inflation rates. Now, with global populism and protectionism on the rise, trade as a share of global GDP is declining (Chart 9). The COVID-19 pandemic will likely exacerbate this trend as more companies bring production closer to home, reversing the disinflationary impact of global supply chains, on the margin. A Strong US Dollar The relentless rise of the US dollar in recent years has exerted a major disinflationary headwind to the world economy, with a large share of global traded goods and commodities priced in dollars. Now, with the greenback finally showing signs of rolling over on a more sustainable basis (Chart 10), fueled by less favorable interest rate differentials and signs of improving global growth, the dollar is slowly becoming a more inflationary force. Chart 10USD Weakness Would Be Inflationary
USD Weakness Would Be Inflationary
USD Weakness Would Be Inflationary
Chart 11Structural Reasons Why Policy Rates Need To Stay Low
Structural Reasons Why Policy Rates Need To Stay Low
Structural Reasons Why Policy Rates Need To Stay Low
Of course, these factors are slow moving and will not necessarily result in an immediate increase in global inflation. Yet the trends now in place are more inflationary, on the margin, than has been the case for many years. Coming at a time when global productivity growth is anemic, the potential for an inflationary spark from overly easy monetary policies should not be ignored. Especially given the very high levels of private and public debt in the developed world, which puts more pressure on policymakers to choose inflation as a way to reduce debt burdens (Chart 11). Investment Implication – Stay Overweight Inflation-Linked Bonds Central bankers are now signaling a desire to keep interest rates lower for longer, both to provide stimulus for virus-stricken economies and to boost weak inflation. Coming at a time when secular disinflationary forces are losing potency, this raises the risk of a protracted period of negative real policy rates as inflation rises and policymakers do little to stop it pre-emptively. Against this shifting backdrop, the value of owning global inflation-linked bonds as core holdings in fixed income portfolios is compelling. Chart 12Maintain A Core Overweight In Inflation-Linked Bonds
Maintain A Core Overweight In Inflation-Linked Bonds
Maintain A Core Overweight In Inflation-Linked Bonds
Against this shifting backdrop, the value of owning global inflation-linked bonds as core holdings in fixed income portfolios is compelling. Inflation breakevens are more likely to creep upward than soar higher in the near term given the lingering economic threat from the COVID-19 pandemic. Yet inflation-linked bonds are likely to outperform nominal government debt over the next few years – if central bankers stay true to their word and keep rates unchanged while welcoming a pickup in inflation. The experience of the years following the 2008 financial crisis, when global policy rates were kept near 0% and central banks expanded balance sheets through quantitative easing, may be a template to follow. Global inflation linked bonds, as an asset class, steadily outperformed nominal government bonds from 2012-2016, shown in Chart 12 on a rolling 3-year annualized basis using benchmark indices from Bloomberg Barclays. A similar extended period of outperformance is not out of the question over the next few years, with central banks ramping up asset purchases once again and promising to keep policy easy until inflation returns. Bottom Line: The recent divergence of inflation expectations and real bond yields can persist if central banks commit to their dovish forward guidance. Stay overweight inflation-linked bonds versus nominal government debt, particularly in the US, Canada and Italy where our models show that breakevens are most undervalued. Robert Robis, CFA Chief Fixed Income Strategist rrobis@bcaresearch.com Footnotes 1 Please see BCA Research Global Investment Strategy "Third Quarter 2020 Strategy Outlook, Navigating The Second Wave", dated June 30, 2020, available at gis.bcaresearch.com. Recommendations The GFIS Recommended Portfolio Vs. The Custom Benchmark Index
Can Central Bankers Credibly Be Not Credible?
Can Central Bankers Credibly Be Not Credible?
Duration Regional Allocation Spread Product Tactical Trades Yields & Returns Global Bond Yields Historical Returns