Global

Highlights The leading providers of fundamental oil data differ sharply in their estimates of demand destruction caused by the COVID-19 pandemic. This will keep uncertainty over the trajectory of prices elevated this year. Our forecast of demand destruction and those of the US EIA and the IEA are clustered around 8mm b/d for 2020, while OPEC’s most recent estimate exceeds 9mm b/d. The rebound in actual demand, which is apparent in the data, a weakening USD and strengthening of global trade in the wake of global fiscal and monetary stimulus support our expectation of lower demand destruction. As mentioned last month, we believe the odds of a COVID-19 vaccine are high by year-end or early 2021 (Chart of the Week). Against this, bloated floating storage levels – and their attendant port congestion – threaten to slow crude-oil demand growth in Asia into 4Q20, particularly if China follows through on putting 19 very large crude carriers (VLCCs) filled with oil from the US on the water over the coming months. We continue to see the balance of risk favoring the upside for prices. We are raising our 2H20 Brent forecast $2/bbl to $46/bbl, and keeping our 2021 expectation at $65/bbl. WTI will trade ~ $3/bbl below those levels. Feature OPEC continues to see a higher level of demand destruction in the wake of the COVID-19 pandemic than BCA, the US Energy Information Administration (EIA) and the Paris-based International Energy Agency (IEA). OPEC continues to see a higher level of demand destruction in the wake of the COVID-19 pandemic than BCA, the US Energy Information Administration (EIA) and the Paris-based International Energy Agency (IEA). The cartel’s economists are estimating global oil-demand destruction would be ~ 9mm b/d year-on-year (y/y) in 2020. In their August projections, the EIA’s and IEA’s expectations for demand destruction are closer to ours at ~ 8mm b/d for this year. In the past, we focused more on OPEC’s output estimates for members of the cartel, particularly for its leader and top producer, the Kingdom of Saudi Arabia (KSA). In this month’s report, and in subsequent reports, we are incorporating OPEC’s demand estimates as a direct input to our price-forecasting models. For 2020, we are giving it an equal weight to the apparent consensus we share with the EIA and IEA. Chart of the WeekActual Oil Demand Continues Strong Recovery
Actual Oil Demand Continues Strong Recovery
Actual Oil Demand Continues Strong Recovery
The immediate effect of this will be to temper the effect of the stronger demand growth expectations we share with the EIA and IEA in this year’s price forecast, which will put us at $46/bbl on average for 2H20.1 The improvement in actual demand is apparent in our base case model up to July, as seen in the Chart of the Week. Much of this recovery is the result of the massive fiscal and monetary stimulus deployed globally by governments and central banks, which will continue to support the demand this year and next.2 This stimulus also is visible in global trade data – particularly in EM imports, which we follow closely, given their high sensitivity to changes in income (GDP). Our modeling indicates this recovery will continue to year-end (Chart 2). Chart 2EM Imports Recovery Likely Continues
EM Imports Recovery Likely Continues
EM Imports Recovery Likely Continues
Weaker USD Will Support Oil-Demand Recovery Speculators have crowded into the short-dollar trade, which augurs for a near-term correction in the USD DXY futures. We expect the USD to continue to weaken on the back of the Fed’s aggressive monetary accommodation, in line with our Global Investment and FX strategists.3 This will support the continued rally in crude oil prices we expect for the balance of this year and next. There are a number of short-term risks to our bearish USD view, however. These are mainly due to the marginal improvement of the US economy vis-à-vis Europe, which is evident in the manufacturing and services PMIs (Chart 3). Improving mobility data, which is coincident with the decline in its number of COVID-19 cases vs Europe, also is supportive of the USD (Chart 4). In the trading markets, speculators have crowded into the short-dollar trade, which augurs for a near-term correction in the USD DXY futures. Close to 60% of the DXY index is accounted for by the Euro (Chart 5). Lastly, while global economic policy uncertainty has fallen from its recent peak, taking the USD lower with it, it still is elevated and continues to represent a risk to the USD bear market (Chart 6). Chart 3USD Bear Market Could Stall
USD Bear Market Could Stall
USD Bear Market Could Stall
All else equal, a weakening USD will continue to support Brent prices, and with that the rest of the global oil complex. As long as EM growth continues to improve, these short-term USD effects discussed above will affect the DXY more than the broad trade-weighted index (TWIB) for the USD, which has a Euro weight of 18% and is a more representative gauge of USD strength vis-à-vis trade. Chart 4DXY Could Rally Briefly As US Recovers
The Oil Markets' Knife Edge
The Oil Markets' Knife Edge
Chart 5Specs Have Crowded Into The Short USD Trade
Specs Have Crowded Into The Short USD Trade
Specs Have Crowded Into The Short USD Trade
Chart 6A Weaker USD Will Boost Oil Prices
A Weaker USD Will Boost Oil Prices
A Weaker USD Will Boost Oil Prices
OPEC 2.0 Discipline, Capital Markets Will Restrain Supply While we expect some of this US production to come back on line as prices improve, overall output in the shales likely will continue to fall until 2H21. OPEC 2.0 production discipline largely is responsible for the 6.1mm b/d y/y decline in global oil production we estimate. The producer coalition’s putative leaders – KSA and Russia – continue to lead by example, having removed 460k b/d and 900k b/d y/y, respectively, from the market (Chart 7, top panel). We expect this to continue into next year (Table 1). Outside OPEC 2.0, US oil production is estimated to have fallen ~ 2mm b/d from its peak of 12.9mm b/d in 4Q19, in line with our expectation. This is largely the result of significantly reduced shale-oil output (Chart 7, bottom panel). While we expect some of this US production to come back on line as prices improve, overall output in the shales likely will continue to fall until 2H21. Chart 7OPEC 2.0, US Shales Output Will Remain Constrained
OPEC 2.0, US Shales Output Will Remain Constrained
OPEC 2.0, US Shales Output Will Remain Constrained
Table 1BCA Global Oil Supply - Demand Balances (MMb/d, Base Case Balances)
The Oil Markets' Knife Edge
The Oil Markets' Knife Edge
We continue to expect the combination of sustained demand growth and constrained supply to tighten balances globally, producing a physical deficit this year and next (Chart 8). As before, we expect this physical deficit to translate into lower inventories in the OECD, as refiners are forced to draw down stocks to meet demand (Chart 9). Chart 8Supply-Demand Balances Continue To Tighten
Supply-Demand Balances Continue To Tighten
Supply-Demand Balances Continue To Tighten
Chart 9Expect OECD Inventories To Draw
Expect OECD Inventories To Draw
Expect OECD Inventories To Draw
Asia’s Floating Storage Set To Increase Additional imports of US crude by China threaten to increase floating storage levels in Asia, which likely will reduce Chinese demand for light-sweet barrels sourced ex-US, and reverse the tightening in Brent and WTI forward curves. The inventory draw in the US – the largest component of OECD crude inventories – could accelerate if China follows through on its planned increase in imports of US crude oil, consistent with reports oil companies there recently chartered 19 VLCCs.4 This apparently was done to comply with the Phase 1 trade deal China and the US negotiated earlier this year. While these imports of US crude into China will lower US inventories – most of the tankers are shipping from the US Gulf – they could add to the swollen floating storage levels currently clogging Chinese harbors, and reduce demand for additional crude until these stocks are absorbed either by refinery demand or strategic reserves (Chart 10). In this context, we also are watching the evolution of forward curves, particularly for Brent, as this surge in Chinese imports could back out other light-sweet crudes similar to those produced in the US – and similar to Brent, for that matter – leaving them distressed on the water looking for a home. There already is early evidence the Brent forward curve’s flattening and expected return to backwardation has stalled (Chart 11). Given this pause in the tightening of the forward curve over the next year, we are closing our 4Q20 backwardation trades at tonight’s close. Chart 10China’s US Crude Imports Will Swell Asia’s Floating Storage
The Oil Markets' Knife Edge
The Oil Markets' Knife Edge
Chart 11Brent Forward Curves Weaken Over the Next 12 Months
Brent Forward Curves Weaken Over the Next 12 Months
Brent Forward Curves Weaken Over the Next 12 Months
Bottom Line: Global crude oil markets continue to tighten, as demand recovers, and supply discipline remains intact. However, additional imports of US crude by China threaten to increase floating storage levels in Asia, which likely will reduce Chinese demand for light-sweet barrels sourced ex-US, and reverse the tightening in Brent and WTI forward curves. This is prompting us to exit our 4Q20 backwardation trades at tonight’s close. The balance of price risks continues to favor the upside, in our estimation. We are raising our 2H20 Brent forecast slightly by $2/bbl to $46/bbl, and keeping our 2021 expectation at $65/bbl. WTI will trade ~ $3/bbl below those levels (Chart 12). Chart 12BCA Oil Price Trajectory Unchanged
BCA Oil Price Trajectory Unchanged
BCA Oil Price Trajectory Unchanged
Robert P. Ryan Chief Commodity & Energy Strategist rryan@bcaresearch.com Hugo Bélanger Associate Editor Commodity & Energy Strategy HugoB@bcaresearch.com Commodities Round-Up Energy: Overweight US natgas prices were up this week as Hurricane Marco and Laura approached the Gulf of Mexico (GoM). Oil and gas producers evacuated part of their offshore facilities and shut 61% of their natural gas production from the region. Cheniere reported it suspended operation at its Sabine Pass LNG export terminal located in the GoM. Still, abundant oil and gas storage in the US limits the price increase. Separately, the latest estimate of US LNG cargo cancellations for October delivery – down to only 10 cancelled vessels – confirms natgas price spreads relative to Asia have reached levels sufficient to incentivize additional exports of US gas, supporting Henry Hub prices (Chart 13). Base Metals: Neutral Copper theft is rising in Chile and Africa, boosting LME copper prices and pushing treatment and refining charges lower. In Chile, “About 40 incidents were reported in the first half of this year, up from six in 2014,” according to mining-journal.com. Falling spot supplies in the wake of COVID-19 mining restrictions likely explain the thefts and increases in the cash-to-three-month copper spread on the LME to $17.25/MT earlier this week. Precious Metals: Neutral We closed our long gold recommendation for a 20% profit after reaching our $1,950/oz stop loss on August 11. We remain positive on gold strategically based on our view the dollar will continue depreciating and the Fed will keep rates low even as inflation and inflation expectations move up. As we go to press, markets await Jerome Powell’s speech at the annual Jackson Hole summit, where he is expected to discuss the Fed’s strategic review of its monetary policy strategy. This could push inflation breakevens slightly higher, and real yields lower. We are recommending a buy order at $1,875/oz as spec positioning remains stretch (Chart 14). Ags/Softs: Underweight The USDA reported 69% of the US soybean crop was rated in good to excellent condition this week, up sharply from last year’s level of 55%. However, this was down from last week’s level of 72%, which was supportive of prices. Separately, the Sino-US Phase 1 trade deal is back in the news this week, with reports the two countries agreed to resume shipments of soybeans on a record scale – in the range of 40mm tons for 2020, which would be 10% above record purchases by China set in 2016, according to bloomberg.com. China had turned to Brazil earlier in the year as the trade deal became mired in tit-for-tat tariff spats. Chart 13Natgas Prices Supported By Hurricane Laura
Natgas Prices Supported By Hurricane Laura
Natgas Prices Supported By Hurricane Laura
Chart 14Gold Vs. USD Spec Positioning Stretched
Gold Vs. USD Spec Positioning Stretched
Gold Vs. USD Spec Positioning Stretched
Footnotes 1 We also reduced the pass-through of the supply-demand difference into the oil price forecast in this month’s report, based on recent research we’ve completed, which also tempers the impact of the stronger growth expectations we share with the EIA and IEA. 2 Please see Low Vol, High Uncertainty Keeps Oil-Price Rally On Tenterhooks published June 18, 2020, for additional discussion of global fiscal and monetary stimulus vis-à-vis oil markets. 3 Please see The Dollar And The Budget Deficit: From Theory To Practice, a Special Report published by BCA Research’s Global Investment Strategy and Foreign Exchange Strategy on August 14, 2020. It is available at gis.bcaresearch.com. 4 In July and August, China imported ~ 17mm barrels of US crude, according to S&P Global Platts. Please see Crude moves higher amid China's US import boost ahead of key OPEC meet published by Platts August 17, 2020. China reportedly charted 19 VLCCs to import ~ 37mm barrels of US crude beginning in August, according to worldoil.com. Please see China charters 19 tankers for record U.S. crude oil shipment published August 21, 2020. Investment Views and Themes Recommendations Strategic Recommendations Tactical Trades Trade Recommendation Performance In 2020 Q2
Russia Again Examines Oil Hedging
Russia Again Examines Oil Hedging
Commodity Prices and Plays Reference Table Trades Closed in 2020 Summary of Closed Trades
Russia Again Examines Oil Hedging
Russia Again Examines Oil Hedging
Highlights The strength in global semiconductor sales in recent months has been due to one-off factors stemming from pandemic-related lockdowns. As the one-off demand surge subsides, global semiconductor sales will decline modestly toward the end of this year. In the near term, global semiconductor stock prices are vulnerable due to overbought conditions, excessive valuations and demand disappointment. The global semiconductor industry is at the epicenter of the US-China confrontation, and more US restrictions on chips sales to China are probable. This is another risk for this sector's share prices. Nevertheless, the structural outlook for global semiconductor demand is constructive. Its CAGR may rise from 3% during 2014-2019 to 5% during 2020-2024. Feature Investor euphoria has taken hold of semiconductor stocks. Global semiconductor stock prices have skyrocketed by 68% from March lows and 96% from December 2018 lows. Meanwhile, global semiconductor sales during March-June rose only by 5% from a year ago. As a result, the ratio of market cap for global semiconductor stocks relative to global semiconductor sales has reached its highest level since at least the inception of data in 2003 (Chart II-1). Chart II-1Global Semi Sector: Market Cap-To-Sales Ratio Has Surged
Global Semi Sector: Market Cap-To-Sales Ratio Has Surged
Global Semi Sector: Market Cap-To-Sales Ratio Has Surged
With semi equity multiples very elevated, their share prices have become even more sensitive to global semiconductor demand growth. Hence, the focus of this report is to try to gauge the strength of global semiconductor demand, both in the near term and structurally. The strength in global semiconductor sales in recent months has been due to one-off factors stemming from the lockdowns. Near-term semiconductor stock prices could disappoint due to weak chip demand from the smartphone sector and diminishing purchases of personal computers (PCs) and servers. However, structurally, we are positive on global semiconductor demand, which is underpinned by the continuing rollout of 5G networks and phones, a wider adoption of data centers, and further technological advancements in artificial intelligence (AI), cloud computing, edge computing and smaller nodes for chip manufacturing (Box II-1). Box II-1 Key Technologies Underpinning Potential Global Semiconductor Demand AI refers to the simulation of human intelligence in machines, for example, computers that play chess and self-driving cars. The goals of AI include learning, reasoning and perception. Cloud computing is the delivery of computing services – including servers, storage, databases, networking, software, analytics and intelligence – over the Internet (“the cloud”) to offer faster innovation, flexible resources and economies of scale. Edge computing is a form of distributed computing, which brings computation and data storage closer to where it is needed, to improve response times and save bandwidth. Technology node refers to the width of line that can be processed with a minimum width in the semiconductor manufacturing industry, such as technology nodes of 10 nanometers (nm), 7nm, 5nm and 3nm. The smaller the nodes are, the more advanced they are. Near-Term Headwinds Semiconductor demand worldwide grew by 6% year-on-year in the first half of this year. There has been a remarkable divergence between world semiconductor sales and the global business cycle (Chart II-2). The divergence between semiconductor sales and economic activity was most striking in the US and China. Semiconductor sales in China rose by 5% year-on-year in Q12020, and in the US they grew by 29% year-on-year in Q22020, despite a contraction in their aggregate demand during the same period. By contrast, Q2 annual growth of semiconductors sales was -2.2% for Japan, -17% for Europe and 1.8% for Asia ex. China and Japan (Chart II-3). Chart II-2World Semi Sales Diverged From The Global Business Cycle
World Semi Sales Diverged From The Global Business Cycle
World Semi Sales Diverged From The Global Business Cycle
Chart II-3Strong Semi Sales In The US And China, But Not Elsewhere
Strong Semi Sales In The US And China, But Not Elsewhere
Strong Semi Sales In The US And China, But Not Elsewhere
The reasons why the US and China posted a surge in semiconductor demand while Europe and Japan experienced a contraction in domestic semiconductor sales are as follows: Most data center investment is occurring in the US and China. Chart II-4 shows that 40% of global hyperscale data centers are operating in the US, much larger than any other countries/regions. China, in turn, ranked second, with a global share of 8%. Chart II-4The US Has The Most Global Hyperscale Data Centers
September 2020
September 2020
Demand contraction in Europe and Japan is due to semiconductor demand in these regions mainly originating from the automobile sector, where production was severely hit by the global pandemic. About 37% of European semiconductor sales were from last year’s automotive market. We believe the divergence between global economic activity and semiconductor sales, as demonstrated by Chart II-2 on page 3, has been due to one-off factors, as the global pandemic lockdowns have spurred semiconductor demand. Such a one-off demand boost will likely dissipate in the coming months. Traditional PCs and tablets: There has been a surge in demand for traditional PCs1 and tablets in the past six months. This was due to the significant increase in online activities, such as working from home, education, e-commerce, gaming and entertainment. Data from the International Data Corporation (IDC) has revealed that shipments of traditional PCs and tablets in volume terms had a strong year-on-year growth of 11.2% and 18.6%, respectively, in the period of April-June (Chart II-5). Looking forward, even renewed lockdowns will not lead to a similar rush to buy these products. Many households are already equipped to work from home and for other online activities. With many countries gradually opening their economies, such demand will diminish. The traditional PC and tablet sectors together account for about 13% of global chip demand (Chart II-6). Chart II-5Personal Computers Sales Have Surged Amid Lockdowns
Personal Computers Sales Have Surged Amid Lockdowns
Personal Computers Sales Have Surged Amid Lockdowns
Server demand: Another major semiconductor demand contribution in Q2020 was from the server sector, which spiked by 21% year-on-year (Chart II-7). The surge in online activities triggered a strong demand for cloud services and remote work applications, both of which require computer servers to run on. Chart II-6The Breakdown Of Global Semiconductor Sales By Type Of Usage
September 2020
September 2020
However, demand from the server sector is also set to diminish in 2H2020 and Q1 2021. Provided the inventories at major data center operators, including Microsoft, Google and Amazon, remain at high levels,2 global cloud service providers will likely reduce their orders of servers next quarter.3 Enterprises will also likely cut their investment in computer servers in 2H2020, as many of them had already increased their purchases of servers to prepare employees and business processes for remote working. We expect global server demand growth to soften in 2H2020. The Digitimes Research forecasted a 5.6% quarter-on-quarter contraction in 3Q2020 and a further cut in global sever shipment in the 4Q2020.2 The global server sector accounts for about 10% of global chip demand and, together with PCs and tablets, they make for 23% (please refer to Chart II-6 on page 5). Further, the smartphone sector – accounting for 27% of global semiconductor demand – will continue struggling in H2 this year. Chart II-7Server Sales Have Surged Amid Lockdowns
Server Sales Have Surged Amid Lockdowns
Server Sales Have Surged Amid Lockdowns
Chart II-8Global Smartphone Shipments Will Likely Remain Weak In 2020H2
Global Smartphone Shipments Will Likely Remain Weak In 2020H2
Global Smartphone Shipments Will Likely Remain Weak In 2020H2
The global total smartphone demand has been hit severely, as households delayed their new smartphone purchases. According to Canalys’ data, global smartphone shipments dropped by 13% and 14% year-on-year in Q1 and Q2, respectively. We expect smartphone shipments to continue contracting over the next three-to-six months (Chart II-8). We believe global consumers will remain cautious in their spending on discretionary goods, such as smartphones, due to lowered incomes and increased job uncertainty. The IDC also forecasted that global smartphone shipments would not grow until 1Q2021.4 The Chinese smartphone sales showed a considerable weakness in July, with a 35% year-on-year contraction, which is much deeper than the 20% decline in H1 this year. 5G smartphone shipments also slowed last month, with a 21% drop from the previous month. The global semiconductor industry is at the epicenter of the US-China confrontation. Bottom Line: The strength in global semiconductor sales in recent months has been due to one-off factors stemming from the lockdowns. As this one-off demand subsides, global semiconductor sales will decline modestly toward the end of this year. Given the overbought conditions and the elevated equity valuations, global semiconductor stocks are currently vulnerable to near-term disappointments in semiconductor demand. At The Epicenter Of The US-China Rivalry Semiconductors are at the epicenter of the US-China confrontation. Ultimately, the US-China contention is about future technological dominance. That is access to technology and the capability to develop new technologies. China currently accounts for about 35% of the global semiconductor demand. US restrictions on semi producers worldwide to supply semiconductors to Chinese buyers constitute a major risk to semiconductor stock prices. On August 17, the US announced fresh sanctions that restrict all US and foreign semiconductor companies from selling chips developed or produced using US software or technology to Huawei, without first obtaining a license. In May, the US had already limited companies, such as the Taiwan Semiconductor Manufacturing Company (TSMC), from making and supplying Huawei with its self-designed chips. In addition, the US recently threatened bans on Chinese-owned apps TikTok and WeChat, and signaled that it could soon restrict Alibaba’s operations in the US. Chart II-9Global Semi Companies' Sales To China Are Substantial
September 2020
September 2020
The global semiconductor sector is highly vulnerable to further escalation in the tension between these two superpowers. Major global semiconductor companies’ sales are heavily exposed to China, and their revenue from China ranges from 16% to 50% of total (Chart II-9). We have been puzzled why global semi share prices have been rallying in spite of US limitations on semiconductor shipments to Huawei and its affiliated entities. One explanation could be that the Chinese companies that are not affiliated with Huawei are able to import semiconductors and then supply them to Huawei. If this is true, the US will have no other choice but to limit all semiconductor sales to China. This will be devastating for global semi producers given their large exposure to China. In anticipation of US punitive policies limiting its access to semiconductors, China had boosted its semiconductor imports over the past 12 months (Chart II-10, top panel). Chinese imports of integrated circuits rose by 12% year-on-year in 1H2020, which is much higher than the 5% year-on-year increase in Chinese semiconductor demand during the same period (Chart II-10, bottom panel). This gap suggests the country had restocked its semiconductor inventories. China has particularly restocked its imports of non-memory chips with imports of processor & controller and other non-memory chips in H1, surging by 30% and 20%, respectively, in US dollar terms (Chart II-11). For memory chips, the contraction in Chinese imports was mainly due to a decline in global memory chip prices. Chart II-10China Had Likely Restocked Its Semi Inventories
China Had Likely Restocked Its Semi Inventories
China Had Likely Restocked Its Semi Inventories
Chart II-11Strong Chinese Imports In Non-Memory Chips
Strong Chinese Imports In Non-Memory Chips
Strong Chinese Imports In Non-Memory Chips
Bottom Line: The global semiconductor industry is at the epicenter of the US-China confrontation, and more restrictions on sales to China are probable. In turn, the restocked semiconductor inventory in China raises the odds of weakening mainland semiconductor import demand in H2 of this year. Structural Tailwinds Table II-1Global Semiconductor Demand CAGR Forecast Over 2020-2024 By Device
September 2020
September 2020
We are optimistic on structural global semiconductor demand. Its nominal CAGR may rise from 3% during 2014-2019 to 5% during 2020-2024 in US dollar terms. Table II-1 shows our demand growth forecasts for global chips in the main consuming sectors over the next five years. The major contributing sectors during 2020-2024 will be 5G smartphones, servers, industrials, electronics and automotive manufacturing. The underlying driving forces are the continuing rollout of 5G networks and phones, the development of data centers, and further technological advancements in AI, cloud computing and edge computing. Currently, the world is still in the early stages of 5G network development. AI, cloud computing and edge computing are constantly evolving. With increasing adoption of 5G smartphones, computer servers and IoT devices, global semiconductor demand is in a structural uptrend (Box II-2). Box II-2 Key Components For The Virtual World In Development Data centers and cloud computing allow data to be stored and applications to be running off-premises and to be accessed remotely through the internet. Edge computing allows data from Internet of things (IoT) devices to be analyzed at the edge of the network before being sent to a data center or cloud. IoT devices contain sensors and mini-computer processors that act on the data collected by the sensors via machine learning. The IoT is a growing system of billions of devices — or things — worldwide that connect to the internet and to each other through wireless networks. AI technology empowers cloud computing, edge computing and IoT devices. 5G is at the heart of the IoT industry transformation, making a world of everything connected possible. Chart II-125G Phone Shipments In China Will Continue To Rise
5G Phone Shipments In China Will Continue To Rise
5G Phone Shipments In China Will Continue To Rise
5G Smartphone Currently, China is the world’s largest 5G-smartphone consumer and the leading 5G-adopter in the world. According to Digitimes Research, global 5G smartphone shipments will reach over 250 million units in 2020, with 170 million (68%) in China and only 80 million units in the world ex. China. Looking forward, 5G smartphone shipments are set to accelerate worldwide over the coming years. The 5G phone shipments in China will continue to rise. The 5G phone sales penetration rate in China is likely to rise from 60% in July to 95% by the end of 2022. In such a case, we estimate that the monthly Chinese 5G phone shipments will increase from the current 16 million units to about 25-30 million units in 2022 (Chart II-12). In the rest of the world, the 5G smartphone adoption pace will also likely speed up over the next five years. The 5G phone selling prices in the world outside China will drop, as more models are introduced and become more affordable. 5G smartphone prices have already fallen in China and will inevitably fall elsewhere. Chinese 5G smartphone producers will ship their low-priced 5G phones overseas, putting pressure on other producers to lower their prices. The 5G infrastructure development is accelerating in China and will accelerate in the rest of the world. Both China and South Korea have been very aggressive in their respective 5G network development. As of the end of June, China's top three carriers: China Mobile, China Unicom, and China Telecom – which together serve more than 1.6 billion mobile users in the country – had installed 400,000 5G base stations against an annual target of 500,000. In comparison, as of April 2020, American carriers had only put up about 10,000 5G base stations.5 As the US is competing with China on the 5G front, the country will likely boost its investment in 5G network development aggressively over the next five years in order to catch up to, or even exceed, China. Importantly, the 5G smartphone has more silicon content than 4G smartphones. More silicon content means higher semiconductor value. Rising 5G smartphone sales and higher silicon content together will more than offset the loss in semiconductor sales due to falling global 4G smartphone shipments. Overall, global semiconductor stock prices have diverged from their sales and profits. Based on our analysis, we expect a CAGR growth of 4% in semiconductor demand from the global smartphone sector over the next five years, slightly lower than the 5% in previous five years (Table II-1 on page 10). This also takes into consideration that the 5G network will be more difficult and more expensive to develop than the 4G network. Servers Global server shipment growth will be highly dependent on both the pace and the scale of data center development (Box II-3). Data centers account for over 60% of global server demand. Box II-3 Data Centers There are four main types of data centers – enterprise data centers, managed services data centers, colocation data centers, and cloud data centers. Data centers can have a wide range of number of servers. Corporate data centers tend to have either 200 (small companies), or 1000 servers (large companies). In comparison, a hyperscale data center usually has a minimum of 5,000 servers linked with an ultra-high speed, high fiber count network. Outsourcing and a move towards the cloud are driving the growth of the hyperscale data center. Instead of companies investing in physical hardware, they can rent server space from a cloud provider to both save their data and reduce costs. Amazon, Microsoft, Google, Apple and Alibaba are all top global cloud service providers. The more hyperscales to be built up, the higher the demand for servers. In 2019, about 13% of the total number of data centers in China were of the hyperscale and large-scale varieties. The plan of new infrastructure development announced earlier this year by Beijing was aiming to increase the number of hyperscale and large-scale data centers in China. Among current data centers either under construction or to be developed in the near future, 36% of them are hyperscale and large-scale data centers. The future growth of data centers is promising. The global trend of data localization6 due to the concerns of data privacy and national security will also bolster a boom of data centers over the next five years. A growing number of countries are adopting data localization requirements, such as China, Russia, Indonesia, Nigeria, Vietnam and some EU countries. While the Chinese data center market is expected to expand by a CAGR of about 28% over 2020-2022,7 a report recently released by Technavio forecasted the global data center industry’s CAGR at over 17% during 2019-2023. We forecast that the global semiconductor demand from servers will grow at a CAGR of 12% over 2020-2024. IoTs Technological advancements in AI, cloud computing and edge computing, in combination with 5G network development, will facilitate the IoTs adoption. According to the GSMA,8 46 operators in 24 markets had launched commercially available 5G networks by 30 January 2020. It forecasted that global IoT connections will be increased from 12 billion mobile devices in 2019 to 25 billion in 2025 with a CAGR at 13%.9 IoTs chips include the Artificial Intelligence of Things (AIoT) – a powerful convergence of AI and the IoT. IoTs is an interconnected network of physical devices. Every device in the IoT is capable of collecting and transferring data through the network. Looking forward, global demand of AI chips and IoT chips will have significant potential to grow with creation of “smarter manufacturing”, “smarter buildings”, “smarter cities”, etc. AI applications can be used in manufacturing processes to render them smarter and more automated. Productivity will be enhanced as machines achieve significantly improved uptime while also reducing labor costs. There are plenty of upsides in industrial semiconductor demand (Chart II-13). We expect the CAGR of industrial electronics to increase from 3.4% during 2014-2019 to 8% during 2020-2024. AI applications can create smart buildings by increasing connectivity across enterprise assets, enabling home network infrastructure (e.g., routers and extenders) and employing home-security devices (e.g., cameras, alarms and locks). AI applications can be used to create smart cities. A smart city is an urban area that uses different types of IoT electronic sensors to collect data. Insights gained from that data are used to manage assets, resources and services efficiently; in return, that data is used improve operations across the city. China has already developed about 750 trial sites of smart cities with different degrees of smartness in the past decade. As AI and 5G technology advances, the existing smart cities’ “smartness” will be upgraded and new trial smart cities will be implemented. Based on IDC data, China’s investment in smart cities will rise at a CAGR of 13.5% over 2020-2023 (Chart II-14). Globally, the U.S., Japan, European countries and other nations are also actively developing smart cities. According to a new study conducted by Grand View Research, the global smart cities market size is expected to grow at a CAGR of 24.7% from 2020 to 2027.10 Chart II-13Plenty Of Upside In Industrial Semi Demand
Plenty Of Upside In Industrial Semi Demand
Plenty Of Upside In Industrial Semi Demand
Chart II-14China’s Investment In Smart Cities Will Continue To Grow
September 2020
September 2020
Automotive We expect the global automotive chip market to grow at a CAGR of 9% during 2020-2024, as in 2014-2019. The increase in consumption of semiconductors by the auto industry will continue to be driven by the market evolution toward autonomous, connected, electric and shared mobility. Most new vehicles now include some level of advanced driver assist systems (ADAS), such as adaptive cruise control, automatic brakes, blind spot monitoring, and parallel parking. The whole industry is progressing toward fully autonomous vehicles in the coming years. Increasing adoption of automotive chips and recovering car sales will revive automotive chip sales. In addition, rising penetration of new energy vehicles (NEVs) is beneficial to semiconductor sales, as NEVs contain higher semiconductor content than conventional vehicles. Conventional vehicles contain an average of a $330 value of semiconductor content while hybrid electric vehicles can contain up to $1,000 and $3,500 worth of semiconductors.11 Regarding other sectors, we are also positive on structural demand of storage and consumer electronics. AI applications generate vast volumes of data — about 80 exabytes per year, which is expected to increase by about tenfold to 845 exabytes by 2025.12 In addition, developers are now using more data in AI and deep learning (DL) training, which also increases storage requirements. With massive potential demand for storage, we estimate a CAGR of 7% over 2020-2024 (Table II-1 on page 10). A recent report from ABI Research predicts that the COVID-19 pandemic will increase global sales of wearables (such as a Fitbit or Apple Watch) by 29% to 30 million shipments of the devices this year. With contribution from wearables, we expect global semiconductor demand from the consumer sector to grow at a CAGR of 3% over 2020-2024, the same rate as in the previous five years. Bottom Line: Continuing rollout of 5G networks and phones, development of data centers, and further technological advancements in AI and cloud computing will provide tailwinds to structural global semiconductor demand, accelerating its CAGR growth from 3% during 2014-2019 to 5% during 2020-2024. Valuations And Investment Conclusions Most global semiconductor stocks are currently over-hyped. Critically, both DRAM and NAND prices have been deflating since January, reflecting weak demand for memory chips. Yet, share prices of memory producers have rallied (Chart II-15). Overall, global semiconductor stock prices have diverged from their sales and profits (Chart II-16). Chart II-15Falling Memory Prices Pose Risk To Memory Stocks
Falling Memory Prices Pose Risk To Memory Stocks
Falling Memory Prices Pose Risk To Memory Stocks
Chart II-16Global Semiconductor Stocks Have Deviated From Profits
Global Semiconductor Stocks Have Deviated From Profits
Global Semiconductor Stocks Have Deviated From Profits
Consequently, the multiples of semiconductor stocks have spiked to multi-year highs (Chart II-17). Even after adjusting for negative US real bond yields, valuations of semiconductor stocks are not cheap. Chart II-18 illustrates the equity risk premium for global semiconductor stocks is at the lower end of its range of the past 10 years. The ERP is calculated as forward earnings yield minus 10-year US TIPS yields. Chart II-17Global Semi Stocks: Elevated Valuations
Global Semi Stocks: Elevated Valuations
Global Semi Stocks: Elevated Valuations
Chart II-18Equity Risk Premium For Global Semi Stocks Is Historically Low
Equity Risk Premium For Global Semi Stocks Is Historically Low
Equity Risk Premium For Global Semi Stocks Is Historically Low
It is impossible to time a correction or know what the trigger would be (US-China tensions have been our best guess). Nevertheless, we do not recommend chasing semiconductor stocks higher due to their overstretched technicals and valuations on the one hand and potential weakening demand in H2 on the other. In addition, the ratio of global semi equipment stock prices relative to the semi equity index correlates with absolute share prices of global semi companies. This is because equipment producers are higher-beta as they outperform during growth accelerations and underperform during growth slumps. The basis is that semi manufacturers have to purchase equipment if there is actual strong demand coming up and vice versa. The recent underperformance by global semi equipment stocks relative to the semi equity index might be an early sign of a potential reversal in semi share prices in absolute terms (Chart II-19). Chart II-19A Signal Of A Potential Reversal In Semi Share Prices
A Signal Of A Potential Reversal In Semi Share Prices
A Signal Of A Potential Reversal In Semi Share Prices
Meanwhile, we believe the subsector- memory chip stocks - will outperform the overall semiconductor index amidst the potential correction, because they have lagged and are less over-extended. Finally, we remain neutral on Taiwanese and Korean bourses within the EM equity space for now. Escalation in US-China confrontation, as well as their exposure to semiconductors, put these bourses at near-term risk. That said, we are reluctant to underweight these markets because fundamentals in EM outside North Asia remain challenging. Ellen JingYuan He Associate Vice President Emerging Markets Strategy Footnotes 1 Traditional PCs are comprised of desktops, notebooks, and workstations. 2 Global server shipments to contract 5.6% sequentially in 3Q2020, says Digitimes Research 3 Global server shipments forecast to increase by 5% this year: TrendForce 4 IDC Expects Worldwide Smartphone Shipments to Plummet 11.9% in 2020 Fueled by Ongoing COVID-19 Challenges 5 America does not want China to dominate 5G mobile networks 6 “Data localization” can be defined as the act of storing data on a device that is physically located within the country where the data was created. Data localization requirements are governmental obligations that explicitly mandate local storage of personal information or strongly encourage local storage through data protection laws that erect stringent legal compliance obligations on cross-border data transfers. 7 The big data center industry ushered in another outbreak 8 The GSMA represents the interests of mobile operators worldwide, uniting more than 750 operators with almost 400 companies in the broader mobile ecosystem, including handset and device makers, software companies, equipment providers and internet companies, as well as organizations in adjacent industry sectors. 9 GSMA: 5G Moves from Hype to Reality – but 4G Still King 10 Smart Cities Market Size Worth $463.9 billion By 2027 11 The Automotive Semiconductor Market – Key Determinants of U.S. Firm Competitiveness 12 AI is data Pac-Man. Winning requires a flashy new storage strategy.
Highlights A weak dollar and low bond yields have pushed up the S&P 500 more than anticipated. Cyclical forces favor loftier stock prices in 12 months. Froth creates short-term vulnerabilities that higher yields could catalyze. The lack of yield curve control along with an improving economic outlook and a decline in deflationary risks indicate that Treasury yields will move toward 1% in the coming months. Long-term investors should begin to add small-cap stocks to their core US holdings. Feature The S&P 500 recent all-time high flies in the face of a long list of tactical indicators that flag an elevated risk of correction. The strength of the US equity market is a testament to the power of policy stimulus, the perceived invincibility of tech titans and the hopes that the powerful economic recovery will continue. Although equities will climb in the coming year, a move up in yields should transfer the leadership from tech and growth stocks to value and traditional cyclicals. While these shifts usually do not spell the end of bull runs, often they generate periods of elevated volatility, especially when the displaced leaders account for 40% of market capitalization. Small-cap stocks look increasingly attractive. A Post Mortem We have been cyclically bullish since late March,1 but on June 25th we warned that the S&P 500 would churn between 2800 and 3200 for the rest of the summer.2 This view did not materialize for several reasons. We underestimated the impact of a weak dollar, which has given a second life to the equity bull market. When expressed in euros, the S&P 500 has been flat since June 5 (Chart I-1). Relative to gold, the S&P 500 is down by 9% since June 8, which further highlights how equities have been supported by a weak US currency and a plentiful money supply. Meanwhile, the S&P 500 has outperformed the EURO STOXX 50 by 7.8% since June 5; however, when we factor in the effect of the strong euro, US equities have steadily underperformed the Eurozone benchmark since early May (Chart I-1, bottom panel). Low bond yields have also buttressed US equities. Near-zero interest rates have allowed the valuation of growth stocks to hit extraordinary levels. The NASDAQ trades at 32-times 2020 earnings and 27-times 2021 EPS. The S&P tech is valued at 29-times 2020 EPS and 25-times next year’s profits. In the most extreme cases, the five tech stocks that have accounted for 31.7% of market gains since March 23 (Apple, Amazon, Microsoft, Alphabet and Facebook) trade on average at 40-times 2020 EPS and 32-times 2021 earnings. Low bond yields have also buttressed US equities. Importantly, COVID-19 has had a positive influence on these same tech stocks. According to our European Investment Strategy colleagues, while spending on restaurant, entertainment and retail collapsed during the pandemic, outlays surged on Amazon, Apple products, Netflix subscriptions, etc.3 At the apex of the crisis, online retail sales expanded by 26.3% annually in the US, while bricks-and-mortar sales contracted by an unprecedented -17.7%. Meanwhile, global shipments of personal computers and servers are expanding by 11.2% and 21.5% annually, respectively (Chart I-2, top panel). Therefore, the largest sector of the S&P 500 is outperforming relative to the rest of the market (Chat I-2, bottom panel). As long as investors continue to expect COVID-19 to affect consumer behavior, they will pay a premium for tech stocks that benefit from the pandemic. Chart I-1The Weak Dollar Is Fueling The Recent Rally
The Weak Dollar Is Fueling The Recent Rally
The Weak Dollar Is Fueling The Recent Rally
Chart I-2Earnings Have Supported Tech Stocks
Earnings Have Supported Tech Stocks
Earnings Have Supported Tech Stocks
Can Stocks Remain Unscathed? The outlook for stocks is positive, but near-term risks have not dissipated because short-term market conditions remain frothy. Watch for higher bond yields as the force to concretize the tactical risks. The following cyclical forces continue to act as crucial tailwinds for equities: The equity risk premium (ERP) remains low. Computations of ERP must factor in the expected expansion of earnings. To incorporate this alteration, we assume that long-term cash flows will grow in line with potential nominal GDP growth. However, we must also consider the absence of stability of the ERP’s mean. After this adjustment, the ERP is still consistent with significant additional gains for the S&P 500 (Chart I-3). Monetary policy is extraordinarily accommodative. Even when we account for the S&P 500’s elevated multiples, the exceptional jump in the BCA Monetary Indicator is large enough to push up equity prices (Chart I-4). Moreover, the strength of US housing activity indicators confirms that the Federal Reserve has pulled the right levers to boost domestic economic activity. For example, the NAHB Housing Market Index has reached a 22-year record, building permits in July grew at their fastest monthly rate in 30 years, and the Mortgage Applications Index for purchases rocketed to a 11-year high in August. Chart I-3A Low ERP Underpins Equities...
A Low ERP Underpins Equities...
A Low ERP Underpins Equities...
Chart I-4...So Does Monetary Policy
...So Does Monetary Policy
...So Does Monetary Policy
The US economy continues to heal. For stocks to climb further on a cyclical basis, the market will need more than five tech giants leading the charge. Hence, earnings expectations for the rest of the market must also mount. Practically, the economy must recover its output loss and the pandemic must ebb. For now, the four-week moving average of initial unemployment claims is drifting lower, and the ISM New Orders-to-Inventories spread is consistent with a faster and more solid business cycle upswing. The ERP is still consistent with significant additional gains for the S&P 500. The global industrial sector outlook is brightening. Manufacturing and trade disproportionately contribute to fluctuations in global economic activity, therefore, they exert an outsized influence on the earnings of non-tech multinationals. The strength in Singapore’s electronics shipments indicates that our Global Industrial Activity Nowcast will accelerate (Chart I-5, top panel). Moreover, the rapid expansion in China’s credit flows points to a marked increase in Chinese imports, which will help industrial and commodity exporters around the world (Chart I-5, bottom panel). Core producer prices have bottomed. Core producer prices are a direct input in the corporate sector’s pricing power. A trough in this inflation gauge leads to stronger EPS and widening profit margins for the S&P 500 (Chart I-6). Chart I-5The Global Industrial Cycle Is Turning The Corner
The Global Industrial Cycle Is Turning The Corner
The Global Industrial Cycle Is Turning The Corner
Chart I-6Easing Deflationary Pressures Will Help Profits
Easing Deflationary Pressures Will Help Profits
Easing Deflationary Pressures Will Help Profits
Investors should still wait to allocate new funds to the stock market. The stock market’s near-term outlook remains marked by short-term froth that dampens our cyclical optimism, especially because the market advance has been concentrated in a small group of equities. Chart I-7Tactical Froth
Tactical Froth
Tactical Froth
The Exposure Index of the National Association of Active Investment Managers has hit 100.1 (Chart I-7). Such a lofty reading indicates that the price of stocks already incorporates optimistic expectations. From a contrarian perspective, this development boosts the probability that swing traders will face disappointments in the near future and will sell their equity holdings. Similarly, the put/call ratio is near a 10-year low, which confirms that traders have bought a lot of upside exposure to stocks without much protection against a pullback. This level of confidence is often a precursor to a significant correction. Finally, our Tactical Strength Indicator is 1.7-sigma above its mean. Historically, when this risk gauge has hit a reading above 1.3, there is a good probability that the S&P 500 will correct or move sideways (Chart I-8). A catalyst must emerge for those aforementioned vulnerabilities to morph into a correction. If Treasury yields move closer to 1%, then stocks will experience a significant pullback of 10% or more as the market rotates away from the leadership of growth stocks. This risk would be especially salient if real yields move up. As Chart I-9 illustrates, falling TIPS yields have been a pillar of the powerful rally of growth stocks. Moreover, low real yields are arithmetically necessary to justify the current level of market multiples exhibited by the S&P 500 (Chart I-9, bottom panel). Chart I-8The S&P 500 Is Vulnerable To A Correction
The S&P 500 Is Vulnerable To A Correction
The S&P 500 Is Vulnerable To A Correction
Chart I-9Falling Real Yields Have Helped Growth Stocks
Falling Real Yields Have Helped Growth Stocks
Falling Real Yields Have Helped Growth Stocks
Growth and high-P/E ratio stocks are heavily represented in the tech and healthcare sectors, which together account for 42% of the S&P 500. This means that higher yields will likely temporarily drag down the entire market. Ultimately, leadership changes are painful events, but they rarely mark the end of bull markets. Can Yields Move Up? Chart I-10Positive Signs For Inflation
Positive Signs For Inflation
Positive Signs For Inflation
It is time to tweak our bond market view because yields should soon move higher. For the past five months, we have written that yields offer minimal downside and that their asymmetric risk profile made government bonds an unappealing investment. We underweighted this asset class relative to stocks and recommended investors bet on higher inflation breakeven rates. However, forces are aligning to expect real rates to rise and thus, nominal yields should move up. The sequencing of the market’s response to QE increasingly favors lower bond prices. Our US Equity Strategy team recently highlighted that in 2009 stocks were the first asset to reflect the implementation of QE1 by the Fed.4 A weaker dollar followed. Bond yields started to perk up only after the USD deteriorated by enough, after stock prices had climbed by enough and after corporate spreads had narrowed by enough to ease financial conditions to stimulate the economy. So far, 2020 echoes the 2009 pattern and our Financial Conditions Index is more stimulatory than it was prior to the COVID-19 outbreak (see Chart III-36 in Section III). Chart I-11Commodities Point To Higher Yields...
Commodities Point To Higher Yields...
Commodities Point To Higher Yields...
Inflation momentum confirms the risks to bonds. The apex of the deflationary shock has already passed. In July, core CPI excluding shelter rose by 0.84% month-on-month, which was the highest reading since 1981 when the Fed was combating the most violent inflation outbreak in generations. The upturn in core producer prices also warns that the annual inflation rate of core CPI should accelerate meaningfully by early 2021 (Chart I-10). The dollar’s weakness is another inflationary force. Import prices from China have already bottomed, which points to an escalation in goods inflation in the coming months. Firming commodity prices constitute another risk for yields. Our Commodities Advance/Decline line has recently broken out. This technical development is consistent with higher commodity prices and higher bond yields (Chart I-11). Rallying natural resources are inflationary, but they also indicate that the global economy is strengthening, which should put upward pressure on real interest rates. Strength in the housing sector also confirms that government bond yields have upside. As we highlighted above, a robust housing market is an important validation that monetary policy is very accommodative. By definition, the objective of loose policy is to boost future economic activity and eradicate deflationary pressures. The surge in lumber indicates bond prices are showing downside risk (Chart I-12). Additionally, the upswing in mortgage issuance is occurring as the Treasury and corporations boost their borrowings, which will generate more demand to use savings generated in the economy. The price of those savings will be higher real interest rates. Chart I-12...Especially Lumber
...Especially Lumber
...Especially Lumber
The ebbing of COVID-19 also suggests that economic activity has scope to accelerate. Moreover, the House of Representatives reconvened to address the problems plaguing the US Postal Service ahead of the November elections. This early return to work gives Washington another opportunity to negotiate the stimulus bill that it failed to pass earlier this month. We still expect such a bill to ultimately become law because both Democrats and Republicans have too much to lose in November if the economy relapses in response of political paralysis. Declining infections and increased government support will bolster aggregate demand and put upward pressure on rates. The stock market’s near-term outlook remains marked by short-term froth that dampens our cyclical optimism. Market dynamics are also very negative for bonds. Our Valuation Index highlights that Treasurys are incredibly expensive (Chart I-13, top panel). Moreover, our Composite Technical Indicator remains overbought, though it has lost momentum. In this context, the lack of appetite for yield curve control or more QE demonstrated by the Federal Open Market Committee creates a genuine danger for bonds. Without these policies, bond yields will have trouble resisting the upward push created by our rising US Pipeline Inflation Pressures Index, our rebounding Nominal Cyclical Spending proxy (which is an average of the ISM Manufacturing headline index and Prices Paid component), and the uptick in the amount of liquidity sitting on commercial banks’ balance sheets (Chart I-14). Chart I-13Treasurys Are Expensive And Losing Momentum
Treasurys Are Expensive And Losing Momentum
Treasurys Are Expensive And Losing Momentum
Chart I-14Building Cyclical Risks For Bonds
Building Cyclical Risks For Bonds
Building Cyclical Risks For Bonds
Thus, equities are at risk on a tactical basis because we anticipate that 10-year Treasury yields may climb towards 1%, including a rise in TIPS yields. The US election creates an additional near-term hurdle for stocks. As we wrote last month, President Trump will likely become more belligerent toward the US’s trading partners in the coming months. Moreover, Vice-President Joe Biden, who has a comfortable lead in the polls including in key swing states such as Florida, Michigan, Pennsylvania, and Wisconsin wants to cancel half of the 2017 tax cuts.5 Small Over Big Long-term investors should expect stocks to beat bonds on a 5- to 10-year horizon, but equities will generate paltry real returns compared with the past 40 years. Elevated valuations for US equities are consistent with long-term annualized real rates of return of only 0.5% (Chart I-15). Moreover, the long-term outlook for profit margins is poor. As we wrote three months ago, mounting populism will result in redistributive policies that will lift the share of wages relative to GDP.6 Moreover, the shift of the US population to the left on economic matters will push up corporate tax rates. Increased labor costs and corporate taxes are negative for profit margins. If profit margins normalize, then equities will probably underperform the uninspiring expected returns implied by current market multiples. The surge in lumber indicates bond prices are showing downside risk. Investors can still generate generous returns through geographical and sectoral selection. We have highlighted how value stocks, industrials and materials, and EM and European equities will likely beat US equities.7 This month we will explore how US small-cap equities are also well placed to best the dismal projected real returns offered by their large-cap counterparts. Our BCA Relative Technical Indicator shows that small-cap stocks are 1.8-sigma oversold when compared with the S&P 500, which indicates a capitulation among investors toward these equities. The bifurcation is even greater if we compare small-cap equities with the S&P 100’s mega-caps that have driven up the US market in recent years. Incorporating these influences, our Cyclical Capitalization Indicator has moved in favor of small-cap stocks, which suggests that small-cap stocks will be rerated if the yield curve can steepen further (Chart I-16). Equities are at risk on a tactical basis because we anticipate that 10-year Treasury yields may climb towards 1%. Chart I-15Valuations And Profit Margins Threaten Long-Term Stock Returns
Valuations And Profit Margins Threaten Long-Term Stock Returns
Valuations And Profit Margins Threaten Long-Term Stock Returns
Chart I-16Indicators Favor Small Cap Stocks
Indicators Favor Small Cap Stocks
Indicators Favor Small Cap Stocks
Chart I-17A Debt Turnaround Would Help Small Cap Stocks
A Debt Turnaround Would Help Small Cap Stocks
A Debt Turnaround Would Help Small Cap Stocks
Debt dynamics could also increasingly beneficial to small-cap equities. In the past few years, the heavy debt-to-EBITDA of smaller firms created a major headwind for small-cap investors. The indebtedness of small-cap stocks often decreases relative to large-caps when an economic recovery begins. This shift in leverage portends an increase in small-caps’ relative future returns (Chart I-17). Our negative bias toward the dollar and our positive view on commodities also benefit small-cap stocks. Since the early 1990s, increasing real commodity prices and a falling Dollar Index have coexisted with a robust performance of small-cap firms (Chart I-18). The negative US balance-of-payment dynamics, coupled with escalating inflation risks, will continue to weigh on the dollar, especially as various large EM nations try to diversify their reserves and payment systems away from the dollar.8 Meanwhile, a declining dollar, expanding global growth, monetary debasement, populism, inflation and a lack of investment in supply, all will accentuate the appeal of natural resources. The sectoral bias of small-cap indices will capitalize on these trends. Chart I-18Small Is Beautiful
Small Is Beautiful
Small Is Beautiful
Chart I-19Small Cap Stocks Like Higher Yields
Small Cap Stocks Like Higher Yields
Small Cap Stocks Like Higher Yields
Finally, cyclical timing is also moving in favor of small-cap firms. Since 2014, the Russell 2000 has outperformed the S&P 500 when real yields moved higher (Chart I-19). Small-cap firms display a more marked pro-cyclicality than large firms. Additionally, the S&P 500 growth bias implies that the US large-cap benchmark underperforms the small cap indices when real yields increase. Mathieu Savary Vice President The Bank Credit Analyst August 27, 2020 Next Report: September 24, 2020 II. Global Semiconductor Stocks: A Hiatus Is Overdue In A Structural Bull Market The strength in global semiconductor sales in recent months has been due to one-off factors stemming from pandemic-related lockdowns. As the one-off demand surge subsides, global semiconductor sales will decline modestly toward the end of this year. In the near term, global semiconductor stock prices are vulnerable due to overbought conditions, excessive valuations and demand disappointment. The global semiconductor industry is at the epicenter of the US-China confrontation, and more US restrictions on chips sales to China are probable. This is another risk for this sector's share prices. Nevertheless, the structural outlook for global semiconductor demand is constructive. Its CAGR may rise from 3% during 2014-2019 to 5% during 2020-2024. Investor euphoria has taken hold of semiconductor stocks. Global semiconductor stock prices have skyrocketed by 68% from March lows and 96% from December 2018 lows. Meanwhile, global semiconductor sales during March-June rose only by 5% from a year ago. As a result, the ratio of market cap for global semiconductor stocks relative to global semiconductor sales has reached its highest level since at least the inception of data in 2003 (Chart II-1). Chart II-1Global Semi Sector: Market Cap-To-Sales Ratio Has Surged
Global Semi Sector: Market Cap-To-Sales Ratio Has Surged
Global Semi Sector: Market Cap-To-Sales Ratio Has Surged
With semi equity multiples very elevated, their share prices have become even more sensitive to global semiconductor demand growth. Hence, the focus of this report is to try to gauge the strength of global semiconductor demand, both in the near term and structurally. The strength in global semiconductor sales in recent months has been due to one-off factors stemming from the lockdowns. Near-term semiconductor stock prices could disappoint due to weak chip demand from the smartphone sector and diminishing purchases of personal computers (PCs) and servers. However, structurally, we are positive on global semiconductor demand, which is underpinned by the continuing rollout of 5G networks and phones, a wider adoption of data centers, and further technological advancements in artificial intelligence (AI), cloud computing, edge computing and smaller nodes for chip manufacturing (Box II-1). Box II-1 Key Technologies Underpinning Potential Global Semiconductor Demand AI refers to the simulation of human intelligence in machines, for example, computers that play chess and self-driving cars. The goals of AI include learning, reasoning and perception. Cloud computing is the delivery of computing services – including servers, storage, databases, networking, software, analytics and intelligence – over the Internet (“the cloud”) to offer faster innovation, flexible resources and economies of scale. Edge computing is a form of distributed computing, which brings computation and data storage closer to where it is needed, to improve response times and save bandwidth. Technology node refers to the width of line that can be processed with a minimum width in the semiconductor manufacturing industry, such as technology nodes of 10 nanometers (nm), 7nm, 5nm and 3nm. The smaller the nodes are, the more advanced they are. Near-Term Headwinds Semiconductor demand worldwide grew by 6% year-on-year in the first half of this year. There has been a remarkable divergence between world semiconductor sales and the global business cycle (Chart II-2). The divergence between semiconductor sales and economic activity was most striking in the US and China. Semiconductor sales in China rose by 5% year-on-year in Q12020, and in the US they grew by 29% year-on-year in Q22020, despite a contraction in their aggregate demand during the same period. By contrast, Q2 annual growth of semiconductors sales was -2.2% for Japan, -17% for Europe and 1.8% for Asia ex. China and Japan (Chart II-3). Chart II-2World Semi Sales Diverged From The Global Business Cycle
World Semi Sales Diverged From The Global Business Cycle
World Semi Sales Diverged From The Global Business Cycle
Chart II-3Strong Semi Sales In The US And China, But Not Elsewhere
Strong Semi Sales In The US And China, But Not Elsewhere
Strong Semi Sales In The US And China, But Not Elsewhere
The reasons why the US and China posted a surge in semiconductor demand while Europe and Japan experienced a contraction in domestic semiconductor sales are as follows: Most data center investment is occurring in the US and China. Chart II-4 shows that 40% of global hyperscale data centers are operating in the US, much larger than any other countries/regions. China, in turn, ranked second, with a global share of 8%. Chart II-4The US Has The Most Global Hyperscale Data Centers
September 2020
September 2020
Demand contraction in Europe and Japan is due to semiconductor demand in these regions mainly originating from the automobile sector, where production was severely hit by the global pandemic. About 37% of European semiconductor sales were from last year’s automotive market. We believe the divergence between global economic activity and semiconductor sales, as demonstrated by Chart II-2 on page 3, has been due to one-off factors, as the global pandemic lockdowns have spurred semiconductor demand. Such a one-off demand boost will likely dissipate in the coming months. Traditional PCs and tablets: There has been a surge in demand for traditional PCs9 and tablets in the past six months. This was due to the significant increase in online activities, such as working from home, education, e-commerce, gaming and entertainment. Data from the International Data Corporation (IDC) has revealed that shipments of traditional PCs and tablets in volume terms had a strong year-on-year growth of 11.2% and 18.6%, respectively, in the period of April-June (Chart II-5). Looking forward, even renewed lockdowns will not lead to a similar rush to buy these products. Many households are already equipped to work from home and for other online activities. With many countries gradually opening their economies, such demand will diminish. The traditional PC and tablet sectors together account for about 13% of global chip demand (Chart II-6). Chart II-5Personal Computers Sales Have Surged Amid Lockdowns
Personal Computers Sales Have Surged Amid Lockdowns
Personal Computers Sales Have Surged Amid Lockdowns
Server demand: Another major semiconductor demand contribution in Q2020 was from the server sector, which spiked by 21% year-on-year (Chart II-7). The surge in online activities triggered a strong demand for cloud services and remote work applications, both of which require computer servers to run on. Chart II-6The Breakdown Of Global Semiconductor Sales By Type Of Usage
September 2020
September 2020
However, demand from the server sector is also set to diminish in 2H2020 and Q1 2021. Provided the inventories at major data center operators, including Microsoft, Google and Amazon, remain at high levels,10 global cloud service providers will likely reduce their orders of servers next quarter.11 Enterprises will also likely cut their investment in computer servers in 2H2020, as many of them had already increased their purchases of servers to prepare employees and business processes for remote working. We expect global server demand growth to soften in 2H2020. The Digitimes Research forecasted a 5.6% quarter-on-quarter contraction in 3Q2020 and a further cut in global sever shipment in the 4Q2020.10 The global server sector accounts for about 10% of global chip demand and, together with PCs and tablets, they make for 23% (please refer to Chart II-6 on page 5). Further, the smartphone sector – accounting for 27% of global semiconductor demand – will continue struggling in H2 this year. Chart II-7Server Sales Have Surged Amid Lockdowns
Server Sales Have Surged Amid Lockdowns
Server Sales Have Surged Amid Lockdowns
Chart II-8Global Smartphone Shipments Will Likely Remain Weak In 2020H2
Global Smartphone Shipments Will Likely Remain Weak In 2020H2
Global Smartphone Shipments Will Likely Remain Weak In 2020H2
The global total smartphone demand has been hit severely, as households delayed their new smartphone purchases. According to Canalys’ data, global smartphone shipments dropped by 13% and 14% year-on-year in Q1 and Q2, respectively. We expect smartphone shipments to continue contracting over the next three-to-six months (Chart II-8). We believe global consumers will remain cautious in their spending on discretionary goods, such as smartphones, due to lowered incomes and increased job uncertainty. The IDC also forecasted that global smartphone shipments would not grow until 1Q2021.12 The Chinese smartphone sales showed a considerable weakness in July, with a 35% year-on-year contraction, which is much deeper than the 20% decline in H1 this year. 5G smartphone shipments also slowed last month, with a 21% drop from the previous month. The global semiconductor industry is at the epicenter of the US-China confrontation. Bottom Line: The strength in global semiconductor sales in recent months has been due to one-off factors stemming from the lockdowns. As this one-off demand subsides, global semiconductor sales will decline modestly toward the end of this year. Given the overbought conditions and the elevated equity valuations, global semiconductor stocks are currently vulnerable to near-term disappointments in semiconductor demand. At The Epicenter Of The US-China Rivalry Semiconductors are at the epicenter of the US-China confrontation. Ultimately, the US-China contention is about future technological dominance. That is access to technology and the capability to develop new technologies. China currently accounts for about 35% of the global semiconductor demand. US restrictions on semi producers worldwide to supply semiconductors to Chinese buyers constitute a major risk to semiconductor stock prices. On August 17, the US announced fresh sanctions that restrict all US and foreign semiconductor companies from selling chips developed or produced using US software or technology to Huawei, without first obtaining a license. In May, the US had already limited companies, such as the Taiwan Semiconductor Manufacturing Company (TSMC), from making and supplying Huawei with its self-designed chips. In addition, the US recently threatened bans on Chinese-owned apps TikTok and WeChat, and signaled that it could soon restrict Alibaba’s operations in the US. Chart II-9Global Semi Companies' Sales To China Are Substantial
September 2020
September 2020
The global semiconductor sector is highly vulnerable to further escalation in the tension between these two superpowers. Major global semiconductor companies’ sales are heavily exposed to China, and their revenue from China ranges from 16% to 50% of total (Chart II-9). We have been puzzled why global semi share prices have been rallying in spite of US limitations on semiconductor shipments to Huawei and its affiliated entities. One explanation could be that the Chinese companies that are not affiliated with Huawei are able to import semiconductors and then supply them to Huawei. If this is true, the US will have no other choice but to limit all semiconductor sales to China. This will be devastating for global semi producers given their large exposure to China. In anticipation of US punitive policies limiting its access to semiconductors, China had boosted its semiconductor imports over the past 12 months (Chart II-10, top panel). Chinese imports of integrated circuits rose by 12% year-on-year in 1H2020, which is much higher than the 5% year-on-year increase in Chinese semiconductor demand during the same period (Chart II-10, bottom panel). This gap suggests the country had restocked its semiconductor inventories. China has particularly restocked its imports of non-memory chips with imports of processor & controller and other non-memory chips in H1, surging by 30% and 20%, respectively, in US dollar terms (Chart II-11). For memory chips, the contraction in Chinese imports was mainly due to a decline in global memory chip prices. Chart II-10China Had Likely Restocked Its Semi Inventories
China Had Likely Restocked Its Semi Inventories
China Had Likely Restocked Its Semi Inventories
Chart II-11Strong Chinese Imports In Non-Memory Chips
Strong Chinese Imports In Non-Memory Chips
Strong Chinese Imports In Non-Memory Chips
Bottom Line: The global semiconductor industry is at the epicenter of the US-China confrontation, and more restrictions on sales to China are probable. In turn, the restocked semiconductor inventory in China raises the odds of weakening mainland semiconductor import demand in H2 of this year. Structural Tailwinds Table II-1Global Semiconductor Demand CAGR Forecast Over 2020-2024 By Device
September 2020
September 2020
We are optimistic on structural global semiconductor demand. Its nominal CAGR may rise from 3% during 2014-2019 to 5% during 2020-2024 in US dollar terms. Table II-1 shows our demand growth forecasts for global chips in the main consuming sectors over the next five years. The major contributing sectors during 2020-2024 will be 5G smartphones, servers, industrials, electronics and automotive manufacturing. The underlying driving forces are the continuing rollout of 5G networks and phones, the development of data centers, and further technological advancements in AI, cloud computing and edge computing. Currently, the world is still in the early stages of 5G network development. AI, cloud computing and edge computing are constantly evolving. With increasing adoption of 5G smartphones, computer servers and IoT devices, global semiconductor demand is in a structural uptrend (Box II-2). Box II-2 Key Components For The Virtual World In Development Data centers and cloud computing allow data to be stored and applications to be running off-premises and to be accessed remotely through the internet. Edge computing allows data from Internet of things (IoT) devices to be analyzed at the edge of the network before being sent to a data center or cloud. IoT devices contain sensors and mini-computer processors that act on the data collected by the sensors via machine learning. The IoT is a growing system of billions of devices — or things — worldwide that connect to the internet and to each other through wireless networks. AI technology empowers cloud computing, edge computing and IoT devices. 5G is at the heart of the IoT industry transformation, making a world of everything connected possible. Chart II-125G Phone Shipments In China Will Continue To Rise
5G Phone Shipments In China Will Continue To Rise
5G Phone Shipments In China Will Continue To Rise
5G Smartphone Currently, China is the world’s largest 5G-smartphone consumer and the leading 5G-adopter in the world. According to Digitimes Research, global 5G smartphone shipments will reach over 250 million units in 2020, with 170 million (68%) in China and only 80 million units in the world ex. China. Looking forward, 5G smartphone shipments are set to accelerate worldwide over the coming years. The 5G phone shipments in China will continue to rise. The 5G phone sales penetration rate in China is likely to rise from 60% in July to 95% by the end of 2022. In such a case, we estimate that the monthly Chinese 5G phone shipments will increase from the current 16 million units to about 25-30 million units in 2022 (Chart II-12). In the rest of the world, the 5G smartphone adoption pace will also likely speed up over the next five years. The 5G phone selling prices in the world outside China will drop, as more models are introduced and become more affordable. 5G smartphone prices have already fallen in China and will inevitably fall elsewhere. Chinese 5G smartphone producers will ship their low-priced 5G phones overseas, putting pressure on other producers to lower their prices. The 5G infrastructure development is accelerating in China and will accelerate in the rest of the world. Both China and South Korea have been very aggressive in their respective 5G network development. As of the end of June, China's top three carriers: China Mobile, China Unicom, and China Telecom – which together serve more than 1.6 billion mobile users in the country – had installed 400,000 5G base stations against an annual target of 500,000. In comparison, as of April 2020, American carriers had only put up about 10,000 5G base stations.13 As the US is competing with China on the 5G front, the country will likely boost its investment in 5G network development aggressively over the next five years in order to catch up to, or even exceed, China. Importantly, the 5G smartphone has more silicon content than 4G smartphones. More silicon content means higher semiconductor value. Rising 5G smartphone sales and higher silicon content together will more than offset the loss in semiconductor sales due to falling global 4G smartphone shipments. Overall, global semiconductor stock prices have diverged from their sales and profits. Based on our analysis, we expect a CAGR growth of 4% in semiconductor demand from the global smartphone sector over the next five years, slightly lower than the 5% in previous five years (Table II-1 on page 10). This also takes into consideration that the 5G network will be more difficult and more expensive to develop than the 4G network. Servers Global server shipment growth will be highly dependent on both the pace and the scale of data center development (Box II-3). Data centers account for over 60% of global server demand. Box II-3 Data Centers There are four main types of data centers – enterprise data centers, managed services data centers, colocation data centers, and cloud data centers. Data centers can have a wide range of number of servers. Corporate data centers tend to have either 200 (small companies), or 1000 servers (large companies). In comparison, a hyperscale data center usually has a minimum of 5,000 servers linked with an ultra-high speed, high fiber count network. Outsourcing and a move towards the cloud are driving the growth of the hyperscale data center. Instead of companies investing in physical hardware, they can rent server space from a cloud provider to both save their data and reduce costs. Amazon, Microsoft, Google, Apple and Alibaba are all top global cloud service providers. The more hyperscales to be built up, the higher the demand for servers. In 2019, about 13% of the total number of data centers in China were of the hyperscale and large-scale varieties. The plan of new infrastructure development announced earlier this year by Beijing was aiming to increase the number of hyperscale and large-scale data centers in China. Among current data centers either under construction or to be developed in the near future, 36% of them are hyperscale and large-scale data centers. The future growth of data centers is promising. The global trend of data localization14 due to the concerns of data privacy and national security will also bolster a boom of data centers over the next five years. A growing number of countries are adopting data localization requirements, such as China, Russia, Indonesia, Nigeria, Vietnam and some EU countries. While the Chinese data center market is expected to expand by a CAGR of about 28% over 2020-2022,15 a report recently released by Technavio forecasted the global data center industry’s CAGR at over 17% during 2019-2023. We forecast that the global semiconductor demand from servers will grow at a CAGR of 12% over 2020-2024. IoTs Technological advancements in AI, cloud computing and edge computing, in combination with 5G network development, will facilitate the IoTs adoption. According to the GSMA,16 46 operators in 24 markets had launched commercially available 5G networks by 30 January 2020. It forecasted that global IoT connections will be increased from 12 billion mobile devices in 2019 to 25 billion in 2025 with a CAGR at 13%.17 IoTs chips include the Artificial Intelligence of Things (AIoT) – a powerful convergence of AI and the IoT. IoTs is an interconnected network of physical devices. Every device in the IoT is capable of collecting and transferring data through the network. Looking forward, global demand of AI chips and IoT chips will have significant potential to grow with creation of “smarter manufacturing”, “smarter buildings”, “smarter cities”, etc. AI applications can be used in manufacturing processes to render them smarter and more automated. Productivity will be enhanced as machines achieve significantly improved uptime while also reducing labor costs. There are plenty of upsides in industrial semiconductor demand (Chart II-13). We expect the CAGR of industrial electronics to increase from 3.4% during 2014-2019 to 8% during 2020-2024. AI applications can create smart buildings by increasing connectivity across enterprise assets, enabling home network infrastructure (e.g., routers and extenders) and employing home-security devices (e.g., cameras, alarms and locks). AI applications can be used to create smart cities. A smart city is an urban area that uses different types of IoT electronic sensors to collect data. Insights gained from that data are used to manage assets, resources and services efficiently; in return, that data is used improve operations across the city. China has already developed about 750 trial sites of smart cities with different degrees of smartness in the past decade. As AI and 5G technology advances, the existing smart cities’ “smartness” will be upgraded and new trial smart cities will be implemented. Based on IDC data, China’s investment in smart cities will rise at a CAGR of 13.5% over 2020-2023 (Chart II-14). Globally, the U.S., Japan, European countries and other nations are also actively developing smart cities. According to a new study conducted by Grand View Research, the global smart cities market size is expected to grow at a CAGR of 24.7% from 2020 to 2027.18 Chart II-13Plenty Of Upside In Industrial Semi Demand
Plenty Of Upside In Industrial Semi Demand
Plenty Of Upside In Industrial Semi Demand
Chart II-14China’s Investment In Smart Cities Will Continue To Grow
September 2020
September 2020
Automotive We expect the global automotive chip market to grow at a CAGR of 9% during 2020-2024, as in 2014-2019. The increase in consumption of semiconductors by the auto industry will continue to be driven by the market evolution toward autonomous, connected, electric and shared mobility. Most new vehicles now include some level of advanced driver assist systems (ADAS), such as adaptive cruise control, automatic brakes, blind spot monitoring, and parallel parking. The whole industry is progressing toward fully autonomous vehicles in the coming years. Increasing adoption of automotive chips and recovering car sales will revive automotive chip sales. In addition, rising penetration of new energy vehicles (NEVs) is beneficial to semiconductor sales, as NEVs contain higher semiconductor content than conventional vehicles. Conventional vehicles contain an average of a $330 value of semiconductor content while hybrid electric vehicles can contain up to $1,000 and $3,500 worth of semiconductors.19 Regarding other sectors, we are also positive on structural demand of storage and consumer electronics. AI applications generate vast volumes of data — about 80 exabytes per year, which is expected to increase by about tenfold to 845 exabytes by 2025.20 In addition, developers are now using more data in AI and deep learning (DL) training, which also increases storage requirements. With massive potential demand for storage, we estimate a CAGR of 7% over 2020-2024 (Table II-1 on page 10). A recent report from ABI Research predicts that the COVID-19 pandemic will increase global sales of wearables (such as a Fitbit or Apple Watch) by 29% to 30 million shipments of the devices this year. With contribution from wearables, we expect global semiconductor demand from the consumer sector to grow at a CAGR of 3% over 2020-2024, the same rate as in the previous five years. Bottom Line: Continuing rollout of 5G networks and phones, development of data centers, and further technological advancements in AI and cloud computing will provide tailwinds to structural global semiconductor demand, accelerating its CAGR growth from 3% during 2014-2019 to 5% during 2020-2024. Valuations And Investment Conclusions Most global semiconductor stocks are currently over-hyped. Critically, both DRAM and NAND prices have been deflating since January, reflecting weak demand for memory chips. Yet, share prices of memory producers have rallied (Chart II-15). Overall, global semiconductor stock prices have diverged from their sales and profits (Chart II-16). Chart II-15Falling Memory Prices Pose Risk To Memory Stocks
Falling Memory Prices Pose Risk To Memory Stocks
Falling Memory Prices Pose Risk To Memory Stocks
Chart II-16Global Semiconductor Stocks Have Deviated From Profits
Global Semiconductor Stocks Have Deviated From Profits
Global Semiconductor Stocks Have Deviated From Profits
Consequently, the multiples of semiconductor stocks have spiked to multi-year highs (Chart II-17). Even after adjusting for negative US real bond yields, valuations of semiconductor stocks are not cheap. Chart II-18 illustrates the equity risk premium for global semiconductor stocks is at the lower end of its range of the past 10 years. The ERP is calculated as forward earnings yield minus 10-year US TIPS yields. Chart II-17Global Semi Stocks: Elevated Valuations
Global Semi Stocks: Elevated Valuations
Global Semi Stocks: Elevated Valuations
Chart II-18Equity Risk Premium For Global Semi Stocks Is Historically Low
Equity Risk Premium For Global Semi Stocks Is Historically Low
Equity Risk Premium For Global Semi Stocks Is Historically Low
It is impossible to time a correction or know what the trigger would be (US-China tensions have been our best guess). Nevertheless, we do not recommend chasing semiconductor stocks higher due to their overstretched technicals and valuations on the one hand and potential weakening demand in H2 on the other. In addition, the ratio of global semi equipment stock prices relative to the semi equity index correlates with absolute share prices of global semi companies. This is because equipment producers are higher-beta as they outperform during growth accelerations and underperform during growth slumps. The basis is that semi manufacturers have to purchase equipment if there is actual strong demand coming up and vice versa. The recent underperformance by global semi equipment stocks relative to the semi equity index might be an early sign of a potential reversal in semi share prices in absolute terms (Chart II-19). Chart II-19A Signal Of A Potential Reversal In Semi Share Prices
A Signal Of A Potential Reversal In Semi Share Prices
A Signal Of A Potential Reversal In Semi Share Prices
Meanwhile, we believe the subsector- memory chip stocks - will outperform the overall semiconductor index amidst the potential correction, because they have lagged and are less over-extended. Finally, we remain neutral on Taiwanese and Korean bourses within the EM equity space for now. Escalation in US-China confrontation, as well as their exposure to semiconductors, put these bourses at near-term risk. That said, we are reluctant to underweight these markets because fundamentals in EM outside North Asia remain challenging. Ellen JingYuan He Associate Vice President Emerging Markets Strategy III. Indicators And Reference Charts We continue to favor stocks at the expense of bonds, but equities are increasingly vulnerable because short-term sentiment and positioning measures are growing increasingly stretched. Three forces can prompt a correction. First, a rebound in yields toward 1% would cause turbulence for the S&P 500, because the index is dominated by growth stocks that are highly sensitive to fluctuations in the risk-free rate. Second, a dollar bounce would hurt the S&P 500 because a depreciating USD has fueled the US stock market rally since June. Finally, the US presidential election is drawing nearer; hence, the risk of potentially damaging political headlines is growing. Despite these short-term risks, the main pillar supporting the rally remains intact: global monetary conditions are highly accommodative and the chance of inflation moving high enough to spook central bankers is minimal in the near future. Additionally, the fiscal spigots are open and governments around the world will ultimately continue to support their economies. Hence, any correction in the S&P 500 is unlikely to move beyond 15% or a level of 2900. Our cyclical indicators confirm the positive backdrop for stocks. While our Valuation Indicator has reached overvalued territory, our Monetary Indicator remains extremely accommodative. Moreover, our Technical Indicator is now flashing a clear buy signal. Putting all those forces together, our Intermediate-Term Indicator continues to support equities. Finally, our Revealed Preference Indicator strongly argues in favor of staying invested in equities. That being said, our Speculation Indicator has surged back up, thus the volatility of the rally should increase. Bonds remain extremely unappealing. Our Bond Valuation Index shows Treasurys as prohibitively expensive and our Composite Technical Indicator continues to lose momentum. So far, government bond yields have managed to remain stable at very low levels even if they have not declined further. Nonetheless, bonds have underperformed equities, which is a trend that will remain in place for many more quarters. Moreover, the pick-up in commodity prices and in various gauges of the business cycle suggests that bond yields should soon move higher, especially because the Fed is far from enthused at the concept of yield curve control. Our Cyclical Bond Indicator has turned higher and will soon flash an outright sell signal. The dollar continues to weaken after its recent breakdown. For now, the USD’s weakness has been concentrated among DM currencies. For the dollar to weaken further, EM currencies must begin to rally more markedly than they have until now, especially in Latin America. The firmness of the CNY is a good sign for the EM complex, but another clear up-leg in global growth must emerge before EM currencies can fully blossom. As a result, we are likely to have entered a temporary period of consolidation for the US dollar. The extremely oversold nature of our Dollar Composite Technical Indicator supports the idea that the dollar needs to digest its recent losses before its poor fundamentals force it lower once again. Finally, commodities have been a prime beneficiary of the weakness in the dollar and the combination of stable yields and improving economic activity. Our Composite Technical Indicator is now well into overbought territory which makes natural resource prices vulnerable to a pullback. A move up in yields as well as a short-term rebound in the dollar will likely catalyze any underlying technical risks to commodities. Gold will be particularly vulnerable to any such pullback, especially if higher real yields are the cause of the correction in natural resource prices. Despite these short-term worries, the outlook for commodities remains bright. As a result, we would use any correction to add exposure to the commodity complex. EQUITIES: Chart III-1US Equity Indicators
US Equity Indicators
US Equity Indicators
Chart III-2Willingness To Pay For Risk
Willingness To Pay For Risk
Willingness To Pay For Risk
Chart III-3US Equity Sentiment Indicators
US Equity Sentiment Indicators
US Equity Sentiment Indicators
Chart III-4Revealed Preference Indicator
Revealed Preference Indicator
Revealed Preference Indicator
Chart III-5US Stock Market Valuation
US Stock Market Valuation
US Stock Market Valuation
Chart III-6US Earnings
US Earnings
US Earnings
Chart III-7Global Stock Market And Earnings: Relative Performance
Global Stock Market And Earnings: Relative Performance
Global Stock Market And Earnings: Relative Performance
Chart III-8Global Stock Market And Earnings: Relative Performance
Global Stock Market And Earnings: Relative Performance
Global Stock Market And Earnings: Relative Performance
FIXED INCOME: Chart III-9US Treasurys And Valuations
US Treasurys And Valuations
US Treasurys And Valuations
Chart III-10Yield Curve Slopes
Yield Curve Slopes
Yield Curve Slopes
Chart III-11Selected US Bond Yields
Selected US Bond Yields
Selected US Bond Yields
Chart III-1210-Year Treasury Yield Components
10-Year Treasury Yield Components
10-Year Treasury Yield Components
Chart III-13US Corporate Bonds And Health Monitor
US Corporate Bonds And Health Monitor
US Corporate Bonds And Health Monitor
Chart III-14Global Bonds: Developed Markets
Global Bonds: Developed Markets
Global Bonds: Developed Markets
Chart III-15Global Bonds: Emerging Markets
Global Bonds: Emerging Markets
Global Bonds: Emerging Markets
CURRENCIES: Chart III-16US Dollar And PPP
US Dollar And PPP
US Dollar And PPP
Chart III-17US Dollar And Indicator
US Dollar And Indicator
US Dollar And Indicator
Chart III-18US Dollar Fundamentals
US Dollar Fundamentals
US Dollar Fundamentals
Chart III-19Japanese Yen Technicals
Japanese Yen Technicals
Japanese Yen Technicals
Chart III-20Euro Technicals
Euro Technicals
Euro Technicals
Chart III-21Euro/Yen Technicals
Euro/Yen Technicals
Euro/Yen Technicals
Chart III-22Euro/Pound Technicals
Euro/Pound Technicals
Euro/Pound Technicals
COMMODITIES: Chart III-23Broad Commodity Indicators
Broad Commodity Indicators
Broad Commodity Indicators
Chart III-24Commodity Prices
Commodity Prices
Commodity Prices
Chart III-25Commodity Prices
Commodity Prices
Commodity Prices
Chart III-26Commodity Sentiment
Commodity Sentiment
Commodity Sentiment
Chart III-27Speculative Positioning
Speculative Positioning
Speculative Positioning
ECONOMY: Chart III-28US And Global Macro Backdrop
US And Global Macro Backdrop
US And Global Macro Backdrop
Chart III-29US Macro Snapshot
US Macro Snapshot
US Macro Snapshot
Chart III-30US Growth Outlook
US Growth Outlook
US Growth Outlook
Chart III-31US Cyclical Spending
US Cyclical Spending
US Cyclical Spending
Chart III-32US Labor Market
US Labor Market
US Labor Market
Chart III-33US Consumption
US Consumption
US Consumption
Chart III-34US Housing
US Housing
US Housing
Chart III-35US Debt And Deleveraging
US Debt And Deleveraging
US Debt And Deleveraging
Chart III-36US Financial Conditions
US Financial Conditions
US Financial Conditions
Chart III-37Global Economic Snapshot: Europe
Global Economic Snapshot: Europe
Global Economic Snapshot: Europe
Chart III-38Global Economic Snapshot: China
Global Economic Snapshot: China
Global Economic Snapshot: China
Mathieu Savary Vice President The Bank Credit Analyst Footnotes 1 Please see The Bank Credit Analyst "April 2020," dated March 26, 2020, available at bca.bcaresearch.com 2 Please see The Bank Credit Analyst "July 2020," dated June 25, 2020, available at bca.bcaresearch.com 3 Please see European Investment Strategy "An Economy Without Mouths Or Noses Will Lose 10 Percent Of Jobs," dated July 30, 2020, available at eis.bcaresearch.com 4 Please see US Equity Strategy "Inversely Correlated," dated August 25, 2020, available at uses.bcaresearch.com 5 Please see The Bank Credit Analyst "August 2020," dated July 30, 2020, available at bca.bcaresearch.com 6 Please see The Bank Credit Analyst "June 2020," dated May 28, 2020, available at bca.bcaresearch.com 7 Please see The Bank Credit Analyst "August 2020," dated July 30, 2020, available at bca.bcaresearch.com 8 Diversifying away from the dollar does not mean that the USD will lose its reserve status. However, a return to the share of FX reserves that prevailed in the first half of the 1990s will hurt the dollar, especially because the US net international investment position has fallen from -4.6% of GDP in 1992 to -57% today. 9 Traditional PCs are comprised of desktops, notebooks, and workstations. 10 Global server shipments to contract 5.6% sequentially in 3Q2020, says Digitimes Research 11 Global server shipments forecast to increase by 5% this year: TrendForce 12 IDC Expects Worldwide Smartphone Shipments to Plummet 11.9% in 2020 Fueled by Ongoing COVID-19 Challenges 13 America does not want China to dominate 5G mobile networks 14 “Data localization” can be defined as the act of storing data on a device that is physically located within the country where the data was created. Data localization requirements are governmental obligations that explicitly mandate local storage of personal information or strongly encourage local storage through data protection laws that erect stringent legal compliance obligations on cross-border data transfers. 15 The big data center industry ushered in another outbreak 16 The GSMA represents the interests of mobile operators worldwide, uniting more than 750 operators with almost 400 companies in the broader mobile ecosystem, including handset and device makers, software companies, equipment providers and internet companies, as well as organizations in adjacent industry sectors. 17 GSMA: 5G Moves from Hype to Reality – but 4G Still King 18 Smart Cities Market Size Worth $463.9 billion By 2027 19 The Automotive Semiconductor Market – Key Determinants of U.S. Firm Competitiveness 20 AI is data Pac-Man. Winning requires a flashy new storage strategy.
Highlights Negative Rates: The persistence of the COVID-19 pandemic is intensifying pressure on policymakers in many countries to provide more stimulus. The odds that a new central bank will join the negative policy interest rate club are increasing. UK vs. New Zealand: Recent comments from Bank of England and Reserve Bank of New Zealand officials have hinted at the possibility of a shift to negative policy rates, should conditions warrant. The odds are greater for such a move in New Zealand. Go long 10-year New Zealand government bonds versus 10-year UK Gilts (currency-hedged into GBP) on tactical (0-6 months) basis. Feature Policymakers around the world are, once again, under increasing pressure to contemplate new responses to the COVID-19 pandemic, which continues to rage through much of the US and emerging world and is flaring up again across Europe. Additional fiscal policy measures will likely be necessary, but it is increasingly politically difficult in many countries to ramp up government support measures – or even extend existing programs - after the massive increase in deficits and debt undertaken this past spring. Chart of the WeekA Bull Market In Negative-Yielding Debt
A Bull Market In Negative-Yielding Debt
A Bull Market In Negative-Yielding Debt
An inadequate fiscal response will put even more pressure on monetary policy to give a boost to virus-stricken economies. Yet fresh options there are even more limited. Policy rates are already near 0% in all developed nations, with central banks promising to keep them there for at least the next couple of years. Central banks are also rapidly expanding their balance sheets to buy up assets via quantitative easing programs. A move to sub-0% policy rates may be the next option for central banks not already there like the ECB and the Bank of Japan. Although it remains questionable how much more stimulus monetary policy could hope to deliver. Government bond yields are at or near historic lows in most countries, while equity and credit markets continue to enjoy a spectacular recovery from the rout in February and March. The stock of global negative-yielding debt has risen to $16 trillion, according to Bloomberg, which remains close to the highs seen over the past few years (Chart of the Week). So who will be the next central bank to cross that bridge into negative rate territory? US Federal Reserve Chairman Jerome Powell, Bank of Canada Governor Tiff Macklem and Reserve Bank of Australia Governor Philip Lowe have all publicly dismissed the need for negative rates in their economies. Recent comments from Bank of England (BoE) Governor Andrew Bailey and Reserve Bank of New Zealand (RBNZ) Governor Adrian Orr, however, have suggested that negative rates could be a future policy choice, if needed. New Zealand looks like the more likely candidate to go to negative rates sometime in the next 3-6 months. Markets are increasingly discounting those outcomes. The UK Gilt yield curve is trading below 0% out to the 6-year maturity, while New Zealand nominal government bond yields are trading at or below a mere 0.3% out to 7-years (and where real yields on inflation-linked bonds have recently turned negative). Of the two, New Zealand looks like the more likely candidate to go to negative rates sometime in the next 3-6 months. A Negative Rates Checklist For The UK & New Zealand In a Special Report we published back in May, we looked back at the decisions that drove the move to negative policy rates by the ECB, Bank of Japan, Swiss National Bank and the Riksbank, with a goal of determining if such an outcome could happen elsewhere.1 We were motivated by the growing market chatter suggesting that the Fed would eventually be forced to cut the fed funds rate to sub-0% territory to fight the deep COVID-19 recession. Chart 2The Fundamental Case For Negative Rates
The Fundamental Case For Negative Rates
The Fundamental Case For Negative Rates
We concluded in that report that such a move was unlikely, but could occur if there was a contraction in US credit growth and/or a spike in the US dollar to new cyclical highs, both outcomes that would result in a major drop in US inflation expectations. Such moves preceded the shift to negative rates in those other countries during 2014-16, as a way to lower borrowing costs and weaken currencies. Since that May report, the US dollar has depreciated and US credit growth has continued to expand amid very stimulative financial conditions, thus the odds of the Fed having to cut the funds rate below 0% are very low. The Fed is far more likely to dovishly alter its forward guidance, or even institute yield curve control to cap US Treasury yields, to deliver additional monetary easing, if necessary. (NOTE: next week, we will be discussing the Fed’s next possible policy moves, and the potential impact on financial markets, in a Special Report jointly published with our colleagues at BCA Research US Bond Strategy). The pressure to consider negative interest rates in the non-negative rate developed market countries remains strong, however, after the major increase in unemployment rates and sharp falls in inflation seen earlier this year (Chart 2). Putting current levels of both into a simple Taylor Rule formula suggests that the “appropriate” level of nominal policy rates is currently negative in the US and Canada, mainly because of the double-digit unemployment rates in those countries. Taylor Rules for the UK and New Zealand remain slightly positive, however, at 0.2% and 0.9%, respectively. Yet the forecasts for inflation and unemployment from the BoE and RBNZ suggest a diverging dynamic between the two over the next couple of years. The BoE is forecasting a very sharp recovery from the 2020 recession, with the UK unemployment rate projected to fall back to 4.7% by 2022 from the surge to 7.5% this year. At the same time, the RBNZ’s forecasts are more cautious, with the New Zealand unemployment rate expected to fall to only 6.1% in 2022 from the projected 8.1% peak at the end of this year. Thus, the implied Taylor Rules using those forecasts suggest a need for negative rates in New Zealand, but a rising path for UK policy rates over the next two years (Chart 3). Clearly, markets are taking the RBNZ’s open talk about negative interest rates to heart, while remaining skeptical that the BoE’s optimistic path for the post-virus UK economy will come to fruition. Despite the diverging trajectory in policy rates implied by the two central banks’ forecasts, markets are pricing in a more similar path for rates. Forward overnight index swap (OIS) rates are discounting slightly negative rates in the UK and New Zealand to the end of 2022 (Chart 4). Clearly, markets are taking the RBNZ’s open talk about negative interest rates to heart, while remaining skeptical that the BoE’s optimistic path for the post-virus UK economy will come to fruition. Chart 3Mapping Central Bank Projections Into The Taylor Rule
Mapping Central Bank Projections Into The Taylor Rule
Mapping Central Bank Projections Into The Taylor Rule
Chart 4Markets Pricing Slightly Negative Rates In The UK & NZ
Markets Pricing Slightly Negative Rates In The UK & NZ
Markets Pricing Slightly Negative Rates In The UK & NZ
The individual cases of the UK and New Zealand as current candidates for negative interest rates can help derive a list of factors to monitor to determine if negative rates would be a more likely policy outcome for any central bank. Based on our read of recent comments from BoE and RBNZ officials, combined with our assessment of what took place in other countries that moved to negative rates in the past, we would include the following in any Negative Rates Checklist: Policymaker perceptions on the effective lower bound (ELB) on policy rates For central bankers, the ELB (or “reversal rate”) is defined as the policy rate below which additional rate cuts are deemed counterproductive to stimulating the economy. For example, cutting rates too low could limit the ability of the banking system to earn interest income, thus hindering banks’ appetite to make new loans. Chart 5Could The Effective Lower Bound Be Negative In the UK & NZ?
Could The Effective Lower Bound Be Negative In the UK & NZ?
Could The Effective Lower Bound Be Negative In the UK & NZ?
For most central banks, the belief is that the ELB is at or just above 0%. It is possible that because of a structural shift, a central bank could deem the ELB to be negative in that particular economy. That could be because of a sharp deterioration in trend economic growth or a rapid rise in debt or a belief that the banking system was strong enough to handle the income shock of negative rates. Currently, potential GDP growth rate estimates have been marked down in both the UK and New Zealand because of the 2020 COVID-19 recession (Chart 5). In New Zealand, taking the average of the RBNZ’s real GDP growth forecasts for the next three years as a proxy for trend growth suggests that trend growth is now around 1.2%, similar to the reduced estimates of UK potential GDP growth. In terms of debt levels, the ratio of total public and private non-financial debt to GDP is close to 400% in the UK, which is far greater than the 126% level of that same ratio in New Zealand. In terms of banking system health, banks in both countries are well capitalized. The Tier 1 capital ratio of the major UK banks is 14.5%, while the similar figure in New Zealand is 13.5%; both figures are provided by the BoE and RBNZ, respectively. Stress tests run by the central banks in recent months indicate that capital levels will remain adequate even after the likely hit from loan losses due to the severity of the 2020 economic downturn. Our assessment is that both the BoE and RBNZ can claim that the ELB is in fact below zero, based on the slow pace of trend economic growth in both. In the case of the UK, high debt levels also suggest that policy rates may have to go below 0% to generate any stimulus to growth via new borrowing activity. In both countries, the central banks can claim that the banking system can handle a period of negative rates, if policymakers go down that road to boost economic growth. Economic confidence is depressed An extended period of weak economic activity and depressed confidence can trigger a need to move to negative policy rates if rates were already at 0%. Currently, UK economic confidence is in tatters after the -20% decline in real GDP seen in the second quarter of 2020. The GfK consumer confidence index remains at recessionary low levels, while the BoE Agents’ survey of UK firms shows a collapse in plans for investment and hiring over the next year (Chart 6). Chart 6A Severe Hit To UK Growth & Confidence
A Severe Hit To UK Growth & Confidence
A Severe Hit To UK Growth & Confidence
New Zealand, the economy contracted -1.6% in the first quarter of the year with consensus forecasts calling for a -20% collapse in the second quarter. Yet economic confidence is surprisingly resilient. The Westpac survey of consumer confidence is falling, but the July reading was still above typical recessionary lows (Chart 7). The ANZ survey of business investing and hiring intentions has been surprisingly upbeat of late, rebounding from the April trough but still below pre-virus levels. Our assessment here is that the BoE has a stronger case for moving to negative rates, based on the deeper collapse in confidence in the UK compared to New Zealand. Inflation expectations are too low If inflation expectations remain too low once rates have hit 0%, then inflation-targeting central banks must consider more extraordinary options to revive inflation expectations. That could take the form of extended forward guidance on future interest rate moves, expanding the size and scope of quantitative easing programs, or cutting policy rates into negative territory. Currently, inflation expectations remain elevated in the UK. 5-year CPI swaps, 5-years forward, are now at 3.6%, while the Citigroup/YouGov survey of household inflation expectations 5-10 years out sits at 3.3% (Chart 8). In New Zealand, the RBNZ inflation survey shows inflation expectations have fallen into the bottom half of the central bank’s 1-3% target band. Chart 7Only A Very Modest Downturn In NZ
Only A Very Modest Downturn In NZ
Only A Very Modest Downturn In NZ
Chart 8Inflation Expectations Are Much Lower In NZ
Inflation Expectations Are Much Lower In NZ
Inflation Expectations Are Much Lower In NZ
Our assessment here is that only the RBNZ can argue for a move to negative rates because of weak inflation expectations. Our assessment here is that only the RBNZ can argue for a move to negative rates because of weak inflation expectations. Financial conditions turning more restrictive Chart 9The News Is Mixed On UK & NZ Financial Conditions
The News Is Mixed On UK & NZ Financial Conditions
The News Is Mixed On UK & NZ Financial Conditions
Another reason why a central bank could try negative rates is if asset prices were trading at depressed levels even after policy rates were at 0%. The current signals on financial conditions in the UK and New Zealand are generally stimulative, but more so in the latter. Currently, the MSCI equity index for New Zealand is nearing the all-time high reached in 1987, while the equivalent UK equity index is languishing near the lows of the past decade (Chart 9). The New Zealand dollar and British pound have both bounced off the cyclical lows seen earlier this year (more on that later). The annual growth rates of nominal house prices have started to pick up in both countries, but with a faster pace in New Zealand. Finally, corporate credit spreads have narrowed sharply since the end of the first quarter in both countries, with New Zealand spreads actually falling below the pre-virus levels seen this year. Our assessment here is that financial conditions in both countries remain generally stimulative, but more so in New Zealand. Neither central bank can point to restrictive financial conditions as a reason to move to negative rates. Signs of impairment of the transmission of policy interest rates to actual borrowing costs If bank lending growth was weakening and/or borrowing rates remained high relative to policy rates, this could be a sign that negative policy rates are necessary to induce greater loan demand by lowering borrowing costs. Chart 10NZ Lenders Are Not Passing On RBNZ Rate Cuts
NZ Lenders Are Not Passing On RBNZ Rate Cuts
NZ Lenders Are Not Passing On RBNZ Rate Cuts
Currently, the annual growth rate of bank lending is slowing in New Zealand, but remains positive at 4.5% (Chart 10). Loan growth in the UK is now a much more robust 7.4%, but some of that growth is due to UK companies drawing down lines of credit with their banks to survive during the COVID-19 lockdowns. A bigger issue is the lack of the full pass-through of the RBNZ’s recent cuts into borrowing rates, especially for home loans. The spread between 5-year fixed mortgage rates and the RBNZ cash rate is now an elevated 387bps, while the equivalent spread in the UK is much lower at 160bps. Our assessment here is that only the RBNZ can argue that an impaired transmission of policy rate cuts to actual borrowing rates could justify a move to negative rates. Scope For Currency Depreciation For any central bank, a benefit of a negative interest rate policy is that it can trigger more stimulus via a weaker currency. This can help boost economic growth by making exports more competitive, while also helping lift inflation by raising the cost of imports. On the growth side, a weaker currency would be somewhat more helpful for New Zealand where exports are 19% of GDP, compared to 16% in the UK. (Chart 11). That is an important distinction, as there is greater scope for the New Zealand dollar (NZD) to depreciate if the RBNZ went to negative rates than for the British pound (GBP) to weaken if the BoE did the same. Chart 11A New Experiment? Negative Rates With A Current Account Deficit
A New Experiment? Negative Rates With A Current Account Deficit
A New Experiment? Negative Rates With A Current Account Deficit
Chart 12BoE Does Not Need To Go Negative To Weaken The Pound
BoE Does Not Need To Go Negative To Weaken The Pound
BoE Does Not Need To Go Negative To Weaken The Pound
Perhaps the most interesting feature of this entire negative rates discussion is that, for the first time in the “negative rates era”, central banks of countries with current account deficits are considering pushing policy rates below 0%. For the first time in the “negative rates era”, central banks of countries with current account deficits are considering pushing policy rates below 0%. The UK and New Zealand both have similarly sized current account deficits, equal to -3.3% and -2.7% of GDP, respectively (middle panel). At the same time, both countries have net foreign direct investment surpluses roughly equal to those current account deficits, leaving their basic balances around 0 (bottom panel). In other words, both countries currently attract enough long-term foreign direct investment inflows to “fund” their current account deficits. Foreign investors may be less willing to continue buying as many New Zealand or UK financial assets if either country went to a negative interest rate to intentionally weaken the currency, as the RBNZ has publicly stated would be a desired outcome of such a move. Chart 13RBNZ Could Go Negative To Weaken The Kiwi
RBNZ Could Go Negative To Weaken The Kiwi
RBNZ Could Go Negative To Weaken The Kiwi
Our colleagues at BCA Foreign Exchange Strategy estimate that, on purchasing power parity (PPP) basis, the GBP/USD exchange rate is now -20% below its long-run fair value (Chart 12). The level of the currency is also broadly in line with the current level of interest rate differentials between the UK and the US (bottom panel). In other words, the GBP is already cheap and additional rate cuts would have limited impact in driving the currency lower. It is a different story for NZD/USD, which is fairly valued on a PPP basis but remains elevated relative to New Zealand-US interest rate differentials (Chart 13). Therefore, our assessment is that only the RBNZ can credibly generate meaningful currency weakness from a move to negative rates. Summing it all up Based on the elements of our Negative Rates Checklist, we deem it more likely for the RBNZ to go negative than the BoE. In the UK, there is less evidence pointing to a significantly impaired credit channel that could be remedied by negative rates, inflation expectations are elevated, and the pound is already at undervalued levels. In New Zealand, previous RBNZ rate cuts have not fully flowed through into bank lending rates, inflation expectations are low, and the New Zealand dollar is at fair value (and, therefore, has room to become cheaper via negative rates). Based on the elements of our Negative Rates Checklist, we deem it more likely for the RBNZ to go negative than the BoE. Bottom Line: The persistence of the COVID-19 pandemic is intensifying pressure on policymakers in many countries to provide more stimulus. The odds that a new central bank will join the negative policy interest rate club are increasing. Recent comments from Bank of England and Reserve Bank of New Zealand officials have hinted at the possibility of a shift to negative policy rates, should conditions warrant. The odds are greater for such a move in New Zealand. A Negative Rates Trade Idea: Go Long New Zealand Government Bonds Vs. UK Gilts Chart 14Go Long 10yr NZ Govt. Bonds Vs 10yr UK Gilts
Go Long 10yr NZ Govt. Bonds Vs 10yr UK Gilts
Go Long 10yr NZ Govt. Bonds Vs 10yr UK Gilts
Based on our analysis above, we are adding a new cross-country spread trade to our Tactical Overlay Trades list on page 18: going long 10-year New Zealand government bonds versus 10-year UK Gilts on a currency-hedged basis (i.e. hedging the NZD exposure into GBP). The trade is to be implemented using on-the-run cash bonds. The current unhedged NZ-UK 10-year yield spread is +36bps, but even on a hedged basis (using 3-month currency forwards) the yield differential is still positive at +23bps (Chart 14). We are targeting zero for the unhedged spread, to be realized sometime within the six months. We like this trade because it can win not only from a decline in New Zealand bond yields if the RBNZ goes to negative rates (as we think is increasingly likely), but also from a potential rise in Gilt yields if the BoE defies market pricing and does not go to negative rates. If both countries keep rates on hold, then the trade will earn a small positive spread over the current meagre level of Gilt yields. Robert Robis, CFA Chief Fixed Income Strategist rrobis@bcaresearch.com Footnotes 1 Please see BCA Research Special Report, "Negative Rates: Coming Soon To A Bond Market Near You?", dated May 20, 2020, available at gfis.bcaresearch.com. Recommendations The GFIS Recommended Portfolio Vs. The Custom Benchmark Index
Assessing The Leading Candidates To Join The Negative Rate Club
Assessing The Leading Candidates To Join The Negative Rate Club
Duration Regional Allocation Spread Product Tactical Trades Yields & Returns Global Bond Yields Historical Returns
Dear clients, China Investment Strategy will take a summer break next week. We will resume our publication on September 9th. Best regards, Jing Sima, China Strategist Highlights The threat of US sanctions has sparked fears of disconnecting Chinese financial institutions from US dollar access, driving urgency to accelerate the RMB internationalization process. China’s RMB internationalization process suffered from a sizable setback in 2016, but the trend has reversed in 2018. Since then China has shifted the strategy to broaden and enhance the RMB’s market demand and functions, as well as to establish systems to facilitate the strategy. In the foreseeable future, the RMB’s role in the global economy is far from challenging the US dollar as the world's dominant reserve currency; China's near-term goal to promote the use of the RMB beyond its borders is to minimize disruptions to China’s trade and investment activities threatened by US financial sanctions. Feature Since 2018 and in the wake of intensifying confrontations between the US and China, the Chinese government has shifted its strategy in promoting the internationalization of the RMB. Authorities have moved from a symbolic international recognition of the RMB to a more pragmatic approach of creating real market demand for the currency. Chart 1China Has Been Shedding USD Assets
China Has Been Shedding USD Assets
China Has Been Shedding USD Assets
It is not our baseline view that the US will take extreme measures and entirely cut off Chinese banks’ access to the US Clearing House Interbank Payments System (CHIPS) and the Society for Worldwide Interbank Financial Telecommunication (SWIFT). However, Beijing’s decoupling from the US dollar (USD) has been in process, diversifying its forex reserves away from the US dollar (USD) and increasing the use of the RMB in cross-border trade and investment (Chart 1). In the foreseeable future, it is neither possible nor is Chinese policymakers’ intention for the RMB to challenge the USD as the world's dominant reserve currency. Rather, we think that under the threat of US sanctions, the near-term goal is to minimize disruptions to China’s trade and investment activities. At the same time, the approach will make China “too big, too connected to fail” in the medium-to-long run and, therefore, minimize the potential for future threats of financial sanctions. China’s new approach to internationalize the RMB involves enhancing the currency’s three functions in the global market, and establishing and strengthening domestic systems to facilitate the enhancements: The RMB as an international settlement currency; The RMB as a commodity pricing currency; and The RMB as an international reserve currency. Most of these strategies still have a long way to go before having significant global market implications. However, these developments bear structural importance and investors should closely monitor them. RMB - An International Settlement Currency Chart 2Cross-Border RMB Settlement Is Picking Up
Cross-Border RMB Settlement Is Picking Up
Cross-Border RMB Settlement Is Picking Up
The RMB’s role in cross-border trade settlement suffered a major setback in 2016 when investor confidence plummeted following a rapid devaluation in China’s currency and equities. The trend has reversed since 2018, partially due to the vigorous promotion of China’s domestic cross-border interbank settlement system (CIPS) (Chart 2). China established CIPS in 2015 after the US proposed to disconnect Russia from the SWIFT payment system.1 As of July 2020, the CIPS system had a total of 33 direct participants and 951 indirect participants, a 35% increase from 2018 with more than half of the participants outside China.2 According to the recently released PBoC RMB internationalization report, the CIPS system processed a total of 34 trillion yuan worth of cross-border RMB transactions in 2019, a 28% improvement from 2018 (Chart 3). Chart 3CIPS Has Been Steadily Expanding
The RMB Internationalization Scorecard
The RMB Internationalization Scorecard
Nevertheless, the RMB’s share of international payments remains far behind the USD, euro and yen, and the RMB's role in cross-border settlement is well below its 2016 peak (Chart 4A and 4B). The dollar's dominant status is not only supported by the US’ strong and open economy, but also by its deep, liquid and highly efficient financial markets, which are impossible for any currencies or payment systems to replicate in the near future. However, establishing domestic financial payment and information exchange systems will likely be a main countermeasure countries will rush to take, if the US launches sanctions to cut off large economies like Russia and China from the USD and/or global financial system. Chart 4AThe RMB’s Share Of International Payments Has Been Disproportional Compared To Its Share In Global Trade…
The RMB Internationalization Scorecard
The RMB Internationalization Scorecard
Chart 4B...And Well Below Its 2016 Peak
...And Well Below Its 2016 Peak
...And Well Below Its 2016 Peak
Chart 5Russia Has Largely Replaced USD Treasury Holdings With Gold
Russia Has Largely Replaced USD Treasury Holdings With Gold
Russia Has Largely Replaced USD Treasury Holdings With Gold
Russia is by far the largest and most globally integrated country that came close to being cut off from SWIFT, and Beijing has clearly learned from Russia’s experience and countermeasure strategies. The proposal to disconnect Russia from SWIFT following the 2014 Crimea crisis never materialized, but in light of the threats and US financial sanctions, Russia established the SPFS, a domestic financial information exchange system to facilitate bank payments. The SPFS is far from the complete emancipation of SWIFT and payments through the SPFS are mostly intra-Russian settlements. However, this active counter-sanction measure, coupled with the Russian central bank’s aggressive reduction of USD-denominated assets in its forex reserves, seems to have achieved positive results (Chart 5). Three years after the establishment of SPFS, the US and Europe no longer target Russian bank payment functions in their further financial sanctions against Russia.3 In response to a US threat to impose economic sanctions against companies and banks dealing with Iran, Europe created a special financial settlement platform called Instrument in Support of Trade Exchanges (INSTEX) in 2019. Although none of the alternative systems can challenge the role of the US CHIPS or SWIFT systems, the trend of establishing and accelerating alternatives will incrementally diminish the effectiveness of such harsh financial actions by the US. RMB - An International Commodity Pricing Currency Table 1China Dominates Global Demand For Many Commodities
The RMB Internationalization Scorecard
The RMB Internationalization Scorecard
We believe that the most important breakthrough in the RMB internationalization process in the past five years has been the strategic shift to promote the RMB’s pricing function. China is the largest trading partner of a growing number of countries with tightly linked supply chains. This generates a natural demand for RMB settlement in bilateral trade. More importantly, China’s dominance in global demand for bulk commodities gives the country an advantage in pricing power (Table 1). In March 2018, China established a RMB-denominated crude oil futures market in Shanghai, which has grown into the third-largest oil exchange market after WTI and Brent. Its cumulative turnover in two years reached nearly 30 trillion yuan with overseas customers in 19 countries and regions.4 Given the success of the Shanghai crude oil futures market, the Chinese government has been vigorously promoting the expansion of the RMB pricing function from crude oil to natural gas, iron ore, soybeans, corn and other bulk commodities. Going forward, we expect the RMB internationalization process to continue to develop through pricing and trading bulk commodities in Chinese currency. This will lead to a higher correlation between the RMB and the currencies of some of China's Asian neighbors and commodity trade partners, and thus expand and strengthen the "RMB currency bloc" (Chart 6A and 6B). Chart 6AThe RMB Currency Bloc May Expand From Manufacturing Ecosystem...
The RMB Currency Bloc May Expand From Manufacturing Ecosystem...
The RMB Currency Bloc May Expand From Manufacturing Ecosystem...
Chart 6B...To Commodity Supply Chain
...To Commodity Supply Chain
...To Commodity Supply Chain
RMB - An International Reserve Currency The role of the RMB among official reserve managers, although still dismal compared to the USD and Euro, has accelerated since 2018. Its global share has doubled from Q4 2016 when the IMF began to include holdings of RMB in its currency composition of official foreign exchange reserves (COFER) (Chart 7). Shares of the USD- and Euro-denominated reserves have remained unchanged or declined during the same period. Among private investors, foreign investment in RMB-denominated assets has been the main source of China’s financial account surplus (Chart 8). China has hastened the opening of its onshore financial market to foreign institutional investors. In the past two years, major global stock and bond indexers –including MSCI, the S&P Dow Jones Indices, the FTSE Russell, and the Bloomberg Barclays Global Aggregate Index – have added A-shares and onshore bonds to their flagship benchmarks. This means that foreign institutional investors have significantly boosted their allocation of RMB-denominated stocks and bonds (Chart 8, bottom panel). Financial assets, such as domestic RMB stocks, bonds, and loans and deposits held by foreign entities, climbed by 26.7% in 2019 over 2018. At the same time, China's domestic financial markets have gradually liberalized and even removed investment quotas for overseas institutional investors. Foreign investors currently account for 5.5% and 2.6% of the market value in Chinese equities and bonds, up from 3% and 2% in 2018, respectively. Chart 7The RMB Share In Global Reserves Remains Dismal, But Has Nearly Doubled Since 2016
The RMB Internationalization Scorecard
The RMB Internationalization Scorecard
Chart 8China Has Been Rapidly Expanding The Scope Of Foreign Participants In Its Onshore Financial Markets
China Has Been Rapidly Expanding The Scope Of Foreign Participants In Its Onshore Financial Markets
China Has Been Rapidly Expanding The Scope Of Foreign Participants In Its Onshore Financial Markets
Bottom Line: The internationalization of the RMB will likely continue to accelerate in the face of decoupling from the US. It is a long process, but China will take advantage of its dominance in global demand to foster the RMB's role in both pricing and settlement in cross-border commodity trade. At the same time, China is rapidly expanding the scope of foreign participants in the country's onshore financial markets, by allowing more foreign banks and financial institutions to enter the market, and broadening the channels for the RMB’s international circulation. Jing Sima China Strategist jings@bcaresearch.com Footnotes 1SWIFT is a system that provides information on international payments and calculations. The system unites more than 11,000 banking and financial institutions in 210 countries and the bank card payment function supported by the SWIFT system reflects a country's financial security. 2China Cross-Border Interbank Payment System release, July 31st, 2020. 3Xu Wenhong, The SWIFT System: A Focus on the U.S.–Russia Financial Confrontation, Russian International Affairs Council, February 3, 2020. 4Based on data from Shanghai International Energy Exchange. Cyclical Investment Stance Equity Sector Recommendations
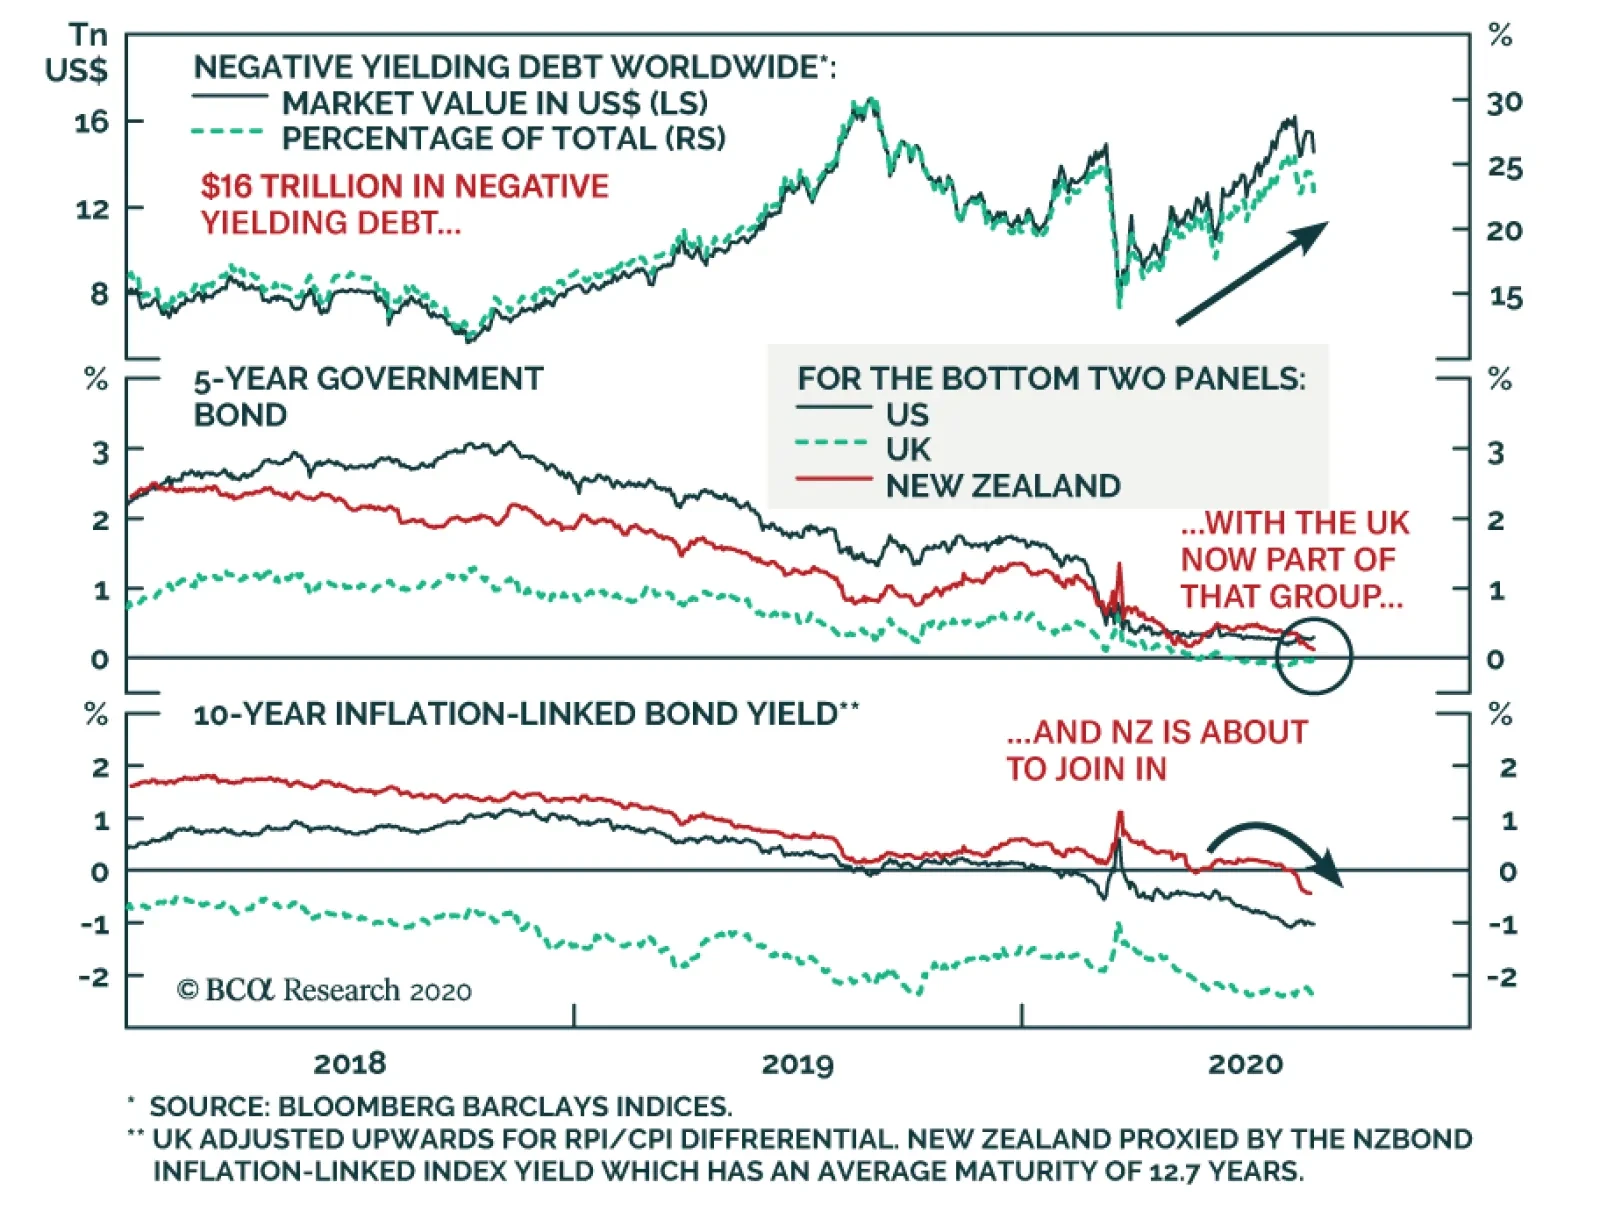
BCA Research's Global Fixed Income Strategy service argues that the persistence of the COVID-19 pandemic intensifies pressure on policymakers around the world to provide more economic stimulus. The odds that more central banks will join the negative policy…
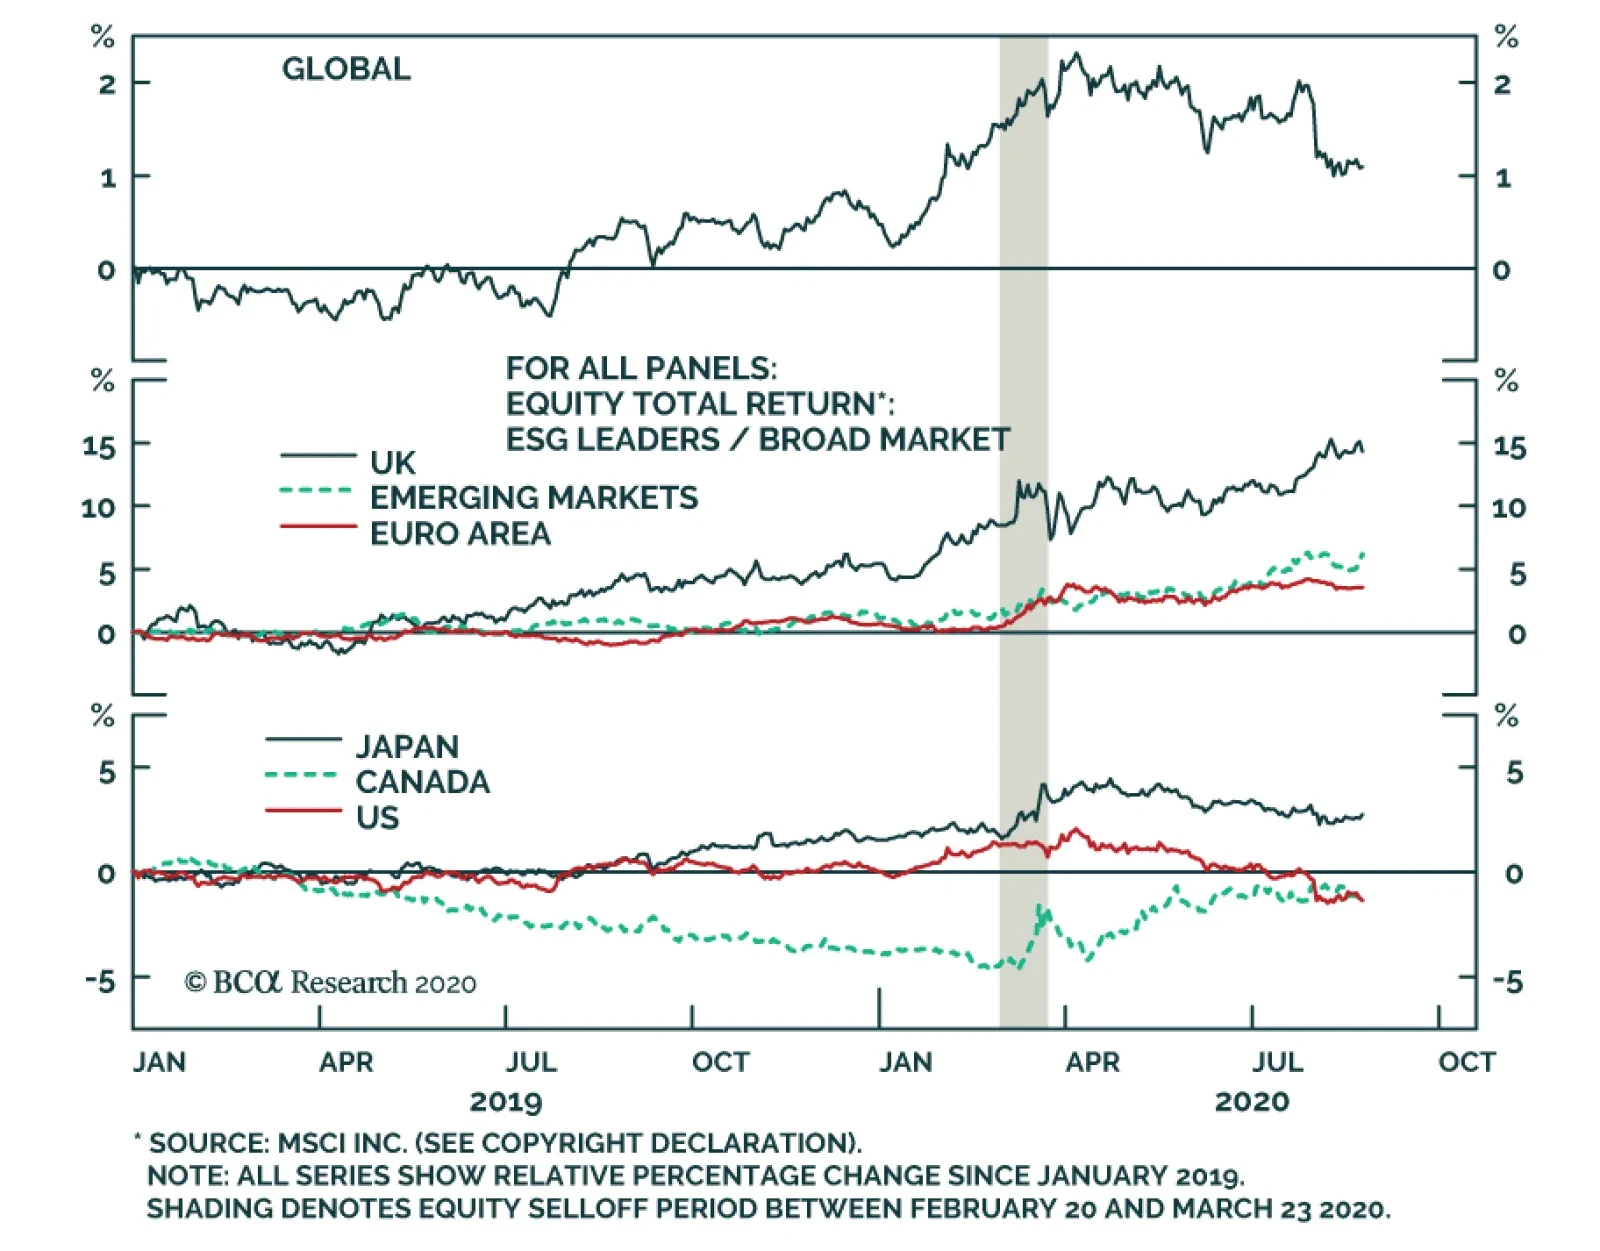
BCA Research's Global Asset Allocation service takes an introspective look at ESG investing. Since 2018, ESG indices in most countries (with the exception of the US and Canada) have outperformed the broad market benchmarks. The global ESG index has…
Highlights ESG-related equities have outperformed global benchmarks over the past two years, as well as during the recent equity selloff. Investor demand and institutional pressure will drive the financial industry to analyze nonfinancial disclosures more closely and take them more into account. The pathway to achieving that is not simple: Unification of reporting standards and improvement in the quality of disclosure are required. Governments can play a role by enforcing climate and sustainability disclosure for firms wanting bailout support. Key stakeholders in the financial system – especially asset managers and other providers of capital – will look to incorporate more sophisticated ESG analysis into their traditional frameworks. Introduction This report is an update to our Special Report published in late 2018 on the benefits of ESG investing. In that report we concluded that ESG indices have performed at least in line with, and may even have slightly outperformed, broad-market indices, while providing societal and environmental benefits.1 We can now also answer one of the questions we raised in that report: Whether ESG investing provides protection during recessions and bear markets. Since we published that report, the ESG space has continued to grow, with the number of new US “sustainable” fund launches, as tracked by Morningstar, increasing – albeit at a lower rate than in the previous two years (Chart 1).2 This can be attributed to an ever-increasing investor demand, predominantly from Europe, but growing rapidly in both the US and Asia, too. The Global Sustainable Investment Review estimates that ESG assets under management (using a relatively broad definition of ESG) totaled $30 trillion as of 2018.3 Chart 1The Industry Is Catering To Increasing Investor Demand
ESG Indices Outperformed Broad-Market Benchmarks In Most Regions During The Equity Selloff
ESG Indices Outperformed Broad-Market Benchmarks In Most Regions During The Equity Selloff
Our earlier report highlighted the increasing demand from investors to allocate capital based on environmental, social, and governance standards, or ESG. Simply put, we defined ESG investing as any investment activity that recognizes a certain set of principles, and screens securities based on those factors. While the term itself might be new, the core concept behind it is not. It encompasses a philosophy dating back hundreds of years, beginning with faith-based investing, to the more recent increased awareness of climate and governance issues. The COVID-19 pandemic – also considered an ESG risk – illustrated how quickly a health and environmental threat can turn into a social issue, as unemployment rates surged to new highs and economic activity came to a halt. In this report, we analyze how the performance of ESG indices has evolved since our last report, and in particular, during the recent February-March equity selloff. Additionally, we discuss the opportunities that governments, investors, and corporations can seize in the future. We also assess the various risks facing ESG investing, given that it is no longer a niche space. Performance Update Since we published our report in late 2018, ESG indices in most countries (with the exception of the US and Canada) have outperformed the broad market benchmarks.4 The global ESG index has outperformed the All-Country World (ACW) broad market index by 1% since (Chart 2). While this might not count as a remarkable outperformance, it answers some of the doubts cast on the merits of ESG investing. However, it is critical for investors to realize that ESG indices are not necessarily just another vehicle to invest in to try to outperform the market; rather, they are a sustainable alternative to traditional indices that do not detract from performance. Importantly, ESG indices either performed in line with or better than broad market indices during the equity selloff between February-March 2020. ESG indices in all major countries and regions, with the exception of the US, outperformed the benchmark during this period (Chart 2). Research by MSCI breaks down the active returns of various ESG country and region indices versus their corresponding broad market indices in Q1 2020. This analysis showed that the outperformance predominantly came from equity style tilts, followed by ESG-related factors and sector/industry tilts (Chart 3). Chart 2ESG Indices Outperformed Broad-Market Benchmarks In Most Regions During The Equity Selloff
ESG Indices Outperformed Broad-Market Benchmarks In Most Regions During The Equity Selloff
ESG Indices Outperformed Broad-Market Benchmarks In Most Regions During The Equity Selloff
ESG indices tilt towards higher-quality, low-beta, and high-yielding stocks relative to their benchmarks. As part of the index construction, some ESG indices exclude stocks not meeting the indices’ ESG eligibility criteria. This would include various names in the oil & gas industry, for example (for environmental criteria), as well as some tech giants (for social and governance reasons). The exclusion of some tech names partly explains the US index’s underperformance. Chart 3 shows that stock selection for the US MSCI ESG Leaders index – the one shown in Chart 2 – had a negative contribution to active returns over the first quarter. Chart 3Breaking Down ESG Performance
ESG Investing: From Niche To Mainstream
ESG Investing: From Niche To Mainstream
Index methodology plays a big role in determining expected performance. The methodology of the MSCI ESG index suite generally aims to reduce sector differences relative to the broad indices, thereby limiting systematic risk. However, even within the MSCI ESG suite, methodologies differ between indices (Tables 1 & 2).5 Table 1Index Methodology Determines Sector Tilts
ESG Investing: From Niche To Mainstream
ESG Investing: From Niche To Mainstream
Table 2Methodology Differences Matter
ESG Investing: From Niche To Mainstream
ESG Investing: From Niche To Mainstream
However, it is critical for investors to realize that ESG indices are not necessarily just another vehicle to invest in to try to outperform the market; rather, they are a sustainable alternative to traditional indices that do not detract from performance. It is also important for investors to understand that sustainability is a long-term issue. For example, as economies shut down when COVID-19 infections and deaths rose, investors rushed to sell their risky exposures: The five largest “traditional” US equity ETFs saw cumulative net equity outflows of as high as $22 billion during the three-week period between February 19 and March 13. By contrast, the five largest ESG equity funds experienced small, yet positive, inflows over the same period (Chart 4). This was also true globally, where sustainable funds tracked by Morningstar recorded inflows close to $45 billion dollars during this period, whereas equity funds overall recorded over $380 billion of outflows.6 The most likely reason for this is that investors see ESG investing as a defensive play, given its sector and factor tilts. Chart 4Small, Yet Steady Inflows During The Equity Selloff
ESG Investing: From Niche To Mainstream
ESG Investing: From Niche To Mainstream
Institutional Pressure Chart 5Analyzing Nonfinancial Disclosures Is A Must...
ESG Investing: From Niche To Mainstream
ESG Investing: From Niche To Mainstream
Investors – particularly those with longer investment horizons, such as pension funds and endowments – are becoming more committed to evaluating their investments more rigorously from an ESG standpoint. This means putting pressure on asset managers to screen and assess company performance using ESG factors. A survey by EY in June 2020 shows that only 2% of respondents conduct little-to-no review of nonfinancial disclosures relating to a company’s environmental and social performance, down from 36% in 2013 (Chart 5). However, absent a formal governing body, standardized reporting, and proper regulation regarding what should be labeled ESG, as well as how metrics are evaluated, asset managers struggle to comply. One of the key points we highlighted in our previous report is that consideration of ESG factors in investment decisions must go beyond simple reliance on ESG scores. The various ESG rating agencies rely on different metrics, factors, and datasets to rank companies and therefore produce very different benchmarks and funds, even though they may have the same objectives. This means that different investors using different ESG indices could end up with different allocations to the same universe of stocks. Therefore, analysis and inclusion based on ESG scores may be misleading and yield dissimilar results. A research paper by the MIT Sloan School of Management showed that the sources of differentiation of ESG rankings by ratings agencies stem from: 1) Scope Divergence: Ratings rely on different attributes to capture ESG performance; 2) Measurement Divergence: Relying on different indicators to measure the same attribute; and 3) Weight Divergence: Ranking the attributes differently in terms of importance. Of these, the paper found that the measurement divergence was the most important.7 Chart 6...With More Companies Now Reporting
ESG Investing: From Niche To Mainstream
ESG Investing: From Niche To Mainstream
Asset managers are not necessarily to blame. They simply lack adequate tools. The problem is not the dearth of disclosure, but rather its quality and comparability. In fact, over the past few years, more companies have begun reporting on their sustainability and social performance (Chart 6). However, the fact that reporting is voluntary, and companies rely on different reporting frameworks and standards, makes cross-country and inter-firm comparisons difficult. On the bright side however, there is a growing pressure for collaboration between the various reporting frameworks in order to bring about a single reporting standard. For example, a recently announced partnership between the Global Reporting Initiative (GRI) and the Sustainability Accounting Standards Board (SASB) – two of the many organizations responsible for creating sustainability reports and reporting on governance data – is an important step in bringing the various standard-setters together. This should promote greater reporting consistency, and highlight the importance of key non financial disclosures. Improved reporting will affect not only investors, but also providers of capital, including banks. Incorporating ESG factors into conventional investing frameworks will become a core step in assessing risk for asset allocators. Providers of capital will have to assess not only borrowers’ fundamentals and growth prospects, but also understand their governance policies and environmental footprint. A recently published report by the Bank of England (BoE) highlighted the potential impact of climate change – both through transition8 and physical risks9 – on UK banks, insurers, and the entire financial system. To highlight the extent of “climate-related exposure,” the analysis found that almost 10% of England’s mortgage value is on properties in flood-risk zones, and that loan exposures to high emission-intensive sectors represent almost 70% of the common equity Tier 1 capital of the UK’s largest banks.10 If a climate event occurs, or new regulations are implemented, the impact will be severe. Incorporating ESG factors into conventional investing frameworks will become a core step in assessing risk for asset allocators. Governments can play a role. As COVID-19 stimulus plans are rolled out – mainly in developed economies – governments are requiring companies in need of support or bailouts to improve their environmental and climate disclosures. This will make it easier for private-sector investors to incorporate ESG analysis. Large Canadian firms, for example, that apply for government loans, must now publish annual climate disclosure reports as well as other releases relating to environmental and sustainability goals. Additionally, further rounds of stimulus could be given to those investing in ESG-related areas – known as “green stimulus.” Since the beginning of the COVID-19 pandemic, G20 countries have committed over $300 billion to support various energy initiatives, of which approximately $150 billion was aimed at clean energy policies and renewable energy programs.11 This could set a precedent for future government support to aid the transition to a greener economy. It can perhaps also serve as an indicator of which areas can present opportunities for investment. Monetary policy is set to remain accommodative for the next few years. It is not unimaginable, then, that central banks’ unconventional monetary easing methods could involve purchasing green bonds,12 issued by both corporations and governments. This is something ECB president Christine Lagarde has hinted at, to aid in the world’s fight against climate change.13 Chart 7The Green Bond Market Is Growing
ESG Investing: From Niche To Mainstream
ESG Investing: From Niche To Mainstream
The green bond market continues to grow, with bond issuance in 2019 up over 55% year-on-year. This growth, however, has fallen somewhat in 2020 due to the economic slowdown (Chart 7), despite overall bond issuance increasing in the second quarter of the year, as companies rushed to raise cash and refinance at lower rates.14 The fact that proceeds issued by green bonds must explicitly be used for environmental projects is the most likely reason for the decline. Green bond issuance, in 2020, has totaled $112 billion as of July, with the US, Germany, France, and the Netherlands being the top four issuers. China, the top issuer in 2018 and 2019, slipped to sixth place in 2020, with its green bond issuance shrinking from $27 billion in 2019 to $6 billion year-to-date. Risks & Headwinds Investors should be wary of various short-to-medium term risks to ESG investment. In the short-term, a delay of climate-change targets is possible. A second wave of COVID-19 infections that would trigger further lockdowns might lead to a rollback in environmental regulation and a refocus of stimulus packages on all-out growth rather than on ESG and climate initiatives. Over the coming years, as ESG investing becomes more mainstream, investors will need to take greater care to spot “greenwashing.”15 For example, this includes funds labeled as “sustainable”, but which hold securities that do not fit under that umbrella. It would also include companies taking advantage of the absence of reporting regulations to report misleading or incomplete information. Such care will be crucial until a unified reporting framework is established. According to calculations by Morningstar, over 500 funds expanded their prospectuses to include ESG factors in their investment analysis in 2019, up from the roughly 50 funds which did so in 2018.16,17 Indeed, this is a sign that funds are responding to investor demand and adding appropriate ESG analysis. However, whether these funds use sustainability as a core factor in their investing is unclear. Therefore, investors should continue to undertake their own proper due diligence. Conclusions The path to fully incorporating ESG analyses into a traditional investing framework is heading in the right direction, but is not yet clear-cut. A unified framework that allows for consistent and comparable disclosures would fix one of the biggest hurdles that investors face. ESG-related equity indices have outperformed in most countries and regions since late 2018, as well as during the recent equity selloff. The full advantage to be derived from incorporating ESG factors should be unlocked as more accurate and comprehensive data becomes available. Investor demand for ESG-related investments will remain the dominant force in driving the shift to integrating ESG disclosures into traditional financial analysis. Amr Hanafy Senior Analyst amrh@bcaresearch.com Footnotes 1 Please see Global Asset Allocation Special Report, “ESG Investing: No Harm, Some Benefit,” dated November 21, 2018 available at gaa.bcaresearch.com. 2 Please see https://www.morningstar.com/articles/989209/esg-funds-setting-a-record-pace-for-launches-in-2020 3 "Global Sustainable Investment Review 2018," Global Sustainable Investment Alliance, gsi-alliance.org. 4 For the purpose of this analysis, we use the MSCI ESG Leaders index suite. 5 "MSCI ESG Indexes," MSCI, msci.com. 6 Please see https://www.morningstar.com/articles/984776/theres-ample-room-for-sustainable-investing-to-grow-in-the-us 7 Florian Bergand, Julian F Kölbel, and Roberto Rigobon, "Aggregate Confusion: The Divergence of ESG Ratings," May 17, 2020. 8 Transition risks can be defined as the risks of economic dislocation and financial losses associated with the transition to a lower-carbon economy. 9 Physicals risks can be defined as those arising from the interaction between climate-related events and human and natural systems. 10"The Bank of England’s climate-related financial disclosure 2020," Bank Of England. 11 "G20," energypolicytracker.org. 12 Green bonds are fixed income securities in which the proceeds are exclusively and explicitly assigned to projects or activities to finance and combat environmental issues – such as those relating to climate change and depletion of biodiversity and natural resources. 13 "Lagarde Puts Green Policy Top Of Agenda in ECB Bond Buying," Financial Times, July 8, 2020. 14 "Credit Trends: Global Financing Conditions: Bond Issuance Is Expected To Finish 2020 Up 6% After A Strong Second Quarter," S&P Global Ratings, July 27, 2020. 15Greenwashing is the process of relying on false claims and impressions to provide misleading information about how certain activities, investments, services, products, etc., are environmentally sound and friendly. 16 https://www.morningstar.com/articles/973432/the-number-of-funds-considering-esg-explodes-in-2019 17 As of March 2020, data by Morningstar show that 3,297 global sustainable funds exist.
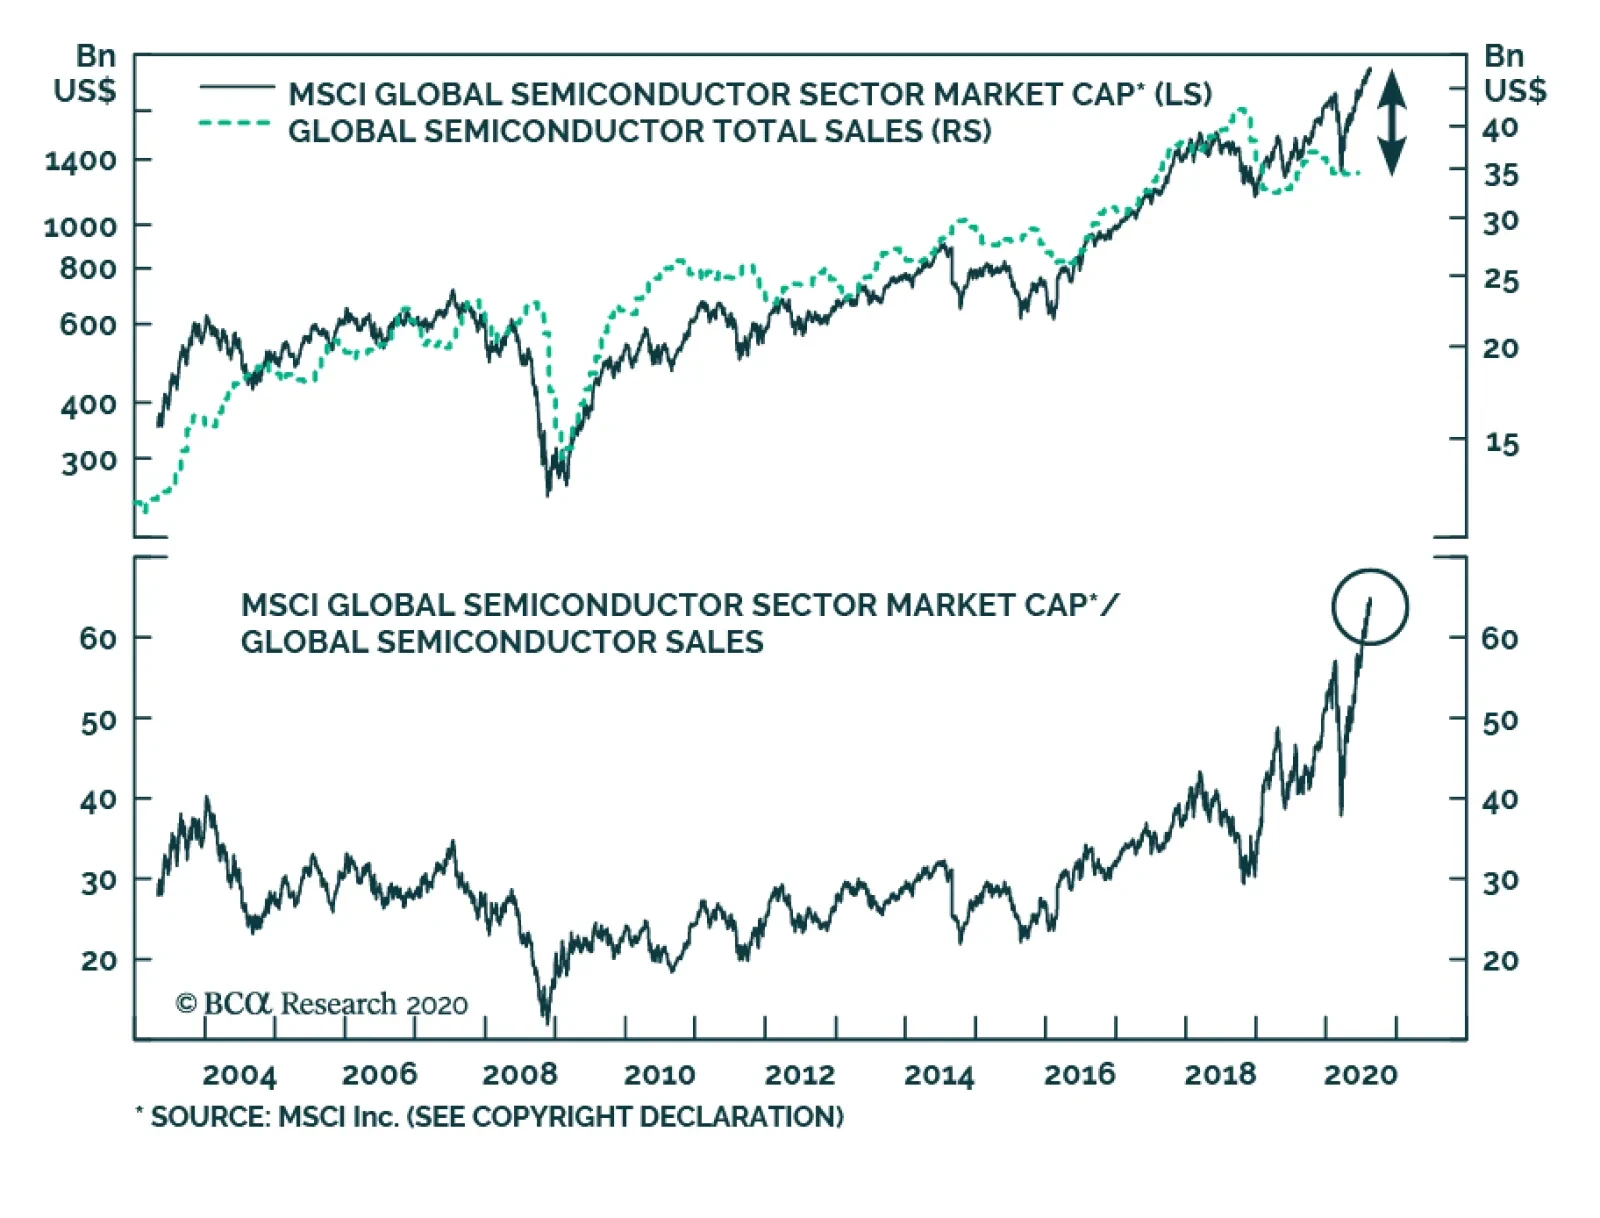
BCA Research's Emerging Markets Strategy service worries about the near-term outlook for semiconductor stock, despite a positive structural story. Investor euphoria has taken hold of semiconductor stocks. Global semiconductor stock prices have skyrocketed…
Highlights We expect limited upside to gas prices from current levels as the comeback of US Liquefied Natural Gas (LNG) exports will add to an already oversupplied market. In the short term, prices will remain below full-cycle costs. This will limit investment in LNG and the infrastructure required to get it to market in future. European storage will peak below maximum capacity. Gas forwards are pricing a rapid drawdown over the winter. Whether this occurs depends critically on winter demand in the northern hemisphere and a continued recovery in world economic activity. In the US, declining production in the prolific natural-gas shales and rising LNG exports will help balance its domestic gas markets: Rig counts in the Appalachian basin are at multiyear lows, which is weighing on output. Collapsing oil production in major shale-oil basins is dramatically reducing associated gas output, which represents more than 16% of total gas production. Still, a second wave of COVID-19 that results in another round of widespread lockdowns could send natgas prices back below $2/MMBtu as storage fills. Over the next few months, the balance of risk in natgas markets – especially in the US – remains to the downside, though highly uncertain. We are staying on the sidelines for now. Over the medium term, global demand for LNG will catch up with supply by 2024, supported by additional coal-to-gas switching and slower supply growth. Feature The mounting probability inventories will fill up to maximum capacity before this coming winter’s heating season has pushed major European and Asian benchmarks below US LNG’s variable costs. Global natural gas markets have been severely hit by the COVID-19 pandemic. Natgas prices in Asia, Europe, and the US were amongst the worst performing commodities during the crisis (Chart 1). This reflects weak fundamentals – i.e. a significant global supply surplus – which gas markets faced even before the exogenous shock. The mounting probability inventories will fill up to maximum capacity before this coming winter’s heating season has pushed major European and Asian benchmarks below US LNG’s variable costs. This development renders shipments of US gas overseas uneconomical. The cancellation of US cargoes is acting as the primary balancing factor and will allow inventories to stay below full capacity – assuming global economic activity continues to accelerate in 2H20. Henry Hub prices surged by 34% since the beginning of the month on the back of higher gas demand – from warmer-than-normal weather and rebounding global economic activity – depressed US LNG exports, and prolonged maintenance at Australia’s Gorgon plant. Chart 1Global Gas Benchmarks Collapsed In 1H20
Global Natgas Markets: Limited Upside, Elevated Downside Risks
Global Natgas Markets: Limited Upside, Elevated Downside Risks
Chart 2Relative Prices Will Favor Additional US LNG Exports
Global Natgas Markets: Limited Upside, Elevated Downside Risks
Global Natgas Markets: Limited Upside, Elevated Downside Risks
As storage-related fears abate, LNG economics is turning favorable for cargoes to be delivered in 4Q20 and 1Q21. This will allow exports of US gas to Europe and Asia to resume as regional demand rises. This improvement is already apparent in relative futures curves (Chart 2). Still, we expect only limited price gains from current levels, especially in the US. The resurgence in US LNG exports will add to the global supply surplus and cap the upside. Relative prices will remain below LNG offtakers' (exporters) full-cycle costs, limiting additional investments in LNG projects over the medium term. We expect demand to catch up to supply by 2024. Gas Fundamentals Worsened In 2019 Global gas demand increased by 2% y/y in 2019, led by growth in the US and China as coal-to-gas switching intensified amid the low-price environment (Chart 3). However, this rate of growth is a marked slowdown relative to the average 3.5% y/y growth from 2016-2018. It was also slower than the strong global supply growth – up 3.4% y/y – and LNG export growth – up 12.7% y/y. Chart 3US, China Supported Gas Demand Growth In 2019
Global Natgas Markets: Limited Upside, Elevated Downside Risks
Global Natgas Markets: Limited Upside, Elevated Downside Risks
The US was the largest contributor to both new gas and LNG supply, accounting for 65% of the world’s incremental gas production (Chart 4). The liquefaction capacity addition from the first wave of investments – i.e. projects that received a final investment decision (FID) before 2017 – is now mostly operational. Chart 4US Dominated Natgas Supply And LNG Growth In 2019
Global Natgas Markets: Limited Upside, Elevated Downside Risks
Global Natgas Markets: Limited Upside, Elevated Downside Risks
US LNG capacity stands at ~10 Bcf/d and serves as a needed pressure valve to its oversupplied domestic market – a consequence of rapid shale production growth – forcing the excess gas to Europe and Asia. However, the economic slowdown in Asia in 2H19 meant the region could no longer adequately absorb these new volumes. As a result, global gas markets moved to a supply-surplus. Relative gas price spreads began trending downward and moved in favor of exports to Europe over Asia.1 Europe plays a growing role as a market of last resort for global natural gas – particularly US LNG – due to its well-developed storage infrastructure, regasification units, and pipeline networks. Around 80% of LNG exports from newly added terminals were absorbed by European markets, and most of that went into storage. Around 40% of the global natural gas supply increase last year ended up in storage, according to the IEA (Chart 5). Moreover, milder-than-expected weather last year exacerbated these trends and forced global prices to converge closer to Henry Hub. Chart 5European Storage Absorbed ~ 40% Of Global Gas Supply Growth
Global Natgas Markets: Limited Upside, Elevated Downside Risks
Global Natgas Markets: Limited Upside, Elevated Downside Risks
By the end of 2019, gas storage in Europe was drastically higher than its 5-year average for that period (Chart 6). Chart 6Elevated US And Europe Gas Storage
Global Natgas Markets: Limited Upside, Elevated Downside Risks
Global Natgas Markets: Limited Upside, Elevated Downside Risks
European Storage Will Stay Below Capacity-Testing Levels Cargo cancellations for September have been markedly lower, a sign of improving – though still oversupplied – fundamentals. Global gas markets confronted the COVID-19 pandemic from a fragile starting point. The shock reinforced the imbalances that began in 2019 and completely erased US LNG’s competitiveness in European and Asian markets. As demand fell in response to lockdowns – down 2.8% in the US and 7% in Europe y/y in Jan-May by IEA’s reckoning – storage in Europe was projected to reach full capacity by end-August.2 Consequently, in June, natural gas prices plunged to a more than two-decade low to incentivize supply and demand adjustments. Around 100 LNG cargoes from the US were cancelled for delivery in June and July, based on EIA estimates (Chart 7). US LNG supply is now the main balancing factor in global gas markets: It is a high-cost source of supply when delivered to Europe or Asia and is contracted under more flexible agreements facilitating cargo cancellations. Over the short term, the number of vessels cancelled each month is an important indicator of storage availability in Europe. The decision to cancel a cargo is complex but mainly depends on whether the spreads between US Henry Hub (HH) and Dutch Title Transfer Facility (TTF) or Japan Korea Marker (JKM) prices cover the exporter's variable costs. Based on a Cheniere-type contract,3 this implies the spread must be higher than 115% of Henry Hub prices plus shipping and regasification costs (Chart 2). Chart 7US LNG Vessel Cancellations Balance Global Gas Markets
US LNG Vessel Cancellations Balance Global Gas Markets
US LNG Vessel Cancellations Balance Global Gas Markets
The spread failed to cover variable costs for most of 2020 and even moved to a premium – i.e. HH above TTF – in July. Moreover, because most contracts have a 40-day to 70-day notice period for cancellation, the supply of US LNG only reacted to the rapid drop in demand with a lag, aggravating the supply surplus and flooding European inventories. The resulting supply adjustments, combined with stronger-than-expected demand in Europe, have slowed the storage injections rates in August and pushed prices higher.4 Cancellations for September have been markedly lower, a sign of improving – though still oversupplied – fundamentals. Forward curve behavior suggests market participants expect US LNG shut-ins, combined with robust demand recovery in Asia and Europe, to move price spreads above variable costs by November this year (Chart 8). This is mostly a consequence of rising Asian LNG prices. We expect this will incentivize added exports of US LNG over the coming months which will move Henry Hub prices slightly higher over the winter. Chart 8Relative Price Spreads Cover LNG Variable Costs, But Not Total Costs
Global Natgas Markets: Limited Upside, Elevated Downside Risks
Global Natgas Markets: Limited Upside, Elevated Downside Risks
In fact, some cargoes are reportedly already selling their gas in forward Asian markets and taking longer routes or reducing their travel speed to remain at sea for longer and profit from these higher deferred prices.5 Still, the increase in US prices will be limited given that relative prices need to remain wide enough to cover LNG variable costs. While global prices will move up gradually over the winter, we believe their upside is bounded by the supply surplus, especially as US exports normalize. At current storage levels, a resurgence of lockdowns in the US or Europe would have drastic consequences, sending prices back below $2/MMBtu. On the demand side, low prices will favor additional coal-to-gas switching as economies recover in 2H20 (Chart 9). Current forward TTF prices are signaling deep drawdowns in European storage this winter as demand in the region increases (Chart 10). Chart 9Cheap Gas Favors Coal-To-Gas Switching
Global Natgas Markets: Limited Upside, Elevated Downside Risks
Global Natgas Markets: Limited Upside, Elevated Downside Risks
Chart 10TTF Forwards Signaling Strong Inventory Draws This Winter
TTF Forwards Signaling Strong Inventory Draws This Winter
TTF Forwards Signaling Strong Inventory Draws This Winter
In Chart 11, we simulated the remaining of the filling season based on previous monthly seasonal injection rates for Europe. This suggests storage remains at risk of being maxed out by October. However, we believe – in agreement with current forward curves – that the pickup in demand from recovering economic activity, coal-to-gas switching, and lower US exports will further diminish injection rates in Aug-Sep-Oct relative to historical rates (Chart 12). This will allow inventory to reach its seasonal peak slightly below capacity-testing levels. Chart 11Euopean Storage Remains A Significant Downside Risk
Euopean Storage Remains A Significant Downside Risk
Euopean Storage Remains A Significant Downside Risk
Chart 12Low US LNG Exports, Warmer Weather Drastically Reduced Injections In July
Global Natgas Markets: Limited Upside, Elevated Downside Risks
Global Natgas Markets: Limited Upside, Elevated Downside Risks
Moreover, flows from Europe to Ukraine should continue freeing up capacity in core EU storage facilities (Chart 13).6 Chart 13Filling Ukrainian Storage Acts As A Safety Valve
Global Natgas Markets: Limited Upside, Elevated Downside Risks
Global Natgas Markets: Limited Upside, Elevated Downside Risks
Chart 14Lower US Gas Supply Slows Inventory Builds
Global Natgas Markets: Limited Upside, Elevated Downside Risks
Global Natgas Markets: Limited Upside, Elevated Downside Risks
In the US, the multi-year-low active gas rigs in the Appalachian basin are starting to weigh on production. Moreover, collapsing oil production in major shale-oil basins is bringing associated gas – which is now more than 16% of total gas production – down rapidly (Chart 14). This contributes to the slowdown in domestic storage injection and to the recent Henry Hub price gains. Still, at current storage levels, a resurgence of lockdowns in the US or Europe would have drastic consequences, sending prices back below $2/MMBtu (Chart 15). Consequently, we believe short-term downside risks from lockdowns are too elevated to try to profit from the limited price increase expected this winter. Chart 15Renewed Lockdowns In Europe Would Push Storage to Capacity
Renewed Lockdowns In Europe Would Push Storage to Capacity
Renewed Lockdowns In Europe Would Push Storage to Capacity
Rising US-Russia Competition Keeps Prices Lower For Longer Global gas markets will stay oversupplied over the medium term. This will keep relative prices between the US and Europe/Asia below LNG exports’ full-cycle costs. In 2019, a record volume of liquefaction capacity reached FID globally (Chart 16). By 2025, global LNG capacity is expected to reach ~73Bcf/d, a ~ 15Bcf/d increase from current levels. Despite the COVID-19 shock, most projects under construction in the US remain on track to be completed as previously scheduled in 2020.7 Global gas markets will stay oversupplied over the medium term. This will keep relative prices between the US and Europe/Asia below LNG exports’ full-cycle costs – i.e. below variable costs plus a fixed contracted liquefaction capacity fee estimated at ~$3/MMBtu. Chart 16Record FID Risks Keeping Markets Oversupplied
Global Natgas Markets: Limited Upside, Elevated Downside Risks
Global Natgas Markets: Limited Upside, Elevated Downside Risks
Mounting competition – especially from Russia – in both Europe and Asia will hold down prices over the coming years. In Europe, the completion of the Nord Stream 2 pipeline would add 5.3Bcf/d of cheap Russian gas supply and could keep prices ~ $1/MMBtu lower than otherwise.8 These new volumes would be absorbed by higher European consumption – fueled by low prices – and lower US LNG exports – from weak relative prices. Geopolitics is a major factor driving Russian behavior and hence oversupply: The US and Russia will vie with each other for market share in Europe. As gas markets further liberalize globally, Europe will be increasingly essential for US LNG as its destination of last resort in times of low demand elsewhere. If Russia floods this market with gas, it reduces Europe’s ability to absorb US gas, which will lead to lower Henry Hub prices. It will shut in US supply in times of low demand, making investments there riskier. While US administrations of either party almost always attempt to engage Russia at the beginning of a four-year term, the US foreign policy establishment no longer believes that engagement with Russia is beneficial (Chart 17). This is apparent under the Russia-friendly Trump administration but will be especially relevant if the Democratic Party wins the White House in November. Democrats blame Russia for undermining and ultimately reversing the Obama administration’s policies by betraying the US-Russia diplomatic “reset” and interfering in the 2016 election. Chart 17Russian Geopolitical Risk Set To Increase Even If Trump Re-Elected
Russian Geopolitical Risk Set To Increase Even If Trump Re-Elected
Russian Geopolitical Risk Set To Increase Even If Trump Re-Elected
Hence the US will continue to impose sanctions on Russia and probably on a range of companies involved in Nord Stream 2 and Turkstream. If both pipelines are completed, then Washington will ask Europe to compensate for its Russia dealings in other ways. Meanwhile Russia will use a combination of commercial and strategic measures to woo Germany and the Europeans so that they do not commit to preferential bilateral deals with the United States. Because the US and Russia are engaged in a great power struggle – rather than healthy trade competition – they will attempt to achieve their aims through means other than price and volume. Punitive measures will create volatility by occasionally removing supplies but probably cannot change the backdrop of oversupply. The gist is that US-Russia relations will remain antagonistic and Europe will benefit from the oversupply except during times of surprise sanctions and strategic blows. In China, we expect imports of US LNG to increase. However, rising Russian LNG and pipeline supplies, increasing domestic gas output, and a persistent global oversupply of gas will limit the incentives for Chinese buyers to sign long-term agreements with US exporters at a price above full-cycle costs – i.e. ~ $7/MMBtu.9 The ongoing US-China trade conflict will encourage China to use US LNG imports as a negotiating lever. This has large implications for the US gas market, as LNG capacity represents ~ 11% of its domestic supply – based on 1H20 production levels. Low demand growth for its gas in Europe or Asia will keep Henry Hub prices low to limit supply growth from shale gas and limit investment in additional liquefaction capacity. Here too geopolitics will undermine Henry Hub prices: China is strengthening economic ties with its strategic partner, Russia, and the ongoing US-China trade conflict will encourage China to use US LNG imports as a negotiating lever. A Biden administration would approach China differently from the Trump administration but it would still have to face fundamental trade tensions due to China’s mercantilism and the US attempt to contain China’s technological rise. China is crucial for global LNG demand growth, but trade tensions will reignite even under Biden and spill over into China’s demand for US commodities. China has substitutes for American LNG. If trade tensions affect China’s imports of US LNG then they will lead to lower Henry Hub prices and possibly to vessel cancellations, especially if European storage once again proves unable to absorb these exports during the injection season. The Biden administration will not ultimately be China-friendly, looking beyond any diplomatic “reset” in its first year, and thus the risk of China diversifying away from US LNG is real. Global natgas prices are moving up, ahead of this winter, but gains will be limited by the persistent oversupply. There are currently more than 6Bcf/d of approved, not yet FID, projects in the US. We do not expect much of this capacity to move forward until LNG economics turn favorable and buyers’ willingness to sign long-term contracts comes back. Large projects expected to start closer to 2025 – e.g. Shell’s LNG Canada and Total’s Mozambique LNG – could be delayed to the second half of the decade. On the demand side, persistent low prices will reinforce two ongoing trends. First, this will favor additional coal-to-gas switching in most regions, helping demand to catch up to supply by 2024 and eventually forcing European and Asian prices significantly higher in anticipation of tighter fundamentals. Second, low spot LNG prices in Asia and the availability of flexible supply will accelerate the shift to a merchant/trading market.10 The movement toward shorter and non-indexed-oil contracts continued in 2019, with spot and short term contracts reaching 34% of total LNG flows in 2019, up 32% vs. 2018 (Chart 18). The COVID-19 shock augmented the incentive to switch to non-oil-indexed contracts given the steep discount it created in LNG spot market prices versus oil-indexed contracts. Based on our Brent price forecasts, we expect this divergence to persist in 2021 (Chart 19). Chart 18Shorter, Gas-On-Gas Contracts Will Increase In Asia
Global Natgas Markets: Limited Upside, Elevated Downside Risks
Global Natgas Markets: Limited Upside, Elevated Downside Risks
Chart 19Spot Prices Will Decouple From Oil-Indexed Again In 2021
Spot Prices Will Decouple From Oil-Indexed Again In 2021
Spot Prices Will Decouple From Oil-Indexed Again In 2021
The convergence in regional prices that began in 2019 is disrupting the standard LNG model based on significant regional price spreads. Low and uniform prices reduce the arbitrage of moving gas overseas. Companies will need to start using sophisticated financial instruments and will increasingly resort to spot and futures markets, like in oil markets.11 Crucially, our expectation that demand will catch up to supply assumes government policies aimed at reducing carbon emissions continue being implemented in major consuming countries. Future gas consumption is a function of economic – i.e. price incentives – and policy variables. A reversal in China’s environmental policies could drastically slow gas demand growth and remains a risk to our view. At present China’s policy setting aims for growth recovery at all costs, but the driver of Xi Jinping’s green policy is the middle class demand for healthier air and environment (Chart 20). Hence the slog to diversify away from coal will resume over the medium and long run. Bottom Line: The large collapse in prices will remain bearish for US LNG over the short term as global gas markets remain firmly oversupplied and storage levels hew dangerously close to maximum capacity. Global natgas prices are moving up, ahead of this winter, but gains will be limited by the persistent oversupply. Relative prices will be capped close to variable costs. These unfavorable conditions for additional investments in LNG projects could create a supply deficit later in the decade. Chart 20China"s Green Policy Is Driven By Its Growing Middle Class
China"s Green Policy Is Driven By Its Growing Middle Class
China"s Green Policy Is Driven By Its Growing Middle Class
Hugo Bélanger Associate Editor Commodity & Energy Strategy HugoB@bcaresearch.com Footnotes 1 These destination adjustments in response to price incentives are possible because of the flexibility in US long-term LNG agreements. These contracts, for the most part, have no predetermined destination clause. 2 For instance see "NWE gas storage sites could be 'almost' full by end-August: Platts Analytics" published by S&P Global Platts on May 21, 2020. 3 There exists two main types of LNG contracts in the US: (1) Tolling agreements in which the LNG exporter needs to secure the feedgas, transport the gas to the liquefaction facility, and ship it to the buyer. In this model, the LNG operator charges a fixed fee – usually in the range of $2.25 to $3.5/MMBtu, paid regardless of whether they use their contracted LNG space to liquefy the gas. The ownership of the gas remains in the hand of the offtaker. (2) Chienere-type agreements – or a hybrid merchant-tolling structure – in which the LNG operator secures the feedgas and transports it to its liquefaction facilities. It takes ownership of the gas until it is liquefied and sold to the exporter responsible for shipping the gas to the final buyer – the pricing scheme is usually ~115% of Henry Hub gas prices + a fixed liquefaction fee. In the US, the Cove Point, Freeport, Cameron, and Elba terminals mostly use the tolling model, while all of Cheniere’s installations – i.e. Sabine Pass and Corpus Christi – are operating under Cheniere-type models. In our analysis we use the Cheniere-type as it is slightly more flexible and seems more vulnerable to cargo cancellations – subject to a penalty, or fixed fee, to ensure a reliable cash flow to Cheniere. Moreover, it is difficult to estimate how much of the shipping cost are truly variable, some offtakers have long-term shipping contracts to diminish total variable costs. Please see “Steady as She Goes, Part 5 - How Global Prices Drive U.S. LNG Cargo Destinations,” published by RBN Energy on August 1, 2020 for a detailed discussion of LNG exporters’ costs. 4 Maintenance delays at Australia’s Gorgon LNG plant also contributed to the price increase, especially in Asia. Please see "Chevron says expects to restart Train 2 of Gorgon LNG plant in early September" published by reuters.com on July 28, 2020 for more details. 5 Please see "Buyers of U.S. LNG cancel September cargoes but pace slows, sources say," published by reuters.com on July 21, 2020. 6 Since May this year, the Ukrainian storage and gas pipeline managing company UkrTransGaz started offering discounts on transportation fees and other arrangements to incentivize European traders to storage gas at their facilities. Natgas stored by non-resident in customs warehouses with UkrTransGaz are more than four times higher than last year. Please see “European gas storage: backhaul helps open the Ukrainian safety valve,” published by Oxford Institute For Energy Studies in May 2020. 7 A few projects reported lockdown-related delays of up to 4 months. 8 Please see "Nord Stream 2 and the battle for gas market share in Europe" published by Wood Mackenzie on July 24, 2020. 9 Please see “No Upside: The U.S. LNG Buildout Faces Price Resistance From China,” published by The Institute for Energy Economics and Financial Analysis (IEEFA), July 2020. 10 We highlighted in our October 4, 2018 report titled "US Set To Disrupt Global LNG Market" that the large LNG supply expansion in the US would incentivize consumers to shorten the tenor of oil-indexed contracts, replacing them with hedgeable futures-based contracts. 11 Please see “Covid-19 And The Energy Transition,” published by Oxford Institute For Energy Studies in July 2020. Investment Views and Themes Recommendations Strategic Recommendations Tactical Trades Trade Recommendation Performance In 2020 Q2
Russia Again Examines Oil Hedging
Russia Again Examines Oil Hedging
Commodity Prices and Plays Reference Table Trades Closed in 2020 Summary of Closed Trades
Russia Again Examines Oil Hedging
Russia Again Examines Oil Hedging