Global

Highlights Both public opinion polls and betting markets suggest that Joe Biden will become President, with the Democrats gaining control of the Senate and retaining the House of Representatives. Such a “blue wave” would have mixed effects on the value of the S&P 500. On the one hand, corporate taxes would rise under a Biden administration. On the other hand, trade relations with China would improve. The Democrats would also push for more fiscal stimulus, which the stock market would welcome. The odds of Republicans and Democrats agreeing on a major new stimulus deal before the November elections look increasingly slim. In a blue wave scenario, the Democrats will enact $2.5-to-$3.5 trillion in pandemic relief shortly after Inauguration Day. Joe Biden‘s platform also calls for around 3% of GDP in additional spending on infrastructure, health care, education, climate, housing, and other Democratic priorities. Unlike in late 2016, the Fed is in no mood to raise interest rates. Large-scale fiscal easing will push down the value of the US dollar, while giving bond yields a modest boost. Non-US stocks will outperform their US peers. Value stocks will outperform growth stocks. Looking further out, Republicans will move to the left on economic issues, leaving corporate America with no clear backer among the two major parties. As such, while we are constructive on equities over the next 12 months, we see grave dangers ahead later this decade. Look, Here's The Deal: Joe Biden Is In The Lead With four weeks remaining until the US presidential election, Joe Biden remains on course to become the 46th president of the United States. According to recent public opinion polls, the former vice president leads Donald Trump by 10 percentage points nationwide, and by 4 points in battleground states (Chart 1). Far fewer voters are undecided today compared to 2016. This suggests that there is less scope for President Trump to narrow his deficit in the polls. Betting markets give Biden a 68% chance of prevailing in the race for the White House (Chart 2). They also assign a 67% probability that the Democrats will take control of the Senate and 89% odds that they will retain their majority in the House of Representatives. Chart 1Opinion Polls Favor Biden ...
Market Implications Of A Blue Wave
Market Implications Of A Blue Wave
Chart 2.... As Do Betting Markets
Market Implications Of A Blue Wave
Market Implications Of A Blue Wave
Mixed Impact On The S&P 500 What would the market implications of a “blue wave” be? Our sense is that the overall impact on the value of the S&P 500 would be small, largely because some negative repercussions from a Democratic sweep would be offset by positive repercussions. On the negative side, Biden has pledged to raise the corporate income tax rate from 21% to 28%, bringing it halfway back to the 35% rate that prevailed in 2017. He has also promised to introduce a minimum of 15% tax on the income that companies report in their financial statements to shareholders, raise taxes on overseas profits, and lift payroll taxes on households with annual earnings in excess of $400,000. Together, these measures would reduce S&P 500 earnings-per-share by 9%-to-10%. On the positive side, while geopolitical tensions will persist, US trade relations with China would likely improve if Joe Biden were to become the president. Biden has roundly criticized Trump’s tariffs, saying that they are “crushing farmers” and “hitting a lot of American manufacturing… choking it to within an inch of its life.”1 He has pledged to honor multilateral agreements. The World Trade Organization concluded on September 15 that Trump’s tariffs violated international trade rules. This judgement and the desire to turn the page on the Trump era could give Biden the impetus to eventually roll back some of the tariffs. In contrast, having been stricken by what he has called the “China virus,” Trump could take things personally and retaliate with a flurry of new punitive measures. Fiscal policy would be further loosened in a blue wave scenario, an outcome that the stock market would welcome. Voters would also applaud more pandemic relief. Table 1 shows that 72% of Americans, including the majority of Republicans, support the broader contours of the $2 trillion stimulus package that President Trump has rejected. Table 1Voters Support A New $2 Trillion Coronavirus Stimulus Package By A Fairly Wide Margin
Market Implications Of A Blue Wave
Market Implications Of A Blue Wave
At this point, the odds of Republicans and Democrats agreeing on a major new stimulus deal before the November elections look increasingly slim. If Biden wins and the Republicans lose control of the senate, the Democrats would likely enact a stimulus package worth $2.5-to-$3.5 trillion shortly after Inauguration Day on January 20. In addition to pandemic-related stimulus, Joe Biden has called for around 3% of GDP in spending on infrastructure, health care, education, climate, housing, and other Democratic priorities. Only about half of those expenditures would be matched by higher taxes, implying substantial net stimulus for the economy. A Weaker Dollar And Modestly Higher Bond Yields The greenback jumped on Tuesday after President Trump said he is breaking off negotiations with the Democrats over a new stimulus bill. This suggests that the dollar will weaken if fiscal policy is loosened. If that were to happen, it would be different from what transpired following Trump’s victory in 2016 when the dollar strengthened. Why the disconnect between now and then? The answer has to do with the outlook for monetary policy. Back then, the Fed was primed to start raising rates again – it hiked rates eight times beginning in December 2016, ultimately bringing the fed funds rate to 2.5% by end-2018 (Chart 3). This time around, the Fed is firmly on hold, with the vast majority of FOMC members expecting policy rates to stay at rock-bottom levels until at least 2023. This suggests that nominal bond yields will rise less than they did in late 2016. Since inflation expectations will likely move up in response to more stimulative fiscal policy, real yields will rise even less than nominal yields. Over the past 18 months, US real rates have fallen a lot more in relation to rates abroad than what one would have expected based on the fairly modest depreciation in the US dollar (Chart 4). If US real rates remain entrenched deep in negative territory, while the US current account deficit widens further on the back of strong domestic demand, the dollar will continue to weaken. Chart 3Trump Victory Was Followed By Rising Interest Rates
Trump Victory Was Followed By Rising Interest Rates
Trump Victory Was Followed By Rising Interest Rates
Chart 4A Relatively Muted Decline In The Dollar Given The Move In Real Yield Differentials
A Relatively Muted Decline In The Dollar Given The Move In Real Yield Differentials
A Relatively Muted Decline In The Dollar Given The Move In Real Yield Differentials
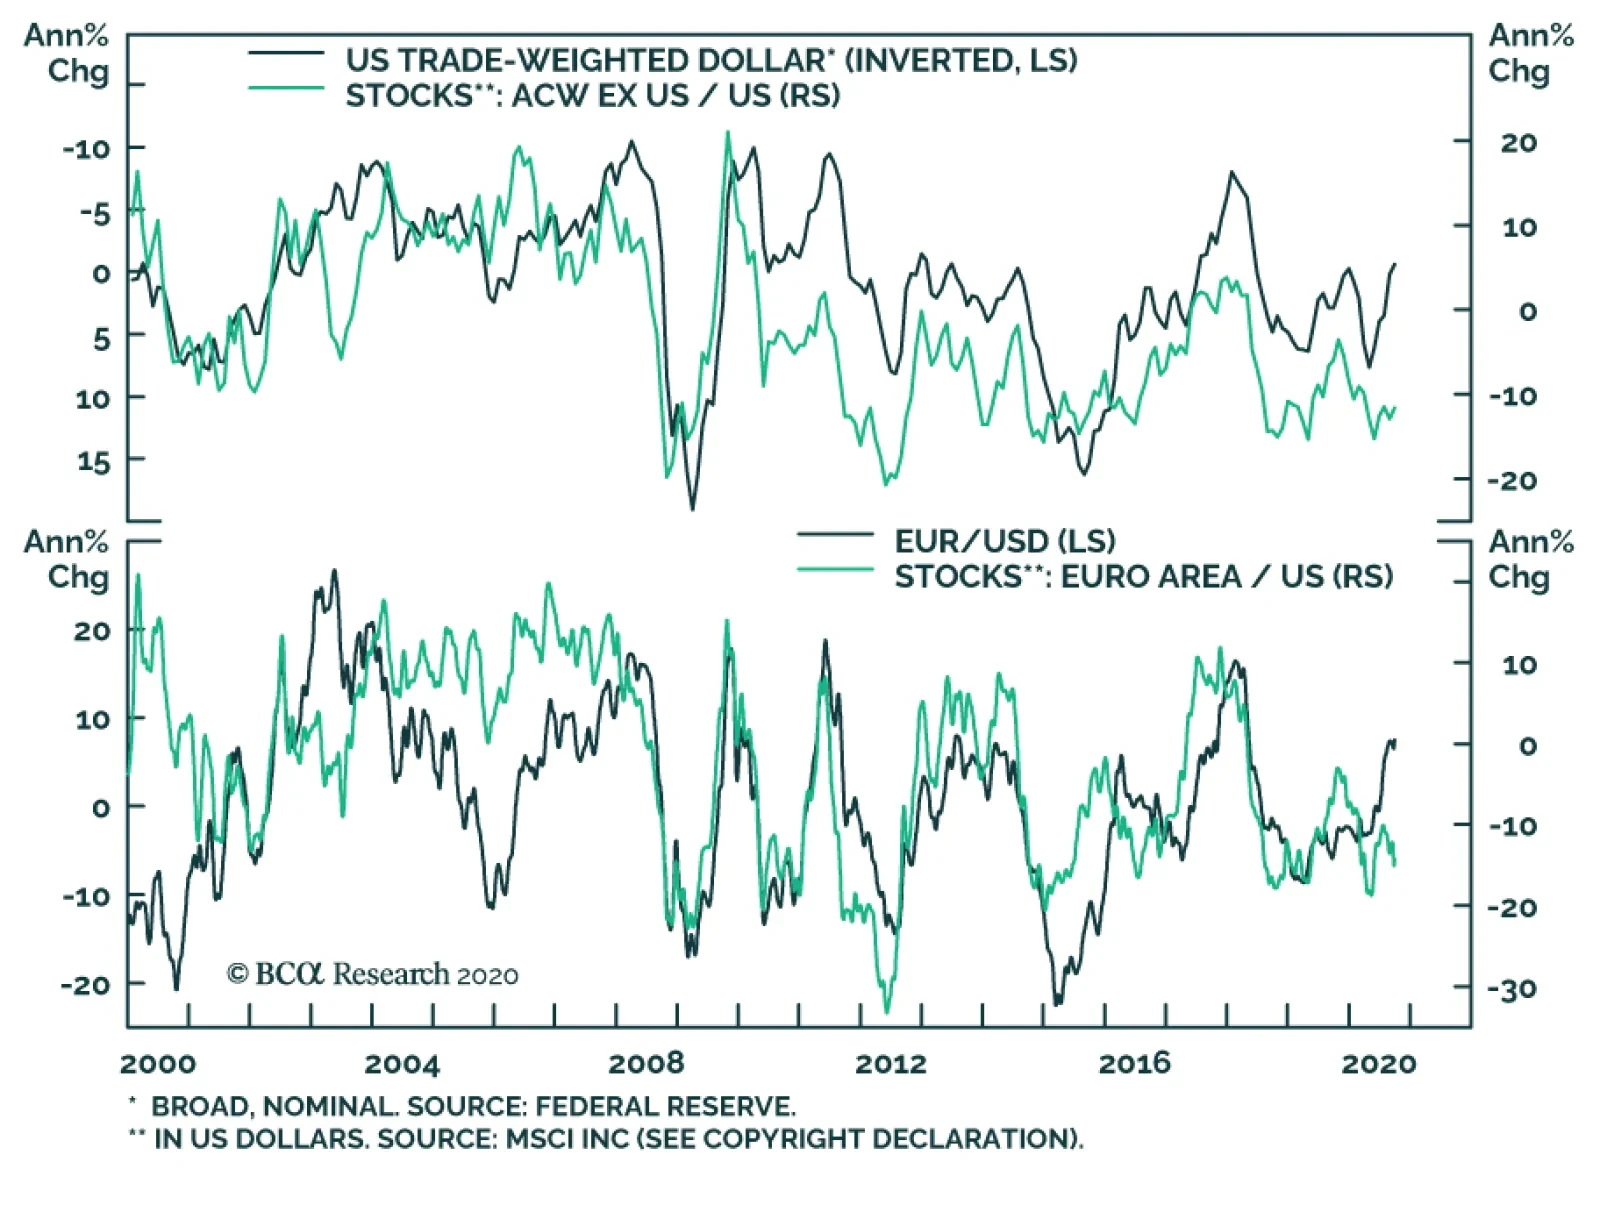
Favor Non-US And Value Stocks Non-US stocks typically outperform their US peers when the dollar is weakening (Chart 5). This partly stems from the fact that cyclical stocks are overrepresented in stock markets outside of the United States. It also reflects the fact that cash flows denominated in say, euros or yen, are worth more in dollars if the value of the dollar declines. Chart 5A Weaker Dollar Tends To Benefit Cyclical And Non-US Stocks
A Weaker Dollar Tends To Benefit Cyclical And Non-US Stocks
A Weaker Dollar Tends To Benefit Cyclical And Non-US Stocks
Financial stocks are overrepresented outside the US (Table 2). They are also overrepresented in value indices (Table 3). While a Biden administration would subject the largest US banks to additional regulatory scrutiny, the impact on their bottom lines would likely be small. US banks have been living under the shadows of the Dodd-Frank Act for over a decade. Today, banks operate more as stable utilities than as cavalier casinos. Table 2Financials Are Overrepresented In Ex-US Indexes, While Tech Dominates The US Market
Market Implications Of A Blue Wave
Market Implications Of A Blue Wave
Table 3Financials Are Overrepresented In Value, While Tech Dominates Growth Indexes
Market Implications Of A Blue Wave
Market Implications Of A Blue Wave
Stronger stimulus-induced growth next year will allow many banks to release some of the hefty provisions against bad loans that they built up this year, while modestly steeper yields curves will boost net interest margins. Tech stocks are overrepresented in growth indices. Better trade relations would help US tech companies, as would a weaker dollar. That said, Joe Biden’s plan to increase taxes on overseas profits would hit tech companies disproportionately hard since the tech sector derives over half its revenue from outside the United States. Stepped up antitrust enforcement and more stringent privacy rules could also weigh on tech profits. On balance, while there are many moving parts, a Democratic sweep would favor non-US equities over US equities, and value stocks over growth stocks. Trumpism Transcends Trump Chart 6Trump Targeted Socially Conservative Voters
Market Implications Of A Blue Wave
Market Implications Of A Blue Wave
In 2016, we bucked the consensus view that Hillary Clinton would win the election. On September 30, 2016, we predicted that “Trump will win and the dollar will rally,” noting that “Trump has seen a huge (yuge?) increase in support among working-class whites. If the so-called “likely voters” backing Clinton are, in fact, less likely to turn out at the polls than those backing Trump, this could skew the final outcome in Trump's favor.”2 Right-wing populism was the $1 trillion bill lying on the sidewalk that no mainstream Republican politician seemed eager to pick up. According to the Voter Study Group, only 4% of the US electorate identified as socially liberal and fiscally conservative in 2016, compared to 29% who saw themselves as fiscally liberal and socially conservative (Chart 6). The latter group had no political home, at least until Donald Trump came along. Rather than waxing poetically about small government conservatism – as most establishment Republicans were wont to do – Trump railed against mass immigration, unfair trade deals, rising crime, never-ending wars, and what he described as out-of-control political correctness. While Trump was able to carry out parts of his protectionist agenda, most of his other actions fell well short of what he had promised. His only major legislative achievement was a massive tax cut for corporations and wealthy individuals – something that the vast majority of his base never asked for. The Rich Are Flocking To The Democratic Party How did corporations and wealthy Americans reward Trump for lowering their taxes? By shifting their allegiances towards the Democrats, that’s how. According to the Pew Research Center, households earning more than $150,000 favored Democrats by 20 percentage points during the 2018 Congressional elections, a 13-point jump from 2016. Households earning between $30,000 and $149,999 favored Democrats by only 6 points in 2018. The only other income group that strongly favored Democrats were those earning less than $30,000 per year (Table 4). Table 4Democratic Candidates Had Wide Advantages Among The Highest-And-Lowest Income Voters
Market Implications Of A Blue Wave
Market Implications Of A Blue Wave
Chart 7Democratic Districts Have Fared Better Over The Past Decade
Market Implications Of A Blue Wave
Market Implications Of A Blue Wave
Other data tell a similar story. Median household income in Democratic congressional districts rose by 13% between 2008 and 2017. It fell by 4% in Republican districts. Today, on average, Republican districts have a median income that is 13% below Democratic districts (Chart 7). Campaign donations have shifted towards the Democrats. The latest monthly fundraising data shows that the Biden campaign received three times more large-dollar contributions in total than the Trump campaign. The nation’s CEOs have not been immune from this transformation. Seventy-seven percent of the business leaders surveyed by the Yale School of Management on September 23 said they would be voting for Joe Biden.3 As elites desert the Republican Party, will the Democratic Party start championing lower taxes and less regulation? That seems unlikely. According to the Voter Study Group, higher-income Democrats are actually more likely to support raising taxes on families earning more than $200,000 per year than lower-income Democrats (83% versus 79%). Among Republicans, the opposite is true: 45% of lower-income Republicans are in favor of raising taxes, compared to only 23% of higher-income Republicans.4 There used to be a time when companies tried to steer clear of the political limelight. This is starting to change. As the relative purchasing power of Democratic voters has risen, many companies have become emboldened to adopt overtly political stances on a variety of hot-button social and cultural issues, even if those stances alienate many conservative customers. What does this imply for investors? If big business abandons conservative voters, conservative voters will abandon big business. Corporate America will be left with no clear backer among the two major parties. Over the long haul, this is likely to be bad news for equity investors. As such, while we are constructive on equities over the next 12 months, we see grave dangers ahead later this decade. Peter Berezin Chief Global Strategist peterb@bcaresearch.com Footnotes 1 “Biden Takes On ‘Trump’s Tariffs’,” The Wall Street Journal, June 12, 2019. 2 Please see Global Investment Strategy Special Report, “Three (New) Controversial Calls,” dated September 30, 2016. 3 “CEO Caucus Survey: Business Leaders Fault Trump Administration on COVID and China,” Yale School of Management, September 24, 2020. 4 Lee Drutman, Vanessa Williamson, Felicia Wong, “On the Money: How Americans’ Economic Views Define — and Defy — Party Lines,” votersstudygroup.org, June 2019. Global Investment Strategy View Matrix
Market Implications Of A Blue Wave
Market Implications Of A Blue Wave
Current MacroQuant Model Scores
Market Implications Of A Blue Wave
Market Implications Of A Blue Wave
BCA Research's Global Fixed Income Strategy service still prefers keeping aggregate portfolio duration close to benchmark, with only a moderate overweight allocation to spread product versus government bonds. Instead, investors should focus on relative value…
BCA Research has a neutral tactical equity stance within our cyclically constructive view. Practically, how can investors best achieve this exposure profile? A simple strategy is to overweight global equities within a core portfolio but overlay some…
BCA Research's Foreign Exchange Strategy service estimates that while the evolution of the pandemic will have some near-term impact on currencies, the biggest driver of FX returns remain fiscal policy. As we approach the winter season in the northern…
Highlights Misunderstanding 1: The danger of Covid-19 is its short-term mortality rate. In fact, the danger of Covid-19 is its long-term mortality and morbidity rate. Misunderstanding 2: The government-imposed lockdown causes the pandemic recession. In fact, the pandemic causes the pandemic recession. Misunderstanding 3: The pandemic’s main economic casualty is output. In fact, the pandemic’s main economic casualty is employment. Misunderstanding 4: The pandemic is a temporary shock to the way we live, work, and interact. In fact, the pandemic is accelerating long-term shifts in the way we live, work, and interact. Misunderstanding 5: The pandemic is pulling Europe apart. In fact, the pandemic is pulling Europe together. Feature Chart of the WeekThe Pandemic Is Pulling Europe Together
The Pandemic Is Pulling Europe Together
The Pandemic Is Pulling Europe Together
Covid-19 is a novel disease. And living through a pandemic is a novel experience for most of us. The result is that many things are not fully understood. In this report, we pull together five major misunderstandings about the Covid-19 pandemic. Or at least, five topics on which we disagree with the mainstream narratives. Misunderstanding 1: The danger of Covid-19 is its short-term mortality rate. Truth 1: The danger of Covid-19 is its long-term mortality and morbidity rate. Some people argue that the danger of Covid-19 is overstated. The mortality rate seems low, especially in the new waves of the pandemic. These people argue that we should just let the pandemic rip to achieve so-called ‘herd immunity’. Yet this focus on the low immediate mortality rate misunderstands the true danger (Chart I-2). Chart I-2Focussing On Covid-19’s Low Immediate Mortality Rate Misunderstands The Danger
Five Major Misunderstandings About Covid-19
Five Major Misunderstandings About Covid-19
The true danger might come from the long-term impact on mortality and morbidity. A good analogy is a non-lethal dose of radiation. It won’t kill you straightaway, and you might not even feel any immediate ill effects, but the exposure does irreparable long-term harm. Unlike other diseases, Covid-19 appears to have long-term sequelae. Unlike other diseases, Covid-19 appears to have long-term sequelae. It can permanently damage your respiratory, vascular, and metabolic systems. As The Lancet points out:1 “Weeks and months after the onset of Covid-19, people continue to suffer. 78 of 100 patients in an observational cohort study who had recovered from Covid-19 had abnormal findings on cardiovascular MRI and 36 reported dyspnoea and unusual fatigue… these patients are not only those recovering from the severe form of the acute disease, but also those who had mild and moderate disease. Long-term sequelae of Covid-19 are unknown… Other concerns are rising: does it cause diabetes, or other metabolic disorders? Will patients develop interstitial lung disease? We owe good answers on the long-term consequences of the disease to our patients and healthcare providers.” Until we know these answers, letting the pandemic rip to achieve herd-immunity is a very dangerous misunderstanding. Misunderstanding 2: The government-imposed lockdown causes the pandemic recession. Truth 2: The pandemic causes the pandemic recession. A pandemic is a classic complex adaptive system, in which there is constant feedback from millions of individual human actions to the pandemic, and from the pandemic to millions of individual human actions. It is this complex adaptive behaviour that generates a pandemic’s classic waves of infection, as well as its recessions. In response to an escalating pandemic, our instinct for self-preservation makes us go into our shells. In response to an escalating pandemic, our instinct for self-preservation makes us go into our shells. We shun crowds and public places, with the result that so-called ‘social consumption’ collapses. The misunderstanding is that the government-imposed lockdown causes the collapse in social consumption. In fact, this is a classic confusion between correlation and causation. The true cause of the recession is that the escalating pandemic is making millions of people go into their shells. But to the extent that an escalating pandemic also leads to an escalating lockdown, many people confuse the correlated lockdown with the underlying cause, the escalating pandemic. As we have previously pointed out, Sweden imposed no lockdown, while its neighbour Denmark imposed the most extreme lockdown in Europe. If it was the government-imposed lockdown that caused the recession, then the economy of no-lockdown Sweden should have fared much better than that of lockdown Denmark. In fact, based on the rise in unemployment rates, no-lockdown Sweden performed worse than lockdown Denmark (Chart I-3 and Chart I-4). Chart I-3No-Lockdown Sweden Performed No Better...
No-Lockdown Sweden Performed No Better...
No-Lockdown Sweden Performed No Better...
Chart I-4...Than Lockdown Denmark
...Than Lockdown Denmark
...Than Lockdown Denmark
Misunderstanding 3: The pandemic’s main economic casualty is output. Truth 3: The pandemic’s main economic casualty is employment. The widespread use of physical distancing and face masks restricts any activity that requires the use of your mouth and nose in proximity to others. These activities are concentrated in three highly labour-intensive sectors: hospitality, retail, and transport. Using the US as a template, hospitality, retail, and transport contribute 12 percent of economic output, but employ 25 percent of all workers (Table I-1). If the pandemic forces these sectors to operate one third below full capacity, the economy will lose a tolerable 4 percent of output. But it will lose a devastating 8.3 percent of jobs. And on less optimistic assumptions, the job destruction could rise to well over 10 percent. Table I-1Sectors Hurt By Social Distancing Employ 25% Of All Workers
Five Major Misunderstandings About Covid-19
Five Major Misunderstandings About Covid-19
Conversely, sectors which are unaffected by physical distancing and face masks make a much bigger contribution to economic output relative to employment. Financial activities generate 19 percent of economic output, but just 6 percent of jobs. Information technology generates 5 percent of output, but just 2 percent of jobs. Sectors hurt by social distancing employ 25 percent of all workers. Hence, the main economic casualty of the pandemic is not output. The main casualty is employment (Chart I-5 and Chart I-6). Worse, as employment suffers much more than output, the pandemic is devastating low-paid jobs. Chart I-5The Main Economic Casualty Of The Pandemic Is Employment…
Five Major Misunderstandings About Covid-19
Five Major Misunderstandings About Covid-19
Chart I-6…Not ##br##Output
Five Major Misunderstandings About Covid-19
Five Major Misunderstandings About Covid-19
Misunderstanding 4: The pandemic is a temporary shock to the way we live, work, and interact. Truth 4: The pandemic is accelerating long-term shifts in the way we live, work, and interact. The pandemic appears to have crystallised many shifts in consumer and business behaviour: for example, de-urbanisation, the shift from offline to online retailing, the shift from office working to remote working, and the shift from business travel to virtual meetings. In fact, these shifts were already in motion well before the pandemic hit (Chart I-7 and Chart I-8). Chart I-7The Pandemic Is Accelerating The Structural Shifts To De-Urbanisation…
Five Major Misunderstandings About Covid-19
Five Major Misunderstandings About Covid-19
Chart I-8…And Online ##br##Shopping
Five Major Misunderstandings About Covid-19
Five Major Misunderstandings About Covid-19
If the pandemic suddenly ended tomorrow, would people flock back to full-time office work in city centres? Would they flock back to bricks and mortar retailers? Would they return to the same intensity of long-haul business travel? We think not, because the shifts from these activities are not temporary. They are structural. The pandemic is devastating low-paid jobs. The pandemic has accelerated the hollowing out of labour-intensive industries such as bricks and mortar retailing, city centre cafes, bars and restaurants, and commercial travel. Combined with the ongoing threat to jobs from AI, this hollowing out process is blighting the job prospects of a generation, creating large numbers of underemployed and unemployed workers. Misunderstanding 5: The pandemic is pulling Europe apart. Truth 5: The pandemic is pulling Europe together. Let’s end on a positive note. The pandemic has allowed Europe to smash two major taboos: explicit fiscal transfers across countries, and the large-scale issuance of common EU bonds. The EU recovery plan also starts discussions on how the EU can ‘increase its own resources’. Which is to say, raise its own taxes. 2020 might turn out to be the most important year for European integration. The EU’s €750 billion ‘Next Generation’ recovery plan comprises €390 billion of grants whose main beneficiaries will be Italy and Spain – and these grants will be funded by common EU issuance. In breaking the long-standing taboos of fiscal transfers and common issuance, Next Generation constitutes a giant step towards European integration. Specifically, Italy’s net grant entitlement is likely to outweigh its contributions to the EU’s 2021-27 budget cycle. Thereby, Italy will flip from a net contributor to a net recipient of EU funds. The willingness to flip the sign of Italy’s contribution marks a sea-change in the EU’s attitude on fiscal solidarity, whose long-term significance should not be underestimated. 2020 might turn out to be the most important year for European integration. The irony is that it took a global pandemic to achieve it. Investment Conclusions The huge and growing slack in labour markets means that zero and negative interest rate policy will become a permanent feature of our lives. Hence, the relatively higher yielding 30-year US T-bond remains an effective hedge against stock market dislocations, as it did in March. Equity sectors whose profits can thrive off the shifts in the way we live, work, and interact, will outperform – specifically, technology, biotechnology, healthcare, and communications. Thereby, stock markets with an overweighting to these sectors will also outperform. The devastation of low-paying jobs means that bank credit growth is set to remain structurally weak or even non-existent. As such, banks should be bought for tactical countertrend moves (as now), but not for the long term. The yield spreads on euro area ‘periphery’ bonds over Germany and France will continue to tighten, and ultimately reach zero (Chart of the Week and Chart I-9). Chart I-9The Pandemic Is Pulling Europe Together
The Pandemic Is Pulling Europe Together
The Pandemic Is Pulling Europe Together
Fractal Trading System* Within the EM universe, the strong outperformance of India versus Czech Republic is vulnerable to a countertrend sell-off. Accordingly, this week’s recommended trade is short MSCI India versus MSCI Czech Republic. The profit target and symmetrical stop-loss is set at 8 percent. Chart I-10MSCI: India Vs. Czech Republic
MSCI: India Vs. Czech Republic
MSCI: India Vs. Czech Republic
In other trades, long USD/PLN achieved its 4 percent profit target, and short AUD/CHF reached the end of its holding period in profit. The rolling 1-year win ratio now stands at 57 percent. When the fractal dimension approaches the lower limit after an investment has been in an established trend it is a potential trigger for a liquidity-triggered trend reversal. Therefore, open a countertrend position. The profit target is a one-third reversal of the preceding 13-week move. Apply a symmetrical stop-loss. Close the position at the profit target or stop-loss. Otherwise close the position after 13 weeks. * For more details please see the European Investment Strategy Special Report “Fractals, Liquidity & A Trading Model,” dated December 11, 2014, available at eis.bcaresearch.com. Dhaval Joshi Chief European Investment Strategist dhaval@bcaresearch.com Footnotes 1 Please see The Lancet, Long-term consequences of Covid-19: research needs, September 1, 2020. Fractal Trading System Cyclical Recommendations Structural Recommendations Closed Fractal Trades Trades Closed Trades Asset Performance Currency & Bond Equity Sector Country Equity Indicators Bond Yields Chart II-1Indicators To Watch - Bond Yields
Indicators To Watch - Bond Yields
Indicators To Watch - Bond Yields
Chart II-2Indicators To Watch - Bond Yields
Indicators To Watch - Bond Yields
Indicators To Watch - Bond Yields
Chart II-3Indicators To Watch - Bond Yields
Indicators To Watch - Bond Yields
Indicators To Watch - Bond Yields
Chart II-4Indicators To Watch - Bond Yields
Indicators To Watch - Bond Yields
Indicators To Watch - Bond Yields
Interest Rate Chart II-5Indicators To Watch - Interest Rate Expectations
Indicators To Watch - Interest Rate Expectations
Indicators To Watch - Interest Rate Expectations
Chart II-6Indicators To Watch - Interest Rate Expectations
Indicators To Watch - Interest Rate Expectations
Indicators To Watch - Interest Rate Expectations
Chart II-7Indicators To Watch - Interest Rate Expectations
Indicators To Watch - Interest Rate Expectations
Indicators To Watch - Interest Rate Expectations
Chart II-8Indicators To Watch - Interest Rate Expectations
Indicators To Watch - Interest Rate Expectations
Indicators To Watch - Interest Rate Expectations
In its Quarterly Outlook, BCA Research's Global Investment Strategy service concludes that improving global growth and a weak dollar will favor foreign equities at the expense of the US. Three potential catalysts could help propel international stocks…
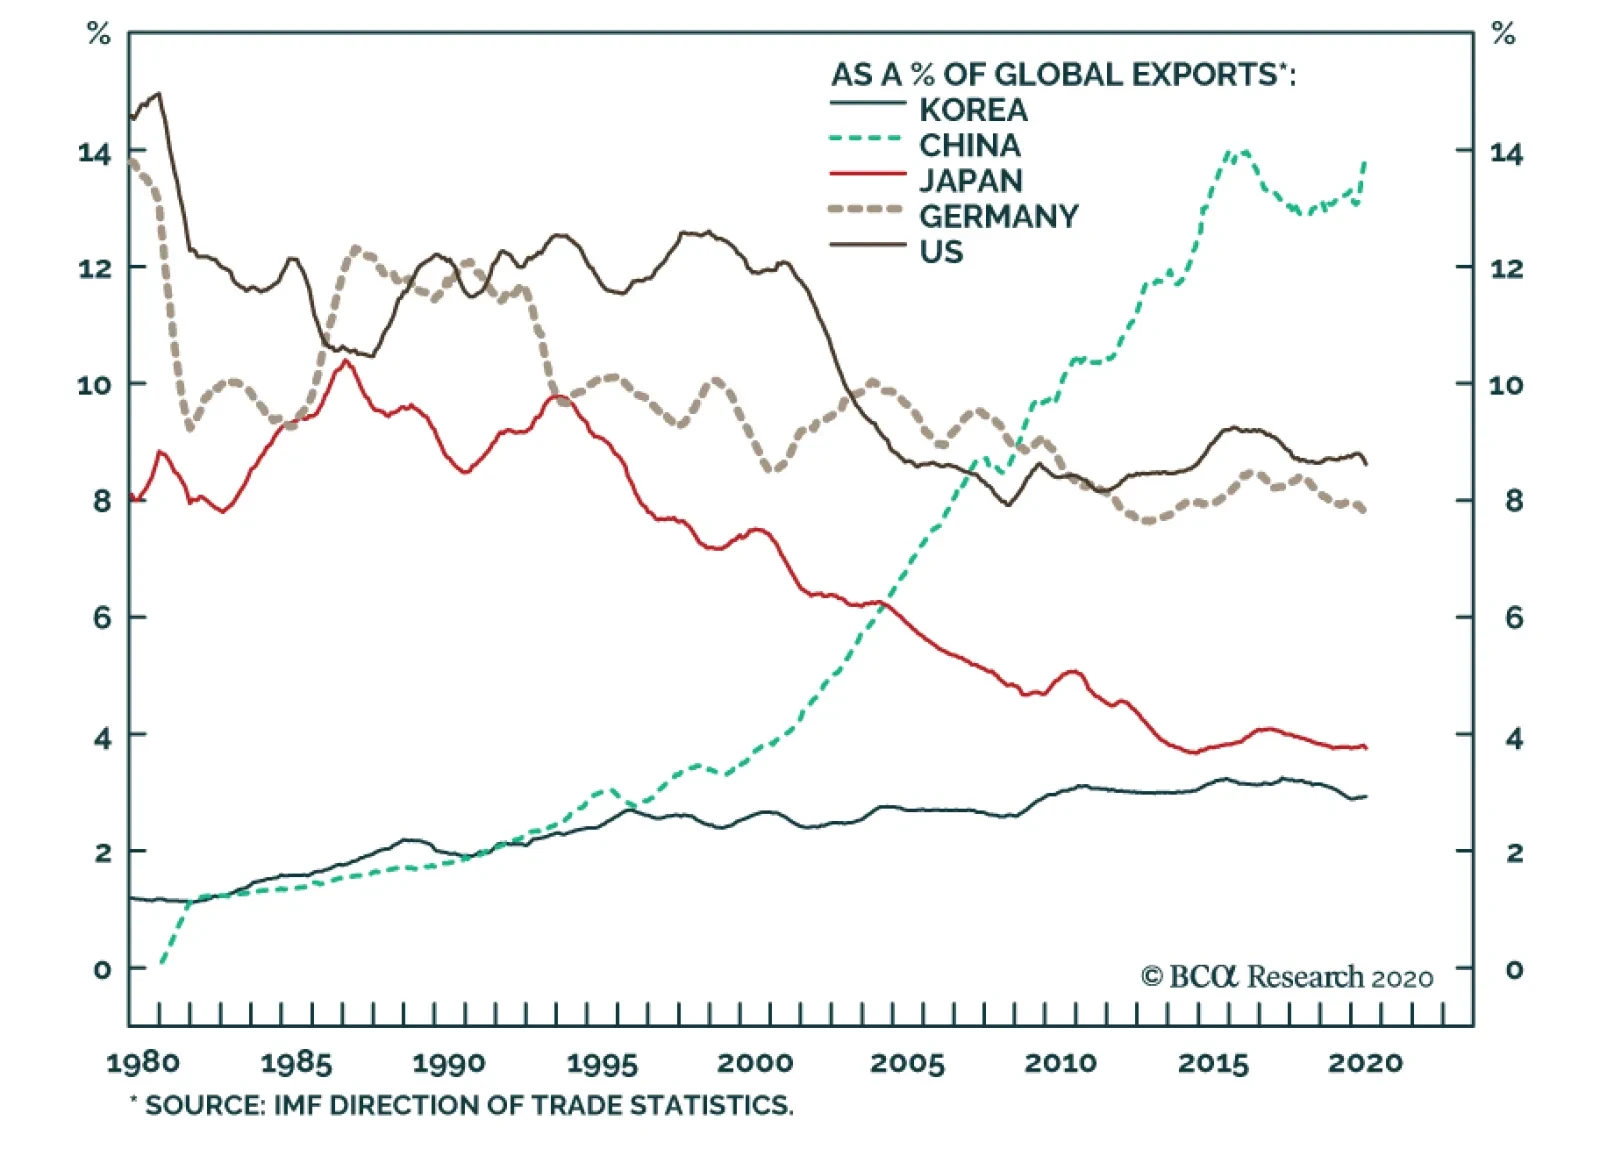
BCA Research's China Investment Strategy & Emerging Markets Strategy services conclude that increasing regionalized global supply chains will benefit several emerging Asian economies – Vietnam and India, in particular. Meanwhile, Mexico will gain in terms…
Dear Client, We are sending you our Quarterly Strategy Outlook today, where we outline our thoughts on the macro landscape and the direction of financial markets for the rest of the year and beyond. We will also be hosting a webcast on Thursday, October 1st at 10:00 AM EDT (3:00 PM BST, 4:00 PM CEST, 10:00 PM HKT) where we will discuss the outlook. Best regards, Peter Berezin, Chief Global Strategist Highlights Macroeconomic outlook: Global growth faces near-term challenges from a resurgence in the pandemic and the failure of the US Congress to pass a stimulus deal. However, growth should revive next year as a vaccine becomes available and fiscal policy turns stimulative again. Global asset allocation: Favor equities over bonds on a 12-month horizon, while maintaining somewhat larger than normal cash positions in the short run that can be deployed if stocks resume their correction. Equities: Prepare to pivot from the “Pandemic trade” to the “Reopening trade.” Vaccine optimism should pave the way for cyclicals to outperform defensives, international stocks to outperform their US peers, and for value to outperform growth. Fixed income: Bond yields will rise modestly, suggesting that investors should maintain below average duration exposure. Favor inflation-protected securities over nominal bonds. Spread product will outperform safe government bonds. Currencies: The US dollar will weaken over the next 12 months. The collapse in interest rate differentials, stronger global growth, and a widening US trade deficit are all bearish for the greenback. Commodities: Rising demand and constrained supply will support oil prices, while Chinese stimulus will buoy industrial metals. Investors should buy gold and other real assets as a hedge against long-term inflation risk. I. Macroeconomic Outlook Policy And The Pandemic Will Continue To Drive Markets Going into the fourth quarter of 2020, we are tactically neutral on global equities but remain overweight stocks and other risk assets on a 12-month horizon. As has been the case for much of the year, both the virus and the policy response to the pandemic will continue to be key drivers of market returns. Coronavirus: Still Spreading Fast, But Less Deadly On the virus front, the global number of daily new cases continues to trend higher, with the 7-day average reaching a record high of nearly 300,000 this week (Chart 1). Chart 1Globally, The Number Of Daily New Cases Continues To Trend Higher
Fourth Quarter 2020 Strategy Outlook: A Post-Pandemic Regime Shift
Fourth Quarter 2020 Strategy Outlook: A Post-Pandemic Regime Shift
The number of daily new cases in the EU has risen above its April peak. Spain and France have been particularly hard hit. Canada is also seeing a pronounced rise in new cases. In the US, the number of new cases peaked in July. However, the 7-day average has been creeping up since early September, raising the risk of a third wave. On the positive side, mortality rates in most countries remain well below their spring levels. There is no clear consensus as to why the virus has become less lethal. Better medical treatments, including the use of low-cost steroids, have certainly helped. A shift in the incidence of cases towards younger, healthier people has also lowered the overall mortality rate. In addition, there is some evidence that the virus may be evolving to be more contagious but less deadly.1 It would not be surprising if that were the case. After all, a virus that kills its host will also kill itself. Lastly, pervasive mask wearing may be mitigating the severity of the disease by reducing the initial viral load that infected individuals receive.2 A smaller initial dose gives the immune system more time to launch an effective counterattack. It has even been speculated that the widespread use of masks may be acting as a form of “variolation.” Prior to the invention of vaccines, variolation was used to engender natural immunity. Perhaps most famously, upon taking command of the Continental Army in 1775, George Washington had all his troops exposed to small amounts of smallpox.3 The gamble worked. The US ended up winning the Revolutionary War, making Washington the first president of the new republic. Waiting For A Vaccine Despite the decline in mortality rates, there is still much that remains unknown about Covid-19, including the extent to which the disease will lead to long-term damage to the vascular and nervous systems. Thus, while governments are unlikely to impose the same sort of severe lockdown measures that they implemented in March, rising case counts will delay reopening plans, and in many cases, lead to the reintroduction of stricter social distancing rules. Chart 2Some States Have Started To Relax Lockdown Measures
Fourth Quarter 2020 Strategy Outlook: A Post-Pandemic Regime Shift
Fourth Quarter 2020 Strategy Outlook: A Post-Pandemic Regime Shift
This has already happened in a number of countries. The UK reinstated more stringent regulations over social gatherings last week, including ordering pubs and restaurants to close by 10pm. Spain has introduced tougher mobility restrictions in Madrid and surrounding municipalities. France ordered gyms and restaurants to close for two weeks. Canada has also tightened regulations, with the government of Quebec raising the alert level to maximum “red alert” in several regions of the province. In the US, the share of the population living in states that were in the process of relaxing lockdown measures has risen above 50% for the first time since July (Chart 2). A third wave would almost certainly forestall the recent reopening trend. Ultimately, a safe and effective vaccine will be necessary to defeat the virus. Fortunately, about half of experts polled by the Good Judgment Project expect a vaccine to become available by the first quarter of 2021. Only 2% expect there to be no vaccine available by April 2022, down from over 50% in May (Chart 3). Chart 3When Will A Vaccine Become Available?
Fourth Quarter 2020 Strategy Outlook: A Post-Pandemic Regime Shift
Fourth Quarter 2020 Strategy Outlook: A Post-Pandemic Regime Shift
Premature Fiscal Tightening And The Risk of Second-Round Effects Even if a vaccine becomes available early next year, there is a danger that the global economy will have suffered enough damage over the intervening months to forestall a rapid recovery. Whenever an economy suffers an adverse shock, a feedback loop can develop where rising joblessness leads to less spending, leading to even more joblessness. Fiscal stimulus can short-circuit this vicious circle by providing households with adequate income to maintain spending. Fiscal policy in the major economies turned expansionary within weeks of the onset of the pandemic (Chart 4). In the US, real personal income growth actually accelerated in the spring because transfers from the government more than offset the loss in wage and salary compensation (Chart 5). Chart 4Fiscal Policy Has Been Very Stimulative This Year
Fourth Quarter 2020 Strategy Outlook: A Post-Pandemic Regime Shift
Fourth Quarter 2020 Strategy Outlook: A Post-Pandemic Regime Shift
Chart 5Personal Income Accelerated Earlier This Year
Personal Income Accelerated Earlier This Year
Personal Income Accelerated Earlier This Year
Chart 6Drastic Drop In Weekly Unemployment Insurance Payments
Drastic Drop In Weekly Unemployment Insurance Payments
Drastic Drop In Weekly Unemployment Insurance Payments
Starting in August, US fiscal policy turned less accommodative. Chart 6 shows that regular weekly unemployment payments have fallen from around $25 billion to $8 billion since the end of July. At an annualized rate, this amounts to over 4% of GDP in fiscal tightening. While President Trump signed an executive order redirecting some of the money that had been earmarked for the Federal Emergency Management Agency (FEMA) to be given to unemployed workers, the available funding will run out within the next month or so. On top of that, the funds in the small business Paycheck Protection Program have been used up, while many state and local governments face a severe cash crunch. US households saved a lot going into the autumn, so a sudden stop in spending is unlikely. Nevertheless, fissures in the economy are widening. Core retail sales contracted in August for the first time since April. Consumer expectations of future income growth remain weak (Chart 7). Permanent job losses are rising faster than they did during the Great Recession (Chart 8). Both corporate bankruptcy and mortgage delinquency rates are moving up, while bank lending standards have tightened significantly (Chart 9). Chart 7Consumer Expectations Of Future Income Growth Remain Weak
Consumer Expectations Of Future Income Growth Remain Weak
Consumer Expectations Of Future Income Growth Remain Weak
Chart 8Permanent Job Losses Are Rising Faster Than They Did During The Great Recession
Fourth Quarter 2020 Strategy Outlook: A Post-Pandemic Regime Shift
Fourth Quarter 2020 Strategy Outlook: A Post-Pandemic Regime Shift
Chart 9Corporate Bankruptcy And Mortgage Delinquency Rates Are Moving Up … While Bank Lending Standards Have Tightened Significantly
Fourth Quarter 2020 Strategy Outlook: A Post-Pandemic Regime Shift
Fourth Quarter 2020 Strategy Outlook: A Post-Pandemic Regime Shift
Fiscal Stimulus Will Return We ultimately expect US fiscal policy to turn accommodative again. There is no appetite for fiscal austerity. Both political parties are moving in a more populist direction, which usually signals larger budget deficits. Even among Republicans, more registered voters support extending emergency federal unemployment insurance payments than oppose it (Chart 10). Chart 10There Is Much Public Support For Fiscal Stimulus
Fourth Quarter 2020 Strategy Outlook: A Post-Pandemic Regime Shift
Fourth Quarter 2020 Strategy Outlook: A Post-Pandemic Regime Shift
As long as interest rates stay low, there will be little market pressure to trim budget deficits. US real rates remain in negative territory. Despite a rising debt stock, the Congressional Budget Office expects net interest payments to decline towards 1% of GDP over the span of the next couple of years, thus reaching the lowest level in six decades (Chart 11). Outside the US, there has been little movement towards tightening fiscal policy. The UK government unveiled last week a fresh round of economic and fiscal measures to help ease the burden on both employees, by subsidizing part-time work for example, and firms, by extending government-guaranteed loan programs. At the beginning of the month, the Macron government announced a 100 billion euro stimulus plan in France. Meanwhile, European leaders are moving forward on a euro area-wide 750 billion euro stimulus package that was announced this summer. In Japan, the new Prime Minister Yoshihide Suga has indicated that he will pursue a third budget to fight the economic downturn, adding that “there is no limit to the amount of bonds the government can issue to support an economy battered by the coronavirus pandemic.” The Japanese government now earns more interest than it pays because two-thirds of all Japanese debt bears negative yields (Chart 12). At least for now, a big debt burden is actually good for the Japanese government’s finances! Chart 11Low Interest Payments Amid Skyrocketing Debt In The US
Low Interest Payments Amid Skyrocketing Debt In The US
Low Interest Payments Amid Skyrocketing Debt In The US
Chart 12Japan: Ballooning Debt And Declining Interest Payments
Japan: Ballooning Debt And Declining Interest Payments
Japan: Ballooning Debt And Declining Interest Payments
China also continues to stimulate its economy. Jing Sima, BCA’s chief China strategist, expects the broad-measure fiscal deficit to reach a record 8% of GDP this year and remain elevated into next year. The annual change in total social financing – a broad measure of Chinese credit formation – is expected to hit 35% of GDP, just shy of its GFC peak (Chart 13). Not surprisingly, the Chinese economy is responding well to all this stimulus. Sales of floor space rose 40% year-over-year in August, driven by a close to 60% jump in Tier-1 cities. Excavator sales, a leading indicator for construction spending, are up 51% over last year’s levels, while industrial profits have jumped 19%. A resurgent Chinese economy has historically been closely associated with rising global trade (Chart 14). Chart 13China Continues To Stimulate Its Economy
China Continues To Stimulate Its Economy
China Continues To Stimulate Its Economy
Chart 14Chinese Economic Rebound Has Historically Been Closely Associated With Rising Global Trade
Chinese Economic Rebound Has Historically Been Closely Associated With Rising Global Trade
Chinese Economic Rebound Has Historically Been Closely Associated With Rising Global Trade
Biden Or Trump: How Will Financial Markets React? Betting markets expect former Vice President Joe Biden to become president and for the Democrats to gain control of the Senate (Chart 15). A “blue wave” would produce more fiscal spending in the next few years. Recall that House Democrats passed a $3.5 trillion stimulus bill in May that was quickly rejected by Senate Republicans. More recently, Democratic leaders have suggested they would approve a stimulus deal in the range of $2-to-$2.5 trillion. Chart 15Betting Markets Putting Their Money On The Democrats
Fourth Quarter 2020 Strategy Outlook: A Post-Pandemic Regime Shift
Fourth Quarter 2020 Strategy Outlook: A Post-Pandemic Regime Shift
In addition to more pandemic-related stimulus, Joe Biden has also proposed a variety of longer-term spending initiatives. These include $2 trillion in infrastructure spending spread over four years, a $700 billion “Made in America” plan that would increase federal procurement of domestically produced goods and services, and new spending proposals worth about 1.7% of GDP per annum centered on health care, housing, education, and child and elder care. As president, Joe Biden would likely take a less confrontational stance towards relations with China. While rolling back tariffs would not be an immediate priority for a Biden administration, it could happen later in 2021. Less welcome for investors would be an increase in taxes. Joe Biden has proposed raising taxes by $4 trillion over ten years (about 1.5% of cumulative GDP). Slightly less than half of that consists of higher personal taxes on both regular income (for taxpayers earning more than $400,000 per year) and capital gains (for tax filers with over $1 million in income). The other half consists of increased business taxes, mainly in the form of a hike in the corporate tax rate from 21% to 28% and the introduction of a minimum 15% tax on the global book income of US-based companies. Netting it out, a blue sweep in November would probably be neutral-to-slightly negative for equities. What about government bonds? Our guess is that Treasury yields would rise modestly in response to a blue wave, particularly at the longer end of the yield curve. Additional fiscal support would boost aggregate demand, implying that it would take less time for the economy to reach full employment. That said, interest rate expectations are unlikely to rise as sharply as they did in late 2016 following Donald Trump‘s victory. Back then, the Fed was primed to raise rates – it hiked rates nine times starting in December 2015, ultimately bringing the fed funds rate to 2.5% by end-2018. This time around, the Fed is firmly on hold, with the vast majority of FOMC members expecting policy rates to stay at rock-bottom levels until at least 2023. The Fed’s New Tune In two important respects, the Fed’s new Monetary Policy Framework (MPF) represents a sharp break with the past. Chart 16The Mechanics Of Price-Level Targeting
Fourth Quarter 2020 Strategy Outlook: A Post-Pandemic Regime Shift
Fourth Quarter 2020 Strategy Outlook: A Post-Pandemic Regime Shift
First, the MPF abandons the Fed’s historic reliance on a Taylor Rule-style framework, which prescribes lifting rates whenever the unemployment rate declines towards its equilibrium level. Second, the MPF eschews the “let bygones be bygones” approach of past monetary policymaking. Going forward, the Fed will try to maintain an average level of inflation of 2% over the course of the business cycle. This means that if inflation falls below 2%, the Fed will try to engineer a temporary inflation overshoot in order to bring the price level back up to its 2%-per-year upward trend (Chart 16). Some aspects of the Fed’s new strategy are both timely and laudable. A Taylor rule approach makes sense when there is a clear relationship between inflation and the unemployment rate, as governed by the so-called Phillips curve. However, if inflation fails to rise in response to declining economic slack – as has been the case in recent years – central banks may find themselves at a loss in determining where the neutral rate of interest lies. In this case, it might be preferable to keep interest rates at very low levels until the economy begins to overheat. Such a strategy would avoid the risk of raising rates prematurely, only to discover that they are too high for what the economy can handle. Targeting an average rate of inflation also has significant merit. When investors purchase long-term bonds, they run the risk that the real value of those bonds will deviate significantly from initial expectations when the bonds mature. If inflation surprises on the upside, the bonds will end up being worth less to the lender as measured by the quantity of goods and services that they can be exchanged for. If inflation surprises on the downside, borrowers could find themselves facing a larger real debt burden than they had anticipated. An inflation targeting system that corrects for past inflation surprises could give both borrowers and lenders greater certainty about the future price level. This, in turn, could reduce the inflation risk premium embedded in long-term bond yields, leading to a more efficient allocation of economic resources. In addition, an average inflation targeting system could make the zero lower bound constraint less vexing by keeping long-term inflation expectations from slipping below the central bank’s target. This would give the central bank more traction over monetary policy. A Bias Towards Higher Inflation Despite the advantages of the Fed’s new approach, it faces a number of hurdles, some practical and some political. On the practical side, it may turn out that the Phillips curve, rather than being flat, is kinked at a fairly low level of unemployment. Theoretically, that would not be too surprising. If I have 100 apples for sale and you want to buy 60, I have no incentive to raise prices. Even if you wanted to buy 80 apples, I would have no incentive to raise prices. However, if you wanted to buy 105 apples, then I would have an incentive to raise my selling price. The point is that inflation could remain stubbornly dormant as slack slowly disappears, only to rocket higher once full employment has been reached. Since changes in monetary policy only affect the economy with a lag, the central bank could find itself woefully behind the curve, scrambling to contain rising inflation. This is precisely what happened during the 1960s (Chart 17). Chart 17Inflation Started Accelerating Quickly Only When Unemployment Reached Very Low Levels In The 1960s
Inflation Started Accelerating Quickly Only When Unemployment Reached Very Low Levels In The 1960s
Inflation Started Accelerating Quickly Only When Unemployment Reached Very Low Levels In The 1960s
Chart 18Something Has Always Happened To Preempt Overheating
Something Has Always Happened To Preempt Overheating
Something Has Always Happened To Preempt Overheating
Over the past three decades, something always happened that kept the US economy from overheating (Chart 18). The unemployment rate reached a 50-year low in 2019. Inflation may have moved higher this year had it not been for the fact that the global economy was clotheslined by the pandemic. In 2007, the economy was heating up only to be sandbagged by the housing bust. In 2000, the bursting of the dotcom bubble helped reverse incipient inflationary pressures. But just because the economy did not have a chance to overheat at any time over the past 30 years does not mean it cannot happen in the future. The Political Economy Of Higher Inflation On the political side, average inflation targeting assumes that central banks will be just as willing to tolerate inflation undershoots as overshoots. This could be a faulty assumption. Generating an inflation overshoot requires that interest rates be kept low enough to enable unemployment to fall below its full employment level. That is likely to be politically popular. Generating an inflation undershoot, in contrast, requires restrictive monetary policy and rising unemployment. More joblessness would not sit well with workers. High interest rates could also damage the stock market and depress home prices, while forcing debt-saddled governments to shift more spending from social programs to bondholders. None of that will be politically popular. If central banks are quick to allow inflation overshoots but slow to engineer inflation undershoots, the result could be structurally higher inflation. Markets are not pricing in such an outcome (Chart 19). Chart 19Markets Are Not Pricing In Structurally Higher Inflation
Fourth Quarter 2020 Strategy Outlook: A Post-Pandemic Regime Shift
Fourth Quarter 2020 Strategy Outlook: A Post-Pandemic Regime Shift
II. Financial Markets Global Asset Allocation: Despite Near-Term Dangers, Overweight Equities On A 12-Month Horizon An acceleration in the number of COVID-19 cases and the rising probability that the US Congress will fail to pass a stimulus bill before the November election could push equities and other risk assets lower in the near term. Investors should maintain somewhat larger than normal cash positions in the short run that can be deployed if stocks resume their correction. Chart 20The Decline In US Real Yields Since March Has Largely Offset The Rise In Stock Prices
The Decline In US Real Yields Since March Has Largely Offset The Rise In Stock Prices
The Decline In US Real Yields Since March Has Largely Offset The Rise In Stock Prices
Provided that progress continues to be made towards developing a vaccine and US fiscal policy eventually turns stimulative again, stocks will regain their footing, rising about 15% from current levels over a 12-month horizon. Negative real bond yields will continue to support stocks (Chart 20). The 30-year TIPS yield has fallen by over 90 basis points in 2020. Even if one assumes that it will take the rest of the decade for S&P 500 earnings to return to their pre-pandemic trend, the deep drop in the risk-free component of the discount rate has still raised the present value of future S&P 500 cash flows by nearly 20% since the start of the year (Chart 21). Chart 21The Present Value Of Earnings: A Scenario Analysis
Fourth Quarter 2020 Strategy Outlook: A Post-Pandemic Regime Shift
Fourth Quarter 2020 Strategy Outlook: A Post-Pandemic Regime Shift
Thanks to these exceptionally low real bond yields, equity risk premia remain elevated (Chart 22). The TINA mantra reverberates throughout the investment world: There Is No Alternative to stocks. To get a sense of just how powerful TINA is, consider the fact that the dividend yield on the S&P 500 currently stands at 1.67%. That may not sound like much, but it is still a full percentage point higher than the paltry 0.67% yield on the 10-year Treasury note (Chart 23). Chart 22Equity Risk Premia Remain Elevated
Equity Risk Premia Remain Elevated
Equity Risk Premia Remain Elevated
Chart 23S&P 500 Dividend Yield Is Above The Treasury Yield
S&P 500 Dividend Yield Is Above The Treasury Yield
S&P 500 Dividend Yield Is Above The Treasury Yield
Imagine having to decide whether to place your money either in an S&P 500 index fund or a 10-year Treasury note. Dividends-per-share paid by S&P 500 companies have almost always increased over time. However, even if we make the pessimistic assumption that dividends-per-share remain unchanged for the next ten years, the value of the S&P 500 would still have to fall by 10% over the next decade to equal the return on the 10-year note. Assuming that inflation averages around 1.9% over this period, the real value of the S&P 500 would need to drop by 25%. The picture is even more dramatic outside the US. In the euro area, the index would have to fall by over 30% in real terms for investors to make more money in bonds than stocks. In the UK, it would need to fall by over 50% (Chart 24). Chart 24 (I)Stocks Would Need To Fall A Lot For Equities To Underperform Bonds
Stocks Would Need To Fall A Lot For Equities To Underperform Bonds Stocks Would Need To Fall A Lot For Equities To Underperform Bonds
Stocks Would Need To Fall A Lot For Equities To Underperform Bonds Stocks Would Need To Fall A Lot For Equities To Underperform Bonds
Chart 24 (II)Stocks Would Need To Fall A Lot For Equities To Underperform Bonds
Stocks Would Need To Fall A Lot For Equities To Underperform Bonds
Stocks Would Need To Fall A Lot For Equities To Underperform Bonds
A Weaker US Dollar Favors International Stocks Outside the US, price-earnings ratios are lower, while equity risk premia are higher. Cheap valuations are usually not enough to justify a high-conviction investment call, however. One also needs a catalyst. Three potential catalysts could help propel international stocks higher over the next 12 months, while also giving value stocks and economically-sensitive equity sectors a boost: A weaker US dollar; the end of the pandemic; and a recovery in bank shares. Let’s start with the dollar. The US dollar faces a number of headwinds over the coming months. First, interest rate differentials have moved sharply against the greenback (Chart 25). Second, as a countercyclical currency, the dollar is likely to weaken as the global economy improves (Chart 26). Third, the current account deficit is rising again. It jumped over 50% from $112 billion in Q1 to $170 billion in Q2. According to the Atlanta Fed GDPNow model, the trade balance is set to widened further in Q3. This deterioration in the dollar’s fundamentals is occurring against a backdrop where the currency remains 11% overvalued based on purchasing power parity exchange rates (Chart 27). Chart 25Interest Rate Differentials Have Moved Sharply Against The Greenback
Interest Rate Differentials Have Moved Sharply Against The Greenback
Interest Rate Differentials Have Moved Sharply Against The Greenback
A weaker dollar is usually good for commodity prices and cyclical stocks (Chart 28). In general, commodity producers and cyclical stocks are overrepresented outside the US. Chart 26The Dollar Is Likely To Weaken As The Global Economy Improves
The Dollar Is Likely To Weaken As The Global Economy Improves
The Dollar Is Likely To Weaken As The Global Economy Improves
Chart 27USD Remains Overvalued
Fourth Quarter 2020 Strategy Outlook: A Post-Pandemic Regime Shift
Fourth Quarter 2020 Strategy Outlook: A Post-Pandemic Regime Shift
Chart 28A Weaker Dollar Is Usually Good For Commodity Prices And Cyclical Stocks
A Weaker Dollar Is Usually Good For Commodity Prices And Cyclical Stocks
A Weaker Dollar Is Usually Good For Commodity Prices And Cyclical Stocks
BCA’s chief energy strategist Bob Ryan expects Brent to average $65/bbl in 2021, $21/bbl above what the market is anticipating. Ongoing Chinese stimulus should also buoy metal prices. A falling greenback helps overseas borrowers – many of whom are in emerging markets – whose loans are denominated in dollars but whose revenues are denominated in the local currency. It is thus no surprise that non-US stocks tend to outperform their US peers when global growth is strengthening and the dollar is weakening (Chart 29). Chart 29Non-US Equities Tend To Outperform Their US Peers When Global Growth Is Improving And The Dollar Is Weakening
Non-US Equities Tend To Outperform Their US Peers When Global Growth Is Improving And The Dollar Is Weakening
Non-US Equities Tend To Outperform Their US Peers When Global Growth Is Improving And The Dollar Is Weakening
The outperformance of non-US stocks in soft dollar environments is particularly pronounced when returns are measured in common-currency terms. From the perspective of US-based investors, a weaker dollar raises the dollar value of overseas sales and profits, justifying higher valuations for international stocks. From the perspective of overseas investors, a weaker dollar reduces the local currency value of US sales and profits, implying a lower valuation for US stocks. This helps explain why European stocks tend to outperform their US counterparts when the euro is rising, even though a stronger euro hurts the European economy. It’s Value’s Turn To Shine Value stocks have often outperformed growth stocks when the US dollar has been weakening and global growth strengthening. Recall that value stocks did poorly during the late 1990s, a period of dollar strength and economic turbulence throughout the EM world. In contrast, value stocks did well between 2001 and 2007, a period during which the dollar was generally on the back foot. The relationship between value stocks, the dollar, and global growth broke down this summer. Growth stocks continued to pull ahead, even though global growth turned a corner and the dollar began to weaken. There are two reasons why this happened. First, investors were too slow to price in the windfall that growth stocks in the tech and health care sectors would end up receiving from the pandemic. Second, rather than rising in response to better economic growth data, real rates fell during the summer months. A falling discount rate benefits growth stocks more than value stocks because the former generate more of their earnings farther into the future. The tentative outperformance of value stocks in September suggests that the tables may have turned for the value/growth trade. Retail sales at physical stores are rebounding, while online sales growth is coming down from highly elevated levels (Chart 30). Bank of America estimates that US e-commerce penetration doubled in just a few short months earlier this year. Some “reversion to the trend” is likely, even if that trend does favor online stores over the long haul. Chart 30Are Brick-And Mortar Retailers Coming Back To Life?
Are Brick-And Mortar Retailers Coming Back To Life?
Are Brick-And Mortar Retailers Coming Back To Life?
Chart 31The Pandemic Has Caused Global Server And PC Shipments To Surge
The Pandemic Has Caused Global Server And PC Shipments To Surge
The Pandemic Has Caused Global Server And PC Shipments To Surge
Meanwhile, PC shipments soared during the pandemic as companies and workers rushed out to buy computer gear to allow them to work from home (Chart 31). To the extent that this caused some spending to be brought forward, it could create an air pocket in tech demand over the next few quarters. A third wave of the virus in the US and ongoing second waves elsewhere could give growth stocks a boost once more, but the benefits are likely to be short-lived. If a vaccine becomes available early next year, investors will pivot from the “pandemic trade” to the “reopening trade.” The “reopening trade” will support companies such as banks, hotels, and transports that were crushed by lockdown measures and which are overrepresented in value indices. From a valuation perspective, value stocks are cheaper now compared to growth stocks than at any point in history – even cheaper than at the height of the dotcom bubble (Chart 32). Chart 32Value Stocks Are Extremely Cheap Relative To Growth Stocks
Value Stocks Are Extremely Cheap Relative To Growth Stocks
Value Stocks Are Extremely Cheap Relative To Growth Stocks
The lofty valuations that growth stocks enjoy can be justified if the mega-cap tech companies that dominate the growth indices continue to increase earnings for many years to come. However, it is far from clear that this will happen. Close to three-quarters of US households already have an Amazon Prime account. Slightly over half have a Netflix account. Nearly 70% have a Facebook account. Google commands 92% of the internet search market. Together, sites owned by Google and Facebook generate about 60% of all online advertising revenue. While all of these companies dominate their markets, this could change. At one point during the dotcom bubble, Palm’s market capitalization was over six times greater than Apple’s. The Blackberry superseded the PalmPilot; the iPhone, in turn, superseded the Blackberry. History suggests that many of today’s technological leaders will end up as laggards. Investors looking to find the next tech leader can focus on smaller, fast growing companies. Unfortunately, picking winners in this space is easier said than done. History suggests that investors tend to overpay for growth, especially among small caps. Based on data compiled by Eugene Fama and Kenneth French, small cap growth stocks have lagged small cap value stocks by an average of 6.4% per year on a market-cap weighted basis, and by 10.4% on an equal-weighted basis, since 1970 (Table 1). Table 1Small Caps Vis-A-Vis Large Caps: Comparison of Total Returns
Fourth Quarter 2020 Strategy Outlook: A Post-Pandemic Regime Shift
Fourth Quarter 2020 Strategy Outlook: A Post-Pandemic Regime Shift
Bank On Banks Financial stocks are heavily overrepresented in value indices (Table 2). Banks have made significant provisions against bad loans this year. If global growth recovers in 2021 once a vaccine becomes available, some of these provisions will end up being released, boosting profits in the process. Table 2Breaking Down Growth And Value By Sector
Fourth Quarter 2020 Strategy Outlook: A Post-Pandemic Regime Shift
Fourth Quarter 2020 Strategy Outlook: A Post-Pandemic Regime Shift
Chart 33Modestly Higher Bond Yields Will Benefit Bank Shares
Modestly Higher Bond Yields Will Benefit Bank Shares
Modestly Higher Bond Yields Will Benefit Bank Shares
A stabilization in bond yields should also help bank shares. Chart 33 shows that a fall in bank stocks vis-à-vis the overall market has closely matched the decline in bond yields. While we do not think that central banks will tighten monetary policy in the next few years, nominal bond yields should still drift modestly higher as output gaps narrow. What about the outlook for bank earnings? A massive new credit boom is not in the cards in any major economy. Nevertheless, it should be noted that global bank EPS was able to return to its long-term trend in 2019, until being slammed again this year by the pandemic (Chart 34). Global bank book value-per-share was 30% higher in 2019 compared to GFC highs (even though price-per-share was 30% lower). Chart 34Global Bank EPS Was Able To Return To Its Pre-GFC Peak In 2019 Until The Pandemic Hit
Global Bank EPS Was Able To Return To Its Pre-GFC Peak In 2019 Until The Pandemic Hit
Global Bank EPS Was Able To Return To Its Pre-GFC Peak In 2019 Until The Pandemic Hit
Chart 35European Bank Earnings Estimates Have Lagged Credit Growth
European Bank Earnings Estimates Have Lagged Credit Growth
European Bank Earnings Estimates Have Lagged Credit Growth
Admittedly, the global numbers disguise a lot of regional variation. While US banks were able to bring EPS back to its prior peak, and Canadian banks were able to easily surpass it, European bank EPS was still 70% below its pre-GFC highs in 2019. The launch of the common currency in 1999 set off a massive credit boom across much of Europe, leaving European banks dangerously overleveraged. The GFC and the subsequent European sovereign debt crisis led to a spike in bad loans, necessitating numerous rounds of dilutive capital raises. At this point, however, European bank balance sheets are in much better shape. If EPS simply returns to its 2019 levels, European banks will trade at a generous earnings yield of close to 20%. That may not be such a hurdle to cross. Chart 35 shows that European bank earnings estimates have fallen far short of what would be expected from current credit growth. If, on top of all this, European banks are able to muster some sustained earnings growth thanks to somewhat steeper yield curves and further cost-cutting and consolidation, investors who buy banks today will be rewarded with outsized returns over the long haul. Fixed Income: What Is Least Ugly? As noted above, a rebound in global growth should push up both equity prices and bond yields. As such, we would underweight fixed income within a global asset allocation framework. Within the fixed income bracket, investors should favor inflation-protected securities over nominal bonds. They should underweight government bonds in favor of a modest overweight to spread product. Spreads are quite low but could sink further if economic activity revives faster than anticipated. The upper quality tranche of high-yield corporates, which are benefiting from central bank purchases, have an especially attractive risk-reward profile. EM debt should also fare well in a weaker dollar, stronger growth environment (Chart 36). Chart 36BB-Rated And EM Debt Offer Reasonable Risk-Reward Profiles
BB-Rated And EM Debt Offer Reasonable Risk-Reward Profiles
BB-Rated And EM Debt Offer Reasonable Risk-Reward Profiles
Given that some investors have no choice but to own developed economy government bonds, which countries or regions should they buy from within this category? Chart 37 shows the 3-year trailing yield betas for several major developed bond markets. In general, the highest-yielding currencies (US and Canada) also have the highest betas, implying that their yields rise the most when global bond yields are rising and vice versa. Chart 37High-Yielding Bond Markets Are The Most Cyclical
Fourth Quarter 2020 Strategy Outlook: A Post-Pandemic Regime Shift
Fourth Quarter 2020 Strategy Outlook: A Post-Pandemic Regime Shift
In economies such as Europe and Japan where the neutral rate of interest is stuck deep below the zero bound, better economic news is unlikely to lift policy rate expectations by very much. After all, the optimal policy rate would still be above its neutral level even if better economic data brought the neutral rate from say, -4% to -3%. In contrast, when the neutral rate is close to zero or even positive, better economic data can lift medium-to-long-term interest rate expectations more meaningfully. As such, we would underweight US Treasurys and Canadian bonds, while overweighting Japanese government bonds (JGBs) over a 12-month horizon. On a currency-hedged basis, which is what most bond investors focus on, 10-year JGBs yield only 20 basis points less than US Treasurys (Table 3). This lower yield is more than offset by the risk that Treasury yields will rise more than yields on JGBs. Table 3Bond Markets Across The Developed World
Fourth Quarter 2020 Strategy Outlook: A Post-Pandemic Regime Shift
Fourth Quarter 2020 Strategy Outlook: A Post-Pandemic Regime Shift
The End Game What will end the bull market in stocks? As is often the case, the answer is tighter monetary policy. The good news is tight money is not an imminent risk. The Fed will not hike rates at least until 2023, and it will take even longer than that for interest rates to rise elsewhere in the world. The bad news is that the day of reckoning will eventually arrive and when it does, bond yields will soar and stocks will tumble. Investors who want to hedge against this risk should consider owning more real assets. As was the case during the 1970s, farmland will do well from rising inflation. Suburban real estate will also benefit from more people working from home and, if recent trends persist, rising crime in urban areas. Gold should also do well. The yellow metal has come down from its August highs, but should benefit from a weaker dollar over the coming months, and ultimately, from a more stagflationary environment later this decade. Peter Berezin Chief Global Strategist peterb@bcaresearch.com Footnotes 1 “More infectious coronavirus mutation may be 'a good thing', says disease expert,” Reuters, August 17, 2020. 2 Nina Bai, ”One More Reason to Wear a Mask: You’ll Get Less Sick From COVID-19,” University of California San Francisco, July 31, 2020. 3 Dave Roos, “How Crude Smallpox Inoculations Helped George Washington Win the War,” History.com, May 18, 2020. Global Investment Strategy View Matrix
Fourth Quarter 2020 Strategy Outlook: A Post-Pandemic Regime Shift
Fourth Quarter 2020 Strategy Outlook: A Post-Pandemic Regime Shift
Current MacroQuant Model Scores
Fourth Quarter 2020 Strategy Outlook: A Post-Pandemic Regime Shift
Fourth Quarter 2020 Strategy Outlook: A Post-Pandemic Regime Shift
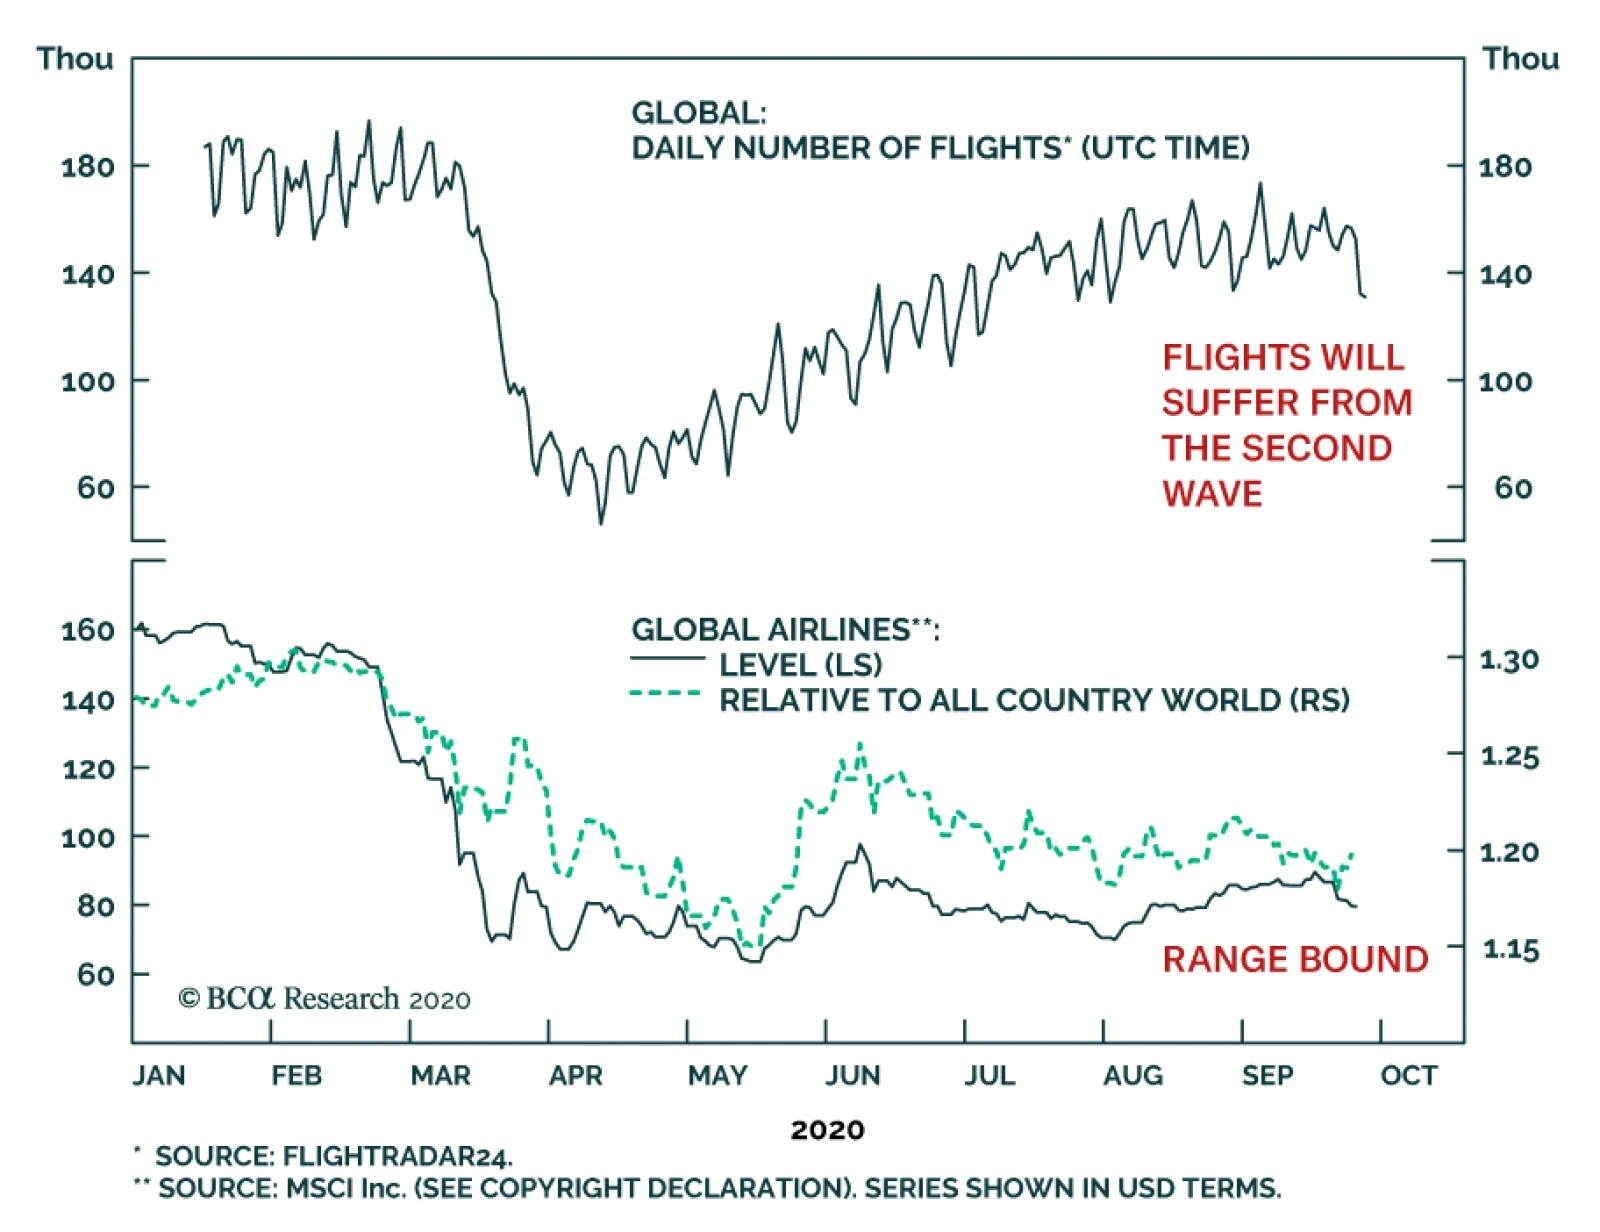
The lack of pulse of global airline stocks is at odds with the rebound in industrial equities. However, it highlights our theme of avoiding the sectors that remain affected by social distancing measures. With the second wave of infections in advanced…
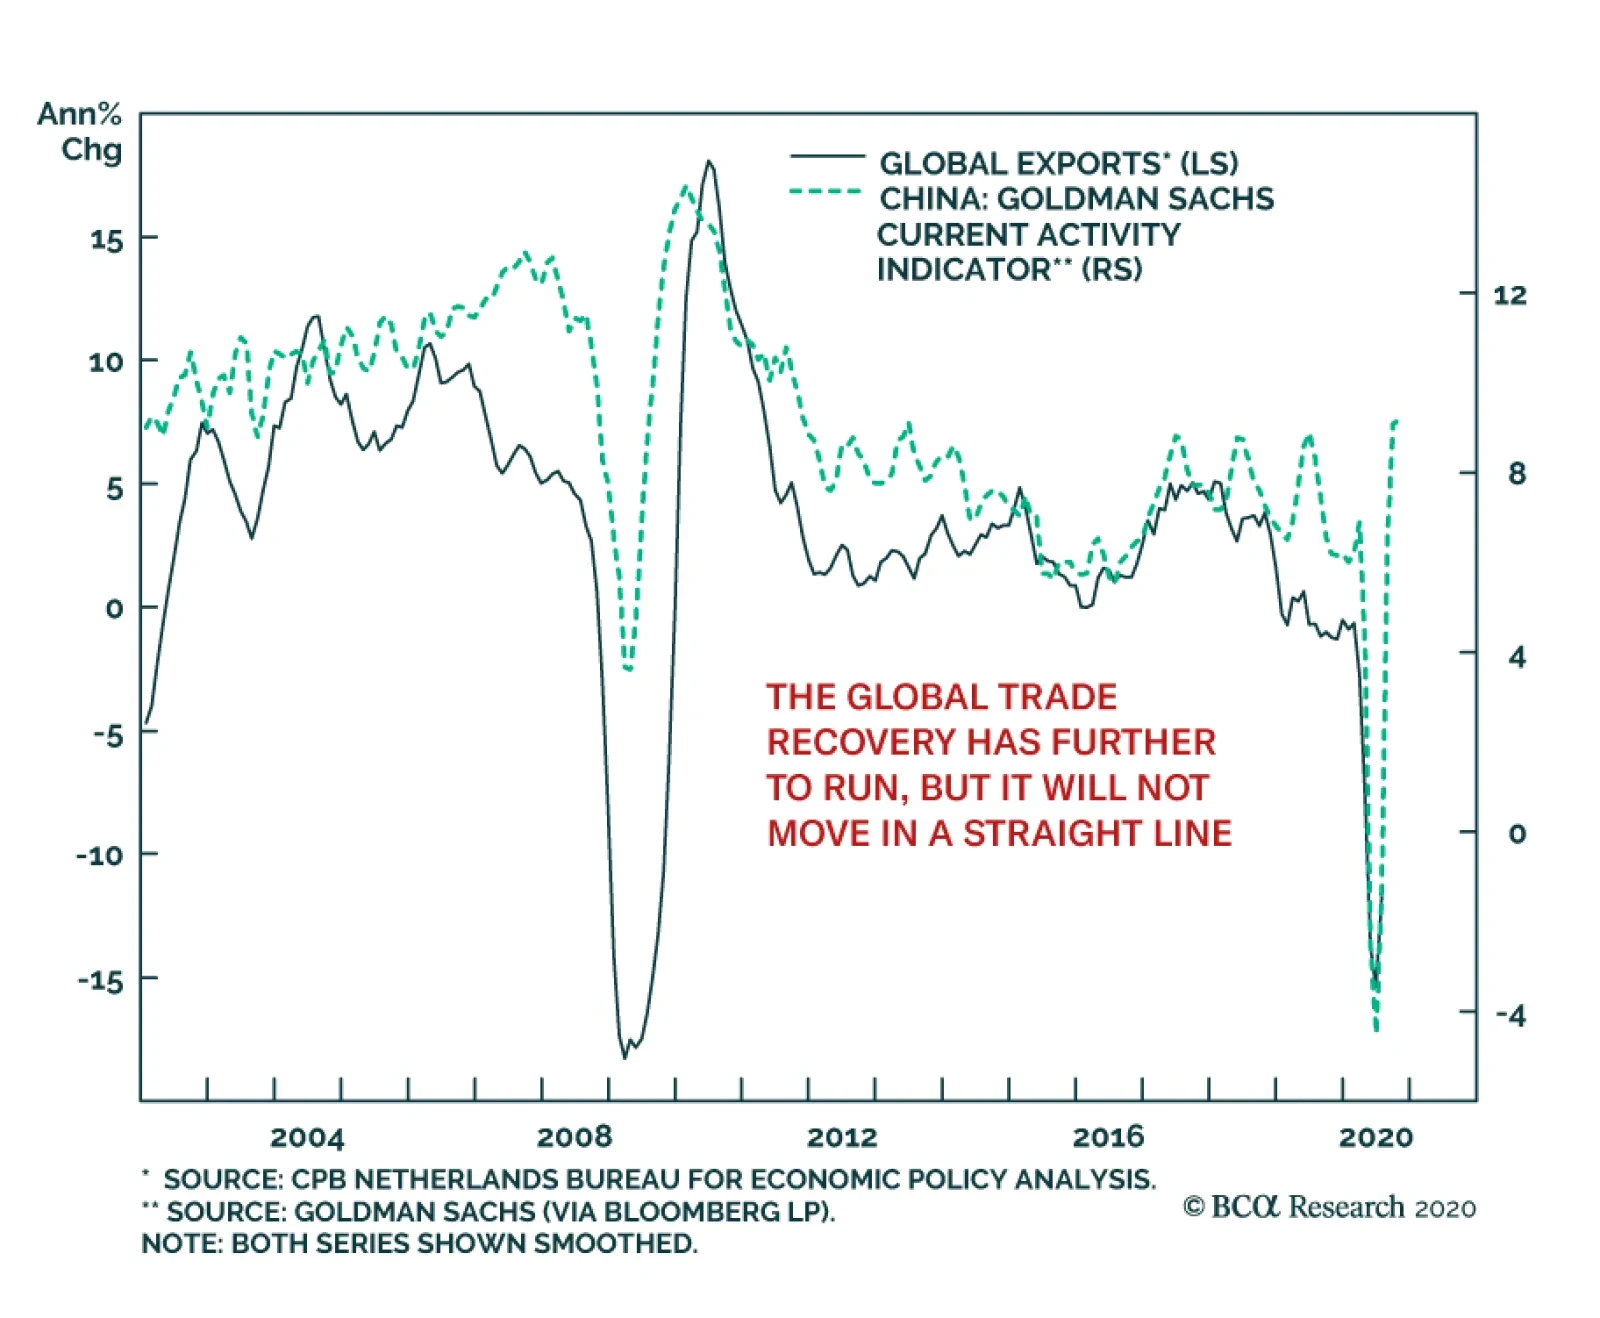
According to the CPB Global Trade Monitor released last Friday, global exports continue to recover. Global trade volumes increased 4.8% in the month of July, which is a deceleration from the 7.9% pace recorded in June. Nonetheless, the annual growth rate of…