Fixed Income

Highlights The Global Golden Rule (GGR): The gap between market expectations of global central bank policy rates and realized interest rate outcomes is a reliable predictor of government bond returns. Thus, "getting the policymaker call right" is the key to outperformance for bond investors. Implied Government Bond Yields: Given the strong correlation between policy rate surprises and government bond yield changes, we can use the GGR to forecast yields one year from now based on our own assumptions of how many rate hikes (cuts) will be delivered versus what is discounted in money market yield curves. Total Return Forecasts: We can use implied government bond yield changes from the GGR to generate expected 12-month total returns for government bond indexes of different maturities, taking into account different rate hike assumptions for various central banks. Feature Chart 1Global Monetary Divergences?
Global Monetary Divergences?
Global Monetary Divergences?
This month marked the ten-year anniversary of the 2008 Lehman Brothers default, which set off a worldwide financial crisis and a massive easing of global monetary policy. Extraordinary measures - zero (or negative) interest rates, large-scale asset purchases and dovish forward guidance from policymakers - were all successful in suppressing both global bond yields and volatility over time, helping the global economy slowly heal from the crisis. Now, a decade later, such hyper-easy monetary policies are no longer required given low unemployment rates and rising inflation in the major developed economies. That can be seen today with the Federal Reserve shifting to "quantitative tightening" (letting bonds run off its swollen balance sheet) alongside steady rate hikes, the European Central Bank (ECB) set to stop net new buying of euro area bonds at year-end, and the Bank of Japan (BoJ) dramatically slowing its pace of asset purchases. BCA's Central Bank Monitors, which assess the cyclical pressure on policymakers to tighten or ease monetary policy, have collectively been calling for interest rate increases since the start of 2017. Yet our Central Bank Monetary Barometer, which measures the percentage of central banks that have tightened policy over the previous three months, shows that only 1 in 5 banks have actually delivered rate hikes of late (Chart 1). Thus, the risks are tilted towards more countries moving away from highly accommodative monetary conditions given tightening labor markets and rising inflation pressures. This now-global shift towards policy normalization has major implications for global bond investing. The focus is now returning back to more traditional drivers of government bond returns, like changes in central bank policy rates. We recently shared a Special Report published by our colleagues at our sister BCA service, U.S. Bond Strategy, describing a methodology they dubbed "The Golden Rule of Bond Investing".1 That report introduced a numerical framework that translates actual changes in the U.S. fed funds rate relative to market expectations into return forecasts for U.S. Treasuries. The historical results convincingly showed that investors who "get the Fed right" by making correct bets on changes in the funds rate versus expectations were very likely to make the right call on the direction of Treasury yields. In this Special Report, we extend that Golden Rule analysis to government bonds in the other major developed markets (DM). Our conclusion is that utilizing a "Global Golden Rule" (GGR) framework that links bond returns to unexpected changes in policy rates can help bond investors correctly forecast changes in non-U.S. bond yields. The report is set up in two sections. First, we illustrate how the GGR works and how it empirically tends to generally succeed over time for different DM bond markets. In the second section, we make use of the GGR to generate expected return forecasts for non-U.S. government bonds for a variety of interest rate "surprise" scenarios. ECB Policy Rate Surprises Dovish surprises from the ECB do reliably coincide with positive German government bond excess returns versus cash (Chart 2A). Chart 2AECB Policy Rate Surprise & Yields I
ECB Policy Rate Surprise & Yields I
ECB Policy Rate Surprise & Yields I
Chart 2BECB Policy Rate Surprise & Yields II
ECB Policy Rate Surprise & Yields II
ECB Policy Rate Surprise & Yields II
The 12-month ECB policy rate surprise and the 12-month change in the Bloomberg Barclays German Treasury index yield displays a strong positive correlation (Chart 2B). The excess returns during periods of dovish surprises is 14.4% on average and are positive 85% of the time. Hawkish surprises on the other hand, coincide with negative average excess returns of -1.5% (Chart 2C). In terms of total return, the picture is roughly the same except that under hawkish surprises, the average total return you would expect is now positive, given that it factors in coupon income (Chart 2D). Chart 2CGermany: Government Bond Index Excess Return & ECB Policy Rate Surprises (2004 - Present)
The Global Golden Rule Of Bond Investing
The Global Golden Rule Of Bond Investing
Chart 2DGermany: Government Bond Index Total Return & ECB Policy Rate Surprises (2004 - Present)
The Global Golden Rule Of Bond Investing
The Global Golden Rule Of Bond Investing
Table 1Germany: 12-Month Government Bond Index Returns And Rate Surprises (2004 - Present)
The Global Golden Rule Of Bond Investing
The Global Golden Rule Of Bond Investing
Looking ahead, the ECB should not deviate from its current dovish forward guidance of no interest rate hikes until at least the third quarter of 2019. That is somewhat consistent with the reading of the ECB monitor being almost equal to zero. Bank Of England (BoE) Policy Rate Surprises The GGR works well for the U.K. as can be seen in Chart 3A. Chart 3ABoE Policy Rate Surprise & Yields I
BoE Policy Rate Surprise & Yields I
BoE Policy Rate Surprise & Yields I
Chart 3BBoE Policy Rate Surprise & Yields II
BoE Policy Rate Surprise & Yields II
BoE Policy Rate Surprise & Yields II
The 12-month BoE policy rate surprise and the 12-month change in the Bloomberg Barclays U.K. Treasury index yield displays a strong positive correlation except for a major divergence in 1997-1998 (Chart 3B). Dovish surprises coincide with positive excess returns over cash 78% of the time and are on average equal to 6.2% over the full sample (Chart 3C and Chart 3D). As you would expect if the GGR applies, hawkish surprises coincide with negative excess returns. Chart 3CU.K.: Government Bond Index Excess Return & BoE Policy Rate Surprises (1993 - Present)
The Global Golden Rule Of Bond Investing
The Global Golden Rule Of Bond Investing
Chart 3DU.K.: Government Bond Index Total Return & BoE Policy Rate Surprises (1993 - Present)
The Global Golden Rule Of Bond Investing
The Global Golden Rule Of Bond Investing
Table 2U.K.: 12-Month Government Bond Index Returns And Rate Surprises (1993 - Present)
The Global Golden Rule Of Bond Investing
The Global Golden Rule Of Bond Investing
Looking ahead, outcomes will be biased toward dovish surprises over the next six months given the uncertain outcome of the U.K.-E.U. Brexit negotiations. Against that backdrop, the BoE will remain accommodative despite inflationary pressures building up. Bank Of Japan (BoJ) Policy Rate Surprises The GGR does not seem to work when it comes to the Japanese bond market. This reflects the fact that both the markets and the Bank of Japan (BoJ) have understood that chronic low inflation has required no changes in BoJ policy rates (Chart 4A, second panel). Chart 4ABoJ Policy Rate Surprise & Yields I
BoJ Policy Rate Surprise & Yields I
BoJ Policy Rate Surprise & Yields I
Chart 4BBoJ Policy Rate Surprise & Yields II
BoJ Policy Rate Surprise & Yields II
BoJ Policy Rate Surprise & Yields II
While the 12-month BoJ policy rate surprise and the 12-month change in the Bloomberg Barclays Japan Treasury index yield displayed a strong positive correlation pre-1998, the correlation has broken down since then (Chart 4B). Negative excess returns over cash both coincide with dovish and hawkish surprises, on average over time. Further, dovish surprises coincide with positive excess returns only 45% of the time (Chart 4C and Chart 4D). Chart 4CJapan: Government Bond Index Excess Return & BoJ Policy Rate Surprises (1994 - Present)
The Global Golden Rule Of Bond Investing
The Global Golden Rule Of Bond Investing
Chart 4DJapan: Government Bond Index Total Return & BoJ Policy Rate Surprises (1994 - Present)
The Global Golden Rule Of Bond Investing
The Global Golden Rule Of Bond Investing
Table 3Japan: 12-Month Government Bond Index Returns And Rate Surprises (1994 - Present)
The Global Golden Rule Of Bond Investing
The Global Golden Rule Of Bond Investing
Looking ahead, given that the BoJ will in all likelihood maintain its ultra-accommodative monetary policy stance in the near future, we do not expect the GGR to become more effective when applied to the Japanese bond market. Bank Of Canada (BoC) Policy Rate Surprises The GGR works relatively well for the Canadian bond market (Chart 5A). Chart 5ABoC Policy Rate Surprise & Yields I
BoC Policy Rate Surprise & Yields I
BoC Policy Rate Surprise & Yields I
Chart 5BBoC Policy Rate Surprise & Yields II
BoC Policy Rate Surprise & Yields II
BoC Policy Rate Surprise & Yields II
We observe a tight correlation between 12-month BoC policy rate surprises and the 12-month change in the Bloomberg Barclays Canada Treasury index yield, especially post-2010 (Chart 5B). Dovish surprises coincide with positive excess returns 81% of the time and 94% of the time if we look at total returns (Chart 5C and Chart 5D). Chart 5CCanada: Government Bond Index Excess Return & BoC Policy Rate Surprises (1993 - Present)
The Global Golden Rule Of Bond Investing
The Global Golden Rule Of Bond Investing
Chart 5DCanada: Government Bond Index Total Return & BoC Policy Rate Surprises (1993 - Present)
The Global Golden Rule Of Bond Investing
The Global Golden Rule Of Bond Investing
Table 4Canada: 12-Month Government Bond Index Returns And Rate Surprises (1993 - Present)
The Global Golden Rule Of Bond Investing
The Global Golden Rule Of Bond Investing
Looking ahead, the BoC will most likely continue to follow the tightening path of the Federal Reserve, admittedly with a lag. However, accelerating inflation at a time when there is no spare capacity in the Canadian economy suggests that the BoC could deliver more rate hikes than are already priced for the next 12 months. As shown in Table 4, hawkish surprises from the BoC do coincide with negative monthly excess returns of -2.8%. Reserve Bank Of Australia (RBA) Policy Rate Surprises The GGR applies extremely well to the Australian bond market (Chart 6A). Chart 6ARBA Policy Rate Surprise & Yields I
RBA Policy Rate Surprise & Yields I
RBA Policy Rate Surprise & Yields I
Chart 6BRBA Policy Rate Surprise & Yields II
RBA Policy Rate Surprise & Yields II
RBA Policy Rate Surprise & Yields II
The 12-month RBA policy rate surprise and the 12-month change in the Bloomberg Barclays Australia Treasury index yield displays the tightest correlation out of all the countries covered (Chart 6B). Dovish surprises coincide with positive excess returns 83% of the time and 96% of the time if we look at total returns (Chart 6C and Chart 6D). Turning to hawkish surprises, they reliably coincide with negative excess returns. Chart 6CAustralia: Government Bond Index Excess Return & RBA Policy Rate Surprises (1994 - Present)
The Global Golden Rule Of Bond Investing
The Global Golden Rule Of Bond Investing
Chart 6DAustralia: Government Bond Index Total Return & RBA Policy Rate Surprises (1994 - Present)
The Global Golden Rule Of Bond Investing
The Global Golden Rule Of Bond Investing
Table 5Australia: 12-Month Government Bond Index Returns And Rate Surprises (1994 - Present)
The Global Golden Rule Of Bond Investing
The Global Golden Rule Of Bond Investing
As can be seen on the bottom panel of Chart 6A, the RBA Monitor has been rapidly falling since 2016 and now stands in the "easier monetary policy" required. However, the RBA will likely have to see a rise in unemployment or a decline in realized inflation before it considers cutting rates, which raises a risk of "hawkish" surprises if the market begins to price in rate cuts. Reserve Bank Of New Zealand (RBNZ) Policy Rate Surprises The GGR works fairly well for Nez Zealand (NZ) government bonds (Chart 7A). Chart 7ARBNZ Policy Rate Surprise & Yields I
RBNZ Policy Rate Surprise & Yields I
RBNZ Policy Rate Surprise & Yields I
Chart 7BRBNZ Policy Rate Surprise & Yields II
RBNZ Policy Rate Surprise & Yields II
RBNZ Policy Rate Surprise & Yields II
12-month RBNZ policy rate surprises and the 12-month change in the Bloomberg Barclays NZ Treasury yield exhibit a decent correlation (Chart 7B). Unusually, NZ is the only bond market covered in this report where both dovish and hawkish surprises coincide with positive excess returns on average, although positive episodes are much less frequent for hawkish surprises than for dovish surprises; respectively 55% and 86% (Chart 7C and Chart 7D). Chart 7CNZ: Government Bond Index Excess Return & RBNZ Policy Rate Surprises (2000 - Present)
The Global Golden Rule Of Bond Investing
The Global Golden Rule Of Bond Investing
Chart 7DNZ: Government Bond Index Total Return & RBNZ Policy Rate Surprises (2000 - Present)
The Global Golden Rule Of Bond Investing
The Global Golden Rule Of Bond Investing
Table 6New Zealand: 12-Month Government Bond Index Returns And Rate Surprises (2000 - Present)
The Global Golden Rule Of Bond Investing
The Global Golden Rule Of Bond Investing
Looking ahead, the RBNZ has already provided forward guidance indicating that the Overnight Cash Rate (OCR) will most likely stay flat until 2020 - an assessment that we agree with, so the odds are against any policy surprises over at least the next 6-12 months. Using The Global Golden Rule To Forecast Government Bond Returns The practical application of the GGR is that it can be used as a framework for generating expected changes in yields and calculating total return forecasts for global government bond indices. The strong correlation demonstrated in the previous section between the 12-month policy rate surprises and the 12-month change in the average yield from the government bond indexes allows us to translate our "assumed" policy rate surprise over the next 12 months into expected changes in yields along the curve. With these expected yield changes, we can simply generate expected total returns using the following formula: Expected Total Return = Yield - (Duration*Expected Change In Yield) + 0.5*Convexity*E(DY2) E(DY2) = 1-year trailing estimate of yield volatility It is important to note that we would not give too much importance to what this analysis yields for longer-dated bonds. As shown in the Appendices, once we move into longer government bond maturities, the correlation between the policy rate surprise and the change in yields declines or even becomes non-existent for some countries. This result should not be surprising, as longer-term yields are driven by other factors besides simply changes in interest rate expectations. Inflation expectations, government debt levels and demand from longer-term investors like pension funds all can have a more outsized influence on the path of longer-term bond yields relative to the shorter-end. That results in much more uncertainty when it comes to the total return forecasts for long-dated maturities calculated with this framework. Practically speaking, we are not encouraging our readers to blindly follow that yield and return expectations generated by the GGR, even for bond markets where it clearly seems to be working over time. Rather, the GGR can be integrated in a larger asset-allocation framework for a global fixed-income portfolio by providing one possible set of bond market outcomes. On a total return basis, the results presented below, interpreted alongside the readings on the BCA Central Bank monitors, suggest that investors should be underweight core Euro Area (Germany, France and Italy), Australia and New Zealand while remaining overweight the U.K. and Canada over the next twelve months. As for Japan, given the likelihood that BoJ will leave its policy rate flat, the results hint at a neutral allocation. Jeremie Peloso, Research Analyst jeremie@bcaresearch.com Robert Robis, CFA, Senior Vice President Global Fixed Income Strategy rrobis@bcaresearch.com 1 Please see U.S. Bond Strategy Special Report, "The Golden Rule Of Bond Investing", dated July 24, 2018, available at usbs.bcaresearch.com. 2 Please see Global Fixed Income Strategy Weekly Report, "BCA Central Bank Monitor Chartbook: Divergences Opening Up," dated September 19, 2018, available at gfis.bcaresearch.com. Global Golden Rule: Germany In light of the forward guidance ECB President Mario Draghi has been providing to the markets, it appears that the most likely scenario over the next 12 months is for the ECB to keep interest rates on hold. Based on the strong relationships between 12-month ECB policy rate surprises and 12-month changes in yields along the curve (Appendix A), a flat interest rate scenario would be bond bearish for German government bonds especially at the short end of the curve with the 1-year German yield expected to rise by 16bps (Table 7A). Table 7AGermany: Expected Changes In Bund Yields Over The Next 12 Months (BPs)
The Global Golden Rule Of Bond Investing
The Global Golden Rule Of Bond Investing
Using the expected change in yields thus inferred by the policy rate surprise, the German government bond aggregate index is forecasted to return 0.45% over the next 12 months (Table 7B). Table 7BGermany: Government Bond Index Total Return Forecasts Over The Next 12 Months
The Global Golden Rule Of Bond Investing
The Global Golden Rule Of Bond Investing
Global Golden Rule: U.K. Markets are currently discounting only 21bps of rate hikes in the U.K. over the next year. Thus, even a scenario where the BoE delivers only a single 25bp rate hike would be bearish for U.K. Gilts, especially at the short-end of the curve. Applying the GGR, 1- and 3-year Gilt yields would be expected to rise by 20bps and 10bps respectively (Table 8A). Table 8AU.K.: Expected Changes In Gilt Yields Over The Next 12 Months (BPs)
The Global Golden Rule Of Bond Investing
The Global Golden Rule Of Bond Investing
Interpolating these expected yield changes, the 1-3 year government bond index total return forecast would be 0.46%. On the other hand, if the BoE prefers to keep rates on hold given the uncertainty of the Brexit outcome, that same 1-3 year government bond index is forecasted to deliver 0.97% of total return over the next 12 months (Table 9B). This is our current base case scenario for Gilts. Table 8BU.K.: Government Bond Index Total Return Forecasts Over The Next 12 Months
The Global Golden Rule Of Bond Investing
The Global Golden Rule Of Bond Investing
Global Golden Rule: Japan Despite many rumors to the contrary earlier this year, the base case view remains that the BoJ will not change its stance on monetary policy anytime soon. As such, the expected changes in JGB yields under a flat interest rate scenario over the next 12 months are close to zero at the short end of the curve and rather bond bullish at the longer end of the curve; for instance, the 30-year JGB yield would be expected to rally by 9bps (Table 9A). Table 9AJapan: Expected Changes In JGB Yields Over The Next 12 Months (BPs)
The Global Golden Rule Of Bond Investing
The Global Golden Rule Of Bond Investing
In that most likely scenario, the Japanese government bond index is forecasted to deliver 0.83% of total return over the next 12 months. In the event that the BoJ surprises the markets by delivering one rate hike of 25bps, it would be bond bearish for JGBs and the total return forecasts for the government bond indices would be negative, regardless of the maturity (Table 9B). Table 9BJapan: Government Bond Index Total Return Forecasts Over The Next 12 Months
The Global Golden Rule Of Bond Investing
The Global Golden Rule Of Bond Investing
Global Golden Rule: Canada Will the Bank of Canada follow the footsteps of the Fed? The markets certainly seem to think so, with more than three 25bps rate hikes priced in for next 12 months in the OIS curve. Table 10ACanada: Expected Changes In Government Bond Yields Over The Next 12 Months (BPs)
The Global Golden Rule Of Bond Investing
The Global Golden Rule Of Bond Investing
That scenario would be outright bearish for Canadian government bonds, with 1- and 2-year yields rising by 16bps and 21bps, respectively (Table 10A). In terms of total returns, the GGR framework forecasts that with 75bps of rate hikes, the Canadian government bond aggregate index would deliver a positive return of 2.35% (Table 10B). This is because 75bps of hikes are currently discounted in the Canadian OIS curve, thus it would neither be a hawkish nor dovish surprise. Table 10BCanada: Government Bond Index Total Return Forecasts Over The Next 12 Months
The Global Golden Rule Of Bond Investing
The Global Golden Rule Of Bond Investing
Global Golden Rule: Australia The RBA Monitor just dipped below the zero line, implying that easier monetary policy is required based on financial and economic data. Table 11A shows that a rate cut delivered by the RBA in the next 12 months would be bond bullish for Aussie yields, especially at the long end of the curve, where the 30-year Aussie bond yield would fall by 34bps. Table 11AAustralia: Expected Changes In Aussie Yields Over The Next 12 Months (BPs)
The Global Golden Rule Of Bond Investing
The Global Golden Rule Of Bond Investing
Of all the interest rate scenarios presented in Table 11B, the two rate cut scenarios would return the highest total returns. For instance, the Australian government bond aggregate index would return 2.80% and 3.90% in the event of one and two 25bps rate hikes, respectively. Table 11BAustralia: Government Bond Index Total Return Forecasts Over The Next 12 Months
The Global Golden Rule Of Bond Investing
The Global Golden Rule Of Bond Investing
Global Golden Rule: New Zealand Our view is that the Reserve Bank of New Zealand will stay on hold for a while longer, which is broadly the same message conveyed by the RBNZ Monitor being positive, but very close to 0. With that in mind, a flat interest rate scenario appears to be bond bearish for the NZ bond yields, except for the longer end of the curve (Table 12A). Table 12ANew Zealand: Expected Changes In NZ Yields Over The Next 12 Months (BPs)
The Global Golden Rule Of Bond Investing
The Global Golden Rule Of Bond Investing
Table 12BNew Zealand: Government Bond Index Total
The Global Golden Rule Of Bond Investing
The Global Golden Rule Of Bond Investing
For New Zealand, the government bond aggregate bond index is the only index provided by Bloomberg Barclays, as opposed to the other countries in our analysis where different maturities are given. In the flat interest rate scenario, the total return forecast for the overall index would be of 2.53% over the next 12 months. Appendix A: Germany Chart 1Change In 1-Year German Bund Yield##BR##Vs. 12-Month ECB Policy Rate Surprise
The Global Golden Rule Of Bond Investing
The Global Golden Rule Of Bond Investing
Chart 2Change In 2-Year German Bund Yield##BR##Vs. 12-Month ECB Policy Rate Surprise
The Global Golden Rule Of Bond Investing
The Global Golden Rule Of Bond Investing
Chart 3Change In 3-Year German Bund Yield##BR##Vs. 12-Month ECB Policy Rate Surprise
The Global Golden Rule Of Bond Investing
The Global Golden Rule Of Bond Investing
Chart 4Change In 5-Year German Bund Yield##BR##Vs. 12-Month ECB Policy Rate Surprise
The Global Golden Rule Of Bond Investing
The Global Golden Rule Of Bond Investing
Chart 5Change In 7-Year German Bund Yield##BR##Vs. 12-Month ECB Policy Rate Surprise
The Global Golden Rule Of Bond Investing
The Global Golden Rule Of Bond Investing
Chart 6Change In 10-Year German Bund Yield##BR##Vs. 12-Month ECB Policy Rate Surprise
The Global Golden Rule Of Bond Investing
The Global Golden Rule Of Bond Investing
Chart 7Change In 30-Year German Bund Yield##BR##Vs. 12-Month ECB Policy Rate Surprise
The Global Golden Rule Of Bond Investing
The Global Golden Rule Of Bond Investing
Appendix B: France Chart 8Change In 1-Year French OAT Yield##BR##Vs. 12-Month ECB Policy Rate Surprise
The Global Golden Rule Of Bond Investing
The Global Golden Rule Of Bond Investing
Chart 9Change In 2-Year French OAT Yield##BR##Vs. 12-Month ECB Policy Rate Surprise
The Global Golden Rule Of Bond Investing
The Global Golden Rule Of Bond Investing
Chart 10Change In 3-Year French OAT Yield##BR##Vs. 12-Month ECB Policy Rate Surprise
The Global Golden Rule Of Bond Investing
The Global Golden Rule Of Bond Investing
Chart 11Change In 5-Year French OAT Yield##BR##Vs. 12-Month ECB Policy Rate Surprise
The Global Golden Rule Of Bond Investing
The Global Golden Rule Of Bond Investing
Chart 12Change In 7-Year French OAT Yield##BR##Vs. 12-Month ECB Policy Rate Surprise
The Global Golden Rule Of Bond Investing
The Global Golden Rule Of Bond Investing
Chart 13Change In 10-Year French OAT Yield##BR##Vs. 12-Month ECB Policy Rate Surprise
The Global Golden Rule Of Bond Investing
The Global Golden Rule Of Bond Investing
Chart 14Change In 30-Year French OAT Yield##BR##Vs. 12-Month ECB Policy Rate Surprise
The Global Golden Rule Of Bond Investing
The Global Golden Rule Of Bond Investing
Appendix C: Italy Chart 15Change In 1-Year Italian Gov't Bond Yield##BR##Vs. 12-Month ECB Policy Rate Surprise
The Global Golden Rule Of Bond Investing
The Global Golden Rule Of Bond Investing
Chart 16Change In 2-Year Italian Gov't Bond Yield##BR##Vs. 12-Month ECB Policy Rate Surprise
The Global Golden Rule Of Bond Investing
The Global Golden Rule Of Bond Investing
Chart 17Change In 3-Year Italian Gov't Bond Yield##BR##Vs. 12-Month ECB Policy Rate Surprise
The Global Golden Rule Of Bond Investing
The Global Golden Rule Of Bond Investing
Chart 18Change In 5-Year Italian Gov't Bond Yield##BR##Vs. 12-Month ECB Policy Rate Surprise
The Global Golden Rule Of Bond Investing
The Global Golden Rule Of Bond Investing
Chart 19Change In 7-Year Italian Gov't Bond Yield##BR##Vs. 12-Month ECB Policy Rate Surprise
The Global Golden Rule Of Bond Investing
The Global Golden Rule Of Bond Investing
Chart 20Change In 10-Year Italian Gov't Bond Yield##BR##Vs. 12-Month ECB Policy Rate Surprise
The Global Golden Rule Of Bond Investing
The Global Golden Rule Of Bond Investing
Chart 21Change In 30-Year Italian Gov't Bond Yield##BR##Vs. 12-Month ECB Policy Rate Surprise
The Global Golden Rule Of Bond Investing
The Global Golden Rule Of Bond Investing
Appendix D: U.K. Chart 22Change In 1-Year Gilts Yield##BR##Vs. 12-Month BoE Policy Rate Surprise
The Global Golden Rule Of Bond Investing
The Global Golden Rule Of Bond Investing
Chart 23Change In 2-Year Gilts Yield##BR##Vs. 12-Month BoE Policy Rate Surprise
The Global Golden Rule Of Bond Investing
The Global Golden Rule Of Bond Investing
Chart 24Change In 3-Year Gilts Yield##BR##Vs. 12-Month BoE Policy Rate Surprise
The Global Golden Rule Of Bond Investing
The Global Golden Rule Of Bond Investing
Chart 25Change In 5-Year Gilts Yield##BR##Vs. 12-Month BoE Policy Rate Surprise
The Global Golden Rule Of Bond Investing
The Global Golden Rule Of Bond Investing
Chart 26Change In 7-Year Gilts Yield##BR##Vs. 12-Month BoE Policy Rate Surprise
The Global Golden Rule Of Bond Investing
The Global Golden Rule Of Bond Investing
Chart 27Change In 10-Year Gilts Yield##BR##Vs. 12-Month BoE Policy Rate Surprise
The Global Golden Rule Of Bond Investing
The Global Golden Rule Of Bond Investing
Chart 28Change In 30-Year Gilts Yield##BR##Vs. 12-Month BoE Policy Rate Surprise
The Global Golden Rule Of Bond Investing
The Global Golden Rule Of Bond Investing
Appendix E: Japan Chart 29Change In 1-Year Japanese JGB Yield##BR##Vs. 12-Month BoJ Policy Rate Surprise
The Global Golden Rule Of Bond Investing
The Global Golden Rule Of Bond Investing
Chart 30Change In 2-Year Japanese JGB Yield##BR##Vs. 12-Month BoJ Policy Rate Surprise
The Global Golden Rule Of Bond Investing
The Global Golden Rule Of Bond Investing
Chart 31Change In 3-Year Japanese JGB Yield##BR##Vs. 12-Month BoJ Policy Rate Surprise
The Global Golden Rule Of Bond Investing
The Global Golden Rule Of Bond Investing
Chart 32Change In 5-Year Japanese JGB Yield##BR##Vs. 12-Month BoJ Policy Rate Surprise
The Global Golden Rule Of Bond Investing
The Global Golden Rule Of Bond Investing
Chart 33Change In 7-Year Japanese JGB Yield##BR##Vs. 12-Month BoJ Policy Rate Surprise
The Global Golden Rule Of Bond Investing
The Global Golden Rule Of Bond Investing
Chart 34Change In 10-Year Japanese JGB Yield##BR##Vs. 12-Month BoJ Policy Rate Surprise
The Global Golden Rule Of Bond Investing
The Global Golden Rule Of Bond Investing
Chart 35Change In 30-Year Japanese JGB Yield##BR##Vs. 12-Month BoJ Policy Rate Surprise
The Global Golden Rule Of Bond Investing
The Global Golden Rule Of Bond Investing
Appendix F: Canada Chart 36Change In 1-Year Canadian Yield##BR##Vs. 12-Month BoC Policy Rate Surprise
The Global Golden Rule Of Bond Investing
The Global Golden Rule Of Bond Investing
Chart 37Change In 2-Year Canadian Yield##BR##Vs. 12-Month BoC Policy Rate Surprise
The Global Golden Rule Of Bond Investing
The Global Golden Rule Of Bond Investing
Chart 38Change In 3-Year Canadian Yield##BR##Vs. 12-Month BoC Policy Rate Surprise
The Global Golden Rule Of Bond Investing
The Global Golden Rule Of Bond Investing
Chart 39Change In 5-Year Canadian Yield##BR##Vs. 12-Month BoC Policy Rate Surprise
The Global Golden Rule Of Bond Investing
The Global Golden Rule Of Bond Investing
Chart 40Change In 7-Year Canadian Yield##BR##Vs. 12-Month BoC Policy Rate Surprise
The Global Golden Rule Of Bond Investing
The Global Golden Rule Of Bond Investing
Chart 41Change In 10-Year Canadian Yield##BR##Vs. 12-Month BoC Policy Rate Surprise
The Global Golden Rule Of Bond Investing
The Global Golden Rule Of Bond Investing
Chart 42Change In 30-Year Canadian Yield##BR##Vs. 12-Month BoC Policy Rate Surprise
The Global Golden Rule Of Bond Investing
The Global Golden Rule Of Bond Investing
Appendix G: Australia Chart 43Change In 1-Year Aussie Yield##BR##Vs. 12-Month RBA Policy Rate Surprise
The Global Golden Rule Of Bond Investing
The Global Golden Rule Of Bond Investing
Chart 44Change In 2-Year Aussie Yield##BR##Vs. 12-Month RBA Policy Rate Surprise
The Global Golden Rule Of Bond Investing
The Global Golden Rule Of Bond Investing
Chart 45Change In 3-Year Aussie Yield##BR##Vs. 12-Month RBA Policy Rate Surprise
The Global Golden Rule Of Bond Investing
The Global Golden Rule Of Bond Investing
Chart 46Change In 5-Year Aussie Yield##BR##Vs. 12-Month RBA Policy Rate Surprise
The Global Golden Rule Of Bond Investing
The Global Golden Rule Of Bond Investing
Chart 47Change In 7-Year Aussie Yield##BR##Vs. 12-Month RBA Policy Rate Surprise
The Global Golden Rule Of Bond Investing
The Global Golden Rule Of Bond Investing
Chart 48Change In 10-Year Aussie Yield##BR##Vs. 12-Month RBA Policy Rate Surprise
The Global Golden Rule Of Bond Investing
The Global Golden Rule Of Bond Investing
Appendix H: New Zealand Chart 49Change In 1-Year NZ Yield##BR##Vs. 12-Month RBNZ Policy Rate Surprise
The Global Golden Rule Of Bond Investing
The Global Golden Rule Of Bond Investing
Chart 50Change In 2-Year NZ Yield##BR##Vs. 12-Month RBNZ Policy Rate Surprise
The Global Golden Rule Of Bond Investing
The Global Golden Rule Of Bond Investing
Chart 51Change In 3-Year NZ Yield##BR##Vs. 12-Month RBNZ Policy Rate Surprise
The Global Golden Rule Of Bond Investing
The Global Golden Rule Of Bond Investing
Chart 52Change In 5-Year NZ Yield##BR##Vs. 12-Month RBNZ Policy Rate Surprise
The Global Golden Rule Of Bond Investing
The Global Golden Rule Of Bond Investing
Chart 53Change In 7-Year NZ Yield##BR##Vs. 12-Month RBNZ Policy Rate Surprise
The Global Golden Rule Of Bond Investing
The Global Golden Rule Of Bond Investing
Chart 54Change In 10-Year NZ Yield##BR##Vs. 12-Month RBNZ Policy Rate Surprise
The Global Golden Rule Of Bond Investing
The Global Golden Rule Of Bond Investing
Highlights Rates are going higher ... : Flight-to-quality episodes aside, the bond bear market that began in July 2016 remains in force. Investors should maintain below-benchmark Treasury duration. ... but that doesn't necessarily spell immediate trouble for stocks: Consistent with our work on the fed funds rate cycle, it appears that the level of rates matters more for equity returns than their direction. Empirical evidence of a rates tipping point is elusive ... : The notion that investors migrate from stocks to bonds at a particular level of rates exerts a powerful intuitive appeal, but the data fail to validate it. ... but a 10-year yield Treasury of 3.75 - 4% might halt the bull market in its tracks: Higher rates reliably slow equities only when they rise enough to slow the economy. We estimate that the pinch point is somewhere in the neighborhood of a 3.75 - 4% 10-year Treasury yield. Feature A share of stock is a pro rata claim on the future earnings of the company that issued it. Holding future earnings constant, the price an investor will be willing to pay for a share is wholly a function of the rate used to discount its earnings back to the present day. The simplicity and ubiquity of this valuation approach suggest that equity returns should be predictably related to moves in interest rates. It may also point the way to a tipping point - either in the level of rates, or the magnitude of their rise - at which capital and savings migrate from stocks to bonds. This Special Report reviews the historical record to see how U.S. equities have interacted with real 10-year Treasury yields. It considers the key variables that would logically seem to bear on equity performance and investors' propensity to rotate between asset classes. We find that the relationship between rates and equity returns is conditional, depending on which crosscurrent dominates in any given episode. We did not uncover any predictable rotation pattern. Do The Math As noted above, valuing a stream of future cash flows is a simple mechanical process once one settles on an appropriate discount rate for converting future dollars to current dollars. According to the security analysis textbooks, then, moves in stock prices are inversely related to changes in interest rates. But the textbooks leave out one key point: changes in interest rates don't occur in a vacuum. When they change, earnings estimates are likely to change, too, most often in the same direction as real rates. To be sure, the denominator discounting future cash flows rises when real rates rise, but the future-earnings numerator most likely rises, too. If real rates are rising, the economy is probably gaining momentum, and earnings estimates should probably be revised higher as well. Conversely, falling rates lead to a higher earnings multiple (ex-the not insignificant animal-spirits wild card), but will regularly be accompanied by downward revisions in future earnings. The net effect is uncertain, and depends on whether the multiple change outweighs the change in earnings or vice versa. Bonds Are A Snap Compared To Stocks It's far simpler to compute the impact on a bond portfolio from a given increase in interest rates because the denominator is the only variable that changes. The future-cash-flows numerator is contractually fixed, and it takes a big shift in the state of the economy to spark an economy-wide change in perceived repayment potential.1 This is why bonds' sensitivity to changes in interest rates can be captured in a single universal metric (duration). Stocks are pulled in so many different directions by factors affecting future cash flows that duration has no equity analogue. Investors should therefore be cautious about pinning too much on interest rates as they relate to equities. Bonds move in fixed orbits around the interest-rate sun, according to strictly ordered rules that establish a very clear cause-and-effect relationship. Equities improvise as they go along, taking their cues from a rotating cast of variables that interact differently over time. Attempts to stretch the concept of interest-rate sensitivity beyond bonds regularly trip up equity investors; we cannot know in advance how rates will come together with the other factors that influence equities. Confounding Intuition, Part 1: Equities Prefer Rising Rates (And Multiples Don't Care) U.S. postwar history makes it clear that equity investors need not run from rising rates. The S&P 500 has fared considerably better when real 10-year yields have risen by at least 100 basis points ("bps") than it has when they've declined by that magnitude (Chart 1), gaining 9.4% and 5%, respectively (Chart 2). Rates do not exhibit any sort of a consistent relationship with either forward (Chart 3) or trailing (Chart 4) S&P 500 multiples, though extremely high and extremely low real yields are both associated with lower trailing P/Es. Negative real yields carry an unwelcome whiff of deflation, and their scatterplot data points tend to cluster at below-the-mean forward and trailing multiples. Chart 1Stocks Actually Do Better When Rates Rise ...
Stocks Actually Do Better When Rates Rise ...
Stocks Actually Do Better When Rates Rise ...
Chart 2... Considerably Better
... Considerably Better
... Considerably Better
When Do Higher Rates Hurt The Economy? Charts 3 and 4 show that both forward and trailing multiples almost always decline when real 10-year Treasury yields cross above 5%. What's bad for multiples isn't necessarily bad for earnings, however, and a 5% real threshold is irrelevant to today's cycle. The steady decline in the average fed funds rate over the last several completed cycles (Chart 5) makes it clear that neutral rate thresholds are not constant across time periods. Assessing interest rates' impact on the economy over time requires a sliding scale. Chart 3Hard To See A Trend Through The Windshield ...
When Will Higher Rates Hurt Stocks?
When Will Higher Rates Hurt Stocks?
Chart 4... Or The Rear-View Mirror
When Will Higher Rates Hurt Stocks?
When Will Higher Rates Hurt Stocks?
Estimates of potential economic growth provide a useful yardstick for measuring the impact of real yields. Comparing real long rates to potential output offers insight into the burden of servicing debt across the economy. If real rates exceed the economy's potential growth rate by a material amount, several marginal borrowers are likely to be gasping for air, and their travails will weigh on the economy. Conversely, servicing debt should be easy when real rates are below potential growth, and investors are more likely to invest, businesses are more likely to expand, and consumers are more likely to spend. Chart 5One Size Does Not Fit All
One Size Does Not Fit All
One Size Does Not Fit All
There have been 22 instances in the postwar era when real 10-year Treasury yields have increased by at least 100 bps, and Table 1 lists all of them, grouped by their relationship to real GDP's potential five-year growth rate. There are three possible states for interest rate increases in relation to potential output: starting and ending below trend growth, starting below trend growth and ending above it, and starting and ending above trend. The S&P 500 comfortably tops its overall postwar returns when rates go from Below-to-Below and Below-to-Above, but declines outright when rates start above potential growth and go even higher. Earnings consistently rise when rates start below potential growth, making multiples the swing factor - when they expand, S&P 500 gains tend to be very large (Box 1). Table 1Real Rates Versus Potential GDP Growth
When Will Higher Rates Hurt Stocks?
When Will Higher Rates Hurt Stocks?
Box 1 Decomposing S&P 500 Returns Table 2 details the decomposition of S&P 500 returns during rising real rate episodes occurring after S&P 500 earnings estimates began to be compiled in 1979. Except in the crucible of 2009, when they were flat, forward earnings estimates have always risen when rates rise from a below-trend starting point, putting a tailwind behind the S&P 500 that regularly overcomes the multiple contraction that occurs in half of the Below/Above instances. Multiples are the swing factor; when they expand in conjunction with rising earnings estimates, U.S. equities soar. They always contract when rates go from high to higher, dragging stocks down against a mixed earnings expectations backdrop. The action is consistent with our fed funds rate cycle work: stocks do best when rates are below equilibrium and falling because earnings and multiples expand in tandem in that setting, but they do nearly as well after rate hikes commence, in spite of multiple contraction. Earnings surge when the Fed is confident enough about the economy to embark on a tightening cycle, but has not yet hiked enough to choke off the expansion. Multiple expansion in a majority of the Below/Above instances reveals that investors do not rotate out of equities en masse when rates rise, even by a considerable amount. The rotation story has intuitive appeal, but it doesn't show up in these data. Table 2Decomposition Of S&P 500 Returns During Rising Rate Periods
When Will Higher Rates Hurt Stocks?
When Will Higher Rates Hurt Stocks?
A Little More Slicing And Dicing (Potential GDP Matters) Chart 6Mind The Gap
Mind The Gap
Mind The Gap
Defining Below-to-Below and Below-to-Above states is easy in hindsight, but an investor cannot know in real time where a rising-rate instance that begins with rates below potential output will end. Earnings rise no matter where rates end relative to potential GDP, but re-rating in Below/Below can flip to de-rating in Below/Above, slamming the brakes on phase gains. The empirical data say investors should lighten up on S&P 500 exposure when real rates cross above real potential GDP. S&P 500 returns trounce their overall postwar gain when rates rise from below potential GDP to potential GDP but lag it once rates cross above potential GDP (Chart 6). Confounding Intuition, Part 2: Institutional Investors Don't Rotate Even if S&P 500 returns fail to demonstrate any consistent relationship with interest rates, one would expect that professional investors' asset-class positioning would. Bonds and stocks are alternatives for one another, and institutional investors presumably shift their allocations in line with the asset classes' relative prospects. We examine Pension Funds', Life Insurers', and Mutual Funds' asset-allocation profiles over time using balance-sheet data from the Federal Reserve's quarterly Flow of Funds report. The data show that asset-allocation decisions are made without apparent regard for relative valuations, at least as proxied by the equity risk premium. Pension funds' steady increase in equity allocations across the '90s appears to have been less a function of rate moves than buying into the bull market (Chart 7). Since the dot-com bubble burst in 2000, bond and equity allocations have mainly reflected the performance tides. The extended trend in pension funds' equity-to-bond allocation ratio suggests that the funds set a long-range goal and grind steadily toward achieving it, regardless of relative valuation movements. It also suggests that the funds may not bother with rebalancing, much less dynamic asset allocation. Life insurers kept their fixed income and equity allocations more or less fixed across the '70s (not shown) and most of the '80s. They then reduced equity exposure for three years after 1987's Black Monday, assiduously built it up across the '90s, and have more or less let it drift since the millennium (Chart 8). The equity risk premium does not appear to have been a consideration. Asset-allocation stasis may simply be a reflection of life insurers' stringent regulatory constraints, but their portfolio managers' limited discretion precludes opportunistic allocation shifts. Mutual fund allocations tend to depend much more on past events than future expectations. Equity holdings peak when the equity risk premium bottoms and bottom when the equity risk premium peaks (Chart 9). The problem is that mutual fund managers are structurally hostage to their investors' whims. They are sorted into narrow silos and then straitjacketed by the rigid allocation rules written into their fund prospectuses. Even if they think asset-class rotation is a great idea, only a tiny minority of fund managers can act upon it. Chart 7Pension Funds Don't Allocate Based On Yields Or The ERP ...
Pension Funds Don't Allocate Based On Yields Or The ERP ...
Pension Funds Don't Allocate Based On Yields Or The ERP ...
Chart 8... While Life Insurers Appear To Allocate In Defiance Of Them
... While Life Insurers Appear To Allocate In Defiance Of Them
... While Life Insurers Appear To Allocate In Defiance Of Them
Chart 9Mutual Funds##BR##Obey Their Owners ...
Mutual Funds Obey Their Owners ...
Mutual Funds Obey Their Owners ...
Confounding Darwin's Intuition: Human Investors Never Learn Chart 10... Who Act On Real Emotion, Not Real Yields
... Who Act On Real Emotion, Not Real Yields
... Who Act On Real Emotion, Not Real Yields
Kahneman and Tversky's groundbreaking research into decision-making under uncertainty revealed that our species is wired to make suboptimal investment decisions. Prospect theory, loss aversion and an unhealthy fixation on recent data all encourage retail investors to repeatedly shoot themselves in the foot. When it comes to asset allocation, households appear to focus exclusively on the action in the rear-view mirror (Chart 10). Retail investors as a group rotate between equities and fixed income retroactively, in response to recent past returns, not proactively in response to cues about future relative-return prospects. Investment Implications Despite the compelling intuition that investors should set their course by the interest-rate stars, there is no evidence in the flow of funds data that they have done so in the past. We posit that structural constraints on institutional investors, combined with humans' durable cognitive biases, offer no reason to expect that they will do so in the future. While there may not be any predictable rotation pattern, rising rates have given rise to a predictable performance pattern. Equities reliably perform better when real rates are rising by at least 100 basis points than they do when they're falling. Decomposition of S&P 500 returns indicates that the pattern holds because earnings rise a good bit more in rising-rate periods than multiples decline. And multiples don't always decline when rates rise, anyway; sometimes emotion overrides cash flow discounting mechanics. Investors should lighten up on Treasury allocations, while keeping the exposures they do hold at below-benchmark duration. They should not flee equities, however. Rates have not yet risen enough to cool off the economy in any material way, and we judge that they won't until somewhere around a 3.75% 10-year Treasury yield.2 Tight supplies in labor and goods markets will eventually stoke realized inflation and provoke the Fed into tightening enough to cut off the rally, but it hasn't happened yet, and it is far too early to de-risk portfolios on account of interest rates. Doug Peta, Senior Vice President U.S. Investment Strategy dougp@bcaresearch.com 1 An unusually large drop in rates may well be associated with economic distress, but default-adjusted bond payment streams are much less variable than near- and intermediate-term earnings estimates. 2 Based on the evolution of the Congressional Budget Office's longer-run estimates of real potential GDP growth, and the trend in our own model of long-term inflation expectations, it appears as if nominal potential GDP growth will be somewhere in the neighborhood of 3.75-4% next year. This is a much lower estimate than one would get from adding the Fed's 2% inflation target to the current rate of GDP growth, but we need to look past the immediate boost of the stimulus package to get a read on its longer-run effects. As with all of the estimates produced by our models, we look to it for a general guide to the future, not a precise point estimate.
Highlights We review last year's "Three Tantalizing Trades" and offer four additional ones: Trade #1: Long June 2019 Fed funds futures contract/short Dec 2020 Fed funds futures contract Trade #2: Long USD/CNY Trade #3: Short AUD/CAD Trade #4: Long EM stocks with near-term downside put protection Feature A Review Of Last Year's "Three Tantalizing Trades" I had the pleasure of speaking at BCA's last Annual Investment Conference on September 25th, 2017, where I presented the following three trade ideas (Chart 1): 1. Short December 2018 Fed funds futures We closed this trade for a profit of 70 basis points. Had we held on, it would be up 92 basis points as of the time of this writing. 2. Long global industrial equities/short utilities We closed this trade on February 1st for a gain of 12%, as downside risks to global growth began to mount. This proved to be a timely decision, as the trade would be up only 6.1% had we kept it on. We would not re-enter this trade at present. 3. Short 20-year JGBs/long 5-year JGBs This trade struggled for much of 2018 but sprung back to life in August. It is up 0.6% since we initiated it. We still like the trade over the long haul. Investors are grossly underestimating the risk that Japanese inflation will move materially higher as an aging population creates a shortage of workers and a concomitant decline in the national savings rate. We also think the government will try to egg on any acceleration in consumer prices in order to inflate away its debt burden. In the near term, however, the trade could struggle if a combination of weaker EM growth and an increase in the value of the trade-weighted yen cause inflation expectations to decline. Four Additional Trades Trade #1: Long June 2019 Fed funds futures contract/short December 2020 Fed funds futures contract Investors expect U.S. short-term rates to rise to 2.38% by the end of 2018 and 2.85% by the end of 2019. The 47 basis points in tightening priced in for next year is less than the 75 basis points in hikes implied by the Fed dots. Investors appear to have bought into Larry Summers' secular stagnation thesis. They are convinced that short rates will not be able to rise above 3% without triggering a recession (Chart 2). Chart 1Revisiting Last Year's Three Tantalizing Trades
Revisiting Last Year's Three Tantalizing Trades
Revisiting Last Year's Three Tantalizing Trades
Chart 2Markets Expect No Fed Hikes Beyond Next Year
Four Tantalizing Trades
Four Tantalizing Trades
Regardless of what one thinks of Summers' thesis, it must be acknowledged that it is a theory about the long-term drivers of the neutral rate of interest. Over a shorter-term cyclical horizon, many factors can influence the neutral rate. Critically, most of these factors are pushing it higher: Fiscal policy is extremely stimulative. The IMF estimates that the U.S. cyclically-adjusted budget deficit will reach 6.8% of GDP in 2019 compared to 3.6% of GDP in 2015. In contrast, the euro area is projected to run a deficit of only 0.8% of GDP next year, little changed from a deficit of 0.9% it ran in 2015 (Chart 3). The relatively more expansionary nature of U.S. fiscal policy is one key reason why the Fed can raise rates while the ECB cannot. Credit growth has picked up. After a prolonged deleveraging cycle, private-sector nonfinancial debt is rising faster than GDP (Chart 4). The recent easing in The Conference Board's Leading Credit Index suggests that this trend will continue (Chart 5). Wage growth is accelerating. Average hourly earnings surprised on the upside in August, with the year-over-year change rising to a cycle high of 2.9%. This followed a stronger reading in the Employment Cost Index in the second quarter. A simple correlation with the quits rate suggests that there is plenty of upside for wage growth (Chart 6). Faster wage growth will put more money into workers pockets who will then spend it. The savings rate has scope to fall. The personal savings rate currently stands at 6.7%, more than two percentage points higher than what one would expect based on the current ratio of household net worth-to-disposable income (Chart 7). If the savings rate were to fall by two points over the next two years, it would add 1.5% of GDP to aggregate demand. Chart 3U.S. Fiscal Policy Is More Expansionary Than The Euro Area
U.S. Fiscal Policy Is More Expansionary Than The Euro Area
U.S. Fiscal Policy Is More Expansionary Than The Euro Area
Chart 4U.S. Private-Sector Nonfinancial Debt Is Rising At Close To Its Historic Trend
U.S. Private-Sector Nonfinancial Debt Is Rising At Close To Its Historic Trend
U.S. Private-Sector Nonfinancial Debt Is Rising At Close To Its Historic Trend
Chart 5U.S. Credit Growth Will Remain Strong
U.S. Credit Growth Will Remain Strong
U.S. Credit Growth Will Remain Strong
Chart 6Quits Rate Is Signaling That There Is Upside For Wage Growth
Quits Rate Is Signaling That There Is Upside For Wage Growth
Quits Rate Is Signaling That There Is Upside For Wage Growth
Chart 7The Personal Savings Rate Has Room To Fall
Four Tantalizing Trades
Four Tantalizing Trades
A back-of-the-envelope calculation suggests that these cyclical factors will permit the Fed to raise rates to 5% by 2020, almost double what the market is discounting.1 A more hawkish-than-expected Fed will bid up the value of the greenback. A stronger dollar, in turn, will undermine emerging markets, which have seen foreign-currency debts balloon over the past six years (Chart 8). The deflationary effects of a stronger dollar and falling commodity prices could temporarily cause investors to price out some hikes over the next few quarters. With that in mind, we recommend shorting the December 2020 Fed funds futures contract, while going long the June 2019 contract. The first leg of the trade captures our expectation that the market will revise up its estimate the terminal rate, while the second leg captures near-term risks to global growth. The gap between the two contracts has widened over the past few days as we have prepared this report, but at 21 basis points, it has plenty of room to increase further (Chart 9). Chart 8EM Dollar Debt Is High
EM Dollar Debt Is High
EM Dollar Debt Is High
Chart 9U.S. Rate Expectations Are Too Low Beyond Mid-2019
U.S. Rate Expectations Are Too Low Beyond Mid-2019
U.S. Rate Expectations Are Too Low Beyond Mid-2019
Trade #2: Long USD/CNY China's economy is slowing, which has prompted the government to inject liquidity into the financial system. The spread in 1-year swap rates between the U.S. and China has fallen from about 3% earlier this year to 0.6% at present, taking the yuan down with it (Chart 10). It is doubtful that China will be willing to match - let alone exceed - U.S. rate hikes. This suggests that USD/CNY will appreciate. China's real trade-weighted exchange rate has weakened during the past four months, but is up 25% over the past decade (Chart 11). U.S. tariffs on $250 billion (and counting) of Chinese imports threaten to erode export competitiveness, making a further devaluation necessary. Chart 10USD/CNY Has Tracked China-U.S. Interest Rate Differentials
USD/CNY Has Tracked China-U.S. Interest Rate Differentials
USD/CNY Has Tracked China-U.S. Interest Rate Differentials
Chart 11The RMB Is Still Quite Strong
The RMB Is Still Quite Strong
The RMB Is Still Quite Strong
President Trump will oppose a weaker yuan. However, just as China's actions earlier this year to strengthen its currency did not prevent the U.S. from imposing tariffs, it is doubtful that efforts by the Chinese authorities to talk up the yuan would appease Trump. Besides, China needs a weaker currency. The Chinese economy produces too much and spends too little. The result is excess savings, epitomized most clearly in a national savings rate of 46%. As a matter of arithmetic, national savings need to be transformed either into domestic investment or exported abroad via a current account surplus. China has concentrated on the former strategy over the past decade. The problem is that this approach has run into diminishing returns. Chart 12 shows that the capital stock has risen dramatically as a share of GDP. As my colleague Jonathan LaBerge has documented, the rate of return on assets among Chinese state-owned companies, which have been the main driver of rising corporate leverage, has fallen below their borrowing costs (Chart 13).2 Chart 12China's Capital Stock Has Grown Alongside Rising Debt Levels
China's Capital Stock Has Grown Alongside Rising Debt Levels
China's Capital Stock Has Grown Alongside Rising Debt Levels
Chart 13China: Rate Of Return On Assets Below Borrowing Costs For State-Owned Companies
China: Rate Of Return On Assets Below Borrowing Costs For State-Owned Companies
China: Rate Of Return On Assets Below Borrowing Costs For State-Owned Companies
Now that the economy is awash in excess capacity, the authorities will need to steer more excess production abroad. This will require a larger current account surplus which, in turn, will necessitate a relatively cheap currency. The dollar is currently working off overbought technical conditions, a risk we flagged in our August 31st report.3 That process should be complete over the next few weeks. Meanwhile, hopes of a massive Chinese stimulus focused on fiscal/credit easing will fade. The combination of these two forces will push up USD/CNY above the psychologically-critical 7 handle by the end of the year. Trade #3: Short AUD/CAD A weaker yuan will raise raw material costs to Chinese firms. This will hurt commodity prices. Industrial metals are much more vulnerable to slower Chinese growth than oil. Chart 14 shows that China consumes close to half of all the copper, nickel, aluminum, zinc, and iron ore produced in the world, compared to only 15% of oil output. Our expectation that developed economy growth will hold up better than EM growth over the next few quarters implies that oil will outperform industrial metals. Oil is also supported by a tighter supply backdrop, particularly given the downside risks to Iranian and Venezuelan crude exports. A bet on oil over metals is a bet on DM over EM growth in general, and the Canadian dollar over the Australian dollar specifically (Chart 15). Canada exports more oil than metals, while Australian exports are dominated by ores and metals. In terms of valuations, the Canadian dollar is still somewhat cheap relative to the Aussie dollar based on our FX team's long-term valuation model (Chart 16). Chart 14China Is A More Dominant Consumer Of Metals Than Oil
China Is A More Dominant Consumer Of Metals Than Oil
China Is A More Dominant Consumer Of Metals Than Oil
Chart 15Oil Over Metals = CAD Over AUD
Oil Over Metals = CAD Over AUD
Oil Over Metals = CAD Over AUD
Chart 16Canadian Dollar Still Somewhat Cheap Versus The Aussie Dollar
Canadian Dollar Still Somewhat Cheap Versus The Aussie Dollar
Canadian Dollar Still Somewhat Cheap Versus The Aussie Dollar
The loonie has been weighed down by ongoing fears that Canada will be left out of a renegotiated NAFTA. However, our geopolitical strategists believe that the Trump administration is trying to focus more on China, against whom the case for unfair trade practices is far easier to make. The U.S. has already negotiated a trade deal with Mexico and an agreement with Canada is more likely than not. If a new deal is struck, the Canadian dollar will rally. We recommended going short AUD/CAD on June 28. The trade is up 3.4%, carry-adjusted, since then. Stick with it. Trade #4: Long EM stocks with near-term downside put protection It is too early to call a bottom in EM assets. Valuations have not yet reached washed-out levels (Chart 17). Bottom fishers still abound, as evidenced by the fact that the number of shares outstanding in the MSCI iShares Turkish ETF has almost tripled since early April (Chart 18). However, at some point - probably in the first half of next year - investors will liquidate their remaining bullish EM bets. During the 1990s, this capitulation point occurred shortly after the collapse of Long-Term Capital Management in September 1998. EM equities fell by 26% between April 21, 1998 and June 15, 1998. After a half-hearted attempt at a rally, EM stocks tumbled again in July, falling by 35% between July 17 and September 10. The second leg of the EM selloff brought down the S&P 500 by 22%. Thanks to a series of well-telegraphed Fed rate cuts, global markets stabilized on October 8th (Chart 19). The S&P 500 surged by 68% over the next 18 months. The MSCI EM index more than doubled in dollar terms over this period. EM stocks outperformed U.S. equities by a whopping 71% between February 1999 and February 2000. Europe also outperformed the U.S. starting in mid-1999. Value stocks, which had lagged growth stocks over the prior six years, also finally gained the upper hand. Chart 17EM Assets: Valuations Not Yet At Washed Out Levels
EM Assets: Valuations Not Yet At Washed Out Levels
EM Assets: Valuations Not Yet At Washed Out Levels
Chart 18EM Bottom Fishers Still Abound
EM Bottom Fishers Still Abound
EM Bottom Fishers Still Abound
Chart 19The ''Great Equity Rotation'' Is Coming: A Roadmap From The 1990s
The ''Great Equity Rotation'' Is Coming: A Roadmap From The 1990s
The ''Great Equity Rotation'' Is Coming: A Roadmap From The 1990s
The "Great Equity Rotation" is coming. All the trades that have suffered lately - overweight EM, long Europe/short U.S., long cyclicals/short defensives, long value/short growth - will get their day in the sun. Investors can prepare for this inflection point by scaling into EM equities today, but guarding against near-term downside risk by buying puts. With that in mind, we are going long the iShares MSCI Emerging Market ETF (EEM), while purchasing March 15, 2019 out-of-the-money puts with a strike price of $41. Peter Berezin, Chief Global Strategist Global Investment Strategy peterb@bcaresearch.com 1 Depending on which specification of the Taylor rule one uses, a one percent of GDP increase in aggregate demand will increase the neutral rate of interest by half a point (John Taylor's original specification) or by a full point (Janet Yellen's preferred specification). Fiscal policy is currently about 3% of GDP too simulative compared to a baseline where government debt-to-GDP is stable over time. Assuming a fiscal multiplier of 0.5, fiscal policy is thus boosting aggregate demand by 1.5% of GDP. Nonfinancial private credit has increased by an average of 1.5 percentage points of GDP per year since 2016. Assuming that every additional one dollar of credit increases aggregate demand by 50 cents, the revival in credit growth is raising aggregate demand by 0.75% of GDP, compared to a baseline where credit-to-GDP is flat. The labor share of income has increased by 1.25% of GDP from its lows in 2015. Assuming that every one dollar shift in income from capital to labor boosts overall spending on net by 20 cents, this would have raised aggregate demand by 0.25% of GDP. Lastly, if the savings rate falls by two points over the next two years, this would raise aggregate demand by 1.5% of GDP. Taken together, these factors are boosting the neutral rate by anywhere from 2% (Taylor's specification) to 4% (Yellen's specification). This is obviously a lot, and easily overwhelms other factors such as a stronger dollar that may be weighing on the neutral rate. 2 Please see China Investment Strategy Special Report, "Chinese Policymakers: Facing A Trade-Off Between Growth And Leveraging," dated August 29, 2018. 3 Please see Global Investment Strategy Weekly Report, "The Dollar And Global Growth: Are The Tables About To Turn?" dated August 31, 2018. Strategy & Market Trends Tactical Trades Strategic Recommendations Closed Trades
Highlights Prediction 1: A major financial downturn will trigger the next major economic downturn, and not the other way round. Prediction 2: The straw that will break the back of a fragile financial system will be the global long bond yield rising by 60 bps within a short space of time. But for those who can fine tune, the global long bond yield must rise a further 30-50 bps before reaching the tipping point for the global risk-asset edifice. Take short-term profits in the overweight position in 30-year government bonds. Take short-term profits in the underweight position in basic materials. Take short-term profits in the underweight positions in Italy (MIB) and Spain (IBEX) and overweight position in Denmark (OMX). Feature The twenty-first century has witnessed three major downturns: the first started in 2000; the second started in 2007 culminating in the Lehman crisis a year later; and the third started in 2011 (Chart of the Week). Today, we are going to stick our necks out and make two predictions about the century's fourth major downturn. Chart of the WeekThree Episodes When Equities Underperformed Bonds By 20 Percent Or More
Three Episodes When Equities Underperformed Bonds By 20 Percent Or More
Three Episodes When Equities Underperformed Bonds By 20 Percent Or More
A major financial downturn will trigger the fourth major economic downturn. The straw that will break the back of a fragile financial system will be the global long bond yield rising by 60 bps within a short space of time. Where The Consensus Is Very Wrong As investment strategists, our primary focus should be the financial markets rather than the economy. On this basis, we define a major downturn in terms of the markets: an episode in which equities underperform bonds by more than 20 percent over a period of more than six months.1 All the same, our market based definition of a major downturn perfectly captures the three occasions that the European economy went into recession or stagnation (Chart I-2). Does this mean that the economic downturns triggered the financial market downturns? No, quite the reverse. The onset of the three major financial downturns clearly preceded the onset of the three major economic downturns. Chart I-2Three Episodes When The Euro Area Economy ##br##Contracted Or Stagnated
Three Episodes When The Euro Area Economy Contracted Or Stagnated
Three Episodes When The Euro Area Economy Contracted Or Stagnated
On reflection, this is hardly surprising. The twenty-first century's major economic downturns have all resulted from financial market distortions and fragilities: the bubble valuations of the technology, media and telecom sectors in 2000 (Chart I-3); the mispricing of U.S. mortgages and credit in 2007 (Chart I-4); and the mispricing of euro area sovereign credit risk in 2011 (Chart I-5). Therefore, it makes perfect sense that the downturns in financial markets should precede the downturns in the economy, even when both are measured in real time. Chart I-3The Major Downturns Stemmed From##br## Financial Market Distortions: The Dot Com ##br##Bubble In 1999/2000...
The Major Downturns Stemmed From Financial Market Distortions: The Dot Com Bubble In 1999/2000...
The Major Downturns Stemmed From Financial Market Distortions: The Dot Com Bubble In 1999/2000...
Chart I-4...The Mispricing Of U.S. ##br##Mortgages And Credit##br## In 2007/2008...
...The Mispricing Of U.S. Mortgages And Credit In 2007/2008...
...The Mispricing Of U.S. Mortgages And Credit In 2007/2008...
Chart I-5...And The Mispricing Of Euro Area ##br##Sovereign Credit Risk##br## In 2010/2011
...And The Mispricing Of Euro Area Sovereign Credit Risk In 2010/2011
...And The Mispricing Of Euro Area Sovereign Credit Risk In 2010/2011
Today, the consensus overwhelmingly believes that an economic downturn will cause the next major downturn in financial markets. But history has taught us time and time again that the causality is much more likely to run the other way. Why not learn the lesson? So here's our first prediction: a major financial downturn will trigger the fourth major economic downturn, and not the other way round. This prediction raises some obvious questions: what could be the major fragility in financial markets, and what could fracture it? A Sharp Rise In Bond Yields Triggered The Last Three Major Downturns Look carefully at the financial market downturns that started in 2000, 2007 and 2011, and you will see another striking similarity. In each episode, the global long bond yield rose by 60 bps or more in the months that preceded the onset of the financial market downturn: April 1999 through January 2000 (Chart I-6); March through July 2007 (Chart I-7); and October 2010 through April 2011 (Chart I-8). This strongly suggests that the spike in the bond yield was the trigger for the subsequent major downturn in financial markets. Chart I-6A Sharply Rising Bond Yield Triggered ##br##The Major Downturn Of 2000
A Sharply Rising Bond Yield Triggered The Major Downturn Of 2000
A Sharply Rising Bond Yield Triggered The Major Downturn Of 2000
Chart I-7A Sharply Rising Bond Yield Triggered##br## The Major Downturn Of 2007 And 2008
A Sharply Rising Bond Yield Triggered The Major Downturn Of 2007 And 2008
A Sharply Rising Bond Yield Triggered The Major Downturn Of 2007 And 2008
Chart I-8A Sharply Rising Bond Yield Triggered ##br##The Major Downturn Of 2011
A Sharply Rising Bond Yield Triggered The Major Downturn Of 2011
A Sharply Rising Bond Yield Triggered The Major Downturn Of 2011
A sharp rise in bond yields is usually the straw that breaks the back of financial market fragilities, in (at least) one of three ways: it flushes out those actors that are reliant on cheap liquidity; it pressures interest rate sensitive sectors in the economy; and it weighs on the valuations of other assets such as equities, especially if those valuations are already extremely elevated. Which segues us neatly to the current fragility in the global financial system. As we wrote last week, the post-2008 global experiment with quantitative easing, and zero and negative interest rate policy has boosted the valuations of all risk-assets across all geographies across all asset-classes. And the total value of those global risk-assets is $400 trillion, equal to about five times the size of the global economy.2 We have also consistently highlighted that not only do the rich valuations of $400 trillion of risk-assets depend (inversely) on bond yields, but that this relationship is an exponential function.3 So here's our second prediction: the straw that will break the back of a fragile financial system will be the global long bond yield rising by 60 bps within a short space of time - just as it did in 2000, 2007 and 2011. But Bond Yields Haven't Gone Up Far Enough... Yet Now comes some bullish news, at least for those who can play shorter-term moves in the market. The global long bond yield has been trapped within a tight channel and is only 20 bps up from its recent low in April (Chart I-9). Therefore, it has the scope to rise a further 30-50 bps before reaching the tipping point for the global risk-asset edifice and unleashing a 'risk-off' phase. Chart I-9In 2018, The Bond Yield Has Not Risen Sharply...Yet
In 2018, The Bond Yield Has Not Risen Sharply...Yet
In 2018, The Bond Yield Has Not Risen Sharply...Yet
For those who want to fine tune their investment strategy, the journey up to that turning point would define a phase when many of this year's cyclical sector underperformances would end or even switch to a phase of modest outperformances. Bear in mind that the cyclical sector underperformances this year have been substantial: European banks have underperformed healthcare by 35 percent; global basic materials have underperformed the market by 10 percent; emerging market equities have underperformed developed market equities by 15 percent. So it is prudent to take some short-term profits, especially as these trends are likely to end, at least in the near term. Hence, three weeks ago we closed our underweight banks versus healthcare position, booking a tidy profit of 23 percent. Today, we are closing our underweight position in basic materials versus the market, booking a profit of 6 percent. In a similar vein, we are taking the modest profits in our overweight position in 30-year government bonds. Sector allocation has unavoidable implications for stock market allocation - because the mainstream stock market indexes all have dominant sector skews which determine their relative performances (Chart I-10). Chart I-10Italy Vs. Denmark = Banks Vs. Healthcare
Italy Vs. Denmark = Banks Vs. Healthcare
Italy Vs. Denmark = Banks Vs. Healthcare
On this basis, closing our underweight banks versus healthcare removes the justification for being underweight bank-dominant Italy (MIB) and Spain (IBEX) and the justification for being overweight healthcare-dominant Denmark (OMX). These three positions now move to neutral. While we consider our next shift, our European stock market allocation is temporarily reduced to just five positions. Overweight: France, Ireland, Switzerland. Underweight: Sweden, Norway. Finally, just to say that there will be no report next week as I will be attending our annual Investment Conference which is in Toronto this year. I look forward to seeing some of you there. Dhaval Joshi, Senior Vice President Chief European Investment Strategist dhaval@bcaresearch.com 1 Based on the relative performance of the MSCI All Country World Index versus the JP Morgan Global Government Bond Index, both in local currency terms. 2 Please see the European Investment Strategy Weekly Report 'Trapped: Have Equities Trapped Bonds?' September 13 2018 available at eis.bcaresearch.com. 3 Please see the European Investment Strategy Weekly Report 'The Rule Of 4 For Equities And Bonds' August 2 2018 available at eis.bcaresearch.com. Fractal Trading Model* This week, we note that the very strong recent outperformance of U.S. telecoms versus U.S. autos is technically extended, reaching a fractal dimension that has previously signalled the start of a countertrend move. Hence, the recommended trade is short U.S. telecoms, long U.S. autos. Set a profit target of 9% with a symmetrical stop-loss. For any investment, excessive trend following and groupthink can reach a natural point of instability, at which point the established trend is highly likely to break down with or without an external catalyst. An early warning sign is the investment's fractal dimension approaching its natural lower bound. Encouragingly, this trigger has consistently identified countertrend moves of various magnitudes across all asset classes. Chart I-11
U.S. Telecom VS. Autos
U.S. Telecom VS. Autos
The post-June 9, 2016 fractal trading model rules are: When the fractal dimension approaches the lower limit after an investment has been in an established trend it is a potential trigger for a liquidity-triggered trend reversal. Therefore, open a countertrend position. The profit target is a one-third reversal of the preceding 13-week move. Apply a symmetrical stop-loss. Close the position at the profit target or stop-loss. Otherwise close the position after 13 weeks. Use the position size multiple to control risk. The position size will be smaller for more risky positions. * For more details please see the European Investment Strategy Special Report "Fractals, Liquidity & A Trading Model," dated December 11, 2014, available at eis.bcaresearch.com Fractal Trading Model Recommendations Equities Bond & Interest Rates Currency & Other Positions Closed Fractal Trades Trades Closed Trades Asset Performance Currency & Bond Equity Sector Country Equity Indicators Bond Yields Chart II-1Indicators To Watch - Bond Yields
Indicators To Watch - Bond Yields
Indicators To Watch - Bond Yields
Chart II-2Indicators To Watch - Bond Yields
Indicators To Watch - Bond Yields
Indicators To Watch - Bond Yields
Chart II-3Indicators To Watch - Bond Yields
Indicators To Watch - Bond Yields
Indicators To Watch - Bond Yields
Chart II-4Indicators To Watch - Bond Yields
Indicators To Watch - Bond Yields
Indicators To Watch - Bond Yields
Interest Rate Chart II-5Indicators To Watch - Interest Rate Expectations
Indicators To Watch - Interest Rate Expectations
Indicators To Watch - Interest Rate Expectations
Chart II-6Indicators To Watch - Interest Rate Expectations
Indicators To Watch - Interest Rate Expectations
Indicators To Watch - Interest Rate Expectations
Chart II-7Indicators To Watch - Interest Rate Expectations
Indicators To Watch - Interest Rate Expectations
Indicators To Watch - Interest Rate Expectations
Chart II-8Indicators To Watch - Interest Rate Expectations
Indicators To Watch - Interest Rate Expectations
Indicators To Watch - Interest Rate Expectations
Highlights In this Weekly Report, we present our semi-annual chartbook of the BCA Central Bank Monitors. The message now conveyed by the Monitors is that divergences between the cyclical pressures faced by the individual central banks are growing larger. This is occurring within some countries, where the growth and inflation indicators are trending in opposite directions. This is also visible across countries, with not every Monitor calling for rate hikes - a significant shift from the coordinated backdrop seen in 2017 (Chart of the Week). Chart of the WeekFrom Convergence To Divergence In The BCA Central Bank Monitors
From Convergence To Divergence In the BCA Central Bank Monitors
From Convergence To Divergence In the BCA Central Bank Monitors
The combined message from the Monitors is that the slower pace of global growth seen in 2018 has not been enough put a serious dent in inflation pressures stemming from a dearth of spare capacity in most major countries. Perhaps that changes if a full-blown U.S.-China trade war develops, or if the tensions in emerging markets spill over more broadly into global financial conditions, but that remains to be seen. Add it all up, and a below-benchmark stance on overall global duration exposure remains appropriate. Feature An Overview Of The BCA Central Bank Monitors Chart 2CB Monitor Divergence = Bond Yield Divergence
CB Monitor Divergence = Bond Yield Divergence
CB Monitor Divergence = Bond Yield Divergence
The BCA Central Bank Monitors are composite indicators designed to measure the cyclical growth and inflation pressures that can influence future monetary policy decisions. The economic data series used to construct the Monitors are not the same for every country, but the list of indicators generally measure the same things (i.e. manufacturing cycles, domestic demand strength, commodity prices, labor market conditions, exchange rates, etc). The data series are standardized and combined to form the Monitors. Readings above the zero line for each Monitor indicate pressures for central banks to raise interest rates, and vice versa. Through the nexus between growth, inflation, and market expectations of future interest rate changes, the Monitors do exhibit broad correlations to government bond yields in the Developed Markets (Chart 2). Our current recommended country allocation for global government bonds reflects the trends seen in the Central Bank Monitors - underweighting countries were the Monitors are most elevated (the U.S., Canada) in favor of regions where the Monitors are lower (Australia, Japan, euro area, New Zealand). In each BCA Central Bank Monitor Chartbook, we include a new chart for each country that we have not shown previously. In this edition, we show the Monitors plotted against the relative returns for each country versus the overall Bloomberg Barclays Global Treasury index (shown inversely in the charts so that a rising line means underperformance versus the benchmark index). Fed Monitor: Still On A Gradual Rate Hike Path Our Fed Monitor remains in the "tight money required" zone, signalling that the cyclical backdrop justifies additional Fed rate hikes (Chart 3A). Resilient U.S. growth, a dearth of spare capacity and an acceleration of both wage growth and core inflation are all consistent with a U.S. economy starting to overheat and requiring tighter monetary policy (Chart 3B). Chart 3AU.S.: Fed Monitor
U.S.: Fed Monitor
U.S.: Fed Monitor
Chart 3BU.S. Inflation On The Rise
U.S. Inflation On The Rise
U.S. Inflation On The Rise
The growth and inflation components of the Fed Monitor have both accelerated since our last Central Bank Monitor Chartbook was published back in April. Most notably, the inflation component has blasted through the zero line to the highest level since 2008 (Chart 3C). The financial conditions component has retreated from very elevated (i.e. growth-supportive) levels, mostly due to the stronger U.S. dollar but also because of wider corporate credit spreads seen since the start of 2018. Importantly, the financial conditions component has not tightened enough to offset the impact on the Monitor from faster growth and inflation. Chart 3CAll Fed Monitor Components Now Above Zero
All Fed Monitor Components Now Above Zero
All Fed Monitor Components Now Above Zero
Recent comments from senior Fed officials (Chair Jay Powell and Governor Lael Brainard) have indicated that the Fed is less confident in its own estimates of the full-employment NAIRU or the appropriate neutral level of the funds rate. Our read on this is that the Fed will instead continue to raise the funds rate at a gradual 25bp per quarter pace until there are signs that U.S. monetary policy has become tight (i.e. an inverted yield curve, wider credit spreads, softer U.S. economic data). Until then, the message sent by the Fed Monitor is to remain underweight U.S. Treasuries with below-benchmark duration, as market pricing of expectations for both the funds rate and inflation remain too low (Chart 3D). Chart 3DU.S. Treasury Underperformance Will Continue - Stay Underweight
U.S. Treasury Underperformance Will Continue - Stay Underweight
U.S. Treasury Underperformance Will Continue - Stay Underweight
BoE Monitor: Brexit Uncertainty Trumps Inflation Pressures The BoE Monitor remains in the "tighter money required" zone as it has since late 2015 (Chart 4A). Despite that persistent signal, the BoE has kept monetary policy at highly accommodative levels, only raising the base rate 50bps over the past year. The BoE Monetary Policy Committee remains torn between signs that inflation risks are tilted to the upside and the downside risks to U.K. growth from an uncertain Brexit outcome. The U.K. unemployment rate is well below NAIRU with an output gap that is now estimated to be closed (Chart 4B). Yet realized inflation has peaked, with core inflation drifting back below 2%. Wages are finally starting to grow in real terms, which the BoE cites as an important factor underpinning consumer spending, but the pace remains modest. Chart 4AU.K.: BoE Monitor
U.K.: BoE Monitor
U.K.: BoE Monitor
Chart 4BNo Spare Capacity, Yet Has Inflation Peaked?
No Spare Capacity, Yet Has Inflation Peaked?
No Spare Capacity, Yet Has Inflation Peaked?
Looking at the breakdown of our BoE Monitor, both the growth and inflation sub-components of the indicator have recently reaccelerated (Chart 4C). Yet U.K. leading economic indicators continue to decline and dampened business confidence measures reflect the heightened uncertainty over the future relationship between the U.K. and the European Union. Chart 4CBoth Growth & Inflation Components Are Boosting The BoE Monitor
Both Growth & Inflation Components Are Boosting The BoE Monitor
Both Growth & Inflation Components Are Boosting The BoE Monitor
The performance of U.K. Gilts has diverged from the Monitor since the 2016 Brexit vote (Chart 4D), as the BoE has been more worried about Brexit than inflation and has stayed accommodative. Stay overweight U.K. Gilts within global government bond portfolios, even with the more bearish signal implied by our BoE Monitor, given the weakening trend in leading economic indicators and persistent Brexit uncertainty. Chart 4DBrexit Uncertainty Preventing More BoE Hikes - Stay Overweight Gilts
Brexit Uncertainty Preventing More BoE Hikes - Stay Overweight Gilts
Brexit Uncertainty Preventing More BoE Hikes - Stay Overweight Gilts
ECB Monitor: No Pressure To Hike Rates Quickly Post-QE Our European Central Bank (ECB) Monitor has fallen sharply since we last published this Chartbook back in April, and it now sits below the zero line (Chart 5A). The growth deceleration in the first half of the year from the rapid pace seen in 2017 is the main reason for this move, as inflation pressures have not subsided (Chart 5B). Chart 5AEuro Area: ECB Monitor
Euro Area: ECB Monitor
Euro Area: ECB Monitor
Chart 5BEuro Area At Full Capacity
Euro Area At Full Capacity
Euro Area At Full Capacity
ECB President Mario Draghi noted last week that the plan remains in place to end the net new buying phase of the ECB's Asset Purchase Program at the end of 2018. Policymakers' have grown more confident that their inflation forecasts will be met as most measures of euro area wage growth (and headline inflation) have accelerated to 2% over the past year. It remains to be seen if those expectations are too optimistic, as the growth component of our ECB Monitor remains well below the zero line, while the inflation component is no longer rising (Chart 5C). Chart 5CGrowth Component Dragging Down The ECB Monitor
Growth Component Dragging Down The ECB Monitor
Growth Component Dragging Down The ECB Monitor
For now, we recommend a neutral stance on core euro area government bonds with an underweight posture on Peripheral sovereign debt as a way to manage these conflicting trends. The overall performance of euro area bonds versus global benchmarks has followed the pace of the ECB's bond-buying since 2015, and not the pressures suggested by our ECB Monitor (Chart 5D), suggesting a bearish stance as the bond buying ends. Yet from a more bullish perspective, the mixed message on growth and lack of immediate pressures on core inflation (still at 1%) imply that the ECB will not deviate from its current dovish forward guidance of no interest rate hikes until at least September 2019. Chart 5DECB Will Not Hike Rates Quickly After QE Ends - Stay Neutral Core European Bonds
ECB Will Not Hike Rates Quickly After QE Ends - Stay Neutral Core European Bonds
ECB Will Not Hike Rates Quickly After QE Ends - Stay Neutral Core European Bonds
BoJ Monitor: Too Soon To Consider Policy Changes Our Bank of Japan (BoJ) Monitor has stayed just barely in the "tighter money required" zone since last October, due mostly to growing inflation pressures (Chart 6A). Yet with the Japanese labor market now as tight as it has been in decades, headline and core CPI inflation are only at 0.9% and 0.3% respectively, well below the BoJ's 2% target (Chart 6B). Chart 6AJapan: BoJ Monitor
Japan: BoJ Monitor
Japan: BoJ Monitor
Chart 6BInflation Pressures Slowly Building In Japan
Inflation Pressures Slowly Building In Japan
Inflation Pressures Slowly Building In Japan
Japanese firms appear to finally be reacting to the tightness of the labor market, however, as wage growth has accelerated in recent months. The pick-up in wages has helped boost inflation expectations, both of which are part of the inflation component of the BoJ Monitor that is now at the highest level since 2008 (Chart 6C). However, the growth component just rolled over and now sits at the zero line, as the Japanese economy has lost some momentum. Chart 6CInflation Boosting BoJ Monitor
Inflation Boosting BoJ Monitor
Inflation Boosting BoJ Monitor
We continue to recommend an overweight stance on JGBs, based on our view that the BoJ will maintain hyper-easy monetary policy settings - especially compared to the rest of the developed markets - until there is much higher realized inflation in Japan. JGBs have indeed been outperforming over the past year, even with the less dovish signal sent by the BoJ Monitor (Chart 6D). Yet the absolute level of the Monitor remains around zero, suggesting that no policy changes should be expected. That means no upward adjustment of the BoJ's 0% yield target on 10-year JGBs or major further reductions in the annual pace of BoJ JGB buying (even though the central bank is hitting capacity constraints as it now owns close to ½ of all outstanding JGBs). Chart 6DBoJ In No Hurry To Turn Hawkish - Stay Overweight JGBs
BoJ In No Hurry To Turn Hawkish - Stay Overweight JGBs
BoJ In No Hurry To Turn Hawkish - Stay Overweight JGBs
BoC Monitor: Rate Hikes - More To Come The Bank of Canada (BoC) Monitor has stayed in "tighter money required" since the beginning of 2017 and is now well above the zero line (Chart 7A). The BoC has been following our BoC Monitor, hiking rates by a cumulative 100bps since July 2017. Chart 7ACanada: BoC Monitor
Canada: BoC Monitor
Canada: BoC Monitor
Chart 7BAn Overheating Canadian Economy?
An Overheating Canadian Economy?
An Overheating Canadian Economy?
The BoC has been responding to the growing inflation pressure in Canada. There is no evidence that spare economic capacity exists, while realized inflation is near the upper bound of BoC's target range of 1-3% (Chart 7B). There is a growing divergence between the growth and inflation subcomponents of the BoC Monitor, with the latter decelerating over the past several months. That was due to a combination of slowing Chinese import demand and the imposition of trade tariffs on Canada by the Trump administration (Chart 7C). Yet the domestic economy remains in good shape, with the overall indicator from the BoC's Business Outlook Survey at the highest level since 2010. Chart 7CInflation Component Boosting BoC Monitor
Inflation Component Boosting BoC Monitor
Inflation Component Boosting BoC Monitor
We continue to recommend an underweight stance on Canadian government bonds, as the relative performance has broadly followed the path of the BoC Monitor over the past three years (Chart 7D). The BoC tends to follow the policy actions of the Fed with a short lag, thus our bearishness on Canadian government bonds is related to our more hawkish views on the Fed. Yet the surge in Canadian inflation, at a time when the economy has no spare capacity, suggests that there are good domestic reasons to expect more rate hikes from the BoC over the next year than what is currently discounted by markets. Chart 7DBoC Not Done Yet - Stay Underweight Canadian Bonds
BoC Not Done Yet - Stay Underweight Canadian Bonds
BoC Not Done Yet - Stay Underweight Canadian Bonds
RBA Monitor: Easier Policy Needed The Reserve Bank of Australia (RBA) monitor has rapidly fallen below the zero line for the first time since 2016, and now indicates that easier monetary policy is required (Chart 8A). This stands out from the more stable trajectory of the rest of the BCA Central Bank Monitors. Unlike most other developed countries, there is still excess capacity in the Australian economy. Australia's output gap has not closed while the current unemployment rate is just at the OECD's NAIRU estimate of 5.3%. Headline and core inflation are at the low end of the RBA's 2-3% target and struggling to gain much upward momentum (Chart 8B). Chart 8AAustralia: RBA Monitor
Australia: RBA Monitor
Australia: RBA Monitor
Chart 8BMinimal Inflation Pressure In Australia
Minimal Inflation Pressure In Australia
Minimal Inflation Pressure In Australia
While both the growth and inflation components of the RBA Monitor have fallen, the biggest decline has come from the inflation side (Chart 8C). The sluggishness of Australia's economy is due to the slow growth of consumer spending and a big deceleration in exports related to softer Chinese demand. On inflation, excess labor market slack, with an underemployment rate close to 8.5%, is the main factor explaining soft wage growth and overall sluggish inflation. Chart 8CInflation Component Weighing On RBA Monitor
Inflation Component Weighing On RBA Monitor
Inflation Component Weighing On RBA Monitor
Our highest conviction country allocation call this year has been to overweight Australian Government bonds, and we see no need to change that given the bullish signal from our RBA Monitor (Chart 8D). It would likely take a rise in unemployment, a renewed decline in realized inflation or a big external shock for the RBA to actually cut rates as our Monitor suggests, but the signal is still bullish for Australian debt on a relative basis. Chart 8DRBA A Long Way From A Hike - Stay Overweight Australian Government Bonds
RBA A Long Way From A Hike - Stay Overweight Australian Government Bonds
RBA A Long Way From A Hike - Stay Overweight Australian Government Bonds
RBNZ Monitor: Policy On Hold For A While Longer The Reserve Bank of New Zealand (RBNZ) Monitor is currently just above the zero line, indicating that tighter monetary policy is required (although just barely) (Chart 9A). This is consistent with the mixed messages in the New Zealand economic data. For example, there is no spare capacity in the economy according to estimates of the output and employment gaps, yet both headline and core inflation have decelerated to the lower end of the RBNZ's 1-3% target band (Chart 9B). Chart 9ANew Zealand: RBNZ Monitor
New Zealand: RBNZ Monitor
New Zealand: RBNZ Monitor
Chart 9BNo Spare Capacity In NZ, But No Inflation Either
No Spare Capacity In NZ, But No Inflation Either
No Spare Capacity In NZ, But No Inflation Either
Looking at the components of the RBNZ Monitor, the growth factors have continued to plunge whereas the inflation factors have been increasing (from below zero) since the start of 2018 (Chart 9C). New Zealand's economic growth has slowed because of softer consumer spending and weaker housing activity, the latter of which is related to lower net immigration. Yet business confidence is falling, both the manufacturing and services PMIs have also declined, and export growth has cooled thanks to weaker growth from China and Australia. Meanwhile, the uptick in the inflation components has not yet translated into any broader improvement in realized inflation that would cause the RBNZ to take a more hawkish turn. Chart 9CConflicting Trends Within The RBNZ Monitor
Conflicting Trends Within The RBNZ Monitor
Conflicting Trends Within The RBNZ Monitor
We continue to recommend an overweight stance on New Zealand Government Bonds, in line with the bullish signal sent by our RBNZ Monitor (Chart 9D). The RBNZ has already provided forward guidance indicating that the Overnight Cash Rate (OCR) will stay unchanged until 2020, and it will take some time before there is evidence that the recent hook down in inflation is nothing more than a temporary blip. Chart 9DRBNZ To Remain On Hold - Stay Long New Zealand Bonds
RBNZ To Remain On Hold - Stay Long New Zealand Bonds
RBNZ To Remain On Hold - Stay Long New Zealand Bonds
Robert Robis, CFA, Senior Vice President Global Fixed Income Strategy rrobis@bcaresearch.com Ray Park, CFA, Research Analyst ray@bcaresearch.com Recommendations The GFIS Recommended Portfolio Vs. The Custom Benchmark Index
BCA Central Bank Monitor Chartbook: Divergences Opening Up
BCA Central Bank Monitor Chartbook: Divergences Opening Up
Duration Regional Allocation Spread Product Tactical Trades Yields & Returns Global Bond Yields Historical Returns
Highlights The Trump administration's decision to effectively tariff the second round of imports at 25% materially raises the odds of another significant uptick in Chinese financial market volatility. Even if China ramps up its stimulus efforts in response, the lesson of the 2014-2016 episode is that investors are likely to wait for earnings clarity before buying stocks aggressively. Stay neutral China, at best, relative to global stocks, and overweight low-beta sectors within the investable equity universe. We have a contrarian view about Chinese corporate bonds, and recommend holding a long but diversified position over the coming 6-12 months. Feature Chart 1The RMB Is Acting As A "Panic Barometer" ##br##For Domestic Stocks
The RMB Is Acting As A "Panic Barometer" For Domestic Stocks
The RMB Is Acting As A "Panic Barometer" For Domestic Stocks
The Trump administration finally announced its decision this week on the second round of tariffs on Chinese imports, essentially applying a 25% rate. While the rate will initially start at 10%, it will rise to 25% by the end of the year, and the administration has threatened to immediately seek public consultation on tariffs on all remaining imports from China if the country retaliates against the second round (which was announced yesterday). With news reports having suggested that China would reject new trade talks merely if the second round moves forward, the prospect of a breakthrough in negotiations seems dim, at best. We have highlighted in past reports that the RMB has acted as a panic barometer for domestic equities (Chart 1), as evidenced by the recent spike in the correlation between the two. During this period, the percent decline in CNY-USD seems to have closely followed the magnitude of proposed tariffs as a percent of Chinese exports to the U.S., as would be implied in a simple open economy model with flexible exchange rates. Based on this framework, Chart 2 suggests that the RMB may come under considerable further market pressure, even if investors only assume a 10% rate on the third round of tariffs. A break above the psychologically-important level of 7 for USD-CNY appears likely barring a major intervention from the PBOC, suggesting that a meaningful uptick in Chinese financial market volatility is forthcoming. Chart 2USDCNY = 7 Is Likely To Be Breached Barring Strong Action From The PBOC
USDCNY = 7 Is Likely To Be Breached Barring Strong Action From The PBOC
USDCNY = 7 Is Likely To Be Breached Barring Strong Action From The PBOC
Stimulus To The Rescue? Given that Chinese policymakers have signaled their willingness to stimulate in response to a negative external environment, some investors have argued that China is actually about to enter a mini-cycle upswing. For now, two points suggest that this conclusion is premature: A 10% tariff rate on all remaining imports from China would imply close to $90 billion in tariffs collected, once the second round rate rises to 25%. As noted above, a simple equilibrium exchange rate framework would imply material further weakness in the RMB to counter protectionism of this magnitude. Besides heralding a further selloff in Chinese stocks, this could lead to competitive currency devaluation amongst China's largest trading partners, a "beggar-thy-neighbor" policy that tends to exacerbate rather than alleviate shocks to aggregate demand. As we have noted numerous times over the past year, China's old economy was slowing in the lead up to the U.S./China trade war, and it is not yet clear whether the announced stimulus will generate enough "lift" to convince investors that the low in economic activity is behind them. Chart 3 shows that the August rise in adjusted total social financing as a share of GDP was extremely muted, and that there is no sign yet of a pickup in government spending. Even if China ramps up its stimulus efforts in response to this week's decision from the Trump administration, Chart 4 highlights an important point for investors: there was a considerable lag between a policy response and the low in stock prices during the 2014-2016 episode (a lag that may re-occur today). The chart shows that despite an ongoing depreciation in the RMB and a rebound in our BCA leading indicator for the Li Keqiang index, Chinese stock prices continued to decline for several months. This gap was caused by a lagged decline in earnings, and underscores that investors may ignore the current efforts by policymakers to stabilize the economy until clarity on the stability of earnings presents itself. Chart 3No Sign Yet Of##br## Major Stimulus
No Sign Yet Of Major Stimulus
No Sign Yet Of Major Stimulus
Chart 4History Suggests Investors Need Both ##br##Stimulus And Earnings Clarity
History Suggests Investors Need Both Stimulus And Earnings Clarity
History Suggests Investors Need Both Stimulus And Earnings Clarity
And for now, several signs point to potentially material downside risk for earnings: While the now considerably larger shock from U.S. tariffs has yet to impact the Chinese economy, trailing earnings growth has already peaked and has recently fallen below its trend (Chart 5, panel 1). Despite the recent deceleration in trailing earnings growth and the sharp decline in stock prices, analysts' 12-month forward growth estimates remain quite elevated (Chart 5, panel 2). This suggests that forward earnings could be vulnerable to a decline above and beyond what occurs to trailing earnings, as a full 1/3rd of the increase in the former since late-2015 has been due to very significant shift in growth expectations. The rise in trailing earnings over the past few years appears to be stretched, based the trend in profit margins (Chart 6). The chart highlights that 12-month trailing earnings have well surpassed sales since late-2016, causing margins to rise to their highest level on record and raising the risk of a significant mean-reversion in response to a meaningful economic shock. Net earnings revisions have done a good job at predicting inflection points in forward earnings growth over the past decade, and have recently fallen into negative territory (Chart 7). Chart 5Lofty Earnings Growth Expectations ##br##Are A Risk To Stocks
Lofty Earnings Growth Expectations Are A Risk To Stocks
Lofty Earnings Growth Expectations Are A Risk To Stocks
Chart 6The Earnings Recovery Has Been Partly ##br##Reliant On A Margin Expansion
The Earnings Recovery Has Been Partly Reliant On A Margin Expansion
The Earnings Recovery Has Been Partly Reliant On A Margin Expansion
Chart 7Earnings Revisions Herald ##br##Slowing Earnings Momentum
Earnings Revisions Herald Slowing Earnings Momentum
Earnings Revisions Herald Slowing Earnings Momentum
It is true that some of the above-average levels for profit margins and 12-month forward growth expectations can be explained by the substantial rise in the share of the tech sector in the MSCI China index, whose constituents are significantly more profitable than ex-tech stocks, may have better longer-term growth prospects, and may be more immunized from the trade war with the U.S. Still, Chart 8 illustrates the high earnings hurdle rate for tech stocks over the coming year. Bottom-up analysts continue to expect tech stocks to grow their earnings more than 20% over the next 12 months, despite: Chart 8Are Chinese Tech Stocks Going To Be##br## Able To Grow Earnings 20+%?
Are Chinese Tech Stocks Going To Be Able To Grow Earnings 20+%?
Are Chinese Tech Stocks Going To Be Able To Grow Earnings 20+%?
A poor economic outlook that is likely to impact consumer spending (even if households "outperform" the business sector), and The fact that tech sector net earnings revisions have fallen deeply into negative territory (panel 2). How should investors allocate capital within China in the middle of a trade war with the U.S? First, despite the fact that Chinese stocks have already fallen significantly from their early-January high, it is clearly too early to bottom fish either domestic or investable stocks. Stay neutral China, at best, relative to global stocks. Second, investors should certainly favor low-beta sectors within the Chinese equity universe. Currently, our low-beta equity portfolio includes industrials, telecom services health care, utilities, and consumer staples, but we update the portfolio weights at the end of every month. Third, as discussed below, investors should ignore the very bearish narrative towards Chinese corporate bonds, and hold a long but diversified position over the coming 6-12 months. Bottom Line: The Trump administration's decision to effectively tariff the second round of imports at 25% materially raises the odds of another significant uptick in Chinese financial market volatility. Even if China ramps up its stimulus efforts in response, the lesson of the 2014-2016 episode is that investors are likely to wait for earnings clarity before buying stocks aggressively. Stay neutral China, at best, relative to global stocks, and overweight low-beta sectors within the investable equity universe. Chinese Corporate Bonds: A Contrarian Long Our analysis of the earnings risk facing equities suggests that it is probably still too early to buy Chinese stocks, but in our (contrarian) view there is still one pro-cyclical asset that investors should favor: Chinese corporate bonds. Headlines about defaults in China's corporate bond market continue to appear in the financial press, with concerns most recently focused on low recovery rates of defaulted issues.1 We last wrote about Chinese corporate bonds in June,2 and took a contrarian (i.e. optimistic) stance towards the market. In the meantime, our long China onshore corporate bond trade has continued to gain ground, and an analysis of the inferred credit rating of the market actually strengthens our conviction to stay long. One key element of the bearish narrative towards Chinese corporate bonds is the fact that investment-grade issues in the market are trading like junk. Table 1 highlights that this is largely true: the table presents the spread-inferred credit rating of the four major rating categories of the ChinaBond Corporate Bond Index, and shows that AAA bonds are trading on the border of equivalent maturity investment- and speculative-grade bonds in the U.S. Bonds rates AA+/AA/AA- in China are trading between lower-B and high-CAA, which is firmly in speculative-grade territory. However, in our view market participants are making a mistake when they assume that de-facto junk ratings on Chinese corporate bonds will translate into U.S. junk-style default rates on bonds over the coming 6-12 months (or, frankly, beyond). Chart 9 presents an estimate of the market-implied default rate for the four rating categories shown in Table 1, and suggests that investors are pricing in roughly a 1% default rate for AAA-rated corporate bonds and a 4-5% default rate for AA+/AA/AA-. Table 1Chinese Corporate Bonds Are Trading##br## Like Speculative-Grade Issues
Investing In The Middle Of A Trade War
Investing In The Middle Of A Trade War
Chart 9Allowing Market-Implied Default Rates##br## To Occur Would Be A Huge Policy Error
Allowing Market-Implied Default Rates To Occur Would Be A Huge Policy Error
Allowing Market-Implied Default Rates To Occur Would Be A Huge Policy Error
There are two important factors to consider when gauging the validity of these expectations: Based on Moody's most recent Annual Default Study, the market's current expectations for Chinese corporate bond defaults are actually above the average historical one-year default rates for their inferred credit ratings. Average default rates almost never actually occur over a given 12-month period. Chart 10 highlights that default rates in the U.S. have a binary distribution that is almost entirely determined by whether the economy is in recession (not just slowing down). The late-1980s and the post-2015 environment have been exceptions to this rule, which in large part can be explained by industry-specific events (namely, a surge of energy-sector defaults due to a collapse in the price of oil). But the key point is that investors are likely to overestimate the actual default rate over a given 12 month period when assuming an average historical rate, unless the economy shifts from an expansion to an outright recession over the period. From our perspective, the combination of the market's default expectations and the fact that China is easing suggests an outright long position in Chinese corporate bonds is warranted over the coming year. In our judgement, there is simply no way that policymakers can allow default rates on the order of what is being priced in to occur, as it would constitute an enormous policy mistake that would risk destabilizing the financial system at a time when officials are attempting to counter the looming shock to the export sector. In fact, we doubt that China's typical policy of gradualism when liberalizing its economy and financial markets would allow default rates to rise from 0% to 5% over a year in any economic environment, particularly the current one. As a final point, Chart 11 highlights why a significant rise in the default rate is required in order for investors to lose money on Chinese corporate bonds. The chart shows the 12-month breakeven spread for the ChinaBond AA- Corporate Bond index, unadjusted for default. The breakeven spread represents the rise in yields that would be required for investors to lose money over a 12-month horizon (i.e. the yield change that exactly erases the income return from the position), assuming no defaults. Chart 10"Average" Default Rates ##br##Do Not Really Occur
"Average" Default Rates Do Not Really Occur
"Average" Default Rates Do Not Really Occur
Chart 11A 2% Rise In Yields From Tighter Policy Is Not##br## Going To Occur Over The Coming Year
A 2% Rise In Yields From Tighter Policy Is Not Going To Occur Over The Coming Year
A 2% Rise In Yields From Tighter Policy Is Not Going To Occur Over The Coming Year
The chart shows that AA- bond yields would have to rise approximately 215 bps over the coming year before investors suffer a negative total return, which would be an enormous rise that has a near-zero probability of occurring due of tighter monetary policy. As such, defaults (or the pricing of default risk) remains the only real credible source of potential capital loss from these bonds over the coming year. Our bet, with high conviction, is that holders of Chinese corporate bonds hold a put option that will prevent this from occurring. Bottom Line: Fade investor concerns about rising defaults, and stay long Chinese corporate bonds over the coming 6-12 months. We acknowledge that idiosyncratic risk is likely to be elevated for this asset class, and we recommend that investors take a diversified, portfolio approach when investing in China's corporate bond market. Jonathan LaBerge, CFA, Vice President Special Reports jonathanl@bcaresearch.com 1 For example, please see "In China, Less Than 20% Defaulted Bonds Have Been Paid Back" by Bloomberg News, August 27, 2018 2 Pease see China Investment Strategy Weekly Report "A Shaky Ladder", dated June 13, 2018, available at cis.bcaresearch.com. Cyclical Investment Stance Equity Sector Recommendations
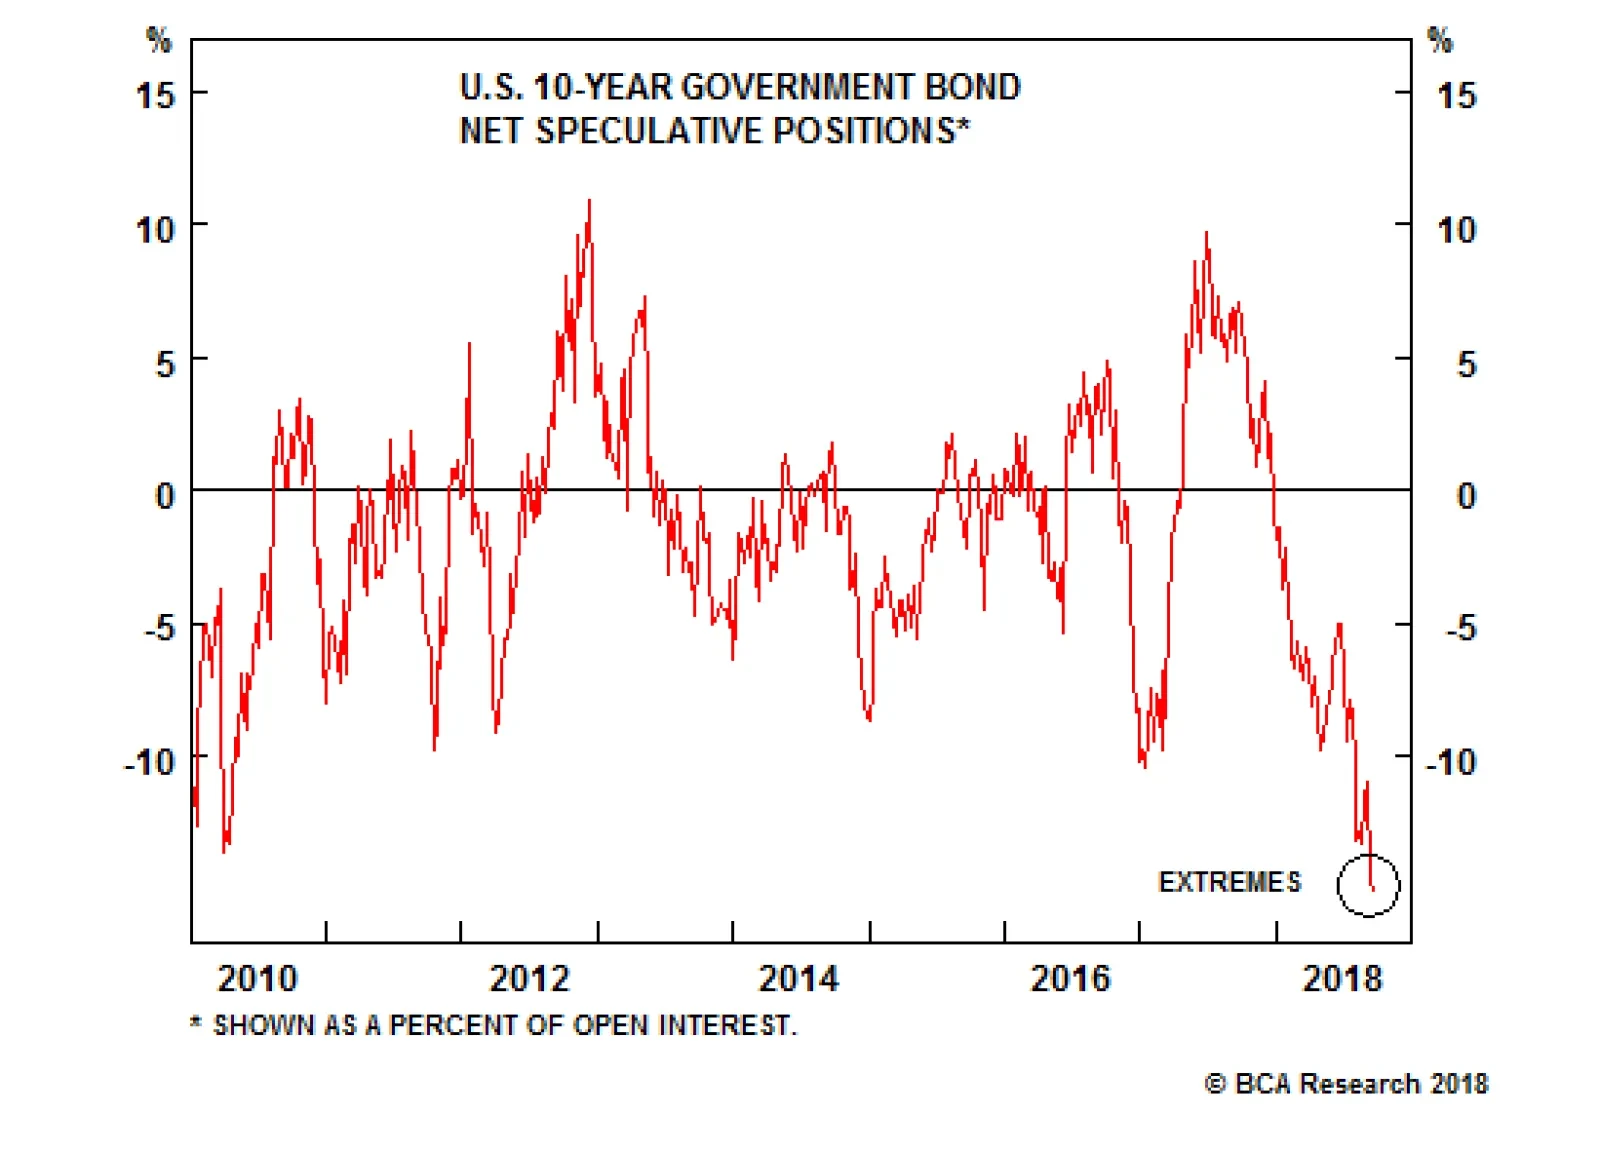
The outlook for Treasury yields has certainly evolved alongside the major macro moves that have gripped markets in 2018. At the beginning of the year, many strategists were throwing around big numbers like 4% for 10-year yields as conditions seemed like they…
Highlights Duration: The Fed is unlikely to slow its 25 bps per quarter rate hike pace until there is sufficient evidence pointing to a slow-down in economic growth. Maintain below-benchmark duration in U.S. bond portfolios. Yield Curve: The yield curve will remain near its current level and await confirmation from rising wage growth. The 2-year maturity point is becoming more attractive, and it will soon be time to switch our yield curve positioning from favoring the 5-year/7-year part of the curve to the 2-year. Economy: The global growth data improved somewhat during the past month, but weak foreign growth remains the greatest risk to the U.S. recovery and the Fed's 25 bps per quarter rate hike cycle. Feature Treasury yields increased last week. The 10-year is once again flirting with 3% and the market now discounts four 25 basis point rate hikes by the end of 2019. This time last week it was only priced for three (Chart 1). Chart 110-Year Testing 3%
10-Year Testing 3%
10-Year Testing 3%
Last week's bearish price action occurred despite core inflation and retail sales both printing well below expectations. But the market saw through the economic data and instead took its cue from a speech given by Fed Governor Lael Brainard.1 A speech that was rightly interpreted as hawkish. We view last week's speech as important because Governor Brainard effectively refuted two arguments that the Fed could use to justify a slower pace for rate hikes in the coming months. Brainard's message to markets is that if any investor still expects the Fed to rely on one of those excuses, they should think again. Getting Close To Neutral One potential reason for the Fed to slow its 25 bps per quarter rate hike pace is that current FOMC estimates place the longer-run neutral fed funds rate between 2.8% and 3.5%.2 This means that four more rate hikes would be sufficient for monetary policy to move from accommodative to neutral. If those neutral rate estimates turn out to be correct, then the Fed might be justified in halting its rate hike cycle this time next year. The problem, as we have pointed out in several prior reports, is that the error bars around such neutral rate estimates are very wide. So wide that we think the FOMC will pay them little attention and focus instead on trends in the actual economy and financial markets.3 Governor Brainard attacks the issue from a different angle, but arrives at the same conclusion. Brainard's framework draws a distinction between the short-run neutral rate - which is allowed to fluctuate in response to changes in the economy - and the long-run neutral rate - which is the neutral rate that prevails "after transitory forces reflecting headwinds or tailwinds have played out." In practice, this distinction means that if the economy proves resilient to a rising fed funds rate, we should conclude that the short-run neutral rate is moving higher. This would mean that higher interest rates are required before monetary policy turns restrictive. If economic tailwinds are strong enough, the short-run neutral rate could even move above the long-run rate. This framework leads to the same investment strategy we have suggested in many prior reports. Investors should ignore neutral rate estimates altogether, and focus instead on monitoring the economy and financial markets for signals that monetary policy is turning restrictive. Some potential signals we have suggested in the past include:4 When year-over-year nominal GDP growth is below the fed funds rate When cyclical spending slows as a percentage of overall GDP When the Treasury curve inverts When the gold price breaks dramatically lower Governor Brainard's speech pointed to one more indicator that we should add to our list: evidence of tightening from indicators of overall financial conditions. The strong relationship between financial conditions and future economic growth is well documented, meaning that Fed rate hikes will only exert a drag on growth if they translate into tighter overall financial conditions. Charts 2, 3 and 4 show how this played out during the past three Fed tightening cycles. Chart 2 shows that financial conditions tightened immediately after the Fed first raised rates in March 1997. They continued to tighten until the Fed stopped hiking in mid-2000. In contrast, Chart 3 shows that financial conditions did not tighten immediately when the Fed first lifted rates in June 2004, but that they eventually tightened as the Fed persisted with hikes. Chart 4 shows how financial conditions have evolved in the current cycle. Broadly speaking, overall financial conditions appear easier now than when the rate hike cycle began in December 2015. In other words, Fed rate hikes have so far not translated into tighter financial conditions. In Brainard's framework this can only mean that the short-run neutral rate has been rising alongside the fed funds rate. This suggests that more rate hikes are required to tighten overall financial conditions and slow growth. Chart 2Financial Conditions: 1990s
Financial Conditions: 1990s
Financial Conditions: 1990s
Chart 3Financial Conditions: 2000s
Financial Conditions: 2000s
Financial Conditions: 2000s
Chart 4Financial Conditions: Present Day
Financial Conditions: Present Day
Financial Conditions: Present Day
Inflation Is Well Contained A second reason why many have suggested that the Fed could slow its pace of rate hikes is that inflation remains well contained near the Fed's target, and the risk of a meaningful overshoot appears low. At 2.19%, year-over-year core CPI inflation is consistent with the Fed's target. However, our Base Effects Indicator suggests it will decelerate during the next six months (Chart 5). Our core PCE Base Effects Indicator sends a similar message, as we showed in a recent report.5 But Brainard suggested that the Fed should broaden its scope beyond a simple inflation target. Specifically, she observed that: The past few times unemployment fell to levels as low as those projected over the next year, signs of overheating showed up in financial-sector imbalances rather than in accelerating inflation. The Federal Reserve's assessment suggests that financial vulnerabilities are building[.] As evidence that financial vulnerabilities are rising, Brainard pointed to low corporate bond spreads, rising corporate debt levels and easing underwriting standards (Chart 6). This would appear to make the case for further rate hikes even if inflation remains well contained near the Fed's target. Chart 5Inflation Will Stay Close To Target
Inflation Will Stay Close To Target
Inflation Will Stay Close To Target
Chart 6Brainard Looks Beyond Inflation
Brainard Looks Beyond Inflation
Brainard Looks Beyond Inflation
Bottom Line: The Fed is unlikely to slow its 25 bps per quarter rate hike pace until there is sufficient evidence pointing to a slow-down in economic growth. Maintain below-benchmark duration in U.S. bond portfolios. Treasury Curve: Considering The 2-Year As we pointed out last week, the Treasury curve has already discounted a significant acceleration in wage growth (Chart 7).6 This is fairly common cyclical behavior. In each of the past two cycles the Treasury curve has flattened sharply and then leveled-off at a low level as wages accelerated. We expect we have now reached this latter stage. The 2/10 slope will stay near its current level for a time, awaiting confirmation from wage growth. Chart 7Waiting For Wages
Waiting For Wages
Waiting For Wages
In our view, the more interesting yield curve trend is that the spread between the 2-year yield and the fed funds rate has widened to above the 2/10 slope (Chart 7, panel 2). Periods where the fed funds/2-year slope exceeds the 2-year/10-year slope are rare, and tend to be quickly followed by fed funds/2-year flattening. The attractiveness of the 2-year note is confirmed by our butterfly spread models. We model different butterfly spread (bullet over duration-matched barbell) combinations relative to the slope between the two legs of the barbell.7 Our models show that the 2-year bullet is consistently cheap relative to different barbell combinations, and in fact cheaper than all other bullet maturities (Table 1). Table 1Butterfly Strategy Valuation
No Excuses
No Excuses
At present, we recommend a yield curve position that is long the 7-year bullet and short the 1/20 barbell. We will continue to hold this position for the time being because, while the 2-year note appears cheaper than the 7-year, we think the 2-year has room to cheapen even further. As mentioned at the beginning of this report, the Treasury market is priced for just barely four rate hikes between now and the end of 2019. The 2-year yield has further upside as more rate hikes get priced in. The upside in the 7-year yield is more limited. Bottom Line: The yield curve will remain near its current level and await confirmation from rising wage growth. The 2-year maturity point is becoming more attractive, and it will soon be time to switch our yield curve positioning from favoring the 5-year/7-year part of the curve to the 2-year. Global Growth Update Governor Brainard's speech shot down two arguments for why the Fed might turn more dovish, but this certainly does not rule out the Fed slowing its pace of rate hikes if economic growth starts to weaken. In past reports we noted that the Global Leading Economic Indicator (LEI) excluding the U.S. is below zero (Chart 8). Since 1993, every time the Global ex. U.S. LEI has fallen below zero, the U.S. LEI has eventually followed. It is conceivable, and perhaps even likely, that the same dynamic will play out again. However, the most recent data on global growth have been somewhat more optimistic. While the Global Manufacturing PMI (excluding the U.S.) has been trending lower, it remains at healthy levels compared to recent history (Chart 8, panel 2). Further, our Global PMI Diffusion index perked up in August, and now shows that 86% of the 36 countries in our sample have PMIs above the 50 boom/bust line (Chart 8, panel 3). The Global LEI also ticked higher in July, and its diffusion index increased, though it remains below 50% (Chart 8, bottom panel). While the monthly LEI and PMI data have improved, indicators of investor sentiment derived from both surveys and financial market prices remain downtrodden. The Global ZEW survey of investor sentiment, the performance of cyclical equity sectors versus defensives and our Boom/Bust Indicator all suggest that U.S. bond yields are too high for the global growth environment (Chart 9). Chart 8Slight Improvement In Global Growth
Slight Improvement In Global Growth
Slight Improvement In Global Growth
Chart 9High Frequency Global Growth Indicators
High Frequency Global Growth Indicators
High Frequency Global Growth Indicators
It's difficult to say how this will all play out, but our sense is that there remains a strong chance that weak foreign growth will eventually drag the U.S. lower. This will cause the Fed to pause its rate hike cycle for a time. However, given the uncertainty surrounding this outcome and the fact that the market is already priced for only two rate hikes in the remainder of 2018 and two more in all of 2019, we view the balance of risks as still consistent with below-benchmark portfolio duration. Bottom Line: The global growth data improved somewhat during the past month, but weak foreign growth remains the greatest risk to the U.S. recovery and the Fed's 25 bps per quarter rate hike cycle. Ryan Swift, Vice President U.S. Bond Strategy rswift@bcaresearch.com 1 https://www.federalreserve.gov/newsevents/speech/brainard20180912a.htm 2 Governor Brainard defines the neutral fed funds rate as: "the level of the federal funds rate that keeps output growing around its potential rate in an environment of full employment and stable inflation." 3 Please see U.S. Bond Strategy Weekly Report, "The Powell Doctrine Emerges", dated September 4, 2018, available at usbs.bcaresearch.com 4 Please see U.S. Bond Strategy Weekly Report, "Tracking The Two-Stage Treasury Bear", dated August 14, 2018, available at usbs.bcaresearch.com 5 Please see U.S. Bond Strategy Weekly Report, "The Powell Doctrine Emerges", dated September 4, 2018, available at usbs.bcaresearch.com 6 Please see U.S. Bond Strategy Portfolio Allocation Summary, "Playing Catch-Up", dated September 11, 2018, available at usbs.bcaresearch.com 7 Please see U.S. Bond Strategy Special Report, "More Bullets, Barbells And Butterflies", dated May 15, 2018, available at usbs.bcaresearch.com Fixed Income Sector Performance Recommended Portfolio Specification
Highlights When projecting the future course of interest rates, the Fed is the best place to start: Although the Fed only expressly controls short rates, its influence is felt across all maturities. Until it inverts the yield curve, its rate-hike campaigns push all yields higher. Its decisions are influenced by inflation, ... : Our checklist of items that might lead us to change our below-benchmark duration view includes key consumer price series as well as inflation expectations and estimates of the economy's supply-demand balance. ... the state of the labor market, ... : We are monitoring compensation trends and ancillary employment measures in addition to the headline unemployment rate to get a fix on how much slack remains in the labor market. ... and signs of major imbalances: Heading off, or ameliorating, a crisis is the third element of the Fed's mandate. Major economic or financial imbalances, or an overseas crisis, could alter the Fed's policy course, and we are on the lookout for them. Feature Over the last seven weeks, we have laid out our big-picture views on markets and the economic backdrop influencing them. We see rates going higher (July 30th Weekly Report); credit performance deteriorating, albeit slowly (August 6th Weekly Report); and the equity bull market stretching into the second half of next year (August 13th Special Report). We do not foresee a recession before 2020 (August 13th Special Report), in large part because we do not expect the monetary policy cycle to turn until the second half of next year (September 3rd Special Report). With that cyclical framework in place, we can now turn to an analysis of the relevant real-time data and its impact on our market outlooks. Checklists are useful tools to help systematize that analysis. They also help track the evolution of our views in real time. Consistent tracking helps us evaluate and improve our process, while making it easier for clients to think along with us, and anticipate our next moves. This week, we introduce our rates checklist, which details the key series we're watching that could encourage us to change our below-benchmark duration recommendation. We will roll out a companion equity checklist next month. The Fed Versus Market Expectations Table 1Rates View Checklist
What Would It Take To Change Our Bearish Rates View?
What Would It Take To Change Our Bearish Rates View?
Our aversion to Treasuries largely stems from our view that the Fed will hike more than markets currently expect. The divergence between our view and the markets' view can be resolved in one of two ways: the market can revise its rate-hike expectations higher to meet ours, or we can lower our expectations to meet theirs. Long-maturity bonds will sell off in the former scenario, validating our below-benchmark-duration call, but the call will underperform if we have to cut our expectations. The "Market Perceptions of the Fed" section of our checklist (Table 1) is designed to highlight changes in the Fed's actions or investors' interpretation of them. Opportunities to earn market-beating returns arise from divergences between outcomes and consensus expectations. If, as we expect, the fed funds rate peaks at 3.5% or above in this cycle, well ahead of the current 3% market expectation, below-benchmark-duration positions will outperform. As the consensus expectation approaches our expectation, however, the incremental return from estimating the terminal rate more accurately than the consensus shrinks. The first checklist item monitors the difference between our terminal rate projection and the market projection as implied by overnight index swaps. As the distance narrows between our estimate (marked by the "X"s in Chart 1), and the peak of the OIS series, so too will the prospective rewards from below-benchmark-duration positioning. The checklist also tracks the yield curve for its insight into whether or not rate hikes have gone too far (Chart 2).1 One explanation for inversion in the latter stages of tightening cycles holds that the curve inverts once the bond market senses that monetary conditions are sufficiently tight to induce a material slowdown. As much insight into future growth prospects as the orientation of the yield curve might offer, however, neither it nor any of the other checklist items acts as a standalone indicator. Even if the curve were to invert tomorrow, we would not change our view without corroboration from several other factors. Chart 1The Consensus Is Way Behind The Curve
The Consensus Is Way Behind The Curve
The Consensus Is Way Behind The Curve
Chart 2Still Plenty Of Margin For Error
Still Plenty Of Margin For Error
Still Plenty Of Margin For Error
Inflation And Its Drivers Price stability is one half of the Fed's statutory mandate, enshrining inflation as a critical policy driver. In our base-case scenario, adding significant fiscal stimulus to an economy already operating at its full potential will consume what remains of spare capacity, fueling upward inflation pressures. The policy upshot is that the Fed will be unable to stop hiking rates until it gains some control over inflation. Since tightening monetary conditions enough to throttle inflation is likely to induce a recession, we expect that rates will rise before they ultimately fall. To track the course of inflation, and the accuracy of our projections, we are looking at headline and core CPI, and headline and core PCE (Chart 3). We will also monitor estimates of the output gap to gauge the potential for inflation pressures to turn into accelerating inflation (Chart 4). We are keeping a close eye on inflation break-evens, the expected level of inflation implied by the difference in yields on nominal and inflation-protected Treasuries. Our bond strategists peg 2.3-2.5% as the break-even level consistent with the Fed's 2% inflation target, and expect that the Fed will turn more hawkish once break-evens threaten the top end of the range (Chart 5). Failure to make progress toward that level in a timely fashion would force us to take a hard look at our stance. Chart 3Inflation Is Slowly Creeping Higher
Inflation Is Slowly Creeping Higher
Inflation Is Slowly Creeping Higher
Chart 4If The Output Gap Really Is Closed, ...
If The Output Gap Really Is Closed, ...
If The Output Gap Really Is Closed, ...
Chart 5... Inflation Will Normalize
... Inflation Will Normalize
... Inflation Will Normalize
The State Of The Labor Market The relative tightness of the labor market is an important determinant of the level of slack in the overall economy. Phillips Curve adherents (along with anyone else who believes in the law of supply and demand) also view labor market slack, or the lack thereof, as a key variable in wage growth and a meaningful influence on the overall level of inflation. We are watching the headline unemployment rate relative to estimates of NAIRU,2 the minimum level of unemployment the economy can sustain without overheating. If unemployment remains below NAIRU, the Fed will have little choice than to remain vigilant; if it rises, or estimates of NAIRU are revised lower, the Fed may be able to ease up a little (Chart 6). Chart 6Sub-NAIRU Unemployment, ...
Sub-NAIRU Unemployment, ...
Sub-NAIRU Unemployment, ...
We are also looking at ancillary indicators of labor market health like the broader U-6 measure of unemployment3 (Chart 7, top panel); the participation rate of work-age citizens in the labor market (Chart 7, second panel); and the quit rate, which sheds light on how easily workers can switch jobs (Chart 7, bottom panel). The first two measures offer insight into the potential size of the pool of workers available to re-enter the labor market and relieve supply constraints, while the last focuses on employee bargaining power, which should impact wages. We also look at a range of compensation growth measures: the average hourly earnings series from the monthly employment situation report (Chart 8, top panel); the Atlanta Fed wage tracker, which follows the same employees from year to year, sidestepping the composition issues that broader surveys face (Chart 8, second panel); and the employment cost index (including benefits), our choice for the single best compensation measure (Chart 8, bottom panel). Chart 7... And Declining
... And Declining "Hidden" Unemployment ...
... And Declining "Hidden" Unemployment ...
Chart 8... Argue For Higher Wages
... Argue For Higher Wages
... Argue For Higher Wages
The Fed's Third Mandate In addition to maintaining price stability and full employment, the Fed also has to protect the economy from shocks or at least try to mitigate their impact. Previous Feds may not have had much taste for supervisory matters, but supervision is now an explicit point of emphasis. There do not appear to be lending excesses today, and Basel III and Dodd-Frank would seem to make them much less likely than they were before the crisis. Corporations have made the most of a parade of indulgent bond buyers, securing promiscuously easy covenants, but turmoil in the bond market does not necessarily pose a systemic threat. In our view, excesses in this cycle are more likely to emerge from typical economic overheating. We are monitoring the most cyclical economic segments' share of activity, though it remains well below previous peaks (Chart 9). But just last week, in a speech about the neutral policy rate, Governor Brainard suggested that an overheating economy may create financial problems instead of economic ones. Viewed in conjunction with recent speeches, the Fed seems to be building a case for tightening policy in response to frothy credit conditions. Chart 9Cyclical Engines Aren't Overheating Yet
Cyclical Engines Aren't Overheating Yet
Cyclical Engines Aren't Overheating Yet
"The past few times unemployment fell to levels as low as those projected over the next year, signs of overheating showed up in financial-sector imbalances rather than in accelerating inflation. The Federal Reserve's assessment suggests that financial vulnerabilities are building, which might be expected after a long period of economic expansion and very low interest rates. Rising risks are notable in the corporate sector, where low spreads and loosening credit terms are mirrored by rising indebtedness among corporations that could be vulnerable to downgrades in the event of unexpected adverse developments. Leveraged lending is again on the rise; spreads on leveraged loans and the securitized products backed by those loans are low, and the Board's Senior Loan Officer Opinion Survey on Bank Lending Practices suggests that underwriting standards for leveraged loans may be declining to levels not seen since 2005."4 Central bank orthodoxy has long held that raising interest rates specifically to prick a bubble is self-defeating because it will likely provoke undesirable collateral damage. But the Fed could presumably justify hiking more than it otherwise would on the grounds that post-crisis banks are far more insulated from loan losses than they have been for several decades. Sustained by their fortified capital positions, banks wouldn't stem the flow of credit as much as they normally would in response to a pickup in provisions and charge-offs, so it would take a higher fed funds rate to slow the economy enough to counter overheating. This is a somewhat esoteric argument, to be sure, but Fed thinking appears as if it may be evolving in that direction. Our final checklist item is major international duress. An overseas crisis, or near-crisis, could pose a dual threat to our rates view. On the one hand, it could spark a flight to quality that brings Treasury yields down. On the other, it could lead the Fed to back off of tightening in the fear that international turmoil could begin to impact the U.S. economy. In our view, the odds of the current EM rumblings deterring the Fed from its "gradual-pace" roadmap are long. The U.S. economy is not only an 800-pound gorilla, it's an especially insular 800-pound gorilla. Only the most significant EM event would cause ripples within the U.S. - even the Asian Crisis failed to register in the U.S. for a year and a half after the Thai baht's collapse, and only then via a hedge fund leveraged to the gills in a way that simply is not possible today. To the extent that there is an "EM put" that could stay the Fed's hand, it's a put with a strike price that is way out of the money. Investment Implications Maintain below-benchmark Treasury duration and underweight fixed income overall. Rates are going to rise more than the consensus expects. We remain neutral on spread product within fixed income portfolios as defaults have already bottomed for the cycle, and capital losses will chip away at stingy coupons. Even though they expect the default rate will rise slowly, our fixed-income strategists are unenthused about the prospects for risk-adjusted excess returns. Doug Peta, Senior Vice President U.S. Investment Strategy dougp@bcaresearch.com 1 We will track the 3-month/10-year segment of the yield curve, which is less susceptible to estimate error, and has historically been more sensitive, than the widely cited 2-year/10-year segment. 2 NAIRU is an acronym for the non-accelerating inflation rate of unemployment. 3 The Bureau of Labor Statistics' U-6 series includes people working part time because they're unable to find a full-time position, and discouraged workers who are not actively looking for work and are therefore not counted as unemployed, in addition to the unemployed in the headline U-3 series. 4 Brainard, Lael (2018). "What Do We Mean by Neutral And What Role Does It Play in Monetary Policy," speech delivered at the Detroit Economic Club, Detroit, Mich., September 12. Emphasis added.
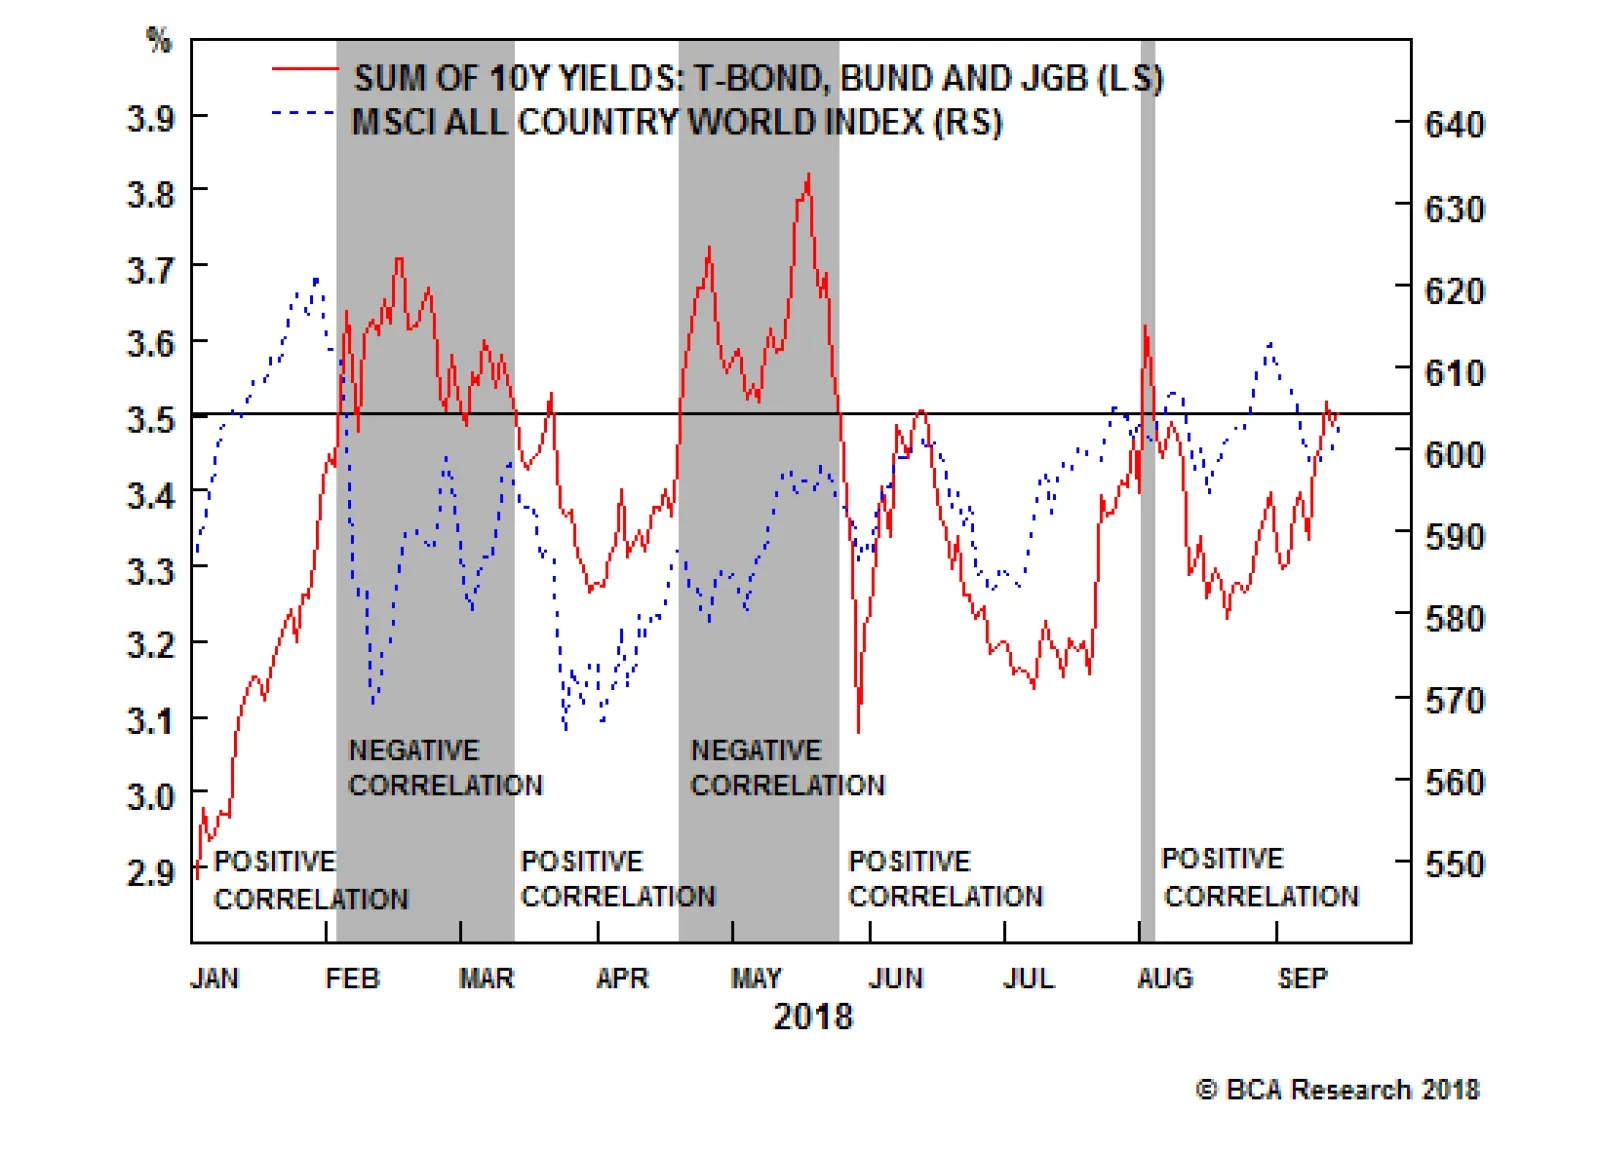
In the major developed economies, unemployment rates keep hitting new generational lows, implying that the main labor markets are tight. Yet policy interest rates remain near or at historically low levels. This raises the potential for an inflation scare. …