Fixed Income
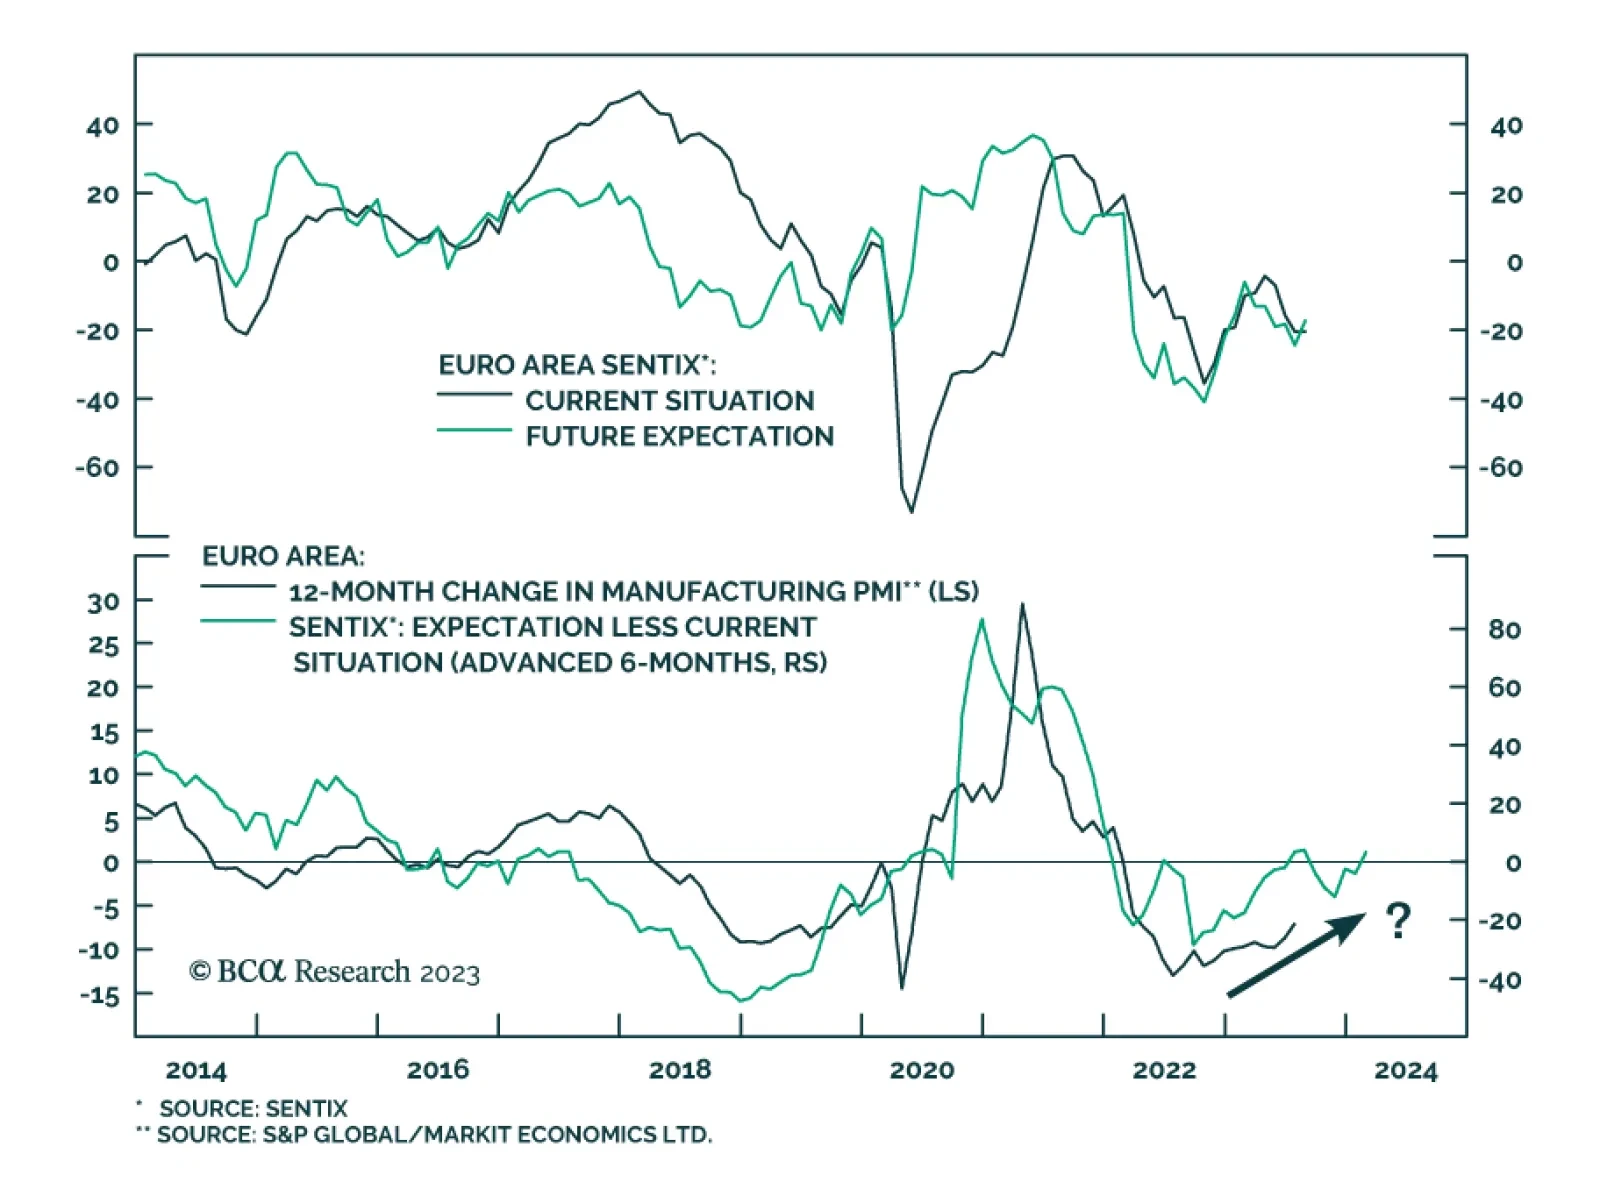
The Sentix Economic Index for the Eurozone sent a positive signal on Monday. It unexpectedly increased from -22.5 to -18.9 in August, surprising expectations of a further deterioration to -24.5. This marks the index’s first increase in four months. A…
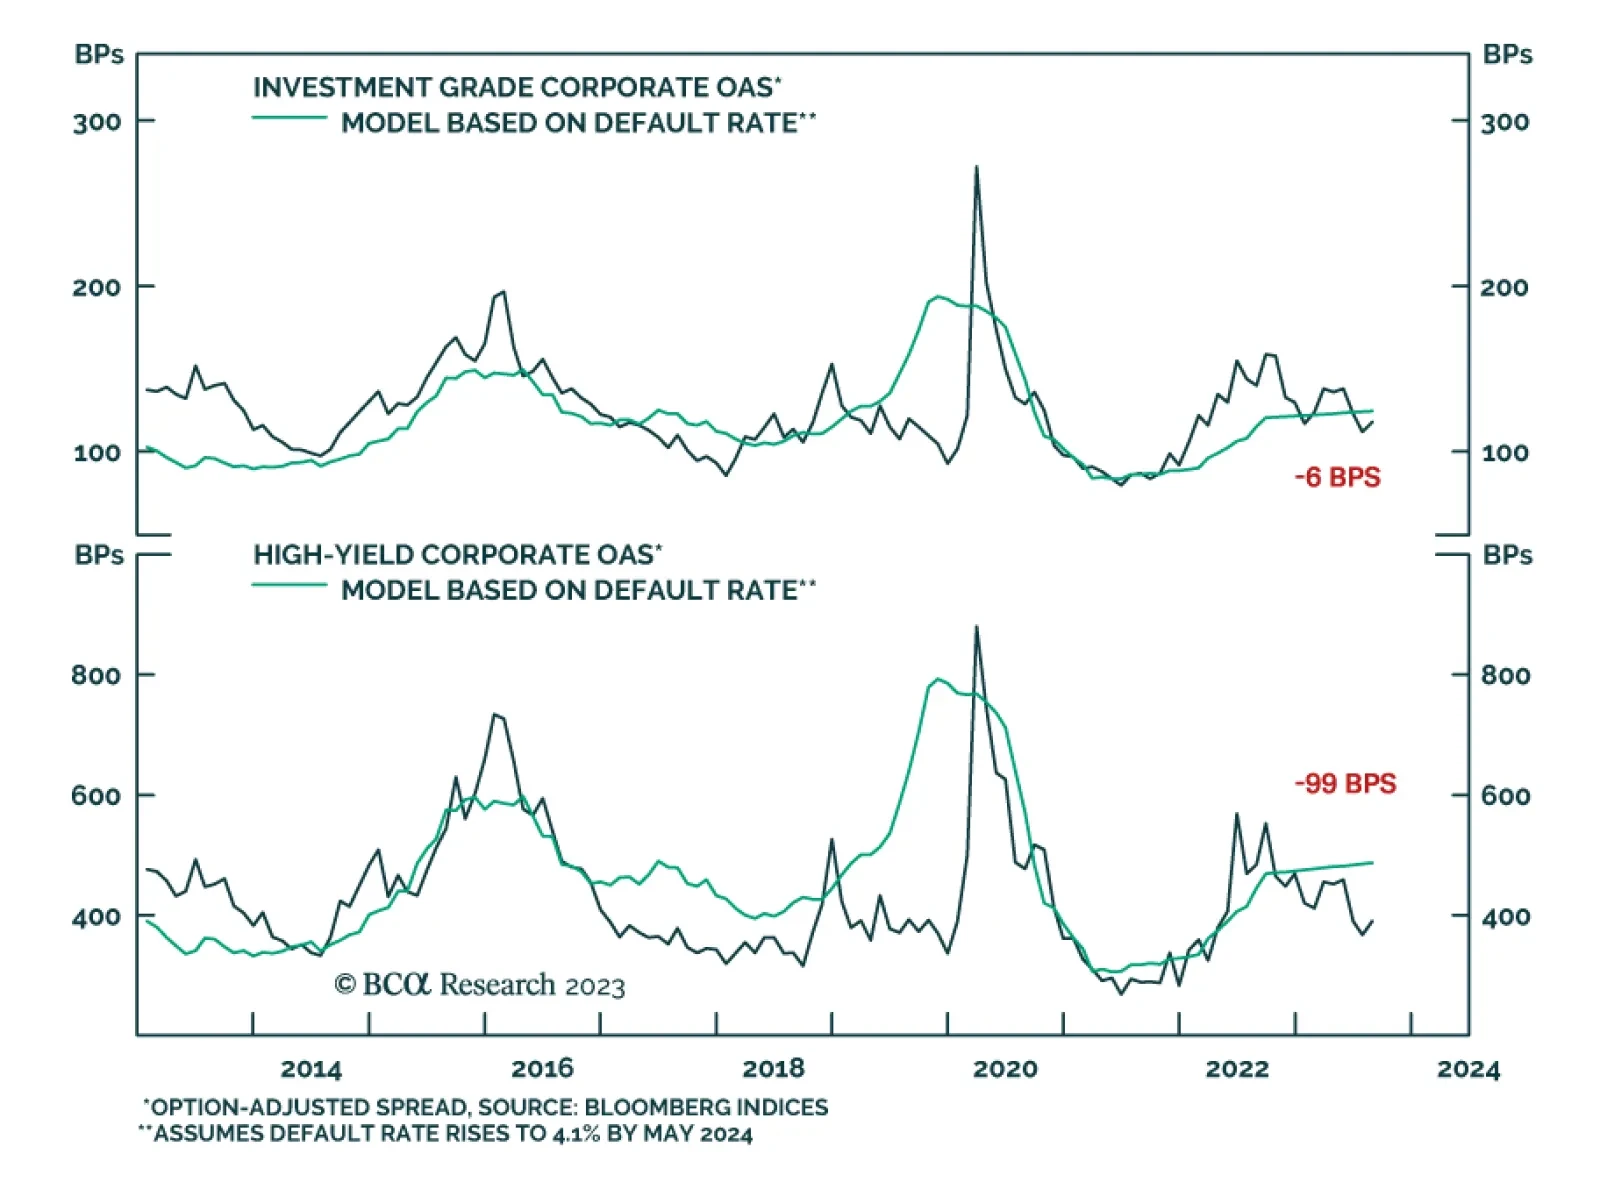
BCA Research’s US Bond Strategy service cautions against turning bullish on corporate bonds. Corporate bonds have delivered strong excess returns versus duration-matched Treasuries during the past two months. Yet the team’s fair value models, based on…

Our Portfolio Allocation Summary for August 2023.
August offers an opportunity to review our key views. European growth is turning the corner and inflation is improving, but does it guarantee an imminent breakout in European stocks?
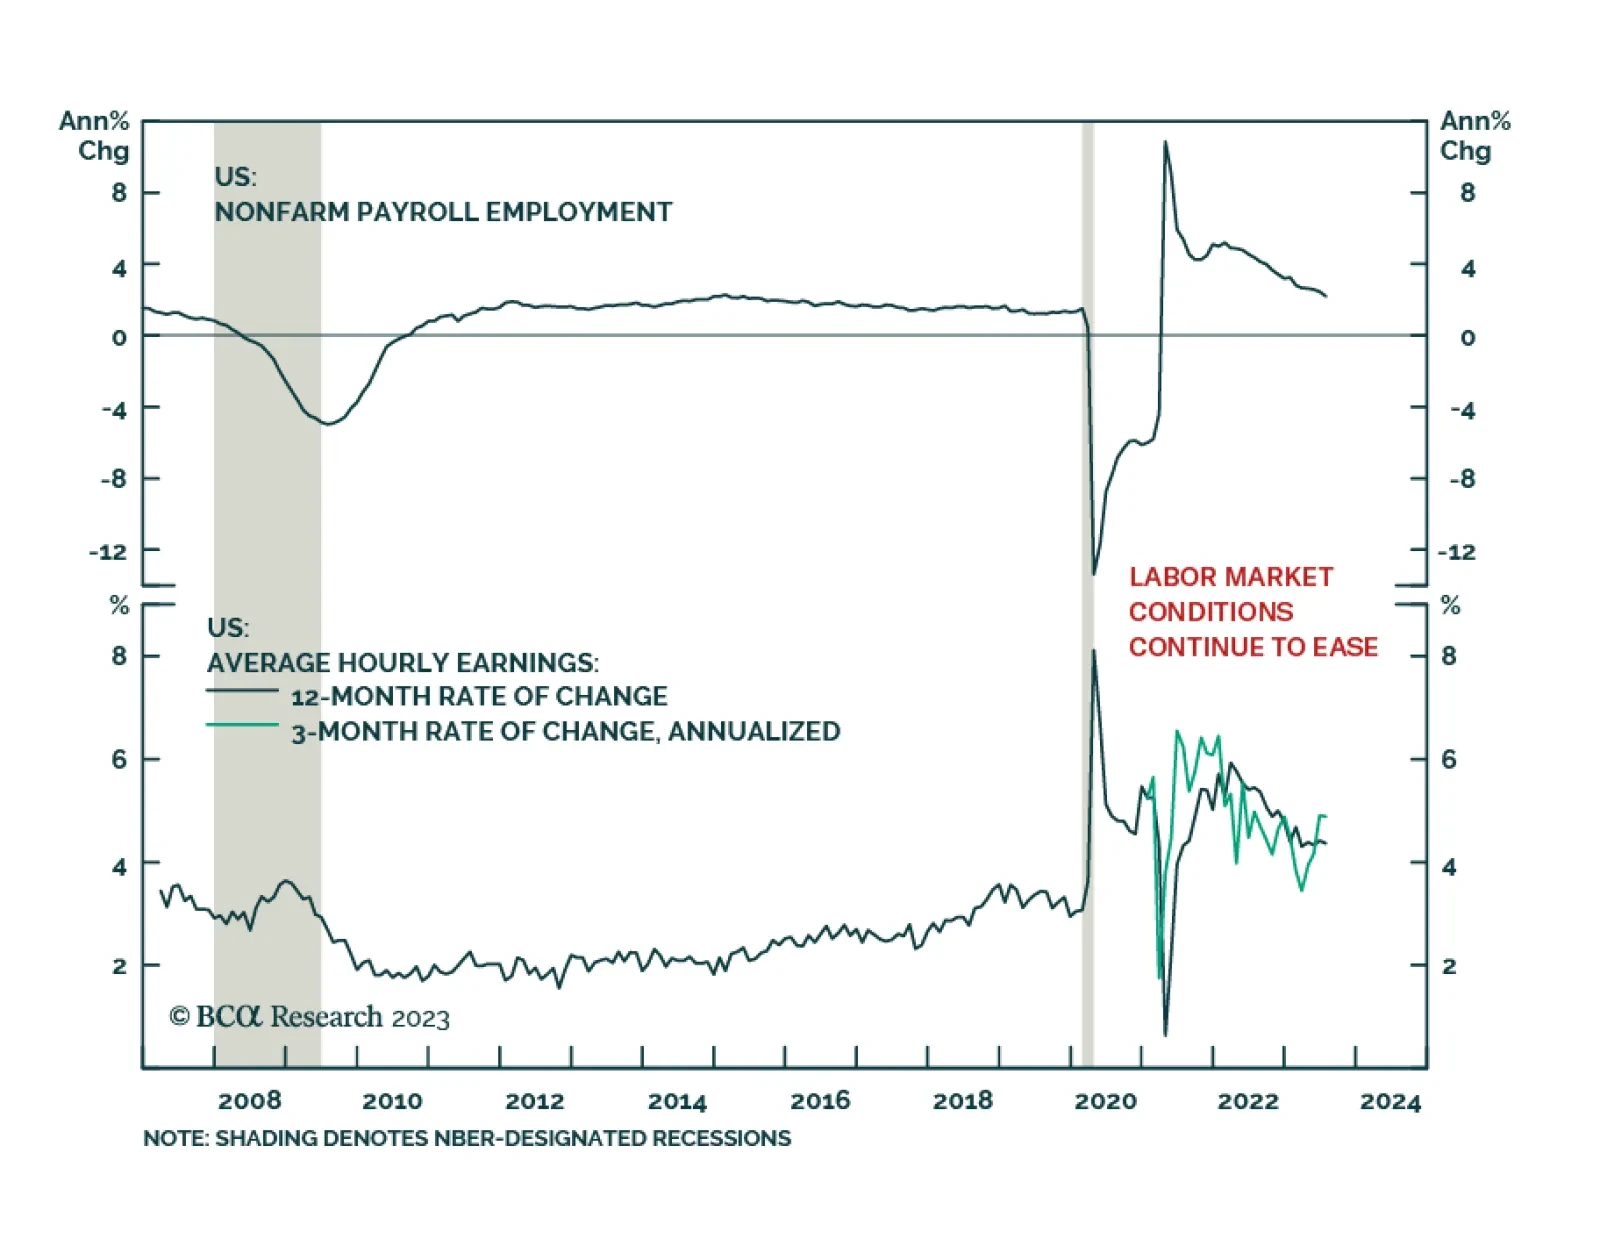
Nonfarm payroll employment increased by less than anticipated in July, rising by 187 thousand versus expectations of 200 thousand. In addition, the June increase was revised down from 209 thousand to 185 thousand. Similarly, average weekly hours worked…
Some thoughts on this week’s bear-steepening of the Treasury curve and this morning’s employment report.
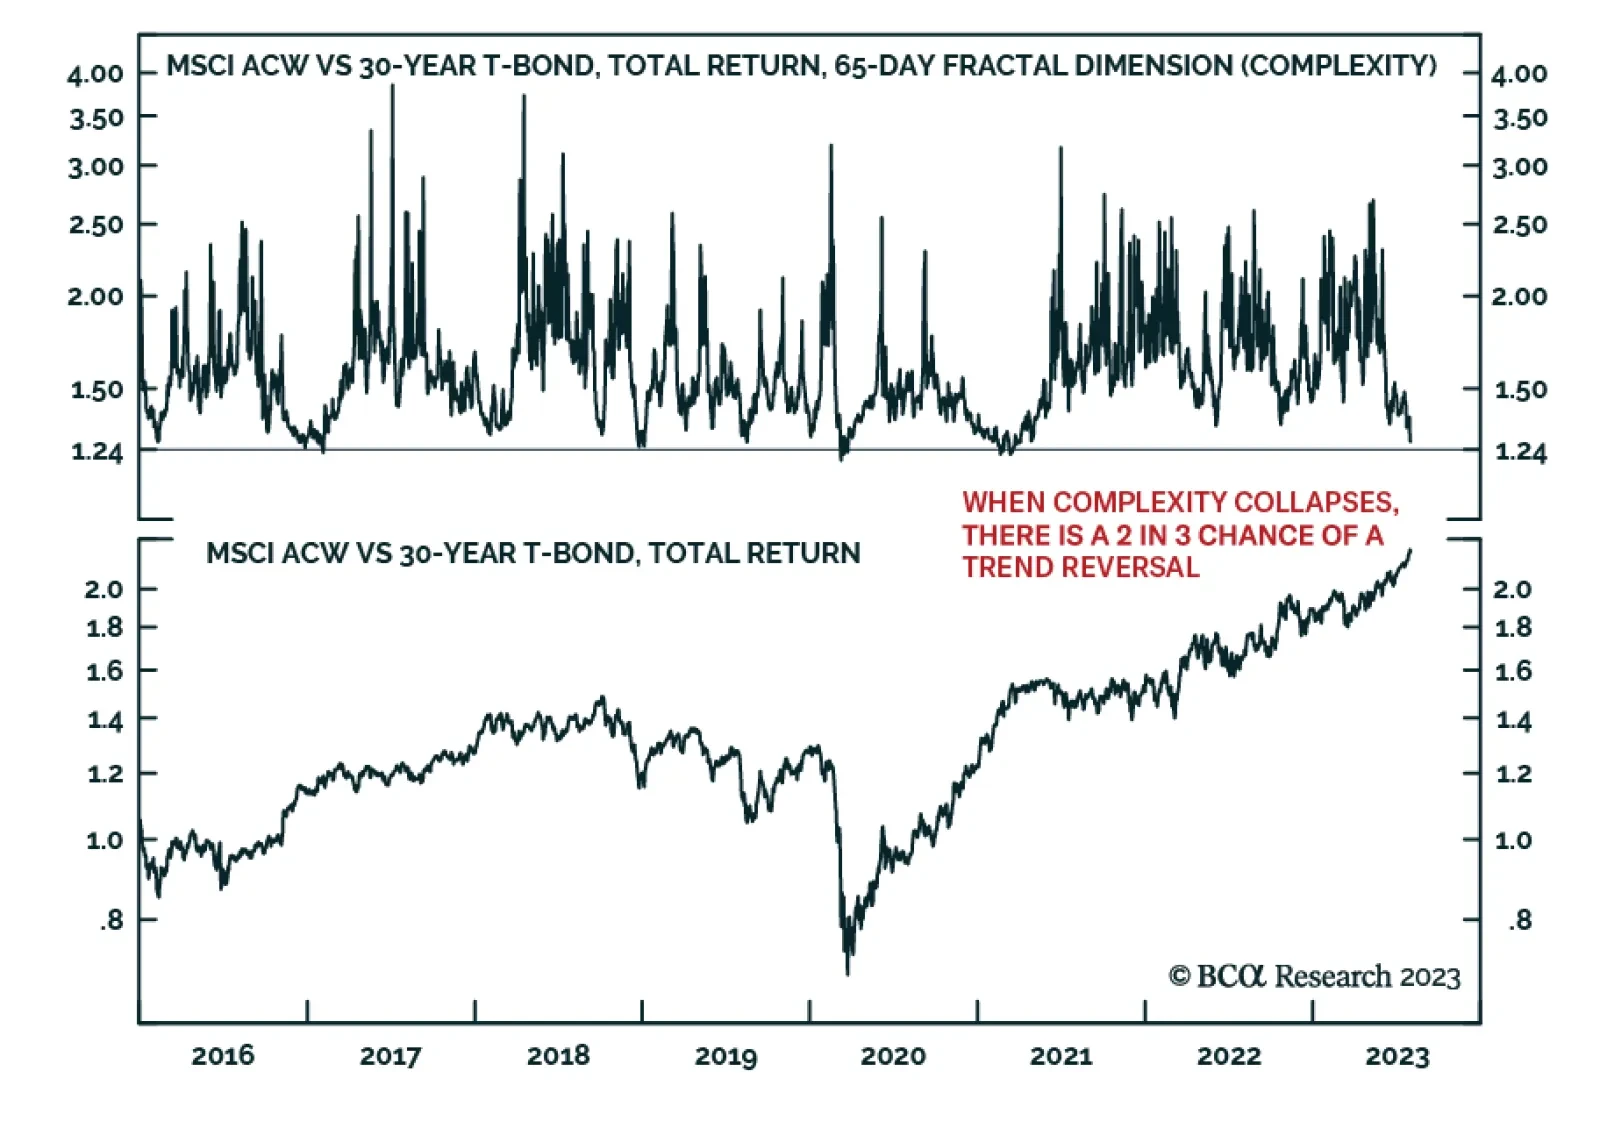
The recent ‘Goldilocks’ stock market rally is predicated on the hope that developed countries really can kill inflation without killing their economies. But one important warning sign suggests that the rally has gone too far too fast, and is vulnerable to…
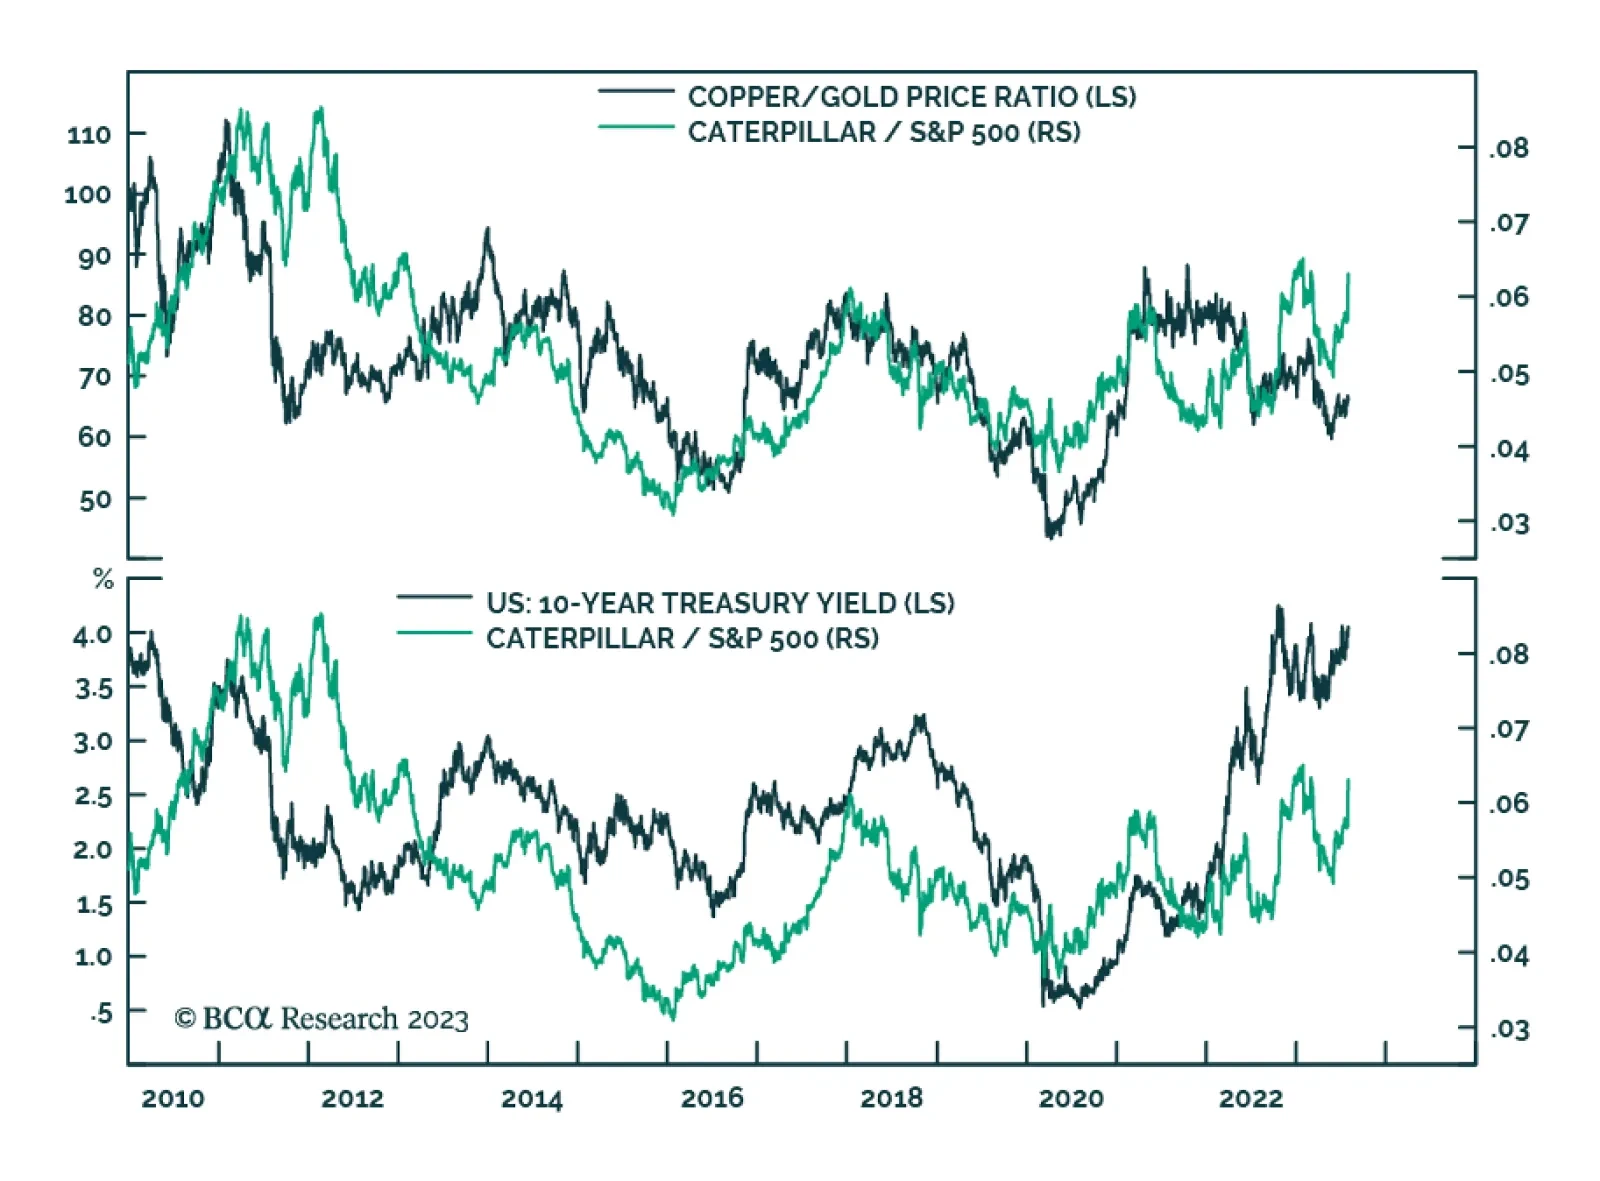
Caterpillar’s Q2 earnings results released on Tuesday beat consensus estimates by a wide margin. Second quarter profit of $2.92 billion ($5.67 per share) came in well above expectations of $2.38 billion ($4.46 per share). The stock jumped to an all time high…
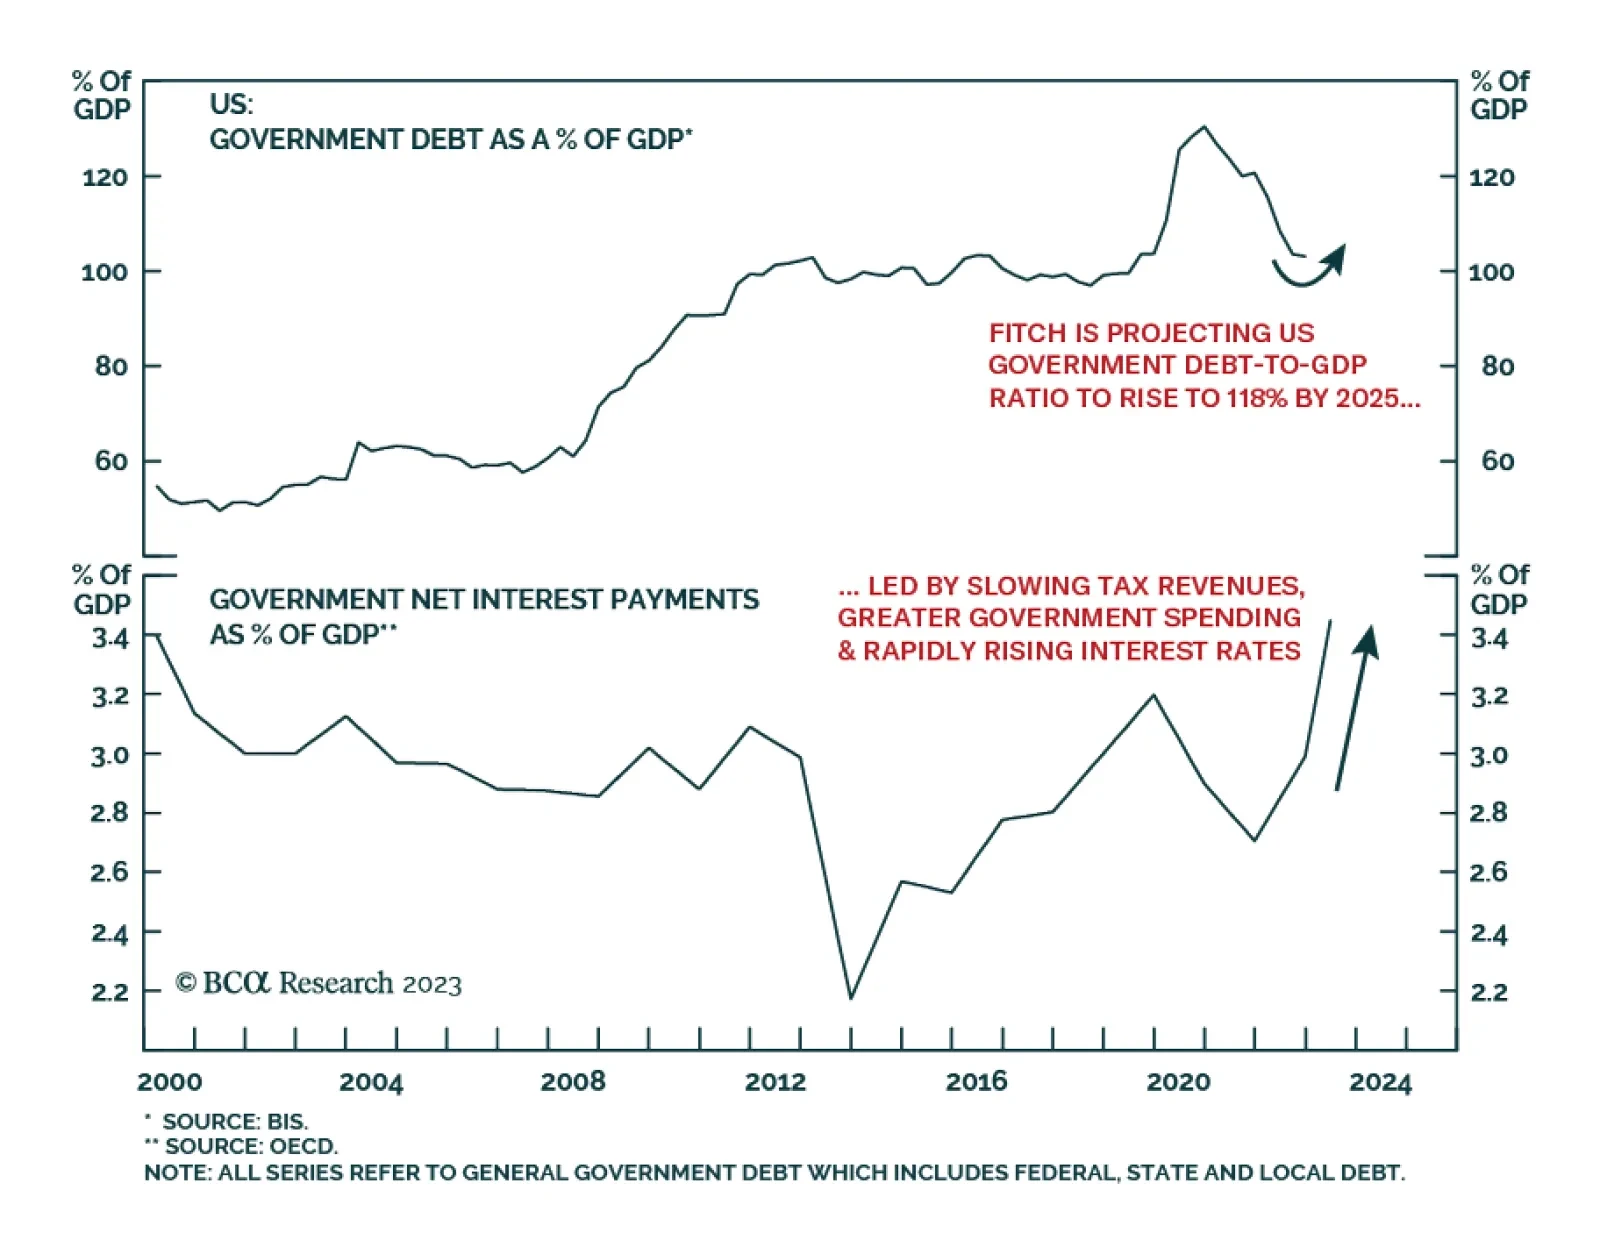
US financial markets were dealt a summer shock yesterday with Fitch Ratings lowering its sovereign credit rating on the US to AA+ from AAA. This brings the rating down to the same level as that of S&P, which announced its own US downgrade nearly twelve…
Collapsed complexity, plus the unwinding of favourable base effects and favourable seasonal adjustments to the inflation and jobs numbers, all pose a danger to the Goldilocks market.