Equities
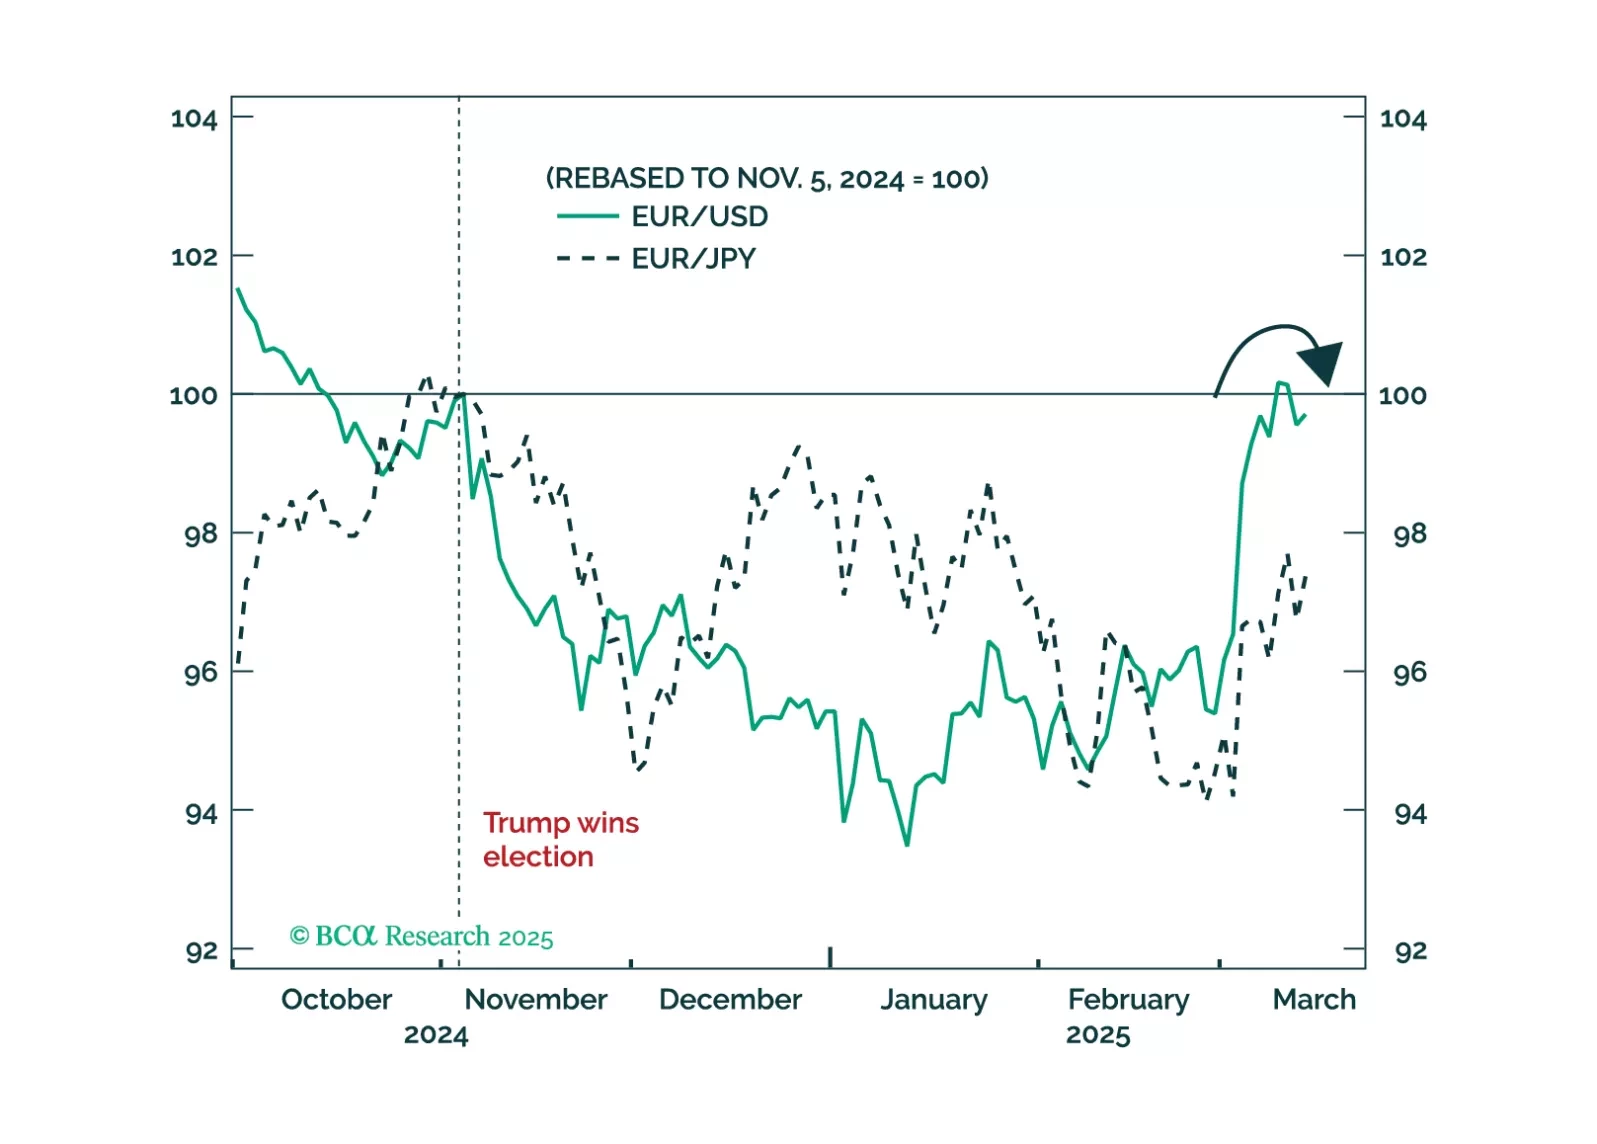
Trump’s foreign policy can be explained by rational US interests, but it requires settling the trade war with allies sooner rather than later. Book gains on EUR-USD for now.
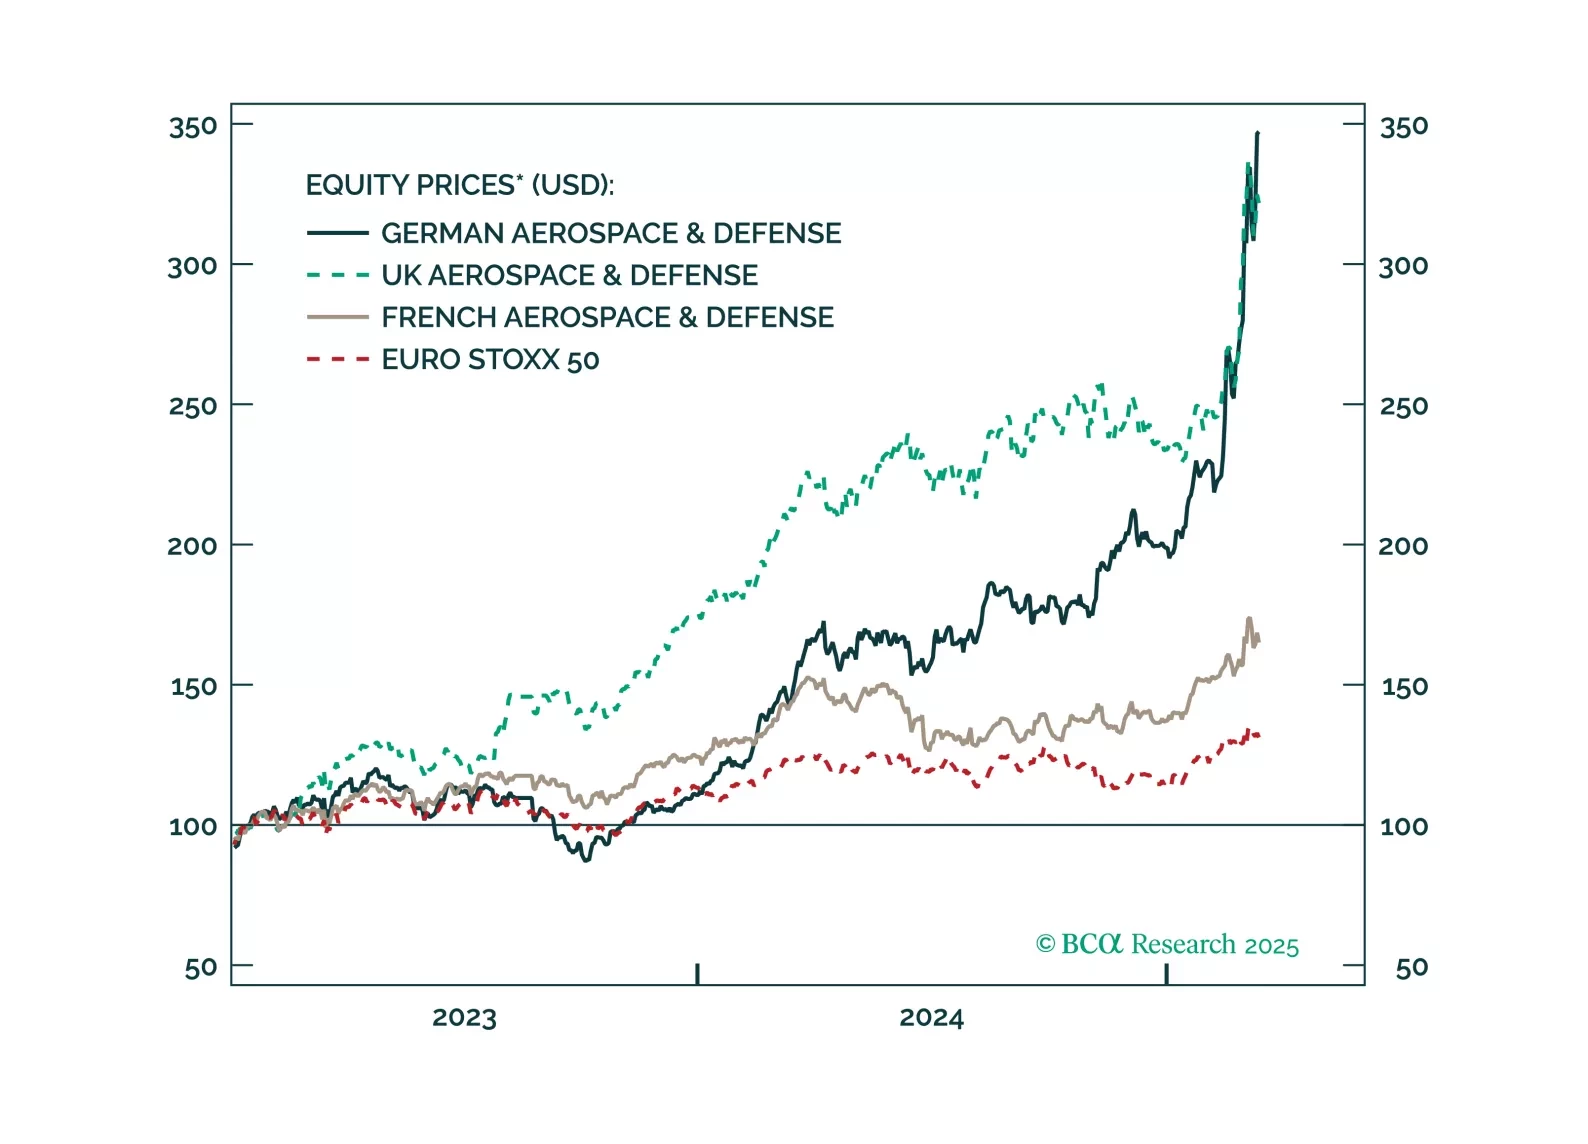
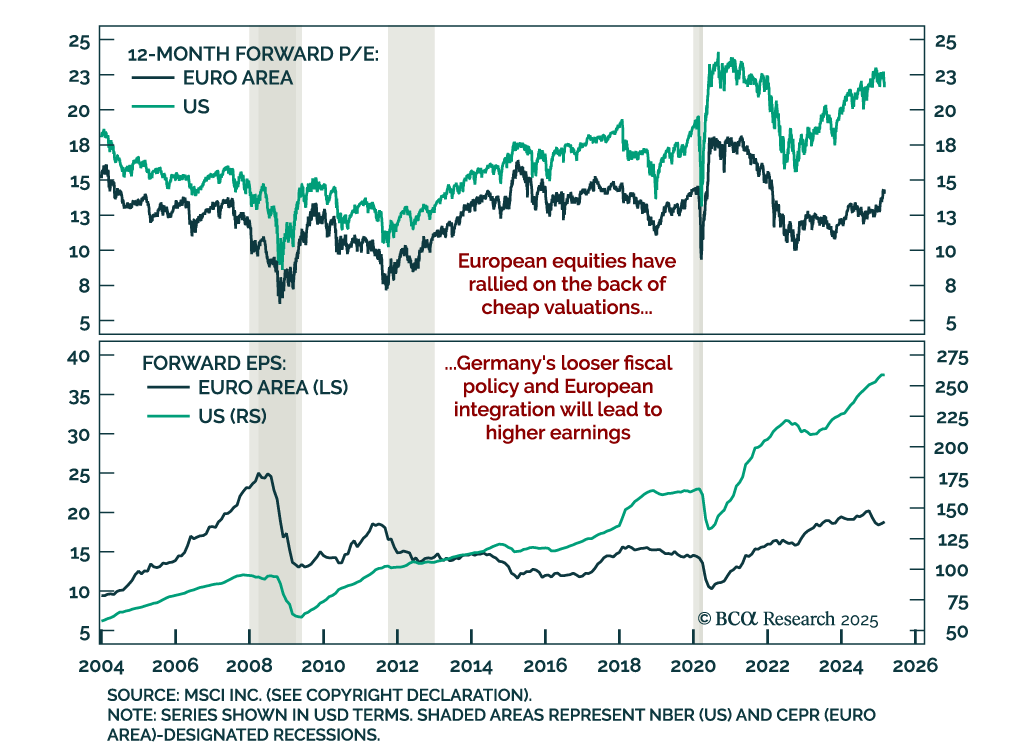
Investors should not chase the rally in European defense names any further. Too much good news has been priced in too quickly.
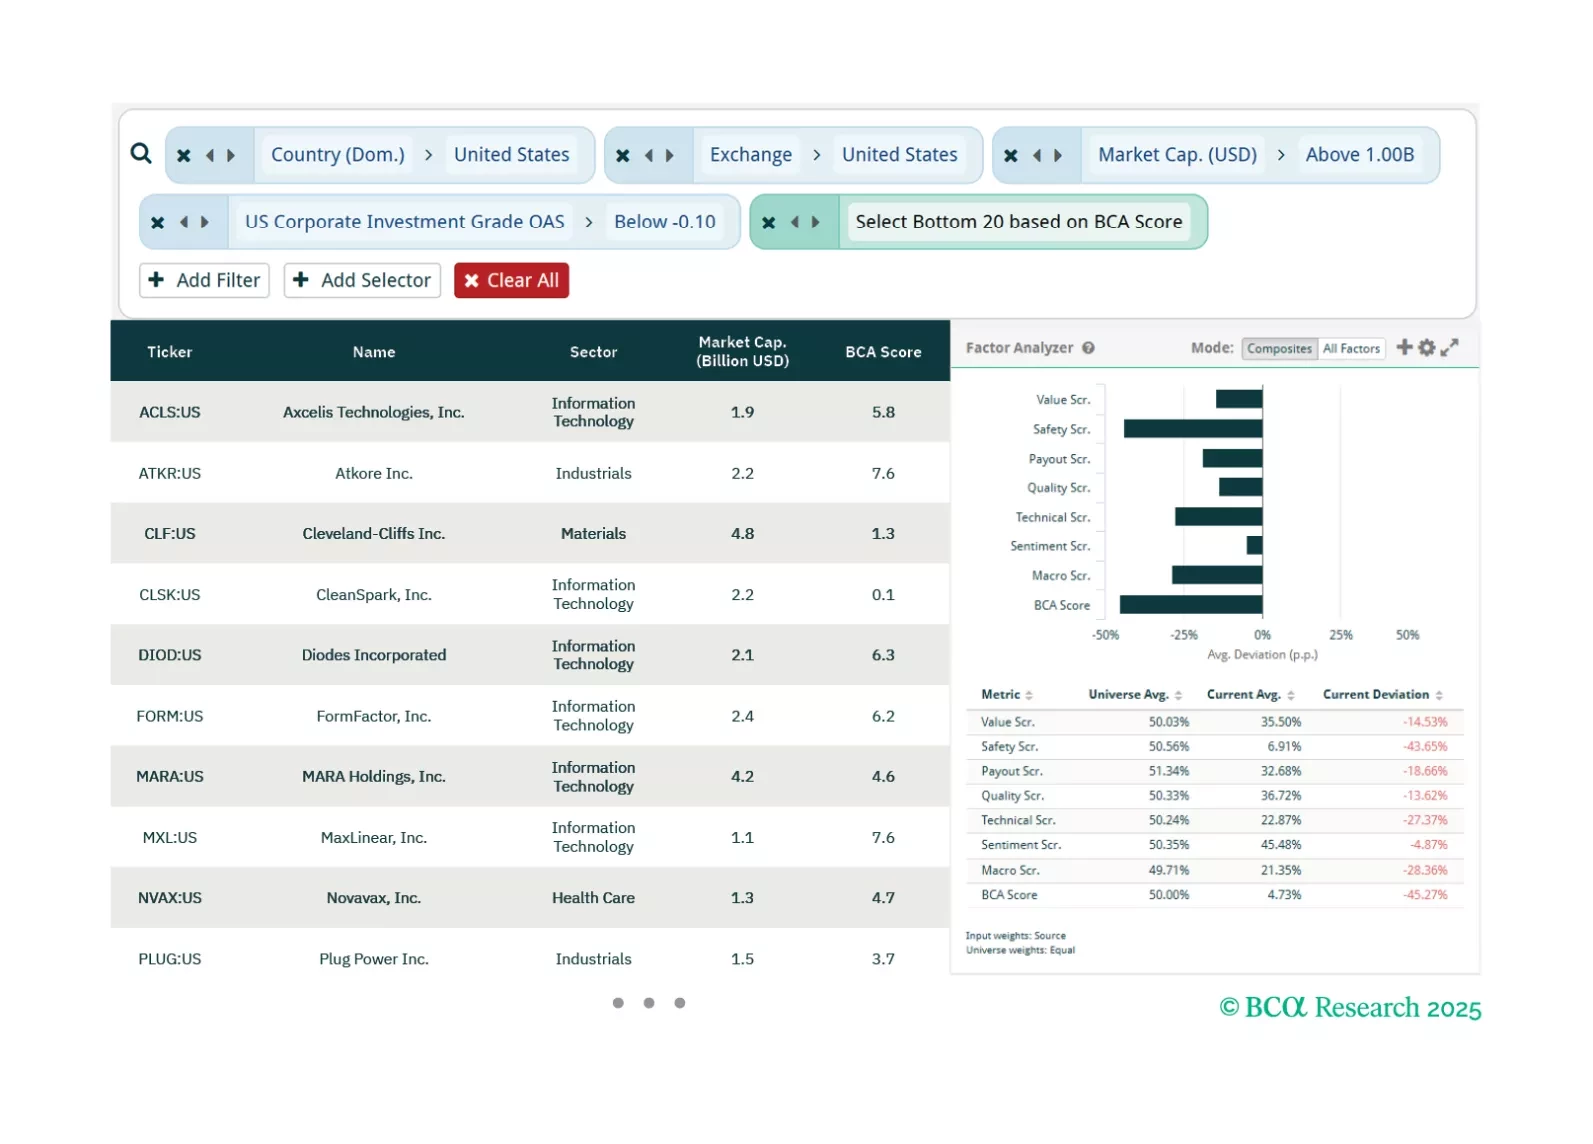
This week, our three screeners cover equity plays in US OAS Spreads, US Exceptionalism, and “DIVE”.
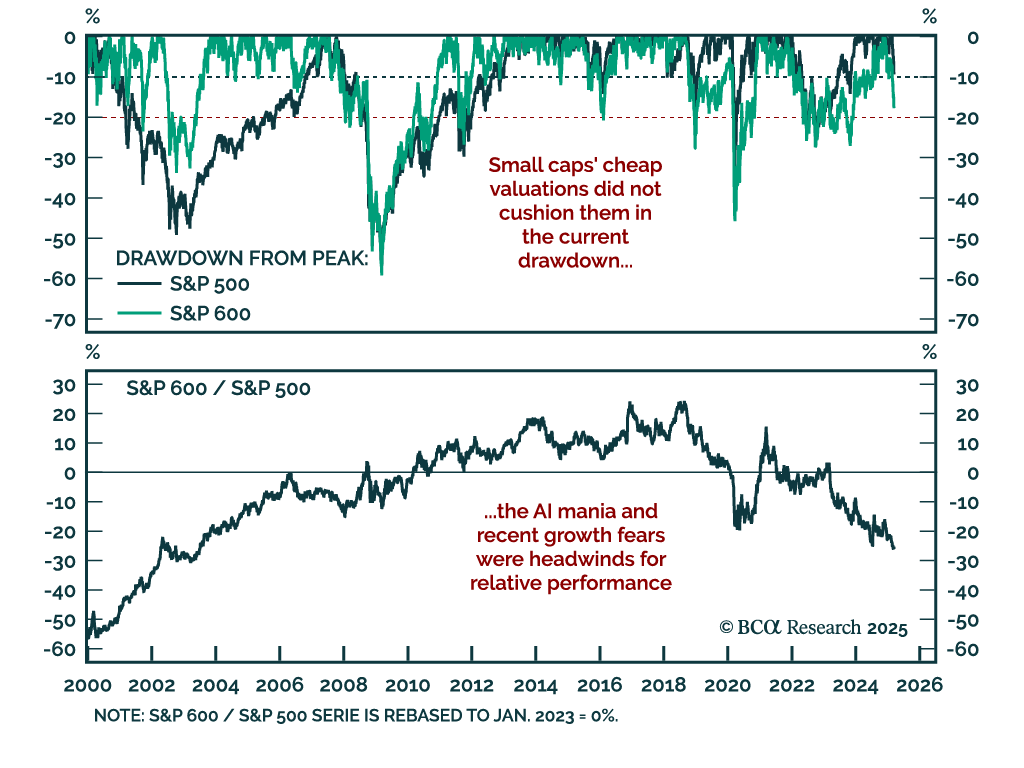
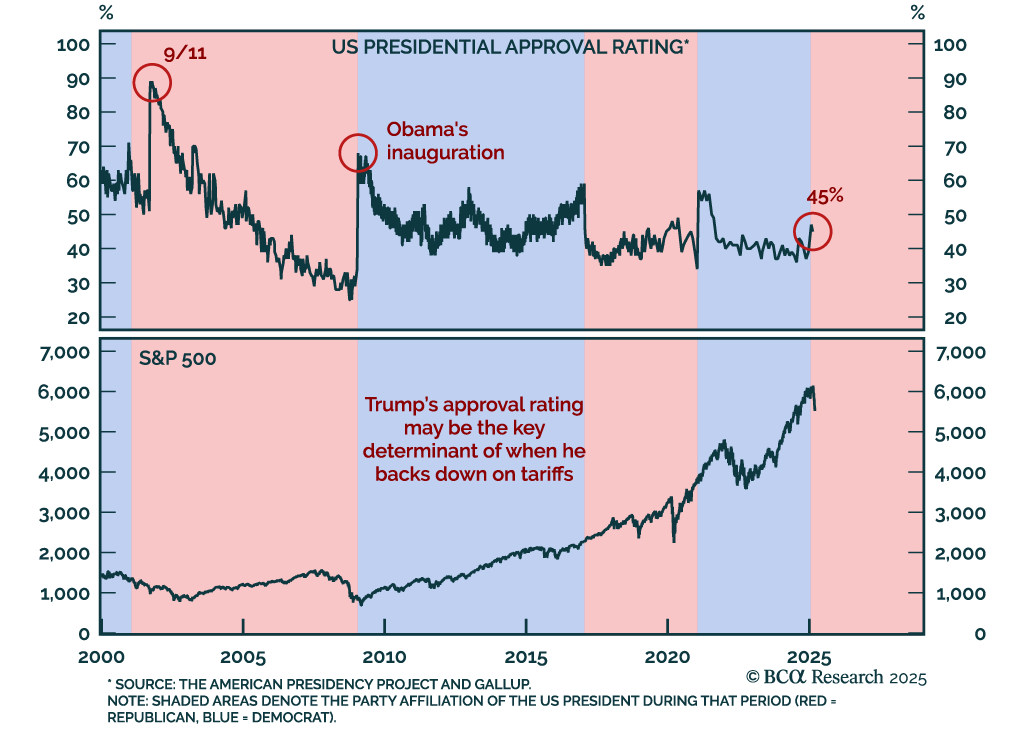
The Trump slump is nearing a temporary reprieve, with a playable countertrend rally in stocks and a tactical rebound in the dollar. Go tactically long USD/SEK. For long-term investors though, the AI bubble still has a lot of air to come out.
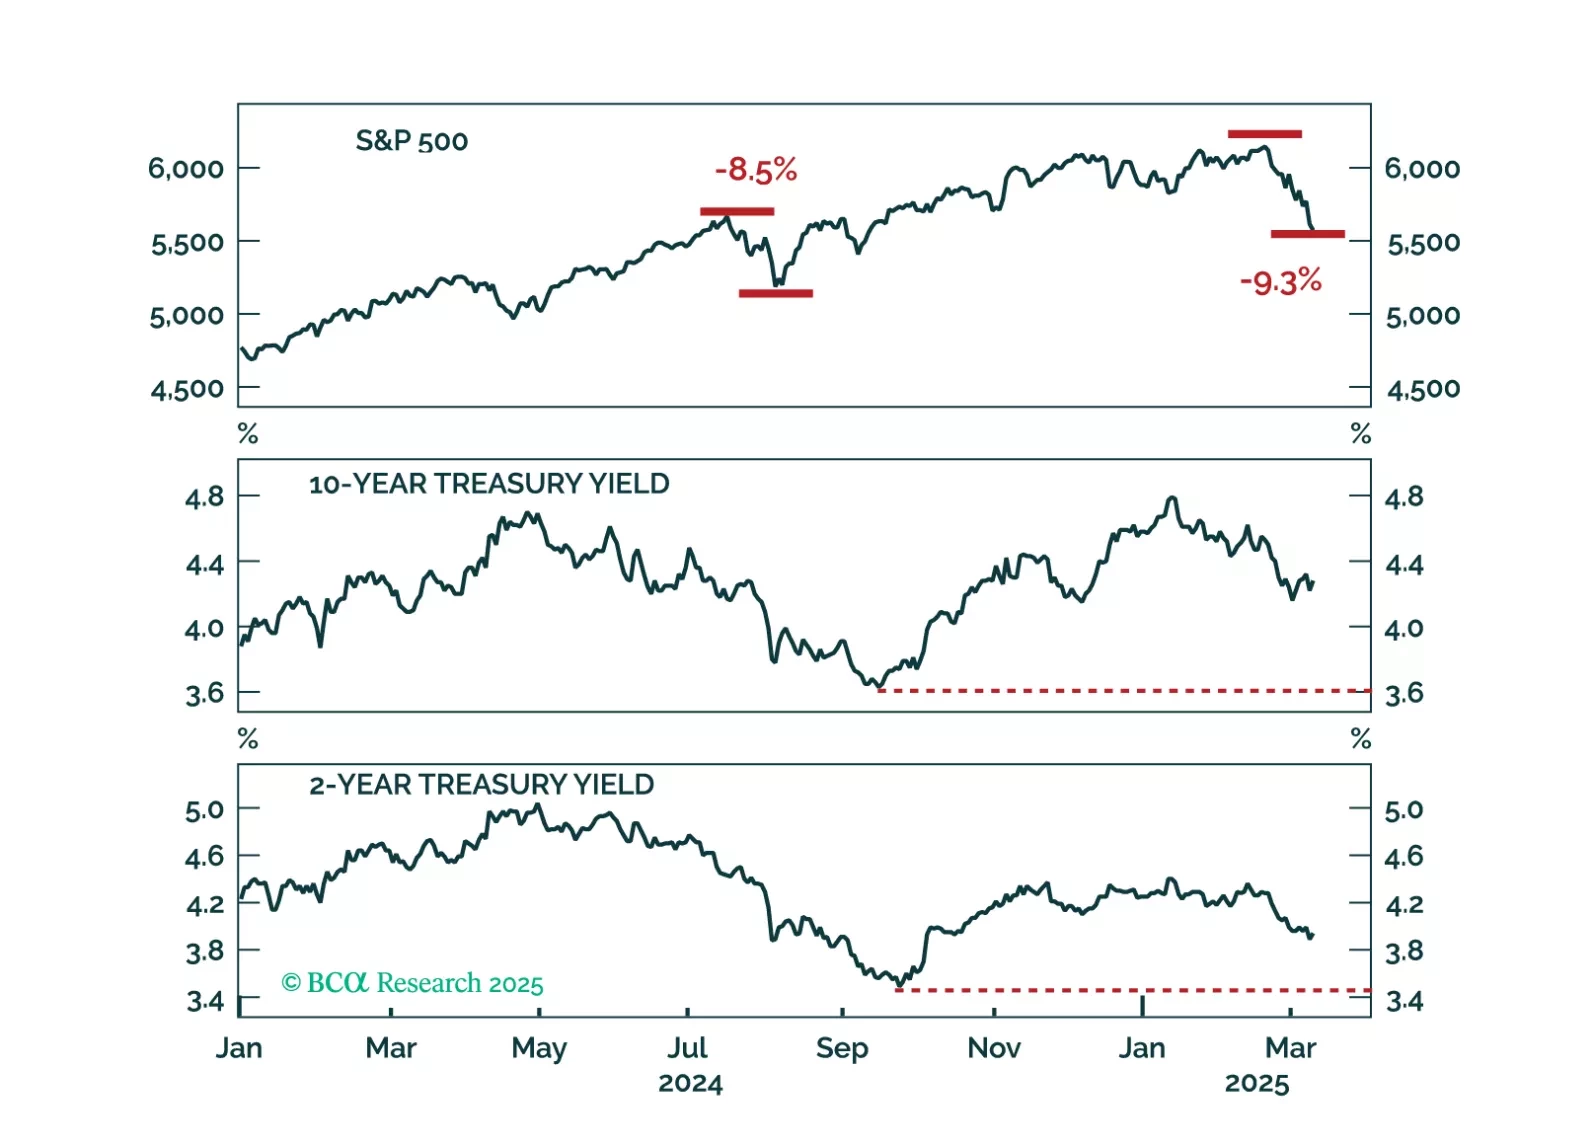
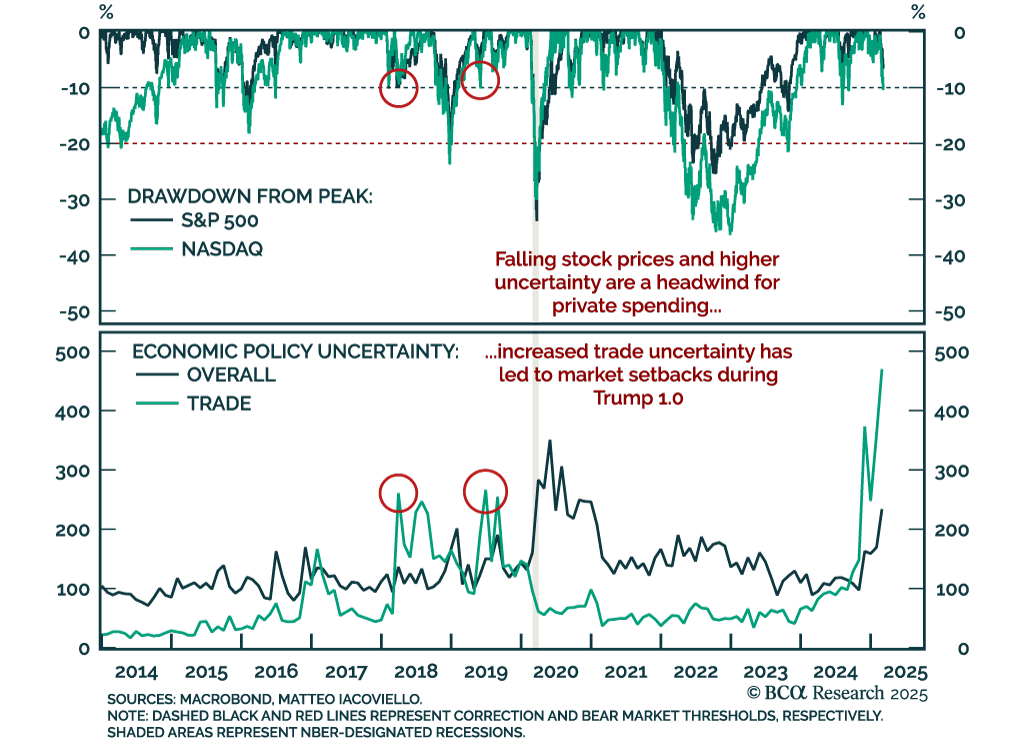
A falling stock market and sticky bond yields represent the worst of both worlds for investors. We interrogate why bond yields haven’t dropped more given the large selloff seen in equities.