Equities
According to BCA Research’s Global Asset Allocation service, the jury is out on the probability of a recession – and is likely to stay out for a while. Global equities will probably move sideways, with significant volatility. Equity markets – with US…

Executive Summary EU Embargoes Russian Oil
Energy Cutoff Continues (GeoRisk Update)
Energy Cutoff Continues (GeoRisk Update)
The EU imposed an embargo on 90% of Russian oil imports, which will provoke retaliation. Russia will squeeze Europe’s economy ahead of critical negotiations over the coming 6-12 months. Russian gains on the battlefield in Ukraine point to a ceasefire later, but not yet – and Russia will need to retaliate against NATO enlargement. The Middle East and North Africa face instability and oil disruptions due to US-Iran tensions and Russian interference. China’s autocratic shift is occurring amid an economic slowdown and pandemic. Social unrest and internal tensions will flare. China will export uncertainty and stagflation. Inflation is causing disparate effects in South Asia – instability in Pakistan and Sri Lanka, and fiscal populism in India. Asset Initiation Date Return Long Brazilian Financials / Indian Equities (Closed) Feb 10/22 22.5% Bottom Line: Markets still face three geopolitical hurdles: Russian retaliation; Middle Eastern instability; Chinese uncertainty. Feature Global equities bounced back 6.1% from their trough on May 12 as investors cheered hints of weakening inflation and questioned the bearish consensus. BCA’s Global Investment Strategy correctly called the equity bounce. However, as BCA’s Geopolitical Strategy service, we see several sources of additional bad news. Throughout the Ukraine conflict we have highlighted two fundamental factors to ascertain regarding the ongoing macroeconomic impact: Will the war cut off the Russia-EU energy trade? Will the war broaden beyond Ukraine? Chart 1Russian-Exposed Assets Will Suffer More
Russian-Exposed Assets Will Suffer More
Russian-Exposed Assets Will Suffer More
In this report we update our views on these two critical questions. The takeaway is that the geopolitical outlook is still flashing red. The US dollar will remain strong and currencies exposed to Russia and geopolitical risk will remain weak (Chart 1). In addition, China’s politics will continue to produce uncertainty and negative surprises this year. Taken together, investors should remain defensive for now but be ready to turn positive when the market clears the hurdles we identify. The fate of the business cycle hangs in the balance. Energy Ties Eroding … Russia Will Retaliate Over Oil Embargo Chart 2AEU Embargoes Russian Oil
Energy Cutoff Continues (GeoRisk Update)
Energy Cutoff Continues (GeoRisk Update)
Europe is diversifying from Russian oil and natural gas. The European Union adopted a partial oil embargo on Russia that will cut oil imports by 90% by the end of 2022. It also removed Sberbank from the SWIFT banking communications network and slapped sanctions on companies that insure shipments of Russian crude. The sanctions will cut off all of Europe’s seaborne oil imports from Russia as well as major pipeline imports, except the Southern Druzhba pipeline. The EU made an exception for landlocked eastern European countries heavily dependent on Russian pipeline imports – namely Hungary, Slovakia, the Czech Republic, and Bulgaria (Chart 2A). Focus on the big picture. Germany changed its national policy to reduce Russian energy dependency for the sake of national security. From Chancellors Willy Brandt to Angela Merkel, Germany pursued energy cooperation and economic engagement as a means of lowering the risk of war with Russia. Ostpolitik worked in the Cold War, so when Russia seized Crimea in 2014, Merkel built the Nord Stream 2 pipeline. But Merkel’s policy failed to persuade Russia that economic cooperation is better than military confrontation – rather it emboldened President Putin, who viewed Europe as divided and corruptible. Chart 2BRussia Squeezes EU’s Natural Gas
Energy Cutoff Continues (GeoRisk Update)
Energy Cutoff Continues (GeoRisk Update)
Russia’s regime is insecure and feels threatened by the US and NATO. Russia believed that if it invaded Ukraine, the Europeans would maintain energy relations for the sake of preserving overall strategic stability. Instead Germany and other European states began to view Russia as irrational and aggressive and hence a threat to their long-term security. They imposed a coal ban, now an oil ban the end of this year, and a natural gas ban by the end of 2027, all formalized under the recently announced RePowerEU program. Russia retaliated by declaring it would reduce natural gas exports to the Netherlands and probably Denmark, after having already cut off Finland, Poland, and Bulgaria (Chart 2B). As a pretext Russia points to its arbitrary March demand that states pay for gas in rubles rather than in currencies written in contracts. This ruble payment scheme is being enforced on a country-by-country basis against those Russia deems “unfriendly,” i.e. those that join NATO, adopt new sanctions, provide massive assistance to Ukraine, or are otherwise adverse. Chart 3Russia Actively Cutting Gas Flows
Russia Actively Cutting Gas Flows
Russia Actively Cutting Gas Flows
Russia and Ukraine are already reducing natural gas exports through the Ukraine and Turkstream pipelines while the Yamal pipeline has been empty since May – and it is only a matter of time before flows begin to fall in the Nord Stream 1 pipeline to Germany (Chart 3). German government and industry are preparing to ration natural gas (to prioritize household needs) and revive 15 coal plants if necessary. Europe is attempting to rebuild stockpiles for the coming winter, when Russian willingness and capability to squeeze natural gas flows will reach a peak. The big picture is demonstrated by game theory in Diagram 1. The optimal situation for both Russia and the EU is to maintain energy exports for as long as possible, so that Russia has revenues to wage its war and Europe avoids a recession while transitioning away from Russian supplies (bottom right quadrant, each side receives four points). The problem is that this solution is not an equilibrium because either side can suffer a sudden shock if the other side betrays the tacit agreement and stops buying or selling (bottom left and top right quadrants). Diagram 1EU-Russia Standoff: What Does Game Theory Say?
Energy Cutoff Continues (GeoRisk Update)
Energy Cutoff Continues (GeoRisk Update)
The equilibrium – the decision sets in which both Russia and the EU are guaranteed to lose the least – is a situation in which both states reduce energy trade immediately. Europe needs to cut off the revenues that fuel the Russian war machine while Russia needs to punish and deter Europe now while it still has massive energy leverage (top left quadrant, circled). Once Europe diversifies away, Russia loses its leverage. If Europe does not diversify immediately, Russia can punish it severely by cutting off energy before it is prepared. Russian energy weaponization is especially useful ahead of any ceasefire talks in Ukraine. Russia aims for Ukrainian military neutrality and a permanently weakened Ukrainian state. To that end it is seizing territory for the Luhansk and Donetsk People’s Republics, seizing the southern coastline and strategic buffer around Crimea, and controlling the mouth of the Dnieper river so that Ukraine is forever hobbled (Map 1). Once it achieves these aims it will want to settle a ceasefire that legitimizes its conquests. But Ukraine will wish to continue the fight. Map 1Russian Invasion Of Ukraine, 2022
Energy Cutoff Continues (GeoRisk Update)
Energy Cutoff Continues (GeoRisk Update)
Russia will need leverage over Europe to convince the EU to lean on Ukraine to agree to a ceasefire. Something similar occurred in 2014-15 when Russia collaborated with Germany and France to foist the Minsk Protocols onto Ukraine. If Russia keeps energy flowing to EU, the EU not only gets a smooth energy transition away from Russia but also gets to keep assisting Ukraine’s military effort. Whereas if Russia imposes pain on the EU ahead of ceasefire talks, the EU has greater interest in settling a ceasefire. Finally, given Russia’s difficulties on the battlefield, its loss of European patronage, and potential NATO enlargement on its borders, Moscow is highly likely to open a “new front” in its conflict with the West. Josef Stalin, for example, encouraged Kim Il Sung to invade South Korea in 1950. Today Russia’s options lie in the Middle East and North Africa – the regions where Europe turns for energy alternatives. Not only Libya and Algeria – which are both inherently fertile ground for Russia to sow instability – but also Iran and the broader Middle East, where a tenuous geopolitical balance is already eroding due to a lack of strategic understanding between the US and Iran. Russia’s capabilities are limited but it likely retains enough influence to ignite existing powder kegs in these areas. Bottom Line: Investors still face a few hurdles from the Ukraine war. First, the EU’s expanding energy embargo and Russian retaliation. Second, instability in the Middle East and North Africa. Hence energy price pressures will remain elevated in the short term and kill more demand, thus pushing the EU and the rest of the world toward stagflation or even recession. War Contained To Ukraine So Far … But Russia To Retaliate Over NATO Enlargement At present Russia is waging a full-scale assault on eastern and southern Ukraine, where about half of Donetsk awaits a decision (Map 2). If Russia emerges victorious over Donetsk in the summer or fall then it can declare victory and start negotiating a ceasefire. This timeline assumes that its economic circumstances are sufficiently straitened to prevent a campaign to the Moldovan border.1 Map 2Russia May Declare Victory If It Conquers The Rest Of Donetsk
Energy Cutoff Continues (GeoRisk Update)
Energy Cutoff Continues (GeoRisk Update)
There are still ways for the Ukraine war to spill over into neighboring areas. For example, the Black Sea is effectively a Russian lake at the moment, which prevents Ukrainian grain from reaching global markets where food prices are soaring. Eventually the western maritime powers will need to attempt to restore freedom of navigation. However, Russia is imposing a blockade on Ukraine, has more at stake there than other powers, and can take greater risks. The US and its allies will continue to provide Ukraine with targeting information against Russian ships but this assistance could eventually provoke a larger naval conflict. Separately, the US has agreed to provide Ukraine with the M142 High Mobility Artillery Rocket System (HIMARS), which could lead to attacks on Russian territory that would prompt a ferocious Russian reaction. Even assuming that the Ukraine war remains contained, Russia’s strategic conflict with the US and the West will remain unresolved and Moscow will be eager to save face. Russian retaliation will occur not only on account of European energy diversification but also on account of NATO enlargement. Finland and Sweden are attempting to join NATO and as such the West is directly repudiating the Putin regime’s chief strategic demand for 22 years. Finland shares an 830 mile border with Russia, adding insult to injury. The result will be another round of larger military tensions that go beyond Ukraine and prolong this year’s geopolitical risk and uncertainty. Russia’s initial response to Finland’s and Sweden’s joint application to NATO was to dismiss the threat they pose while drawing a new red line. Rather than forbidding NATO enlargement, Russia now demands that no NATO forces be deployed to these two states. This demand, which Putin and other officials expressed, may or may not amount to a genuine Russian policy change. Russia’s initial responses should be taken with a grain of salt because Turkey is temporarily blocking Finland’s and Sweden’s applications, so Russia has no need to respond to NATO enlargement yet. But the true test will come when and if the West satisfies Turkey’s grievances and Turkey moves to admit the new members. If enlargement becomes inevitable, Russia will respond. Russia will feel that its national security is fundamentally jeopardized by Sweden overturning two centuries of neutrality and Finland reversing the policy of “Finlandization” that went so far in preventing conflict during the Cold War. Chart 4Military Balances Stacking Up Against Russia
Energy Cutoff Continues (GeoRisk Update)
Energy Cutoff Continues (GeoRisk Update)
Russia’s military options are limited. Russia has little ability to expand the war and fight on multiple fronts judging by the army’s recent performance in Ukraine and the Red Army’s performance in the Winter War of 1939. This point can be illustrated by taking the military balance of Russia and its most immediate adversaries, which add up to about half of Russian military strength even apart from NATO (Chart 4). Russian armed forces already demonstrated some pragmatism in April by withdrawing from Kyiv and focusing on more achievable war aims. Unless President Putin turns utterly reckless and the Russian state fails to restrain him, Russia will opt for defensive measures and strategic deterrence rather than a military offensive in the Baltics. Hence Russia’s military response will come in the form of threats rather than outright belligerence. However, these threats will probably include military and nuclear actions that will raise alarm bells across Europe and the United States. President Dmitri Medvedev has already warned of the permanent deployment of nuclear missiles in the Kaliningrad exclave.2 This statement points to only the most symbolic option of a range of options that will increase deterrence and elevate the fear of war. Otherwise Russia’s retaliation will consist of squeezing global energy supply, as discussed above, including by opening a new front in the Middle East and North Africa. Instability should be expected as a way of constraining Europe and distracting America. Higher energy prices may or may not convince the EU to negotiate better terms with Russia but they will sow divisions within and among the allies. Ultimately Russia is highly unlikely to sacrifice its credibility by failing to retaliate for the combination of energy embargo and NATO enlargement on its borders. Since its military options are becoming constrained (at least its rational ones), its economic and asymmetrical options will grow in importance. The result will be additional energy supply constraints. Bottom Line: Even assuming that the war does not spread beyond Ukraine – likely but not certain – global financial markets face at least one more period of military escalation with Russia. This will likely include significant energy cutoffs and saber-rattling – even nuclear threats – over NATO enlargement. China’s Political Situation Has Not Normalized China continues to suffer from a historic confluence of internal and external political risk that will cause negative surprises for investors. Temporary improvements in government policy or investor sentiment – centered on a relaxation of “Zero Covid” lockdowns in major cities and a more dovish regulatory tone against the tech giants – will likely be frustrated, at least until after a more dovish government stance can be confirmed in the wake of the twentieth national party congress in October or November this year. At that event, Chinese President Xi Jinping is likely to clinch another ten years in power and complete the transformation of China’s governance from single-party rule to single-person rule. This reversion to autocracy will generate additional market-negative developments this year. It has already embedded a permanently higher risk premium in Chinese financial assets because it increases the odds of policy mistakes, international aggression, and ultimately succession crisis. The most successful Asian states chose to democratize and expand free markets and capitalism when they reached a similar point of economic development and faced the associated sociopolitical challenges. But China is choosing the opposite path for the sake of national security. Investors have seen the decay of Russia’s economy under Putin’s autocracy and would be remiss not to upgrade the odds of similarly negative outcomes in China over the long run as a result of Xi’s autocracy, despite the many differences between the two countries. China’s situation is more difficult than that of the democratic Asian states because of its reviving strategic rivalry with the United States. US Secretary of State Antony Blinken recently unveiled President Biden’s comprehensive China policy. He affirmed that the administration views China as the US’s top strategic competitor over the long run, despite the heightened confrontation with Russia.3 The Biden administration has not eased the Trump administration’s tariffs or punitive measures on China. It is unlikely to do so during a midterm election year when protectionist dynamics prevail – especially given that the Xi administration will be in the process of reestablishing autocracy, and possibly repressing social unrest, at the very moment Americans go to the polls. Re-engagement with China is also prohibited because China is strengthening its strategic bonds with Russia. President Biden has repeatedly implied that the US would defend Taiwan in any conflict with China. These statements are presented as gaffes or mistakes but they are in fact in keeping with historical US military actions threatening counter-attack during the three historic Taiwan Strait crises. The White House quickly walks back these comments to reassure China that the US does not support Taiwanese independence or intend to trigger a war with China. The result is that the US is using Biden’s gaffe-prone personality to reemphasize the hard edge (rather than the soft edge) of the US’s policy of “strategic ambiguity” on Taiwan. US policy is still ambiguous but ambiguity includes the possibility that a president might order military action to defend Taiwan. US attempts to increase deterrence and avoid a Ukraine scenario are threatening for China, which will view the US as altering the status quo and penalizing China for Russia’s actions. Beijing resumed overflights of Taiwan’s air defense identification zone in the wake of Biden’s remarks as well as the decision of the US to send Senator Tammy Duckworth to Taiwan to discuss deeper economic and defense ties. Consider the positioning of US aircraft carrier strike groups as an indicator of the high level of strategic tensions. On January 18, 2022, as Russia amassed military forces on the Ukrainian border – and the US and NATO rejected its strategic demands – the US had only one publicly acknowledged aircraft carrier in the Mediterranean (the USS Harry Truman) whereas it had at least five US carriers in East Asia. On February 24, the day of Russia’s invasion of Ukraine, the US had at least four of these carriers in Asia. Even today the US has at least four carriers in the Pacific compared to at least two in Europe – one of which, notably, is in the Baltics to deter Russia from attacking Finland and Sweden (Map 3). The US is warning China not to take advantage of the Ukraine war by staging a surprise attack on Taiwan. Map 3Amid Ukraine War, US Deters China From Attacking Taiwan
Energy Cutoff Continues (GeoRisk Update)
Energy Cutoff Continues (GeoRisk Update)
Of course, strategic tensions are perennial, whereas what investors are most concerned about is whether China can secure its economic recovery. The latest data are still disappointing. Credit growth continues to falter as the private sector struggles with a deteriorating demographic and macroeconomic outlook (Chart 5). The credit impulse has entered positive territory, when local government bonds are included, reflecting government stimulus efforts. But it is still negative when excluding local governments. And even the positive measure is unimpressive, having ticked back down in April (Chart 6). Chart 5Credit Growth Falters Amid Economic Transition
Credit Growth Falters Amid Economic Transition
Credit Growth Falters Amid Economic Transition
Chart 6Silver Lining: Credit Impulse Less Negative
Silver Lining: Credit Impulse Less Negative
Silver Lining: Credit Impulse Less Negative
Bottom Line: Further monetary and fiscal easing will come in China, a source of good news for global investors next year if coupled with a broader policy shift in favor of business, but the effects will be mixed this year due to Covid policy and domestic politics. Taken together with a European energy crunch and Middle Eastern oil supply disruptions, China’s stimulus is not a catalyst for a sustainable global equity market rally this year. South Asia: Inflation Hammers Sri Lanka And Pakistan Since 2020 we have argued that the global pandemic would result in a new wave of supply pressures and global social unrest. High inflation is blazing a trail of destruction in emerging markets, notably in South Asia, where per capita incomes are low and political institutions often fragile. Chart 7South Asia: Surging Inflation
Energy Cutoff Continues (GeoRisk Update)
Energy Cutoff Continues (GeoRisk Update)
Sri Lanka has been worst affected (Chart 7). Inflation surged to an eye-watering 34% in April and is expected to rise further. Surging inflation has affected Sri Lanka disproportionately because its macroeconomic and political fundamentals were weak to begin with. The tourism-dependent Sri Lankan economy suffered a body blow from terrorist attacks in 2019 and the pandemic in 2020-21. Then 2022 saw a power struggle between Sri Lanka’s President Gotabaya Rajapaksa and members of the national assembly including Prime Minister (PM) Mahinda Rajapaksa. The crisis hit a crescendo when the country defaulted on external debt obligations last month. These events weigh on Sri Lanka’s ability to transition from a long civil war (1983-2009) to a path of sustained economic development. While the political crisis has seemingly stabilized following the appointment of new Prime Minister Ranil Wickremesinghe, we remain bearish on a strategic time horizon. This is mainly because the new PM is unlikely to bring about structural solutions for Sri Lanka’s broken economy. Moreover, Sri Lanka holds more than $50 billion of foreign debt, or 62% of GDP. Another country that has been dealing with political instability alongside high inflation in South Asia is Pakistan, where inflation hit a three-year high in April (see Chart 7 above). The latest twist in Pakistan’s never-ending cycle of political uncertainty comes from the ousted Prime Minister Imran Khan. The former PM, who commands an unusual popular support group due to his fame as a cricketer prior to entering politics, is demanding fresh elections and otherwise threatening to hold mass protests. Pakistan’s new coalition government and Prime Minister Shehbaz Sharif, who came to power amid parliamentary intrigues, are refusing elections and ultimatums. From a structural perspective Pakistan is characterized by a weak economy and an unusually influential military. Now it faces high inflation and rising food prices – indeed it is one of the countries that is most dangerously exposed to the Russia-Ukraine war as it depends on these two for over 70% of its grain imports. Bottom Line: MSCI Sri Lanka has underperformed the MSCI EM index by 58.3% this year to date. Pakistan has underperformed the same index by 41.6% over the same period. Against this backdrop, we remain strategic sellers of both bourses. Instability in these countries is also one of the factors behind our strategic assessment of India as a country with a growing domestic policy consensus. South Asia: India’s Fiscal Populism And Geopolitics Inflation is less rampant in India, although still troublesome. Consumer prices nearly jumped to an 8-year high in April (see Chart 7). With a loaded state election calendar due over the next 12-18 months, the jump in inflation naturally triggered a series of mitigating policy responses. Ban On Wheat Exports: India produces 14% of the world’s wheat and 11% of grains, and exports 5% and 7%, respectively. India’s exports could make a large profit in the context of global shortages. But Prime Minister Narendra Modi is entering into the political end of the business cycle, with key state elections due that will have an impact on the ruling party’s political standing two years before the next federal election. He fears political vulnerability if exports continue amid price pressures at home. The emphasis on food security is typical but also bespeaks a lack of commitment to economic reform. Chart 8India's Real Interest Rates Fall
India's Real Interest Rates Fall
India's Real Interest Rates Fall
Surprise Rate Hikes: The Reserve Bank of India (RBI) increased the policy repo rate by 40 basis points at an unscheduled meeting on May 4, thereby implementing its first rate hike since August 2018. With real rates in India lower than those in China or Brazil (Chart 8), the RBI will be forced to expedite its planned rate hikes through 2022. Tax Cuts On Fuel: India’s central government also announced steep cuts in excise duty on fuel. This is another populist measure that reduces political pressures but fails to encourage the private sector to adjust. These measures will help rein in inflation but the rate hikes will weigh on economic growth while the tax cuts will add to India’s fiscal deficit. Indeed, India is resorting to fiscal populism with key state elections looming. Geopolitical risk is less of a concern for India – indeed the Ukraine war has strengthened its bargaining position. In the short run, India benefits from the ability to buy arms and especially cheap oil from Russia while the EU imposes an embargo. But over the long run its economy and security can be strengthened by greater interest from the US and its allies, recently highlighted by the fourth meeting of the Quadrilateral Security Dialogue (Quad) and the launch of the US’s Indo-Pacific Economic Framework (IPEF). These initiatives are modest but they highlight the US’s need to replace China with India and ASEAN over time, a trend that no US administration can reverse now because of the emerging Russo-Chinese strategic alliance. At the same time, the Quad underscores India’s maritime interests and hence the security benefits India can gain from aligning its economy and navy with the other democracies. Bottom Line: Fiscal populism in the context of high commodity prices is negative for Indian equities. However, our views on Russia, the Middle East, and China all point to a sharper short-term spike in commodity prices that ultimately drives the world economy deeper into stagflation or recession. Therefore we are booking a 22.5% profit on our tactical decision to go long Brazilian financials relative to Indian equities. Matt Gertken Chief Geopolitical Strategist mattg@bcaresearch.com Ritika Mankar, CFA Editor/Strategist ritika.mankar@bcaresearch.com Chart 9Russia: GeoRisk Indicator
Russia: GeoRisk Indicator
Russia: GeoRisk Indicator
Chart 10Other Measures Of Russian Geopolitical Risk
Other Measures Of Russian Geopolitical Risk
Other Measures Of Russian Geopolitical Risk
Chart 11China: GeoRisk Indicator
China: GeoRisk Indicator
China: GeoRisk Indicator
Chart 12United Kingdom: GeoRisk Indicator
United Kingdom: GeoRisk Indicator
United Kingdom: GeoRisk Indicator
Chart 13Germany: GeoRisk Indicator
Germany: GeoRisk Indicator
Germany: GeoRisk Indicator
Chart 14France: GeoRisk Indicator
France: GeoRisk Indicator
France: GeoRisk Indicator
Chart 15Italy: GeoRisk Indicator
Italy: GeoRisk Indicator
Italy: GeoRisk Indicator
Chart 16Canada: GeoRisk Indicator
Canada: GeoRisk Indicator
Canada: GeoRisk Indicator
Chart 17Spain: GeoRisk Indicator
Spain: GeoRisk Indicator
Spain: GeoRisk Indicator
Chart 18Australia: GeoRisk Indicator
Australia: GeoRisk Indicator
Australia: GeoRisk Indicator
Chart 19Taiwan: GeoRisk Indicator
Taiwan: GeoRisk Indicator
Taiwan: GeoRisk Indicator
Chart 20Korea: GeoRisk Indicator
Korea: GeoRisk Indicator
Korea: GeoRisk Indicator
Chart 21Turkey: GeoRisk Indicator
Turkey: GeoRisk Indicator
Turkey: GeoRisk Indicator
Chart 22South Africa: GeoRisk Indicator
South Africa: GeoRisk Indicator
South Africa: GeoRisk Indicator
Chart 23Brazil: GeoRisk Indicator
Brazil: GeoRisk Indicator
Brazil: GeoRisk Indicator
Footnotes 1 Recent diplomatic flaps between core European leaders and Ukrainian President Volodymyr Zelensky reflect Ukraine’s fear that Europe will negotiate a “separate peace” with Russia, i.e. accept Russian territorial conquests in exchange for economic relief. 2 Dmitri Medvedev explicitly states ‘there can be no more talk of any nuclear-free status for the Baltic - the balance must be restored’ in warning Finland and Sweden joining NATO. Medvedev is suggesting that nuclear weapons will be placed in this area where Russia has its Kaliningrad exclave sandwiched between Poland and Lithuania. Guy Faulconbridge, ‘Russia warns of nuclear, hypersonic deployment if Sweden and Finland join NATO’, April 14, 2022, Reuters. 3 See Antony J Blinken, Secretary of State, ‘The Administration’s Approach to the People’s Republic of China’, The George Washington University, Washington D.C., May 26, 2022, state.gov. Additionally, see President Joe Biden’s remarks on China and getting involved military to defend Taiwan in a joint press conference with Japan’s Prime Minister Kishida Fumio. ‘Remarks by President Biden and Prime Minister Kishida Fumio of Japan in Joint Press Conference’, Akasaka Palace, Tokyo, Japan, May 23, 2022, whitehouse.gov. Strategic Themes Open Tactical Positions (0-6 Months) Open Cyclical Recommendations (6-18 Months) Regional Geopolitical Risk Matrix Section III: Geopolitical Calendar
Listen to a short summary of this report. Executive Summary Recession Checklist
Monthly Portfolio Update: Recession Or No Recession?
Monthly Portfolio Update: Recession Or No Recession?
US stocks were down almost 20% at their lowest point in May. Any lower and they would be pricing in recession. Central banks will raise rates to or above neutral to ensure that inflation comes back down to their targets. This will cause growth to slow. Markets will now start to worry more about faltering growth than about high inflation. In our recession checklist (see Table), no indicator is yet pointing to recession, but some may do so soon. The jury is likely to be out for some time on whether there will be a recession in the next 12-18 months. In the meantime, equities are likely to move sideways, amid high volatility.
Monthly Portfolio Update: Recession Or No Recession?
Monthly Portfolio Update: Recession Or No Recession?
Bottom Line: Investors should stay cautiously positioned for now, with only a neutral weighting in equities, and tilts towards more defensive markets and sectors. We recommend a large holding in cash to allow for funds to be redeployed quickly when there is a better entry-point. The narrative driving global markets has shifted from worries about inflation, to fretting about the risk of recession. Although headline inflation remains high (8.3% year-on-year in the US and 8.1% in the eurozone), inflation pressures have clearly peaked (for now, at least): Broad measures, such as the US trimmed-mean PCE, have started to ease significantly (Chart 1). Recommended Allocation
Monthly Portfolio Update: Recession Or No Recession?
Monthly Portfolio Update: Recession Or No Recession?
Chart 1Inflationary Pressures Are Starting To Ease
Monthly Portfolio Update: Recession Or No Recession?
Monthly Portfolio Update: Recession Or No Recession?
But now signs are emerging of a slowdown in economic growth. The Citigroup Economic Surprise Indexes in all the major regions have turned down (Chart 2), and global industrial production is falling year-on-year (albeit partly because of lingering supply-side bottlenecks) (Chart 3). Chart 2Global Growth Is Turning Down
Global Growth Is Turning Down
Global Growth Is Turning Down
Chart 3IP Growth Has Turned Negative
IP Growth Has Turned Negative
IP Growth Has Turned Negative
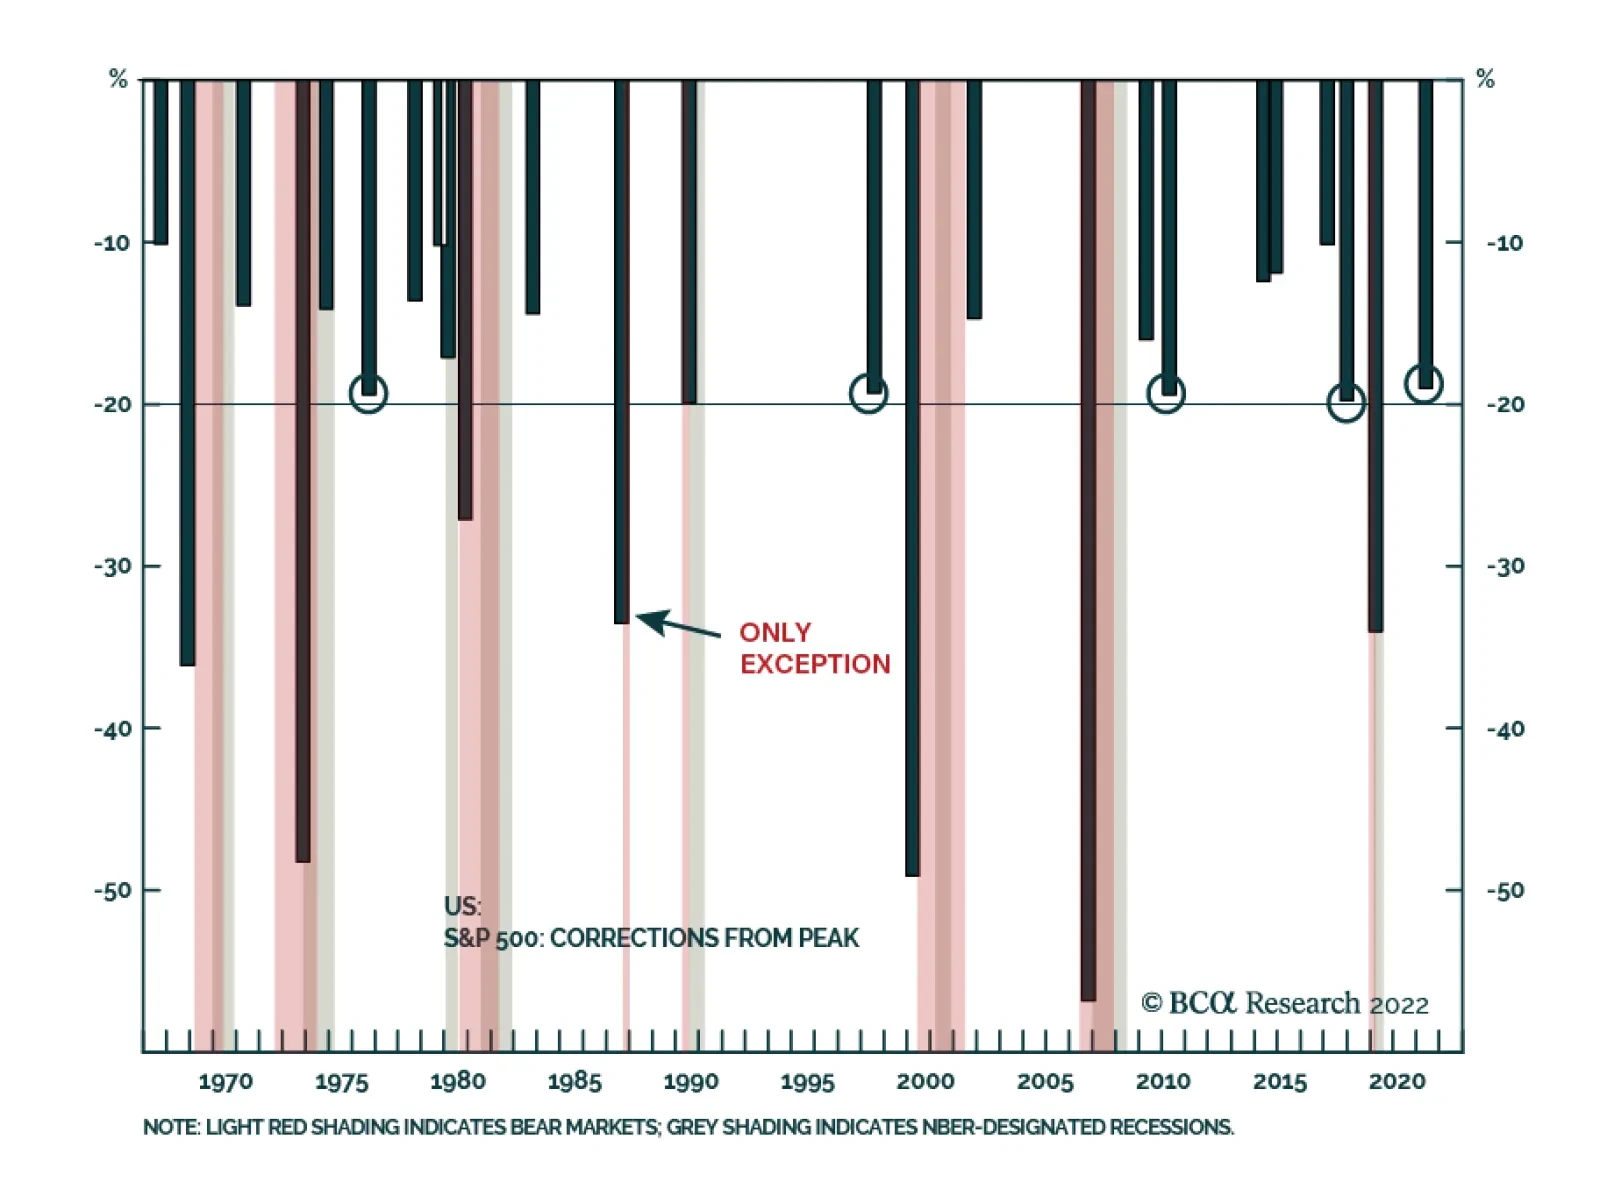
Equity markets – with US stocks down 19% from their peak to the May low, and global stocks 17% – are pricing in a slowdown, but not yet a recession. As we have often argued, it is almost unheard of to have a bear market (defined as a greater than 20% decline in US stocks) without a recession – the last time that happened was in 1987 (and all on one day, Black Monday) (Chart 4). Note from the chart how often stocks correct by 19-20%, on concerns about recession, without tipping into a bear market. That is where we stand today. Chart 4US Stocks Don't Fall More Than 20% Without A Recession
US Stocks Don't Fall More Than 20% Without A Recession
US Stocks Don't Fall More Than 20% Without A Recession
Table 1Recession Checklist
Monthly Portfolio Update: Recession Or No Recession?
Monthly Portfolio Update: Recession Or No Recession?
So the key question is: Will we have a recession over the next 12-18 months? We have dug out the recession checklist we last used in 2019 (Table 1). While none of the indicators are yet clearly pointing to recession, several may do so by year-end (Chart 5). And there are a number of warning signs starting to flash. The US housing market – the most interest-rate sensitive part of the economy – could soon see home prices falling, after the 200 BPs rise in the 30-year mortgage rate since the start of the year (Chart 6). Wages have failed to rise in line with inflation, which has led to retail sales falling year-on-year in real terms (Chart 7). And there are even some signs that companies are slowing their hiring, presumably on worries about the durability of the recovery: In the latest ISM surveys, the employment component fell to close to 50 (Chart 8). Chart 5Some Recession Indicators Look Worrying
Some Recession Indicators Look Worrying
Some Recession Indicators Look Worrying
Chart 6Housing Is The Most Vulnerable Sector
Housing Is The Most Vulnerable Sector
Housing Is The Most Vulnerable Sector
Chart 7Real Retail Sales Are Falling
Real Retail Sales Are Falling
Real Retail Sales Are Falling
Chart 8Signs That Companies Are Growing Wary Of Hiring?
Signs That Companies Are Growing Wary Of Hiring?
Signs That Companies Are Growing Wary Of Hiring?
The strongest argument against there being a recession is the $2.2 trillion of excess savings held by US households (and $5 trillion among households in all major developed economies). The argument is that, even if interest rates rise and real wage growth is negative, consumers can continue to spend by dipping into these accumulated savings. But there are some problems here. The savings are highly concentrated among the rich, who have a lower propensity to spend (Chart 9). Because of “mental accounting” biases, people may think only of current income, not savings, when considering how much to spend. And, as spending shifts back from goods to services, now that pandemic rules are largely over (Chart 10), spending on manufactured products is likely to fall below trend (since many purchases were brought forward). But it is hard to catch up on previously missed services spending (you can’t take three vacations this year to make up for those you missed in 2020 and 2021), and so services spending will, at best, only return to trend. Chart 9The Rich Have All The Money
The Rich Have All The Money
The Rich Have All The Money
Chart 10Can Services Take Over From Goods Spending?
Can Services Take Over From Goods Spending?
Can Services Take Over From Goods Spending?
Meanwhile, central banks will be focused on fighting inflation. All of them are expected to take rates to or above neutral over the next 12 months (Chart 11) – implying a squeeze on aggregate demand. Although inflation may be peaking, it is still well above most central banks’ comfort zones. In the US, for example, the FOMC expects core PCE to ease to 4.1% by year-end and 2.6% by end-2023, but that is still higher than its 2% target. The Fed is likely to remain focused on the upside risks to inflation: From rising services prices (Chart 12), and the risk of a price-wage spiral (Chart 13). BCA Research’s bond strategists expect the Fed to hike by 50 BPs at each of the next two meetings (in June and July), and then to revert to 25 BPs a meeting, as long as it is clear by then that inflation is trending down.1 Chart 11Rates Are Going To Or Above Neutral Everywhere
Rates Are Going To Or Above Neutral Everywhere
Rates Are Going To Or Above Neutral Everywhere
Chart 12Inflation Risks: Rising Services Prices...
Inflation Risks: Rising Services Prices...
Inflation Risks: Rising Services Prices...
Our conclusion is that the jury is out on the probability of recession – and is likely to stay out for a while. So far this year, equities and bonds have both performed poorly – with a 60:40 equity/bond portfolio producing the worst start to a year in three decades (Chart 14). Equities have wobbled because of tight monetary policy and worries about slowing growth; bonds because of inflation concerns. This is likely to remain the case until there is more clarity about the risk of recession. In this environment, we expect global equities to move sideways, with significant volatility – falling on signs of weakening growth, but rallying on hopes that the Fed may change its course.2 Chart 13...And A Price-Wage Spiral
...And A Price-Wage Spiral
...And A Price-Wage Spiral
Chart 14Nowhere To Hide This Year
Nowhere To Hide This Year
Nowhere To Hide This Year
We continue, therefore, to recommend fairly cautious portfolio positioning, with a neutral weight in global equities (and a preference for defensive country and sector allocations). Investors should keep a healthy holding in cash, giving them dry powder to use when a better entry-point into risk assets presents itself. Fixed Income: Bond yields have fallen over the past month, with the US 10-year Treasury yield slipping to 2.8% from 3.1% in early May. As per BCA Research’s Golden Rule of Bond Investing, the level of yields will be determined by whether the Fed (and other central banks) surprise dovishly or hawkishly relative to market expectations (Chart 15).3 The Fed is likely to hike slightly less this year than the market is pricing in, but may continue to raise rates beyond mid-2023, compared to a market expectation of rate cuts then (see Chart 11, panel 1 above). This points to the 10-year yield remaining broadly flat for the rest of this year, but possibly rising after that. Historically, rates tend to peak in line with trend nominal GDP growth (Chart 16). This means that, if the expansion continues for another couple of years, the 10-year yield could reach 4%. We, therefore, recommend an underweight on bonds. However, government bonds do now represent a good hedge again, with strong capital gain in the event of recession (Table 2). We recommend a neutral weight on government bonds within the fixed-income category. Chart 15The Golden Rule Of Bond Investing
The Golden Rule Of Bond Investing
The Golden Rule Of Bond Investing
Chart 16Rates Tend To Peak In Line With Trend Nominal GDP Growth
Rates Tend To Peak In Line With Trend Nominal GDP Growth
Rates Tend To Peak In Line With Trend Nominal GDP Growth
Table 2Government Bonds Now Offer Good Returns In A Recession
Monthly Portfolio Update: Recession Or No Recession?
Monthly Portfolio Update: Recession Or No Recession?
Chart 17Credit Now Offers Attractive Valuations
Monthly Portfolio Update: Recession Or No Recession?
Monthly Portfolio Update: Recession Or No Recession?
The recent rise in credit spreads has opened some opportunities. Valuations for both investment-grade (IG) and high-yield (HY) bonds are now attractive again, with all but the highest-quality bonds trading at a breakeven spread higher than the long-run median (Chart 17). The likelihood of defaults is rising, however, so we lower our weighting in HY (whilst remaining slightly overweight) and raise the weight in IG, also to a small overweight. We fund this by cutting our recommendation in Emerging Market debt to underweight. Credit, especially in the US, now offers tempting returns as long as the economy avoids recession, and is a relatively low-risk way to gain exposure to upside surprises. Chart 18US Performance Has Lagged This Year
US Performance Has Lagged This Year
US Performance Has Lagged This Year
Equities: US relative equity performance has been a little disappointing year-to-date, dragged down by the performance of the IT sector (Chart 18). Nonetheless, we stick to our overweight, given the market’s lower beta and the likely greater resilience of the US economy. Among sectors, we raise our weighting in Energy to overweight from neutral. Our energy strategists recently lifted their forecast for end-2022 Brent crude to $120 from $90, and raise the possibility of even $140 (see below for more on why). Despite the sharp outperformance of Energy stocks over the past six months, the sector has barely registered net inflows – presumably because of ESG (Chart 19). As we argued in a recent report, oil producers could be the new “sin stocks”, making the sector attractive over the next few years to investors who do not have ethical restraints on investing in it. We fund the overweight in Energy by lowering our weighting in Industrials to neutral. Capex is a late-cycle play and capital-goods makers benefited as manufacturers rushed to increase production during the recent consumer boom. But signs are now emerging that companies are becoming more cautious on capex (Chart 20). Chart 19Weak Flows Into The Energy Sector Despite Strong Performance
Monthly Portfolio Update: Recession Or No Recession?
Monthly Portfolio Update: Recession Or No Recession?
Chart 20Companies Are Becoming More Cautious On Capex
Companies Are Becoming More Cautious On Capex
Companies Are Becoming More Cautious On Capex
Commodities: China’s growth remains very weak and, although commodity prices have started to fall (with copper down 9% and iron ore 11% in Q2), they have not yet caught up with the slowdown in Chinese imports (Chart 21). The key question is whether China will now roll out a big stimulus. Given the government’s determination to persevere with the zero-Covid policy, and its need to achieve the 5.5% GDP growth target this year, it will eventually have no choice. But it is reluctant to trigger another housing boom, and there are doubts about how effective stimulus would be given the property market’s dysfunction. For now, we remain cautious on the Materials sector, and on commodities as an alternative asset – though the long-term structural story (because of the build-out of alternative energy) remains strong. Oil and natural-gas prices are likely to remain high due to disruptions in supply from Russia. Russia will probably have to shut 1.6 m b/d of production following the EU embargo on Russian oil imports. The EU is rushing to build up natural-gas inventories before the winter, in case Russia bans gas exports to Europe in retaliation (Chart 22). Higher oil prices are positive for the Energy sector, and for countries such as Canada (whose equity market we raise to neutral, funding this by trimming the overweight in the US). Chart 21Commodity Prices Dragged Down By Weak Chinese Growth
Commodity Prices Dragged Down By Weak Chinese Growth
Commodity Prices Dragged Down By Weak Chinese Growth
Chart 22The EU Will Need To Buy Lots Of Natural Gas
Monthly Portfolio Update: Recession Or No Recession?
Monthly Portfolio Update: Recession Or No Recession?
Currencies: Momentum, cyclical factors, and interest-rate differentials still favor the US dollar. Although the Fed will not raise rates quite as much as futures are pricing in, other central banks – especially the ECB and the Reserve Bank of Australia – will miss by more (Table 3). Nevertheless, the USD looks very overvalued (Chart 23) and speculators are long the currency. This means that, once global growth bottoms, there could be a sharp depreciation in the dollar. We remain neutral on the USD. Our preferred defensive currency is the CHF, since the other usual safe haven, the JPY, will remain depressed if, as we expect, the Bank of Japan persists with its yield curve control, limiting the 10-year JGB yield to 0.25%. Table 3Most Central Banks Will Not Hike As Much As Futures Predict
Monthly Portfolio Update: Recession Or No Recession?
Monthly Portfolio Update: Recession Or No Recession?
Chart 23US Dollar Is Very Overvalued
US Dollar Is Very Overvalued
US Dollar Is Very Overvalued
Garry Evans, Senior Vice President Global Asset Allocation garry@bcaresearch.com Footnotes 1 Please see US Bond Strategy Report, “Echoes Of 2018” dated May 24, 2022. 2 BCA Research’s US equity strategists call this a “Fat and Flat” market. Please see “What Is Next For US Equities? They Will Be Fat And Flat”. 3 Please see “Updating Our Global Golden Rule Of Bond Investing As Inflation Momentum Peaks” for an explanation of how the Golden Rule works in different countries. Recommended Asset Allocation Model Portfolio (USD Terms)
After having faced strong selling pressures since the beginning of the year, Chinese stocks have stabilized in recent weeks. Investor sentiment towards Chinese stocks appears to be improving amid positive policy developments. Authorities have rolled out…
Executive Summary Inflationary Pressures To Fade
Inflationary Pressures To Fade
Inflationary Pressures To Fade
The biggest problem for the European economy is surging inflation. Inflation has eroded household real disposable income and is hurting consumption. Inflation is set to roll over this summer, which should allow European economies to begin recovering in the fourth quarter of 2022. The ECB is likely to pause after exiting negative interest rates in Q3. European credit is becoming more attractive, but the risks to our view of European growth could still cause major problems for this asset class. Swiss stocks are vulnerable to a pullback relative to German ones. In France, President Emmanuel Macron is likely to get a legislative majority in June. Bottom Line: European growth should recover after inflation rolls over this summer. The peak in inflation will allow the ECB to pause after its deposit rate gets to zero. Despite this positive view, the large risks hanging over Europe suggest prudence is still warranted. European assets are rebounding in conjunction with the decline in risk aversion visible around global markets. The euro is catching a welcome bid too. However, as we wrote last week, while the conditions are falling in place to see a rally in Europe, too many risks continue to lurk in the background. Therefore, we maintain our conservative approach to European markets, and we still recommend a defensive portfolio. Related Report European Investment StrategyDon’t Be A Hero To shift to a less defensive stance, we want first to observe a peak in European inflation. Inflation represents the greatest problem for the European economy. If inflation continues to surge, the purchasing power of households will deteriorate further and the ECB will ratchet up its hawkish rhetoric, which will cause considerable mayhem in the European economy. A Reprieve For Europe? Only when the income suppressing impact of inflation recedes will European growth strengthen. Chart 1Paying More For The Same
Paying More For The Same
Paying More For The Same
Higher prices continue to hurt European consumption. As witnessed in the US, European retail sales are rising in nominal terms (Chart 1). However, households are not consuming more; they are spending more to purchase the same amount of goods, which is illustrated by the stagnation in retail sales volumes over the past twelve months. Households are not increasing the size of their consumption baskets, because their incomes are not keeping up with inflation. Unlike in the US, Eurozone households never saw their real disposable income spike during the pandemic because European governments focused on preserving jobs rather than distributing large handouts to households. As a result, European real disposable income began to lag its pre-pandemic trend (Chart 2). As the economy recovered, disposable income did not converge back to trend. Now that food and energy prices have spiked, the gap between real disposable income and its trend is only widening. Wages are not coming to the rescue either. The European labor market has been incapable of generating the same kind of wage growth that the US labor market has enjoyed. Even the recent uptick in negotiated wages is not as strong as it seems. German workers benefited from a one-off payment that caused wages to spike by 6.7%, elevating the Euro Area average to 2.8% from 1.6%. However, without that adjustment, German underlying wage growth fell from 3.9% to 1.6% (Chart 3), which means that the underlying European wage only rose by 2%. Chart 2Inflation Destroys Purchasing Power
Inflation Destroys Purchasing Power
Inflation Destroys Purchasing Power
Chart 3Not As Strong As It Seems
Not As Strong As It Seems
Not As Strong As It Seems
The distinction between one-off payments and underlying wages matters. As per Milton Friedman’s permanent income hypothesis, households are unlikely to shift their consumption pattern based on a temporary boost to income. They will save it, or in today’s case, use their one-off payment to cover their food and energy price increases. If today’s wage boost is not repeated, but inflation remains elevated, consumption will suffer. Europe’s tourism industry would be another major beneficiary from the peak in inflation. Prior to the pandemic, tourism contributed to 13%, 14% and 9% of the Italian, Spanish, and French economies, respectively. This sector was decimated during the pandemic after travel came to a halt. We are seeing positive signs emerge on this front. In the spring of 2021, nights spent at hotels were 80% below their spring 2019 levels for the Euro Area (Chart 4). As of March 2022, this variable is now between 15% and 30% below their March 2019 levels in Italy and France, respectively. Moreover, Google Mobility indices for the retail and recreation sectors have almost fully recovered (Chart 5). Thus, we can expect these trends to gather steam once inflation slows, because it will free up household disposable income. Europe’s periphery is particularly well placed to benefit from this eventual positive development. Chart 4Improving Tourism Sector
Improving Tourism Sector
Improving Tourism Sector
Chart 5Mobility Pick-Up
Mobility Pick-Up
Mobility Pick-Up
Positively, European inflation will peak soon. Commodity prices remain elevated, but commodity inflation has decelerated significantly. Hence, the commodity impulse is consistent with an imminent decline in Euro Area HICP (Chart 6). A simulation using BCA’s Commodity & Energy forecast for Brent, which also assumes that European natural gas prices will continue to hover around EUR100/MWh and that EUR/USD will hit 1.1 by year-end, confirms that energy inflation will swoon (Chart 7). Even if we assume a sudden surge in energy prices due to a Russian natural gas cutoff, energy inflation will recede in the second half of 2022 after spiking this summer. Chart 6Peak Inflation?
Peak Inflation?
Peak Inflation?
Chart 7Beware The Russia Cutoff Risk
Beware The Russia Cutoff Risk
Beware The Russia Cutoff Risk
Chart 8Less Pressure From The Consumer Of Last Resort
Less Pressure From The Consumer Of Last Resort
Less Pressure From The Consumer Of Last Resort
Beyond the energy market, global forces also point toward a peak in European inflation in the coming months. The surge in US goods consumption over the past 24 months was felt globally and generated inflationary pressures in Europe as well. However, US durable goods consumption is declining (Chart 8). As a result, this important driver of European inflation will recede. Bottom Line: European consumption will not recover until inflation peaks. Without a deceleration in inflation, household disposable income will remain weak and consumers will remain careful. The good news is that European inflation is still on track to begin its descent this summer, which will boost the prospect for consumer spending and tourism. ECB Update: A Fall Pause? In a blog post last Monday, ECB president Christine Lagarde confirmed that the central bank will lift interest rates in July and will push the deposit rate to zero by September. Chart 9Too Much Priced In
Too Much Priced In
Too Much Priced In
The economy is likely able to handle those two rate hikes. Our ECB monitor highlights the need to remove monetary accommodation in the Eurozone (Chart 9). Moreover, the German 2-/10-year yield curve has steepened this year, despite the hawkish shift in the ECB’s rhetoric, which confirms that monetary conditions are extremely accommodative. We expect the ECB to pause its rate hike campaign after exiting negative rates this fall to reassess economic conditions. Constraints on the ECB remain potent. If the central bank ignores these limiting factors, a policy mistake will ensue. Inflation is likely to decelerate by the end of the summer, which will undercut the hawks driving the consensus at the Governing Council today. Inflation is the factor pushing the ECB Monitor higher right now, not growth conditions (Chart 9, second panel). Thus, the case for lifting rates will weaken considerably when inflation slows. Growth is unlikely to have recovered enough by September to justify additional rate hikes after inflation slows. The expected improvement in consumption and household finances discussed earlier will be embryonic by the end of the summer and will not offer a clear case to lift rates further. Instead, the ECB will still have to juggle the tightening in financial conditions created by wider bond spreads in the European periphery and the impact of China’s slowdown on European exports. Meanwhile, capex is unlikely to strengthen meaningfully as long as global trade softens. As a result, we stay long the June 2023 Euribor futures. An extended pause after the September meeting will prevent the ECB from hiking rates as much as money markets expect over the coming twelve months (Chart 9, bottom panel). If the ECB goes ahead and continues to lift rates in the fall and early winter, the European economy will weaken considerably more and the previous rate hikes will have to be undone. Both scenarios are bullish for the June 2023 Euribor contract. Bottom Line: The ECB is likely to pause after pushing its deposit rate to zero in the third quarter in order to reassess economic conditions. Inflation is the main factor behind higher rates, and it will peak this summer. Meanwhile, the economy is still not strong enough to justify significantly higher interest rates. The market’s pricing in the ESTR curve is much too aggressive considering this context. Stay long June 2023 Euribor futures. Credit Update: Don’t Be A Hero Chart 10Cautious In Absolute Terms, Positive On Relative Performance
Cautious In Absolute Terms, Positive On Relative Performance
Cautious In Absolute Terms, Positive On Relative Performance
Credit markets are experiencing a second episode of spread widening this year. The first episode was triggered by the invasion of Ukraine by Russia. The current one reflects strong inflation, weaker growth prospects, and the ECB’s policy shift. Year-to-date, European investment grade and high-yield corporate bond option-adjusted spreads have widened by 74bps and 188bps, respectively (Chart 10, top panel). As we wrote last week, if the global economic situation were to stabilize, then European assets would be a buy at current levels. This is especially true for European credit. Beyond attractive valuations, corporate bond issuers’ balance sheets are in good shape and the default risk is low. However, the same risks that prevent us from being buyers of the euro and European stocks today also hang over the credit market. Specifically, a further deterioration of the energy flows between Russia and the EU and/or a policy mistake, whereby the ECB delivers the seven rate hikes priced in the overnight index swap market, would cause spreads to widen meaningfully from their current elevated levels. Therefore, we recommend investors remain on the sidelines and wait for a safer entry point over the coming weeks. Once inflation has peaked and stagflation/recession fears recede, then credit spreads will have ample room to narrow, especially if the ECB decides to pause after lifting the deposit rate to 0% (Chart 10, second panel). In the meantime, expected policy rate differentials are still supportive of an overweight on European credit relative to US credit (Chart 10, bottom panel). Bottom Line: European spreads are most likely peaking. However, the same risks that hang over EUR/USD and European equities prevent us from buying this asset class just yet. Swiss Stocks Are Getting Expensive Chart 11Swiss Stocks Getting Ahead Of Earnings
Swiss Stocks Getting Ahead Of Earnings
Swiss Stocks Getting Ahead Of Earnings
The defensive Swiss market has greatly outperformed its Euro Area counterpart this year. However, the recent bout of Swiss outperformance has been completely dissociated from the trend in Swiss EPS relative to those of the Euro Area (Chart 11). Now, Swiss equities are particularly expensive and sport multiples 45% greater than the P/E ratio of the Eurozone MSCI benchmark. This bifurcation between the relative performance of Swiss stocks and their relative earnings represents a trading opportunity. Specifically, Swiss shares look vulnerable against German ones, which have been seriously beaten down in recent years. Chart 12Priced For The Apocalypse
Priced For The Apocalypse
Priced For The Apocalypse
Swiss stocks have been re-rated on the back of many forces. First, the valuations of Swiss stocks relative to German ones have risen in tandem with the Eurozone’s headline and core inflation (Chart 12, top and second panel). Swiss relative valuations have also benefited from the significant tailwind created by higher 2-year rates in the Eurozone (Chart 12, third panel) and from the weakness in the euro (Chart 12, fourth panel). Finally, Swiss relative valuations seem to have already priced in a significant deterioration in European manufacturing activity, which would have lifted their appeal as a defensive play (Chart 12, bottom panel). We recommend selling Swiss stocks against German ones. We anticipate European inflation to peak this summer. Our ECB view is consistent with a decline in Germany’s 2-year bond yields. We also expect the euro to bottom and, even though we have written about a deterioration in European manufacturing activity, the recent explosion of Swiss multiples relative to German ones looks overdone. This trade may be seen as our first attempt to dip our toe into cyclical assets, even if we generally favor capital preservation over risk taking at this juncture. Bottom Line: The outperformance of Swiss equities is overextended and is already pricing in a dire outcome for European economies. Selling Swiss shares relative to German stocks is an attractive way to add tentatively some risk to a European portfolio. France Update: Likely Legislative Majority For Macron Chart 13French Polls Suggest Macron Will Get His Legislative Majority
Looking Beyond Europe’s Inflation Peak
Looking Beyond Europe’s Inflation Peak
President Emmanuel Macron’s political party, Renaissance (previously En Marche!), may surprise to the upside in this year’s legislative election. An aggregate of recent polls (Chart 13) suggests that the presidential coalition (which includes Renaissance and its allies) will obtain between 295 and 340 seats in the Assemblée Nationale, more than the 289 seats needed to achieve a majority. The odds of seeing an historically low voter turnout should also play in the French president’s favor. Chart 14Favor French Small-Caps & Avoid Consumer Stocks
Favor French Small-Caps & Avoid Consumer Stocks
Favor French Small-Caps & Avoid Consumer Stocks
Macron will not have to compromise to build a coalition in favor of his reform agenda, which bodes well for French productivity and trend growth. This election should not have an impact on French assets beyond that. We continue to recommend investors favor French small-caps, as they will benefit from an improvement in domestic consumer confidence and an eventual strengthening in the euro (Chart 14). Meanwhile, we still see more downside for French consumer stocks (Chart 14, bottom panel). Mathieu Savary, Chief European Strategist Mathieu@bcaresearch.com Jeremie Peloso, Editor/Strategist JeremieP@bcaresearch.com Tactical Recommendations Cyclical Recommendations Structural Recommendations
Executive Summary Equities Are Closer To Capitulation
What Is Next For US Equities? They Will Be Fat And Flat
What Is Next For US Equities? They Will Be Fat And Flat
The market appears to be moving away from concerns about inflation toward worries about slowing growth. The initial stage of the sell-off in risky assets, pricing in tighter monetary policy, may now be complete. The next and final stage of the bear market will be pricing in a global growth slump. Slowing growth is not yet built into consensus expectations, neither for earnings nor GDP – downgrades and negative surprises are in store. The US consumers are under duress and are unlikely to lend a “spending hand” to support economic growth. Inflation is easing. Positive inflation surprises will ignite powerful rallies but are unlikely to alter the trajectory of monetary policy. The Fed “put” is no longer at play – falling equities will help the Fed tame inflation via the “wealth effect”. The next chapter for the market is down but in a “fat and flat” manner, with “growth disappointment” equity sell-off being punctuated by short-lived rallies on hopes that the Fed may change its course. Our updated Equities Capitulation Scorecard is marginally more positive on equities but is still signaling that not all conditions for a sustainable rebound are yet met. Bottom Line: Repricing of tighter monetary policy is likely complete. The next leg down for equities will be pricing in slower economic growth and a potential earnings recession. We expect the market to be “fat and flat” over the next few months, i.e., alternating between pullbacks and short-lived rallies. Monetary Tightening Is Probably Priced In Until now, the sell-off in equity markets was a repricing of tighter monetary conditions. One may argue that most of the damage has been done: Since the beginning of the year, the NASDAQ is down 30% while the S&P is down 20%. Nearly 34% of stocks in the S&P 500, and 14% of stocks in the NASDAQ are trading below their 200-day moving average. Does this mean that the sell-off is over and that hawkish Fed fears are overdone? After all, over the past few days, Fed rate expectations appear to have topped out (Chart 1), and Treasury yields have come down 37 bps from their recent peak to 2.75% (Chart 2). Monetary conditions have tightened substantially year to date, although more tightening is still on the way (Chart 3). The Citi Inflation Surprise Index has turned decisively down (Chart 4) and some of the series most affected by supply chain bottlenecks, such as shipping costs, have been deflating. Chart 1Fed Rate Expectations Have Stabilized
Fed Rate Expectations Have Stabilized
Fed Rate Expectations Have Stabilized
Chart 2Treasury Yield Has Come Down
Treasury Yield Has Come Down
Treasury Yield Has Come Down
Chart 3Financial Conditions Are Getting Tighter
Financial Conditions Are Getting Tighter
Financial Conditions Are Getting Tighter
Chart 4Inflation Is Starting To Surprise To The Downside
Inflation Is Starting To Surprise To The Downside
Inflation Is Starting To Surprise To The Downside
Is it clear sailing for longer-duration assets like growth equities? Not so fast: While much adversity has been priced in, a sustainable rebound in equities is probably still elusive. Worries About Economic Growth Are Starting To Dominate The Market Narrative We posit that long-term rates have come down because the markets have moved on from worries about raging inflation and the hawkish Fed to concerns about a downshift in growth both in the US and globally. As such, both earnings and economic growth disappointments are on the cards, potentially leading the markets down further. Overall, the next phase of the sell-off in global risk assets will likely be characterized by heightened growth worries. This phase will also mark the final chapter of this bear market. Thunder Clouds On The Horizon During the J.P. Morgan Investor Day, Jamie Dimon, in his otherwise upbeat speech, said that there are “thunder clouds on the horizon.” Indeed, the list of investor concerns is long: A global growth slowdown, build-up of inventories, inflation damaging consumer purchasing power, the soaring costs of raw materials, declining corporate profitability, tightening monetary conditions and, to top it all, a stronger dollar. However, from Dimon’s standpoint, these are just that: Clouds that could dissipate at any time. Of course, there is always a chance that things will turn out better than expected, and a “softish landing” is on the cards. We hope Dimon is right… Economic Growth Surprises To The Downside For now, our working assumption is that the economy is still strong, but growth is decelerating. To us, this is a story about the second derivative. The troubling part is that slowing growth is not yet built into consensus expectations: It is confounding that GDP growth forecasts have still barely budged from the beginning of the year and do not yet reflect all the headwinds listed above (Chart 5). Moreover, the Q1-2022 GDP revision has shown that growth was weaker than initially reported, with the latest reading of -1.5%, growth reduced by investments weaker than initially anticipated. The Atlanta Fed Nowcast GDP tracker points to only 1.8% annualized growth in Q2-2022. Elevated expectations are setting investors up for disappointment, which will lead to the next leg of the sell-off. The Citigroup Economic Surprise Index has recently shifted into negative territory (Chart 6). Chart 5GDP Forecasts Need To Be Revised Down Further
GDP Forecasts Need To Be Revised Down Further
GDP Forecasts Need To Be Revised Down Further
Chart 6Economic Data Disappoints
Economic Data Disappoints
Economic Data Disappoints
What is the evidence of slowing growth? Walking down the main street of any major city and seeing restaurants overflowing with customers and people buzzing in and out of shops, one may think that the economy is booming. Yet, there is plenty of evidence to the contrary. The ISM PMI is on a downward trajectory, hitting 55 in May, which was also 2.4 points below consensus. The S&P Global (former Markit) May flash PMI readings have also declined from 59.2 in April to 57.5 in May. This is hardly surprising: As night follows day, monetary tightening leads to slowing growth (Chart 7). Inventory overhang: It is noteworthy that the ISM PMI new orders-to-inventories ratio (NOI) is in a free-fall: It is foreshadowing further weakness in manufacturing activity as demand for durable goods is fading (Chart 8). May durable goods orders were also soft. Chart 7Monetary Tightening Leads To Slower Growth
Monetary Tightening Leads To Slower Growth
Monetary Tightening Leads To Slower Growth
Chart 8Inventories Are Building Up
Inventories Are Building Up
Inventories Are Building Up
Freight volumes are also contracting, pointing to weakening growth, and are consistent with the NOI ratio (Chart 9). Global growth is also slowing as evidenced by the contraction in global trade volumes (Chart 10): US and European demand for goods ex-autos is shrinking following the pandemic binge, while China’s recovery has been delayed. Chart 9Freight Volumes Also Point To Weaker Growth
Freight Volumes Also Point To Weaker Growth
Freight Volumes Also Point To Weaker Growth
Chart 10Global Export Volumes Are Set To Shrink
Global Export Volumes Are Set To Shrink
Global Export Volumes Are Set To Shrink
Economic growth is slowing, and more negative surprises are in store. Earnings Growth Expectation Have Gotta Come Down While the stock market is not the economy, they are closely intertwined. One of the key differences between the two, however, is that the US economy is dominated by services, while the S&P 500 has higher exposure to goods. With the current demand for services outstripping demand for goods, the economy should fare better than the market (Chart 11). Therefore, it does not bode well for S&P 500 earnings expectations that the Q1-2022 GDP revision flagged earnings contracting 2.3% on a quarter-on-quarter basis, under the weight of slowing sales and rising costs. And while the S&P 500 Q1-22 results were just fine, the ratio of negative/positive guidance for Q2-22 was roughly two to one. Slowing growth at home and abroad, rising costs of raw materials and wages, as well as fading demand for goods will weigh on earnings over the balance of the year (Chart 12). Chart 11Slowing Growth Will Weigh On Earnings
Slowing Growth Will Weigh On Earnings
Slowing Growth Will Weigh On Earnings
Chart 12US EPS Expectations Have Not Yet Been Downgraded
US EPS Expectations Have Not Yet Been Downgraded
US EPS Expectations Have Not Yet Been Downgraded
Also, there is the not-so-small issue of a strong dollar, which has gained nearly 13% since January 2021. This makes US goods more expensive and also reduces companies’ bottom lines via the currency translation effect. According to our rough estimates, every percentage change in the USD reduces earnings growth by roughly 33 bps, i.e., 4.3% off earnings caused by the entire dollar move. We expect slower top-line growth and shrinking profit margins to translate into flat to negative real earnings growth over the next 12 months. Importantly, US economic growth does not need to contract for a profit recession to take hold. However, S&P 500 EPS expectations have not yet been downgraded and 12-month forward EPS growth expectations are at about 10%; despite the recent market rout, US stocks have not yet priced in negative profit growth. However, either downgrades or earnings disappointments are coming, neither of which bodes well for US equity performance. Earnings growth expectations need to come down to reflect reality on the ground. Valuations Are Only Optically Cheap And one more salient point: If earnings expectations are set to unrealistically high levels, then the recent forward multiple of the S&P 500 is not 17x, but 2 to 3 points higher, and, voilà, US equities no longer look cheap. Will US Consumers Save The Day? Perhaps things are not as dire as we describe. After all, US consumers are healthy, their balance sheets are pristine, and retail sales look good. There is also the not-so-small issue of $2.2 trillion in excess savings. This argument rings true. Chart 13Negative Real Wage Growth Is Sapping Consumer Confidence
Negative Real Wage Growth Is Sapping Consumer Confidence
Negative Real Wage Growth Is Sapping Consumer Confidence
However, inflation continues to put pressure on US consumers. Negative real wage growth is sapping their confidence (Chart 13) and is cutting into their purchasing power. Soaring inflation also makes people concerned about the future as they watch their life savings melt away. Underwhelming reports from Walmart and Target are cases in point: Lower-income consumers are shifting spending away from discretionary items and towards necessities. Strong reports from Dollar General and Family Dollar indicate that many Americans are price sensitive and are shopping around. Home Depot commented that fewer customers walked through its doors (but the ones that did, tended to spend more in nominal terms). And retail sales are reported in nominal terms: Rising prices inflate growth rates. Indeed, excess savings may help achieve the “soft landing.” However, there are early signs that either many lower-income Americans have spent the money, or their savings accounts are earmarked for a rainy day, and many people aim to spend only what they earn. However, higher-income Americans are still willing to spend, but this group is shifting spending away from goods and towards services, which is consistent with strong results from the US airline carriers, which report a significant gain in pricing power. A similar message came from both Nordstrom and Macy’s. Clearly, American consumers are highly heterogeneous, and there is a significant bifurcation between “haves” and “have nots.” It is, however, concerning that many of the wealthier Americans have lost a significant percentage of their nest eggs in the stock market. The theory goes that the wealth effect is one of the main mechanisms through which monetary tightening affects consumer demand (Chart 14). It stands to reason that it is only a matter of time (unless the stock market rebounds) before even the wealthier cohorts start tightening their belts, dampening demand for consumer services. Chart 14Nest Eggs Are Dwindling
Nest Eggs Are Dwindling
Nest Eggs Are Dwindling
Another obvious implication is the effect of dwindling investments on the housing market: Americans are watching their down payments disappear, with cash buyers subject to the same negative forces. The US consumer is under duress, and the more embedded the inflation and the deeper the market rout, the greater proportion of the US population is affected, making them less and less likely to lend a “spending hand” to support economic growth. Inflation Will Turn: Too Little, Too Late One may also argue that inflation will turn, which would help both the economy and the markets, and will reset the Fed trajectory. Inflation will come down assisted by the arithmetic of the base effect. Supply chain bottlenecks are clearing, shipping costs are coming down, and demand is weakening – all of these developments point to inflation coming down over the next few months. However, this process may be rather slow: Inflation permeates the entire economy (Chart 15), and there are also signs that a vicious wage-price spiral is taking hold (Chart 16). Therefore, inflation is unlikely to revert to levels that the Fed and the US consumer will consider acceptable any time soon. Chart 15Inflation Is Broad-based And It Will Take Time For It To Revert To Acceptable Levels
Inflation Is Broad-based And It Will Take Time For It To Revert To Acceptable Levels
Inflation Is Broad-based And It Will Take Time For It To Revert To Acceptable Levels
Chart 16Wage-Price Spiral Is Taking Hold
Wage-Price Spiral Is Taking Hold
Wage-Price Spiral Is Taking Hold
Just recently, Fed Chairman Jerome Powell reiterated the Fed’s commitment to hiking interest rates until core consumer price inflation gets closer to 2%. Notably, in his speech at a WSJ event on May 17, Powell noted: “This is not a time for tremendously nuanced readings of inflation… We need to see inflation coming down in a convincing way. Until we do, we’ll keep going.” Given that US core consumer price inflation is currently at around 6.2%, a mere rollover in core inflation from current levels will not be enough for the Fed to tone down its hawkishness. While we believe that the Fed will be steadfast in its objective to combat inflation, any positive news on inflation will be perceived by a hopeful market as a sign that the Fed may alter its course, which would lead to a rally, only to be punctured by the negative news from either growth or the Fed. Positive inflation surprises will ignite powerful rallies but are unlikely to alter the trajectory of monetary policy. The Fed “Put” Is No More The Fed “put” is no longer at play as the Fed has signaled that it cares far more about combating inflation than the performance of the stock market. In fact, falling equities will play into Powell’s hand as a negative wealth effect is likely to put a lid on inflationary pressures, with the wealthier Americans paying the toll. When Bad News Is Good News We make a case that disappointing growth will be the next chapter of this market saga. One might wonder if poor growth readings would actually be perceived by the market as a positive: Not only does disappointing growth put downward pressure on Treasury yields but also creates an expectation that the Fed will pause and monetary policy will end up looser than initially projected. Our take is that stable or lower rates will offer support for equities, and that is the reason why we conclude that the first stage of the repricing is complete. Will slower growth invite a more gentle and considerate Fed? We don’t think so as the Fed has already telegraphed that it now aims for a “softish landing” and that fighting inflation will incur some “pain”. Investment Implications Chart 17In 1980-82, The Market Was "Fat And Flat"
In 1980-82, The Market Was "Fat And Flat"
In 1980-82, The Market Was "Fat And Flat"
We expect the market to be “fat and flat” over the next few months, i.e., alternating between pullbacks and short-term rallies. Rallies are frequent during bear markets and other severe corrections and are generally significant in magnitude. Markets showed a similar pattern in 1980-1982 as Chairman Volker was battling inflation (Chart 17). The bull market took hold only in 1982. Rallies will follow pullbacks because the market is not yet ready for a sustainable rebound. This first leg of the correction was pricing in tighter monetary policy. The next leg down will be the market pricing in slowing growth both at home and abroad, corporate earnings disappointments, and weakening consumer demand. Over the next few months, the market is likely to trend down but in a “fat and flat” manner, with “growth disappointment” equity sell-off being punctuated by fast and furious rallies on hopes that inflation is abating, and that a gentler, data-driven Fed would be more supportive of the economy and the markets. Thus, with markets looking oversold, a short-lived rally is now likely. It will be accompanied by a change in leadership: Energy and Materials will give back gains, while Big Tech and other cyclicals will bounce. And US equities may still plumb new lows on the back of economic growth or earnings growth disappointments. The market will also not take it kindly if inflation turns out to be stickier than expected and is accompanied by slowing growth: Stagflation is one of the most challenging regimes for US equities (Chart 18). Sticky inflation would call for an even more aggressive rate hiking cycle. Chart 18Stagflation Would Be The Worst Possible Outcome For The Markets
What Is Next For US Equities? They Will Be Fat And Flat
What Is Next For US Equities? They Will Be Fat And Flat
Table 1Equities Are Closer To Capitulation
What Is Next For US Equities? They Will Be Fat And Flat
What Is Next For US Equities? They Will Be Fat And Flat
We believe that a sustainable rebound will take place once most of the negative “news” is priced in. Compared to two months ago, we conclude that the first part of the adjustment process, i.e., pricing in tighter monetary policy, has run its course. Now it is a matter of adjusting growth expectations. Our “Equities Capitulation” scorecard (“Have We Hit Rock Bottom” report), adds up to -1, a slightly less negative reading than the -2 just a few weeks ago — but a reading which still signals negative equity returns (Table 1). We conclude that staying close to the benchmark, with a small tilt towards defensive growth, remains the most sensible strategy. Bottom Line The first stage of the market correction is probably complete and tighter monetary policy is getting priced in. The next leg down for equities will be pricing in slower economic growth and a potential earnings recession. We expect the market to be “fat and flat” over the next several months as rallies ignited by soothing inflation readings are punctured by growth disappointments and a resolute Fed. Irene Tunkel Chief Strategist, US Equity Strategy irene.tunkel@bcaresearch.com Recommended Allocation Recommended Allocation: Addendum
What Is Next For US Equities? They Will Be Fat And Flat
What Is Next For US Equities? They Will Be Fat And Flat
Listen to a short summary of this report. Executive Summary US Financial Conditions Have Tightened Significantly This Year
US Financial Conditions Have Tightened Significantly This Year
US Financial Conditions Have Tightened Significantly This Year
US financial conditions have tightened by enough that the Fed no longer needs to talk up interest rate expectations. If inflation decelerates faster than anticipated over the coming months, as we expect will be the case, the Fed’s messaging will soften further. Bond yields in the US and abroad are likely to fall over the next 6-to-12 months, even if they do rise over a longer-term horizon. Stay overweight stocks, favoring non-US equities over their US peers. We are closing our short 10-year Gilts trade, initiated at a yield of 0.85%, for a gain of 7.5%. We are also opening a new trade going long Canadian short-term interest rate futures versus their US counterparts. Investors expect Canadian rates to exceed US rates in 2024, which seems unlikely to us given that the Canadian housing market is much more sensitive to higher rates than the US market. Bottom Line: After having tightened significantly over the past seven months, financial conditions should loosen modestly during the remainder of the year. This should benefit risk assets. Fed Focused on Financial Conditions Chart 1Tighter Financial Conditions Will Hurt Growth
Tighter Financial Conditions Will Hurt Growth
Tighter Financial Conditions Will Hurt Growth
Like many central banks, the Fed sees financial conditions as a key driver of the real economy. While there are many financial conditions indices (FCIs), most include bond yields, credit spreads, equity prices, and the exchange rate as inputs. Higher bond yields, wider credit spreads, lower equity prices, and a strong currency all lead to tighter financial conditions and a weaker economy, and vice versa. Goldman’s US FCI is especially popular among market participants. It is calibrated so that 100 bps in tightening corresponds, all things equal, to a 100 basis-point decline in US real GDP growth over the subsequent four quarters. The Goldman FCI has tightened by 212 bps since the start of the year and by 225 points from its loosest level in November 2021. If the historic relationship between the FCI and the economy holds, the tightening in financial conditions would be enough to push US growth to a below-trend pace by the second quarter of 2023. In fact, the tightening in the Goldman FCI over the past 12 months already suggests that the manufacturing ISM will fall below 50 (Chart 1). Along the same lines, the Chicago Fed’s Adjusted National FCI, which measures financial conditions relative to current economic conditions, has moved slightly into restrictive territory. Aside from a brief period at the outset of the pandemic, the index has been consistently in expansionary territory since early 2013 (Chart 2). Chart 2The Chicago Fed Financial Conditions Index Has Moved Into Slightly Restrictive Territory
Are Financial Conditions Tight Enough?
Are Financial Conditions Tight Enough?
Other data are consistent with the message from the FCIs. Most notably, growth estimates for the US and for other major economies have come down over the past few months (Chart 3). Economic surprise indices have also fallen, especially in the US. Chart 3AGrowth Forecasts Have Softened As Economic Data Have Surprised To The Downside (I)
Growth Forecasts Have Softened As Economic Data Have Surprised To The Downside (I)
Growth Forecasts Have Softened As Economic Data Have Surprised To The Downside (I)
Chart 3BGrowth Forecasts Have Softened As Economic Data Have Surprised To The Downside (II)
Growth Forecasts Have Softened As Economic Data Have Surprised To The Downside (II)
Growth Forecasts Have Softened As Economic Data Have Surprised To The Downside (II)
Mission Accomplished? Chart 4The Fed Expects To Lift Rates Above Its Estimate Of Neutral
The Fed Expects To Lift Rates Above Its Estimate Of Neutral
The Fed Expects To Lift Rates Above Its Estimate Of Neutral
Given the recent tightening in financial conditions and weaker growth expectations, the Fed is likely to soften its tone. Already this week, Atlanta Fed President Raphael Bostic suggested that the Fed could pause raising rates in September in order to assess the impact of the Fed’s tightening campaign. The Fed minutes also conveyed a sense of flexibility and data-dependence about the timing and magnitude of future hikes once rates reach 2%. It’s worth stressing that the Fed expects rates to rise in 2023 to about 40 bps above its estimate of the terminal rate (Chart 4). Jawboning rate expectations higher would potentially undermine the Fed’s goal of achieving a soft landing for the economy. Inflation Will Dictate How Much Easing Lies Ahead There is a big difference between not wanting financial conditions to tighten further and wanting them to loosen. The Fed would only want to see an easing in financial conditions if inflation were to fall faster than expected. Chart 5 shows how the year-over-year change in the core PCE deflator would evolve over the remainder of the year depending on different assumptions about the month-over-month change in the deflator. The Fed would be able to reach its expectation of year-over-year core PCE inflation of 4.1% for end-2022 if the month-over-month change averages 0.33%. Monthly core PCE inflation averaged 0.3% in February and March and is expected to clock in at around the same level for April once the data is released tomorrow. Chart 5AUS Inflation Will Fall By More Than The Fed Expects If The Monthly Change In Core PCE Is Less Than 0.3% (I)
US Inflation Will Fall By More Than The Fed Expects If The Monthly Change In Core PCE Is Less Than 0.3% (I)
US Inflation Will Fall By More Than The Fed Expects If The Monthly Change In Core PCE Is Less Than 0.3% (I)
Chart 5BUS Inflation Will Fall By More Than The Fed Expects If The Monthly Change In Core PCE Is Less Than 0.3% (II)
US Inflation Will Fall By More Than The Fed Expects If The Monthly Change In Core PCE Is Less Than 0.3% (II)
US Inflation Will Fall By More Than The Fed Expects If The Monthly Change In Core PCE Is Less Than 0.3% (II)
Regardless of tomorrow’s data print, as we discussed last week, we expect the monthly inflation rate to average less than 0.3 in the back half of the year. If that happens, inflation will surprise to the downside relative to the Fed’s expectations. Consistent with the observation above, market-based inflation expectations have already declined. The 5-year TIPS inflation breakeven has fallen from 3.64% in March to 2.98% at present. The widely watched 5-year/5-year forward breakeven rate is back down to 2.29%, at the bottom of the Fed’s comfort zone of 2.3%-to-2.5% (Chart 6).1 The Citi US Inflation Surprise Index has also rolled over (Chart 7). Chart 6Market-Based Inflation Expectations Have Come Down Of Late
Market-Based Inflation Expectations Have Come Down Of Late
Market-Based Inflation Expectations Have Come Down Of Late
Chart 7The US Inflation Surprise Index Has Rolled Over
The US Inflation Surprise Index Has Rolled Over
The US Inflation Surprise Index Has Rolled Over
Financial Conditions Abroad Financial conditions indices in the other major developed economies have tightened somewhat less than in the US because equities represent a smaller share of household net worth abroad and also because most currencies have weakened against the US dollar (Chart 8). Nevertheless, with growth momentum having already deteriorated sharply, central banks are signaling a more balanced approach towards policy normalization. Chart 8Financial Conditions Have Tightened More In The US Than Elsewhere This Year
Are Financial Conditions Tight Enough?
Are Financial Conditions Tight Enough?
ECB: Wait and See? In a blog post published on Monday, Christine Lagarde observed that inflation expectations have risen from pre-pandemic levels, implying that real policy rates are currently lower than they were two years ago. In her mind, this warrants ending net purchases under the Asset Purchase Programme early in the third quarter. It also warrants raising the deposit rate by 25 bps at both the July and September meetings, bringing it back to zero from -0.5% at present. Beyond then, Lagarde was circumspect about what should be done, stressing the need for “gradualism, optionality and flexibility.” She noted that “The euro area is clearly not facing a typical situation of excess aggregate demand or economic overheating … Both consumption and investment remain below their pre-crisis levels, and even further below their pre-crisis trends.” She then added: “The outlook is now being clouded by the negative supply shocks hitting the economy … households’ expectations of their future financial situation dropped to their second-lowest level on record in March and remained close to that level in April.” The market expects the ECB to raise rates by 170 bps over the next 12 months, bringing the deposit rate to 1.2% by mid-2023 (Chart 9). BCA’s Global Fixed Income team, led by Rob Robis, foresees only 50 bps of tightening over the next 12 months. Chart 9Markets Expect Rates To Rise The Most In The Anglo-Saxon World
Are Financial Conditions Tight Enough?
Are Financial Conditions Tight Enough?
The UK, Canada, and Australia: Frothy Housing Markets Will Limit Rate Hikes The Bank of England (BoE) hiked rates by 90 bps over the past 12 months. The UK OIS curve is priced for another 140 bps of rate hikes over the next year. According to the BoE’s forecasting models, this would raise the unemployment rate by two percentage points while lowering inflation to below 2% within the next two-to-three years. In our opinion, that is more tightening than the BoE would like to see. BCA’s strategists expect the BoE to deliver only another 75 bps of hikes over the next year. Chart 10Buildup In Leverage And Frothy Housing Markets Pose A Challenge To Monetary Policy In Some Developed Market Countries
Buildup In Leverage And Frothy Housing Markets Pose A Challenge To Monetary Policy In Some Developed Market Countries
Buildup In Leverage And Frothy Housing Markets Pose A Challenge To Monetary Policy In Some Developed Market Countries
The Canadian economy has been quite strong, with the unemployment rate falling to 5.2% in April, the lowest since 1974. The Canadian OIS curve is discounting 195 bps of interest rate hikes over the next 12 months, substantially more than the 150 bps of tightening our fixed income team foresees. By mid-2024, investors expect Canadian policy rates to be about 25 bps above US rates. This seems unreasonable to us, and as of this week, we are expressing this view by going long the June 2024 3-month Canadian Bankers’ Acceptance (BAX) futures contract (BAM4) versus the corresponding 3-month US SOFR futures contract (SFRM4). A more liquid option is to simply go long the 10-year Canadian government bond versus the 10-year US Treasury note. At present, Canadian 10-year government bonds are yielding 5 bps more than their US counterparts. Unlike in the US, where household debt has fallen over the past 14 years, debt in Canada has risen, fueled by a massive housing boom (Chart 10). High indebtedness and the prevalence of variable rate/short-term fixed-rate mortgages will limit the ability of the BoC to raise rates. The Australian OIS curve is currently discounting 262 bps of rate hikes over the next year which, if realized, would take the cash rate to 3.3% – a level last seen in 2013 when the neutral rate in Australia was much higher by the RBA’s own reckoning. BCA’s fixed income strategists expect only 150 bps of tightening over the next 12 months. Japan: Yield Curve Control Will Continue Chart 11Japan: Long-Term Inflation Expectations Are Far Lower Than In The Rest Of The World
Japan: Long-Term Inflation Expectations Are Far Lower Than In The Rest Of The World
Japan: Long-Term Inflation Expectations Are Far Lower Than In The Rest Of The World
The Bank of Japan expects inflation excluding fresh food prices to remain at about 2% in the second half of 2022, but then to slow to 1.1% in the fiscal year starting April 2023. The Japan OIS curve is discounting almost no tightening over the next 12 months. Long-term inflation expectations are far lower in Japan than in any other major economy, which makes ultra-low rates a necessity for the foreseeable future (Chart 11). China: Outright Easing Chart 12Covid Restrictions Have Eased Only Modestly In China
Are Financial Conditions Tight Enough?
Are Financial Conditions Tight Enough?
China faces a trifecta of problems: A weakening housing market; slowing external demand for manufactured goods; and the ongoing threat of Covid-related lockdowns. Despite a steep drop in the number of new Covid cases over the past month, China’s lockdown index has only eased modestly, as the authorities continue to fret about the next outbreak (Chart 12). The leadership in Beijing has responded with policy easing. The PBoC lowered the 5-year loan prime rate by 15 bps last week, the largest such cut since 2019. This followed a cut in the floor rate for first-home mortgages that was announced on May 15. BCA’s China strategists believe these measures will arrest the deep contraction in the property market but will not spark a full-blown recovery due to the ongoing commitment of the government to the “three red lines” policy.2 In normal times, a Chinese real estate slump would be a cause of grave concern for global investors. These are not normal times, however. Public enemy number one these days is inflation. A weaker Chinese property market would curb commodity demand, thus helping to cool inflation. That would be a welcome development for global investors. Investment Conclusions Global financial conditions have tightened to the point that betting on ever-higher rates, at least for the next 12 months, no longer makes sense. If global inflation decelerates faster than anticipated during the remainder of the year, as we expect will be the case, central banks will dial back the hawkish rhetoric. We took partial profits on our short 10-year Treasury trade earlier this month (initiated at a yield of 1.45%). As of this week, consistent with the earlier decision of BCA’s fixed income strategists to upgrade UK Gilts, we are closing our short 10-year Gilt position (initiated at a yield of 0.85%) for a gain of 7.5%. The coming Goldilocks environment of falling inflation and supply-side led growth will buttress equities. We expect global stocks to rise 15%-to-20% over the next 12 months, with non-US markets outperforming the US. Looking further out, the fate of Goldilocks will rest on where the neutral rate of interest resides. If the neutral rate in the US turns out to be substantially lower than 2.5%, then any growth recovery will falter as the lagged effects of restrictive monetary policy work their way through the economy. Conversely, if the neutral rate turns out to be substantially higher than 2.5%, then inflation will reaccelerate as the economy overheats. Given the choice, we would wager on the latter outcome. Thus, while we expect global bond yields to decline over a 12-month horizon, we foresee them rising over a 2-to-5-year time frame. Similarly, while stocks will strengthen over the next 12 months, they are likely to encounter another bout of turbulence starting late next year or in 2024 as central banks initiate a second round of rate hikes. Peter Berezin Chief Global Strategist peterb@bcaresearch.com Follow me on LinkedIn Twitter Footnotes 1 The Federal Reserve targets an average inflation rate of 2% for the Personal Consumption Expenditures (PCE) index. The TIPS breakeven is based on the CPI index. Due to compositional differences between the two indices, CPI inflation has historically averaged 30-to-50 basis points higher than PCE inflation. This is why the Fed effectively targets a CPI inflation rate of 2.3%-to-2.5%. 2 The People’s Bank of China and the housing ministry issued a deleveraging framework for property developers in August 2020, consisting of a 70% ceiling on liabilities-to-assets, a net debt-to-equity ratio capped at 100%, and a limit on short-term borrowing that cannot exceed cash reserves. Developers breaching these “red lines” run the risk of being cut off from access to new loans from banks, while those who respect them can only increase their interest-bearing borrowing by 15% at most. Global Investment Strategy View Matrix
Are Financial Conditions Tight Enough?
Are Financial Conditions Tight Enough?
Special Trade Recommendations Current MacroQuant Model Scores
Are Financial Conditions Tight Enough?
Are Financial Conditions Tight Enough?
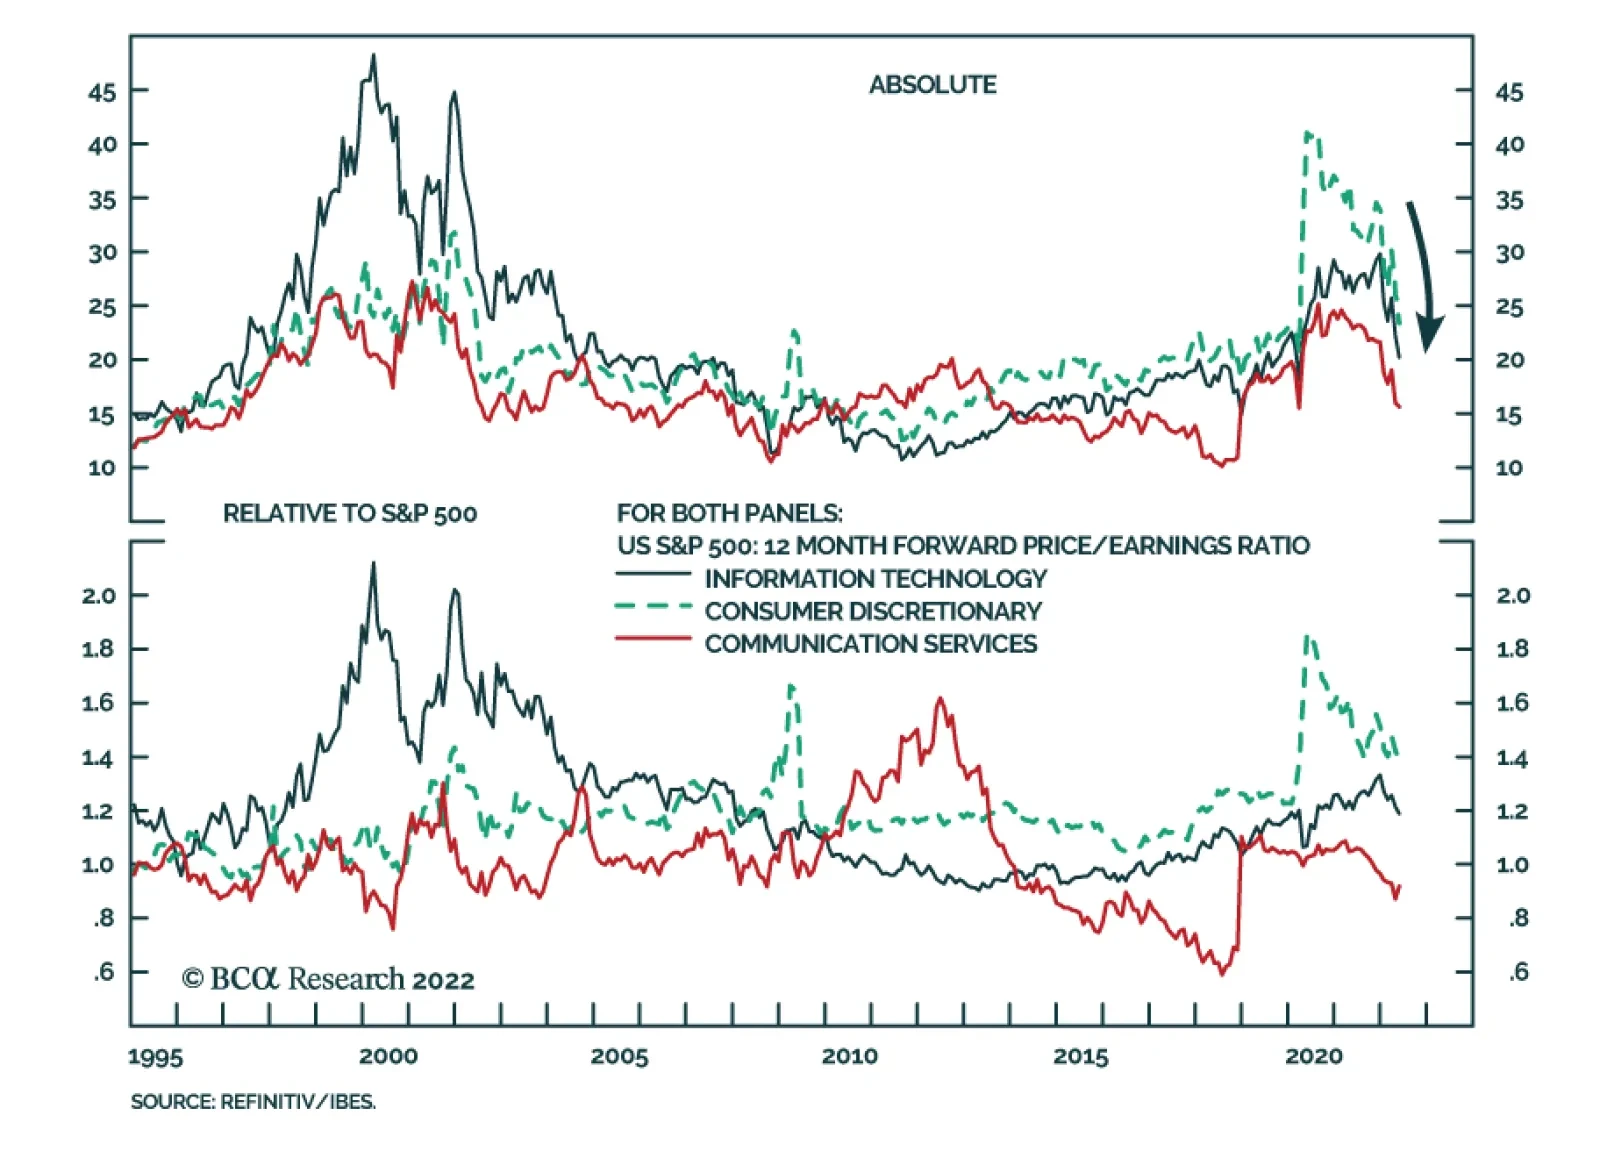
Rising bond yields have been a headwind to the performance of long-duration US tech stocks this year. Consumer Discretionary, Communication Services, and IT are the worst performing S&P 500 sectors so far in 2022. However, this negative force is now…
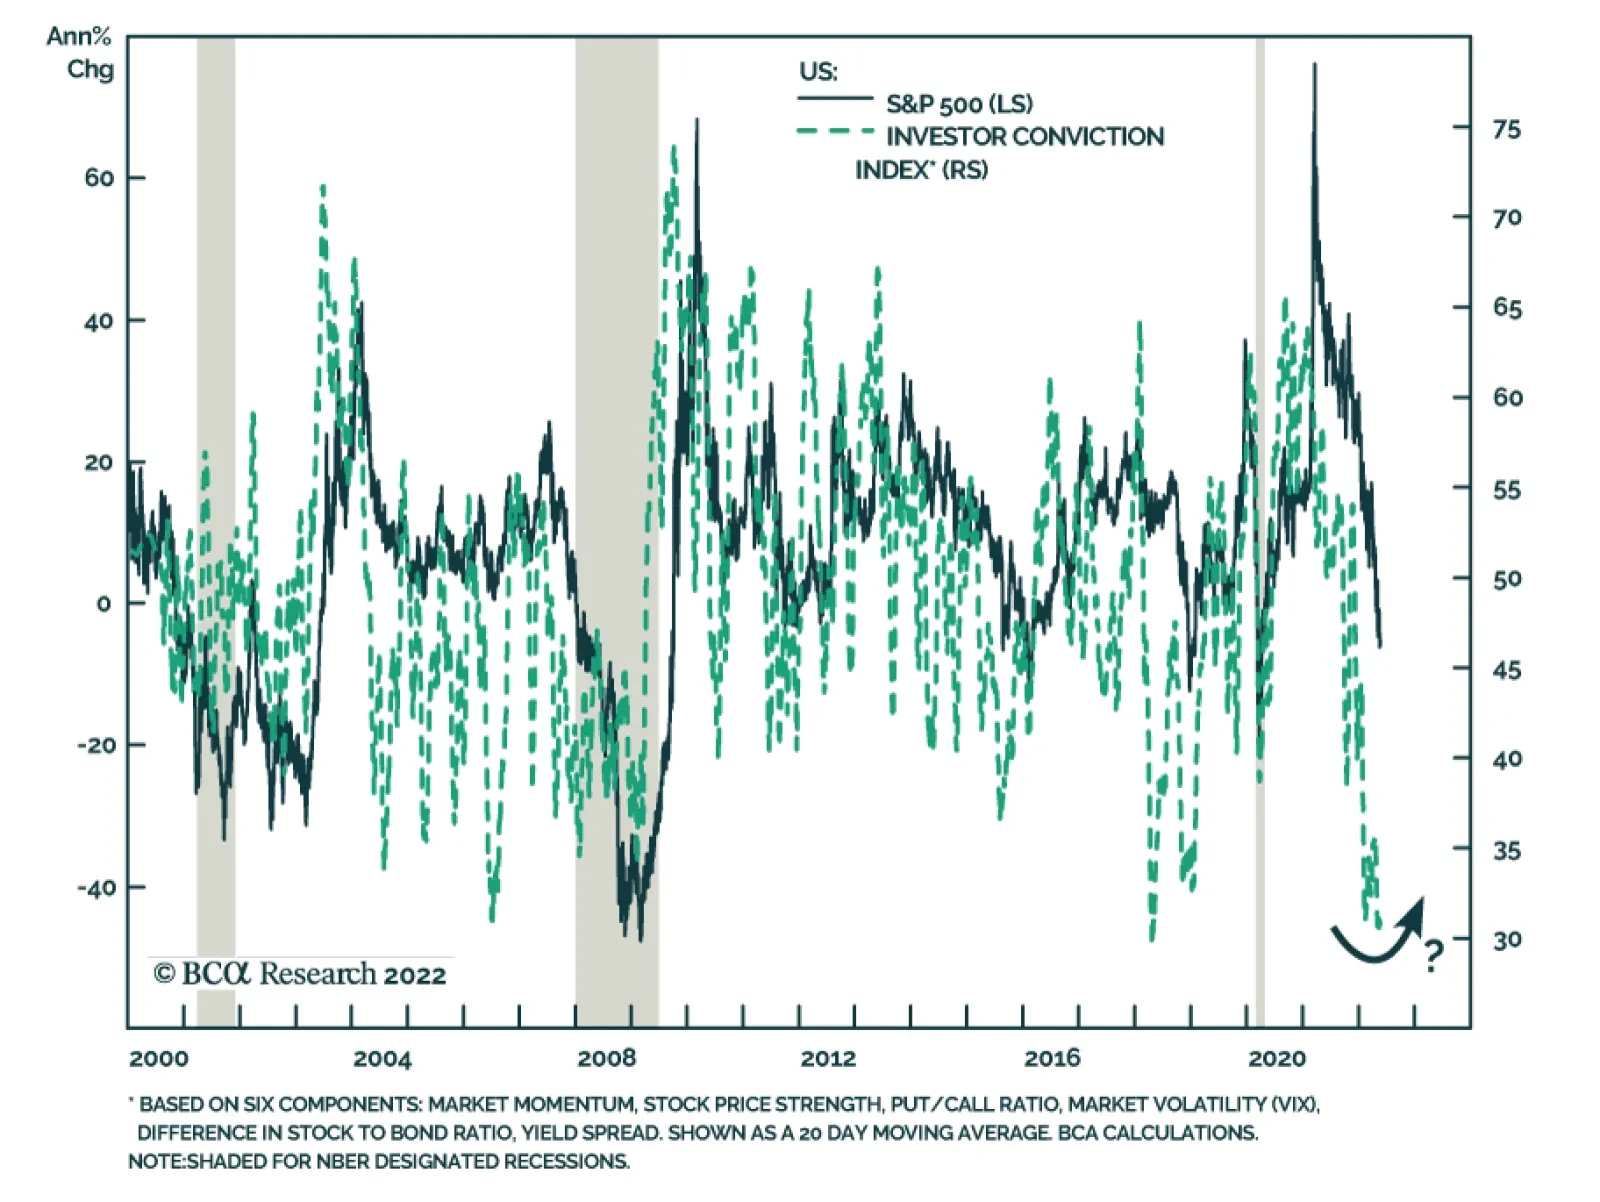
Market-based measures of investor confidence have deteriorated sharply this year. The VIX has trended higher, high-yield bond spreads have widened, and equity momentum is deteriorating. Our Investor Conviction Index – which aggregates six components to…
Highlights The Fed’s hawkish shift over the past six months has caused a sharp increase in US interest rates. In this report we examine the US housing market for signs of an imminent recession, given the housing sector’s strong interest rate sensitivity. In addition to a severe contraction in real home improvement spending, there are several other housing-related indicators that are ostensibly pointing in a bearish direction. The growth in total home sales and the MBA mortgage application purchase index are already in negative territory, housing affordability has deteriorated meaningfully, and the National Association of Home Builders’ (NAHB) housing market index is falling sharply. However, the breadth of house prices and building permits, consumer surveys, housing equity sector relative performance, and the fact that mortgage rates have likely peaked for the year point to a more optimistic outlook for housing. At a minimum, they do not yet suggest that the current slowdown in housing-related activity is recessionary. Structural factors are also supportive of the pace of housing construction in the US. While a slowdown in the housing market is clearly underway, it is not occurring after a period of excessive housing construction. The opposite is true: the US and several other developed market economies have underbuilt homes over the past decade. This should limit the drag on economic growth from housing-related activity, and reduces the odds that a housing market slowdown will morph into a housing-driven US recession. Feature Chart II-1The Fed's Hawkish Shift Has Caused An Extremely Sharp Rise In Interest Rates
The Fed's Hawkish Shift Has Caused An Extremely Sharp Rise In Interest Rates
The Fed's Hawkish Shift Has Caused An Extremely Sharp Rise In Interest Rates
The Fed’s hawkish shift over the past six months has caused US interest rates to rise at an extremely rapid pace. Panel 1 of Chart II-1 highlights that the spread between the US 2-year Treasury yield and the 3-month T-bill yield reached a 20-year high in early April of this year. Panel 2 shows that the two-year change in the 30-year mortgage rate will reach the highest level since the early 1980s by the end of this year if mortgage rates remain at their current level. Over the longer run, it is the level of interest rates that matters more than their change. However, changes in interest rates and other key financial market variables are also important drivers of economic activity, especially when they happen very rapidly. Given the speed of the recent adjustment in US interest rates, and the fact that the Fed funds rate will have likely reached the Fed’s neutral rate forecast by the end of this year, investors have understandably become concerned about the potential for a recession in the US. In this report we examine the US housing market for signs of an imminent recession, given the housing sector’s strong interest rate sensitivity. We conclude that while a slowdown in the housing market is clearly underway, several signs suggest that this slowdown is not recessionary. Investors should remain laser-focused on the pace of housing-related activity over the coming 6-12 months, but for now our assessment of the housing market is consistent with a modest overweight stance towards stocks within a multi-asset portfolio. A Brief Review Of The Housing Sector’s Contribution To Growth Table II-1 highlights the importance of the housing sector as a driver/predictor of US recessions. This table highlights that real residential investment is not a particularly important contributor to real GDP growth during nonrecessionary quarters, but it is the only main expenditure component exhibiting negative growth on average in the year prior to a recession.1 Table II-1Real Residential Investment Tends To Contract In The Year Prior To A Recession
June 2022
June 2022
When examining the contribution to economic growth from the housing sector, investors and housing market analysts often fully equate real residential investment with housing construction. In fact, while direct construction of housing units accounts for a sizeable portion of the contribution to growth from housing, it is just one of four components. This is an important point, as one of the often-overlooked elements of real residential investment has strongly leading properties and is currently providing a very negative signal about the housing sector. Chart II-2 breaks down what we consider as aggregate real “housing-related activity”, and Chart II-3 presents the contributions to annualized quarterly growth in housing activity from the four components. For the sake of completeness, we include personal consumption expenditures on furnishings and household equipment as part of housing-related activity, alongside the two main components of real residential investment: permanent site construction (including single and multi-family properties), and “other structures.” In reality, “other structures” is not predominantly accounted for by the construction of different types of residential properties; it is almost entirely composed of spending on home improvements and brokerage commissions on the sale of existing residential properties. Chart II-2Housing Construction Is An Important Part Of Residential Investment, But There Are Other Contributing Factors
June 2022
June 2022
Chart II-3Home Improvement Spending And Brokerage Commissions Also Drive Residential Investment
June 2022
June 2022
Aside from the link between existing home sales and the general demand for newly-built homes, the prominence of brokerage commissions in other residential structures investment helps explain why existing home sales are strongly correlated with real residential investment (Chart II-4, panel 1). Given that a distributed lag of monthly housing starts maps closely to permanent site construction (panel 2), starts and existing home sales explain a good portion of the contribution to growth from housing-related activity. Of the two remaining components of housing-related activity, Chart II-5 highlights that personal consumption expenditures on furniture and household equipment generally coincide with the pace of housing construction and new home sales. We take this to mean that the consumption component of housing-related activity is typically a derivative of the decision to build a new home or sell an existing one. Chart II-4Existing Home Sales Explain Commissions, And Housing Starts Explain Permanent Site Construction
Existing Home Sales Explain Commissions, And Housing Starts Explain Permanent Site Construction
Existing Home Sales Explain Commissions, And Housing Starts Explain Permanent Site Construction
Chart II-5The Pace Of Contraction In Home Improvement Spending Is Worrying
The Pace Of Contraction In Home Improvement Spending Is Worrying
The Pace Of Contraction In Home Improvement Spending Is Worrying
What is not coincident with construction and existing home sales is residential home improvement: Panel 2 of Chart II-5 highlights that it has strongly leading properties, and is currently contracting at its worst rate since the 2008 recession. Data on real home improvement spending is only available quarterly from 2002, so the ability to compare the current situation to previous housing market cycles is limited. But the pace of contraction is worrying and underscores that investors should be on the lookout for corroborating signs of a major contraction in the housing market. Is The Housing Data Sending A Recessionary Signal? In addition to the severe contraction in real home improvement spending shown in Chart II-5, there are several other housing-related indicators that are ostensibly pointing in a bearish direction. In particular, Chart II-6 highlights that both the growth in total home sales and the MBA mortgage application purchase index are already in negative territory, that housing affordability has deteriorated meaningfully, and that the National Association of Home Builders’ (NAHB) housing market index is falling sharply. However, there are also several signs pointing to a more optimistic outlook for housing, or at least indicating that the current slowdown in housing-related activity is not recessionary. We review these more optimistic indicators below. The Breadth Of House Prices And Building Permits In sharp contrast to previous periods of serious housing market weakness and/or recessionary periods, there is no sign yet of a major slowdown in US house price appreciation including cities with the weakest gains. In fact, Chart II-7 highlights that house prices have recently been reaccelerating on a very broad basis after having slowed in the second half of last year, which hardly bodes poorly for new home construction. Chart II-6A US Housing Sector Slowdown Is Certainly Underway
A US Housing Sector Slowdown Is Certainly Underway
A US Housing Sector Slowdown Is Certainly Underway
Chart II-7No Sign Yet Of A Major Deceleration In House Prices
No Sign Yet Of A Major Deceleration In House Prices
No Sign Yet Of A Major Deceleration In House Prices
It is true that US house price data is somewhat lagging, so it is quite likely that price weakness is forthcoming. However, there has been no sign of a major slowdown in prices through to March 2022, by which point 30-year mortgage rates had already risen 200 basis points from their 2021 low. More importantly, Chart II-8 highlights that a state-by-state diffusion index of authorized housing permits has done a very good job at leading the growth in permits nationwide, and is currently not pointing to a contraction in activity. Chart II-9 presents explanatory models for the growth in US housing starts and total home sales based on our state permits diffusion index, pending home sales, the change in mortgage rates, and housing affordability. The chart underscores that a contraction in housing activity is not what these variables would predict, even though starts and sales should be growing at a much more modest pace than what has prevailed on average over the past two years. Chart II-8Our Building Permits Diffusion Index Leads Housing Construction Activity, And Is Not Pointing To A Major Slowdown
Our Building Permits Diffusion Index Leads Housing Construction Activity, And Is Not Pointing To A Major Slowdown
Our Building Permits Diffusion Index Leads Housing Construction Activity, And Is Not Pointing To A Major Slowdown
Chart II-9Reliably Leading Indicators Of Construction And Home Sales Do Not Point To A Recessionary Outcome
Reliably Leading Indicators Of Construction And Home Sales Do Not Point To A Recessionary Outcome
Reliably Leading Indicators Of Construction And Home Sales Do Not Point To A Recessionary Outcome
Consumer Surveys The University of Michigan consumer survey shows that consumers feel it is the worst time to buy a home since the early-1980s (Chart II-10), which seems like a clearly negative sign for the housing market and an indication of the likely impact of tighter policy on housing-related activity. And yet, panel 2 highlights that this is the result of the fact that house prices in the US have surged during the pandemic, not that mortgage rates have risen too high. It is true that the number of survey respondents citing “interest rates are too high” is rising sharply, but this factor as a share of all “bad time to buy” reasons given is not meaningfully higher than it was in 2018, 2011, or 2006. It is clear that high prices are also the culprit for why consumers report that it is a bad time to buy large household durables and not that large household durables are unaffordable or that interest rates are too high (Chart II-11). Chart II-10Nearly The Worst Time To Buy A Home, Mostly Due To Prices (Not Interest Rates)
Nearly The Worst Time To Buy A Home, Mostly Due To Prices (Not Interest Rates)
Nearly The Worst Time To Buy A Home, Mostly Due To Prices (Not Interest Rates)
Chart II-11Same Story For Large Household Durables
Same Story For Large Household Durables
Same Story For Large Household Durables
It may seem counterintuitive for investors to see Charts II-10 and II-11 as in any way positive for the housing market. But, to us, the notion that elevated house prices are the main source of poor affordability supports the idea that a normalization of the housing market will occur through a combination of marginally lower demand, a slower pace of house price appreciation, and a sustained pace of housing market construction. This implies that existing home sales may be weaker than housing construction over the coming year, but the latter will help to support the contribution to overall economic growth from housing-related activity. Housing Sector Relative Performance Despite the significant slowdown in real home improvement spending and the recent decline in the NAHB’s housing market index, Chart II-12 highlights that home improvement retail and homebuilding stocks have not exhibited significantly negative abnormal returns over the past year – as they did in 1994/1995 and in the lead up to the global financial crisis. The chart, which presents a rolling 1-year “Jensen’s alpha” measure for both industries, attempts to capture the risk-adjusted performance of the industry versus the S&P 500. While the chart shows that both industries have generated negative alpha over the past year, the magnitude does not appear to be consistent with a recession. In the case of homebuilder stocks in particular, negative abnormal returns over the past year should have been meaningfully worse given the year-over-year change in mortgage rates. Chart II-13 highlights that homebuilder performance has not been cushioned by a deep valuation discount in advance of the rise in mortgage rates. Chart II-12Housing-Related Equity Sectors Are Not Warning Of A Housing-Driven Recession
Housing-Related Equity Sectors Are Not Warning Of A Housing-Driven Recession
Housing-Related Equity Sectors Are Not Warning Of A Housing-Driven Recession
Chart II-13Homebuilders Were Not Excessively Cheap Before Mortgage Rates Spiked
Homebuilders Were Not Excessively Cheap Before Mortgage Rates Spiked
Homebuilders Were Not Excessively Cheap Before Mortgage Rates Spiked
In short, the important takeaway for investors is that the relative performance of housing-related stocks is not yet consistent with a housing-led US recession. Mortgage Rates Are Not Restrictive, And Have Likely Peaked As we highlighted in Chart II-1, the two-year change in the US 30-year conventional mortgage rate will be the largest in history by the end of this year, save the Volcker era, if the mortgage rate remains at its current level. However, it is not just the change in interest rates that matters for economic activity, but rather also the level. Encouragingly, Chart II-14 highlights that the level of mortgage rates has not yet risen into restrictive territory relative to the economy’s underlying potential rate of growth. In addition, it appears that mortgage rates have overreacted to the expected pace of monetary tightening – and thus have likely peaked for this year. Two points support this view: First, panel 2 of Chart II-14 highlights that the 30-year mortgage rate is one standard deviation too high relative to the 10-year Treasury yield, underscoring that the former has overshot. And second, Chart II-15 highlights that the mortgage rate is still too high even after controlling for business cycle expectations, current coupon MBS yields, and bond & equity market volatility. Chart II-14Mortgage Rates Are Not Yet Restrictive, But Have Likely Peaked For The Year
Mortgage Rates Are Not Yet Restrictive, But Have Likely Peaked For The Year
Mortgage Rates Are Not Yet Restrictive, But Have Likely Peaked For The Year
Chart II-15No Matter How You Slice It, US Mortgage Rates Are Stretched
No Matter How You Slice It, US Mortgage Rates Are Stretched
No Matter How You Slice It, US Mortgage Rates Are Stretched
Structural Factors Supporting Housing Construction Chart II-16The US And Several Other DM Countries Have Underbuilt Homes Since The Global Financial Crisis
The US And Several Other DM Countries Have Underbuilt Homes Since The Global Financial Crisis
The US And Several Other DM Countries Have Underbuilt Homes Since The Global Financial Crisis
Our analysis above points to a scenario in which the housing market slows in a nonrecessionary fashion, supported by relatively buoyant construction activity. Structural factors, which are mostly a legacy of the global financial crisis, are also supportive of the pace of housing construction in the US and other developed market economies. We presented Chart II-16 in our June 2021 Special Report, which shows the most standardized measure of cross-country housing supply available for several advanced economies: the trend in real residential investment relative to real GDP over time. These series are all rebased to 100 as of 1997, prior to the 2002-2007 US housing market boom. The chart makes it clear that advanced economies generally fall into two groups based on this metric: those that have seen declines in real residential investment relative to GDP, especially after the global financial crisis (panel 1) and those that have experienced either an uptrend in housing construction relative to output or a flat trend (panel 2). The US, along with the euro area, the UK, and Japan, all belong to the first group, with commodity-producing and Scandinavian countries belonging to the second group. The point of the chart is that the US and most other major DM economies have seemingly experienced a chronic undersupply of homes in the wake of the global financial crisis, which should continue to support housing construction activity even if demand for housing is slowing because of a sharp increase in mortgage rates. Given that the trend in real residential investment to GDP is a somewhat crude metric of housing supply, Chart II-17 presents a more precise measure for the US. It shows the standardized trend in permanent site residential structures investment (both single- and multi-family) relative to both the US population and the number of households. The chart makes it clear that the US vastly overbuilt homes from the late-1990s to 2007, but also vastly underbuilt since 2008. Relative to the number of households, real permanent site residential structures investment is still half of a standard deviation below its long-term average – even after the surge in construction that occurred in 2020. Chart II-18 highlights a similar message: it shows that the US homeowner vacancy rate (the proportion of the housing stock that is vacant and for sale) was at a 66-year low at the end of the first quarter. Chart II-19 shows that the monthly supply of existing one-family homes on the market is also at a multi-decade low, but that the supply of new homes for sale spiked in April. Chart II-17More Precise Home Supply Measures Underscore That The US Needs To Build More Houses
More Precise Home Supply Measures Underscore That The US Needs To Build More Houses
More Precise Home Supply Measures Underscore That The US Needs To Build More Houses
Chart II-18The Homeowner Vacancy Rate Is Extremely Low
The Homeowner Vacancy Rate Is Extremely Low
The Homeowner Vacancy Rate Is Extremely Low
At first blush, this spike in the monthly supply of new homes relative to sales is quite concerning, as it has risen back to levels that prevailed in 2007. One point to note is that the increase in new home inventory relates to homes still under construction; the inventory of completed homes for sale remains quite low. In addition, from the perspective of a homebuilder, a rise in the monthly supply of new homes relative to home sales is only concerning if it translates into a significant increase in the amount of time to sell a completed home, as has historically been the case (Chart II-20). Chart II-19Existing Home Inventories Remain Low Relative To Sales...
Existing Home Inventories Remain Low Relative To Sales...
Existing Home Inventories Remain Low Relative To Sales...
Chart II-20...And Higher New Home Inventories Are Not Affecting Time-To-Sale Of Completed Homes
...And Higher New Home Inventories Are Not Affecting Time-To-Sale Of Completed Homes
...And Higher New Home Inventories Are Not Affecting Time-To-Sale Of Completed Homes
Chart II-20 highlights that a fairly significant divergence between these two series has emerged over the past decade. Despite roughly five-six months’ supply of new home inventory on average since 2012, the median number of months required to sell a new home rarely exceeded four. In early-2019 the monthly supply of new homes also spiked, and a relatively modest and nonrecessionary slowdown in housing starts was sufficient to prevent any meaningful rise in the amount of time required to sell a newly completed home. Notably, the models that we presented in Chart II-9 led the slowdown in total home sales and starts in late-2018/early-2019, and they are not pointing to a major contraction today. The key point for investors is that while a slowdown in the housing market is clearly underway, it is not occurring after a period of excessive housing construction. In fact, the opposite is true: despite a surge in construction during the pandemic, it remains below its historical average relative to the population and especially the number of households. This should act to limit the drag on economic growth from housing-related activity, and therefore reduces the odds that a housing market slowdown will morph into a housing-driven US recession. Investment Implications We noted in our May report that the inversion of the 2-10 yield curve has set a recessionary tone to any weakness in US macroeconomic data, and that a recession scare was likely. Recent negative housing market data surprises underscore that a slowdown in the US housing market is clearly underway, and that this will likely feed recessionary concerns for a time. Investors should continue to be highly focused on the evolution of US macro data when making asset allocation decisions over the coming 6-12 months, as the current economic and financial market environment remains highly uncertain. This should include a strong focus on the housing market, as consumer surveys highlight that the overall impact of falling real wages and high house prices could cause a more pronounced slowdown in housing-related activity than we expect – and that the change and level of interest rates would imply. Nevertheless, our analysis of the historical predictors of housing construction and sales points to the conclusion that the ongoing housing market slowdown is not likely to be recessionary in nature. This, in conjunction with the factors that we noted in Section 1 of our report, support maintaining a modest overweight towards stocks within a multi-asset portfolio over the coming 6-12 months. Jonathan LaBerge, CFA Vice President The Bank Credit Analyst Footnotes 1 This is aside from the contribution to growth from imports, which mechanically subtract from consumption and investment when calculating GDP.