Equities

Executive Summary Reporters at last week’s post-FOMC press conference were consumed by the prospect of a recession. Their questions about the economy echoed the analysts’ on bank earnings calls and Chair Powell’s answers echoed the CEOs’ and the CFOs’: while it has clearly slowed, it remains stronger than it would be in a recession. Although the Econ 101 definition of a recession – two or more quarters of contracting real GDP – is embedded in the public’s mind, the NBER’s recession criteria are more involved and do not appear as if they have yet been met. With a little over half of index constituents (~70% of market cap) having reported, S&P 500 earnings have surprised to the upside. Despite a rampaging dollar and a sharp backup in corporate bond yields, margins are down less than 60 basis points from 2Q21 and are unchanged from 1Q22. We are constructive on equities and credit over a three-to-twelve-month timeframe because we believe markets have priced in the impact of the next recession too soon. We expect the Fed will eventually induce a recession, but not for at least another year. Earnings Haven't Stumbled Yet
Earnings Have Not Stumbled Yet
Earnings Have Not Stumbled Yet
Bottom Line: Continue to overweight equities in multi-asset portfolios with a twelve-month timeframe because markets have gotten ahead of themselves by selling off so sharply. A recession will not arrive before underweight investors judged on their relative quarterly performance are forced back into stocks. Feature And we thought investors were preoccupied with recession. The questions sell-side analysts asked on big bank earnings calls in mid-July revealed that the shadow of a recession loomed large in their institutional investor clients’ minds. The questions markets and economics reporters asked Chair Powell at his post-FOMC meeting press conference last week demonstrated that the media is positively obsessed with it. If it bleeds, it leads is no longer just the local TV newscast’s mantra. We have been trying to steer the discussion away from are-we-or-aren’t-we toward questions that we think are more productive for investors. How bad will the next downturn be? What is its current estimated time of arrival? Have markets under or overreacted to our best guess about severity and ETA, assuming the marginal price setter has a timeframe of twelve months or less? Are-we-or-aren’t-we is manifestly Topic A in the financial and general media, however, so the body of this week’s report is given over to why we think we are neither in a recession nor on the cusp of one. We will turn to financial markets and investment strategy in the concluding section. What Is A Recession? In Econ 101 three-plus decades ago, I learned that a recession was defined as back-to-back quarters of economic contraction as measured by real GDP. For all the time that has passed since, I remember that definition clearly. Apparently other graduates do, too, and the definition taught in central Virginia was the standard in Economics departments across the nation. Alas, life is more complicated than it seemed in those halcyon student days. Business cycle inflections are not always apparent to the naked eye and the NBER’s Business Cycle Dating Committee has been tasked with assessing when downturns are sufficiently deep, diffuse and persistent to constitute a recession. The committee monitors a broad range of indicators and moves deliberately, announcing its determinations only after enough subsequent data have arrived to support its assessment of peaks and troughs. For the six recessions since 1980, the committee has announced cycle peaks with an average lag of seven months and cycle troughs with an average lag of fifteen months (Table 1). Table 1Long And Variable Lags
Recession Obsession
Recession Obsession
Equity and credit portfolio managers and analysts spend a lot more time on corporate earnings than GDP, so the recession debate would seem to be of interest mainly within the ivory towers of academia, think tanks and the bureaucracy. The topic is relevant for investors, however, because equity bear markets tend to coincide with recessions. As bear markets (Chart 1, light red shading) typically begin before NBER-designated recessions (gray shading) and always end before them, it is worth investors’ time to try to anticipate their onset. Since a significant portion of bear market drawdowns occur after the recession is deemed to have started, there is also value in the humbler (and more attainable) aim of recognizing a recession once it’s begun. Chart 1Bear Markets And Recessions Tend To Travel Together
Bear Markets And Recessions Tend To Travel Together
Bear Markets And Recessions Tend To Travel Together
So Has It Begun? At the risk of sounding like Jay Powell before a skeptical pool of reporters, we do not think the economy is in a recession, primarily because the labor market is so strong. Recessions always follow one-third percentage-point increases in the three-month moving average of the unemployment rate, but it has yet to begin moving upward (Chart 2). Leading indicators like small business hiring intentions (Chart 3, second panel), temporary employment (Chart 3, third panel) and initial jobless claims (Chart 3, bottom panel) point to continued payroll expansion (Chart 3, top panel). The economy is unquestionably slowing, and labor demand will slow with it, but the record backlog of job openings (Chart 4, top panel) and unabated stream of job quits (Chart 4, bottom panel) suggest that the labor market has a sizable cushion that will allow it to endure a few blows. Chart 2Unemployment Has Not Turned Yet
Unemployment Has Not Turned Yet
Unemployment Has Not Turned Yet
Chart 3The Employment Outlook Is Still Good ...
The Employment Outlook Is Still Good ...
The Employment Outlook Is Still Good ...
Chart 4... As There Is Still A Shortage Of Workers
... As There Is Still A Shortage Of Workers
... As There Is Still A Shortage Of Workers
Like Chair Powell, we would venture that the labor market’s cushion extends to the overall economy. We believe that households’ excess pandemic savings will buffer the largest component of aggregate demand from inflation pressures, though the eventual fate of those savings is hotly debated within BCA. Related Report US Investment StrategyA Difference Of Opinion We expect that a meaningful share of the $2 trillion-plus that households have amassed will eventually be spent; our Counterpoint team does not. The matter is not yet settled, but we are encouraged that the savings rate dipped below its February 2020 level of 8.3% in the fourth quarter and has been less than 6% every month this year, reaching a low of 5.1% in June. If the savings rate is mean-reverting, and if households don’t circle the wagons en masse as they might if recession prophecies become self-fulfilling, households have quite a bit of catching up to do (Chart 5). If consumption continues to lead business investment in line with the empirical record, fixed investment should be able to keep its head above water. Even a downshift in consumption and investment ought to be enough to offset the modest fiscal drag that may ensue if gridlock becomes even more constraining after November’s elections, as our US Political Strategy colleagues expect, and keep the expansion going for a few more quarters. Chart 5These Squirrels Have Stored Up A Lot Of Nuts For The Winter
These Squirrels Have Stored Up A Lot Of Nuts For The Winter
These Squirrels Have Stored Up A Lot Of Nuts For The Winter
Okay, But What About Earnings? S&P 500 earnings are where the rubber meets the road for investors. Befitting the one-step-forward, one-step-back course the macro data releases have followed, second quarter earnings have been mixed.1 In the aggregate, however, they’ve been solid, with the 56% of index constituents (~70% of market cap) that have reported so far beating earnings expectations by 5.2%. That’s in line with the typical underpromise-and-overdeliver earnings season theater but feels like a reprieve for investors who’ve been subjected to a steady drumbeat of recession talk. Profit margins have narrowed – earnings per share have grown 7.7% year over year, well shy of revenue per share’s 12.1% growth – but by less than expected, as the 5.2% earnings surprise has swamped the 1.6% revenue surprise. S&P 500 operating profit margins observed a tight range after the crisis before jumping by more than a percentage point when the top marginal corporate tax rate was lowered beginning in 2018 (Chart 6). They then made another percentage-point leap in 2021, as companies seemed to find another efficiency gear as they adjusted to the pandemic. The reasons for the pandemic leap aren’t clear – shrinking office footprints, lower utility bills and reduced travel and entertainment don’t seem like candidates to move the needle so far on their own – but according to Refinitiv, the owner of I/B/E/S, the definitive source for earnings estimates, it has persisted through the first two quarters of 2022.2 The contraction in real compensation since 2021 (Chart 7, second panel) has likely been the primary driver, but the backup in corporate bond yields (Chart 7, third panel) and the surging dollar (Chart 7, bottom panel) have been margin headwinds so far this year. Chart 6Profit Margins Remain Elevated
Profit Margins Remain Elevated
Profit Margins Remain Elevated
Chart 7Falling Real Wages Have Been Great For Margins
Falling Real Wages Have Been Great For Margins
Falling Real Wages Have Been Great For Margins
We expect that the interest expense and currency translation headwinds will largely disappear in the second half, leaving real wages as the critical swing factor. Our benign take on wages (from employers’ perspective) is not unanimously held within BCA and could be a crucial determinant of our more bullish recommendations’ outcome. Our view is predicated on an analysis of US labor relations history positing that employers have achieved formidable structural advantages over employees that cannot be unwound by a few years of a cyclical boost and one term of the determinedly labor-friendly Biden administration. Our interpretation runs counter to the prevailing view but we believe it is well supported and can provide a lengthy source bibliography for those inclined to check our work. Investment Implications There are no absolutes in financial markets. No asset is good or bad in itself; its merit is solely a function of its relative probability-adjusted risk-reward profile. The recession debate doesn’t matter much in itself; the key is whether this year’s market declines have gone too far in pricing in the severity, breadth, duration and proximity of the next downturn. We add proximity to the list of the NBER’s criteria because it is a critically important factor when most professional money managers, who exert outsize influence in setting prices, are judged on their relative quarterly and annual performance. We are not perma-bulls or attention-seekers. We are more bullish than our colleagues and the investor consensus purely because we think the equity market has gone too far in discounting the impact of a recession that we estimate will not begin before the second half of 2023 and may not be particularly deep in the absence of imbalances that make the real economy vulnerable to a metastasizing downturn. Inflation pressures have not been building unopposed across four presidencies (LBJ through Carter) while corporate management teams nearly indifferent to shareholder interests rolled over at the feet of the UAW and other formerly potent labor unions, entrenching the wage-price spiral. The Powell Fed has begun to hike the funds rate aggressively, but it will not have to smother the economy like the Volcker Fed to round up a fugitive inflation genie and force it back into the bottle. Chart 8It Is Not A Spiral When Prices Rout Wages
It Is Not A Spiral When Prices Rout Wages
It Is Not A Spiral When Prices Rout Wages
Levered capital has not been cascading into commercial real estate for better than a decade to exploit tax loopholes which were closed by the 1986 Tax Act, leaving savings and loans holding the bag and imperiling a sizable swath of the banking system. Stocks are expensive and there are plenty of pockets of silliness, but financial markets have not replayed the dot-com mania, no matter how promiscuously the term "bubble" is applied or how thoroughly the post-crisis rise in asset values has driven Austrian School devotees up the wall. Malinvestment has not occurred on anything close to the scale of the subprime crisis, when lenders, ratings agencies, regulators, banks and investors collectively failed at their duties, spawning a global crisis. American households have modest debt loads and a mountain of savings. Nonfinancial corporations are well heeled after a frenzy of pandemic debt issuance at laughably favorable terms. The banking system is doubly and triply reinforced with the biggest banks hemmed in by excessive capital requirements and stifling risk limits. The economy is likely to be on a better footing at the start of the next recession than it has been in any of the recessions of the previous 40 years (ex-the flash COVID recession). Although he wouldn’t answer the question directly, we thought Chair Powell made it abundantly clear that the Fed is willing to induce a recession if that’s what it takes to bring inflation to heel. We ultimately think the Fed will have to squash the economy to get inflation back down to its 2% target, but we don’t think it will happen over the timeframe that matters to the institutional investor constituencies that have a huge say in setting marginal prices. That view is at risk if inflation does not show signs of peaking soon or if longer-run inflation expectations rise to uncomfortable levels. For now, neither has happened and the latest run of data did not break one way or the other. Final July long-run inflation expectations of 2.9% from the University of Michigan consumer sentiment survey were down from June’s final 3.1% reading and meaningfully below the 3.3% preliminary June false alarm that jarred the FOMC. The second quarter employment cost index grew by more than 1% for the fourth straight quarter, extending its nominal rise (Chart 8, top panel) even while it continues to contract in real terms (Chart 8, bottom panel). A growth shortfall is a threat as well, though it failed to materialize in second quarter earnings, forcing the S&P 500 to unwind some of the weak growth expectations it had already discounted. If our base-case scenario holds, more such unwinding is in store. Doug Peta, CFA Chief US Investment Strategist dougp@bcaresearch.com Footnotes 1 As we worked on this report after Thursday’s market close, Amazon delighted investors, Apple pleased them and Intel, as per a barrons.com headline, “missed by a mile.” 2 Per Standard & Poor’s, the index’s operating margin fell by a percentage point in the first quarter. Though S&P has tended to define operating earnings less favorably than Refinitiv/I/B/E/S, the two series moved together directionally until 1Q22 and only Refinitiv’s data facilitates comparisons between past results and future expectations.
Listen to a short summary of this report. Executive Summary US Lead On Mega-Sized Firms: Is A Peak Nigh?
America's Lead On Mega-Sized Companies: Is A Peak Nigh?
America's Lead On Mega-Sized Companies: Is A Peak Nigh?
The US has been the star protagonist of global equity markets for decades. It offers investors the rare combination of a big economy and a large universe of mega-sized listed companies. In fact, the overwhelming majority of the top 20 largest firms globally by revenue today are American. But can the US maintain this degree of presence on this list over the next decade? We think that this is unlikely. For starters, a decline in the US’s footprint could be driven by the fact that there is a peculiar stagnation in the works in the middle tier of American firms. Given that this tier acts as a talent pool for big firms, a stagnation here could mean that the US spawns fewer super-sized firms. The high market share commanded by big American firms could also end up being a liability. This dominance could bait regulatory attention, thereby affecting these firms’ growth prospects. Finally, slowing GDP growth in the US, as compared to its Asian peers, will prove to be another headwind that American firms must contend with. What should strategic investors do to prepare for this tectonic shift? We recommend reducing allocations to US equities over the long run since the US’s weight in global indices will peak soon (or may have already peaked). Bottom Line: Irrespective of what the Fed does (or does not do), the US’s footprint in the global league tables of big firms by revenue will weaken over the next decade. Strategic investors can profit from this change by reducing allocations to US equities while increasing allocations to China as well as a basket of countries including Korea, Japan, Taiwan, and Germany. Dear Client, This week, we are sending you a Special Report by Ritika Mankar, CFA, who will be writing occasional special reports for the Global Investment Strategy service on a variety of topical issues. Ritika makes the case that the US economy’s ability to spawn mega-sized companies may become increasingly compromised over the next decade. We will return to our regular publishing schedule next week. Best Regards, Peter Berezin, Chief Global Strategist US: Home To The Largest Number Of Big Listed Firms 2022 has been a turbulent year for US markets so far. But it is worth bearing in mind that the US has been the star protagonist of global equity markets for decades. This is because the US has offered investors a near-perfect trifecta constituting of: (1) A mega-sized economy; (2) A large universe of mega-sized listed companies; and (3) A track record of market outperformance. Specifically: Largest Economy: For over a century now, the US has been the largest economy in the world – a title it is expected to defend over the next few years (Chart 1). Large Listed Companies: The US’s high nominal GDP has also translated into high sales growth for its listed space. This, in turn, powered a great rise in the American equity market’s capitalization (Chart 2). In fact, the US’s market cap is so large today that it exceeds the cumulative market cap of the next four largest economies in the world, by a wide margin. So unlike Germany or China (which have large economies but small markets), the US has a large economy and is also home to some of the largest, most liquid stocks globally. Chart 1The US Will Remain The World’s Largest Economy For The Next Few Years
America's Lead On Mega-Sized Companies: Is A Peak Nigh?
America's Lead On Mega-Sized Companies: Is A Peak Nigh?
Chart 2The Listed Universe In The US Has Grown From Strength To Strength
America's Lead On Mega-Sized Companies: Is A Peak Nigh?
America's Lead On Mega-Sized Companies: Is A Peak Nigh?
Chart 3Growing Sales In The US Have Powered Its Outperformance Over The Past Decade
Growing Sales In The US Have Powered Its Outperformance Over The Past Decade
Growing Sales In The US Have Powered Its Outperformance Over The Past Decade
Long History of Outperformance: And most importantly, the US market has a strong track record of outperformance. US markets have outperformed global benchmarks over the past decade thanks largely to the rapid sales growth seen by American firms (Chart 3). Notwithstanding the US’s star role in global markets thus far, in this report we highlight that the US’s heft will likely decline over the next decade. The Fed may or may not administer recession-inducing rate hikes in 2022. But irrespective of what the Fed does over the next 12-to-24 months, the US’s loss of influence in global equity markets appears certain because it will be driven by structural forces. Chart 4US Lead On Mega-Sized Firms: Is A Peak Nigh?
America's Lead On Mega-Sized Companies: Is A Peak Nigh?
America's Lead On Mega-Sized Companies: Is A Peak Nigh?
Firstly, while behemoths such as Apple and Amazon have been attracting record investor attention, it is worth noting that the next tier of mid-sized American companies is no longer thriving as it used to. The reason why this matters is because history suggests that the pool of mid-sized companies acts as a superset for the big companies of tomorrow. So, if this talent pool is not booming today in the US, then there is likely to be repercussions tomorrow. Secondly, the US’s largest firms will have to contend with two structural headwinds over the next decade, namely increased regulatory attention and slowing growth. To complicate matters for American firms, competitors in Asia will not have this albatross around their neck. Hence, the US may remain the largest economy of the world a few years from now but is unlikely to be home to as many big, listed companies as it is today (Chart 4). The rest of this report quantifies the strength of these forces, and then concludes with actionable investment ideas. Trouble In The Talent Pool Chart 5The US Is Home To Nearly A Dozen Mega-Sized Firms Today
America's Lead On Mega-Sized Companies: Is A Peak Nigh?
America's Lead On Mega-Sized Companies: Is A Peak Nigh?
2021 produced a special milestone for the American economy. This was the first year that ten listed American firms1 surpassed $200 billion in annual revenues (firms we refer to as ‘Big Shots’ from here on) (Chart 5). The US has been a global leader when it came to the size of its economy for decades, but last year it also became home to the largest number of big, listed corporations (Table 1). American Big Shots were striking both in terms of their number as well as their scale. In fact, such was their scale that the combined revenue of these ten Big Shots now exceeded the nominal GDP of major economies like India (Chart 6). Table 1The US Today Dominates The Global List Of Top 20 Firms
America's Lead On Mega-Sized Companies: Is A Peak Nigh?
America's Lead On Mega-Sized Companies: Is A Peak Nigh?
Chart 6The Revenues Of US Big Shot Firms Are Comparable To India’s Nominal GDP!
America's Lead On Mega-Sized Companies: Is A Peak Nigh?
America's Lead On Mega-Sized Companies: Is A Peak Nigh?
While the world has been captivated by the size that the US’s Big Shots have achieved (as well as the ideas of their unconventional founders), few have noticed that the talent pool for tomorrow’s Big Shots is no longer burgeoning. History suggests that most Big Shot firms tend to emerge from firms belonging to a lower revenue tier. For instance, Amazon and Apple, which have revenues in the range of $350-to-$500 billion today, were mid-sized firms a decade ago with revenues in the vicinity of $50-to-$100 billion (Chart 7). Chart 7Most Big Shots Today Were The Mid-Sized Firms Of Yesterday
America's Lead On Mega-Sized Companies: Is A Peak Nigh?
America's Lead On Mega-Sized Companies: Is A Peak Nigh?
This is why it is worrying that all is not well in the US’s ecosystem of mid-sized firms. If we define firms with annual revenues of $50-to-$200 billion as ‘core’ firms, then their share in the total number of American firms has stagnated over the past decade (Chart 8). Even the revenue share accounted for by core firms has been fading (Chart 9). This phenomenon contrasts with the situation in China, where the mid-sized firms’ cohort has been growing over the last decade (Charts 10 and 11). Chart 8Share Of Mid-Sized Firms In The US Has Stagnated
America's Lead On Mega-Sized Companies: Is A Peak Nigh?
America's Lead On Mega-Sized Companies: Is A Peak Nigh?
Chart 9The Revenue Share Of US Mid-Sized Firms Is Also Falling
America's Lead On Mega-Sized Companies: Is A Peak Nigh?
America's Lead On Mega-Sized Companies: Is A Peak Nigh?
Chart 10Share Of Mid-Sized Firms In China Is Expanding
America's Lead On Mega-Sized Companies: Is A Peak Nigh?
America's Lead On Mega-Sized Companies: Is A Peak Nigh?
Chart 11The Revenue Share Of Chinese Mid-Sized Firms Is Rising
America's Lead On Mega-Sized Companies: Is A Peak Nigh?
America's Lead On Mega-Sized Companies: Is A Peak Nigh?
Japan’s experience also suggests that when the mid-sized firms’ ecosystem weakens, the pipeline of future potential mega-cap companies get affected. In Japan, the proportion of core firms (Chart 12), as well as their revenue share (Chart 13), has not been growing as is the case, say, in China. And this is perhaps why, despite being the third-largest economy in the world today, Japan is home to only one listed mega-sized corporation with revenues of over $200 billion (Toyota).
Image
Chart 13The Revenue Share Of Japanese Mid-Sized Firms Has Plateaued
America's Lead On Mega-Sized Companies: Is A Peak Nigh?
America's Lead On Mega-Sized Companies: Is A Peak Nigh?
The US May Have Hit Peak Oligopolization The fact that ten Big Shot firms (i.e., firms with annual revenues of over $200 billion) exist in the US today is remarkable. After all, the number of Big Shot firms in the US today exceeds the total number of Big Shots in the next four largest economies of the world combined (Chart 14). Chart 14The US Today Is The Global Hub For Mega-Sized Companies
America's Lead On Mega-Sized Companies: Is A Peak Nigh?
America's Lead On Mega-Sized Companies: Is A Peak Nigh?
So why will the US’s leadership in this area come under pressure going forward? One reason is that the large size of American firms could itself become a liability. Specifically: Public Backlash Against The US’s Big Shots: The ten Big Shot firms of the US today account for more than a fifth of the revenue generated by all firms that constitute the MSCI US index (Chart 15). Also, the number of Big Shot firms, as a share of total firms, is high in the US (Chart 16). Chart 15Big Shots Account For More Than A Fifth Of Revenues Generated By The US Listed Space
America's Lead On Mega-Sized Companies: Is A Peak Nigh?
America's Lead On Mega-Sized Companies: Is A Peak Nigh?
Chart 16A Large Proportion Of Firms In The US Are Very Big
America's Lead On Mega-Sized Companies: Is A Peak Nigh?
America's Lead On Mega-Sized Companies: Is A Peak Nigh?
Notably, market leaders across a range of key sectors in the US account for an unusually large chunk of the sector’s revenues. Financials, Information Technology, and Consumer Discretionary together account for about half of the US equity market index’s weight. The dominant firm in each of these three sectors (as defined by MSCI) accounts for 15%-to-25% of that sector’s revenue (Chart 17). Market power usually benefits investors. But too much market power can be a problem. The growing oligopolization of the US economy has caused public dissatisfaction over the influence of corporations in the US to hit a multi-year high (Chart 18). Over 60% of Americans want major US corporations to have less influence. It is for this reason that the record scale acquired by American firms could prove to be an issue. American mega-scaled firms’ high market shares will provide them with pricing power, but this very power will end up baiting regulatory attention and anti-trust lawsuits which, in turn, will restrict their future growth rates. The fact that the US Federal Trade Commission (FTC) today is headed by a leader who wants to return the FTC to its trust-busting origins, and made her name by writing a paper arguing for Amazon to be broken up,2 is indicative of which way the wind is blowing. Chart 17Market Leaders In The US Are Too Big
America's Lead On Mega-Sized Companies: Is A Peak Nigh?
America's Lead On Mega-Sized Companies: Is A Peak Nigh?
Chart 18Public Dissatisfaction With US Big Shot Firms Is High And Rising
America's Lead On Mega-Sized Companies: Is A Peak Nigh?
America's Lead On Mega-Sized Companies: Is A Peak Nigh?
Interestingly, the speed at which the US restricts the market power of big firms will determine how quickly the US’s mid-sized firms begin to flourish again, thereby setting the stage for the US to spawn a new generation of big firms. Besides the growing regulatory risks for the US’s big firms, three other technical factors will end up slowing the pace at which the US can generate large firms, namely: Slowing GDP Growth: Since the US is a large and mature economy, the pace of its growth is bound to slow (Chart 19). Besides the deceleration in the US’s growth rate relative to its own past, it is projected to end up being lower than that of major economies like China. Chart 19US GDP Growth Is Set To Slow
America's Lead On Mega-Sized Companies: Is A Peak Nigh?
America's Lead On Mega-Sized Companies: Is A Peak Nigh?
Big Business ≠ Big GDP Growth: While GDP growth receives a fillip when small firms grow, the high pricing power that very large firms command can end up constraining an economy’s growth rate. This is because large firms can charge monopolistic prices, thereby restraining demand. Secondly, mega-sized firms may actively invest in manipulating institutions to block upstarts,3 a dynamic that can restrict productivity growth as well. Chart 20The Revenue-To-Nominal GDP Ratio Is Already Elevated In The US
America's Lead On Mega-Sized Companies: Is A Peak Nigh?
America's Lead On Mega-Sized Companies: Is A Peak Nigh?
Approaching Revenue Saturation: A cross-country comparison suggests that the revenue-to-nominal GDP ratio in the US is high1 (Chart 20). Only Japan has a superior ratio, which is likely to be an aberration rather than the norm (owing to Japanese firms’ unique tendency to prioritize revenues over profitability). Given that the US revenue-to-nominal GDP ratio is already elevated, it is likely that even as the US’s nominal GDP keeps growing, the pace of conversion of this GDP into revenues will stay the same or may even diminish over the coming decade. Prepare For A Brave New World “German judges…first read a description of a woman who had been caught shoplifting, then rolled a pair of dice that were loaded so every roll resulted in either a 3 or a 9. As soon as the dice came to a stop, the judges were asked whether they would sentence the woman to a term in prison greater or lesser, in months, than the number showing on the dice…On average, those who had rolled a 9 said they would sentence her to 8 months; those who rolled a 3 said they would sentence her to 5 months; the anchoring effect was 50%.” – Daniel Kahneman, Thinking, Fast and Slow (Farrar, Straus and Giroux, 2011) The US has been the largest economy in the world and has also been able to nurture some of the largest mega-scaled companies of today. Such is the might and size of these firms that it is impossible to imagine a world where American firms’ leadership could be disrupted. Moreover, it is mentally easier to extrapolate the US’s lead today into the future. It may even seem like there is no other alternative to the US since Japan’s economy has been stagnating, Europe lacks innovation, and the political environment in China is contentious. Also, it is true that the US today is the undisputed leader when it comes to qualitative factors such as the ability to attract top global talent, its education system, and its legal system. However, the case can be made that this belief (that the US’s lead on mega-sized companies will spill into the next decade) runs the risk of becoming a Kahneman-esque anchoring bias. This is because: History Suggests That Upsets Are The Norm: History suggests that the evolution of the top 20 global firms (by revenue) has been a story of upsets. For instance, Europe’s hold over this list in the 2000s was striking by all accounts (Chart 21). Back then, it would have been almost blasphemous to question Europe’s lead (Chart 22). But today firms from three Asian island-countries account for more companies on this list than all of pre-Brexit Europe put together. Chart 21In The 2000s, Europe Was The Epicenter Of Global Mega-Sized Firms
America's Lead On Mega-Sized Companies: Is A Peak Nigh?
America's Lead On Mega-Sized Companies: Is A Peak Nigh?
Chart 22How The Mighty Can, And Do, Fall
America's Lead On Mega-Sized Companies: Is A Peak Nigh?
America's Lead On Mega-Sized Companies: Is A Peak Nigh?
China’s Disadvantages < Its Competitive Advantages: Despite its political baggage, China has the most formidable capability today to displace the US’s leadership position on the league tables of top 20 global firms by revenue. This is because China has a thriving ecosystem of core firms (Chart 11) and is set to grow at a faster clip than the US over the next five years (Chart 19). Moreover, while the Chinese government’s tolerance for large tech giants could remain low, the establishment could be keen to grow firms in the industrials as well as financials space for the sake of common prosperity. EM Listed Space Can Catch Up: The listed space in the US has developed at an exceptionally fast pace relative to its peers. The gap between US nominal GDP and listed space parameters is low (Chart 20), while the gap is wider for countries like Germany, China, and several other EMs. Even in a ceteris paribus situation where nominal GDPs were to stay static, an increase in the size of the listed universe in other countries can adversely affect the US’s current footprint. So, what can investors do to prepare for this coming tectonic shift? We recommend reducing allocations to US equities since the US’s weight in global indices will peak soon. It is worth noting that this strategic investment recommendation dovetails nicely with our earlier view that strategic investors should rotate out of US stocks. Currently, about half of the 20 largest firms globally by revenue are American (Map 1). Owing to the dynamics listed above, the number of American firms in the global league of top 20 could fall from this high level to 7 or 8 over the coming decade. Given that this change is indicative of things to come, we would urge investors to reduce allocations to US equities in a global portfolio over a strategic horizon. A confluence of micro and macro factors is likely to result in the US’s weight in global indices to crest sooner rather than later. Map 1Could The Global Epicenter Of Big Firms Drift Eastwards Over The Next Decade?
America's Lead On Mega-Sized Companies: Is A Peak Nigh?
America's Lead On Mega-Sized Companies: Is A Peak Nigh?
In fact, US equities’ weight in a global index like the MSCI ACWI could have already peaked (Chart 23) and could fall by 500-to-600bps over the next decade if the last year’s trend is extrapolated into the future. As regards to sectors, health care appears to be the key industry where the US’s footprint could weaken (Table 2). Chart 23Loss Of US Influence Will Create Space For Underrepresented Markets To Grow
America's Lead On Mega-Sized Companies: Is A Peak Nigh?
America's Lead On Mega-Sized Companies: Is A Peak Nigh?
Table 2China’s Weight In Top 20 Firms Is Set To Grow
America's Lead On Mega-Sized Companies: Is A Peak Nigh?
America's Lead On Mega-Sized Companies: Is A Peak Nigh?
As the US cedes its leadership position, we expect the global epicenter of mega-sized listed corporates to drift eastwards (Map 1). Specifically: China: Currently, less than a quarter of the 20 largest firms globally by revenue are Chinese (Map 1). It is highly likely that the number of Chinese firms in the global list of top 20 firms will increase. China should be able to spawn more mega-sized companies since it already has a cache of promising large and mid-sized companies. Chinese companies will also benefit from the high growth rate of China’s domestic economy. From a sectoral perspective, financials and industrials appear to be two sectors where China’s footprint could grow the most (Table 2). Asia Ex-China: Asian countries like Korea, Taiwan, and Japan could potentially end up growing their weight in global equity indices by becoming home to more than one company that makes it to the global league tables of large companies. Besides the high GDP growth rate on offer in their domestic markets (Chart 20), firms in these countries could increase scale by feeding a stimulus-fueled industrial boom in the US. Additionally, these Asian countries have a competitive advantage when it comes to high-tech manufacturing capabilities (Chart 24). This will ensure that they will accrue any offshore opportunities that arise. Taiwan has the potential to grow its presence in the Information Technology space, given its innate competitive advantages (Chart 24) and the positive structural outlook for global semiconductor demand. In the case of India, it is worth noting that the country’s influence in the world economy will be ascendant over the next decade as its growing middle class flexes its muscles. Despite this, the probability of an Indian firm making an appearance among the largest firms of the world is low given the unusually small size of Indian companies today. Europe: Distinct from the Asian countries listed above, Germany could benefit from the industrial boom in the US given its capabilities when it comes to high-end manufacturing (Chart 24). Even as we believe that oil faces a bleak future on a structural basis, if a commodities supercycle were to take hold over the next decade, then the UK and France could improve their presence in global equity benchmarks given that Europe is home to some large firms in the energy sector. A commodities supercycle will also end up benefiting China and the US, since some large energy producers are also located in these countries. Chart 24Korea, Japan, And Germany Have An Edge In Manufacturing, While Taiwan, Japan, And China Have An Edge In Semiconductors
America's Lead On Mega-Sized Companies: Is A Peak Nigh?
America's Lead On Mega-Sized Companies: Is A Peak Nigh?
Appendix The Methodology The starting point for most country-level economic analyses tends to be a country’s nominal GDP. But as market economists we realized that some key advantages could be unlocked by focusing on ‘revenues’ generated by the listed universe of a country. These advantages include: Investment Focus: As compared to nominal GDP which ends up picking up signals about the health of the listed ‘and’ unlisted firms in any country, focusing on listed firms’ revenues allows us to home-in on the health of the listed space. This is a valuable merit since the listed space is what public equity investors can buy into. For example, India is the fifth largest economy of the world and is also one of the fastest growing economies globally. But India is also characterized by a listed space where the largest companies have revenues of only around $100 billion. This makes India less investable than countries like Taiwan or South Korea that have far smaller nominal GDPs as compared to India but are home to firms with revenue of around $200 billion. Taking note of this difference - between the size of a country’s nominal GDP and the size of investable firms in a country - is key for our clients. Focus On Cause, Not Effect: It is fashionable today in the financial press to focus on the daily changes in market capitalization of assets (and non-assets too). But it is critical to note that the market cap of a stock or the price of a security is a dependent variable. Revenue, on the other hand, is a key independent variable that influences prices. So, a focus on forecasting movement in revenues of companies in a country ten years down the line, can be a more fruitful exercise for strategic investors. Steady And Stable: Revenue generated by a firm, is also a superior measure as compared to the market capitalization of a firm because the latter can be volatile. Whilst it could be argued that earnings of a company as a variable also offer stability and influence prices, earnings suffer from one drawback which is that it is a function of revenues as well as costs. Revenues of companies on the other hand have a direct theoretical link to the nominal GDP of a country. So, to rephrase a popular adage - market cap is vanity, nominal GDP is sanity, but revenue is king. This is the reason why in this Special Report, we analyze investment opportunities through the lens of revenues generated by listed firms in some of the largest economies of the world. We do so by focusing on the constituents of MSCI Country Indices (Equity) for major world economies in 2021. Ritika Mankar, CFA Editor/Strategist ritika.mankar@bcaresearch.com Footnotes 1 Based on MSCI ACWI data for 2021. 2 Kiran Stacey, “Washington vs Big Tech: Lina Khan’s battle to transform US antitrust,” ft.com, August 2021. 3 Kathy Fogel, Randall Morck, and Bernard Yeung, “Big Business Stability And Economic Growth: Is What’s Good For General Motors Good For US?”, NBER Working Paper No. 12394, nber.org, July 2006.
Executive Summary Italy’s right-wing alliance, led by Brothers of Italy, will likely outperform in the upcoming election. The new government will prioritize the economy, posing a risk to the EU’s united front against Russia. It is conducive to an eventual ceasefire, which is marginally positive for risk assets in 2023. We recommend investors underweight Italian assets on a tactical basis. China’s political risks will remain elevated until Xi consolidates power this fall, positive news will come after, if at all. Geopolitical risk in the Taiwan Strait will remain high and persistent until China and the US reach a new understanding. Separately, we are booking a 9% gain on our long US equities relative to UAE equities trade. Italy: GeoRisk Indicator
Italy: GeoRisk Indicator
Italy: GeoRisk Indicator
Tactical Recommendation Inception Date Return LONG US / UAE EQUITIES (CLOSED) 2022-03-11 9.0% Bottom Line: Italy’s political turmoil suggests a more pragmatic policy toward Russia going forward. Europe’s energy cutoff will also motivate governments to negotiate with Russia. Feature In this report we update our GeoRisk Indicators, with a special focus on Italy’s newest political turmoil. Italy Over the past several months, we have argued that Italy was a source of political risk within the European Union and that the market underestimated the probability of an early Italian election. In the past two weeks, this forecast has become a reality (Chart 1). Chart 1Italy: GeoRisk Indicator
Italy: GeoRisk Indicator
Italy: GeoRisk Indicator
The grand coalition under Prime Minister Mario Draghi had fulfilled its two main purposes – to distribute EU recovery funds and secure an establishment politician in the Italian presidency. At the same time, headline inflation hit 8.5% in June, the highest since 1986, even as the Italian and global economy slowed down, Italian government bonds sold off, and Russia induced an energy crisis. The stagflationary economic environment is biting hard and the different coalition members are looking to their individual interests ahead of election season. On July 14, Giuseppe Conte, the former prime minister, pulled its populist Five Star Movement (M5S) out of Mario Draghi’s national unity government, triggering a new round of political turmoil in Italy. Draghi’s first resignation was rejected by Italian President Mattarella later that day. However, on July 21, the League and Forza Italia also defected from the grand coalition. After Draghi’s plan of reviving the coalition collapsed, President Mattarella accepted his resignation and called for a snap election to be held on September 25, ten months ahead of the original schedule. Based on the latest public opinion polls, right-wing political parties are well-positioned for the upcoming election. The far-right Brothers of Italy is now the front runner in the election race and is expected to win around 23% of the votes. Another far-right party, the League, is the third most popular party, with nearly 15% support despite a drop in support during its time within the grand coalition. In addition, the center-right Forza Italia receives 8.5% of the support. Together, the right-wing conservative bloc amounts to 46.5% of voting intentions. There is still positive momentum for Brothers of Italy to harvest more support given that they are the flag-bearer for anti-incumbent sentiment amid the stagflationary economy. By contrast, the left-wing parties – the Democrats, the Left, and the Greens – only command about 27%. The possibility of an extended left-wing coalition, even with the inclusion of the M5S, is looking slim. On July 25, Enrico Letta, the leader of the Democratic Party, publicly expressed his anger against party leader Giuseppe Conte and ruled out any electoral pact with the M5S because of the recent political chaos they caused. He stressed that the Democratic Party would seek ties with parties that had remained loyal to Draghi’s national unity. However, there are not many parties left for the Democrats to partner with. Apart from the Left and the Greens, the Democrats’ best chance would be the center-left Action Party and Italia Viva, which is led by Matteo Renzi, who served as the secretary of the Democratic Party from 2013 to 2018. However, these four parties are small and will not enable the Democrats to form a government. Courting M5S is the Democrats’ only chance to set up an alternative to the right-wing bloc, but that will require the election to force the two parties together. Related Report Geopolitical StrategyLe Pen And Other Hurdles (GeoRisk Update) The Democratic Party was the biggest supporter of Draghi’s government, while the Brothers of Italy were the sole major opposition. Thus the September 25 election will be a race between these two major parties. Both are expected to outperform current polling, as they will attract the most supporters from each side. The other right-wing parties, Forza Italia and the League, will at least perform in line with their polling, while the other left-wing parties will underperform. In the meantime, M5S’ popularity will continue to decline – the party is bruised over its role in Draghi’s coalition and divided over how to respond to the Ukraine war. Foreign policy is a major factor in this election. Italy has the highest share of citizens in the Eurozone who support solving the Russia-Ukraine conflict through peaceful dialogue (52% versus the Eurozone average of 35%). Italy has long maintained pragmatic relations with Russia, including the Putin administration, as it imported 40% of its natural gas from there prior to 2022. The EU is struggling to maintain a united front against Russia, and war policy will be a key focal point among the different parties. Draghi and the Democratic Party are the strongest supporters of the EU’s oil embargo on Russia and decision to send arms to support Ukraine. On the other side, the right-wing Forza Italia and the League have been more equivocal due to their traditional friendship with Russia. What’s more important is the stance of the Brothers of Italy on Russia, as it is the largest party now and will probably lead a right-wing government after the election. On July 27, the three right-wing parties struck a deal to officially form an alliance in the upcoming election and whichever party wins the most votes would determine the next prime minister if the alliance wins. This deal puts Giorgia Meloni, the leader of Brothers of Italy, one step closer to becoming Italy’s first female PM. Giorgia Meloni, unlike her right-wing peers, has endorsed Draghi’s hawkish stance towards Russia. Recently, she stressed that Italy would keep sending arms to Ukraine if her party forms a government after the election. However, Meloni’s speech could be a tactical move to win the election more than an unshakeable policy position. First, like the other two right-wing parties, the Brothers of Italy have had close connections with Russia. After the 2018 Russian presidential election, Meloni congratulated Putin and claimed his victory was “the unequivocal will of Russians.” In addition, she is close to Prime Minister Viktor Orban of Hungary and National Rally leader Marine Le Pen of France, both of whom have criticized the EU’s decision to provide military support to Kyiv. Hence her sharp change of stance this year seems calculated to avoid accusations of being pro-Russian. But that does not preclude a more pragmatic approach to Russia once in office. Second, Meloni has compromised other far-right positions to broaden her voter base. She has reversed the party’s original anti-EU stance and claimed it does not seek to leave the EU, as most European anti-establishment parties have had to do in order to make themselves electable. Being the only female in the election race, Meloni also pledged to protect women’s access to safe abortions in Italy, also a softer stance than before. Even if the Brothers of Italy distance themselves from some unpopular right-wing positions, including on Ukraine, they probably cannot form a government on their own. They will need to court Forza Italia and the League. These two parties prefer a more pragmatic approach to Russia and a peaceful resolution to the war. Thus while it will be hard to find a middle ground on the issue of Ukraine, the election will likely prevent Italy from taking a more confrontational stance toward Russia. It will probably do the opposite. Consider the context in which the next Italian government will operate. Russia declared on July 25 that it will further reduce natural gas supplies to Europe through Nord Stream 1, as we expected, bringing pipeline flows to 20% of its full capacity. Energy prices will go up even as European economic activity and industry will suffer greater strains. If Meloni is elected as the new prime minister this September, she will have to keep talking tough on Russia while simultaneously seeking a solution to soaring energy prices and economic crisis. This solution will be diplomacy – unless Russia seeks to expand its invasion all the way to Moldova. A right-wing victory is the most likely outcome based on opinion polling, the negative cyclical economy, and the underlying structural factors supporting populism in Italy that we have monitored for years. Such a coalition will not be pro-Russian but it will be pragmatic and focused on salvaging Italy’s economy, which means it will be highly inclined toward diplomacy. If Russia halts its military advance – does not attempt to conquer southwestern Ukraine to Moldova – then this point will be greatly reinforced. Italy will become a new veto player within the European Union when it comes to any major new sanctions on Russia. While Europeans will continue diversifying their energy mix away from Russia, it will be much harder for the EU to implement a natural gas embargo in the coming years if Italy as well as Hungary oppose it. Even if we are wrong, and the Democratic Party or other left-wing parties surprise to the upside in the election, the new coalition will most likely have to focus on mitigating the economic crisis and thus pursuing diplomacy with Russia. That is, as long as Russia pushes for a ceasefire after it achieves its military aims in Donetsk, the last holdout within the south-southeastern territories Russia is trying to conquer. Bottom Line: Due to persistent political uncertainty, we recommend investors underweight Italian stocks and bonds at least until a new government takes shape, which could take months even after the election. However, government bonds will remain vulnerable if a right-wing coalition assumes power, since it will pursue loose fiscal policies and will eschew structural reforms. Overall Italy’s early elections will lead to a new government that is focused on short-term economic growth, likely including pragmatism toward Russia. From an investment point of view that will not be a negative development, though much depends on whether Russia expands its invasion or declares victory after Donetsk. Russia Market-based measures of Russian geopolitical risk are rebounding after subsiding from peak levels hit during the invasion of Ukraine in February (Chart 2). Chart 2Russia: GeoRisk Indicator
Russia: GeoRisk Indicator
Russia: GeoRisk Indicator
Russia’s continued tightening of natural gas supplies (and food exports) this week is precisely what we predicted would happen despite a wave of wishful thinking from investors over the past month. The optimists claimed that Russia would resume Nord Stream 1 pipeline flows after a regular “maintenance” period. They also said that Canada’s cooperation in resolving some “technical” issues around turbines would stabilize natural gas supply. The truth is that Russia is seeking to achieve its war aims in Ukraine. Until it has achieved its aims, it will use a range of leverage, including tightening food and energy supplies. Most likely Russia will halt the advance after completing the conquest of the Donbas region and land-bridge to Crimea. Then it will seek to legitimize its conquests through a ceasefire agreement. However, it could launch a new phase of the war to try to take Odessa and Transniestria, which would cement European resolve, even in Italy, and trigger a new round of sanctions. Bottom Line: Russia faces a fork in the road once it completes the conquest of Donetsk. Most likely it will declare victory and start pushing for a ceasefire late this year or early next year. Movement toward a ceasefire would reduce geopolitical risk for global financial markets in 2023. But there is still a substantial risk that Russia could expand the invasion to eastern Moldova, which would escalate the overarching Russia-West conflict and sustain the high level of geopolitical risk for markets. China Chinese political and geopolitical risk will continue to rise and the bounce in Chinese relative equity performance is faltering as we expected (Chart 3). Chart 3China: GeoRisk Indicator
China: GeoRisk Indicator
China: GeoRisk Indicator
China’s leaders will hold their secretive annual meeting at Beidaihe in August ahead of the critical Communist Party national congress this fall. General Secretary Xi Jinping is attempting to cement himself as the paramount leader in China, comparable to Chairman Mao Zedong, transforming China’s governance from that of single-party rule to single-person rule. The reversion to autocratic government is coinciding with a historic economic slowdown consisting of cyclical factors (weak domestic demand, weakening foreign demand, draconian Covid-19 restrictions) and structural factors (labor force contraction, property sector bust, social change and unrest). Both Xi and US President Biden face major domestic political challenges in the coming months with the party congress and the US midterm election. Hence they are holding talks to try to stabilize relations. But we do not think they will succeed. China cannot reject Russia’s strategic overture, while the US cannot afford to re-engage with a China that is partnering with Russia in a challenge to the liberal-democratic world order. In addition, US policies are erratic and the US cannot credibly promise China that it will not pursue a containment strategy even if China offers trade concessions. Bottom Line: China-related political and geopolitical risks will remain very high until at least after the twentieth party congress. At that point we expect President Xi to loosen a range of policies to stabilize the economy and foreign trade relations. These policies may bring positive news in 2023, though China’s biggest macroeconomic and geopolitical problems remain structural in nature and we remain underweight Chinese assets. Taiwan For many years we have warned of a “fourth Taiwan Strait crisis” due to the unsustainable geopolitical situation between China, Taiwan, and the United States. After the war in Ukraine we argued that the US would try to boost its strategic deterrence around Taiwan, since it failed to deter Russia from invading Ukraine, but that the increased commitment to Taiwan would in fact provoke China (Chart 4). Chart 4Taiwan: GeoRisk Indicator
Taiwan: GeoRisk Indicator
Taiwan: GeoRisk Indicator
Until the US and China reach a new understanding over Taiwan, we argued that the region would be susceptible to rising tensions and crisis points that would send investors fleeing from risky assets, especially risky regional assets. It is possible that we have arrived at this crisis now, with House Speaker Nancy Pelosi making preparations to visit Taiwan, China pledging “forceful” countermeasures if she does, President Biden suggesting that the US military thinks Pelosi should not visit, and Biden and Xi preparing for a phone conversation. In essence China is giving an ultimatum and setting a new bar, and a very low bar, for taking some kind of action on Taiwan, i.e. the mere visit of a US House speaker, which has happened before (House Speaker Newt Gingrich in 1997). China’s purpose is to lay the groundwork for preventing the US from upgrading Taiwan relations in any more substantial way, whether political or military. If the Biden administration calls off the Pelosi visit, then American relations with Taiwan will have been curtailed, at least for this administration. If Biden goes forward with the visit, then Beijing will need to respond with an aggressive show of force to prevent any future president from repeating the exercise or building on it. And if this show threatens US personnel or security, a full-blown diplomatic or military crisis could ensue. While we doubt it would lead to full-scale war, it could lead to a frightening confrontation. Biden may want to stabilize relations with China, since he is primarily focused on countering Russia, but his options are limited. China cannot save him from inflation but it can solidify the public perception that he is weak. Hence he is more likely to maintain his administration’s hawkish approach. Biden’s approval rating is 38% and his party faces a drubbing in the midterm elections. A confrontation with Russia, China, Iran, or anyone else would likely help his party by producing a public rally around the flag. Any unilateral concessions will merely strengthen Xi’s power consolidation at the party congress, which is detrimental to US interests. Only if the Biden administration pursues a dovish policy of re-engagement that is subsequently confirmed by the 2024 presidential election will there be potential for a substantial US-China economic re-engagement. We are pessimistic. Bottom Line: Taiwan-related geopolitical risk will rise in the short run. If there is a new US-China understanding over Taiwan, then regional and global geopolitical risk will decline over the medium term. But we remain short Taiwanese assets. Investment Takeaways Investors should remain defensively positioned until the US midterm election ends with congressional gridlock; the Chinese party congress is over and Xi Jinping launches a broad pro-growth policy; and Russia starts pushing for a ceasefire in Ukraine. We also expect that markets will need to get over new, unexpected oil supply shocks arising from the failure of US-Iran nuclear negotiations, which remains off the radar and therefore a source of negative surprises. Any US-Iran nuclear deal would be a major positive surprise that postpones this risk for a few years. Having said that, we are booking a 9% gain on our long US versus UAE equity trade for technical reasons. Democrats have reached a deal to pass a budget reconciliation bill in an effort to mitigate midterm election losses. This development reinforces the 65% odds of passage that we have maintained for this bill’s passage in our US Political Strategy reports since last year. Yushu Ma Research Analyst yushu.ma@bcaresearch.com Matt Gertken Chief Geopolitical Strategist mattg@bcaresearch.com Appendix UK Chart 5UK: GeoRisk Indicator
United Kingdom: GeoRisk Indicator
United Kingdom: GeoRisk Indicator
Germany Chart 6Germany: GeoRisk Indicator
Germany: GeoRisk Indicator
Germany: GeoRisk Indicator
France Chart 7France: GeoRisk Indicator
France: GeoRisk Indicator
France: GeoRisk Indicator
Spain Chart 8Spain: GeoRisk Indicator
Spain: GeoRisk Indicator
Spain: GeoRisk Indicator
Canada Chart 9Canada: GeoRisk Indicator
Canada: GeoRisk Indicator
Canada: GeoRisk Indicator
Australia Chart 10Australia: GeoRisk Indicator
Australia: GeoRisk Indicator
Australia: GeoRisk Indicator
Korea Chart 11Korea: GeoRisk Indicator
Korea: GeoRisk Indicator
Korea: GeoRisk Indicator
Brazil Chart 12Brazil: GeoRisk Indicator
Brazil: GeoRisk Indicator
Brazil: GeoRisk Indicator
Turkey Chart 13Turkey: GeoRisk Indicator
Turkey: GeoRisk Indicator
Turkey: GeoRisk Indicator
South Africa Chart 14South Africa: GeoRisk Indicator
South Africa: GeoRisk Indicator
South Africa: GeoRisk Indicator
Strategic Themes Open Tactical Positions (0-6 Months) Open Cyclical Recommendations (6-18 Months) Regional Geopolitical Risk Matrix "Batting Average": Geopolitical Strategy Trades Geopolitical Calendar
Executive Summary EU Will Prioritize Natgas Storage
Energy Security Rolls Over EU's ESG Agenda
Energy Security Rolls Over EU's ESG Agenda
Russia’s reduction in natural gas flows through the Nord Stream 1 (NS1) pipeline to 20% of capacity will test the EU’s ability to keep the lights on going into winter. The EU’s plan to voluntarily reduce natgas consumption by 15% has a higher likelihood of becoming mandatory, following Russia’s cut in NS1 flows. Coal-fired generation in the EU will come online sooner on the back of the NS1 cutoff. This will allow more natgas supplies to be directed to storage injection ahead of winter. Global natgas supplies will remain tight until 2025, as liquified natural gas (LNG) export capacity is developed ex-EU. Bottom Line: EU energy security will be paramount going into the winter, particularly if Russia keeps gas flows through NS1 at or below 20% of capacity going into winter. Russia most likely is seeking a significant reduction or the complete elimination of EU oil sanctions, which were imposed after it invaded Ukraine. If fully enacted, the EU’s embargo will remove more than 3mm b/d of Russian oil exports to the continent by 1Q23. The EU’s coal reserves and its 15% cut in demand could allow the bloc to get through the winter without a massive recession. If, as we believe, these measures are successful, a strong rally in European equities and bonds could ensue. Feature Following Russia’s halving of NS1 gas flows to 20% of capacity yesterday – taking shipments to ~ 33mm cm/d – the EU will be forced to increase its reliance on coal-fired electricity generation sooner than expected, to ensure as much natgas as possible is directed to filling storage ahead of the coming winter. And it will have to count on high levels of cooperation in reducing natgas demand between August and March by 15%.1 There is nothing that more dramatically illustrates the bind the EU finds itself in than rolling over its ESG agenda to ensure it has sufficient gas supplies to heat homes, hospitals and other critical services over the course of the coming winter. Russia’s cutoff of NS1 supplies is being done to focus EU member states on their precarious energy position just as they are scrambling to fill natgas storage. The sense of urgency in this effort is heightened by relatively high odds (67%) of another La Niña event, which usually is accompanied by colder-than-normal winter temperatures in the Northern Hemisphere.2 Russia appears to be seeking a significant reduction or the complete elimination of EU oil import sanctions, which were imposed after it invaded Ukraine. If fully enacted as approved, this will embargo more than 3mm b/d of Russian oil exports to the continent by 1Q23. The EU was Russia’s largest oil customer prior to the sanctions being approved.3 Russia Deploys Its Gas Weapon The EU is aiming to have 80% of its gas storage capacity filled by November, to ensure it has sufficient supplies for the coming winter (Chart 1).4 Achieving this target will prove difficult and uncertain, since it hinges on 1) gas flows from Russia not dropping precariously low or completely cutting off; 2) higher non-Russian flows; and 3) reduced gas consumption, which, as we noted above, likely will become mandatory. We ran different simulations altering these variables to see how inventories could move for the rest of 2022 and into the winter (Chart 2). Chart 1EU Will Prioritize Natgas Storage
Energy Security Rolls Over EU's ESG Agenda
Energy Security Rolls Over EU's ESG Agenda
Chart 2The EU Could Face A Cold Winter
The EU Could Face A Cold Winter
The EU Could Face A Cold Winter
In the simulations, if a variable changes more than we expect – e.g. Russian supplies drop by more than projected – one or both of the other variables will need to adjust to ensure the EU can sufficiently fill gas storage. This adjustment is not guaranteed, since all three variables will likely not move in accordance with policymakers’ expectations, especially gas flows from Russia as it seeks to imperil the bloc’s energy security. On the supply side, Russian flows can drop with little or no warning, while non-Russian supplies will need to remain ~ 30-35% higher relative to 2021, for the rest of the year to get natgas inventories to or slightly above 80%. On the demand side, the EU deal to cut gas consumption by 15% over the course of August-March was accepted with caveats for some member states. The debate and member states’ dissatisfaction over the initial agreement signals states may not implement this policy until they must, which could be too little too late. Of course, a complete cutoff of natural gas flows on the NS1 pipeline would result in inventories being pulled much harder and earlier, and likely would induce further rationing measures. This would produce a sharper economic contraction, since coal-fired generation and other energy usage likely would have maxed out prior to the sharp fall-off in natgas storage. Higher Coal Usage Buys EU Time Global natural gas markets are expected to remain tight into 2025, given the 5-year lead times required to develop LNG capacity export capacity.5 This is forcing EU member states – particularly Austria, France, Germany and the Netherlands – to place an additional 14 GW of coal-fired generation capacity into its reserve fleet in the event of a complete cutoff of Russian supplies.6 Fossil fuels accounted for 34% of EU generation in 2021, or 1,069 TWh. The largest share of this generation was accounted for by coal (Chart 3). Fossil fuels and renewables provide the largest shares of electricity generation overall in the EU (Chart 4). Chart 3Coal Folded Back Into EU Power Stack
Energy Security Rolls Over EU's ESG Agenda
Energy Security Rolls Over EU's ESG Agenda
The EU would like to see its natgas inventories 80% full by November. This translates to ~ 3.2 TCF of natgas in storage, which would put inventories at the higher end of the 5-year range for November. That’s a big assumption, but it does indicate why the combination of higher coal usage and – critically – the 15% cut in demand (vs. five-year average demand) in our simulations is so important. Together, these measures mean the EU will save almost 1.3 TCF of storage gas from August – March. This assumes, of course, that EU member states pull their weight on the conservation front in this economic war with Russia. If everything goes according to plan for the EU (scenario 2 in the Chart 2), then March 2023 inventories will be at the level of 2.5 Tcf. Compared to last year, that means inventories will be 1.3 Tcf higher. Of course that’s impossible to forecast, but there are realistic outcomes close to this outcome. Chart 4Fossil Fuels, Renewables Provide Most Of EU’s Power
Energy Security Rolls Over EU's ESG Agenda
Energy Security Rolls Over EU's ESG Agenda
Investment Implications The EU and Russia are at a critical juncture as winter approaches. Our analysis indicates the EU can – using its coal reserves and getting full buy-in on the 15% conservation measures adopted this week – weather this storm without experiencing a massive recession. Markets will be watching this evolution carefully. By late January or early February, it will be apparent how well the EU managed this challenge. If, as we believe, these measures are successful, we could expect a strong rally in European equities and bonds. Robert P. Ryan Chief Commodity & Energy Strategist rryan@bcaresearch.com Ashwin Shyam Research Analyst Commodity & Energy Strategy ashwin.shyam@bcaresearch.com Paula Struk Research Associate Commodity & Energy Strategy paula.struk@bcaresearch.com Commodities Round-Up Energy: Bullish The US became the largest exporter of LNG in 1H22 with outbound shipments averaging 11.2 Bcf/d, according to the EIA (Chart 5). US liquefaction peak capacity is estimated at 13.9 Bcf/d, with average capacity at 11.4 Bcf/d. The EU and UK are receiving most of the US LNG, which averaged 7.3 Bcf/d, or 64% of total exports over the January-May 2022 interval. Over 1H22, US exports accounted for close to half of the 15 Bcf/d imported by the EU and UK, making it the largest single exporter to Europe. Export volumes were dented in June with the loss of volumes from the Freeport LNG facility in Texas; this is expected to be restored by year-end. We are expecting exports to Europe to remain strong in the wake of the Russia-Ukraine war, especially as demand from Europe to replace Russian supplies stays strong. Base Metals: Bullish Chinese property stocks rallied on news that the government created a $44.4 billion fund to help alleviate the state’s property sector woes. Housing accounts for ~ 30% of copper consumption in China, and the fund should provide positive price action for the red metal in the face of slowing global growth this year and next. We remain bullish copper on the back of supply disruptions in Peru; increasing concern higher taxes in Chile will no longer support returns to miners that are sufficient to encourage capex, and extremely low global copper inventories, which have remained more than 25% below year-ago levels for more than a year (Chart 6). We will be updating our copper view next week. Ags/Softs: Neutral Russia and Ukraine signed a deal brokered by Turkey and the United Nations aimed at allowing some 22mm tons of grain exports from Ukraine, and some Russian grain and fertilizers to transit the Black Sea to end-use markets. These grain supplies are critically important to Middle East and North African markets. However, it could take weeks for Ukrainian ports to be cleared of mines and other obstacles – and, importantly, for a true cessation in Russian attacks on Black Sea port facilities – to resume operations.7 Chart 5
Energy Security Rolls Over EU's ESG Agenda
Energy Security Rolls Over EU's ESG Agenda
Chart 6
Global Copper Inventories Rebuilding But Still Down Y/Y
Global Copper Inventories Rebuilding But Still Down Y/Y
Footnotes 1 Please see EU allows get-out clause in Russian gas cut deal - BBC News, published by bbc.co.uk on July 27, 2022. 2 Please see the US Climate Prediction Center's most recent forecast, posted on July 14, 2022. 3 lease see Higher Gasoline, Diesel Prices Ahead, for discussion of the embargo on Russian crude and product imports to the EU. Our assessment was published on June 2, 2022, and is available at ces.bcaresearch.com. 4 As of July 25, EU natgas inventories were ~ 67% full at 2.5 TCF. 5 The IEA estimates growth in global LNG supply will slow over its five-year 2021-25 forecast horizon, due to low capex, and COVID-19-induced delays. Please see the IEA’s Gas Market Report, Q3-2022. 6 Please see Coal is not making a comeback: Europe plans limited increase, published by the European think tank Ember on July 13, 2022. 7 Please see Ukraine, Russia Sign Black Sea Grain Export Deal published by University Of Illinois, July 22, 2022. Investment Views and Themes Strategic Recommendations Trades Closed In 2022
Executive Summary If a loss of wealth persists for a year or more, it hurts the economy. The recent $40 trillion slump in global financial wealth is larger than that suffered in the pandemic of 2020, the global financial crisis of 2008, and the dot com bust of 2000-01. Partly countering this slump in global financial wealth is a $20 trillion uplift in global real estate wealth. However, Chinese home prices are already stagnating. And the recent disappearance of US and European homebuyers combined with a flood of home-sellers warns that US and European home prices will cool over the next 6 months. With the loss of wealth likely to persist, it will amplify a global growth slowdown already in train, aided and abetted by central banks that are willing to enter recession to slay inflation. The optimal asset allocation over the next 6-12 months is: overweight bonds, neutral stocks, and underweight commodities. A variation on this theme is: overweight conventional bonds and stocks versus inflation-protected bonds and commodities. Fractal trading watchlist: US telecoms versus utilities, and copper. We Have Just Suffered The Worst Loss Of Financial Wealth In A Generation
The World Is $20 Trillion Poorer. Why That Matters
The World Is $20 Trillion Poorer. Why That Matters
Bottom Line: On a 6-12 month horizon, overweight bonds, neutral stocks, and underweight commodities. Feature Since the end of last year, the world has lost $40 trillion of financial wealth, evenly split between the crashes in stocks and bonds (Chart I-1). The slump in financial wealth, both in absolute and proportionate terms, is the worst suffered in a generation, larger than that in the pandemic of 2020, the global financial crisis of 2008, and the dot com bust of 2000-01.1 Chart I-1Global Stocks And Global Bonds Have Both Slumped By $20 Trillion
Global Stocks And Global Bonds Have Both Slumped By $20 Trillion
Global Stocks And Global Bonds Have Both Slumped By $20 Trillion
Partly countering this $40 trillion slump in global financial wealth is a $20 trillion uplift in global real estate wealth. But in total, the world is still $20 trillion ‘asset poorer’ than at the end of last year. Given that global GDP is around $100 trillion, we can say that we are asset poorer, on average, by about one fifth of our annual income. Does this loss of wealth matter? A Loss Of Wealth Matters If It Persists For A Year Or More Some argue that we shouldn’t worry about the recent slump in our wealth, because we are still wealthier than we were, say, at the start of the pandemic (Chart I-2). Yet this is a facile argument. Whatever loss of wealth we suffer, there is always some point in the past against which we are richer! Chart I-2We Have Just Suffered The Worst Loss Of Financial Wealth In A Generation
We Have Just Suffered The Worst Loss Of Financial Wealth In A Generation
We Have Just Suffered The Worst Loss Of Financial Wealth In A Generation
Another argument is that people do not care about a short-lived dip in their wealth. This argument has more truth to it. For example, in the extreme event of a flash crash, an asset price can drop to zero and then bounce back in the blink of an eyelid. In this case, most people would be oblivious, or unconcerned, by this momentary collapse in their wealth. But people do care if the slump in their wealth becomes more prolonged. How long is prolonged? The answer is, if the slump persists for a year or more. Why a year? Because that is the timeframe over which governments, firms, and households make their income and spending plans. Governments and firms do this formally in their annual budgets that set tax rates, wages, bonuses, and investment spending. Households do it informally, because their wages, bonuses, and taxes – and therefore disposable incomes – also adjust on an annual basis. Into this yearly spending plan will also come any change in wealth experienced over the previous year. For example, firms often do this formally by converting an asset write-down to a deduction from profits, which will then impact the firm’s future spending. This illustrates that what impacts your spending is not the level of your wealth, but the yearly change in your wealth. Spending Is Impacted By The Change In Wealth The intellectual battle here is between Economics and Psychology. The economics textbooks insist that it is the level of your wealth that impacts your spending, whereas the psychology and behavioural finance textbooks insist that it is the change in your wealth that impacts your spending. (Chart I-3and Chart I-4). In my view, the psychologists and behavioural finance guys have nailed this better than the economists, through a theory known as Mental Accounting Bias. Chart I-3The Change And Impulse Of Stock Market Wealth Are Both Negative
The Change And Impulse Of Stock Market Wealth Are Both Negative
The Change And Impulse Of Stock Market Wealth Are Both Negative
Chart I-4The Change And Impulse Of Bond Market Wealth Are Both Negative
The Change And Impulse Of Bond Market Wealth Are Both Negative
The Change And Impulse Of Bond Market Wealth Are Both Negative
Nobel Laureate psychologist Daniel Kahneman points out that we categorise our money into different accounts, which are sometimes physical, sometimes only mental – and that there is a clear hierarchy in our willingness to spend these ‘mental accounts’. Put simply, we are willing to spend our income mental account, but we are much less willing to spend our wealth mental account. Still, wealth can generate income through interest payments and dividends, which we are willing to spend. Clearly, the level of income generated will correlate with the amount of wealth – $10 million of wealth will likely generate much more income than $1 million of wealth. So, economists get the impression that it is the level of wealth that impacts spending, but the truth is that it is the income generated by the wealth that impacts spending. We are willing to spend our income ‘mental account’, but we are much less willing to spend our wealth ‘mental account’. What about someone like Amazon founder Jeff Bezos who has immense wealth but seemingly negligible income – Mr. Bezos receives only a token salary, and his huge holding of Amazon shares pays no dividend – how then can we explain his largesse? The answer is that Mr. Bezos’ immense wealth generates tens of billions in trading income. So again, it is his income that is driving his spending. Wealth also generates an ‘income substitute’ via capital gains. For example, you should be indifferent between a $100 bond giving you $2 of income, or a $98 zero-coupon bond maturing in one year at $100, giving you $2 of capital gain. In this case the capital gain is simply an income substitute and fully transferred into the spending mental account. Nowhere is this truer than in China, where the straight-line appreciation in house prices through several decades has allowed homeowners to regard a reliable capital gain as an income substitute (Chart I-5). Which justifies rental yields on Chinese housing that are the lowest in the world and lower even than the yield on risk-free cash. In other words, which justifies a stratospheric valuation for Chinese real estate.
Image
Usually though, we tend to transfer only a proportion of our capital gains or losses into our spending mental account. As described previously, a firm will do this formally by transferring an asset write-down into the income statement. And households will do it informally by transferring some proportion of their yearly change in wealth into their spending mental account. The important conclusion is that spending is impacted by the yearly change in wealth. Meaning that spending growth is impacted by the yearly change in the yearly change in wealth, known as the wealth (1-year) impulse, where a negative impulse implies negative growth. Cracks Appearing In The Housing Market Given the recent slump in financial wealth, the global financial wealth impulse is in deeply negative territory. Yet by far the largest part of our wealth comprises housing, meaning the value of our homes2 (Chart I-6). In China, the recent stagnation of house prices means that the housing wealth impulse has turned negative. Elsewhere in the world though, the recent boom in house prices means that the housing wealth impulse is still positive, meaning a tailwind – albeit a rapidly fading tailwind – to spending (Chart I-7 and Chart I-8). Chart I-6Housing Comprises By Far The Largest Part Of Our Wealth
Housing Comprises By Far The Largest Part Of Our Wealth
Housing Comprises By Far The Largest Part Of Our Wealth
Chart I-7Chinese House Prices Have Stagnated, US House Prices Have Surged
The World Is $20 Trillion Poorer. Why That Matters
The World Is $20 Trillion Poorer. Why That Matters
Chart I-8The Chinese Housing Wealth Impulse Is Negative, The US Housing Wealth Impulse Is Fading
The Chinese Housing Wealth Impulse Is Negative, The US Housing Wealth Impulse Is Fading
The Chinese Housing Wealth Impulse Is Negative, The US Housing Wealth Impulse Is Fading
In China, the recent stagnation of house prices means that the housing wealth impulse has turned negative. Still, as we explained in The Global Housing Boom Is Over, As Buying Becomes More Expensive Than Renting, the disappearance of homebuyers combined with a flood of home-sellers is a tried and tested indicator that US and European home prices will cool over the next 6 months. US new home prices have already suffered a significant decline in June (Chart I-9). Some of this is because US homebuilders are building smaller and less expensive homes. Nevertheless, it seems highly likely that the non-China housing wealth impulse will also turn negative later this year. Chart I-9US New Home Prices Fell Sharply In June
US New Home Prices Fell Sharply In June
US New Home Prices Fell Sharply In June
To be clear, the wealth impulse is just one driver of spending growth. Nevertheless, it does have the potential to amplify the growth cycle in either direction. With global growth clearly slowing, and central banks willing to enter recession to slay inflation, the rapidly fading global wealth impulse will amplify the slowdown. Therefore, the optimal asset allocation over the next 6-12 months is: Overweight bonds. Neutral stocks. Underweight commodities. A variation on this theme is: Overweight conventional bonds and stocks versus inflation-protected bonds and commodities. Fractal Trading Watchlist After a 35 percent decline since March, copper has hit a resistance point on its short-term fractal structure, from which it could experience a countertrend move. Hence, we are adding copper to our watchlist. Of note also, the underperformance of US telecoms versus utilities has reached the point of fragility on its 260-day fractal structure that has signalled previous major turning points in 2012, 2014, and 2017 (Chart I-10). Hence, the recommended trade is long US telecoms versus utilities, setting a profit target and symmetrical stop-loss at 8 percent. Chart I-10US Telecoms Versus Utilities Are At A Potential Turnaround
US Telecoms Versus Utilities Are At A Potential Turnaround
US Telecoms Versus Utilities Are At A Potential Turnaround
Fractal Trading Watchlist: New Additions Copper’s Selloff Has Hit Short-Term Resistance
Copper's Selloff Has Hit Short-Term Resistance
Copper's Selloff Has Hit Short-Term Resistance
Dhaval Joshi Chief Strategist dhaval@bcaresearch.com Footnotes 1 The value of global equities has dropped by $20tn to $80tn, the value of global bonds by $20tn to around $100tn, while the value of global real estate has increased by $20tn to an estimated $370tn. 2 Strictly speaking, housing wealth should be measured net of the mortgage debt that is owed on our homes. But as the wealth impulse is a change of a change, and mortgage debt changes very slowly, it does not matter whether we calculate the impulse from gross or net housing wealth. Chart 1CNY/USD At A Potential Turning Point
CNY/USD At A Potential Turning Point
CNY/USD At A Potential Turning Point
Chart 2Copper's Selloff Has Hit Short-Term Resistance
Copper's Selloff Has Hit Short-Term Resistance
Copper's Selloff Has Hit Short-Term Resistance
Chart 3US REITS Are Oversold Versus Utilities
US REITS Are Oversold Versus Utilities
US REITS Are Oversold Versus Utilities
Chart 4CAD/SEK Is Reversing
CAD/SEK Is Reversing
CAD/SEK Is Reversing
Chart 5Financials Versus Industrials Has Reversed
Financials Versus Industrials Has Reversed
Financials Versus Industrials Has Reversed
Chart 6The Outperformance Of Resources Versus Biotech Has Ended
The Outperformance Of Resources Versus Biotech Has Ended
The Outperformance Of Resources Versus Biotech Has Ended
Chart 7The Outperformance Of Resources Versus Healthcare Has Ended
The Outperformance Of Resources Versus Healthcare Has Ended
The Outperformance Of Resources Versus Healthcare Has Ended
Chart 8FTSE100 Outperformance Vs. Euro Stoxx 50 Is Vulnerable To Reversal
FTSE100 Outperformance Vs. Euro Stoxx 50 Is Vulnerable To Reversal
FTSE100 Outperformance Vs. Euro Stoxx 50 Is Vulnerable To Reversal
Chart 9Netherlands' Underperformance Vs. Switzerland Has Ended
Netherlands' Underperformance Vs. Switzerland Has Ended
Netherlands' Underperformance Vs. Switzerland Has Ended
Chart 10The Sell-Off In The 30-Year T-Bond At Fractal Fragility
The Sell-Off In The 30-Year T-Bond At Fractal Fragility
The Sell-Off In The 30-Year T-Bond At Fractal Fragility
Chart 11The Sell-Off In The NASDAQ Is Approaching Fractal Fragility
The Sell-Off In The NASDAQ Is Approaching Fractal Fragility
The Sell-Off In The NASDAQ Is Approaching Fractal Fragility
Chart 12Food And Beverage Outperformance Is Exhausted
Food And Beverage Outperformance Is Exhausted
Food And Beverage Outperformance Is Exhausted
Chart 13German Telecom Outperformance Has Started To Reverse
German Telecom Outperformance Has Started To Reverse
German Telecom Outperformance Has Started To Reverse
Chart 14Japanese Telecom Outperformance Vulnerable To Reversal
Japanese Telecom Outperformance Vulnerable To Reversal
Japanese Telecom Outperformance Vulnerable To Reversal
Chart 15ETH Is Approaching A Possible Capitulation
ETH Is Approaching A Possible Capitulation
ETH Is Approaching A Possible Capitulation
Chart 16The Strong Trend In The 18-Month-Out US Interest Rate Future Has Ended
The Strong Trend In The 18-Month-Out US Interest Rate Future Has Ended
The Strong Trend In The 18-Month-Out US Interest Rate Future Has Ended
Chart 17The Strong Downtrend In The 3 Year T-Bond Has Ended
The Strong Downtrend In The 3 Year T-Bond Has Ended
The Strong Downtrend In The 3 Year T-Bond Has Ended
Chart 18A Potential Switching Point From Tobacco Into Cannabis
A Potential Switching Point From Tobacco Into Cannabis
A Potential Switching Point From Tobacco Into Cannabis
Chart 19Biotech Is A Major Buy
Biotech Is A Major Buy
Biotech Is A Major Buy
Chart 20Norway's Outperformance Has Ended
Norway's Outperformance Has Ended
Norway's Outperformance Has Ended
Chart 21Cotton Versus Platinum Has Reversed
Cotton Versus Platinum Has Reversed
Cotton Versus Platinum Has Reversed
Chart 22Switzerland's Outperformance Vs. Germany Is Exhausted
Switzerland's Outperformance Vs. Germany Is Exhausted
Switzerland's Outperformance Vs. Germany Is Exhausted
Chart 23USD/EUR Is Vulnerable To Reversal
USD/EUR Is Vulnerable To Reversal
USD/EUR Is Vulnerable To Reversal
Chart 24The Outperformance Of MSCI Hong Kong Versus China Has Ended
The Outperformance Of MSCI Hong Kong Versus China Has Ended
The Outperformance Of MSCI Hong Kong Versus China Has Ended
Chart 25A Potential New Entry Point Into Petcare
A Potential New Entry Point Into Petcare
A Potential New Entry Point Into Petcare
Chart 26GBP/USD At A Potential Turning Point
GBP/USD At A Potential Turning Point
GBP/USD At A Potential Turning Point
Chart 27US Utilities Outperformance Vulnerable To Reversal
US Utilities Outperformance Vulnerable To Reversal
US Utilities Outperformance Vulnerable To Reversal
Chart 28The Outperformance Of Oil Versus Banks Is Exhausted
The Outperformance Of Oil Versus Banks Is Exhausted
The Outperformance Of Oil Versus Banks Is Exhausted
Fractal Trading System Fractal Trades
The World Is $20 Trillion Poorer. Why That Matters
The World Is $20 Trillion Poorer. Why That Matters
The World Is $20 Trillion Poorer. Why That Matters
The World Is $20 Trillion Poorer. Why That Matters
6-12 Month Recommendations Structural Recommendations Closed Fractal Trades Indicators To Watch - Bond Yields Chart II-1Indicators To Watch - Bond Yields - Euro Area
Indicators To Watch - Bond Yields - Euro Area
Indicators To Watch - Bond Yields - Euro Area
Chart II-2Indicators To Watch - Bond Yields - Europe Ex Euro Area
Indicators To Watch - Bond Yields - Europe Ex Euro Area
Indicators To Watch - Bond Yields - Europe Ex Euro Area
Chart II-3Indicators To Watch - Bond Yields - Asia
Indicators To Watch - Bond Yields - Asia
Indicators To Watch - Bond Yields - Asia
Chart II-4Indicators To Watch - Bond Yields - Other Developed
Indicators To Watch - Bond Yields - Other Developed
Indicators To Watch - Bond Yields - Other Developed
Indicators To Watch - Interest Rate Expectations Chart II-5Indicators To Watch - Interest Rate Expectations
Indicators To Watch - Interest Rate Expectations
Indicators To Watch - Interest Rate Expectations
Chart II-6Indicators To Watch - Interest Rate Expectations
Indicators To Watch - Interest Rate Expectations
Indicators To Watch - Interest Rate Expectations
Chart II-7Indicators To Watch - Interest Rate Expectations
Indicators To Watch - Interest Rate Expectations
Indicators To Watch - Interest Rate Expectations
Chart II-8Indicators To Watch - Interest Rate Expectations
Indicators To Watch - Interest Rate Expectations
Indicators To Watch - Interest Rate Expectations
US services spending collapsed during the COVID-19 pandemic, and remains significantly below the level that would have prevailed had the pandemic not occurred. This raises the question of whether services consumption will ever return to “normal.” In this report, we address this question by examining the weakest components of services spending, with an eye towards any evidence indicating that this weakness is permanent. A category analysis of services spending highlights that the spending gap currently exists due to a combination of work-from-home trends and evidence of lasting aversion to COVID-19. The latter is unlikely to be permanent, and the former will be partially or fully offset by a permanent increase in substitutable goods spending. In a non-recessionary scenario, our analysis suggests that the US services spending gap will continue to close, which will provide support for overall consumption as goods spending slows in response to weak real wage growth and higher interest rates. The COVID-19 pandemic has been enormously disruptive, socially as well as economically. In the US, a massive shift from services to goods spending represents one of the most significant economic disruptions caused by the pandemic, which persists even today. Chart II-1The Pandemic Caused An Extreme Shift In Spending From Services To Goods
The Pandemic Caused An Extreme Shift In Spending From Services To Goods
The Pandemic Caused An Extreme Shift In Spending From Services To Goods
Chart II-1 presents our best estimate of the real goods and services spending gaps relative to potential GDP, which illustrates how extreme the shift from services to goods has been. The real goods spending gap exploded during the pandemic to a level that had not been seen since the early-1950s, and services spending collapsed in an unprecedented fashion and remains at a level that is lower than at any other point over the past seven decades (aside from the worst of the pandemic itself). Chart II-2 highlights that the overall output and household consumption gaps have not yet turned positive, despite an extremely strong labor market. This underscores that weak services spending is playing a role in depressing consumption, and thus overall economic activity. Chart II-2Weak Services Spending Is Playing A Role In Depressing Consumption
Weak Services Spending Is Playing A Role In Depressing Consumption
Weak Services Spending Is Playing A Role In Depressing Consumption
This persistent weakness in services spending raises the question of whether services consumption will ever return to “normal,” defined as the level of spending that would have likely prevailed had the pandemic never occurred. In this report we address this question by examining the weakest components of services spending, with an eye towards any evidence indicating that this weakness is permanent. We conclude that the services spending gap currently exists due to a combination of WFH trends and evidence of lasting aversion to COVID-19. While the effect of the former may be permanent, we do not believe that the effect of the latter will be. And, in cases where certain categories of services spending are likely to be permanently lower, at least some of this decline in spending is likely to be partially or fully offset by a permanent increase in substitutable goods spending. In a non-recessionary scenario, our analysis suggests that the US services spending gap will continue to close, which will provide support for overall consumption as goods spending slows in response to weak real wage growth and higher interest rates. The Pandemic, Remote Work, And Services Spending During the very early phase of the pandemic, COVID-19 was spreading rapidly in industrialized economies. Following recommended or mandatory stay at home orders from governments in many countries, most office-based businesses rapidly shifted to work-from-home (WFH) arrangements as an emergency response. This, in conjunction with forced closures of “close contact” businesses such as restaurants, entertainment, and travel caused US services spending to collapse. However, by the summer of 2021, many of these pandemic control measures had been significantly eased or lifted in the US. In addition, several national US surveys found many office workers preferred the flexibility afforded by WFH arrangements. Many employers, correspondingly, found that the productivity of their employees did not suffer while working from home, or that it even improved. These findings led many in the business community to conclude that WFH policies are not, in fact, emergency measures that will ultimately be reversed and instead reflect the “new normal” for work. While this “new normal” is still in the process of being defined, it seems fairly clear that some form of hybrid work arrangements will be permanent for many businesses. Chart II-3 presents the Kastle Systems Back to Work Barometer, which reflects keycard swipes in office buildings in the top 10 US cities. The chart highlights that urban office building activity has recovered to less than half of its pre-pandemic level, and that there has been no evidence of a continued uptrend over the past 3 months. Chart II-4 reinforces this point by highlighting that public transit use in major US cities has lagged the recovery in air travel, and also has not substantially changed over the past few months. Chart II-3Urban Office Building Activity Has Recovered To Less Than Half Of Its Pre-Pandemic Level
Urban Office Building Activity Has Recovered To Less Than Half Of Its Pre-Pandemic Level
Urban Office Building Activity Has Recovered To Less Than Half Of Its Pre-Pandemic Level
Chart II-4Urban Public Transit Use Has Lagged The Recovery In Air Travel
Urban Public Transit Use Has Lagged The Recovery In Air Travel
Urban Public Transit Use Has Lagged The Recovery In Air Travel
This underscores that investors have a basis to question whether at least some US services spending may be permanently impaired by the pandemic, as was the case for overall output for several years following the 2008/2009 global financial crisis. To answer this question, we present a detailed review of the most lagging categories of US services spending on pages 8-15, focused on whether WFH trends and/or activity in central business districts can plausibly explain the gap in spending in each category. The US Services Spending Gap: Key Observations And Conclusions As discussed in greater detail below, we make the following observations about the US services spending gap: Among the seven major categories of US services spending, health care accounts for the largest portion of the services spending gap. Reduced health care spending has little to do with work from home trends, and more to do with an aversion to contracting the disease in a healthcare environment and the reluctance to place elderly relatives in nursing homes given the higher risk that COVID presents to those who are older. Some recreation services spending has been impacted by WFH trends and thus may be permanent, but a lingering fear of crowded indoor spaces and still-recovering international tourism appear to be more important drivers of the recreation services spending gap. Some portion of reduced transportation services spending may be permanent (either in whole or in part), as the spending gap in road transportation seems strongly connected to WFH trends. But the sizeable and impactful decline in real spending on motor vehicle leasing is likely to recover as motor vehicle production improves over the coming year, suggesting that transportation services spending will continue to improve over the coming year relative to its pre-pandemic trend even if a spending gap in this category of services spending is permanent or long-lasting. Personal care and clothing services is mostly responsible for the spending gap in other services, and clear WFH effects do suggest that a reduction in spending in this category may be permanent. However, these categories are relatively small, and in some cases have been partially offset by what is likely to be a permanently positive spending gap on equivalent goods. The takeaway for investors is that the services spending gap currently exists due to a combination of WFH trends and evidence of lasting aversion to COVID-19. While some investors may interpret these observations as suggesting that the gap will act as a permanent or long-lasting drag on consumer spending, we disagree for two important reasons. First, we agree that some form of hybrid work arrangements will be permanent for many businesses, and that a spending gap may be permanent or long-lasting for spending categories most closely tied to WFH effects. But this also suggests that the goods-equivalent spending that has occurred as a result of this decline in services spending will also be permanent. In other words, some of the drag that permanent WFH effects will have on overall consumer spending will be offset by a permanent increase in certain categories of goods spending. Chart II-5Some Of The Permanent Drag On Services Spending Will Be Offset By Permanently Higher Goods Spending
Some Of The Permanent Drag On Services Spending Will Be Offset By Permanently Higher Goods Spending
Some Of The Permanent Drag On Services Spending Will Be Offset By Permanently Higher Goods Spending
Chart II-5 highlights the sum of spending for two pairs of clearly substitutable services/goods categories: miscellaneous personal care services plus personal care products, and sporting equipment, supplies, guns, and ammunition plus membership clubs and participant sports centers. The chart highlights that the sum of these four categories is currently above its pre-pandemic trend, highlighting that permanently lower spending in some services categories affected by WFH trends will likely be offset by permanently higher spending in some goods categories. Second, we doubt that a strong aversion to a COVID-19 infection will be permanent, as the endemicity of the disease has yet to be recognized by the public and normalized by political leaders and health professionals. This is especially true given that the availability and awareness of Pfizer’s Paxlovid antiviral therapy is still in its early stages in the US, and remains severely restricted in other developed economies and (for now) essentially unavailable in the emerging world. As an additional point concerning the lingering societal fear of COVID-19, estimates for the likely annual disease burden from “endemic COVID” are now coming into focus. In a recent New York Times opinion piece, the author cited forecasts from a number of medical professionals that endemic COVID-19 will likely infect roughly half of the US population per year, and will kill on the order of 100,000-250,000 Americans annually.1 That compares with roughly 50,000 fatalities over the course of a year from the worst flu season experienced over the past decade, implying that COVID-19 will end up being between 2-5 times as bad over the longer term as worst-case flu. If the disease burden of endemic COVID-19 ends up being on the higher end of that estimate, then it is likely that an aversion to crowded spaces and shared human settings will be permanent. But we suspect that the eventually-widespread availability of Paxlovid – and other treatment options that have yet to be developed – makes it more likely that annual fatalities will be on the lower end of that range. Chart II-6“Endemic COVID” Will Still Be A Significant Killer, But It Will Not Likely Cause A Permanent Fear Of Crowded Spaces
August 2022
August 2022
While tragic, a disease with a fatality rate of 30 per 100,000 people (equivalent to 100,000 US deaths per year) will rank behind accidents, chronic lower respiratory diseases (such as bronchitis, emphysema, and asthma), stroke, and just in line with Alzheimer’s disease as a leading cause of death (Chart II-6). It is certainly unwelcome that a new leading cause of death has emerged. But given that COVID-19 will never go away, we doubt that this will be enough to cause a permanent change in public behavior, suggesting that US services spending will return to normal over time. To the extent that some services spending declines are permanent, we expect that to be partially or fully offset by a permanent increase in substitutable goods spending. Investment Conclusions As we discussed in Section 1 of our report, the risk of a US recession is quite elevated. In a non-recessionary scenario, our analysis suggests that the US services spending gap will continue to close, which will provide support for overall consumption as goods spending slows in response to weak real wage growth and higher interest rates. Chart II-7In A Nonrecessionary Scenario, Excess Savings Will Support Services Spending
In A Nonrecessionary Scenario, Excess Savings Will Support Services Spending
In A Nonrecessionary Scenario, Excess Savings Will Support Services Spending
Chart II-7 highlights that the excess savings that have accumulated since the onset of the pandemic – which can be deployed to support spending – have accrued heavily to upper income earners, who are typically responsible for a significant amount of services spending. While it is true that upper income earners have also suffered a significant wealth shock from the combined effect of falling stock and bond prices, we strongly suspect that excess savings and the transition to endemic COVID-19 will support services spending and cause it to move toward the level that would have prevailed had the pandemic not occurred. In a recessionary scenario, we doubt that services spending would fall significantly, given that it is still extraordinarily depressed relative to history. However, some cyclical categories of services spending would decline, and Chart II-1 highlighted that services spending does tend to decline during recessions. The key point for investors is that changes in services spending would not be large enough to cushion a meaningful decline in goods spending were a recession to emerge. While the emergence of a US recession is not yet a foregone conclusion, the risk that it will occur is an important reason supporting our a neutral asset allocation stance. As noted in Section 1 of our report, further signs of an impending recession would cause us to recommend that investors underweight risky assets over the coming 6-12 months. Jonathan LaBerge, CFA Vice President The Bank Credit Analyst Gabriel Di Lullo Research Associate Overall Household Consumption Expenditures for Services Household consumption expenditures for services is composed of seven categories of services spending: Housing and Utilities, Health Care, Transportation Services, Recreation Services, Food Services and Accommodations, Financial Services and Insurance, and Other Services. In order to gauge to what degree services spending is likely to be permanently impaired by the COVID-19 pandemic, we estimate the “services spending gap” for each of these seven categories based on the pre-pandemic trend of overall services spending and the pre-pandemic weight of each category (Chart II-8). Chart II-8The Services Spending Gap Is Fairly Broad-Based
August 2022
August 2022
Spending fell in all seven services categories during the early phase of the COVID-19 pandemic, but the pace of their respective recoveries has been varied. Spending in many of these sectors has not yet fully recovered relative to its pre-pandemic trend (Charts II-9 and 10), contributing to a spending gap of more than $350 billion real dollars.2 Chart II-8 presents a breakdown of this spending gap by category, and we analyze the drivers of each of these gaps by examining subcategories of services spending on pages 8-15. Our subcategory analysis focuses on areas of services spending that are well below their pre-pandemic level, rather than relative to the hypothetical level of spending that would have prevailed had the pandemic not occurred. This is due to BEA data limitations that prevent us from accurately attributing category spending gaps to subcategories in real terms. Charts II-8-10 underscore that the services spending gap is very broad-based. However, four categories stand out as being particularly impactful: health care, recreation services, transportation services and other services. We discuss the causes of the spending gap in these four categories below, with the goal of determining whether they will likely abate as the pandemic continues to recede, or whether they are likely to be permanent. Chart II-9Four Categories Of Services Spending Stand Out…
Four categories Of Services Spending Stand Out...
Four categories Of Services Spending Stand Out...
Chart II-10…As Being Particularly Impactful Drivers Of The Services Spending Gap
...As Being Particularly Impactful Drivers Of The Services Spending Gap
...As Being Particularly Impactful Drivers Of The Services Spending Gap
Health Care Real US personal consumption on health care services is currently $126 billion below our estimate of its pre-pandemic trend, and is currently just below its pre-pandemic level (Chart II-11). “Missing” health care spending accounts for the largest share of the overall spending gap for household consumption expenditures for services. Chart II-11“Missing” Health Care Spending Accounts For A Large Part Of The Overall Services Spending Gap
August 2022
August 2022
Health care spending initially experienced a V-shaped recovery following the onset of the pandemic, but the pace of recovery has since slowed. The sectors displaying the most significant deviations from their pre-pandemic levels are physician services, dental services, and nursing home spending (Chart II-12). The gap in spending on hospital, physician, and dental services is clearly related to the COVID-19 pandemic, in the sense that some households likely fear contracting the disease in a healthcare setting (especially given the invasive nature of dental treatments). It is also possible that households have been visiting doctor and dentist offices less frequently due to work-from-home policies, in cases where these offices were located in or adjacent to central business districts. Nursing home spending is very much the outlier in the health care sub-sectors, in the sense that its recovery has been more U-shaped than V-shaped. As the pandemic placed the elderly at great risk, we suspect that many family members decided to remove them from nursing homes (or postpone moving them into a nursing home), due to the concern that a communal living environment significantly increased the risk of COVID exposure. Bottom Line: We strongly doubt that the gap in healthcare services spending is permanent. The increasing availability of Paxlovid should help physician services, dental services, and nursing home spending recover, although it is possible that nursing home spending will be the most lagging of the three. Still, we expect that the health care services spending gap will close meaningfully over the coming year if a US recession is avoided (and possibly even if a recession does occur). Chart II-12Some Households Likely Fear Contracting COVID In A Healthcare Setting
Some Households Likely Fear Contracting COVID In A Healthcare Setting
Some Households Likely Fear Contracting COVID In A Healthcare Setting
Chart II-13Lingering Fears Of Crowded Indoor Spaces And Still Weak Tourism Explain Weak Recreation Services Spending
Lingering Fears Of Crowded Indoor Spaces And Still Weak Tourism Explain Weak Recreation Services Spending
Lingering Fears Of Crowded Indoor Spaces And Still Weak Tourism Explain Weak Recreation Services Spending
Recreation Services Real spending on recreation services is currently $75 billion below its pre-pandemic trend, and remains well below its pre-pandemic level (Chart II-14). Despite only accounting for 6% of household consumption expenditure for services, the sharp decline in spending in certain sub-sectors of recreation services has been large enough to significantly contribute to the overall services spending gap. Chart II-14The Recreation Services Spending Gap: Concerts, Amusement Parks, Movies, And Gyms
August 2022
August 2022
Chart II-13 highlights that the sectors most responsible for the gap in recreation services spending are 1) live entertainment excluding sports, 2) amusement parks, campgrounds and related recreational services, 3) motion picture theatres, and 4) membership clubs and participant sports centers. A fairly clear narrative explains large spending gaps in three of these categories. In contrast to real spending on spectator sports, which is currently $9 billion above its pre-pandemic level, movies and concerts tend to be held indoors, underscoring that large spending gaps in these categories likely reflect lingering fears of contracting COVID in crowded indoor spaces. Membership clubs and participant sports centers spending is also explained by the COVID-fear effect, although some of the spending gap in this subcategory may be long-lasting as it is also seemingly related to work-from-home effects (for example, substituting home exercise equipment for gym memberships). Real spending on amusement parks, campgrounds and related recreational services is somewhat more difficult to explain, given that spending on these types of services tend to occur outdoors. In addition, some high-profile examples of amusement parks, such as those maintained by the Walt Disney Company in California and Florida, have seemingly experienced strong attendance compared with pre-pandemic levels. We suspect that weakness in this spending category reflects the fact that international tourism has yet to return to its pre-pandemic level. Over the past 12 months, visitor arrivals to the US, while rising, have been less than 40% of what prevailed prior to the pandemic. Bottom Line: We strongly doubt that a sizeable majority of the recreation services spending gap is permanent. As noted for healthcare spending, the increased availability of Paxlovid should progressively reduce the fear associated with crowded indoor spaces, which we believe will cause the recreation services spending gap to close meaningfully over the coming year if a US recession is avoided. Transportation Services Real spending on transportation services is currently $64 billion below our estimate of its pre-pandemic trend, and remains well below its pre-pandemic level (Chart II-15). Chart II-15Road Transportation And Motor Vehicle Leasing Are The Largest Contributors To The Transportation Services Spending Gap
August 2022
August 2022
Similar to recreation services spending, transportation services spending accounts for only 5% of household consumption expenditure for services, but the extent of the decline in certain categories of transportation services spending has significantly contributed to the overall gap in services spending. The sectors responsible for the transportation services spending gap are: road transportation, motor vehicle leasing, motor vehicle maintenance and repair, and parking fees and tolls (Chart II-16). Some of the gap in transportation services spending is related to work-from-home trends, and as such may be permanent (either in whole or in part). The decline in road transportation spending has been heavily driven by a collapse in spending on intercity buses and mass transit, which is strongly connected to reduced office building occupancy in major US cities and also appears to explain reduced spending on parking fees and tolls. In addition, weak motor vehicle maintenance and repair seems strongly correlated with retail and recreation mobility, which remains below its pre-pandemic level. However, reduced spending on motor vehicle leasing accounts for an important portion of the transportation services spending gap, and does not appear to be caused by work-from-home trends. Instead, the decline in leasing seems strongly linked to the decline in motor vehicle inventory that has caused an enormous rise in new and used car prices. As we have discussed at length in previous reports, this decline in vehicle production and sales has been caused by a semiconductor shortage that will eventually abate, underscoring that this subcomponent of transportation services spending will eventually recover. Bottom Line: We expect the transportation services spending gap to close further over the coming year, even if it does not close fully. Some portion of reduced transportation services spending may be permanent (either in whole or in part), but spending on motor vehicle leasing will not be, suggesting that transportation services spending will continue to improve over the coming year relative to its pre-pandemic trend if a contraction in the US economy is avoided. Chart II-16Some Of The Gap In Transportation Services Spending May Be Permanent
Some Of The Gap In Transportation Services Spending May Be Permanent
Some Of The Gap In Transportation Services Spending May Be Permanent
Chart II-17Personal Care And Clothing Services Spending Has Definitely Been Impacted By Work-From-Home Trends
Personal Care And Clothing Services Spending Has Definitely Been Impacted By Work-From-Home Trends
Personal Care And Clothing Services Spending Has Definitely Been Impacted By Work-From-Home Trends
Other Services Other services spending represents a 14% share of household consumption expenditure for services. Real spending on other services is currently $51 billion below our estimate of its pre-pandemic trend, and still below its pre-pandemic level (Chart II-18). In percentage terms, the other services spending gap is smaller than for health care, recreation services, and transportation services, but it is closer in dollar terms because other services spending is a larger expenditure category. Chart II-18Some Other Services Spending Is Higher Than Before The Pandemic, But Personal Care And Clothing Services Is The Laggard
August 2022
August 2022
Real spending on other services is below its pre-pandemic level in four subcategories: personal care and clothing services, education services, household maintenance, and social services and religious activities. However, the majority of the spending gap in other services is accounted for by personal care and clothing services (Chart II-17). Some components of personal care and clothing services spending are likely permanently impaired (in whole or in part). Almost all of clothing and footwear services spending is made up by spending on laundry and dry-cleaning services, which remains 12% below its pre-pandemic level and is not exhibiting any meaningful uptrend. In addition, within personal care services, spending on hairdressing salons and personal grooming establishments remains well below its pre-pandemic level, and is only slowly recovering in line with central business district office occupancy. However, one interesting aspect of personal care services spending is that spending on personal care products has increased significantly during the pandemic as spending on miscellaneous personal care services decreased. This suggests that any permanently negative spending gap on personal care and clothing services will be at least partially offset by a permanently positive spending gap on personal care products. Bottom Line: Some of the negative spending gap on other services is likely to be permanent or long-lasting due to persistent work-from-home effects, but at least some of this negative gap will be offset by a permanently positive spending gap on the goods equivalent of these services. Footnotes 1 New York Times Opinion, Endemic Covid-19 Looks Pretty Brutal, July 20, 2022 2 Please note that all real dollar references in this report refer to chained (2012) dollars.
The Global Investment Strategy service tactically downgraded equities in February but then upgraded them in May. The decision to upgrade equities to overweight in May was clearly premature, as stocks fell significantly in June. However, the rally in July has brought stocks back above the level where we upgraded them. Hence, we are using this opportunity to shift our recommended equity allocation back to neutral. While our base case forecast still foresees no recession in the US over the next 12 months, the risks to this view have increased. In Europe, we see a recession as more likely than not. China’s economy will remain under pressure due to Covid lockdowns, a shift in global spending away from manufactured goods, and a weakening property market. Even if the US avoids a recession, this could prove to be a bittersweet outcome for stocks: While earnings will hold up, the Fed is unlikely to cut rates next year, as markets are currently discounting. Real bond yields, which have already risen steeply this year, will rise further, weighing on equity valuations. Time to Take Some Chips Off the Table The consensus view among investors these days seems to be that the US is heading into a recession (or may already be in one), which will cause stocks to fall during the remainder of the year as earnings estimates are slashed. Looking out to 2023, most investors expect stocks to recover as the Fed begins to cut rates. I have the opposite view. While the risks to growth have increased, the US will probably avoid a recession over the next 12 months. This will allow stocks to rise modestly from current levels into year-end. However, as we enter 2023, it will become obvious that the Fed has no reason to cut rates. This could cause stocks to give up some of their gains, thus producing a fairly flat profile for equities over a 12-month horizon. In past reports, we have argued that the neutral rate of interest – the interest rate consistent with full employment and stable inflation – is higher than widely believed in the US. The nice thing about a high neutral rate is that it insulates the economy from tighter monetary policy: Even if the Fed raises rates to 3.8% next year, as the dots are currently forecasting, that will only put rates in the middle of our fair value range of 3.5%-to-4% for the US neutral rate. The downside of a high neutral rate is that eventually, investors will need to value stocks using a higher discount rate. The 10-year TIPS yield has already increased from -0.97% at the start of the year to +0.36% today. It will rise to 1%-to-1.5% by the middle of 2023. A higher-than-expected neutral rate also raises inflation risks because it could cause the Fed to inadvertently keep monetary policy too loose. Inflation is likely to fall significantly over the coming months as supply-chain bottlenecks ease. However, this decline in inflation could sow the seeds of its own demise: As inflation falls, real wage growth – which is now negative – will turn positive. Rising real wages will booster consumer confidence and spending. A reacceleration in inflation in the second half of next year could prompt the Fed to start hiking rates again in late 2023, thus producing a recession not in 2022 but in 2024. Outside the US, the outlook is more challenging. In Europe, a recession is more likely than not in the second half of the year. We expect the recession to be fairly short-lived, with European governments moving aggressively to mitigate the fallout from gas shortages through various income support schemes for the private sector. Chinese growth should rebound in the second half of the year. However, the specter of future lockdowns, the shift in global spending away from manufactured goods towards services, and the weakening property sector will continue to weigh on activity. We will have much more to say about this view change early next week. In the meantime, please review our report from last week entitled “The Downside Of A Soft Landing” for further color on some of the points made in this short bulletin. Tomorrow, my colleague Ritika Mankar will be sending you a Special Report making the case that the US economy’s ability to spawn mega-sized companies may become increasingly compromised over the next decade. Peter Berezin Chief Global Strategist peterb@bcaresearch.com Follow me on LinkedIn & Twitter.
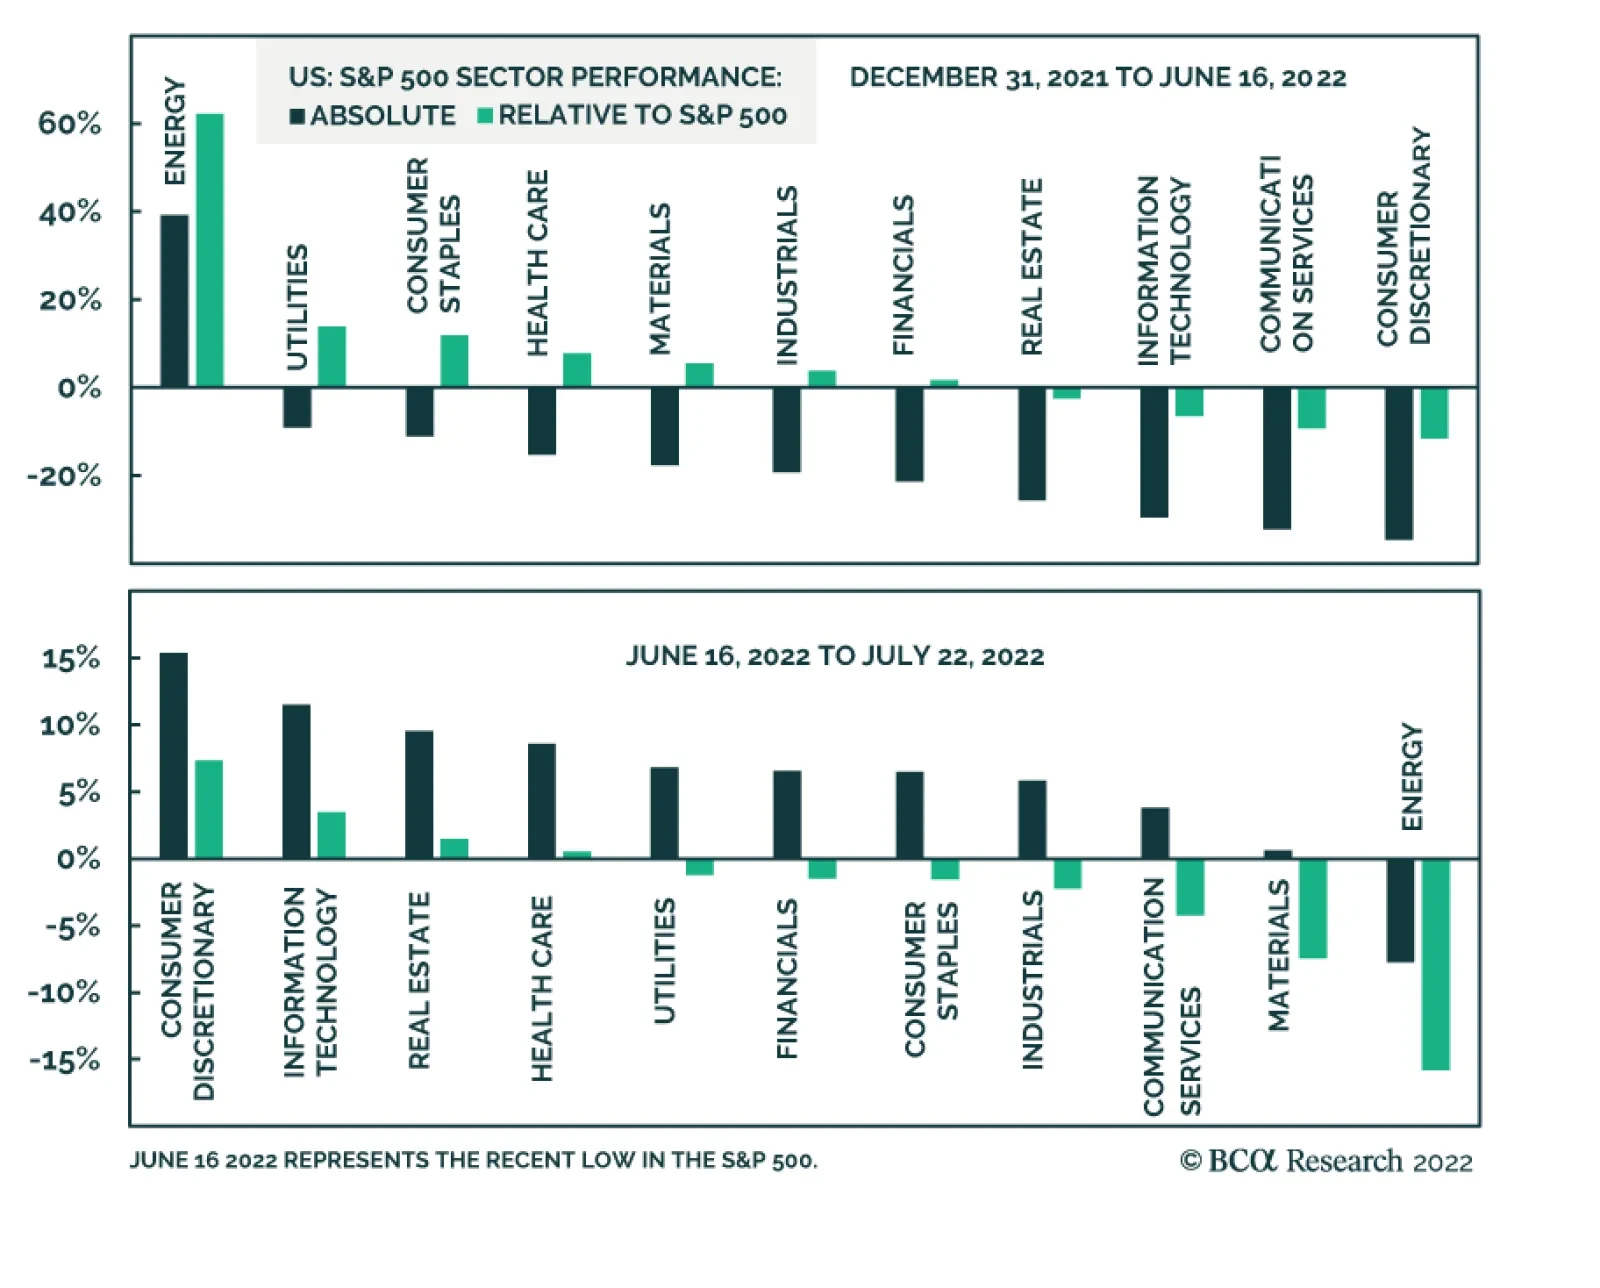
This year’s US equity selloff has been broad-based. Energy is the only S&P 500 sector that has posted year-to-date gains. The indiscriminate nature of the slump highlights that macro forces are behind the weakness. The Fed’s abrupt hawkish pivot has…
Executive Summary More Tightening To Come
More Tightening To Come
More Tightening To Come
In the following report we answer the most asked questions from our recent “Bear Market 2.0” webcast. Macroeconomic backdrop and inflation: While commodity prices falling, the wage-price spiral is in full force, implying that it will take many months to reach the level of PCE inflation palatable to the Fed. The Fed will continue to tighten monetary conditions until entrenched inflation reaches its target, which may take longer than the market expects. Earnings outlook: Q2-2022 results show that an earnings slowdown has already commenced and is bound to get worse over the next couple of quarters. However, earnings forecasts are still too optimistic and a slowdown in earnings growth is not yet priced in. Investment themes: We recommend topping up allocation to Tech as it benefits from rate stabilization. However, be judicious in your choices, staying away from the more cyclical areas, such as Hardware and Equipment, and Semiconductors. We are overweight Software and Services, which is dominated by profitable and stable growth companies. Bottom Line: We continue to recommend that investors remain patient and prudent in range-bound markets. Earnings growth is likely to deteriorate into the year end. Feature Last Monday, July 18, I hosted a webcast called “Bear Market 2.0.” A total of 675 people dialed in, and I was honored. The webcast generated a significant number of client questions which I aim to address in this weekly publication. Broadly speaking, questions fell under each of the three rubrics of the webcast: Macroeconomic backdrop, earnings outlook, and investment themes, with the latter generating the lion’s share of questions. In today’s report, we will discuss inflation and rates, earnings season results, potential S&P 500 targets, whether the S&P 500 rally is sustainable, and if it is a good idea to top up Tech. We will address remaining questions on Energy and Materials, and Semiconductor in the near future. And as always, we are looking forward to more questions! Macroeconomic Backdrop How do you reconcile your inflation outlook with an assumption that long yields may have peaked? In the “Fat and Flat” and “Adaptive Expectations” reports, we outline our view that the market’s focus is shifting away from concerns about inflation and the hawkish Fed toward worries about growth. Indeed, the 10-year rate has stabilized at 2.78% on fears of impending slowdown (Chart 1). How does this reconcile with our view that inflation is entrenched and broadening (Chart 2), especially in light of the recent pullback in energy and commodities prices? Chart 1Yields Are Stabilizing
Yields Are Stabilizing
Yields Are Stabilizing
Chart 2Inflation Is Entrenched
Inflation Is Entrenched
Inflation Is Entrenched
Even if energy and commodities prices are falling, the latest wage survey from the Atlanta Fed demonstrates wage growth is not letting up, and labor costs, at over 50% of sales as per NIPA accounts, are a more important component of the US corporate cost structure than the cost of energy. Inflation is embedded as, companies pass on wage increases to customers by increasing prices – and, voilà, the wage-price spiral is becoming pervasive. This dynamic implies the following: Even if inflation peaks over the next several months, it will take many months to reach the level of PCE inflation palatable to the Fed. After having mismanaged inflation over the past 18 months, the Fed will err on the side of tighter policy. In fact, in its official statement, the Fed has asserted that its commitment to bringing inflation to its 2% target is unconditional. Therefore, we are still in the early innings of the monetary tightening cycle (Chart 3), where elevated inflation coexists with slowing growth and range-bound long rates. Bottom Line: The Fed will continue to tighten monetary conditions until entrenched inflation reaches its target, which may take longer than the market expects. Chart 3More Tightening To Come
More Tightening To Come
More Tightening To Come
Earnings Outlook What are your takeaways from the earnings seasons so far? In the Daily Insight, which we published on July 21, we offer our initial reaction to the results. In short, so far earnings have been good, but margins are under pressure (Chart 4) from rising wages and fading pricing power (Chart 5). We have also heard quite a few negative comments from companies concerning the effects of inflation and rising costs, a strong dollar, and withdrawal from Russia. Some of the largest Technology companies announced slowdowns in hiring as they anticipate falls in demand. Forward guidance has also been concerning. Most companies talk about deteriorating economic conditions. Chart 4Margins Are Expected To Contract
Margins Are Expected To Contract
Margins Are Expected To Contract
Chart 5Pricing Power Turning
Pricing Power Turning
Pricing Power Turning
We are still convinced that street forecasts of earnings growing at about a 10% rate over the next 12 months and 11% into year-end (Table 1), despite ubiquitous negative corporate guidance, are unrealistically high. Even in this reporting season for Q2-22, earnings growth is -3%, excluding Energy. Table 1S&P 500 EPS: Actual And Expected
What Our Clients Are Asking: The Bear Market 2.0 Webcast Follow Up
What Our Clients Are Asking: The Bear Market 2.0 Webcast Follow Up
It is unlikely that, over the next several months, macro headwinds, such as slowing growth, the hawkish Fed, stubborn inflation, and rising wages will dissipate. There is little consensus among analysts on forecasts (Chart 6) and downgrades are likely. We take it a step further, and call an earnings recession in three to six months. Chart 6Analysts Have Little Confidence In Their Forecasts
Analysts Have Little Confidence In Their Forecasts
Analysts Have Little Confidence In Their Forecasts
Bottom Line: Q2-2022 results show that an earnings slowdown has most likely already commenced and is bound to get worse over the next couple of quarters. However, earnings forecasts are still too optimistic and a slowdown in earnings growth is not yet priced in. Do you think that the slowdown in earnings might trigger multiple expansion? Earnings contraction, everything else equal, translates into multiple expansion, as the denominator of the fraction gets smaller. For example, according to our back-of-the-envelope estimates, earnings contracting by 10% will increase the forward multiple from the current 16x to 19x. Therefore, the key question here is how likely is it that everything else will indeed stay equal, as opposed to the market selling off in line with earnings? Multiples will expand if the market is able to see past negative earnings growth, identifying a catalyst for an imminent rebound. That was the case in 2020 as investors anticipated earnings bouncing back helped by easy monetary and fiscal policy, and COVID receding. What will be a catalyst for earnings rebound in, say, 2023? We can only speculate but one of the potential reasons for faster earnings growth is perhaps normalization of growth outside of the US: A weaker dollar, peace in Ukraine, resolution of the energy crisis, or ultra-loose monetary and fiscal policy in China. At home, the anticipation of a soft landing and a more dovish monetary policy coupled with a positive real wage growth boosting consumers’ spending power may be sufficient to reassure investors that earnings growth turning positive is imminent. However, all of these developments are probably months away. And we expect the market to sell off if earnings growth disappoints. Where do you see the S&P 500 by the end of the year? Broadly speaking, BCA Research does not provide targets but rather aims to offer insights into market trends. However, in the “Is Earnings Recession In The Cards?” report, we presented a matrix outlining different scenarios of earnings growth vs. forward multiples to arrive at a potential range of the outcomes for the index. We assume that the forward multiple stays at 16x, as the multiple contraction stage of the bear market is likely completed, but there is still no clear catalyst for earnings rebound. We will approximate CY 2022 results using the Next Twelve Months Matrix (Table 2). Table 2The S&P 500 Price Target Scenarios
What Our Clients Are Asking: The Bear Market 2.0 Webcast Follow Up
What Our Clients Are Asking: The Bear Market 2.0 Webcast Follow Up
We can distill the matrix into three likely scenarios: Earnings growth delivered by companies in line with analyst expectations of 11% over the six months; flat earnings (0% growth) broadly in line with the forecast based on our earnings model; and the worst-case scenario of a severe earnings contraction of -10% into year-end. We assign 25% to both extreme cases and about 50% to earnings staying flat for the next six months (earnings recession commencing in 2023). Best-case scenario: Earnings grow into year-end by 11%, and by 9.7% over the next 12 months. In that case, the S&P 500 will end the year at 3,837 or 3% off the current level. This is what is being priced in. Most likely scenario: Earnings growth trends to zero by the end of the year with the S&P 500 hitting 3500 or downshifting roughly 10% from here. Worst-case scenario: Earnings contract by 10%, and with the multiple staying at 16x, the S&P 500 price target will be 3287 or about 17% lower than today. With “E” falling so much, perhaps the multiple expands to 17x, in which case the market will fall “only” 11% from here. Bottom Line: We expect flagging earnings to cause another leg of the bear market, which is likely to be 5-10% into year-end, and perhaps another 5-10% in 2023. Equity Market Outlook And Key Investment Themes Are investors capitulating? Are we near or even past the bottom? The decline in oil and food prices and the easing of supply-side bottlenecks have alleviated market worries about US inflation. This, coupled with oversold risk assets, and apparent extreme pessimism in investor sentiment, has resulted in the S&P 500 rebounding 8% from its June lows. Sectors that have sold off the most over the past six months have bounced back the hardest (Chart 7). Naturally, the question that is top of mind for investors is whether this rebound is sustainable. Should they add beaten-down cyclicals to their portfolios to partake in the rally? Of course, no one can predict what Mr. Market will do with 100% certainty but here are some thoughts: Chart 7Sector Performance Overview
What Our Clients Are Asking: The Bear Market 2.0 Webcast Follow Up
What Our Clients Are Asking: The Bear Market 2.0 Webcast Follow Up
Positives Many risk assets are severely oversold, and for long-term investors, an entry point is attractive valuation-wise. So far, many investors find earnings season results somewhat encouraging: Netflix soared on what its CEO Hawkins called “less bad results.” Multiples have contracted and priced in most of the primary effects of high inflation and rising rates. Negatives The Fed is determined to extinguish inflation, and this hiking cycle may end up much longer and steeper than the market is pricing in. We do not anticipate monetary easing in the first half of 2023. Financial markets are currently underrating the risk of a seriously hawkish Fed. Economic growth is slowing, and consensus forecasts of earnings growth are still overly optimistic. Earnings contraction over the next several quarters is likely but is certainly not priced in, and disappointment may rock markets. The catalyst for this summer’s rebound is two-fold: The market is celebrating the end of inflation worries and is rebounding from severely oversold conditions. Black swan “generators” such as China and Russia, may have more surprises in stock (Table 3). We continue to stick to “fat and down” expectations for the equities outlined in the “Adaptive Expectations” report and anticipate a range-bound market where relief rallies are alternated with pullbacks, mostly triggered by growth disappointments and realizations that the Fed has dug in its heels and is unlikely to let up anytime soon. The “down” leg will ensue if earnings contract. Yet we recommend investors take a granular approach to industry selection and start tilting portfolios away from assets that benefit from rising inflation, such as Energy and Materials, towards the “growthy” assets that benefit from rate stabilization and falling growth. We picked up on the turning point and upgraded Growth to overweight in early July, funding it from Value. Table 3Scorecard
What Our Clients Are Asking: The Bear Market 2.0 Webcast Follow Up
What Our Clients Are Asking: The Bear Market 2.0 Webcast Follow Up
Bottom Line: We consider the recent rebound in US equities a bear market rally, and don’t believe that it is sustainable. The Fed and the stock market are on a collision course – easier financial conditions will make the Fed even more aggressive. Is it time to buy Tech? As we have highlighted in the “Are We There Yet?!” report back in January, Tech’s worst performance is two to three months prior to the first rate hike, and the rebound is two to three months after the beginning of the monetary cycle. The slump and a recent rally are perfectly in line with history (Chart 8). Rates have stabilized and “growthy” Tech has pounced (Chart 9). Another issue that was holding the sector back earlier in the year was a slowdown in demand for Tech investment (Chart 10). Recently, business demand for Tech has picked up. However, US consumer spending on Tech is falling, as demand for consumer goods, pulled forward by the pandemic, is fading (Chart 11). Therefore, we need to be judicious in our selection of technology stocks. Chart 8Tech Performance During A Hiking Cycle
What Our Clients Are Asking: The Bear Market 2.0 Webcast Follow Up
What Our Clients Are Asking: The Bear Market 2.0 Webcast Follow Up
Chart 9Technology Rebounded On The Back Of Yields Peaking
Technology Rebounded On The Back Of Yields Peaking
Technology Rebounded On The Back Of Yields Peaking
Chart 10Corporate Demand For Tech Has Picked Up…
Corporate Demand For Tech Has Picked Up…
Corporate Demand For Tech Has Picked Up…
We reiterate our overweight in Software and Services, which is least exposed to consumer demand. Our thesis is that this industry group represents “defensive growth” thanks to the key trends of digitization of the US economy and migration to cloud. Spending on digitization and the cloud are pervasive across non-tech companies and capture a large swath of corporate America by both size and industry. Also, software and services companies tend to have stable earnings growth throughout the cycle, as software improves productivity and cuts costs (Chart 12). Chart 11...But Consumer Spending Slowed
...But Consumer Spending Slowed
...But Consumer Spending Slowed
Chart 12Software Is Defensive Growth
Software Is Defensive Growth
Software Is Defensive Growth
We are underweight more cyclical Hardware and Equipment, and Semiconductors industry groups as they are more exposed to the slowing economy and the flagging demand for hardware and chips. We will take a close look at the Semiconductor Industry Group in the near future. Bottom Line: We recommend topping up allocation to tech as it benefits from rate stabilization. However, be judicious in your choices, staying away from the more cyclical areas, such as Hardware and Equipment, and Semiconductors. We are overweight Software and Services, which is dominated by profitable and stable growth companies. Irene Tunkel Chief Strategist, US Equity Strategy irene.tunkel@bcaresearch.com Recommended Allocation Recommended Allocation: Addendum
What Our Clients Are Asking: The Bear Market 2.0 Webcast Follow Up
What Our Clients Are Asking: The Bear Market 2.0 Webcast Follow Up
Executive Summary Iran Reaches Nuclear Breakout
Biden And Putin Court The Middle East
Biden And Putin Court The Middle East
The next geopolitical crisis will stem from the Middle East. The US, Russia, and China are striving for greater influence there and Iran’s nuclear quest is reaching a critical juncture. The risk of US-Israeli attacks against Iran remains 40% over the medium term and will rise sharply if Iran attempts to construct a deliverable nuclear device. Saudi Arabia may increase oil production but only if global demand holds up, which OPEC will assess at its August 3 meeting. Global growth risks will prevail in the short term and reduce its urgency. Russia will continue to squeeze supplies of energy and food for the outside world. The restart of Nord Stream 1 and the Turkey-brokered grain export proposal are unreliable signals. Russia’s aim is victory in Ukraine and any leverage will be used. The US may be done with the Middle East but the Middle East may not be done with the US. Structurally we remain bullish on gold and European defense stocks but we are booking 17% and 18% gains on our current trades. The deterioration in global growth and likely pullback in inflation will temporarily undercut these trades. Tactical Recommendation Inception Date Return LONG GOLD (CLOSED) 2019-06-12 17.1% LONG EUROPEAN AEROSPACE & DEFENSE / EUROPEAN TECH EQUITIES (CLOSED) 2022-03-18 17.9% Bottom Line: Global demand is weakening, which will weigh on bond yields and commodities. Yet underlying oil supply constraints persist – and US-Iran conflict will exacerbate global stagflation. Feature Chart 1Equity Volatility And Oil Price Volatility
Equity Volatility And Oil Price Volatility
Equity Volatility And Oil Price Volatility
US President Joe Biden visited Saudi Arabia last week in a belated attempt to make amends with OPEC, increase oil production, and reduce inflation ahead of the midterm election. Biden also visited Israel to deter Iran, which is the next geopolitical crisis that markets are underrating. Meanwhile Russian President Vladimir Putin went to Iran on his second trip outside of Russia since this year’s invasion of Ukraine. Putin sought an ally in his conflict with the West, while also negotiating with Turkish President Recep Erdogan, who sought to position himself as a regional power broker. In this report we analyze Biden’s and Putin’s trips and what they mean for the global economy and macro investors. Macroeconomics is bearish for oil in the short term but geopolitics is bullish for oil in the short-to-medium term. The result is volatility (Chart 1). OPEC May Pump More Oil But Not On Biden’s Time Frame Here are the important developments from Biden’s trip: A credible threat against Iran: The US and Israel issued a joint declaration underscoring their red line against Iranian nuclear weaponization.1 Meanwhile the Iranians claimed to have achieved “nuclear breakout,” i.e. enough highly enriched uranium to construct a nuclear device (Chart 2). A balance-of-power coalition to contain Iran: Israel and Saudi Arabia improved relations on the margin. Each took action to build on the strategic détente between Israel and various Arab states that is embodied in the 2020 Abraham Accords.2 This strategic détente has staying power because it is a self-interested attempt by the various nations to protect themselves against common rivals, particularly Iran (Chart 3). Biden also tried to set up a missile defense network with Israel and the Arabs, although it was not finalized.3 Chart 2Iran Reaches Nuclear Breakout
Biden And Putin Court The Middle East
Biden And Putin Court The Middle East
A reaffirmed US-Saudi partnership: The US and Saudi Arabia reaffirmed their partnership despite a rocky patch over the past decade. The rocky patch arises from US energy independence, China’s growth, and US attempts to normalize ties with Iran (Chart 4). These trends caused the Saudis to doubt US support and to view China as a strategic hedge. Chart 3Iran: Surrounded And Outgunned
Biden And Putin Court The Middle East
Biden And Putin Court The Middle East
President Biden came into office aiming to redo the Iran deal and halt arms sales to Saudi Arabia. Since then he has been chastened by high energy prices, a low approval rating, and hawkish Iranian policy. On this trip he came cap in hand to the Saudis in a classic example of geopolitical constraints. If the US-Iran deal is verifiably dead, then US-Saudi ties will improve sustainably. (Though of course the Saudis will still do business with China and even start trading with China in the renminbi.) What global investors want to know is whether the Saudis and OPEC will pump more oil. The answer is maybe someday. The Saudis will increase production to save the global business cycle but not the Democrats’ election cycle. They told Biden that they will increase production only if there is sufficient global demand. Global Brent crude prices have fallen by 6% since May, when Biden booked his trip, so the kingdom is not in a great rush to pump more. Its economy is doing well this year (Chart 5). Chart 4Drivers Of Saudi Anxiety
Drivers Of Saudi Anxiety
Drivers Of Saudi Anxiety
Chart 5Saudis Won't Pump If Demand Is Weak
Saudis Won't Pump If Demand Is Weak
Saudis Won't Pump If Demand Is Weak
At the same time, if global demand rebounds, the Saudis will not want global supply constraints to generate punitive prices that cap the rebound or kill the business cycle. After all, a global recession would deplete Saudi coffers, set back the regime’s economic reforms, exacerbate social problems, and potentially stir up political dissent (Chart 6). Related Report Geopolitical StrategyThird Quarter Geopolitical Outlook: Thunder And Lightning Hence the Saudis will not increase production substantially until they have assessed the global economy and discussed the outlook with the other members of the OPEC cartel in August and September, when the July 2021 agreement to increase production expires. We expect global demand to weaken as Europe and China continue to struggle. Our Commodity & Energy Strategist Bob Ryan argues that further escalation in the energy war between the EU and Russia could push prices above $220 per barrel by Q4 2023, whereas an economic collapse could push Brent down to $60 per barrel. His base case Brent price forecast remains $110 per barrel on average in 2022 and $117 per barrel in 2023 (Chart 7). Chart 6Saudis Will Pump To Prevent Recession
Saudis Will Pump To Prevent Recession
Saudis Will Pump To Prevent Recession
Chart 7BCA's July 2022 Oil Price Forecast
BCA's July 2022 Oil Price Forecast
BCA's July 2022 Oil Price Forecast
The geopolitical view suggests upside oil risks over the short-to-medium time frame but the macroeconomic view suggests that downside risks will be priced first. Bottom Line: Saudi Arabia may increase production but not at any US president’s beck and call. The Saudis are not focused on US elections, they benefit from the current level of prices, and they do not suffer if Republicans take Congress in November. The downside risk in oil prices stems from demand disappointments in global growth (especially China) rather than any immediate shifts in Saudi production discipline. Volatility will remain high. US-Iran Talks: Dying But Not Dead Yet In fact the Middle East underscores underlying and structural oil supply constraints despite falling global demand. While Iran is a perennial geopolitical risk, the world is reaching a critical juncture over the next couple of years. Investors should not assume that Iran can quietly achieve nuclear arms like North Korea. Since August 2021 we have argued that the US and Iran would fail to put back together the 2015 nuclear deal (the Joint Comprehensive Plan of Action or JCPA). This failure would in turn lead to renewed instability across the Middle East and sporadic supply disruptions as the different nations trade military threats and potentially engage in direct warfare. This forecast is on track after Biden’s and Putin’s trip – but we cannot yet say that it is fully confirmed. Biden’s joint declaration with Israeli Prime Minister Yair Lapid closed any daylight that existed between the US and Israel. Given that there was some doubt about the intentions of Biden and the Democrats, it is now crystal clear that the US is determined to prevent Iran from getting nuclear weapons even if it requires military action. The US specifically said that it will use “all instruments of national power” to prevent that outcome. Chart 8Iran Not Forced To Capitulate
Iran Not Forced To Capitulate
Iran Not Forced To Capitulate
Judging by the tone of the statement, the Israelis wrote the document and Biden signed it.4 Biden’s foreign policy emphasizes shoring up US alliances and partnerships, which means letting allies and partners set the line. Israel’s Begin Doctrine – which says that Israel is willing to attack unilaterally and preemptively to prevent a hostile neighbor from obtaining nuclear weapons – has been reinforced. The US is making a final effort to intimidate Iran into rejoining the deal. By clearly and unequivocally reiterating its stance on nuclear weapons, and removing doubts about its stance on Israel, there is still a chance that the Iranian calculus could change. This is possible notwithstanding Ayatollah Khamenei’s friendliness with Putin and criticisms of western deception.5 After all, why would the Iranians want to be attacked by the US and Israeli militaries? Iran will need to think very carefully about what it does next. Khamenei just turned 83 years old and is trying to secure the Islamic Republic’s power transition and survival after his death. Here are the risks: Iran’s economy, buoyed by the commodity cycle, is not so weak as to force Khamenei to capitulate. Back in 2015 oil prices had collapsed and his country was diplomatically isolated. Today the economy has somewhat weathered the storm of the US’s maximum pressure sanctions (Chart 8). Iran is in bad shape but it has not been brought to its knees. Another risk is that Khamenei believes the American public lacks the appetite for war. Americans say they are weary of Middle Eastern wars and do not feel particularly threatened by Iran. However, this would be a miscalculation. US war-weariness is nearing the end of its course. The US engages in a major military expedition roughly every decade. Americans are restless and divided – and the political elite fear populism – so a new foreign distraction is not as unlikely as the consensus holds. Moreover a nuclear Iran is not an idle threat but would trigger a regional nuclear arms race and overturn the US grand strategy of maintaining a balance of power in the Middle East (as in other regions). In short, the US government can easily mobilize the people to accept air strikes to prevent Iran from going nuclear because there is latent animosity toward Iran in both political parties (Chart 9). Chart 9Risk: Iran Overrates US War-Weariness
Biden And Putin Court The Middle East
Biden And Putin Court The Middle East
Another risk is that Iran forges ahead believing that the US and Israel are unwilling or unable to attack and destroy its nuclear program. The western powers might opt for containment like they did with North Korea or they might attack and fail to eliminate the program. This is hard to believe but Iran clearly cannot accept US security guarantees as an alternative to a nuclear deterrent when it seeks regime survival. At the same time Russia is courting Iran, encouraging it to join forces against the American empire. Iran is planning to sell drones to Russia for use in Ukraine, while Russia is maintaining nuclear and defense cooperation with Iran. Putin’s trip highlighted a growing strategic partnership despite a low base of economic ties (Chart 10).6 Chart 10Russo-Iranian Ties
Russo-Iranian Ties
Russo-Iranian Ties
Chart 11West Vulnerable To Middle East War
Biden And Putin Court The Middle East
Biden And Putin Court The Middle East
While Russia does not have an interest in a nuclear-armed Iran, it is not afraid of Iran alone, and it would benefit enormously if the US and Israel got bogged down in a new war that destabilized the Middle East. Oil prices would rise, the US would be distracted, and Europe would be even more vulnerable (Chart 11). Chart 12China's Slowdown And Dependency On Middle East
China's Slowdown And Dependency On Middle East
China's Slowdown And Dependency On Middle East
China’s interest is different. It would prefer for Iran to undermine the West by means of a subtle and long-term game of economic engagement rather than a destabilizing war in the region that would upset China’s already weak economy. However, Beijing will not join with the US against Iran, especially if Iran and Russia are aligned. Ultimately China needs to access Iranian energy reserves via overland routes so that it gains greater supply security vis-à-vis the American navy (Chart 12). Since June 2019, we have maintained 40% odds of a military conflict with Iran. The logic is outlined in Diagram 1, which we have not changed. Conflict can take various forms since the western powers prefer sabotage or cyber-attacks to outright assault. But in the end preventing nuclear weapons may require air strikes – and victory is not at all guaranteed. We are very close to moving to the next branch in Diagram 1, which would imply odds of military conflict rise from 40% to 80%. We are not making that call yet but we are getting nervous. Diagram 1Iran Nuclear Crisis: Decision Tree
Biden And Putin Court The Middle East
Biden And Putin Court The Middle East
Moreover it is the saber rattling around this process – including an extensive Iranian campaign to deter attack – that will disrupt oil distribution and transport sooner rather than later. Bottom Line: The US and Iran could still find diplomatic accommodation to avoid the next step in our decision tree. Therefore we are keeping the odds of war at a subjective 40%. But we have reached a critical juncture. The next step in the process entails a major increase in the odds of air strikes. Putin’s Supply Squeeze Will Continue As we go to press, financial markets are reacting to President Putin’s marginal easing of Russian political pressure on food and energy supplies. First, Putin took steps toward a deal, proposed by Turkish President Erdogan, to allow Ukrainian grain exports to resume from the Black Sea. Second, Putin allowed a partial restart of the Nord Stream 1 natural gas pipeline, after a total cutoff occurred during the regular, annual maintenance period. However, these moves should be kept into perspective. Nord Stream 1 is still operating at only 40% of capacity. Russia reduced the flow by 60% after the EU agreed to impose a near-total ban on Russian oil exports by the end of the year. Russia is imposing pain on the European economy in pursuit of its strategic objectives and will continue to throttle Europe’s natural gas supply. Russia’s aims are as follows: (1) break up European consensus on Russia and prevent a natural gas embargo from being implemented in future (2) pressure Europe into negotiating a ceasefire in Ukraine that legitimizes Russia’s conquests (3) underscore Russia’s new red line against NATO military deployments in Finland and Sweden. Europe, for its part, will continue to diversify its natural gas sources as rapidly as possible to reduce Russia’s leverage. The European Commission is asking countries to decrease their natural gas consumption by 15% from August to March. This will require rationing regardless of Russia’s supply squeeze. The collapse in trust incentivizes Russia to use its leverage while it still has it and Europe to try to take that leverage away. The economic costs are frontloaded, particularly this winter. The same goes for the Turkish proposal to resume grain exports. Russia will continue to blockade Ukraine until it achieves its military objectives. The blockade will be tightened or loosened as necessary to achieve diplomatic goals. Part of the reason Russia invaded in the first place was to seize control of Ukraine’s coast and hold the country’s ports, trade, and economy hostage. Bottom Line: Russia’s relaxation of food and energy flows is not reliable. Flows will wax and wane depending on the status of strategic negotiations with the West. Europe’s economy will continue to suffer from a Russia-induced supply squeeze until Russia achieves a ceasefire in Ukraine. So will emerging markets that depend on grain imports, such as Turkey, Egypt, and Pakistan. Investment Takeaways The critical juncture has arrived for our Iran view. If Iran does not start returning to nuclear compliance soon, then a fateful path of conflict will be embarked upon. The Saudis will not give Biden more oil barrels just yet. But they may end up doing that if global demand holds up and the US reassures them that their regional security needs will be met. First, the path for oil over the next year will depend on the path of global demand. Our view is negative, with Europe heading toward recession, China struggling to stimulate its economy effectively, and the Fed unlikely to achieve a soft landing. Second, the path of conflict with Iran will lead to a higher frequency of oil supply disruptions across the Middle East that will start happening very quickly after the US-Iran talks are pronounced dead. In other words, oil prices will be volatile in a stagflationary environment. In addition, while inflation might roll over for various reasons, it is not likely to occur because of any special large actions by Saudi Arabia. The Saudis are waiting on global cues. Of these, China is the most important. We are booking a 17% gain on our long gold trade as real rates rise and China’s economy deteriorates (Chart 13). This is in line with our Commodity & Energy Strategy, which is also stepping aside on gold for now. Longer term we remain constructive as we see a secular rise in geopolitical risk and persistent inflation problems. Chart 13Book Gains On Gold ... For Now
Book Gains On Gold ... For Now
Book Gains On Gold ... For Now
We are booking an 18% gain on our long European defense / short European tech trade. Falling bond yields will benefit European tech (Chart 14). We remain bullish on European and global defense stocks. Chart 14Book Gains On EU Defense Vs Tech ... For Now
Book Gains On EU Defense Vs Tech ... For Now
Book Gains On EU Defense Vs Tech ... For Now
Chart 15Markets Underrate Middle East Geopolitical Risk
Biden And Putin Court The Middle East
Biden And Putin Court The Middle East
Stay long US equities relative to UAE equities. Middle Eastern geopolitical risk is underrated (Chart 15). Matt Gertken Chief Geopolitical Strategist mattg@bcaresearch.com Footnotes 1 The White House, “The Jerusalem U.S.-Israel Strategic Partnership Joint Declaration,” July 14, 2022, whitehouse.gov. 2 Israel and the US will remove international peacekeepers from the formerly Egyptian Red Sea islands of Tiran and Sanafir, which clears the way for Saudi Arabia to turn them into tourist destinations. Saudi Arabia also removed its tight airspace restrictions on Israel, enabling civilian Israeli airlines to fly through Saudi airspace on normal basis. Of course, Saudi allowance for Israeli military flights to pass through Saudi airspace would be an important question in any future military operation against Iran. 3 The US has long wanted regional missile defense integration. The Biden administration is proposing “integrated air defense cooperation” that would include Israel as well as the Gulf Cooperation Council (GCC). A regional “air and missile defense architecture” would counter drones and missiles from rival states and non-state actors such as Iran and its militant proxies. Simultaneously the Israelis are putting forward the proposed Middle East Air Defense Alliance (MEAD) in meetings with the same GCC nations. Going forward, Iran’s nuclear ambitions will give more impetus to these attempts to cooperate on air defense. 4 This is apparent from the hard line on Iran and the relatively soft line on Russia in the document. Israel is wary of taking too hard of a line against Russia because of its security concerns in Syria where Russian forces are present. See footnote 1 above. 5 Khamenei called for long-term cooperation between Russia and Iran; he justified Russia’s invasion of Ukraine as a defense against NATO encroachment; he called for the removal of the US dollar as the global reserve currency. See “Khamenei: Tehran, Moscow must stay vigilant against Western deception,” Israel Hayom, July 20, 2022, israelhayom.com. 6 Russia’s natural gas champion Gazprom signed an ostensible $40 billion memorandum of understanding with Iran’s National Oil Company to develop gas fields and pipelines. See Nadeen Ebrahim, “Iran and Russia’s friendship is more complicated than it seems,” CNN, July 20, 2022, cnn.com. However, while there are longstanding obstacles to Russo-Iranian cooperation, the West’s tough new sanctions on Russia and EU diversification will make Moscow more willing to invest in Iran. Strategic Themes Open Tactical Positions (0-6 Months) Open Cyclical Recommendations (6-18 Months) Regional Geopolitical Risk Matrix