Elections

Our sister BCA Geopolitical Strategy Service has introduced a Presidential Election Model that uses political and economic variables to predict the Electoral College vote on the state-by-state level. The model would have predicted the past five elections correctly on an out-of-sample basis, and even the controversial win of George W. Bush over Al Gore in 2000. As of the latest available data, the model predicts that the Republicans will lose Michigan and Wisconsin (critical victories in 2016). Wisconsin, Pennsylvania, and New Hampshire become borderline or “toss-up” states: the probability of a Republican win in these states is 48.77%, 50.17%, and 46.90%, respectively. Even the smallest change in our model inputs can shift these states to either party. According to the model, President Trump is also at the lowest level of approval and weakest state-by-state economy that he can afford. If one of these factors stabilizes below today’s level, Trump will lose his reelection bid. Bottom Line: Quantitative modeling, entirely independent of our qualitative assessment, suggests that Trump is favored to win the 2020 election. However, he is skating on very thin ice with regard to key cyclical variables such as state-level economic performance and popular approval rating.
BCA’s Geopolitical Strategy's 2020 US Presidential Election Model
BCA’s Geopolitical Strategy's 2020 US Presidential Election Model
It is too soon to declare that Trump’s presidency is finished. On the contrary he is slightly favored to win reelection. President Trump’s low approval rating does not prohibit him from reelection. While historically low, it is also historically stable. If…
Highlights US politics are the chief source of global geopolitical risk over the coming year – and likely beyond. President Trump’s reelection remains our base case – the sitting president rarely loses if the economy is expanding. Yet the risk of a Democratic victory is high – Trump’s low approval rating, impending impeachment trial, and various policy troubles threaten his reelection bid. Trump’s tactics and the Democrats’ turn to the progressive left pose threats to BCA Research’s cyclically bullish house equity view. Feature If a time-traveler had accosted you in the fall of 2014 and told you that Donald Trump, the host of the reality TV show The Apprentice, would be the next American president, would you have believed him? What if the time-traveler had gone on to say that President Trump’s unconventional behavior would get him into hot water and that in 2020 he would become the first president in US history to be impeached and removed from office? Granting the premise, the second proposition is easier to imagine. And yet Trump is highly unlikely to be removed from office. He is in fact favored to be reelected. Just as his victory in 2016 proved more likely than the consensus held at the time, so his reelection in 2020 is more likely than the consensus holds today. The reason comes down to political constraints. First, the bar for removal in the Senate is very high. Second, it is easier for a sitting president to get reelected than it is for the opposition to convince voters to start over with something entirely different. Especially if the economy is in decent shape. In what follows we present our quantitative 2020 election model and our qualitative, constraints-based analysis of the election and likely market responses. Trump's fate is only one factor. But US politics is the chief source of market-relevant global political risk over the next 12-24 months. Not A Lame Duck (Yet) After a harrowing year in which global manufacturing slumped due to China’s tight credit policy and Trump’s trade war, the probability of a US recession is now – tentatively – subsiding (Chart 1). This is good news for Trump, whose presidency is hanging by a thread. Chart 1Recession Averted? Or Trump's Death Knell?
Recession Averted? Or Trump's Death Knell?
Recession Averted? Or Trump's Death Knell?
Chart 2Bookies Expect A Democrat Victory
US Election 2020: Civil War Lite
US Election 2020: Civil War Lite
Betting markets like PredictIt.org suggest that Democrats are slightly more likely than Republicans to win the White House next November (Chart 2). The narrow spread is appropriate given that the balance of evidence is fairly even. However, if there is to be a tilt, it should go the opposite way, i.e. toward Republicans as the incumbent party. The history of US elections since 1860 shows a strong tendency for the incumbent party to hold the White House when the sitting president is running at the head of the ticket. This is especially true when there has not been a recession during the president’s four-year term. It is even true when the ruling party has lost seats in preceding congressional elections, as occurred in 2018 and as is often the case (Chart 3). Other than recession, the biggest exception to the sitting president’s victory – especially in modern times – is when a major scandal has occurred, as with Gerald Ford in 1976. This is clearly relevant to today. In these rare cases the incumbent president’s and incumbent party’s historic reelection rates are both 50/50. The implication of Chart 3 is that Trump’s odds, from a historical point of view, are slightly above 50%. Of course, history does not afford an example of a first-term president being impeached, acquitted, and running for election again.1 Yet this is the most likely outcome today, as there is not an overwhelming popular demand to remove Trump from office. Despite the revelations and public hearings in the impeachment inquiry so far, support for removal stands at 47%, while opposition to removal stands at 45% (Chart 4). In other words, there is no majority in favor of removal, but only a narrow plurality. Removal – nullifying an election result – requires more. Chart 3History Says Trump More Likely To Win Than Not
US Election 2020: Civil War Lite
US Election 2020: Civil War Lite
Chart 4No Consensus On Removal From Office
US Election 2020: Civil War Lite
US Election 2020: Civil War Lite
The spread is conspicuously close to the 46%-to-48% popular vote spread for Trump and Hillary Clinton, respectively, in 2016. The impeachment is not a tsunami of public opposition to the administration. It is a bare-knuckle power struggle: Trump tried to have his top rival investigated and tarred with corruption allegations, the Democrats are retaliating by trying to remove Trump prior to the election. Support for removal will fluctuate, but it will take more than 47% of the population to generate a 67-vote supermajority against Trump in a Republican-held Senate. Republican senators would be taking a grave risk in voting against their base when they have the option of deferring to voters in just 11 months’ time. Both Richard Nixon and Bill Clinton were in their second terms when Congress began moving articles of impeachment: the public had no other recourse in the event that they committed “high crimes and misdemeanors.” Trump is in his first term and is due for the public’s verdict shortly. Nixon resigned when it became clear that grassroots Republicans had lost faith in him and the Senate would not acquit. Trump’s political base has not yet lost faith – his approval among Republicans is still 90%, higher than the average of Republican presidents and at the high end of his term in office (Chart 5). When it comes to the final vote, some Republican senators may defect, but it would take 20 to remove Trump from office. This will require a Nixon-like hemorrhage of support. Remarkably Trump’s general approval rating has not been affected by the impeachment inquiry (Chart 6). His approval rating is still comparable to President Barack Obama’s rating at this stage in his first term (as well as Ronald Reagan’s). While Trump is highly unlikely to break above 50%, he is emphatically not a lame duck … at least not yet. Presidential approval tends to rise as the opposition nomination is settled and the election approaches. If Trump’s approval revives to the 46% of the popular vote he won in 2016, then he remains competitive in the swing states where the election will be fought and won. Chart 5Trump’s Political Base Geared Up For Battle
US Election 2020: Civil War Lite
US Election 2020: Civil War Lite
Chart 6A Precarious Approval Rating
US Election 2020: Civil War Lite
US Election 2020: Civil War Lite
What about the Republicans’ heavy losses in the midterm elections and special elections since 2016? Haven’t national voting trends already condemned Trump and the Republicans to a loss in 2020? Not necessarily. Democrats lost elections more dramatically in 2009-11 than Republicans lost in 2017-19 – both in voter support and turnout (Table 1) – and yet President Obama secured the victory in 2012. Presidential elections are a different beast. Table 1Democrats Suffered More Post-2008 Than Republicans Post-2016 … Yet Obama Won Reelection
US Election 2020: Civil War Lite
US Election 2020: Civil War Lite
Chart 7GOP Governorships At Low End Of Rising Trend
US Election 2020: Civil War Lite
US Election 2020: Civil War Lite
The same goes for Republican losses in recent gubernatorial races. In Kentucky the incumbent governor was a Republican and lost; in Louisiana the incumbent governor was a Democrat and won. The catch is that the number of Republican governors was extremely elevated prior to 2018. Recent losses have merely brought the Republicans back to the bottom of their upward channel as a share of the nation’s 50 governors (Chart 7). Thus while the interim elections are a warning sign to Trump and the GOP, they are not a death knell – as long as the economy rebounds and President Trump’s approval rises as the election approaches. Bottom Line: Trump is not a lame duck yet. His administration is embattled and the impeachment process could permanently damage his standing. But so far his general approval rating and the specific impeachment polling suggest that he will stay in office and remain competitive in the 2020 race. If the election were today he would almost surely lose, but a lot can change in 12 months. If the economy avoids recession, then investors should take reelection as their base case. Cyclical Constraints Will Prevail A recession is the surest way to render a president a lame duck. It does not have to be a technical recession. The contraction in the manufacturing sector – and corresponding cutbacks in lending in the manufacturing-heavy and electorally vital Midwest – are extremely threatening to a president who promised to revive manufacturing and trade (Chart 8). Incumbency, economic growth, failed impeachment, and partial policy victory are enough to win the key swing states. Having declared that “trade wars are good and easy to win,” President Trump will not be able to hide from a deeper slowdown in the industrial heartland. State-level wage growth is positive, but swing states, particularly Trump swing states, are seeing a sharp drop-off from the highs prior to the trade war (Chart 9). The solution is the trade ceasefire being pursued with China. Trump is now in the position of the Federal Reserve Chairman: he can no longer afford to hike (tariff) rates, and the equity market may force him to cut, as long as he can reasonably hope to improve the economy. If the economy is lost, the trade war is back on. Chart 8An Urgent Need For A Trade Ceasefire
An Urgent Need For A Trade Ceasefire
An Urgent Need For A Trade Ceasefire
Chart 9Trump Swing States Took A Hit From The Trade War
Trump Swing States Took A Hit From The Trade War
Trump Swing States Took A Hit From The Trade War
Chart 10Buttigieg And Warren More Favorable Than Others
US Election 2020: Civil War Lite
US Election 2020: Civil War Lite
Are incumbency, economic growth, failed impeachment, and partial policy victories enough to get Trump over the line in the key swing states?2 Subjectively, we think so. The Democrats have to win all of the states they won in 2016 plus Michigan and Florida (or two other states in place of Florida, such as Wisconsin and Pennsylvania). President Trump can afford to lose Michigan and one other state (but not Florida). This assessment has little to do with the Democratic presidential nominee – as yet unknown – and everything to do with whether the incumbent president or party has been fundamentally discredited. Democratic candidates like Senator Elizabeth Warren and Mayor Pete Buttigieg are generally more competitive than consensus holds. Warren, for instance, is one of the few candidates in recent elections who has a net positive favorability rating (Chart 10). But her favorability is not enough to overturn a sitting president – that will most likely require a shock that renders the status quo intolerable. The cyclical constraints on Trump and his opponents are thus clear. What of the structural constraints? Trump’s 2016 victory is often attributed to long-running structural trends in the US such as deindustrialization, immigration, and racial attitudes. The Democrats’ “blue wall” in the Rust Belt crumbled because Trump courted the working-class voter there and/or stoked racial anxieties. The implication, however, is that Trump still has an advantage in these swing states. Older voters and especially white voters have drifted toward Republicans for several years – the trend was interrupted only by the Great Recession, which saw a surge in Democratic support that has now subsided (Chart 11). Chart 11Old And White People Drifting To GOP Over Time ... Excepting The Great Recession
US Election 2020: Civil War Lite
US Election 2020: Civil War Lite
While the white share of the swing states is falling over time, that trend is not sufficient to prevent Trump from winning the Electoral College in the year 2020. Instead the rapidly changing racial and ethnic composition of society should be seen as motivating the attitudes that Trump exploits. Trump’s electoral strategy of maximizing white turnout and support for the Republican Party, which we dubbed “White Hype” in 2016, is still the only way for him to achieve a popular vote victory in 2020, and hence the clearest pathway for him to achieve an Electoral College victory (Chart 12). Needless to say, tensions and controversies over race and immigration will swell in the coming year. Chart 12Electoral College Scenarios Show Trump Win Still Possible
US Election 2020: Civil War Lite
US Election 2020: Civil War Lite
Chart 13Swing State Turnout Follows Unemployment
US Election 2020: Civil War Lite
US Election 2020: Civil War Lite
By the same token, demographic change means that the Democrats can theoretically win by performing no better than they did in 2016 in terms of voter turnout and support rates (see the “Status Quo” scenario in Chart 12). This is a low hurdle for Democrats – suggesting once again that the election will be extremely close, that Trump can win only through the Electoral College (not the popular vote), and that the election outcome will ultimately swing on the cyclical factors outlined above, particularly the state of the economy. A final word about voter turnout. The greatest electoral risk to President Trump is an increase in voter turnout among traditionally low turnout groups that heavily favor the Democratic Party, such as young people and minorities. Given the surge in turnout for the 2018 midterm elections, and the extremely controversial and heated environment surrounding Trump’s presidency, there is considerable reason to suspect that 2020 will be a high-turnout election. Other things being equal, this would likely penalize Trump’s reelection prospects. However, it is important to recognize that voter turnout in swing states is fairly well correlated with the unemployment rate (Chart 13). Depending on the state, surges in turnout occurred in 1992, in the wake of recession; 2004, in the wake of recession, terrorism and war; and 2008, in the wake of the great financial crisis. The exception is Pennsylvania, where a surge in white voter turnout helped Trump pull off a surprise win in the state. Turnout is the hardest political variable to predict, so it is not clear whether Trump’s scandals and impeachment will do the trick. But an increase in the unemployment rate would virtually destroy Trump’s bid, being negatively correlated with presidential approval and positively correlated with voter turnout. Bottom Line: Trump’s executive powers give him the potential to achieve some additional policy victories that could boost his approval rating – namely a trade ceasefire with China that simultaneously improves the economic outlook. Meanwhile structural factors such as demographics do not forbid Trump from winning the Electoral College – on the contrary, aging and the decline in the white share of the population mean that Trump’s electoral strategy could succeed again in 2020, but will be much harder to pull off after 2020. Introducing … BCA’s Geopolitical Strategy 2020 US Presidential Election Model The BCA Geopolitical Strategy Presidential Election Model is a state-by-state model that uses political and economic variables to predict the Electoral College vote. What differentiates our model from that of others is that it attempts to predict the probability of the incumbent party winning the Electoral College votes in each of the 50 states. The model would have predicted the past five elections correctly on an out-of-sample basis, even the controversial win of George W. Bush over Al Gore in 2000. Why do we predict the electoral vote rather than the popular vote? First, the winner of the presidential election is determined by the Electoral College, not the popular vote. Second, in recent history, two candidates who lost the popular vote (George W. Bush in 2000 and Donald Trump in 2016) won the election. It is possible that we will see a similar result in 2020, given President Trump’s low national popularity yet distinctive policy pitch for the Midwestern states (e.g. economic patriotism, hardline on immigration). With only minor exceptions, electoral votes are allocated based on a winner-take-all process, as opposed to proportionately to the popular vote. Hence the best way to forecast the presidential election winner is to predict the probability of winning each state, i.e. receiving all the electoral votes assigned to each state.3 Due to the data availability of our input variables, our sample size includes nine elections (1984 to 2016) across 50 states, making for a total of 450 observations. We designed the model to be as succinct as possible. It includes four explanatory variables: A weighted average of the Federal Reserve Bank of Philadelphia State Leading Index, from the beginning of the previous presidential term until September of the election year. The state leading indexes predict the 6-month growth rate of the state coincident indexes, which include nonfarm payroll employment, average hours worked in manufacturing by production workers, the unemployment rate, and wage and salary disbursements deflated by the consumer price index (U.S. city average).4 Chart 14Voters Make Up Their Minds Ahead Of Time
US Election 2020: Civil War Lite
US Election 2020: Civil War Lite
We use a weighted average of all the monthly forecasts in the presidential term preceding an election, where later months are weighted more heavily than earlier months. Our sample includes 6-month growth rates up to and including September of the election year, which means it includes a rough forecast of the direction of the state’s economy in Q1 of the new president’s term. Since we weigh recent months more heavily, our model assigns more importance to forward-looking factors. It is sufficient to end our calculations of the average state leading indexes in September of the election year. First, the October data comes out in early November, just days before the election, which would be an insufficient lead-time for our final forecast. Second, most voters make their decision at least one month in advance of the election and last-minute changes in economic forecasts will likely not influence their decision (Chart 14). The incumbent party’s margin of victory in the previous presidential election in each state. This is measured as the incumbent party vote share minus the non-incumbent party vote share. Simply put, if the incumbent party failed to secure a solid win in a given state in the previous election, the probability of securing a solid win in the current election is much smaller. Average national approval level of the incumbent president in July of the election year. We tested the correlation between presidential approval in every month leading up to the election versus the election outcome and found that July approval levels have the second-highest correlation with the popular vote and Electoral College vote (Chart 15). Average October approval levels have slightly higher correlation with election outcomes, but not sufficiently so to sacrifice three months of lead-time. A “time for change” variable. This is a categorical variable indicating whether the incumbent party has been in the White House for one or more terms. Academic literature shows that a party that has occupied the White House for two terms or more is much less likely to win an election than a party that is running for a second term.5 Chart 15Voters Mostly Decided By July
US Election 2020: Civil War Lite
US Election 2020: Civil War Lite
The output of our model is the probability of an incumbent win in each state. There are two ways of aggregating these probabilities to produce a national-level outcome: Allocate the number of Electoral College votes won by the incumbent proportionally to their probability of victory in each state, and then sum them up across all states. This method would smooth out potential errors in our forecast. The Republican Party is expected to win with 279 Electoral College votes in 2020. Assume a probability threshold of 50%: any state with an incumbent win that is at least 50% likely is fully assigned to the incumbent. While this method could significantly sway our forecast towards one of the parties because of small changes in probability, it is closer to the political reality. Even the smallest majority in a given state will (usually) result in the winning candidate getting all of the state’s Electoral College votes. We therefore adopt this method in our aggregation.6 Our model performs well in back tests: it correctly predicted every election in in-sample tests and every election from 2000 to 2016 in out-of-sample tests (Chart 16). Chart 16BCA Research Geopolitical Strategy Election Model: Back Tests Accurate
US Election 2020: Civil War Lite
US Election 2020: Civil War Lite
Chart 17 shows our initial 2020 prediction. Overall, the Republican Party is expected to win 279 Electoral College votes, a 25-vote decrease from its 2016 result. Chart 17Trump Narrowly Slated To Win 2020 With 279 Electoral College Votes
US Election 2020: Civil War Lite
US Election 2020: Civil War Lite
As of the latest available data, our model predicts that the Republicans will lose Michigan and Wisconsin (critical victories in 2016). Wisconsin, Pennsylvania, and New Hampshire become borderline or “toss-up” states: the probability of a Republican win in these states is 48.77%, 50.17%, and 46.90%, respectively. Even the smallest change in our inputs can shift these states to either party. The two inputs that can affect our forecast are the state leading index and President Trump’s approval level, since the other two inputs – the time for change variable and last election’s margin of victory – are fixed. Table 2 shows the predicted Electoral College votes for the Republican Party for various scenarios of these two variables. According to the model, President Trump is currently at the lowest level of approval and weakest state-by-state economy that he can afford. If one of these factors stabilizes below today’s level, Trump will lose his reelection bid. Table 2Small Decline In State Economies Could Ruin Trump’s 2020 Bid
US Election 2020: Civil War Lite
US Election 2020: Civil War Lite
In the worst-case scenario for Trump – if his approval and the state leading indexes drop to the lowest levels they have touched in Trump’s presidency – the Republican Party will only manage to secure 230 Electoral College votes. The opposite, optimistic scenario would see them winning with 329 votes. An interesting takeaway from our model is that it captures the increase in American political polarization that has been widely observed by scholars. The 2020 forecast shows that many states will be won or lost by the incumbent party with extreme certainty (0% or 100%). Results of in-sample predictions show that this trend has been increasing since 1992 (Chart 18, top panel), which is also in line with our own measure of polarization (Chart 18, bottom panel). Since the results are based on in-sample estimations, the coefficients remain constant, so the differences in the results can be attributed to the underlying data. The impression of ever-intensifying polarization in the US is correct. What does this mean for Trump? He cannot be written off simply because he has a relatively low approval rating. Structural political factors that propelled him to the White House are still in place. His approval and the economy must deteriorate to change this base case. The chief risk to our model is the accuracy and interpretation of presidential approval polling. While polling data always has a margin of error, it is possible that approval polling is underestimating Trump’s support, particularly on the state level, as was witnessed in 2016 (Chart 19). Chart 18Rising Polarization – It’s Empirical
US Election 2020: Civil War Lite
US Election 2020: Civil War Lite
Chart 19State-Level Polling Still A Risk
State-Level Polling Still A Risk
State-Level Polling Still A Risk
We have a high degree of confidence in professional pollsters, who have also made improvements since 2016. But asking Americans whether they “approve” of the unorthodox Trump may be a different proposition than in the past, disguising voting intentions to some degree. By choosing the level of Trump’s approval in our model (see Appendix), we are guarding against overstating his support and not allowing much room for any dampening effects or self-censorship, which is thus a risk to our model. Bottom Line: Quantitative modeling, entirely independent of our qualitative assessment, suggests that Trump is favored to win the 2020 election. However, he is skating on very thin ice with regard to key cyclical variables such as state-level economic performance and popular approval rating. If his approval level suffers from a slowing economy, or scandal and impeachment, then he will lose the critical toss-up states and the White House. Investment Conclusions In this report we have outlined a case where President Trump, despite his extreme unorthodoxy in general, and acute vulnerability at this moment in time, is still the most likely winner of the 2020 election. Elections are a Bayesian process in which investors should establish a clear prior, or starting place, and update their probabilities according to reliable data streams. This report establishes our prior and our key data streams. So what? Does it matter if Trump is reelected? Is it relevant to investors? From a bird’s eye view, Trump has made a few decisions that clearly distinguish his term in office from that of previous presidents. First, Trump replaced Janet Yellen with Jerome Powell at the Federal Reserve. It is debatable whether or how this affected the normalization of monetary policy. What is clear is that Trump made a change at the helm while pushing through highly stimulative fiscal policy. Fed hikes contributed to a rise in bond yields and an increase in market volatility, and the Fed was ultimately forced to adjust. Trump has vociferously criticized the Fed and demanded ever-lower rates. Second, by embracing sweeping Republican tax reform, Trump initiated pro-cyclical fiscal stimulus that widened the US’s monetary and economic divergence from the rest of the world, while exacerbating the US’s long-term fiscal woes. Third, by adopting protectionist trade policy to confront China’s mercantilism, Trump rattled global sentiment and contributed to a manufacturing recession. As long as our view remains correct, investors will have a base case that is cyclically bullish. Of these three macro developments, the only one that the election could substantially change is trade policy – and yet the Democrats are also taking a more hawkish approach to China. On the fiscal front, the Democrats will raise taxes, but they will not impose austerity – instead they propose large expansions of entitlements that the populace increasingly demands. Populist social spending combined with geopolitical struggle with China ensures that the deficit/GDP ratio will go up regardless of the party in power. From a market point of view, the historical record suggests that presidential elections – specifically elections that lead to gridlock between the White House and Congress, since we do not expect the Democrats to lose the House of Representatives – usually see a rising US stock market beforehand and a higher degree of volatility afterwards (Chart 20). Relative to developed market equities, US stocks typically underperform, and only resume their rise in the second half of the following year (i.e. 2021). Comparing Trump to other first-term presidents, it is clear that his “pluto-populism” (populism plus tax cuts for the rich) has exerted a reflationary effect on the equity market (Chart 21). As long as the data show that he has a fair chance of reelection, investors will have a base case that is cyclically bullish, despite the volatility to come from the Democrats’ taxation and regulation proposals. Chart 20Equity Outcomes Surrounding US Presidential Votes
Equity Outcomes Surrounding US Presidential Votes
Equity Outcomes Surrounding US Presidential Votes
Chart 21Trump A Reason To Be Bullish
Trump A Reason To Be Bullish
Trump A Reason To Be Bullish
What is most striking about Trump’s presidency is the low real total return on US Treasuries. This is despite his aggressive foreign and trade policy, which has motivated safe-haven flows into Treasuries this year (Chart 22). The bottom line is that the output gap is closed, the labor market is tight, and fiscal policy is expansive, putting upward pressure on yields. Given that Trump needs to cultivate a China ceasefire and economic improvement for reelection, this trend should continue until the next recession looms. Chart 22Trump Marks End Of Bull Market In Bonds
Trump Marks End Of Bull Market In Bonds
Trump Marks End Of Bull Market In Bonds
The risk, however, is that Trump’s precarious China negotiations fall through, or that his scandals cause a permanent downshift in his approval rating, rendering him a lame duck. Not only would this free him of the election constraint that currently forces him to pursue pro-market policies, but it would also make a Democratic victory more likely. The Democratic nomination, meanwhile, could easily produce a progressive populist in the figure of Elizabeth Warren, who is still a frontrunner in the Democratic nomination. A bear market could develop quite easily if a normal equity market correction, which improves the odds of a Democratic victory becomes entangled in expectations that Warren is set to win the nomination. If the opposition can summon enough votes to unseat an incumbent president, chances are that the circumstances will include a “blue wave” that also sees the Democrats take the Senate. This would institute another sweeping change to American policy, this time in a direction that is unfriendly to corporate profits. As the probability of such a scenario rises, the equity market will have to discount it. Expectations of a Trump victory will spur the market upward – but investors should be wary. If this very long bull market has continued all the way to November 3, 2020, and President Trump is confirmed in office, the positive stock market reaction will likely provide an excellent time for booking profits and reducing risk. In a second term, Trump will be unshackled from his electoral constraints – very much unlike a first-term Democrat. This would free him to pursue his trade wars with fewer inhibitions – against China but also likely against Europe. A continuation of the trade war has important impacts across the full slate of global assets, as outlined in Chart 23, which depicts the movement of assets on days in which US equities reacted negatively to trade war developments. Chart 23A Trump Second Term Means Trade War With Fewer Constraints
US Election 2020: Civil War Lite
US Election 2020: Civil War Lite
With 11 months to go, we are a world away from the election. The party nomination process, or third-party candidates, could overturn all expectations. But if there is one certainty, it is that polarization and political risk will rise in the coming 12-24 months. The losing side of the population will have deep heartburn. A crisis of legitimacy could easily haunt the next administration. There could be hanging chads, vote recounts, faithless electors, or contested results. The outcome of the election could turn upon unprecedented developments in the Electoral College, Supreme Court, or even in cyberspace. If the Democrats win, redistribution will amplify partisanship. If Trump wins, inequality will rise. There is no easy way forward for the United States. Matt Gertken Vice President Geopolitical Strategist mattg@bcaresearch.com Ekaterina Shtrevensky Research Analyst ekaterinas@bcaresearch.com Appendix 1: The Approval Question: Level Or Change? Chart 24Trump’s Historically Low Approval Rating
US Election 2020: Civil War Lite
US Election 2020: Civil War Lite
The chief risk to our model is the interpretation of the presidential approval rating and its impact on the election. President Trump’s approval rating is notoriously low compared to the average president (Chart 24). While many authors use approval rating (or popularity) in their models, some argue that it is not the approval level, but the change in approval leading up to the election that matters.7 Consider the following: if President Trump’s approval increases from today’s level of 43% by 5%, he would be at the same level of approval as the average president if their approval were to drop by 5%. A model based on approval level would place these two presidents equally, while a model based on the change in approval would favor Trump. So which one is correct? We compare the incumbent’s popular vote in post-WWII elections with four different “variations” of incumbent president approval: the average level in July of the election year (as in our model); the deviation of the average October level from the election-year average, the change during the last two years of the term; and the range throughout the entire term. Directionally, the results are as expected. Level and change in approval are positively correlated with the popular vote, while a less stable approval (higher range) is negatively correlated (Chart 25A). We also find that approval level has the best fit with the election outcome, followed by the change in approval in the two years leading up to the election. However, if we restrict the sample size to the range of elections used in our model, 1984 to 2016, we find that the change in approval has a much better fit than the level (Chart 25B). In other words, in modern elections the presidential candidate’s momentum matters more in the final outcome. Chart 25AHigh, Rising, And Stable Approval Ratings …
US Election 2020: Civil War Lite
US Election 2020: Civil War Lite
Chart 25B… Help Presidents Win Elections
US Election 2020: Civil War Lite
US Election 2020: Civil War Lite
We tested each variation of approval as an input in our model instead of the July approval level. Table 3 summarizes the results. Trump wins in all four versions. Table 3All Measures Of Approval Favor Trump In 2020
US Election 2020: Civil War Lite
US Election 2020: Civil War Lite
Our current model penalizes Trump the most, while the model based on approval range favors him. This makes sense, given that President Trump’s approval is relatively low but very stable (Chart 26). Chart 26Trump Approval Very Low … And Very Stable
US Election 2020: Civil War Lite
US Election 2020: Civil War Lite
We will continue to use approval level in our model to generate updated predictions, given that this measure has the best long-term historical fit with the election outcome. However, given that President Trump is performing relatively well on these other measures of approval, there is upside risk to his 2020 performance. Appendix 2: A Word About The Probit Model Table 4 presents the regression coefficients of our model. Since this is a probit model, the coefficients cannot be directly interpreted as they would in an ordinary regression. The coefficients in a probit regression model measure the change in the Z-score associated to each independent variable for a one-unit change in that variable. Table 4BCA 2020 US Presidential Election Model Statistics
US Election 2020: Civil War Lite
US Election 2020: Civil War Lite
The sign of the coefficient corresponds to the direction of change in probability. So increases in the state leading index, presidential approval, or the incumbent’s margin of victory in the last election increase the probability of the incumbent winning a state. Of course, the latter variable is fixed and will not change until the election. At the same time, having occupied the White House for two terms or more decreases the probability of an incumbent win. But this is not the case in the current election. Footnotes 1 Andrew Johnson, the first to be impeached, did not run in 1868; Ulysses Grant bowed out after two terms in 1876, amid the “Great Barbecue” scandal; Warren Harding died before the election of 1924, amid the infamous “Teapot Dome” scandal; Harry Truman stepped down amid scandal after two terms in 1952; Richard Nixon resigned before the election of 1976; Bill Clinton was impeached and hit the two-term limit before the election of 2000. For these examples, and the electoral impact of great scandals in general, please see Allan J. Lichtman, Predicting The Next Presidency: The Keys To The White House 2016 (Rowman and Littlefield, 2016). 2 Trump’s policy record contains one major legislative victory, the Tax Cut and Jobs Act of 2017, along with a number of works in progress. The Republicans’ failed attempt to repeal and replace the Affordable Care Act (Obamacare) exacted an opportunity cost: it deprived Trump and the GOP Congress of time needed to legislate a southern border wall, while mobilizing the opposition for all subsequent elections. As for other policies, the renegotiation of NAFTA is only a partial success as the USMCA has not been ratified. The promised infrastructure package will become a campaign pledge for the second term. We expect some kind of North Korea deal. 3 To this end, we use a probit model, where the dependent variable is stated as 1 = incumbent party won all Electoral College votes in this state, or 0 = incumbent party did not win any Electoral College votes in this state. This model allows us to measure the probability that a state with certain characteristics will fall into one of these two categories. 4 “The leading index for each state predicts the six-month growth rate of the state’s coincident index. In addition to the coincident index, the models include other variables that lead the economy: state-level housing permits (1 to 4 units), state initial unemployment insurance claims, delivery times from the Institute for Supply Management (ISM) manufacturing survey, and the interest rate spread between the 10-year Treasury bond and the 3-month Treasury bill.” See the Federal Reserve Bank of Philadelphia, www.philadelphiafed.org. 5 Alan I. Abramowitz, “Forecasting the 2008 Presidential Election with the Time-for-Change Model,” Political Science and Politics, Vol. 41, No. 4 (Oct., 2008), pp. 691-695. 6 We also assume that the Democrats always win the District of Columbia. 7 Please see Michael S. Lewis-Beck, Charles Tien, “Forecasting presidential elections: When to change the model,” International Journal of Forecasting, Volume 24, Issue 2, April–June 2008, Pages 227-236, and Mark Zandi, Dan White, Bernard Yaros, “2020 Presidential Election Model,” Moody’s Analytics, September 2019.
Highlights The Fed is the usual culprit for killing business cycles — but the Fed is on hold. This makes geopolitics the likeliest candidate to kill the cycle. The key geopolitical risks are US political turmoil, China’s economic policy, and the US-Iran confrontation. Nevertheless, policymakers are adjusting to the threat of recession, which points to a continuation of this long-in-the-tooth expansion. The US-China talks will be driven by Trump’s need for an economic boost ahead of the US election. If the economy or Trump’s approval rating fails anyway, then all bets are off. Go long gold as a strategic hedge. Feature Great power struggle, or “multipolarity,” continues to be our mega-theme in 2020. The world does not operate like a normal society, with a single government that possesses a monopoly on the use of force and ensures stability. Nations are individualistic, armed, and dangerous, creating what scholar Hedley Bull once called “The Anarchical Society.” This is not pure chaos, but rather a community of nations that lacks a clear and undisputed leader. Hence, quarrels break out often. Updating our geopolitical power index shows that the rise of China remains the most disruptive trend in global politics (Chart 1). The gap between the US and China has closed until recently, with China’s downshift in growth rates, but American fear is just being awakened (Chart 2). Given that Beijing threatens the US’s military and technological dominance over the long run, Washington will continue to develop a containment policy. Chart 1China's Geopolitical Rise Is Disruptive
2020 Key Views: The Anarchic Society
2020 Key Views: The Anarchic Society
Chart 2China-US Power Gap Is Narrowing
2020 Key Views: The Anarchic Society
2020 Key Views: The Anarchic Society
China is too big to quarantine, especially for a relatively unpopular first-term American president who eschews international coalition-building. The European Union’s decline in relative power is more marked than that of the United States, but China does not pose as much of a security threat to Europe. This trend exacerbates the already serious divergence in the trans-Atlantic alliance – which will worsen if Trump wins on November 3, 2020. Hence, globalization faces persistent challenges, as indicated by the falling import share of global output (Chart 3). This multi-decade process has peaked, creating a headwind for trade-exposed firms over the long run. What about the next 12 months? Will geopolitics kill the bull market? Not necessarily. Just as central bankers have cut interest rates to guard against deflationary risks (Chart 4), so the key governments are adjusting policies to avoid recessionary risks, especially with the memory of 2008 still fresh. Simply put: The Fed is on pause, Trump wants to be reelected, and China cannot afford a hard landing. Chart 3Globalization Faces Challenges
2020 Key Views: The Anarchic Society
2020 Key Views: The Anarchic Society
Chart 4Policymakers Are Reacting To Deflationary Risks
2020 Key Views: The Anarchic Society
2020 Key Views: The Anarchic Society
Clearly the risks to this view are elevated. The chief ones: (1) President Trump becomes a lame duck, cannot run on an economic platform, and thus makes a desperate attempt to win as a “war president” (2) Xi Jinping overestimates his advantage, in domestic or foreign policy, and makes a policy mistake (3) the US-Iran conflict spirals out of control due to Iran’s economic vulnerability. Other risks, such as Brexit, pale by comparison. Fear And Loathing On The Campaign Trail It is too soon to declare that Trump’s presidency is finished. On the contrary he is slightly favored to win reelection: • The Senate is unlikely to remove him from office. Republican support for the president is well above average despite evidence that Trump tried to get Ukrainian officials to investigate his political rival (Chart 5). The implication is that a year from now Democrats will have suffered a policy failure while Trump will have been cleared of charges. Chart 5Trump Still Popular Among Republicans
2020 Key Views: The Anarchic Society
2020 Key Views: The Anarchic Society
• The odds of recession in the coming year are low. The US voter is buffered by rising real incomes and wages and high net wealth (Chart 6). To unseat a sitting president requires a recessionary backdrop that fundamentally discredits him and his party – not just slowing growth. Chart 6Pocketbook Voter Theory To The Test
2020 Key Views: The Anarchic Society
2020 Key Views: The Anarchic Society
• Trump’s low approval rating does not prohibit him from reelection. While historically low, it is also historically stable. Our quantitative election model – which predicts Trump will win the Electoral College with 279 votes by clinging onto Pennsylvania – shows that Trump’s victory margin would increase if we looked not at the average level of his approval but at its change, momentum, or low range (i.e. stability). Table 1 shows the results of all four variations of his approval rating, with ascending chances of winning key swing states. Table 1All Measures Of Trump’s Approval Rating Get Him 270 Electoral College Votes
2020 Key Views: The Anarchic Society
2020 Key Views: The Anarchic Society
Trump’s odds of winning will affect the US equity market throughout the year. As long as he remains competitive, i.e. neither scandal nor the economy cause his approval rating to break down, he will have reason to temper his policies to cater to US financial markets. Foreign and trade policies are Trump’s only ways to improve the economy and voter support. Trump’s only remaining way to boost the economy and improve voter support lies in foreign policy and trade policy. Specifically, he will stop increasing tariffs on China – and maybe even roll back tariffs to August 2019 or even April 2019 levels (Chart 7) – at least as long as the manufacturing recession persists. Chart 7Some Tariff Rollback Is Possible
2020 Key Views: The Anarchic Society
2020 Key Views: The Anarchic Society
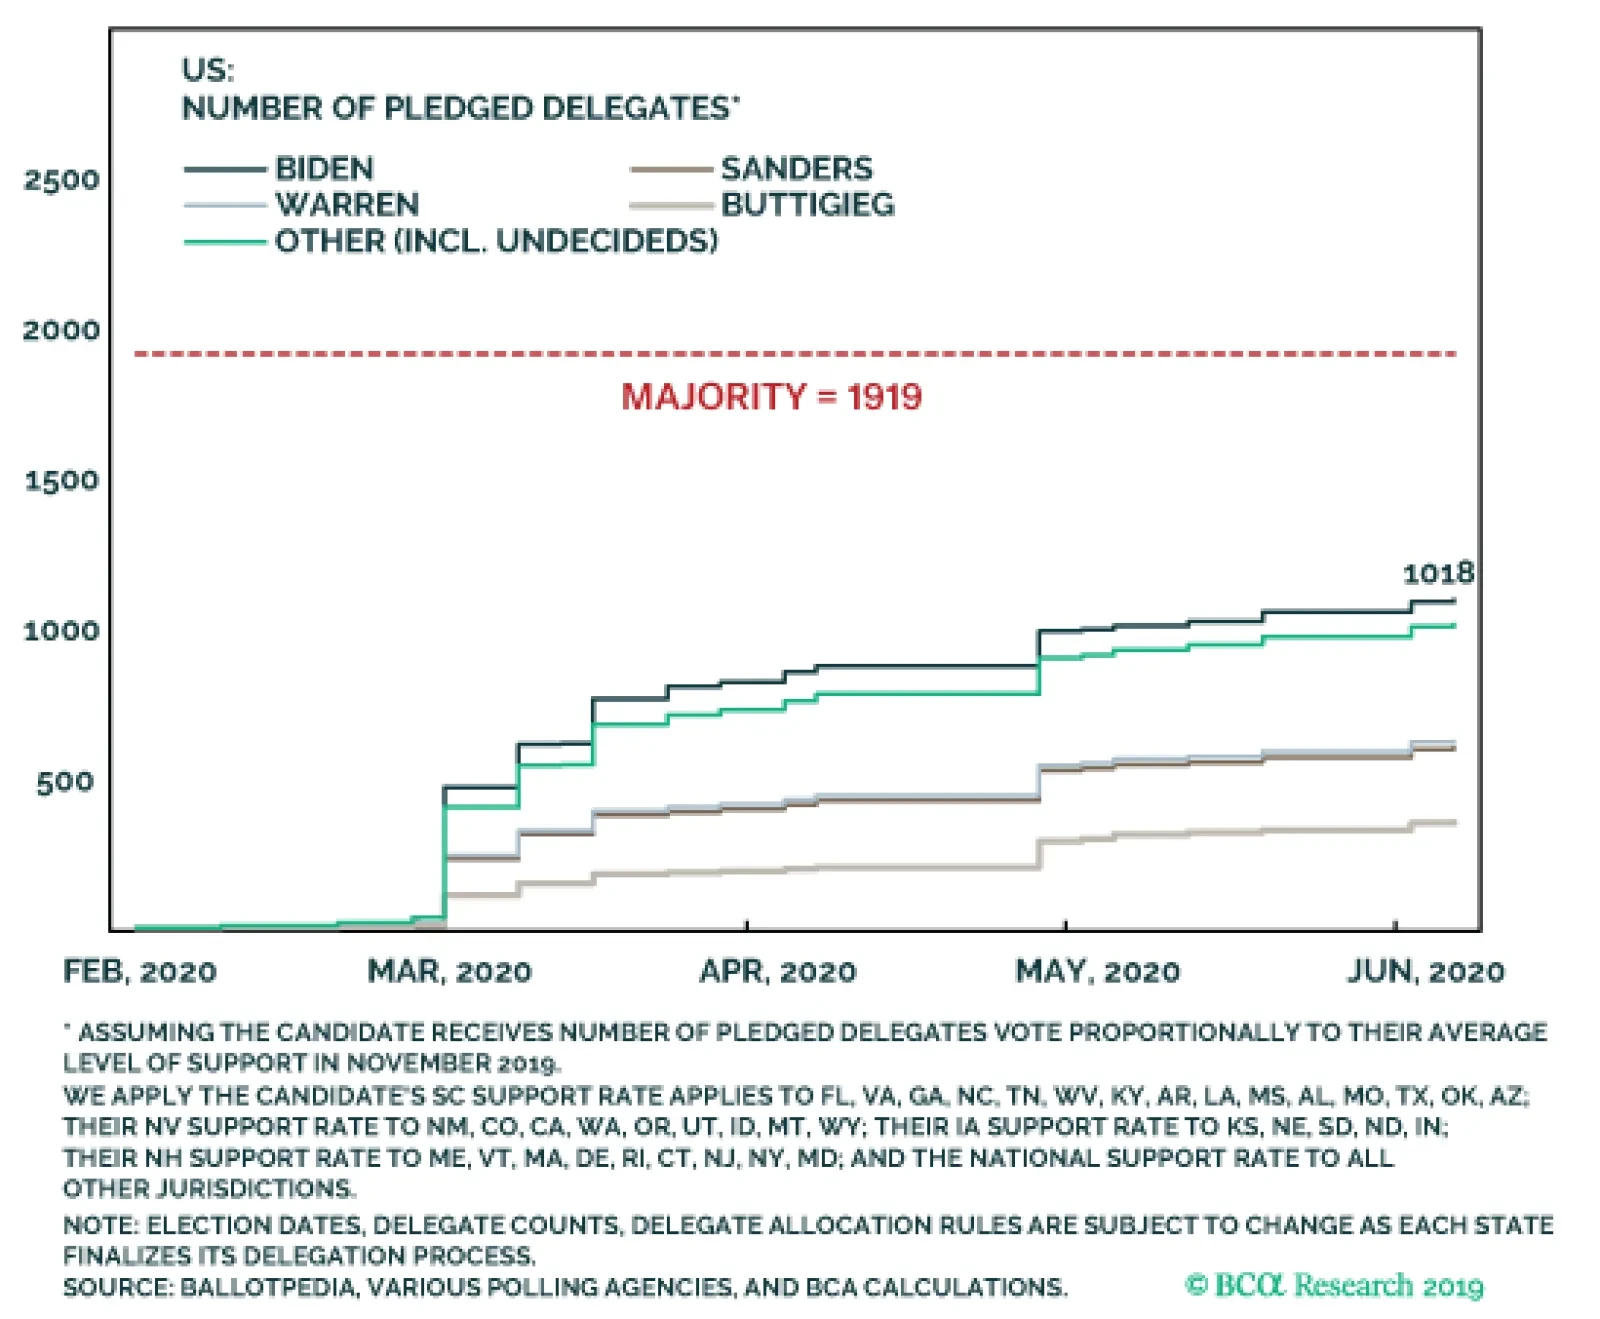
China is unlikely to implement painful structural changes when Trump could be gone in 12 months’ time. Strategic tensions outside of trade will undermine any ceasefire. Hence economic policy uncertainty will remain elevated even though it will drop off from recent peaks. Assuming the electoral constraint prevents Trump from levying sweeping tariffs on China or Europe, he will be limited to other foreign and trade policies to try to boost his approval rating or fire up his base: • We expect a third summit with Kim Jong Un of North Korea. Trump is rumored to be considering some troop reduction in exchange for progress on denuclearization (neither of which would be irreversible). • Otherwise Trump could turn to saber-rattling, since Pyongyang is threatening to resume long-range tests and the economic consequences of another round of “fire and fury” would be limited. • Trump could also rattle the saber against Iran, Venezuela, or other rogue states. If Trump becomes uncompetitive in the election, then the market will sell off. The market will have to price not only policy discontinuity (e.g. higher taxes), but also the chance of a progressive-populist taking the White House. Moreover, if a Democrat is able to unseat an incumbent president, the Democrats will take the Senate as well. Trump is a known unknown; this scenario would be an unknown unknown. The Democratic Party’s primary election will consume the first half of the year. It culminates in the Democratic National Convention, strategically chosen to take place in Milwaukee, Wisconsin on July 13-16. Wisconsin is one of three critical swing states. Will former Vice President Joe Biden win the nomination? A high conviction is not warranted. Biden is clearly the frontrunner, but we think a progressive can pull it off. A simulation of the Democratic Convention “pledged delegates,” based on November polling in the first four primary elections, shows Biden far short of a majority (Chart 8). He needs to outperform his polls, but this will be difficult given that he is well-known, has not performed well in debates, and will have Mayors Pete Buttigieg and Michael Bloomberg nipping at his heels in the Midwest and Northeast, respectively. Chart 8Do Not Discount A Progressive Win
2020 Key Views: The Anarchic Society
2020 Key Views: The Anarchic Society
Over time, candidates will drop out, so it is more informative to look at the “centrist” candidates as a whole compared to the “progressives.” Here the early primary polling suggests that the progressives will come closest to victory (Chart 9). Chart 9Progressives Come Closest To Victory
2020 Key Views: The Anarchic Society
2020 Key Views: The Anarchic Society
The trend within the party is to move to the left. Senators Elizabeth Warren and Bernie Sanders are tied as voters’ second choice – even Buttigieg supporters are split between Biden and Warren (Chart 10). What is unknown is whether Warren (or Sanders) can consolidate the progressive vote faster than Biden (or Buttigieg) consolidates the centrist vote. Chart 10If Biden Falters, Progressives Are Next In Line
2020 Key Views: The Anarchic Society
2020 Key Views: The Anarchic Society
Chart 11Structural Imbalances Give Rise To Populism
2020 Key Views: The Anarchic Society
2020 Key Views: The Anarchic Society
Trends pointing toward a progressive victory may not at first trouble the market, but any signs that a progressive is pulling ahead decisively will force investors to sharply upgrade the probability that he or she will win the White House. This will cause equity volatility, which could become self-reinforcing. A progressive nominee would force investors to recognize that populism and political risk are here to stay – which is our expectation given that they are motivated by polarization, inequality, and other structural imbalances in the United States (Chart 11). Left-wing or progressive populism is far more negative for corporate earnings than Trump’s right-wing or “pluto-populism.” Sanders or Warren present the worst case for investors because they favor trade protectionism in addition to higher taxes and minimum wages. Most presidents achieve their chief legislative priority in their first term and there is no reason to assume a progressive presidency would be any different. The implication is higher corporate taxes as well as individual taxes to pay for a sweeping expansion of the social safety net – positive for the economy perhaps but negative for corporate earnings. Chart 12A Progressive Win Threatens Key Sectors
2020 Key Views: The Anarchic Society
2020 Key Views: The Anarchic Society
An extensive re-regulation of the US economy would occur regardless, since it falls under executive authority. It would affect the key equity sectors in the US bourse, technology and health (Chart 12), as well as energy and financials. The choice of a centrist Democrat like Biden (or Buttigieg) would be the least negative outcome for US equities of all the Democrats. The market would probably cheer a Trump versus Biden matchup for this reason. Biden favors higher taxes and regulation but is an establishment politician and known quantity. However, even Biden will be pulled to the left by the current within his party once in office; and Buttigieg will govern to the left of Biden. Trump’s reelection would spur a relief rally in US equities, but it would be short-lived. He would solidify low taxes and deregulation and would have a real chance of passing an infrastructure package. But he would also curtail labor force growth with his border wall and double down on trade protectionism – likely against Europe as well as China this time. His unpredictable and aggressive tendencies would be turbo-charged by a new popular mandate. We expect to cut back on risk exposure upon Trump’s reelection, assuming the bull market has survived to return him to office. A Democratic victory would mark another reversal in US policy orientation. Given our view that the White House call is also the Senate call, this would be the third time since 2008 that the country has witnessed a total reversal. Domestic American political risk will not end with the election: a legitimacy crisis could follow a narrow election, and institutional erosion continues regardless. It is too soon to call peak polarization, as the election will result in either a left-wing government bent on redistributing wealth or a right-wing Trump administration that exacerbates inequality. A centrist "return to normalcy" is possible with a Biden or Buttigieg victory. This reinforces our constructive cyclical view. Bottom Line: The chief risk from US politics in 2020 is Trump becoming a lame duck and resorting to belligerent foreign policy to try to win back voters through a rally around the flag. The chief risk of the Democratic nomination, and the general election, is a left-wing populist winning the White House. Any Democratic victory would likely bring the Senate, removing a key constraint. Over time the median voter is moving to the left. The Man Who Changed China Chart 13Xi Is Purging Misallocated Capital
2020 Key Views: The Anarchic Society
2020 Key Views: The Anarchic Society
Xi Jinping undoubtedly represents a “new era” in China – a reassertion of Communist Party rule. The party faced a crisis of legitimacy amid the Great Recession and Arab Spring and was determined to regain political, economic, and social control. Xi had previously been anointed but was all too happy to take on the role of neo-Maoist strongman. Yet Xi’s playbook is close to that of President Jiang Zemin’s: centralize the party, repress dissent, modernize the military, restructure banks and the economy, upgrade the country’s science and technology, and expand China’s global influence. The difference is that while Jiang rode the high tide of globalization, Xi is riding the receding tide. Jiang culled two-thirds of the country’s state-owned enterprises, laying off over 40 million people, confident that a surge of new growth would ensue. Xi is also cracking down – allowing bankruptcies to purge misallocated capital (Chart 13) – but with a large debt load and shrinking labor force, he needs the state sector to put a floor under growth rates. The takeaway is that Xi will act pragmatically to boost growth when China’s stability is threatened, as he did in 2015-16. The trade war has already forced him to backtrack on the 2017-18 deleveraging campaign and stimulate the economy. The combined fiscal and credit impulse amounts to 6.6% of GDP from trough to now, and it hasn’t peaked. The implication is that Chinese growth – and global growth – will pick up from here (Chart 14). Chinese authorities are still trying to contain the growth in leverage, which has kept this year’s stimulus in check. But the chief banking regulator has also stated that as long as the macro-leverage ratio is not growing faster than 10%, this goal is met (Chart 15). Chart 14Chinese Growth Will Pick Up
2020 Key Views: The Anarchic Society
2020 Key Views: The Anarchic Society
Chart 15China Says Leverage Already Contained
2020 Key Views: The Anarchic Society
2020 Key Views: The Anarchic Society
The economy has not yet durably bottomed, so the state will continue adding support. The coming year is the third and final year of the “Three Battles” – against poverty, pollution, and systemic risk – as well as the final year of the thirteenth five-year plan. Beijing is falling short on its targets for real urban per capita income (Chart 16) and poverty elimination (Chart 17). A last-minute rush to meet these targets is likely and will require more fiscal stimulus. Chart 16Beijing Falls Short Of Urban Income Target...
2020 Key Views: The Anarchic Society
2020 Key Views: The Anarchic Society
Chart 17...And Poverty Target
2020 Key Views: The Anarchic Society
2020 Key Views: The Anarchic Society
This is not an argument for a blowout credit splurge. China is saving dry powder for a further escalation in the US containment strategy and a worse economic downturn. Do not expect a blowout Chinese credit splurge. The core constraint on policy is unemployment. Stimulus efforts have created a bottom in the employment component of the manufacturing PMI as well as a notable uptick in the demand for urban labor (Chart 18). To withdraw stimulus now – or tighten policy – would be to trigger a relapse in an economy that is ultimately at risk of a debt-deflation trap. Chart 18Chinese Stimulus Shows Up In Employment
2020 Key Views: The Anarchic Society
2020 Key Views: The Anarchic Society
Chart 19A Banking Crisis Is A Risk To The Chinese Economy
2020 Key Views: The Anarchic Society
2020 Key Views: The Anarchic Society
Tougher controls on credit and shadow banking have seen an uptick in corporate defaults and bank failures. With the government deliberately imposing pain on bloated sectors of the economy, financial turmoil could spread. Newspaper mentions of defaults, layoffs, and bankruptcies have only slightly subsided since stimulus efforts began (Chart 19). If bank failures spiral out of control, the economy will tank. The state will have to fight fires. Tariffs have accelerated the trend of firms relocating out of China, which began because of rising wages and a darkening business environment (Chart 20). A questionable trade ceasefire will not reverse the process as American and Asian companies are seeking a lasting solution, which requires them to set up shop elsewhere. China will want to mitigate the process, first by stabilizing domestic growth, and second by accepting Trump’s tactical trade retreat. Xi is also trying to avoid diplomatic isolation by courting trade partners other than the US, since the ceasefire is unreliable and the US containment strategy is presumed to continue. This involves outreach to the rest of Asia, Russia, and Europe, and even to distrustful neighbors like Japan and India. Europe is the swing player. China’s Asian neighbors, and Australia and New Zealand, have reason to fear Beijing’s growing clout and seek the US’s security umbrella. Russia and China are informal allies. But the European public is not interested in the new cold war – China does not threaten Europe from next door, like Russia does, and the Trump administration is threatening Europe with both trade war and Middle Eastern instability. European leaders are happy to take the market share that the US is leaving, as is clear from direct investment (Chart 21). Only a concentrated US diplomatic effort can address this divergence, which is not forthcoming in 2020. Chart 20Firms Are Relocating Out Of China
2020 Key Views: The Anarchic Society
2020 Key Views: The Anarchic Society
Chart 21Europe Exploits US-China Rift
2020 Key Views: The Anarchic Society
2020 Key Views: The Anarchic Society
A new Democratic administration, or a change in Trump strategy in the second term, could eventually produce a multilateral western coalition demanding that China open up and liberalize parts of its economy. But Europe will need to be convinced of the underlying reality that China is doubling down on the state-led industrial policies that provoked the Americans to begin with. Beijing is after economic self-sufficiency, indigenous innovation, and leadership in high-tech production and new frontiers. Its official research and development budget is not its only means for achieving this end (Chart 22) – it also has state-backed acquisitions and cyber campaigns. Germany and Europe have begun scrutinizing Chinese investment, separately from the United States. Chart 22Beijing Is After Economic Self-Sufficiency
2020 Key Views: The Anarchic Society
2020 Key Views: The Anarchic Society
The danger to China – and the world – is that Xi Jinping might overplay his hand. He could overtighten money, credit, or property regulations and spoil the economy when global growth is vulnerable. His anti-corruption campaign is a telling reminder of his heavy hand in domestic affairs (Chart 23). Chart 23Xi Jinping Risks Overplaying His Hand
2020 Key Views: The Anarchic Society
2020 Key Views: The Anarchic Society
Chart 24China Needs To Calm Things Down
2020 Key Views: The Anarchic Society
2020 Key Views: The Anarchic Society
He could also suppress protesters in Hong Kong and rattle sabers over Taiwan or the South China Sea in a way that undermines the trade ceasefire. Or he could fail to bring the North Koreans to heel. These strategic tensions are significant only insofar as they undermine the trade ceasefire or provoke US-China saber-rattling. Failing to act as an honest broker in the Iran crisis would also irk Europeans and give them an excuse to side with the US. Bottom Line: China will continue modestly stimulating the economy next year to achieve a durable stabilization in growth. The risk of debt-deflation and rising unemployment ultimately necessitates this policy. Beijing can accept Trump’s tariff rollback for the sake of stability – China’s policy uncertainty relative to the rest of the world is off the charts and Beijing has an interest in calming things down (Chart 24). Yet Beijing will double down on indigenous innovation, while courting the rest of the world so as to preempt criticism and isolate the Americans. The risk is that Xi proves too heavy-handed when it comes to domestic leverage, the tech grab, strategic disputes, or trade talks with Washington. The Strait Of Hormuz Risk Chart 25US-Iran Conflict Still Unresolved
2020 Key Views: The Anarchic Society
2020 Key Views: The Anarchic Society
In a special report earlier this year entitled “The Polybius Solution” we argued that while the US-China conflict is the major long-term geopolitical conflict, the US-Iran showdown could supersede it in the short term. This remains a risk for 2020, as the Trump administration’s confrontation with Iran is fundamentally unresolved (Chart 25). The Trump administration is still enforcing “maximum pressure” sanctions, which have reduced Iranian oil exports from 1.8 million barrels per day at their recent peak to 100,000 barrels per day in November (Chart 26). These are crippling sanctions that have sent Iran’s economy reeling. Chart 26Iran Remains Under
2020 Key Views: The Anarchic Society
2020 Key Views: The Anarchic Society
Iran’s Supreme Leader Ayatollah Ali Khamenei has ruled out negotiations with Trump. They would be unpopular at home without a major reversal on sanctions from Trump (Chart 27). Chart 27Major US Reversal Prerequisite For Iran Talks
2020 Key Views: The Anarchic Society
2020 Key Views: The Anarchic Society
Trump presumably aims to avoid an oil shock ahead of the election. The US and its allies have visibly shied away from conflict in the wake of Iran’s provocations, including the spectacular attack on eastern Saudi Arabia that knocked 5.7 million barrels of oil per day offline in September. However, this does not mean the odds of war are zero. The Americans or the Iranians could miscalculate. Both sides might think they can improve their standing at home by flexing their muscles abroad. Iran is a rational actor and would not normally court American airstrikes or antagonize a potentially lame duck president. Yet it is under extreme pressure due to the sanctions. It faces significant unrest both at home and in its sphere of influence (Iraq and Lebanon). Opinion polls show that the public primarily blames the government for the collapsing economy, and yet that American sanctions are siphoning off some of this anger (Chart 28). This could tempt the leaders to continue staging provocations in the Strait of Hormuz or elsewhere in the region. Chart 28Iranians Blame Tehran, Tehran Blames America
2020 Key Views: The Anarchic Society
2020 Key Views: The Anarchic Society
Hardline military leaders and politicians currently receive the most favor in polling, while the reformist President Rouhani – undercut by the American withdrawal from the 2015 deal – is among the least popular (Chart 29). The Majlis (parliament) elections in February will likely reverse the reformist turn in Iranian politics that began in 2012. The regime stalwarts are gearing up for the supreme leader’s succession in the coming years. While a Democratic White House could restore the 2015 deal, that ship may have sailed. Chart 29Rouhani And Reformists In Trouble
2020 Key Views: The Anarchic Society
2020 Key Views: The Anarchic Society
A historic oil supply disruption is a fatter tail risk than investors realize. Chart 30The Iranians May Take Excessive Risk
2020 Key Views: The Anarchic Society
2020 Key Views: The Anarchic Society
Trump, under impeachment, could seek to distract the public. This was Bill Clinton’s tactic with Operations Infinite Reach, Desert Fox, and Allied Force in 1998-99. These operations were minor and not comparable to a conflict with Iran. However, Trump may be emboldened. On paper the US strategic petroleum reserve (along with OPEC and other petroleum reserves) could cover most major oil shock scenarios. According to Hugo Bélanger, Senior Analyst at BCA Research Commodity & Energy Strategy, a supply outage the size of the Abqaiq attack in September would have to persist for four months to cause enough price pressure to harm the US economy and decrease Trump’s chances of winning reelection. The simulations in Chart 30 overstate the gasoline price impact by assuming that global oil reserves remain untapped. Thus while the Iranians may take excessive risks, the Trump administration may not refrain this time from airstrikes. Bottom Line: While the Middle East is always full of risks to oil supply, Iran’s vulnerability and Trump’s status at home make the situation unusually precarious. A historic oil supply disruption is a fatter tail risk than investors realize. Europe Is A Price Taker, Not A Price Maker Just as the US and China have a shared incentive to avoid tariff-induced recession, so the UK and EU have a shared incentive to prevent a shock reversion to basic WTO tariffs. The December 31, 2020 deadline for the UK-EU trade deal, like the various deadlines for Brexit itself, can be delayed. Even Prime Minister Boris Johnson has proved unwilling to exit without a deal and even a hung parliament has proved capable of preventing him from doing so. The negotiation of a trade deal – which is never easy and always drags on – will be a lower-order risk in the wake of the past two years’ Brexit-induced volatility. Johnson will not be held hostage by hardline Brexiters given that Brexit itself will be complete. If our view on Chinese growth is correct, then Europe’s economy can recover and European political risk will be a “red herring” in 2020, as it was in 2019. Instead the EU presents an opportunity. Chart 31Euro Area Breakup Risk Has Subsided
2020 Key Views: The Anarchic Society
2020 Key Views: The Anarchic Society
Euro Area break-up risk has subsided after a series of challenges in the wake of the sovereign debt crisis (Chart 31). There is not a basis for a reversal of this trend, at least not until a full-blown recession afflicts the continent. The rise in anti-establishment parties coincided with a one-off surge in migration that is finished – and successful populists from Greece to Italy have moderated on euro membership once in power. Germany is entering a profound transition driven by de-globalization and tensions with the United States. It is more likely to have an early election than the consensus holds. But it is fundamentally stable and supportive of European integration. In fact the great debate about fiscal policy poses an upside risk over the long run both for European equities and the European project. We remain optimistic on French structural reforms even though President Emmanuel Macron must overcome significant public opposition. An eerie quiet hangs over Russia, making it one of our “Black Swan” risks for 2020. Oil prices are not very high, which discourages foreign adventures, and President Vladimir Putin has spent his fourth term trying to consolidate international gains and improve domestic stability. But approval of the government is weak, the job market is deteriorating, and social unrest is cropping up. There is plenty of room to ease monetary and fiscal policy, but a sharp downturn could provide the basis for an aggressive foreign policy action to shore up regime support. The US election also presents the risk of renewed US-Russian tensions, whether over election interference or a Democratic victory. Investment Conclusions Geopolitics is the likeliest candidate to derail the global bull market in 2020. Nevertheless, policymakers are adjusting to their constraints. Trump and Xi are negotiating a ceasefire and a disorderly Brexit is off the table. Even Trump’s impeachment shows that the US system of checks and balances remains intact. After all, there is nothing to prevent removal from office if Trump further antagonizes public opinion and the Republican Senate. This means that policy uncertainty will decline on the margin in 2020, even as it remains elevated due to the danger of the underlying events. The nature of US economic imbalances suggests that the policy discontinuity of a Democratic victory on November 3, 2020 would be better for the economy (via household consumption) than it would be for corporate earnings. Policy continuity with the Trump administration suggests the opposite. On a sectoral basis we recommend going long US energy large cap stocks and short info-tech and communications. Energy has limited downside even if a progressive wins whereas tech has limited upside even if Trump wins. The BCA Research House View expects the US dollar to weaken as global growth rebounds, stocks to outperform bonds and cash, and developed market equities to outperform those of the United States. But a Republican victory in November would push against these trends as it is more bullish for the greenback and for US equities relative to global. As a play on the global growth rebound we expect, we recommend going long industrial metals. Like our colleagues at BCA Research Commodity & Energy Strategy, we are initiating this as a tactical trade but it may become strategic. We are reinitiating a tactical long Korea / short Taiwan equity trade. Taiwanese political risk is understated ahead of January’s election and the island is the epicenter of the US-China cold war. We are restoring our long gold trade as a strategic hedge. Populism and de-globalization are potentially inflationary, but they are also linked with great power competition which will increase the frequency of geopolitical crises. In either case, gold is the right safe haven to own. Matt Gertken Vice President Geopolitical Strategist mattg@bcaresearch.com
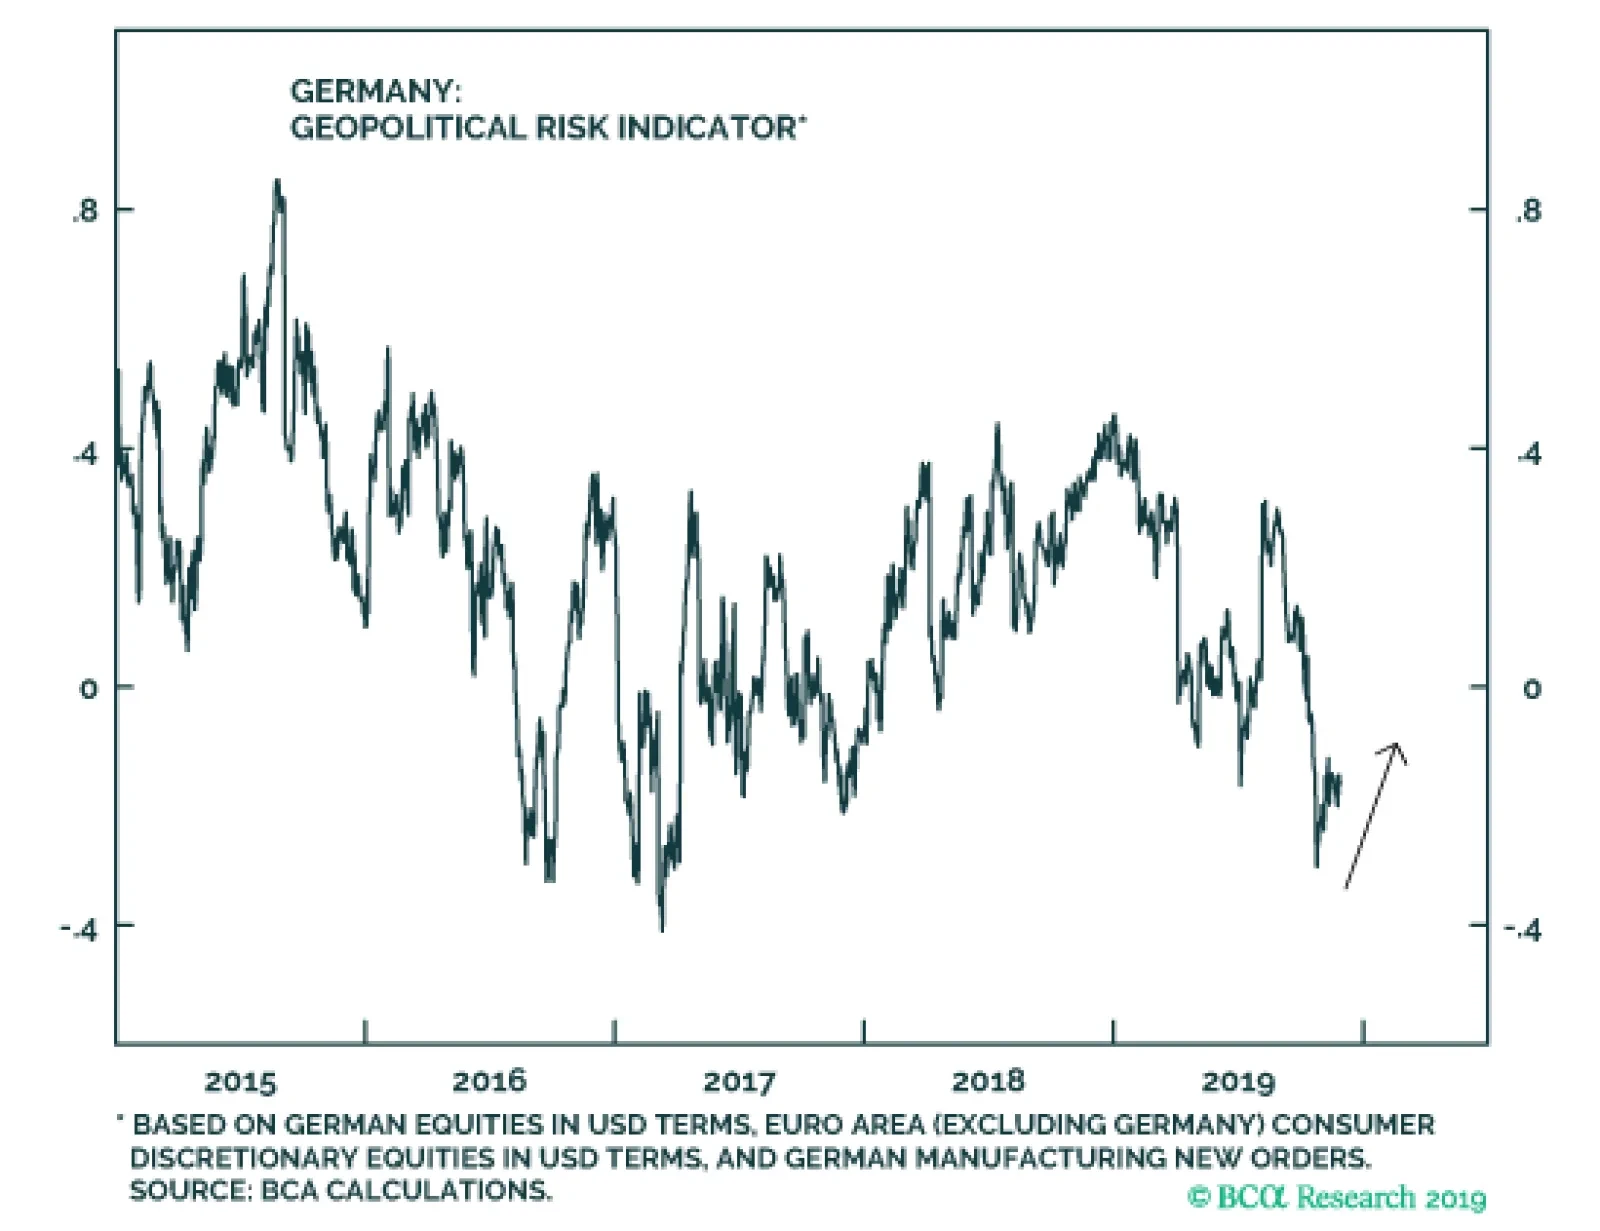
Germany is wading deeper into a period of political risk surrounding Chancellor Angela Merkel’s “lame duck” phase. The federal election of 2021 already looms large. Our indicator is only beginning to price this trend which can last for the next two years. …
Highlights The US-China trade talks will continue despite Hong Kong. The UK election will not reintroduce no-deal Brexit risk – either in the short run or the long run. European political risk is set to rise from low levels, but Euro Area break-up risk will not. There is no single thread uniting emerging market social unrest. We remain constructive on Brazil. Feature Chart 1Taiwan Indicator To Rise Despite Ceasefire
Taiwan Indicator To Rise Despite Ceasefire
Taiwan Indicator To Rise Despite Ceasefire
President Trump signed the Hong Kong Human Rights and Democracy Act into law on November 27. The signing was by now expected – Trump was not going to veto the bill and invite the Senate to override him with a 67-vote at a time when he is being impeached. He does not want to familiarize the Senate with voting against him in supermajorities. The Hong Kong bill will not wreck the US-China trade talks, but it is a clear example of our argument that strategic tensions will persist and cast doubt on the durability of the “phase one trade deal” being negotiated. It is better to think of it as a ceasefire, as Trump’s electoral constraint is the clear motivation. Trump is embattled at home and will contend an election in 11 months. He will not impose the tariff rate hike scheduled for December 15. A relapse into trade war would kill the green shoots in US and global growth, which partly stem from the perception of easing trade risk. Only if Trump’s approval rating collapses, or China stops cooperating, will he become insensitive to his electoral constraint. Will China abandon the talks and leave Trump in the lurch? This is not our base case but it is a major global risk. So far China is reciprocating. Xi Jinping’s political and financial crackdown at home, combined with the trade war abroad, has led to an economic slowdown and an explosion in China’s policy uncertainty relative to America’s. A trade ceasefire – on top of fiscal easing – is a way to improve the economy without engaging in another credit splurge. The US and China will continue moving toward a trade ceasefire, despite the Hong Kong bill. The move toward a trade ceasefire will probably keep our China GeoRisk Indicator from rising sharply over the next few months. However, our Taiwan indicator, which we have used as a trade war proxy at times, may diverge as it starts pricing in the heightened political risk surrounding Taiwan’s presidential election on January 11, 2020 (Chart 1). Sanctions, tech controls, Hong Kong, Taiwan, North Korea, Iran, the South China Sea, and Xinjiang are all strategic tensions that can flare up. Yes, uncertainty will fall and sentiment will improve on a ceasefire, but only up to a point. China’s domestic policy decisions are ultimately more important than its handling of the trade war. At the upcoming Central Economic Work Conference authorities are expected to stay focused on “deepening supply-side structural reform” and avoiding the use of “irrigation-style” stimulus (blowout credit growth). But this does not mean they will not add more stimulus. Since the third quarter, a more broad-based easing of financial controls and industry regulations is apparent, leading our China Investment Strategy to expect a turning point in the Chinese economy in early 2020. This “China view” – on stimulus and trade – is critical to the outlook for the two regions on which we focus for the rest of this report: Europe and emerging markets. Assuming that China stabilizes, these are the regions where risk assets stand to benefit the most. Europe is a political opportunity; the picture in emerging markets is, as always, mixed. United Kingdom: Will Santa Bring A Lump Of Coal? The Brits will hold their first winter election since 1974 on December 12. Prime Minister Boris Johnson’s Conservative Party has seen a tremendous rally in opinion polls, although it has stalled at a level comparable to its peak ahead of the last election in June 2017 (Chart 2). Another hung parliament or weak Tory coalition is possible. Yet the Tories are better positioned this time given that the opposition Labour Party is less popular than two years ago, while the Liberal Democrats are more capable of stealing Labour votes. The Tories stand to lose in Scotland, but the Brexit Party of Nigel Farage is not contesting seats with them and is thus undercutting Labour in certain Brexit-leaning constituencies. Markets would enjoy a brief relief rally on a single-party Tory majority. This would enable Johnson to get his withdrawal deal over the line and take the UK out of the EU in an orderly manner by January 31. The question would then shift to whether Johnson feels overconfident in negotiating the post-Brexit trade agreement with the EU, which is supposed to be done by December 31, 2020. This date will become the new deadline for tariff increases, but it can be extended. Johnson is as unlikely to fly off the cliff edge next year as he was this year, and this year he demurred. Negotiating a trade agreement is easier when the two economies are already integrated, have a clear (yet flexible) deadline, and face exogenous economic risks. Our political risk indicator will rise but it will not revisit the highs of 2018-19 (Chart 3). The pound’s floor is higher than it was prior to September 2019. Chart 2Tories Look To Be Better Positioned For A Single Party Majority
Tories Look To Be Better Positioned For A Single Party Majority
Tories Look To Be Better Positioned For A Single Party Majority
Chart 3UK Risk Will Rise, But Not To Previous Highs
UK Risk Will Rise, But Not To Previous Highs
UK Risk Will Rise, But Not To Previous Highs
Bottom Line: A hung parliament is the only situation where a no-deal Brexit risk reemerges in advance of the new Brexit day of January 31. The market is underestimating this outcome based on our risk indicator. But Johnson himself prefers the deal he negotiated and wishes to avoid the recession that would likely ensue from crashing out of the EU. And a headless parliament can prevent Johnson from forcing a no-deal exit, as investors witnessed this fall. We remain long GBP-JPY. Germany: The Risk Of An Early Election Germany is wading deeper into a period of political risk surrounding Chancellor Angela Merkel’s “lame duck” phase, doubts over her chosen successor, and uncertainty about Germany’s future in the world. The federal election of 2021 already looms large. Our indicator is only beginning to price this trend which can last for the next two years (Chart 4). On October 27 Germany’s main centrist parties suffered a crushing defeat in the state election of Thuringia. For the first time, the Christian Democratic Union (CDU) not only lost its leadership position, but also secured less vote share than both the Left Party and the right-wing Alternative für Deutschland (AfD) (Chart 5, top panel). Chart 4Germany Is Heading Toward A Period Of Greater Political Risk
Germany Is Heading Toward A Period Of Greater Political Risk
Germany Is Heading Toward A Period Of Greater Political Risk
The AfD successfully positioned itself with the right wing of the electorate and managed to capture more undecided voters than any other party (Chart 5, bottom panel). Chart 5The Right-Wing AfD Outperformed In Thuringia …
Global Unrest And A Christmas Election – GeoRisk Update: November 29, 2019
Global Unrest And A Christmas Election – GeoRisk Update: November 29, 2019
While the rise of the AfD (and its outperformance over its national polling) may seem alarming, Germany is not being taken over by Euroskeptics. Both support for the euro and German feeling of being “European” is near all-time highs (Chart 6). The question is how the centrist parties respond. Merkel’s approval rating is at its lower range. Support for Annegret Kramp-Karrenbauer (AKK), Merkel’s chosen successor, is plummeting (Chart 7). Since AKK was confirmed as party chief, the CDU suffered big losses in the European Parliament election and in state elections. Several of her foreign policy initiatives were not well received in the party.1 In October 2019, the CDU youth wing openly rejected her nomination as Merkel’s successor. At the annual CDU party conference on November 22-23, she only narrowly managed to avoid rebellion. She is walking on thin ice and will need to recover her approval ratings if she wants to secure the chancellorship. Meanwhile the CDU will lose its united front, increasing Germany’s policy uncertainty. Chart 6... But Euroskeptics Will Not Take Over Germany
... But Euroskeptics Will Not Take Over Germany
... But Euroskeptics Will Not Take Over Germany
Germany’s other major party – the Social Democratic Party (SPD) – is also going through a leadership struggle. Chart 7The CDU Party Leader Is Walking On Thin Ice
The CDU Party Leader Is Walking On Thin Ice
The CDU Party Leader Is Walking On Thin Ice
Chart 8A Return To The Polls Would Result In A CDU-Green Coalition
Global Unrest And A Christmas Election – GeoRisk Update: November 29, 2019
Global Unrest And A Christmas Election – GeoRisk Update: November 29, 2019
In the first round of the leadership vote, Finance Minister Olaf Scholz and Klara Geywitz (member of the Brandenburg Landtag) secured a small plurality of votes with 22.7%, just 1.6% more than Bundestag member Saskia Esken and Norbert Walter-Borjans (finance minister of North Rhine-Westphalia from 2010-17). The latest polling, and Scholz’s backing by the establishment, implies that he will win but this is uncertain. The results of the second round will be published on November 30, after we go to press. What does the SPD’s leadership contest mean for the CDU-SPD coalition? More likely than not, the status quo will continue. Scholz is an establishment candidate and supports remaining in the ruling coalition until 2021. Esken is calling for the SPD to leave the coalition, but Walter-Borjans has not explicitly supported this. An SPD exit from the Grand Coalition would likely lead to a snap election, not a favorable outcome for stability-loving Germans. A return to the polls would benefit the Greens and AfD at the expense of the mainstream parties, and would likely see a CDU-Green coalition emerge (Chart 8). Given that a majority of voters want the SPD to remain in government (Chart 9), and that new elections would damage the SPD’s prospects, we believe that the SPD is likely to stay in government until 2021, even if the less established Esken and Walter-Borjans win. The risk is the uncertainty around Merkel’s exit. October 2021 is a long time for Merkel to drag the coalition along, so the odds of an early election are probably higher than expected. Chart 9Germans Prefer The SPD Remains In Government
Global Unrest And A Christmas Election – GeoRisk Update: November 29, 2019
Global Unrest And A Christmas Election – GeoRisk Update: November 29, 2019
Chart 10Climate Spending Closest Germany Gets To Fiscal Stimulus (For Now)
Global Unrest And A Christmas Election – GeoRisk Update: November 29, 2019
Global Unrest And A Christmas Election – GeoRisk Update: November 29, 2019
Chart 11There Is Room For More Fiscal Stimulus In Germany, If Needed
There Is Room For More Fiscal Stimulus In Germany, If Needed
There Is Room For More Fiscal Stimulus In Germany, If Needed
What would a Scholz win mean for the great debate over whether Germany will step up its fiscal policy? If the establishment duo wins the SPD leadership, the Grand Coalition remains in place, and the economy does not relapse, we are unlikely to see additional fiscal stimulus in the near future. Scholz argues that additional stimulus would not be productive, as the slowdown is due to external factors (i.e. trade war).2 The recently released Climate Action Program 2030 is the closest to fiscal stimulus that we will see. This package will deliver additional spending worth 9bn euro in 2020 and 54bn euro until 2023 (Chart 10). We are unlikely to see additional fiscal stimulus from Germany in the near future. Bottom Line: Germany is wading into a period of rising political uncertainty. In the event of a downward surprise in growth, there is room to add more fiscal stimulus (Chart 11). But there is no change in fiscal policy in the meantime, e.g. no positive surprise. France: Macron Takes Center Stage While Merkel exits, President Emmanuel Macron continues to position himself as Europe’s leader – with a vision for European integration, reform, and political centrism. But in the near term he will remain tied down with his ambitious domestic agenda. France is trudging down the path of fiscal consolidation. After exiting the Excessive Deficit Procedure in 2018, and decreasing real government expenditures by 0.3% of GDP, France’s budget deficit is forecasted to decline further (Chart 12). Macron’s government is moving towards balancing its budget primarily by reducing government expenditures to finance tax cuts and decrease the deficit. Macron’s reform efforts following the Great National Debate – tax cuts for the middle class, bonus exemptions from income tax and social security contributions, and adjustment of pensions for inflation – have paid off.3 His approval rating is beginning to recover from the lows hit during the Yellow Vest protests (Chart 13). These reforms will be financed by lower government expenditures and reduced debt burden as a result of accommodative monetary policy. Chart 12Fiscal Consolidation In France
Global Unrest And A Christmas Election – GeoRisk Update: November 29, 2019
Global Unrest And A Christmas Election – GeoRisk Update: November 29, 2019
Chart 13Macron's Reform Efforts Have Paid Off
Macron's Reform Efforts Have Paid Off
Macron's Reform Efforts Have Paid Off
Overall, France has proven to a very resilient country in light of a general economic slowdown (Chart 14, top panel). Business investment and foreign direct investment, propped up by gradual cuts in the corporate income tax rate, have remained steady, and confidence remains strong (Chart 14, bottom panels). France is consumer driven and hence somewhat protected from storms in global trade. Chart 14French Economy Resilient Despite Global Slowdown
French Economy Resilient Despite Global Slowdown
French Economy Resilient Despite Global Slowdown
Chart 15Ongoing Strikes Will Register In French Risk Indicator
Ongoing Strikes Will Register In French Risk Indicator
Ongoing Strikes Will Register In French Risk Indicator
Bottom Line: France stands out for remaining generally stable despite pursuing structural reforms. Strikes and opposition to reforms will continue, and will register in our risk indicator (Chart 15), but it is Germany where global trends threaten the growth model and political trends threaten greater uncertainty. On the fiscal front France is consolidating rather than stimulating. Italy: Muddling Through This fall’s budget talks caused very little political trouble, as expected. The new Finance Minister Roberto Gualtieri is an establishment Democratic Party figure and will not seek excessive conflict with Brussels over fiscal policy. Italy’s budget deficit is projected to stay flat over 2019 and 2020. The key development since the mid-year budget revision was the repeal of the Value Added Tax hike scheduled for 2020, a repeal financed primarily by lower interest spending.4 Equity markets have celebrated Italy’s avoidance of political crisis this year with a 5.6% increase. Our own measure of geopolitical risk has dropped off sharply (Chart 16). But of course we expect it to rise next year given that Italy remains the weakest link in the Euro Area over the long run. The left-leaning alliance between the established Democratic Party and the anti-establishment Five Star Movement hurt both parties’ approval ratings. In fact, the only parties that have seen an increase in approval in the last month are the League, the far-right Brothers of Italy, and the new centrist party of former Prime Minister Matteo Renzi, Italia Viva (Chart 17). We expect to see cracks form next year, particularly over immigration, but mutual fear of a new election can motivate cooperation for a time. Chart 16Decline In Italian Risk Will Be Short Lived
Decline In Italian Risk Will Be Short Lived
Decline In Italian Risk Will Be Short Lived
Chart 17The M5S-PD Alliance Damaged Their Approval
The M5S-PD Alliance Damaged Their Approval
The M5S-PD Alliance Damaged Their Approval
Bottom Line: Italy’s new government is running orthodox fiscal policy, which means no boost to growth, but no clashing with Brussels either. Spain: Election Post Mortem Chart 18A Gridlocked Parliament In Spain
Global Unrest And A Christmas Election – GeoRisk Update: November 29, 2019
Global Unrest And A Christmas Election – GeoRisk Update: November 29, 2019
The Spanish election produced another gridlocked parliament, as expected, with no party gaining a majority and no clear coalition options. The Spanish Socialist Workers’ Party (PSOE) emerged as the clear leader but still lost three seats. The People’s Party recovered somewhat from its April 2019 defeat, gaining 23 seats. The biggest loser of the election was Ciudadanos, which lost 47 seats after its highly criticized shift to the right, forcing its leader Alberto Rivera to resign. The party’s seats were largely captured by the far-right Vox party, which won 15.1% of the popular vote and more than doubled its seats (Chart 18). Socialist leader Pedro Sanchez has arranged a preliminary governing agreement with Podemos leader Pablo Iglesias, but it is unstable. Even with Podemos, Sanchez falls far short of the 176 seats he needs to govern. In fact, there are only three possible scenarios in which the Socialists can reach the required 176 seats and none of these scenarios are easy to negotiate (Chart 19). The first – a coalition with the People’s Party – can already be ruled out. The other two require the support of the smaller pro-independence party, which will be difficult for Sanchez to secure, given that he hardened his stance on Catalonia in the days leading up to the election. Chart 19No Simple Way To A Majority Government
Global Unrest And A Christmas Election – GeoRisk Update: November 29, 2019
Global Unrest And A Christmas Election – GeoRisk Update: November 29, 2019
The next step for Sanchez is to be confirmed as prime minister in an “investiture” vote, likely on December 16.5 He would need 176 votes in the first round (or a simple majority in the second round) to gain the confidence of Congress. He looks to fall short (Chart 20).6 If he fails to be confirmed, Sanchez will have another two months to form a government or face the possibility of yet another election. Chart 20Sanchez Set To Fall Short In Investiture Vote
Global Unrest And A Christmas Election – GeoRisk Update: November 29, 2019
Global Unrest And A Christmas Election – GeoRisk Update: November 29, 2019
Spain’s indecision is leading to small conflicts with Brussels. Last week, the European Commission placed Spain under the preventative arm of the Stability and Growth Pact, stating that the country had not done enough to reach its medium-term budget objective.7 The European Commission’s outlook on Spain is slightly more pessimistic than that of the Spanish government (Chart 21). Deficit projections could worsen if a left-wing government takes power that includes the anti-austerity Podemos – which means that Spain is the only candidate for a substantial fiscal policy surprise. Chart 21A Fiscal Policy Surprise In Spain?
Global Unrest And A Christmas Election – GeoRisk Update: November 29, 2019
Global Unrest And A Christmas Election – GeoRisk Update: November 29, 2019
Chart 22Spanish Risk Will Keep Rising
Spanish Risk Will Keep Rising
Spanish Risk Will Keep Rising
We expect our Spanish risk indicator to keep rising (Chart 22). The silver lining is that Spain’s turmoil – like Germany’s – poses no systemic risk to the Euro Area. Spain could also see an increase in fiscal thrust. Stay long Italian government bonds and short Spanish bonos. Bottom Line: We remain tactically long Italian government bonds and short Spanish bonos. Italian bonds will sell off less in a risk-on phase and rally more in a risk-off phase, and relative political trends reinforce this trade. Emerging Markets: Global Unrest Civil unrest is unfolding across the world, grabbing the attention of the global news media (Chart 23). The proximate causes vary – ranging from corruption, inequality, governance, and austerity – but the fear of contagion is gaining ground. Chart 23Pickup In Civil Unrest Raising Fear Of Contagion
Global Unrest And A Christmas Election – GeoRisk Update: November 29, 2019
Global Unrest And A Christmas Election – GeoRisk Update: November 29, 2019
A country’s vulnerability to unrest can be gauged by two main factors: political voice and underlying economic conditions. • Political Voice: The Worldwide Governance Indicators, specifically voice and accountability, corruption, and rule of law, provide proxies for political participation (Chart 24). The aim is to assess whether there is a legitimate channel for discontent to lead to change. Countries with low rankings are especially at risk of experiencing unrest when the economy is unable to deliver. Chart 24Greater Risk Of Unrest Where Political Voice Is Absent
Global Unrest And A Christmas Election – GeoRisk Update: November 29, 2019
Global Unrest And A Christmas Election – GeoRisk Update: November 29, 2019
• Economic Conditions: Last year’s tightening monetary conditions, the manufacturing and trade slowdown, the US-China trade war, and a strong US dollar have weighed on global growth this year. This is challenging, especially for economies struggling to pick up the pace of growth (Chart 25). It translates to increased job insecurity, in some cases where insecurity is already rife (Chart 26). The likelihood that economic deterioration spurs widespread unrest depends on both the level and change in these variables. The former political factor is a structural condition that becomes more relevant when economic conditions deteriorate. Chart 25The Global Slowdown Weighed On Growth In Regions Already Struggling …
Global Unrest And A Christmas Election – GeoRisk Update: November 29, 2019
Global Unrest And A Christmas Election – GeoRisk Update: November 29, 2019
Chart 26… And Raise Job Insecurity
Global Unrest And A Christmas Election – GeoRisk Update: November 29, 2019
Global Unrest And A Christmas Election – GeoRisk Update: November 29, 2019
Chart 27Brazilian Risk Unlikely To Reach Previous Highs
Brazilian Risk Unlikely To Reach Previous Highs
Brazilian Risk Unlikely To Reach Previous Highs
BCA Research is optimistic on global growth as we enter the end game of this business cycle. Nevertheless risks to this view are elevated and emerging market economies are still reeling from the past year’s slowdown. This makes them especially sensitive to failures on the part of policymakers. As a result, policymakers will be more inclined to ease monetary and fiscal policy and less inclined to execute structural reforms. Brazil is a case in point. Our indicator is flagging a sharp rise in political risk (Chart 27). This reflects the recent breakdown in the real – which can go further as the finance ministry has signaled it is willing to depreciate to revive growth. Meanwhile the administration has postponed its proposals to overhaul the country’s public sector, including measures to freeze wages and reduce public sectors jobs. On the political front, President Jair Bolsonaro’s recent break from the Social Liberal Party and launch of a new party, the Alliance for Brazil, threatens to reduce his ability to get things done. This move comes at a time when Brazil’s political landscape is being shaken up by former president Luiz Inacio Lula da Silva’s release from jail, pending an appeal against his corruption conviction. The former leader of the Worker’s Party lost no time in vowing to revive Brazil’s left. Our risk indicator might overshoot due to currency policy, but we doubt that underlying domestic political instability will reach late-2015 and mid-2018 levels. Brazil has emerged from a deep recession, an epic corruption scandal, and an impeachment that led to the removal of former president Dilma Rousseff. It is not likely to see a crisis of similar stature so soon. Bolsonaro’s approval rating is the lowest of Brazil’s recent leaders, save Michel Temer, but it has not yet collapsed (Chart 28). An opinion poll held in October – prior to Lula’s release – indicates that Bolsonaro is favored to win in a scenario in which he goes head to head against Lula (Chart 29). Justice Minister Sergio Moro, who oversaw the corruption investigation, is the only candidate that would gain more votes when pitted against Bolsonaro. He is working with Bolsonaro at present and is an important pillar of the administration. So it is premature to pronounce Bolsonaro’s presidency finished. Chart 28Bolsonaro’s Approval, While Relatively Low, Has Not Collapsed
Global Unrest And A Christmas Election – GeoRisk Update: November 29, 2019
Global Unrest And A Christmas Election – GeoRisk Update: November 29, 2019
Chart 29Bolsonaro Not Yet Finished
Global Unrest And A Christmas Election – GeoRisk Update: November 29, 2019
Global Unrest And A Christmas Election – GeoRisk Update: November 29, 2019
The problem, as illustrated in Charts 25 and 26, is that Brazil still suffers from slow growth and an uninspiring job market – longstanding economic grievances. This will induce the administration to take a precautionary stance and slow the reform process. The result should be reflationary in the short run but negative for Brazil’s sustainability over the long run. There is still a positive path forward. Unlike the recently passed pension cuts and the public sector cuts that were just postponed – both of which zap entitlements from Brazilians – the other items on the reform agenda are less controversial. Privatization and tax reform are less politically onerous and will keep the government and economy on a positive trajectory. Meanwhile the pension cuts are unlikely to be a source of discontent as they will be phased in over 12-14 years. Thus, while the recent political events justify a higher level of risk, speculation regarding the likelihood of mass unrest in Brazil – apart from the mobilization of Worker’s Party supporters ahead of the municipal elections next fall – is overdone. Bottom Line: The growth environment in emerging markets is set to improve in 2020. US-China trade risk is falling and China will do at least enough stimulus to be stable. Moreover emerging markets will use monetary and fiscal tools to mitigate social unrest. This will not prevent unrest from continuing to flare. But not every country that has unrest is globally significant. Brazil is a major market that has recently emerged from extreme political turmoil, so a relapse is not our base case. Otherwise one should monitor Hong Kong’s impact on the trade deal, Russia’s internal stability, and the danger that Iranian and Iraqi unrest could cause oil supply disruptions. In the event that the global growth rebound does not materialize we expect Mexico and Thailand – which have better fundamentals – to outperform. Our long Thai equity relative trade is a strategic defensive trade. Matt Gertken Vice President Geopolitical Strategist mattg@bcaresearch.com Ekaterina Shtrevensky Research Analyst ekaterinas@bcaresearch.com Roukaya Ibrahim Editor/Strategist Geopolitical Strategy RoukayaI@bcaresearch.com Footnotes 1 Please see “Merkel’s Successor Splits German Coalition With Rogue Syria Plan,” dated October 22, 2019 and “Merkel's Own Party Wants Outright Huawei Ban From 5G Networks,” dated November 15, 2019, available at bloomberg.com. 2 Please see “Scholz Says No Need for German Stimulus After Dodging Recession,” dated November 14, 2019, available at bloomberg.com. 3 Please see “France: Draft Budgetary Plan For 2020,” dated October 15, 2019, available at ec.europa.eu. 4 Please see “Analysis of the Draft Budgetary Plan of Italy,” dated November 20, 2019, available at ec.europa.eu. 5 Please see “Investiture calendar | Can a government be formed before Christmas?” dated November 14, 2019, available at elpais.com. 6 If Sanchez convinces PNV, BNG, and Teruel Exists to vote in his favor for both rounds of the vote, he would need ERC and Eh Bildu to abstain in order to win. However, given that the PSOE has stated that it will not even negotiate with Eh Bildu, it is likely that this party will vote against Sanchez, giving the opposition 168 votes. In this case, Sanchez would not only need PNV, BNG, and Teruel in his favor, but also the support of either CC or ERC, both unlikely scenarios. 7 Please see “Commission Opinion on the Draft Budgetary Plan of Spain,” dated November 20, 2019, available at ec.europa.eu. Appendix Germany: GeoRisk Indicator
Germany: GeoRisk Indicator
Germany: GeoRisk Indicator
France: GeoRisk Indicator
France: GeoRisk Indicator
France: GeoRisk Indicator
Italy: GeoRisk Indicator
Italy: GeoRisk Indicator
Italy: GeoRisk Indicator
Spain: GeoRisk Indicator
Spain: GeoRisk Indicator
Spain: GeoRisk Indicator
UK: GeoRisk Indicator
UK: GeoRisk Indicator
UK: GeoRisk Indicator
Canada: GeoRisk Indicator
Canada: GeoRisk Indicator
Canada: GeoRisk Indicator
China: GeoRisk Indicator
China: GeoRisk Indicator
China: GeoRisk Indicator
Taiwan: GeoRisk Indicator
Taiwan: GeoRisk Indicator
Taiwan: GeoRisk Indicator
Korea: GeoRisk Indicator
Korea: GeoRisk Indicator
Korea: GeoRisk Indicator
Russia: GeoRisk Indicator
Russia: GeoRisk Indicator
Russia: GeoRisk Indicator
Brazil: GeoRisk Indicator
Brazil: GeoRisk Indicator
Brazil: GeoRisk Indicator
Turkey: GeoRisk Indicator
Turkey: GeoRisk Indicator
Turkey: GeoRisk Indicator
What's On The Geopolitical Radar?
Global Unrest And A Christmas Election – GeoRisk Update: November 29, 2019
Global Unrest And A Christmas Election – GeoRisk Update: November 29, 2019
Section III: Geopolitical Calendar
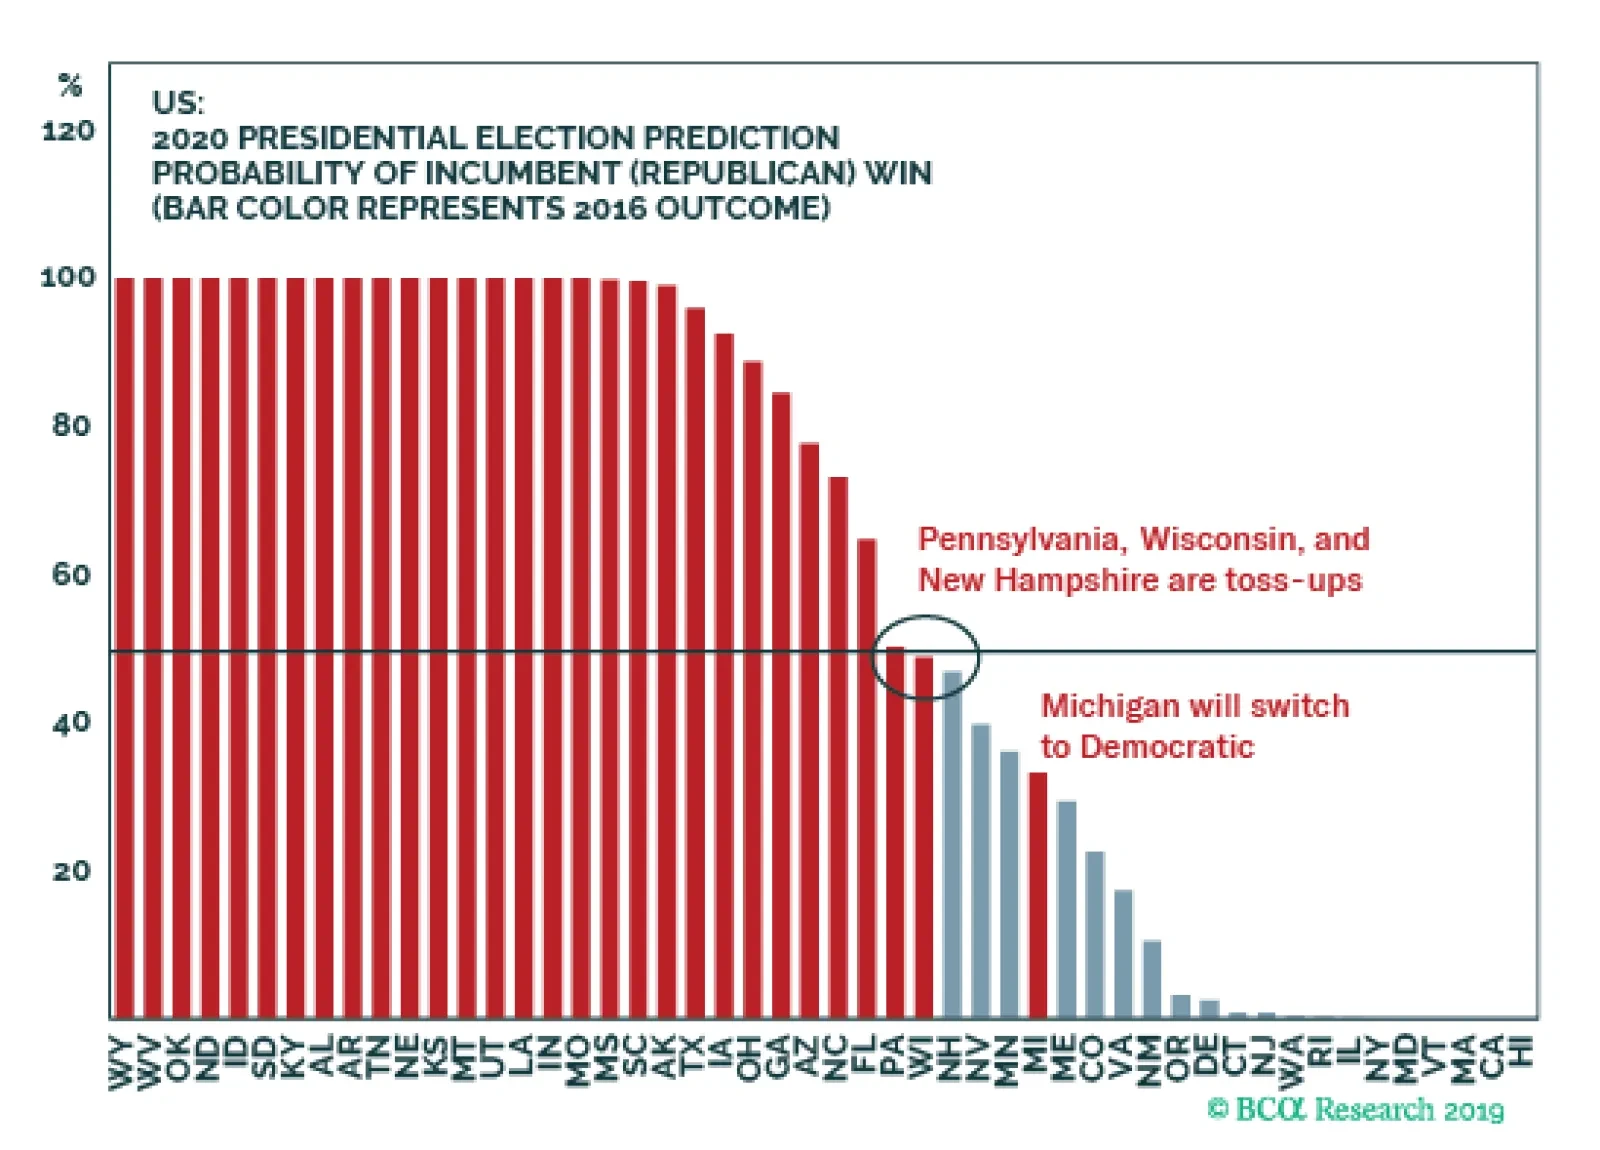
The BCA Geopolitical Strategy Presidential Election Model is a state-by-state model that uses political and economic variables to predict the Electoral College vote. The model would have predicted the past five elections correctly on an out-of-sample basis,…
Mr. X and his daughter, Ms. X, are long-time BCA clients who visit our office toward the end of each year to discuss the economic and financial market outlook for the year ahead. This report is an edited transcript of our recent conversation. Mr. X: I have been eagerly looking forward to this meeting given my many concerns about the outlook. Our portfolio has done well in the past year thanks to the surge in bond prices and the outperformance of defensive equities. However, I am deeply troubled by the amount of monetary stimulus required to support risk assets, and by how expensive bonds and equities are. Moreover, the global economy remains engulfed in deflationary risks, and policymakers are running out of ammunition. As always, there is much to talk about. Ms. X: Let me add that I am also pleased to once again be here to discuss the major risks and opportunities in the global marketplace. A year ago, I held a more positive market view than my father. Directly after our meeting, the deep market correction gave me second thoughts, but ultimately, the rebound in stock prices vindicated my view. Clearly, your assertion that markets would be turbulent proved correct. Since I joined the family firm in early 2017, I have been pushing my father to keep a higher equity exposure than he was normally comfortable with. We agreed to still favor stocks last year, albeit, with a bias toward defensive sectors, and this strategy paid off. But after the past year’s powerful rally in both bonds and stocks, we are again left wondering how to position our portfolio. Ultimately, I do not believe a recession is imminent. Yes, stocks are expensive, but bonds are even more so. Since I expect economic growth to pick up, I am inclined to tilt the portfolio further into equities and move away from our preference for defensive sectors. As usual, I am very interested to hear your views. BCA: Our core theme for 2019 was that we would face classic late-cycle turbulence. Despite this volatility, a run-up in asset prices was likely. Soon after we met, the stock market plunged, hitting a low on December 26, 2018. We anticipated the Federal Reserve to be much more hawkish than what actually transpired. Wage growth and even core inflation have remained firm in the US, but the weakness in global inflation expectations drove central banks’ reaction functions more powerfully than we anticipated. Moreover, the rapid escalation of the Sino-US trade war added a layer of uncertainty that exacerbated the economic slowdown that had started in mid-2018, forcing global central banks to ease policy as an indemnity against recession. Looking ahead, central bankers are highly unlikely to tighten monetary policy as long as inflation expectations remain below their normal range consistent with a 2% inflation target. We agree that the odds of a US recession in the coming year are still low because financial conditions are set to remain accommodative, Chinese authorities are setting policy to shore up growth, and a trade truce is likely. Global economic activity will rebound in early 2020. Instead, the most probable timeframe for a broad based recession is late 2021/early 2022. As a result, we remain positive on risk assets, especially foreign stocks. We are also underweighting bonds as they offer extremely poor absolute and relative value. Mr. X: I can see we will have a lively discussion because I do not share your or my daughter’s optimism. My list of concerns is long, I hope we have time to get through them all. But first, let’s briefly review your predictions from last year. BCA: This exercise is always interesting and often humbling, too. A year ago, our key conclusions were that: Tensions between policy and markets would be an ongoing theme in 2019. With the US unemployment rate at a 48-year low, it would take a significant slowdown for the Fed to stop hiking rates. Ultimately, the Fed would deliver more hikes in 2019 than discounted in the markets. This would push up the dollar and keep the upward trend in Treasury yields intact. The dollar would peak in mid-2019. China would also become more aggressive in stimulating its economy, which would boost global growth. However, until both of these things happened, emerging markets would remain under pressure. We favored developed market equities over their EM peers. We also preferred defensive equity sectors such as healthcare and consumer staples over cyclical sectors such as industrials and materials. Within the developed market universe, the US would outperform Europe and Japan over the next few quarters, especially in dollar terms. Stabilization in global growth would ignite a blow off rally in global equities. If the Fed was raising rates in response to falling unemployment, it would be unlikely to derail the stock market. However, once supply-side constraints began to bite fully in early 2020 and inflation began to rise well above the Fed’s target of 2%, stocks would begin to buckle. This would mean that a window would exist in 2019 for stocks to outperform bonds. We would maintain a benchmark allocation to stocks, but increase exposure if global bourses were to fall significantly from then (late 2018) current levels without a corresponding deterioration in the economic outlook. Corporate credit would underperform stocks as government bond yields rise. A major increase in credit spreads was unlikely as long as the economy remained in expansion mode, but spreads could still widen modestly. US shale companies had been the marginal producers in the global oil sector. With breakeven costs in shale close to $50/bbl, crude prices would be unlikely to rise much from current levels over the long term. However, we expected production cuts in Saudi Arabia would push prices up, with Brent crude averaging around $82/bbl in 2019. A balanced portfolio was likely to generate average returns of only 2.8% a year in real terms over the next decade. This compares to average returns of around 6.6% a year between 1982 and 2018. As already noted, our forecast for more Fed rate hikes was wrong. This meant that we were offside in our duration call. Ultimately, 10-year Treasuries have generated returns of 10.8% so far this year, and German bunds and Japanese government bonds returns of 5.8% and 1.0% in EUR and JPY terms, or 2.5% and 2.0% in USD terms, respectively (Table 1). Nonetheless, our expectation of a run-up in risk asset prices was spot on. Equities outperformed bonds, with global stocks climbing 22.2% in USD terms. We missed the initial outperformance of corporate bonds relative to Treasuries, as investment grade credit rose by 13.9%. However, our bond team took a more constructive stance on corporates as the year progressed. Table 1Market Performance
OUTLOOK 2020: Heading Into The End Game
OUTLOOK 2020: Heading Into The End Game
Chart 12019 Was A Good Year For Stocks
2019 Was A Good Year For Stocks
2019 Was A Good Year For Stocks
In terms of regional allocation recommendations, we were correct to overweight US equities which beat non-US stocks by 13.4%, partly thanks to the dollar’s appreciation. We were also right to underweight EM equities, with Asia and Latin America generating dollar returns of only 12.6% and 6.9%. Overall, it was a good year for financial markets (Chart 1). Our growth forecasts were mixed. We predicted global growth would slow in the first half of 2019 but improve thereafter. Instead, the slowdown extended and intensified into the second half of the year as the Sino-US trade war escalated more than expected, and Chinese policymakers were more reluctant to reflate than anticipated. The IMF also revised down its growth forecasts. In the October 2019 World Economic Outlook report, growth in advanced economies for the year was cut to 1.7% from 2.1% compared to 2018 forecasts, led by a downward revision to 1.5% from 2% in Europe (Table 2). They also pared down 2019 EM growth estimates to 3.9% from 4.7%. Consequently, inflation was softer than originally predicted. These trends in economic activity meant that our dollar call was partially right. The currency did not peak in the middle of the year as we foresaw, but has been flat since the spring and today trades where it was in April. Meanwhile, the weaker-than-expected growth put our oil call offside, with Brent averaging $62/bbl this year, not $82/bbl. Table 2IMF Economic Forecasts
OUTLOOK 2020: Heading Into The End Game
OUTLOOK 2020: Heading Into The End Game
The Cycle’s End Game Mr. X: You mentioned that you remain positive on risk assets and stocks for 2020. You will not be surprised that I am extremely skeptical of this view. The Fed could only raise rates to 2.5% before all hell broke loose, and it has now cut them back to 1.75%. The European Central Bank has lowered its deposit rate to -0.5% and is resuming its asset purchase program, while the Bank of Japan is clearly out of ammunition. Yet global growth remains weak. Despite this lack of economic traction, US stocks are at a record high and are unequivocally expensive. This situation seems untenable. If global growth weakens further, there is little more policymakers can do. I think the risk of a recession is a lot more elevated than you believe, especially as we cannot count on a lasting trade détente. Meanwhile, the US presidential election makes me uncomfortable, and I cannot see how business leaders will want to deploy capital to expand capacity given the risk that the regulatory and tax environment could become hostile to the corporate sector. If I’m wrong about growth – and I hope I am – then inflationary pressures will build and central banks will have to tighten policy suddenly. As bond yields rise, stocks will be sold and yet bonds will not offer any protection since they yield so little. Also, I have not even talked about negative interest rates. $12.1 trillion of debt yields less than zero percent. This is obviously preventing creative destruction from purging the system of rot. It is also promoting capital misallocation and undue risk-taking by financial institutions who cannot meet fiduciary liabilities. Ms. X: Based on this tirade, you can easily imagine what life at the office has been like in recent months. I do share some of my father’s concerns. Negative rates cannot be a good thing, especially from a long-term perspective. If growth weakens further, I’m also concerned that central banks have few options left. However, I do not see these risks as imminent. There are nascent signs that the global economy will stabilize soon; both President Trump and President Xi have strong incentives to reach a trade truce; and central banks are nowhere near removing the proverbial punch bowl. While US stocks are expensive, other risk assets offer value if global growth rebounds. The wall of worry is high, but stocks can and will climb that wall. BCA: Your debate is similar to our own internal discussions. It is undeniable that the investing landscape looks shaky at the moment, especially with the S&P 500 currently trading at 18-times forward earnings. However, the situation you are describing is a direct consequence of one BCA’s long running macro themes: The end of the debt supercycle. While the debt supercycle is dead in advanced economies, it remains very much alive in emerging markets, and China in particular. The private debt load in advanced economies has declined by 20% of GDP since 2009 (Chart 2A). Despite the burgeoning US federal government deficit, public debt accumulation has not been strong enough to cause total debt loads to increase. Instead, aggregate indebtedness has been stuck slightly above 260% of GDP for the past 10 years. Depressed, and in some cases, negative interest rates reflect weak demand for credit. Chart 2AThe Debt Supercycle Is Dead In DM...
The Debt Supercycle Is Dead In DM...
The Debt Supercycle Is Dead In DM...
Chart 2B...But Not In EM
...But Not In EM
...But Not In EM
The end of the debt supercycle has both a negative and positive impact. Without increasing leverage, domestic demand cannot grow faster than trend GDP. Thus, it takes much more time for inflationary pressures to build. Concurrently, in the absence of inflationary pressure, more time passes before monetary policy reaches a restrictive level causing recession. The upshot is that the business cycle can last much longer. Moreover, a world less geared to credit accumulation reduces the fragility of the financial system, at the margin. While the debt supercycle is dead in advanced economies, it remains very much alive in emerging markets, and China in particular (Chart 2B), where the demand for credit is still very sensitive to changes in monetary settings. EM countries are the major source of volatility in the global business cycle. Chinese policymakers’ management of the tradeoff between growth and leverage will determine whether the global economy can avoid deflation. If they decide to tackle debt excesses head on, EM credit growth will contract and EM final demand will suffer. In this scenario, negative rates will persist in low-growth advanced economies, and the Fed will be incapable of raising rates because global deflationary forces will be too strong. Chart 3The World Is In The Midst Of A Deflationary Episode
The World Is Experiencing A Deflationary Episode...
The World Is Experiencing A Deflationary Episode...
The second half of 2018 and the whole of 2019 gave us a taste of these forces. When China tightened credit conditions, the EM economies slowed first. Trade and manufacturing hubs like Europe, Australia and Japan quickly followed. A deflationary wave spread around the world, as evidenced by a drop in global producer prices (Chart 3). The US is a comparatively closed economy, but it could not avoid this gravitational pull. The ISM manufacturing survey ultimately started to contract in August 2018, converging to weakness in the rest of the world. The trade war’s hit to business confidence added insult to the injury of an already weak economic environment. Looking ahead, our optimism reflects an expectation that Chinese policymakers will adopt a more pro-growth policy stance because they too are spooked by the downtrend in their economy. While the Politburo Standing Committee has not abandoned its structural reform agenda, it realizes that aggressive deleveraging is dangerous. The Chinese economy is growing at its weakest pace in nearly 30 years and deflation is once again taking hold. In response to date, policymakers have lowered China’s reserve requirement ratio by 400 basis points, cut taxes by 2.8% of GDP, increased the issuance of local government bonds to finance public infrastructure projects, and boosted capex at state-owned enterprises. EM economies will respond to these stimulative measures. The Chinese credit and fiscal impulse has stabilized (Chart 4). Meanwhile, the Fed has pushed the real fed funds rate 74.4 basis points below the Holston-Laubach-Williams estimate of the neutral rate, and coordinated global policy easing points to a rebound in the global manufacturing sector (Chart 4, bottom panel). Moreover, the global inventory purge that magnified the industrial sector’s pain is getting exhausted and the auto sector is looking up. Finally, we agree with Ms. X that both President Trump and President Xi have their own incentives to deescalate trade policy uncertainty. We are entering the end game of this business cycle and bull market. Global borrowing rates will rise, but only to a limited extent. Rightly or wrongly, major central banks are terrified by the prospect of the Japanification of their economies. Practically speaking, this means that they want inflation expectations to move back up to normal levels (Chart 5). However, after undershooting their 2% targets for 11 years, achieving this objective will require central banks to let realized inflation overshoot these targets first. Thus, central banks are unlikely to tighten policy until late next year at the earliest, which will limit how far yields can climb in 2020. Chart 4…But Do Not Bet Against Reflation
...But Do Not Bet Against Reflation
...But Do Not Bet Against Reflation
Chart 5Depressed Inflation Expectations
Depressed Inflation Expectations
Depressed Inflation Expectations
Equities and other risk assets should perform well if global growth re-accelerates but interest rates don’t rise much at first. Some benefit of this fertile backdrop is already priced in, but many pockets of value levered to stronger global growth still exist. We are entering the end game of this already long business cycle. While the general environment favors remaining invested in risk assets in 2020, this is likely the last window of opportunity to do so. Today’s accommodative monetary policy will revive inflationary pressures in 2021, and central banks will ultimately be forced to lift rates much more aggressively. China will continue to resist excessive leverage. Neither the business cycle nor the equity bull market will withstand these final assaults. Mr. X: Your benign outlook reminds me of when we met in December 2007. Do you remember? You told me that the housing slowdown and the credit market seizure were large risks, but central banks would put a floor under global growth. How did that turn out? I agree that in advanced economies, overall debt loads have been stable. But this belies major disparities. For example, US corporate debt has never represented a larger share of GDP than it does today. This must be a major vulnerability. While household balance sheets look healthy, I do not think consumption will save the day if companies are cutting capex and employment while they clean up their balance sheets. Countries like Canada and Australia are drowning in private sector debt. How can you ignore these vulnerabilities? BCA: A comparison with 2008 actually reveals why advanced economies, particularly the US, are not the powder keg that they once were. US corporate debt is elevated when compared to GDP, but profits also represent a much larger share of GDP than they did 10 or 20 years ago, and interest rates are close to historic lows. As a result, interest coverage ratios are still adequate (Chart 6). In 2007, household debt loads were large, but interest payments also accounted for 18.1% of disposable income, the highest proportion since 1972. Additionally, US firms’ debt-to-asset ratio is in line with the post-1970 average of 22.1%. Finally, US businesses have not used rising leverage to fund capital spending, as demonstrated by the elevated age of the capital stock. Thus, the US corporate sector continues to generate positive net savings. Ahead of recessions, US businesses typically generate negative net savings. The composition of the creditors is another important difference. In 2007, an extremely large share of the spurious borrowings resided on banks’ balance sheets. Moreover, the banking system was woefully undercapitalized with a leverage ratio of 17x. Weak banks had to absorb 2.2 trillion of losses after 2008. Consequently, the money creation mechanism broke down, and money multipliers collapsed (Chart 7). Today, US banks boast relatively stronger balance sheets, and they are still judicious about extending credit despite being less exposed to the corporate sector than they were to the mortgage market in 2008. Instead, most corporate debt is held by less levered entities such as ETFs, pension plans, and insurance companies. The leveraged losses that proved so debilitating in 2008 are less likely to be a source of systemic risk in this cycle. Chart 6US Businesses Can Still Service Their Debt
US Businesses Can Still Service Their Debt
US Businesses Can Still Service Their Debt
Chart 72008 Heralded A Destruction Of Money
2008 Heralded A Destruction Of Money
2008 Heralded A Destruction Of Money
Countries like Australia and Canada have much more worrisome private sector debt dynamics, as their servicing costs are elevated (Chart 8). However, these economies are unlikely to collapse when global rates are low, as long as the global economy can avoid a recession, which would reduce export revenue in these trade-sensitive countries. You expect a moderate rebound in global growth next year, but not a sharp acceleration because Chinese stimulus will not be that aggressive. The bottom line is that both the US corporate sector and at-risk countries like Canada should avoid a day of reckoning until interest rates rise meaningfully. As we have already mentioned, central banks are very clear that they will allow inflation to overshoot before tightening policy anew. We monitor US inflation breakeven rates to gauge the likely timing of that outcome. At 1.6%, they remain well below the 2.3% to 2.5% range, which is historically consistent with central banks durably achieving their inflation target (Chart 9). Until inflation expectations are re-anchored back up in that range, we will not worry about an imminent tightening in monetary conditions. Chart 8Canada And Australia Are Close To Their Debt Walls
Canada And Australia Are Close To Their Debt Walls
Canada And Australia Are Close To Their Debt Walls
Chart 9The Fed Is In No Rush To Tighten
The Fed Is In No Rush To Tighten
The Fed Is In No Rush To Tighten
Chart 10Inflation Is A Lagging Indicator
OUTLOOK 2020: Heading Into The End Game
OUTLOOK 2020: Heading Into The End Game
It is true that inflationary pressures are building in the US. Historical evidence points to a kink in the Phillips curve, the link between wage growth and the unemployment rate. Since the labor market is tight, we are already seeing average hourly earnings growth accelerate. Moreover, the output gap is mostly closed. However, keep in mind that inflation is also a lagging economic indicator (Chart 10). Consequently, the recent global economic slowdown is likely to keep US inflation at bay for most of 2020. The sharp fall in US capacity utilization along with the decline in imported goods and core producer price inflation corroborate this picture. Mr. X: So you believe that as long as rates stay low, the day of reckoning will be delayed. But ultimately, that it is unavoidable. BCA: Correct. No matter what, we are entering the end game of this already long business cycle. The current period of easy policy will allow cyclical spending to rise as a share of output, and debt to build up again over the coming 18 months. Because slack is clearly limited, this latest wave of policy easing will generate inflationary pressures. Ultimately, the Fed will be forced to play catch up and tighten more aggressively than expected in 2021. Paradoxically, the longer the onset of recession is delayed, the deeper it is likely to be… Mr. X: Because imbalances and vulnerabilities will only grow larger! BCA: Absolutely! Mr. X: That is something we can agree on. Ms. X: The way you complete one another’s sentences is a testament to how many years you have been talking to each other. For me, the most concerning issue is political risk. While I am more positive on the outlook for trade policy than my father, I do worry about the impact of US election risk on capital spending. Chart 11If The 2012 Election Is Any Guide, Trump Can Still Win A Second Term
OUTLOOK 2020: Heading Into The End Game
OUTLOOK 2020: Heading Into The End Game
BCA: On the trade war, we would like to address your father’s concerns. All politicians, even unconventional ones like President Trump, seek re-election. Yet, President Trump’s overall approval rating is low (Chart 11). If the election were held today, his odds of winning would be minimal. However, US presidential elections do ultimately favor the incumbent. If the re-election of President Obama in 2012 is any guide, President Trump has enough time to boost his approval rating over the coming 12 months to secure a second term through the Electoral College. In order to achieve this outcome, he must reverse the large slowdown in wage growth currently plaguing the swing states he won by only a small margin in 2016 (Chart 12). Workers in states like Michigan, Pennsylvania and Wisconsin are suffering disproportionately from the uncertainty created by the trade tensions. President Trump will have to pause the tariffs – and even cut tariff rates – to support the economy and reassure voters. Chart 12Trump's Fear Is Coming True
Trump's Fear Is Coming True
Trump's Fear Is Coming True
China is willing to accept a trade truce. The Chinese economy is weak and producer prices are once again deflating. President Xi doesn’t want to preside over another massive surge in leverage or a 1930’s Irving Fisher-style deflationary spiral. Reviving private sector investment sentiment via a reduction in trade policy uncertainty would help stabilize spending and avoid a disorderly economic slump. Moreover, President Xi may not trust the current White House, but the prospect of a Democratic administration that will be tough on both environmental standards and human rights would offer little solace. This brings us to the US election. The recent Bank of America Merrill Lynch positioning survey shows that the investment community shares your concerns. This risk is hard to quantify. The Democratic nomination is wide open. Former Vice President Joe Biden leads the opinion polls, and is a known quantity. Meanwhile, the rising progressive wing of the party, embodied in Senator Elizabeth Warren, is hostile to business and likely to cause concerns in boardrooms across the US, especially in the tech, energy, financial services and healthcare sectors. This could dampen animal spirits. Biden’s and Warren’s odds of beating President Trump are overstated by current polls, especially if the President softens his stance on trade to allow for a growth pick-up. Moreover, to be competitive nationally, Senator Warren will have to abandon some of her more progressive plans and pivot toward the center. The recent upbeat equity market performance of sectors like managed healthcare suggests that markets are discounting this shift. Thus, we doubt the election is currently really weighing on business intentions. The recent pick up in capital spending intentions in various Fed Manufacturing surveys fades this risk. Chart 13A Structural Tailwind Has Vanished
A Structural Tailwind Has Vanished
A Structural Tailwind Has Vanished
What is clear though is that if the economy were to weaken further, Senator Warren’s chances would improve and CEOs would genuinely begin to worry about re-regulation, potentially unleashing a vicious cycle. Thus, the end game is an unstable equilibrium. On a structural basis, whether one looks at the rise of populism or the geopolitical rivalry between China and the US, trade tensions will remain a pesky feature of the global economy. In effect, the trade truce will not be a permanent deal. The global economy has therefore lost the tailwind of deepening global integration achieved through trade (Chart 13). This will limit global potential GDP growth. Ms. X: Thank you. I think the time is right to explore your economic outlook in more detail. The Economic Outlook Chart 14China: Modest Reflation Is Underway
China: Modest Reflation Is Underway
China: Modest Reflation Is Underway
Mr. X: From your arguments, it seems that the outlook for China and Emerging Markets is critical, so let’s start there. My impression is that President Xi is not abandoning his structural reform agenda. Avoiding the middle-income trap will require decreasing China’s dependence on credit as a growth driver. Can economic activity really stabilize under those circumstances? BCA: You are correct: Senior Chinese administrators are reluctant to allow another major phase of debt accumulation to take hold. However, as we already highlighted, policymakers are taking steps to end the most severe economic slowdown since the first half of the 1990s. China is currently implementing a middling stimulus program. The positive impact of the lower bank reserve requirement ratio, the tax cuts and increased public infrastructure spending is being mitigated by strong regulatory constraints on the shadow banking system and small financial institutions, by efforts to limit real estate speculation, and by the cash crunch facing real estate developers. These crosscurrents make it unlikely that the credit impulse will rise as sharply as it did following the reflationary campaigns of 2009, 2012 or 2016. Nonetheless, the Chinese economy is indeed exhibiting some mildly positive signals. Our monetary indicator and state-owned enterprise capital spending point to a rebound in overall Chinese economic activity (Chart 14). Moreover, household spending is trying to bottom. If China stabilizes, then the EM slowdown will end soon. Without a deepening drag from the Chinese economy, EM countries should be able to take advantage of the easing in global financial and liquidity conditions. But the end of the Chinese drag on EM growth does not mean a massive tailwind will be forthcoming. Additionally, deflationary forces remain stronger in the emerging world than in the US. As a result, EM real rates will remain stubbornly above the level that real economic activity warrants, posing a headwind for capital and durable goods spending. Generally speaking, EM and China are moving from a headwind for the world to a mild tailwind. Treasury yields are unlikely to move significantly higher than the 2.25% to 2.5% zone. Ms. X: I’m somewhat more positive than you on global growth next year. The policy easing around the world looks very promising for economic activity. How do you factor the impact of improving global liquidity conditions into your outlook for 2020? BCA: It is undeniable that global liquidity conditions have eased massively. As we already highlighted, the majority of global central banks cutting rates is a very positive dynamic for global growth. Trends in measures of liquidity ratify this message. Foreign exchange reserves are again growing and our BCA US Financial Liquidity index has rallied sharply over the past 12 months. Historically, this indicator forecasts the trend in the BCA Global Leading Economic Indicator, commodity prices and EM export prices by 18 months (Chart 15). Moreover, money aggregates are growing faster than credit across the major advanced economies. Such developments typically foretell an acceleration in global economic activity (Chart 16). Chart 15Liquidity Dynamics: Fueling A Global Growth Recovery
Liquidity Dynamics: Fueling A Global Growth Recovery
Liquidity Dynamics: Fueling A Global Growth Recovery
Chart 16Rising Money Supply Is A Good Thing
Rising Money Supply Is A Good Thing
Rising Money Supply Is A Good Thing
The duration of the current slowdown also warrants optimism. We have often highlighted that since the early 1990s, the global manufacturing sector evolves over 36-month symmetric cycles (Chart 17). The current soft patch has lasted more than 18 months. In the context of easing liquidity and depleted inventories, pent-up demand can easily translate into actual spending. The recent surge in the new orders-to-inventories ratio confirms that global manufacturing activity should soon pick up (Chart 18). The auto sector’s weakness, which was exacerbated by previous inventory buildups, changing emission standards, and rising borrowing costs, is also ebbing. Chart 17The Mid-Cycle Slowdown Is Long In The Tooth
The Mid-Cycle Slowdown Is Long In The Tooth
The Mid-Cycle Slowdown Is Long In The Tooth
Chart 18The New Order-To-Inventory Ratio Points To A Global Rebound
The New Orders-To-Inventories Ratio Points To A Global Rebound
The New Orders-To-Inventories Ratio Points To A Global Rebound
Various growth indicators are sniffing out this positive inflection point. The recent trough in the global ZEW survey is revealing (Chart 19). It materialized quickly after Sino-US trade tensions began to ease. Enough positive global economic momentum exists such that a minor decline in policy uncertainty could unleash a large improvement in growth expectations. The rebound in Taiwanese equities and European luxury stocks confirms that the global economy should soon bottom. There are two things we cannot emphasis enough. First, this is the end game of the business cycle, after which a recession will ensue. Second, investors should not expect the kind of strong synchronized growth rebound witnessed in 2017. Without a Chinese and EM boom, a crucial source of demand will be wanting. Mr. X: What about US growth? The yield curve inverted this summer and deteriorating consumer and business confidence raised the specter of an imminent recession. Moreover, the fiscal stimulus that helped the economy in the first half of 2019 is now over. In fact, with a $1 trillion federal deficit despite an unemployment rate of only 3.6%, we have run out of fiscal room to support activity if and when a recession materializes. BCA: The recent yield curve inversion most likely overstated the risk of an economic contraction. First, in the mid-1990s, if the term premium had been as low as it is today, the curve would have also inverted without any recession materializing from 1995 to 2000. Second, this summer, the curve inverted up to the 5-year tenor and steepened for longer maturities. Prior to recessions, the curve inverts across all maturities. Recessions are not born out of thin air. They are caused by imbalances and tight monetary policy. The large debt buildup and other investment imbalances that have preceded prior US recessions are not yet apparent. Prior to the 1991, 2001 and 2008 recessions, the private sector debt load had increased by 20.6%, 14.6% and 25.6% of GDP in the previous five years, not the current 1.4% run rate. The Fed’s policy is now clearly accommodative. Not only is the real fed funds rate 74.4 basis points below the Fed’s favored estimate of the neutral rate of interest, but also real estate, the most interest-rate sensitive economic sector, is rebounding. In 2018, real estate activity collapsed in response to mortgage rates rising to 4.9%. Today, the NAHB Homebuilding index has retraced 79% of its losses; mortgage demand has improved; and housing starts and building permits have recovered (Chart 20). When policy is tight, real estate activity never recovers this quickly, even as yields fall. Chart 19Positive Signals For Global Growth
Positive Signals For Global Growth
Positive Signals For Global Growth
Chart 20The Housing Market Signals That Policy Is Accommodative
The Housing Market Signals That Policy Is Accommodative
The Housing Market Signals That Policy Is Accommodative
Chart 21Robust Household Financial Health
OUTLOOK 2020: Heading Into The End Game
OUTLOOK 2020: Heading Into The End Game
A counterargument is that real estate price appreciation is weak. However, tight monetary policy is not the cause. Two forces are dampening house prices. First, the Jobs and Tax Act of 2017 lowered allowable mortgage interest and state and local tax deductions. High-end properties in high-tax states such as California, New York and Massachusetts have suffered from this adjustment. Second, the US housing market has an overhang of large, pricey homes relative to strong demand for smaller, starter homes. Median home prices outpacing average ones show this divergence. We also to need to gauge if consumer spending is likely to follow the manufacturing sector lower. If it does, a recession will be unavoidable. On this front, we are hopeful because: The outlook for household income is positive. As you noted, the unemployment rate is still extraordinarily low, and more Americans will be working by the end of 2020 than today. Additionally, the rising employment-to-population ratio for prime-age workers is tightly linked to stronger wages (Chart 21). Also, the recent pick up in productivity growth points to higher real wage growth. The household savings rate is elevated and has limited upside. Households already have a large cushion insulating them from unforeseen shocks. At 8.1% of disposable income, the savings rate is in the 65th percentile of its post-1980 distribution. It is especially lofty if we take into account robust American households’ net worth (Chart 21, bottom panel). Consumer credit demand is rising, according to the Fed’s Senior Loan officer survey. Since household liquid assets are quickly expanding and the household formation rate is robust, consumption of durable goods should pick up, especially in light of the large decrease in borrowing costs. This is particularly true since the household debt-to-assets ratio is at its lowest level since 1985 and debt-servicing costs only represent 9.7% of disposable income, the lowest share for nearly 40 years. The corporate sector outlook should brighten soon. The modest rise in productivity protects margins from higher wages, an effect that will linger given that capacity expansion is consistent with further productivity gains (Chart 22). Crucially, the combined fiscal and monetary easing in China should bolster capital-spending intentions around the world, including the US (Chart 23). Rising productivity will only consolidate these trends. Chart 22Capacity Growth Provides Some Support For Productivity
Capacity Growth Provides Some Support For Productivity
Capacity Growth Provides Some Support For Productivity
Chart 23Chinese Reflation Will Revive US Capital Spending
Chinese Reflation Will Revive US Capital Spending
Chinese Reflation Will Revive US Capital Spending
The most positive development for the US corporate sector is our outlook for non-US growth. If the global manufacturing sector mends itself, so will the US. Ample liquidity is a positive for the world economy, as well as for US manufacturing conditions (Chart 24). On the fiscal front, we appreciate your worries, but they are not a story for 2020. The US fiscal thrust will not be as positive as it was in 2018 or 2019, but it is set to remain a small tailwind, not a drag. Furthermore, given that 2020 is an election year it is unlikely that politicians will tighten purse strings over the coming 12 months. Fiscal risks are undoubtedly greater in the long run. However, a sudden fiscal consolidation is a remote probability because fiscal austerity has gone out of style. Instead, the federal debt burden will be a major source of long-term inflation because there is no other easy way to address this gigantic pile of liabilities. The path of least resistance will be more spending and financial repression. In other words, real rates will stay too low and excess government spending will push prices higher, conveniently eroding the real value of that high federal debt burden. This was a big story in the 20th century and it will remain so in the 21st (Chart 25), especially since an aging population and the peak in globalization will weigh on global savings. Chart 24The US Manufacturing Slowdown Has Run Its Course
The US Manufacturing Slowdown Has Run Its Course
The US Manufacturing Slowdown Has Run Its Course
Chart 25Inflation Is About Political Decisions
Inflation Is About Political Decisions
Inflation Is About Political Decisions
Ms. X: Your point about demographics makes me think of Europe and Japan. Brexit has not been resolved; populism remains a concern in Italy; and the European banking system is still fragile. Japan suffers from an even worse demographic profile and the recent VAT increase was ill-timed, economically. Given these headwinds, can these regions participate in the global recovery you foresee? BCA: The short answer is yes, albeit to varying degrees. The outlook for Europe is more promising than Japan. A No-Deal Brexit is now a very low probability event, even after next month’s UK election. The conservatives’ support for Prime Minister Johnson’s Brexit plan will ensure as much. A large source of uncertainty is being lifted, which will allow European businesses to resume investment planning. The situation in the European periphery is also improving. Non-performing loans in Spain and Italy are falling (Chart 26), which is allowing for a normalization of credit origination. The narrowing Italian and peripheral spreads to German bunds will be helped by easing financial conditions in the European economies that need it most. Higher Italian bond prices improve banks’ solvency and cut borrowing costs for the private sector. Finally, populism is alive and well in Europe, rejecting fiscal austerity, but not embracing euro-skepticism. More generous fiscal spending would be a positive for Europe. European liquidity conditions are also generous. Deposit growth has strengthened and financial conditions have benefited from lower German yields and a cheap euro, which trades 15% below fair-value estimates. Our model for European banks’ return on tangible equity is rising, which is a clear indication that easy financial and liquidity conditions should deliver stronger incremental economic activity (Chart 27). Chart 26Declining Non-Performing Loans Are A Positive For The European Periphery
Declining Non-Performing Loans Are A Positive For The European Periphery
Declining Non-Performing Loans Are A Positive For The European Periphery
Chart 27European Banks' Return On Equity Will Improve In 2020
European Banks' Return On Equity Will Improve In 2020
European Banks' Return On Equity Will Improve In 2020
The fiscal outlook is murkier. European fiscal thrust was a positive 0.4% of GDP in 2019, but it will decline to 0.1% in 2020. However, fiscal policy affects economic activity with a lag. The impact of this year’s easing has yet to be fully felt. Since European rates are so low and the economy is not operating at full capacity, the fiscal multiplier is greater than one. Therefore, Europe can still reap a substantial fiscal dividend next year. Finally, Europe remains a very pro-cyclical economy. A large share of euro area GDP is connected to manufacturing and exports. As a result, Europe will be one of the prime beneficiaries of a pickup in global growth. Already, the sharp rebound in the German and euro area ZEW survey expectation components point to a brighter outlook for the region. Japan is also a very pro-cyclical economy, which will reap a dividend from a bottom in global manufacturing activity. However, the Land of the Rising Sun is still subject to idiosyncratic constraints. Japanese financial conditions have not improved as much as those in Europe. The yen has appreciated 2.6% in trade-weighted terms this year, while Japanese yields have not melted as much as European ones (because Italian and peripheral yields fell so much in 2019). Japan will also have to reckon with the impact of the October VAT increase. Ahead of the tax hike, retail sales spiked by 9.1% on a year-on-year basis, or 7.1% compared to the previous month, a script similar to 2014. 2015 was a payback year where consumption was depressed. This scenario will play out again, even if the Abe government has implemented some fiscal offsets. Ultimately, the Japanese economy will lag Europe’s in the first half of the year but should catch up in the second half. The impact of the tax hike will dissipate. Most importantly, rebounding global growth will hurt the yen, at least on a trade-weighted basis, providing a lift to export prospects and easing Japanese financial conditions relative to the rest of the world, which will produce a growth dividend later in 2020. Ms. X: To summarize, you expect a moderate rebound in global growth next year, but not a sharp acceleration because Chinese stimulus will not be that aggressive. EM activity will also pick up but will not generate fireworks. The US will be okay but Europe will probably deliver the largest positive growth surprise as external and domestic conditions align positively. Japan will also stabilize on the back of stronger global growth, but domestic headwinds mean that a true reacceleration won’t happen until the latter part of the year. This recovery constitutes the business cycle’s end game as inflation will become a concern in 2021, forcing the Fed to tighten then. BCA: Yes, this is correct. Ms. X: Thank you! Bond Market Prospects Chart 28Global Bonds Are Extremely Overvalued
Global Bonds Are Extremely Overvalued
Global Bonds Are Extremely Overvalued
Ms. X: I do not like US Treasuries at current yields. They do not protect me against an inflation surprise and will do nothing for me in an economic recovery. However, my bearishness is tempered by the large stock of bonds with negative yields in Europe and Japan. As long as this strange situation persists, I doubt US yields will experience much upside. US paper is too attractive to foreign asset managers right now. BCA: We share your view and are recommending an underweight to global government bonds. Global yields offer little value and are vulnerable to a rebound in economic activity or a trade détente. Our Global Bond Valuation index is flashing a clear sell signal (Chart 28). As yields rise, global yield curves are bound to steepen. We also agree that the upside for Treasury yields is limited, but we disagree with the limiting factor. Foreign investors are not the major buyers of Treasuries. Indeed, the data shows that European and Japanese investors have not been aggressive purchasers of US government securities. The US yield curve is flat and US short rates tower above European and Japanese ones, hedging currency exposure when buying Treasuries is expensive. In euro or yen terms, a hedged Treasury yields -67 basis points and -60 basis points, less than 10-year bunds or JGBs, respectively. Meanwhile, EM central banks are diversifying their FX reserves away from the US dollar into gold. Instead, our view is governed by the concept we dub the “Golden Rule of Treasury Investing.” According to this principle, the outperformance of Treasuries relative to cash is a direct function of the Fed’s ability to surprise the market. If the Fed cuts rates more than the OIS curve anticipated 12 months prior, Treasuries outperform. The opposite happens if the Fed delivers a hawkish surprise (Chart 29). Chart 29The Golden Rule Of Treasury Investing
The Golden Rule Of Treasury Investing
The Golden Rule Of Treasury Investing
Treasury yields are unlikely to move significantly higher than the 2.25% to 2.5% zone, because the OIS curve is now only pricing in 28 basis points of rate cuts over the next year. It is not just the US OIS curve that has priced out a large amount of rate cuts; this phenomenon has materialized around the world over the past five weeks. Chart 30The Term Premium Is Too Low
The Term Premium Is Too Low
The Term Premium Is Too Low
Any upside risk to that 2.25% to 2.5% forecast for 2020 will come from the inflation expectations and term premium components of yields. Central banks, including the Fed, have telegraphed an intention to allow inflation expectations to rise, initially, in response to stronger global growth. Moreover, declining risk aversion should also allow the exceptionally depressed term premium to normalize (Chart 30). Only in late 2020 or early 2021 will Treasury yields durably move above this 2.25-2.5% zone. Punching above these levels will require core PCE inflation to have been above target long enough to re-anchor inflation expectations back up to their 2.3% to 2.5% target zone. Only then will the Fed give the all-clear signal to the bond market to lift yields higher. Mr. X: You still have not directly addressed the question of negative yields in Europe and Japan. This story will not end well. Do you worry about these bond markets over the next year? BCA: Our answer is an emphatic yes. But we assume you will not let us leave it at that. Mr. X: You know me too well. BCA: Over the course of the past 50 years, we have learned a thing or two about you. In all seriousness, let’s start with our simple but effective valuation ranking. It compares the current level of real yields for each country to their historical averages and standard deviations. You can see that the most unattractive bond markets right now are all in Europe (Chart 31). Chart 31European Bonds Are Too Dear
OUTLOOK 2020: Heading Into The End Game
OUTLOOK 2020: Heading Into The End Game
Chart 32Swiss Bonds Are A Lose-Lose Proposition
Swiss Bonds Are A Lose-Lose Proposition
Swiss Bonds Are A Lose-Lose Proposition
The lower bound of interest rates is another reason to avoid these markets. This floor seems to lie around -1% in nominal terms. Because of these constraints, in recent months, Swiss, Swedish, Dutch and German 10-year bonds have failed to rally as much as their higher-yielding US, Canadian or Australian counterparts when global yields are declining. However, they also underperform when yields are rising (Chart 32). They have become a lose-lose proposition. The only pockets of value left in DM bond markets are Greece, Portugal or Italy. Despite their apparent risks, we still like them. Support for the euro in Greece and Italy is 70% and 65%, respectively. Even populist governments in these nations are reluctant to attack euro membership anymore. Moreover, the ECB remains committed to the survival of the euro area in its current form. Christine Lagarde will not change that. For 2020 or 2021, the risk of euro breakup is practically zero. The same may not be true on a 5- to 10-year investment horizon, but for the coming year, these bonds offer an attractive risk-adjusted carry. Ms. X: Unsurprisingly, my father does not like corporate bonds because of highly levered corporate balance sheets. I think this is a long-term problem, but not a risk for 2020, so I’m looking to stay overweight spread product relative to Treasuries. Where do you stand on this market? BCA: On this issue, we sit somewhere between you both. Our Corporate Health Monitor continues to deteriorate (Chart 33). The high debt load of the US business sector coupled with the decline of the return on capital worries us. Furthermore, the covenant-lite trend in recent issuance suggests that corporate borrowers, not lenders, are getting the good deals. Essentially, too much cash is still chasing too little available yield pick-up. In this environment, capital is sure to be misallocated, and money ultimately lost. We find the reward-to-risk tradeoff more attractive in Europe and Japan than in emerging markets. On a short-term basis, the spreads will not widen much. An easy Fed, recovering global growth, and the gigantic pile of negative-yielding bonds around the world will make sure of that. We advocate a neutral stance on investment grade corporates because IG bonds have high modified duration such that breakeven spread compensation versus Treasuries is near the bottom of its historical distribution across the IG credit spectrum (Chart 34). This means that credit will generate poor returns if government bond yields rise. Chart 33Dangerous Long-Term Picture For US Corporates
A Precarious Long-Term Picture For US Corporates
A Precarious Long-Term Picture For US Corporates
Chart 34No Value Left In IG
No Value Left In IG
No Value Left In IG
Chart 35EMs Still Experiencing Deflation
EMs Still Experiencing Deflation
EMs Still Experiencing Deflation
Thankfully, they are ways around this problem: emphasizing exposure to high-yield (HY) bonds and agency mortgage-backed securities (MBS) instead. HY breakeven spreads remain much more attractive than in the IG space, and option-adjusted spreads will benefit if our growth and inflation forecasts materialize. Investors reluctant to commit capital to these products should look into high quality agency MBS. After the recent wave of mortgage refinancing, these securities’ duration has collapsed to 3.0 compared to 7.9 for IG corporates. These securities therefore offer much better protection in a rising-yield environment. Ms. X: Before we move on to equities, where do you stand on EM bonds? BCA: We need to differentiate between EM local-currency bonds and EM USD-denominated bonds. We do like some EM local currency bonds. Inflation in EM countries is low and dropping. Money and credit growth is slowing, which implies that the disinflationary trend will remain in place through 2020 (Chart 35). Weaker nominal growth means that central banks in EM will continue to cut rates, providing a nice tailwind for local-currency bond prices. This comes with a caveat. Lower policy rates will boost bond prices but hurt EM currencies, especially because most EM currencies are not cheap and are already over-owned. Next year, it will be preferable to garner exposure to those countries interest rate moves via the swap market rather than the cash bond market. Chart 36The Mexican Peso Is Cheap
The Mexican Peso Is Cheap
The Mexican Peso Is Cheap
There are some exceptions, like Mexico. The MXN is already very cheap because of fears surrounding the economic policies of President Andres Manual Lopez Obrador (AMLO) (Chart 36). However, we doubt he will turn out to be as dangerous as feared. Hence, MXN Mexican bonds are attractive to foreign investors in unhedged terms. We are currently avoiding EM USD-denominated debt, corporate and sovereign. Since emerging markets sport $5.1 trillion of dollar-denominated debt, falling EM exchange rates will increase the cost of servicing this debt, which makes it riskier. Mr. X: I think we will continue to underweight corporate and EM bonds in our fixed income portfolio. Spread levels still make no sense in terms of providing compensation for credit risk. I must admit that I find your recommendation to overweight MBS intriguing. We will need to ponder this idea further. Ms. X: And please wish me luck trying to convince my father to buy some high-yield bonds. Equity Market Outlook Mr. X: US stocks are too expensive for my taste, with the S&P 500 trading at a forward P/E ratio of 18. I’m well aware of the argument that equities may be expensive but that they are actually cheap compared to bonds, which implies that I should favor stocks over bonds. However, you know that I emphasize capital preservation. With stocks this rich already, equities offer no margin of safety. If I own stocks, I am therefore exposed to any unexpected shocks. Because I do not share your optimism on the economy, I am more worried about downside risk. Moreover, even if the economy performs better than I fear, I suspect stocks will respond poorly to higher yields. Chart 37The S&P Is Very Expensive
The S&P Is Very Expensive
The S&P Is Very Expensive
Ms. X: I agree with my father that stocks are expensive. Nonetheless, as Keynes famously quipped, “Markets can stay irrational longer than you can stay solvent.” In today’s context, to me this means that stocks can ignore their overvaluation so long as liquidity is plentiful, rates are low, and a recession is avoided. BCA: On this question, we agree with Ms. X. We all agree that US equities are expensive. As you mentioned, their price-to-earnings ratio is 18. Only at the apex of the tech bubble and in early 2018 was the S&P 500 more expensive. Worryingly, the price-to-sales ratio is at 2.3, an even larger historical outlier than the P/E (Chart 37). Chart 38Low Yields And Plentiful Liquidity Are Still Fertile Ground For Stocks
Low Bond Yields And Plentiful Liquidity Are Still Fertile Ground For Stocks
Low Bond Yields And Plentiful Liquidity Are Still Fertile Ground For Stocks
Ms. X is correct that we cannot look at stock valuations in isolation. Investing is about opportunity cost and the macroeconomic context. On this front, even US equities have their merit. Despite the S&P 500’s expensive multiples, our Composite Valuation Indicator is no more elevated than it was in 2013. Meanwhile, our Monetary Indicator has rarely been as supportive of stock prices as it is today, and our Speculation Indicator is in line with its January 2016 reading (Chart 38). Moreover, BCA’s Composite Sentiment indicator is still below its long-term historical average and margin debt has declined by $47.5 billion to the lowest share of US market capitalization since June 2005. These are hardly signs of irrational exuberance. Ultimately, bear markets and recessions travel together. A durable 20% drop in stock prices requires a significant and long-lasting decline in earnings. These developments happen during recessions (Chart 39). Our call is for a recession in the next 24 months or so. We must also remember that while equities perform poorly six months ahead of a recession, the end of a bull market, its last 12 to 18 months, tend to be very rewarding (Table 3). We are within this window. Chart 39Bear Markets And Recessions Travel Together
Bear Markets And Recessions Travel Together
Bear Markets And Recessions Travel Together
Table 3The End Game Can Be Rewarding
OUTLOOK 2020: Heading Into The End Game
OUTLOOK 2020: Heading Into The End Game
Based on our forecast for interest rates, we do not share the concerns that rising bond yields will topple stocks right away. Stock prices are an inverse function of risk-free rates, but a positive function of growth expectations. Higher yields will initially reflect stronger growth, not restrict it. But remember: the upside for yields is limited because central banks do not want to choke off the recovery. They will maintain accommodative policy. In other words, we expect real rates to lag behind growth expectations. Because long-term growth expectations, whether from sell-side analysts or extracted out of market prices using the Gordon Growth Model, are low, we are willing to make this bet (Chart 40). Equities will suffer if the global bond yield rises above 2.5%. This is more a story for 2021, and not our central scenario for 2020. It is nonetheless a reminder that we are entering the end game of the business cycle, so we are also entering the end-game of the bull market. Mr. X: I think you are playing with fire. Stocks are so expensive that if you are wrong on either the growth call or the yield call, they will suffer. I would rather miss the last melt-up in stocks than unnecessarily expose my portfolio to a meltdown. Additionally, you have not addressed the fact that S&P 500 margins have begun to soften but are still extremely elevated. Shouldn’t this dampen your optimism? BCA: Aggregate S&P 500 margins have some downside. Our Composite Margin Proxy, Operating Margins Diffusion index and Corporate Pricing Power indicator all remain weak (Chart 41). The deceleration in the crude PPI excluding food and energy and the past strength in the dollar confirm this insight, especially as the corporate wage bill climbs in a tight labor market. The biggest mitigating factor is that productivity is also on the mend, which curbs the negative impact of higher worker pay. Chart 40Growth Expectations Are Muted
Profit Growth Expectations Are Muted
Profit Growth Expectations Are Muted
Chart 41US Margins Under Pressure
US Margins Under Pressure
US Margins Under Pressure
This danger must be put into perspective though. Margin expansion has been dominated by the tech sector (Chart 42). Excluding this industry, S&P 500 margins are roughly in line with their previous peak, and are not declining. The aggregate softness in margins is a reflection of the sharper decline in tech margins. Declining margins do not spell the imminent end of the bull market either. Table 4 shows that on average, the S&P 500 rises by 9.5% following the peak in margins. Equities can rise after margins crest because this is often an environment where wages are climbing, which boosts consumption. Consequently, top-line growth can accelerate and earnings can rise even if they represent a lower proportion of sales. This is the environment we foresee over 2020. Chart 42Tech Margins Have Likely Peaked
Tech Margins Have Likely Peaked
Tech Margins Have Likely Peaked
Table 4Margin Peaks Do Not Spell S&P Doom
OUTLOOK 2020: Heading Into The End Game
OUTLOOK 2020: Heading Into The End Game
Chart 43Taiwanese Stocks Are Sniffing Out Better Global Growth
Taiwanese Stocks Are Sniffing Out Better Global Growth
Taiwanese Stocks Are Sniffing Out Better Global Growth
Ms. X: You have talked about the tech sector being a drag on overall margins. How would you position a US stock portfolio? BCA: First, around the world, we prefer cyclical sectors to defensive ones. Cyclical stocks are depressed relative to defensive firms’ shares. Rebounding global growth and rising bond yields will favor cyclical sectors. Globally, the performance of cyclical equities relative to defensive ones correlates with Taiwanese equities, which are currently rallying smartly (Chart 43). This suggests that at the margin, the most cyclical asset markets are beginning to express optimism about global growth. Within the S&P 500, our favorite pair trade to express this bias is to overweight energy stocks at the expense of utilities. Utilities are bond proxies which will substantially underperform energy stocks when the rate of change of Treasury yields moves up (Chart 44). Moreover, based on our valuation indicators, energy stocks have never traded at such a deep discount to utilities, nor have they ever been as oversold. Chart 44Favor Energy Over Utilities
Favor Energy Over Utilities
Favor Energy Over Utilities
Second, we are currently neutral on tech stocks but have put them on a downgrade alert. Tech equities are expensive, trading at a forward P/E ratio 21% above the other cyclicals. Moreover, since software spending has remained surprisingly resilient despite the global economic slowdown, it will likely lag investment in machinery and structures when industrial demand rebounds. Consequently, tech earnings will lag other traditional cyclical sectors. Tech multiples will also suffer when bond yields rise. As high-growth stocks, tech equities derive a large proportion of their intrinsic value from long-term deferred cash flows and their terminal value. Thus, tech multiples are highly sensitive to changes in the discount rate We implement this view by way of an underweight in tech and an overweight to industrials. Industrials have suffered disproportionately from the trade war. Any near term truce is unlikely to contain a grand bargain on intellectual property rights transfer that galvanizes tech exports, but it will remove some of the uncertainty weighing on industrials. Moreover, industrials are a much cheaper play on a global growth rebound. The global manufacturing slowdown has caused industrial equities to trade at their greatest discount to the tech sector since the financial crisis. Finally, the wage bill for the industrial sector is melting relative to tech, and our margin proxy is surging (Chart 45). This has created a very positive backdrop for this pair trade. We also like financials. They will be a key beneficiary of rising yields and a steepening yield curve. Additionally, household credit demand has picked up and overall credit growth should accelerate as central banks will maintain very accommodative monetary conditions. The yield impulse already points toward higher bank credit growth and companies are issuing an increasingly large stock of bonds (Chart 46). Chart 45Operating Metrics Will Boost Industrials Versus Tech Equities
Operating Leverage Will Boost Industrials Versus Tech Equities
Operating Leverage Will Boost Industrials Versus Tech Equities
Chart 46Easing Financial Conditions Will Support Credit Creation
Easing Financial Conditions Will Support Credit Creation
Easing Financial Conditions Will Support Credit Creation
Ms. X: When combining valuation analysis with your fundamental sectoral slant, I am guessing that you must favor European, Japanese and EM stocks over the S&P 500? BCA: We do favor European and Japanese equities. Based on valuation alone, all the regions you mentioned offer higher expected long-term real rates of return than the US (Chart 47). Moreover, the dollar is expensive relative to advanced economies’ currencies. Hence, these markets are cheaper vehicles than the S&P 500 to bet on a global economic recovery. But valuation alone is not enough. US stocks are trading at unprecedented levels relative to global equities because of the FAANG craze (Chart 48). Looking at sector representation, our positive view on non-tech cyclicals also flatters exposure to Europe and Japan (Table 5). Chart 47Non US Equities Offer Better Value
OUTLOOK 2020: Heading Into The End Game
OUTLOOK 2020: Heading Into The End Game
Chart 48FAANG-Driven US Outperformance
FAANG-Driven US Outperformance
FAANG-Driven US Outperformance
Table 5Equity Market Sector Composition
OUTLOOK 2020: Heading Into The End Game
OUTLOOK 2020: Heading Into The End Game
Chart 49European Banks Are Cheap
European Banks Are Cheap
European Banks Are Cheap
Europe is particularly attractive because of its large skew towards industrials and financials, which represent 32.3% of the market versus 22.3% in the US. Moreover, European financials are also a tantalizing bet because they trade at a 50% discount to US financials, according to their price-to-book ratio. Additionally, their return on tangible equity will benefit from higher German yields, easing financial conditions, declining non-performing loans in the periphery and rebounding global growth. Our RoE model for European banks already points to a resurgence in their stock prices (Chart 49). Of the major markets we track, Japan offers the highest prospective long-term real returns. Its strong cyclical slant and low share of tech stocks means it is another market investors should overweight to bet on a global recovery. The biggest problem for Japanese equities is the yen. When global yields climb higher, a weak JPY will clip some of the Nikkei’s gains for foreign investors. Finally, we are reluctant to overweight EM stocks just yet. In this space, median P/E ratios are much higher than on a market capitalization-weighted basis (Chart 50). State-owned companies explain this bifurcation, Chinese banks in particular. Since we expect Chinese banks to remain a conduit for policy, credit origination may flatter economic growth more than shareholders’ interests. Moreover, we have a negative outlook on EM currencies, and hedging this exposure is expensive. Finally, if China’s economic activity improves only modestly in 2020, the 2012 experience suggests that EM stocks can still underperform the global equity universe as global growth improves and yields rise (Chart 51). In other words, we find the reward-to-risk tradeoff more attractive in Europe and Japan than in emerging markets. Chart 50EM Stocks Are No Bargain Yet
EM Stocks Are No Bargain Yet
EM Stocks Are No Bargain Yet
Chart 51EM Stocks Can Underperform When Global Growth Improves
EM Stocks Can Underperform Even When Global Growth Improves
EM Stocks Can Underperform Even When Global Growth Improves
Mr. X: Thank you. I am still not sure what share of our portfolio will be dedicated to stocks. However, I think that whatever this proportion will be, buying global equities makes more sense than US ones. Your valuation argument alone is swaying me, considering my more conservative instincts. Ms. X: I’m glad we will not have to argue on this point, but I know we will nonetheless battle on the stock/bond/gold split. Should we move on to your currency and commodity forecasts? BCA: It would be our pleasure. Currencies And Commodities Mr. X: You have often argued that the dollar is a countercyclical currency. Based on our discussion so far, you must expect the dollar to decline until we get closer to the next recession. I am not fully convinced. Specifically, I remember that in the back half of 2016 global growth was rebounding, but the dollar soared. Therefore, the growth/dollar relationship can be more complex than you argue. Meanwhile, with negative interest rates in Europe, Japan and Switzerland, why would I even consider divesting out of my positive yielding dollar assets? Chart 52The Dollar Is A Counter Cyclical Currency
The Dollar Is A Counter Cyclical Currency
The Dollar Is A Counter Cyclical Currency
BCA: You raise interesting questions, and you are correct that we expect the dollar to depreciate if our constructive view on global growth pans out for 2020. The inverse relationship between global industrial production (excluding the US) and the trade-weighted dollar is unambiguous (Chart 52). As you also mentioned, the reality is a little bit more nuanced. To understand why, it is important to remember how currencies function. We can think of an exchange rate as an adjustment mechanism that solves for the gap in growth between any two countries. This is at the root of the dollar’s counter-cyclicality. When global growth is picking up, returns tend to be higher in cyclical markets, which are highly concentrated outside of the US. Flows then gravitate from the US to other markets and the dollar declines. After a while, the dollar becomes cheap enough that these flows reverse. In the second half of 2016, three factors drove the dollar rebound. First, US manufacturing was improving at a faster pace than that of the rest of the world. Second, the Fed resumed its interest rate hikes, so interest rate differentials suddenly flattered the dollar anew. Finally, the election of President Trump, who campaigned on large scale fiscal stimulus, elicited memories of the Reagan dollar bull market of the first half of the 1980s. These factors eventually faded as global growth rebounded. Today, the Fed’s policies are hurting the dollar. Aside from recent interest rate cuts, the Fed has been injecting liquidity into the banking system through repurchase agreements and renewed asset (T-Bills) purchases. Moreover, the rate cuts are also easing global funding conditions and promoting a re-steepening of the yield curve. This will incentivize banks to lend and boost the US money supply. As growth re-accelerates and demand for imports (machinery, commodities, and consumer goods) rises, the current account deficit will widen further. This process will increase the international supply of dollars. Historically, these dynamics usually hurt the dollar. What we have described is a tentative abatement in geopolitical risk at best – but it would be cavalier to get overly enthusiastic. Like you, we are deeply uncomfortable with negative interest rates. Thankfully, the nascent pickup in global economic activity is lifting global bond yields. So far, foreign bond markets have led this move. More specifically, countries that have suffered most from the global manufacturing slowdown are now seeing their bond yields rise the quickest (Chart 53). For example, yields in Germany, Norway, Sweden, Switzerland and Japan have risen by a lot more than those in the US since global yields troughed in September. Should the initial signals of stabilization in global growth morph into a synchronized recovery, the US yield advantage will evaporate. In a nutshell, interest rates might be negative in Europe and Switzerland, but the positive carry offered by US assets is rapidly fading. Chart 53AAre Interest Rate Differentials Flashing A Signal About Exchange Rates?
Are Interest Rate Differentials Flashing A Signal About Exchange Rates?
Are Interest Rate Differentials Flashing A Signal About Exchange Rates?
Chart 53BAre Interest Rate Differentials Flashing A Signal About Exchange Rates?
Are Interest Rate Differentials Flashing A Signal About Exchange Rates?
Are Interest Rate Differentials Flashing A Signal About Exchange Rates?
Chart 54Foreigners Are Selling Treasuries
Foreigners Are Selling Treasuries
Foreigners Are Selling Treasuries
For international investors, the currency risk inherent in owning US bonds is just too large at the current juncture. Remember, the trade-weighted dollar stands 25% above its long-term equilibrium and the US twin deficits are expanding. Markets priced in cheap currencies with some potential upside, such as Australia, Canada, Norway or even the European periphery, might be better bets. Flows highlight just how precarious the situation is for the US dollar. Since last August, overall flows into the US Treasury market have been negative. Net foreign purchases by private investors are still positive at an annualized US$180 billion, but they are clearly rolling over. Moreover, official net outflows are running at $350 billion, easily cancelling out the private sector’s inflows (Chart 54). Essentially, foreigners’ appetite for US fixed-income assets is waning exactly as interest rate differentials have started moving against the dollar. Ms. X: I share my father’s concerns, but how would you implement your negative dollar view. Which currencies should I be loading up on as we enter the business cycle’s end game? BCA: The more export-dependent economies (and currencies) should benefit the most from a rebound in global growth. Within the G-10, we particularly like the Swedish krona, the Norwegian krone and the British pound. Bond yields for these currencies are rising the fastest vis-à-vis the US. As a result, the currencies themselves should soon follow (previously mentioned Chart 53). We also expect commodity currencies to benefit, but only upon clearer signs that the resource-thirsty Chinese economy is improving. Until then, they are likely to lag the pro-cyclical European currencies, which are less directly dependent on Chinese stimulus. The euro could become the greatest beneficiary from a weaker dollar because a large headwind for European economic activity is disappearing for now. For the past ten years, European real interest rates have been too low for the most productive, competitive exporter – Germany – but too high for others such as Spain and Italy. Consequently, the euro has been caught in a tug-of-war between a rising neutral rate of interest for Germany and a very low one for the peripheral economies. Via its rate cuts, asset purchase programs, and aggressive TLTRO packages, the ECB may have now finally eased policy to the point where nearly all Eurozone countries enjoy an accommodative monetary environment. 10-year government bond yields in France, Spain, Portugal and even Italy now all sit close to the neutral rate of interest for the entire eurozone (Chart 55). Chart 55The ECB Has Eased Policy Enough
The ECB Has Eased Policy Enough
The ECB Has Eased Policy Enough
Finally, the euro is likely to benefit from inflows into European equity markets. The euro’s drop since 2018 has eased financial conditions and made euro area businesses more competitive. This is an important tailwind for European corporate profits and thus stocks. Moreover, European equities, especially those in the periphery, remain unloved, as illustrated by their cheap valuations compared to other advanced economies. Additionally, analysts’ earnings expectations for eurozone equities are perking up relative to US stocks. If the sell-side is right, powerful inflows into the region will lift the euro in 2020. Mr. X: Thank you. I find it difficult to share your enthusiasm for the euro, a currency backed by such a flimsy edifice. While I would agree that it could rebound next year, I find currencies highly unpredictable on such a time horizon. I prefer to think about them on a long-term basis, and while the euro is cheap, its weak institutional underpinning is too concerning. Let’s move on to commodities. Following our meeting last year, we took your advice on oil and gold. Overall, these calls helped our portfolio. Going forward, these markets are extremely perplexing. There is so much risk in oil markets, such as the tensions in the Middle East and the uncertainty stemming from the trade war between the US and China. How would you recommend playing the oil market in 2020? Chart 56Inventory Drawdown Will Support Oil
Inventory Drawdown Will Support Oil
Inventory Drawdown Will Support Oil
BCA: Your assessment of these markets is spot on. Yet, price risk is skewed to the upside because fiscal and monetary stimulus will revive commodity demand. The oil-producer coalition led by Saudi Arabia and Russia will continue to restrain production, and will probably extend its 1.2mm b/d production cut due to expire at the end of March to year-end 2020. In the US, market-imposed capital discipline will keep reducing the growth of US shale-oil supply. Additionally, US shale-oil supply growth is threatened by flaring of associated natural gas in the Bakken and Permian basins. Failure to limit the burn-off at oil-production sites could provide the environmental lobby an opening to challenge growth. Ms. X: What about the demand side of the oil markets? The fall in the growth rate of demand this year caught most participants off guard. What do you make of that? BCA: Demand data shows a lot of lingering weakness, much of which was caused by tight financial conditions last year in the US and China. But now, most global central banks are pursuing highly accommodative monetary policy and many governments are also easing fiscal policy. As a result, this demand weakness will fade next year. We think next year growth will clock in at 1.4mm b/d. Not as robust as 2017, but still respectable. This should stop the downward pressure on oil prices that has prevailed since May (Chart 56). Mr. X: You’re describing a fairly strong market for next year. What are the downside risks to your view? BCA: Global economic policy uncertainty remains elevated. Uncertainty is one of the key factors driving demand for USD, which is one of the most popular safe havens in the world (Chart 57). A strong dollar creates a headwind for commodity demand. It raises the local-currency costs of consumers in the EM economies that drive oil demand, and lowers production costs outside of the US, encouraging supply growth at the margin. Chart 57Elevated Global Economic Uncertainty Has Kept The USD Well Bid
OUTLOOK 2020: Heading Into The End Game
OUTLOOK 2020: Heading Into The End Game
Chart 58Gold: A Valuable Portfolio Hedge
OUTLOOK 2020: Heading Into The End Game
OUTLOOK 2020: Heading Into The End Game
Ms. X: So, pulling it all together, what is your call for 2020? BCA: The weaker 2019 demand data and the upward revisions to global oil inventories pushed our 2020 Brent Oil forecast to $67/bbl from $70/bbl. We still expect WTI to trade at a $4/bbl discount to Brent. As we mentioned earlier, the risk to our forecast is to the upside: a resolution of the US-China trade war, and lower global economic policy uncertainty could trigger a sharp rally in crude prices. Mr. X: Thank you for your insight on oil. I would like to hear your thoughts on gold. You can tell that I see little absolute value in stocks or bonds at the moment, so I have an outsized preference for the yellow metal this year. Also, how could the US dollar and gold both rally at the same time in 2019? BCA: Let’s start with your dollar/gold question. It is very rare to see gold and the dollar rally together. Normally a strong dollar hurts gold. As you know, we’ve been recommending an allocation to gold since 2017, mostly as a portfolio hedge. We like that gold strongly outperforms other safe havens in equity bear markets and can participate in the upside (even if to a limited extent) in bull markets. We think the safe-haven properties of gold and the US dollar really have come to the fore over the past couple of years (Chart 58). Economic policy uncertainty, and divisive politics globally have raised the level of uncertainty to record levels. In such an environment, the dollar and gold both provide a safe haven and a portfolio hedge. Hence, their joint popularity this past year. We should also remember that gold is a good inflation hedge, and is particularly negatively correlated with real interest rates. A Fed that is willing to let the economy overheat is a Fed that will limit how high real rates climb. Moreover, global liquidity is plentiful. Finally, EM central banks have been slowly divesting from Treasuries and diversifying into gold lately, buying most of the new supply in the process. This backdrop, along with our forecast of a weaker dollar, should support gold again in 2020. That being said, because gold is tactically overbought and could face temporary headwinds if global uncertainty recedes, we prefer silver, which is not as stretched. Furthermore, silver’s higher industrial use means that it should also benefit from a global manufacturing recovery. Geopolitics Chart 59Multipolarity Creates An Unstable Environment
Multipolarity Creates An Unstable Environment
Multipolarity Creates An Unstable Environment
Mr. X: Let’s return to geopolitical and policy risks, both of which abound. Global economic policy uncertainty is the highest it has been since academics began measuring it. The world is fraught with populism, authoritarianism, war, immigration, technological disruption, inequality, and corruption. With so much chaos, and so little consensus, is there anything solid for an investor to grasp about the political backdrop next year? BCA: Geopolitics is the likeliest candidate to short circuit this long bull market, given that the Federal Reserve, the usual culprit, has paused its rate tightening campaign. On a secular basis, geopolitical risk is rising because the United States’ national power is declining relative to that of other world powers (Chart 59). China’s rise, in particular, is stirring conflict with the US and its allies in the western Pacific. Beijing’s technological and military advance is generating fear across the American political establishment. Russia and China continue to deepen their relationship in the face of an increasingly unpredictable United States. These strategic tensions will persist despite any tariff ceasefire with China. Chart 60Globalization Has Peaked
Globalization Has Peaked
Globalization Has Peaked
Competition among the great powers makes for a world of contested authority. As the rules of the road have become less certain, the tailwind behind international trade and investment has weakened (Chart 60). Deglobalization is a headwind for the earnings of large cap global companies in the long run. Emerging markets, which are exposed to trade, face persistent unrest. Mr. X: Given the above, how can an investor take an optimistic view of the global economy and markets next year? BCA: We have a framework for analyzing politics: constraints over preferences. We cannot predict what the chief politicians will prefer at any given time, but we can try to identify and measure the constraints that will restrict their freedom of movement. With global growth slowing, world leaders have become more sensitive to their constraints. The Fed has reversed rate hikes; China is easing policy; President Trump has refrained from attacking Iran; and President Trump and President Xi are negotiating a ceasefire. The UK has avoided a “no deal” Brexit – not once but twice. In short, the risk of recession (or conflict) has been sufficient to alter the policy trajectory. As a result, there is a prospect for global geopolitical risks to abate somewhat in 2020. Both the American and Chinese administrations need to see growth stabilize despite their ongoing strategic conflict. Both the British and European governments need to avoid a disorderly Brexit despite their lack of clarity beyond that. Geopolitical risk is declining, albeit from an extremely elevated level. Mr. X: The US and China have already come close to a deal only to get cold feet and back away from it. The British Prime Minister is committed to leaving the EU with or without a deal. Surely you cannot believe that the Middle East, Russia, other emerging markets, or North Korea will be any bastion of stability. BCA: The US-China trade war is still the single greatest threat to the equity bull market. Brexit is not resolved and a new deadline for a trade deal looms at the end of 2020. Investors must remain vigilant and hedge their portfolios, particularly with gold. Nevertheless, one cannot ignore this year’s reaffirmation of the Fed put, the China put, and Trump’s “Art of the Deal.” The base case for next year should be constructive, albeit with vigilant attention to the major risks: President Trump, China and Iran. The other issues you mention have varying degrees of market relevance. Russia is focusing on pacifying domestic discontent. North Korea is on a diplomatic track with the United States. Emerging market unrest is particularly relevant where it can have a bearing on global stability: Iraq, Iran and Hong Kong in particular. Ms. X: If I may interject: It seems to me that the worst of the trade war has passed, that the risk of a no-deal Brexit is negligible, and that Iran is unlikely to outdo its attack against Saudi Arabia in September. Doesn’t this imply that geopolitical risk is overrated and that investors should rush to capture the risk premium in equities? BCA: What we have described is a tentative abatement in geopolitical risk at best – but it would be cavalier to get overly enthusiastic. After all, any fall in global risks will be amply made up for by the impending rise in US domestic political risk. Indeed, US politics are the chief source of global political risk in 2020. First, if President Trump becomes a “lame duck” then he could take actions that are hugely disruptive to global markets in a desperate attempt to win reelection as a “war president.” Chart 61European Political Risk Is Now Low
Europe Political Risk Is Now Low
Europe Political Risk Is Now Low
Second, if President Trump is reelected, then his disruptive populism will have a new mandate and his “America First” foreign and trade policy will be unshackled. Third, if the opposition Democrats succeed in unseating an incumbent president, they will likely take the Senate too, removing the main hurdle to a dramatic policy change. That would mark the third 180-degree reversal in national policy in 12 years. Moreover, investors may find the country merely exchanged right-wing populism for left-wing populism, which has a more negative impact on corporate earnings prospects. Polarization and institutional erosion will continue. The election results may be razor thin; swing states may have to recount votes; and the outcome could hinge on rare or unprecedented developments in the Electoral College, the Supreme Court or cyberspace. A crisis of legitimacy could easily afflict the next administration. In short, there are few scenarios in which US political risk does not rise over the next 12-24 months. Rising American risk stands in stark contrast to Europe (Chart 61), where the will to integrate has overcome several challenges since the sovereign debt crisis. Substantial majority of voters support the euro and the European Union. Germany is on the brink of a major political succession but it is not turning its back on the European project. France is successfully pursuing structural reforms. Italy remains the weakest link, but even the populist Northern League accepts the euro. This leaves two remaining global risks: China and Iran. Chinese political risk is generally understated. President Xi Jinping, lacking President Trump’s electoral constraint, could overestimate his leverage. He could overreach in the trade talks, in his battle to prevent excessive debt growth, or in his handling of Hong Kong, Taiwan, North Korea, or Iran. The result could be a breakdown in the trade talks or a separate strategic crisis with the United States. Another cold war-style escalation in tensions could easily kill the green shoots in global growth. As for Iran, the regime is under crippling American sanctions and faces unrest both at home and within its regional sphere of influence. There is a non-negligible risk that it will lash out and cause an extended oil supply shock. Conclusions Mr. X: This is a good place to conclude our discussion. We have covered a lot of ground but I remain deeply concerned that staying invested in risk assets today is akin to picking-up pennies in front of a steamroller. I accept your opinion that a recession is unlikely in 2020, but valuations of both stocks and bonds are uncomfortably stretched for my taste. As a result, I believe stocks could suffer whether growth is good or bad next year. Finally, since so many things need to go right for the global economy to continue to defy gravity, a recession may hit faster than you envision. To me, there is simply not enough margin of safety in stocks to compensate me for the risk! Ms. X: I agree with my father that the risks are high because we are entering the end game of the cycle. But I also see pockets of value, some of which you have mentioned today. Moreover, I am sympathetic to your view that global growth will recover next year. Corporate earnings should therefore expand. Hence, I fear that being out of the market will be very painful, especially because policy is quite accommodative. While stocks may not perform as well as they did in 2019, I expect them to outperform bonds handily. I’m therefore willing to continue holding risk assets, even if I need to be more judicious in my sector and regional allocation. BCA: Your family debate mirrors our own internal discussions. There is always a trade-off between maximizing short-term returns and taking a longer-term approach. Valuations are the ultimate guidepost for long-term return prospects. Because so many assets have become more expensive this year, long-term returns are likely to be uninspiring compared to recent history. Table 6 shows our baseline calculations of what a balanced portfolio will earn over the coming decade. We estimate that such a portfolio will deliver average annual returns of 4.4% over the next ten years, or 2.4% after adjusting for inflation. That is a noticeable deterioration from our inflation-adjusted estimate of 2.8% from last year, and also still well below the 6.5% real return that a balanced portfolio earned between 1982 and 2019. Table 6Asset Market Return Projections
OUTLOOK 2020: Heading Into The End Game
OUTLOOK 2020: Heading Into The End Game
Our outlook for next year hinges on global growth rebounding and policy uncertainty receding. Monetary policy is less of a threat to equities than it was last year because central banks have already eased considerably and have been very open about their willingness to let inflation run above target for a while before retightening the monetary screws. We propose the following list of easy-to-track milestones to monitor whether or not our central scenario for the global economy and asset markets is playing out, and how close we are to the end of the cycle: Chinese money and credit numbers. Chinese credit growth must stabilize for the economy to do so. If credit origination continues to decelerate, this will indicate that Beijing has decided to tolerate the slowdown and prioritize its reform and deleveraging agenda. In this case, the Chinese debt supercycle is over sooner and the global economy will pay the price. Our China Investment Strategy Activity Index. Global policy is accommodative and liquidity conditions have improved significantly. However, if the Chinese economy continues to deteriorate, global growth will not rebound. The China Activity Index must stabilize and even improve somewhat for our global growth view to come to fruition. Progress in the “phase one” deal. China and the US must agree to a trade détente. As long as uncertainty around immediate tariffs remain high and retaliation risks stay alive, global capital spending intentions and thus the global manufacturing sector will be hamstrung. Surveys of global growth. The Global manufacturing PMI and the global growth expectation component of the ZEW survey must both recover. If these variables cannot gain any traction, the global economy is sicker than we estimate and risk assets will suffer. Commodity prices and the dollar. In the first quarter, industrial commodity prices must rebound and the dollar must start to depreciate. These two developments will not only reflect an improvement in global growth. They will also alleviate deflationary pressures around the world, revive profits and sponsor a business spending recovery. Moreover, a weaker dollar will also ease global financial conditions by decreasing the global cost of capital. 10-year inflation breakeven rate. If US breakevens move above the 2.3% to 2.5% zone, the Fed will become more proactive about raising rates. This would provoke a quicker end to the business cycle. President Trump’s approval rating. If President Trump’s approval rating stabilizes below 42%, he could give up on the economy and instead bet on a “rally around the flag” as his best strategy for re-election. This would result in a much more hawkish and confrontational White House that would become an even greater source of uncertainty for the economy, and thus risk asset prices. Ms. X: Thank you for this comprehensive list of variables to monitor. As always, you have left us with much to think about. We look forward to these discussions every year. Before we conclude, it would be helpful to have a recap of your key views. BCA: It will be our pleasure. The key points are as follow: Global equities are entering the end game of their nearly 11-year bull market. Stocks are expensive, but bonds are even more so. As a result, if global growth can recover and the US can avoid a recession in 2020, earnings will not weaken significantly and stocks will again outperform bonds. Low rates reflect the end of the debt supercycle in the advanced economies. However, the debt supercycle is still alive in EM in general, and in China, in particular. The global economic slowdown that begun more than 18 months ago started when China tried to limit debt growth. If Beijing continues to push for more deleveraging, global growth will continue to suffer as the EM debt supercycle will end. Nonetheless, we expect China to try to mitigate domestic deflationary pressures in 2020. As a result, a small wave of Chinese reflation, coupled with the substantial easing in global monetary and liquidity conditions should promote a worldwide re-acceleration in economic activity. Policy uncertainty will recede next year. Domestic constraints are forcing China and the US toward a trade détente. The risk of a no-deal Brexit is now marginal, and President Trump is still the favorite in 2020. A decline in policy risk will foster a global economic rebound. That being said, some pockets of risk remain, such as in the Middle East. Global central banks are highly unlikely to remove the punch bowl anytime soon. Not only will it take some time before global deflationary forces recede, monetary authorities in the G10 want to avoid the Japanification of their economies. As a result, they are already announcing that they will allow inflation to overshoot their 2% target for a period of time. This will ultimately raise the need for higher rates in 2021, which will push the global economy into recession in late 2021, or early 2022. These dynamics are key to our categorization of 2020 as the end game. US growth will re-accelerate. The US consumer remains in good shape thanks to healthy balance sheets and robust employment and wage growth prospects. Meanwhile, corporate profits and capex should benefit from a decline in global uncertainty and a pick-up in global economic activity. China will continue to stimulate its economy but will not do so as aggressively as it did over the past 10 years. Consequently, EM growth will also bottom but is unlikely to boom. Europe and Japan will re-accelerate in 2020. Bond yields will grind higher in 2020. However, Treasury yields are unlikely to break above the 2.25% to 2.5% range until much later in the year. Inflationary pressures won’t resurface quickly, so the Fed is unlikely to signal its intention to raise interest rates until late 2020 or later. European bonds are particularly unattractive. Corporate bonds are a mixed offering. Investment grade credit is unattractive owing to low option-adjusted spreads and high duration, especially when corporate health is deteriorating. Agency mortgage-backed securities and high-yield bonds offer better risk-adjusted value. Global stocks will enjoy their last-gasp rally in 2020. As global growth recovers, favor the more cyclical sectors and regions which also happen to offer the best value. US stocks are the least attractive bourse; they are very expensive and loaded with defensive and tech-related exposure, two groups that could suffer from higher bond yields. We are neutral on EM equities. Investors should pare exposure to equities after inflation breakevens have moved back into their 2.3% to 2.5% normal range and the Fed funds rate has moved closer to neutral. We anticipate this to be a risk in 2021. The dollar is likely to decline because it is a countercyclical currency. Balance of payment dynamics and valuation considerations are also becoming headwinds. The pro-cyclical European currencies and the euro should be the main beneficiary of any dollar depreciation. Oil and gold will have upside next year. Crude will benefit from both supply-side discipline and a recovery in oil demand on the back of the improving growth outlook. Gold will strengthen as global central banks limit the upside to real rates by allowing inflation to run a bit hot. A weaker dollar will flatter both commodities. A balanced portfolio is likely to generate average returns of only 2.4% a year in real terms over the next decade. This compares to average returns of around 6.5% a year between 1982 and 2019. We would like to take this opportunity to wish you and all of our clients a very peaceful, healthy and prosperous New Year. The Editors November 22, 2019
Highlights US politics are the chief source of global geopolitical risk over the coming year – and likely beyond. President Trump’s reelection remains our base case – the sitting president rarely loses if the economy is expanding. Yet the risk of a Democratic victory is high – Trump’s low approval rating, impending impeachment trial, and various policy troubles threaten his reelection bid. Trump’s tactics and the Democrats’ turn to the progressive left pose threats to BCA Research’s cyclically bullish house equity view. Feature If a time-traveler had accosted you in the fall of 2014 and told you that Donald Trump, the host of the reality TV show The Apprentice, would be the next American president, would you have believed him? What if the time-traveler had gone on to say that President Trump’s unconventional behavior would get him into hot water and that in 2020 he would become the first president in US history to be impeached and removed from office? Granting the premise, the second proposition is easier to imagine. And yet Trump is highly unlikely to be removed from office. He is in fact favored to be reelected. Just as his victory in 2016 proved more likely than the consensus held at the time, so his reelection in 2020 is more likely than the consensus holds today. The reason comes down to political constraints. First, the bar for removal in the Senate is very high. Second, it is easier for a sitting president to get reelected than it is for the opposition to convince voters to start over with something entirely different. Especially if the economy is in decent shape. In what follows we present our quantitative 2020 election model and our qualitative, constraints-based analysis of the election and likely market responses. Trump's fate is only one factor. But US politics is the chief source of market-relevant global political risk over the next 12-24 months. Not A Lame Duck (Yet) After a harrowing year in which global manufacturing slumped due to China’s tight credit policy and Trump’s trade war, the probability of a US recession is now – tentatively – subsiding (Chart 1). This is good news for Trump, whose presidency is hanging by a thread. Chart 1Recession Averted? Or Trump's Death Knell?
Recession Averted? Or Trump's Death Knell?
Recession Averted? Or Trump's Death Knell?
Chart 2Bookies Expect A Democrat Victory
US Election 2020: Civil War Lite
US Election 2020: Civil War Lite
Betting markets like PredictIt.org suggest that Democrats are slightly more likely than Republicans to win the White House next November (Chart 2). The narrow spread is appropriate given that the balance of evidence is fairly even. However, if there is to be a tilt, it should go the opposite way, i.e. toward Republicans as the incumbent party. The history of US elections since 1860 shows a strong tendency for the incumbent party to hold the White House when the sitting president is running at the head of the ticket. This is especially true when there has not been a recession during the president’s four-year term. It is even true when the ruling party has lost seats in preceding congressional elections, as occurred in 2018 and as is often the case (Chart 3). Other than recession, the biggest exception to the sitting president’s victory – especially in modern times – is when a major scandal has occurred, as with Gerald Ford in 1976. This is clearly relevant to today. In these rare cases the incumbent president’s and incumbent party’s historic reelection rates are both 50/50. The implication of Chart 3 is that Trump’s odds, from a historical point of view, are slightly above 50%. Of course, history does not afford an example of a first-term president being impeached, acquitted, and running for election again.1 Yet this is the most likely outcome today, as there is not an overwhelming popular demand to remove Trump from office. Despite the revelations and public hearings in the impeachment inquiry so far, support for removal stands at 47%, while opposition to removal stands at 45% (Chart 4). In other words, there is no majority in favor of removal, but only a narrow plurality. Removal – nullifying an election result – requires more. Chart 3History Says Trump More Likely To Win Than Not
US Election 2020: Civil War Lite
US Election 2020: Civil War Lite
Chart 4No Consensus On Removal From Office
US Election 2020: Civil War Lite
US Election 2020: Civil War Lite
The spread is conspicuously close to the 46%-to-48% popular vote spread for Trump and Hillary Clinton, respectively, in 2016. The impeachment is not a tsunami of public opposition to the administration. It is a bare-knuckle power struggle: Trump tried to have his top rival investigated and tarred with corruption allegations, the Democrats are retaliating by trying to remove Trump prior to the election. Support for removal will fluctuate, but it will take more than 47% of the population to generate a 67-vote supermajority against Trump in a Republican-held Senate. Republican senators would be taking a grave risk in voting against their base when they have the option of deferring to voters in just 11 months’ time. Both Richard Nixon and Bill Clinton were in their second terms when Congress began moving articles of impeachment: the public had no other recourse in the event that they committed “high crimes and misdemeanors.” Trump is in his first term and is due for the public’s verdict shortly. Nixon resigned when it became clear that grassroots Republicans had lost faith in him and the Senate would not acquit. Trump’s political base has not yet lost faith – his approval among Republicans is still 90%, higher than the average of Republican presidents and at the high end of his term in office (Chart 5). When it comes to the final vote, some Republican senators may defect, but it would take 20 to remove Trump from office. This will require a Nixon-like hemorrhage of support. Remarkably Trump’s general approval rating has not been affected by the impeachment inquiry (Chart 6). His approval rating is still comparable to President Barack Obama’s rating at this stage in his first term (as well as Ronald Reagan’s). While Trump is highly unlikely to break above 50%, he is emphatically not a lame duck … at least not yet. Presidential approval tends to rise as the opposition nomination is settled and the election approaches. If Trump’s approval revives to the 46% of the popular vote he won in 2016, then he remains competitive in the swing states where the election will be fought and won. Chart 5Trump’s Political Base Geared Up For Battle
US Election 2020: Civil War Lite
US Election 2020: Civil War Lite
Chart 6A Precarious Approval Rating
US Election 2020: Civil War Lite
US Election 2020: Civil War Lite
What about the Republicans’ heavy losses in the midterm elections and special elections since 2016? Haven’t national voting trends already condemned Trump and the Republicans to a loss in 2020? Not necessarily. Democrats lost elections more dramatically in 2009-11 than Republicans lost in 2017-19 – both in voter support and turnout (Table 1) – and yet President Obama secured the victory in 2012. Presidential elections are a different beast. Table 1Democrats Suffered More Post-2008 Than Republicans Post-2016 … Yet Obama Won Reelection
US Election 2020: Civil War Lite
US Election 2020: Civil War Lite
Chart 7GOP Governorships At Low End Of Rising Trend
US Election 2020: Civil War Lite
US Election 2020: Civil War Lite
The same goes for Republican losses in recent gubernatorial races. In Kentucky the incumbent governor was a Republican and lost; in Louisiana the incumbent governor was a Democrat and won. The catch is that the number of Republican governors was extremely elevated prior to 2018. Recent losses have merely brought the Republicans back to the bottom of their upward channel as a share of the nation’s 50 governors (Chart 7). Thus while the interim elections are a warning sign to Trump and the GOP, they are not a death knell – as long as the economy rebounds and President Trump’s approval rises as the election approaches. Bottom Line: Trump is not a lame duck yet. His administration is embattled and the impeachment process could permanently damage his standing. But so far his general approval rating and the specific impeachment polling suggest that he will stay in office and remain competitive in the 2020 race. If the election were today he would almost surely lose, but a lot can change in 12 months. If the economy avoids recession, then investors should take reelection as their base case. Cyclical Constraints Will Prevail A recession is the surest way to render a president a lame duck. It does not have to be a technical recession. The contraction in the manufacturing sector – and corresponding cutbacks in lending in the manufacturing-heavy and electorally vital Midwest – are extremely threatening to a president who promised to revive manufacturing and trade (Chart 8). Incumbency, economic growth, failed impeachment, and partial policy victory are enough to win the key swing states. Having declared that “trade wars are good and easy to win,” President Trump will not be able to hide from a deeper slowdown in the industrial heartland. State-level wage growth is positive, but swing states, particularly Trump swing states, are seeing a sharp drop-off from the highs prior to the trade war (Chart 9). The solution is the trade ceasefire being pursued with China. Trump is now in the position of the Federal Reserve Chairman: he can no longer afford to hike (tariff) rates, and the equity market may force him to cut, as long as he can reasonably hope to improve the economy. If the economy is lost, the trade war is back on. Chart 8An Urgent Need For A Trade Ceasefire
An Urgent Need For A Trade Ceasefire
An Urgent Need For A Trade Ceasefire
Chart 9Trump Swing States Took A Hit From The Trade War
Trump Swing States Took A Hit From The Trade War
Trump Swing States Took A Hit From The Trade War
Chart 10Buttigieg And Warren More Favorable Than Others
US Election 2020: Civil War Lite
US Election 2020: Civil War Lite
Are incumbency, economic growth, failed impeachment, and partial policy victories enough to get Trump over the line in the key swing states?2 Subjectively, we think so. The Democrats have to win all of the states they won in 2016 plus Michigan and Florida (or two other states in place of Florida, such as Wisconsin and Pennsylvania). President Trump can afford to lose Michigan and one other state (but not Florida). This assessment has little to do with the Democratic presidential nominee – as yet unknown – and everything to do with whether the incumbent president or party has been fundamentally discredited. Democratic candidates like Senator Elizabeth Warren and Mayor Pete Buttigieg are generally more competitive than consensus holds. Warren, for instance, is one of the few candidates in recent elections who has a net positive favorability rating (Chart 10). But her favorability is not enough to overturn a sitting president – that will most likely require a shock that renders the status quo intolerable. The cyclical constraints on Trump and his opponents are thus clear. What of the structural constraints? Trump’s 2016 victory is often attributed to long-running structural trends in the US such as deindustrialization, immigration, and racial attitudes. The Democrats’ “blue wall” in the Rust Belt crumbled because Trump courted the working-class voter there and/or stoked racial anxieties. The implication, however, is that Trump still has an advantage in these swing states. Older voters and especially white voters have drifted toward Republicans for several years – the trend was interrupted only by the Great Recession, which saw a surge in Democratic support that has now subsided (Chart 11). Chart 11Old And White People Drifting To GOP Over Time ... Excepting The Great Recession
US Election 2020: Civil War Lite
US Election 2020: Civil War Lite
While the white share of the swing states is falling over time, that trend is not sufficient to prevent Trump from winning the Electoral College in the year 2020. Instead the rapidly changing racial and ethnic composition of society should be seen as motivating the attitudes that Trump exploits. Trump’s electoral strategy of maximizing white turnout and support for the Republican Party, which we dubbed “White Hype” in 2016, is still the only way for him to achieve a popular vote victory in 2020, and hence the clearest pathway for him to achieve an Electoral College victory (Chart 12). Needless to say, tensions and controversies over race and immigration will swell in the coming year. Chart 12Electoral College Scenarios Show Trump Win Still Possible
US Election 2020: Civil War Lite
US Election 2020: Civil War Lite
Chart 13Swing State Turnout Follows Unemployment
US Election 2020: Civil War Lite
US Election 2020: Civil War Lite
By the same token, demographic change means that the Democrats can theoretically win by performing no better than they did in 2016 in terms of voter turnout and support rates (see the “Status Quo” scenario in Chart 12). This is a low hurdle for Democrats – suggesting once again that the election will be extremely close, that Trump can win only through the Electoral College (not the popular vote), and that the election outcome will ultimately swing on the cyclical factors outlined above, particularly the state of the economy. A final word about voter turnout. The greatest electoral risk to President Trump is an increase in voter turnout among traditionally low turnout groups that heavily favor the Democratic Party, such as young people and minorities. Given the surge in turnout for the 2018 midterm elections, and the extremely controversial and heated environment surrounding Trump’s presidency, there is considerable reason to suspect that 2020 will be a high-turnout election. Other things being equal, this would likely penalize Trump’s reelection prospects. However, it is important to recognize that voter turnout in swing states is fairly well correlated with the unemployment rate (Chart 13). Depending on the state, surges in turnout occurred in 1992, in the wake of recession; 2004, in the wake of recession, terrorism and war; and 2008, in the wake of the great financial crisis. The exception is Pennsylvania, where a surge in white voter turnout helped Trump pull off a surprise win in the state. Turnout is the hardest political variable to predict, so it is not clear whether Trump’s scandals and impeachment will do the trick. But an increase in the unemployment rate would virtually destroy Trump’s bid, being negatively correlated with presidential approval and positively correlated with voter turnout. Bottom Line: Trump’s executive powers give him the potential to achieve some additional policy victories that could boost his approval rating – namely a trade ceasefire with China that simultaneously improves the economic outlook. Meanwhile structural factors such as demographics do not forbid Trump from winning the Electoral College – on the contrary, aging and the decline in the white share of the population mean that Trump’s electoral strategy could succeed again in 2020, but will be much harder to pull off after 2020. Introducing … BCA’s Geopolitical Strategy 2020 US Presidential Election Model The BCA Geopolitical Strategy Presidential Election Model is a state-by-state model that uses political and economic variables to predict the Electoral College vote. What differentiates our model from that of others is that it attempts to predict the probability of the incumbent party winning the Electoral College votes in each of the 50 states. The model would have predicted the past five elections correctly on an out-of-sample basis, even the controversial win of George W. Bush over Al Gore in 2000. Why do we predict the electoral vote rather than the popular vote? First, the winner of the presidential election is determined by the Electoral College, not the popular vote. Second, in recent history, two candidates who lost the popular vote (George W. Bush in 2000 and Donald Trump in 2016) won the election. It is possible that we will see a similar result in 2020, given President Trump’s low national popularity yet distinctive policy pitch for the Midwestern states (e.g. economic patriotism, hardline on immigration). With only minor exceptions, electoral votes are allocated based on a winner-take-all process, as opposed to proportionately to the popular vote. Hence the best way to forecast the presidential election winner is to predict the probability of winning each state, i.e. receiving all the electoral votes assigned to each state.3 Due to the data availability of our input variables, our sample size includes nine elections (1984 to 2016) across 50 states, making for a total of 450 observations. We designed the model to be as succinct as possible. It includes four explanatory variables: A weighted average of the Federal Reserve Bank of Philadelphia State Leading Index, from the beginning of the previous presidential term until September of the election year. The state leading indexes predict the 6-month growth rate of the state coincident indexes, which include nonfarm payroll employment, average hours worked in manufacturing by production workers, the unemployment rate, and wage and salary disbursements deflated by the consumer price index (U.S. city average).4 Chart 14Voters Make Up Their Minds Ahead Of Time
US Election 2020: Civil War Lite
US Election 2020: Civil War Lite
We use a weighted average of all the monthly forecasts in the presidential term preceding an election, where later months are weighted more heavily than earlier months. Our sample includes 6-month growth rates up to and including September of the election year, which means it includes a rough forecast of the direction of the state’s economy in Q1 of the new president’s term. Since we weigh recent months more heavily, our model assigns more importance to forward-looking factors. It is sufficient to end our calculations of the average state leading indexes in September of the election year. First, the October data comes out in early November, just days before the election, which would be an insufficient lead-time for our final forecast. Second, most voters make their decision at least one month in advance of the election and last-minute changes in economic forecasts will likely not influence their decision (Chart 14). The incumbent party’s margin of victory in the previous presidential election in each state. This is measured as the incumbent party vote share minus the non-incumbent party vote share. Simply put, if the incumbent party failed to secure a solid win in a given state in the previous election, the probability of securing a solid win in the current election is much smaller. Average national approval level of the incumbent president in July of the election year. We tested the correlation between presidential approval in every month leading up to the election versus the election outcome and found that July approval levels have the second-highest correlation with the popular vote and Electoral College vote (Chart 15). Average October approval levels have slightly higher correlation with election outcomes, but not sufficiently so to sacrifice three months of lead-time. A “time for change” variable. This is a categorical variable indicating whether the incumbent party has been in the White House for one or more terms. Academic literature shows that a party that has occupied the White House for two terms or more is much less likely to win an election than a party that is running for a second term.5 Chart 15Voters Mostly Decided By July
US Election 2020: Civil War Lite
US Election 2020: Civil War Lite
The output of our model is the probability of an incumbent win in each state. There are two ways of aggregating these probabilities to produce a national-level outcome: Allocate the number of Electoral College votes won by the incumbent proportionally to their probability of victory in each state, and then sum them up across all states. This method would smooth out potential errors in our forecast. The Republican Party is expected to win with 279 Electoral College votes in 2020. Assume a probability threshold of 50%: any state with an incumbent win that is at least 50% likely is fully assigned to the incumbent. While this method could significantly sway our forecast towards one of the parties because of small changes in probability, it is closer to the political reality. Even the smallest majority in a given state will (usually) result in the winning candidate getting all of the state’s Electoral College votes. We therefore adopt this method in our aggregation.6 Our model performs well in back tests: it correctly predicted every election in in-sample tests and every election from 2000 to 2016 in out-of-sample tests (Chart 16). Chart 16BCA Research Geopolitical Strategy Election Model: Back Tests Accurate
US Election 2020: Civil War Lite
US Election 2020: Civil War Lite
Chart 17 shows our initial 2020 prediction. Overall, the Republican Party is expected to win 279 Electoral College votes, a 25-vote decrease from its 2016 result. Chart 17Trump Narrowly Slated To Win 2020 With 279 Electoral College Votes
US Election 2020: Civil War Lite
US Election 2020: Civil War Lite
As of the latest available data, our model predicts that the Republicans will lose Michigan and Wisconsin (critical victories in 2016). Wisconsin, Pennsylvania, and New Hampshire become borderline or “toss-up” states: the probability of a Republican win in these states is 48.77%, 50.17%, and 46.90%, respectively. Even the smallest change in our inputs can shift these states to either party. The two inputs that can affect our forecast are the state leading index and President Trump’s approval level, since the other two inputs – the time for change variable and last election’s margin of victory – are fixed. Table 2 shows the predicted Electoral College votes for the Republican Party for various scenarios of these two variables. According to the model, President Trump is currently at the lowest level of approval and weakest state-by-state economy that he can afford. If one of these factors stabilizes below today’s level, Trump will lose his reelection bid. Table 2Small Decline In State Economies Could Ruin Trump’s 2020 Bid
US Election 2020: Civil War Lite
US Election 2020: Civil War Lite
In the worst-case scenario for Trump – if his approval and the state leading indexes drop to the lowest levels they have touched in Trump’s presidency – the Republican Party will only manage to secure 230 Electoral College votes. The opposite, optimistic scenario would see them winning with 329 votes. An interesting takeaway from our model is that it captures the increase in American political polarization that has been widely observed by scholars. The 2020 forecast shows that many states will be won or lost by the incumbent party with extreme certainty (0% or 100%). Results of in-sample predictions show that this trend has been increasing since 1992 (Chart 18, top panel), which is also in line with our own measure of polarization (Chart 18, bottom panel). Since the results are based on in-sample estimations, the coefficients remain constant, so the differences in the results can be attributed to the underlying data. The impression of ever-intensifying polarization in the US is correct. What does this mean for Trump? He cannot be written off simply because he has a relatively low approval rating. Structural political factors that propelled him to the White House are still in place. His approval and the economy must deteriorate to change this base case. The chief risk to our model is the accuracy and interpretation of presidential approval polling. While polling data always has a margin of error, it is possible that approval polling is underestimating Trump’s support, particularly on the state level, as was witnessed in 2016 (Chart 19). Chart 18Rising Polarization – It’s Empirical
US Election 2020: Civil War Lite
US Election 2020: Civil War Lite
Chart 19State-Level Polling Still A Risk
State-Level Polling Still A Risk
State-Level Polling Still A Risk
We have a high degree of confidence in professional pollsters, who have also made improvements since 2016. But asking Americans whether they “approve” of the unorthodox Trump may be a different proposition than in the past, disguising voting intentions to some degree. By choosing the level of Trump’s approval in our model (see Appendix), we are guarding against overstating his support and not allowing much room for any dampening effects or self-censorship, which is thus a risk to our model. Bottom Line: Quantitative modeling, entirely independent of our qualitative assessment, suggests that Trump is favored to win the 2020 election. However, he is skating on very thin ice with regard to key cyclical variables such as state-level economic performance and popular approval rating. If his approval level suffers from a slowing economy, or scandal and impeachment, then he will lose the critical toss-up states and the White House. Investment Conclusions In this report we have outlined a case where President Trump, despite his extreme unorthodoxy in general, and acute vulnerability at this moment in time, is still the most likely winner of the 2020 election. Elections are a Bayesian process in which investors should establish a clear prior, or starting place, and update their probabilities according to reliable data streams. This report establishes our prior and our key data streams. So what? Does it matter if Trump is reelected? Is it relevant to investors? From a bird’s eye view, Trump has made a few decisions that clearly distinguish his term in office from that of previous presidents. First, by replacing Janet Yellen with Jerome Powell at the Federal Reserve, Trump arguably accelerated the normalization of monetary policy, which contributed to a rise in bond yields, an increase in market volatility, a strong dollar, and a global slowdown. Second, by embracing sweeping Republican tax reform, Trump initiated pro-cyclical fiscal stimulus that widened the US’s monetary and economic divergence from the rest of the world, while exacerbating the US’s long-term fiscal woes. Third, by adopting protectionist trade policy to confront China’s mercantilism, Trump rattled global sentiment and contributed to a manufacturing recession. As long as our view remains correct, investors will have a base case that is cyclically bullish. Of these three macro developments, the only one that the election could substantially change is trade policy – and yet the Democrats are also taking a more hawkish approach to China. On the fiscal front, the Democrats will raise taxes, but they will not impose austerity – instead they propose large expansions of entitlements that the populace increasingly demands. Populist social spending combined with geopolitical struggle with China ensures that the deficit/GDP ratio will go up regardless of the party in power. From a market point of view, the historical record suggests that presidential elections – specifically elections that lead to gridlock between the White House and Congress, since we do not expect the Democrats to lose the House of Representatives – usually see a rising US stock market beforehand and a higher degree of volatility afterwards (Chart 20). Relative to developed market equities, US stocks typically underperform, and only resume their rise in the second half of the following year (i.e. 2021). Comparing Trump to other first-term presidents, it is clear that his “pluto-populism” (populism plus tax cuts for the rich) has exerted a reflationary effect on the equity market (Chart 21). As long as the data show that he has a fair chance of reelection, investors will have a base case that is cyclically bullish, despite the volatility to come from the Democrats’ taxation and regulation proposals. Chart 20Equity Outcomes Surrounding US Presidential Votes
Equity Outcomes Surrounding US Presidential Votes
Equity Outcomes Surrounding US Presidential Votes
Chart 21Trump A Reason To Be Bullish
Trump A Reason To Be Bullish
Trump A Reason To Be Bullish
What is most striking about Trump’s presidency is the low real total return on US Treasuries. This is despite his aggressive foreign and trade policy, which has motivated safe-haven flows into Treasuries this year (Chart 22). The bottom line is that the output gap is closed, the labor market is tight, and fiscal policy is expansive, putting upward pressure on yields. Given that Trump needs to cultivate a China ceasefire and economic improvement for reelection, this trend should continue until the next recession looms. Chart 22Trump Marks End Of Bull Market In Bonds
Trump Marks End Of Bull Market In Bonds
Trump Marks End Of Bull Market In Bonds
The risk, however, is that Trump’s precarious China negotiations fall through, or that his scandals cause a permanent downshift in his approval rating, rendering him a lame duck. Not only would this free him of the election constraint that currently forces him to pursue pro-market policies, but it would also make a Democratic victory more likely. The Democratic nomination, meanwhile, could easily produce a progressive populist in the figure of Elizabeth Warren, who is still a frontrunner in the Democratic nomination. A bear market could develop quite easily if a normal equity market correction, which improves the odds of a Democratic victory becomes entangled in expectations that Warren is set to win the nomination. If the opposition can summon enough votes to unseat an incumbent president, chances are that the circumstances will include a “blue wave” that also sees the Democrats take the Senate. This would institute another sweeping change to American policy, this time in a direction that is unfriendly to corporate profits. As the probability of such a scenario rises, the equity market will have to discount it. Expectations of a Trump victory will spur the market upward – but investors should be wary. If this very long bull market has continued all the way to November 3, 2020, and President Trump is confirmed in office, the positive stock market reaction will likely provide an excellent time for booking profits and reducing risk. In a second term, Trump will be unshackled from his electoral constraints – very much unlike a first-term Democrat. This would free him to pursue his trade wars with fewer inhibitions – against China but also likely against Europe. A continuation of the trade war has important impacts across the full slate of global assets, as outlined in Chart 23, which depicts the movement of assets on days in which US equities reacted negatively to trade war developments. Chart 23A Trump Second Term Means Trade War With Fewer Constraints
US Election 2020: Civil War Lite
US Election 2020: Civil War Lite
With 11 months to go, we are a world away from the election. The party nomination process, or third-party candidates, could overturn all expectations. But if there is one certainty, it is that polarization and political risk will rise in the coming 12-24 months. The losing side of the population will have deep heartburn. A crisis of legitimacy could easily haunt the next administration. There could be hanging chads, vote recounts, faithless electors, or contested results. The outcome of the election could turn upon unprecedented developments in the Electoral College, Supreme Court, or even in cyberspace. If the Democrats win, redistribution will amplify partisanship. If Trump wins, inequality will rise. There is no easy way forward for the United States. Matt Gertken Vice President Geopolitical Strategist mattg@bcaresearch.com Ekaterina Shtrevensky Research Analyst ekaterinas@bcaresearch.com Appendix 1: The Approval Question: Level Or Change? Chart 24Trump’s Historically Low Approval Rating
US Election 2020: Civil War Lite
US Election 2020: Civil War Lite
The chief risk to our model is the interpretation of the presidential approval rating and its impact on the election. President Trump’s approval rating is notoriously low compared to the average president (Chart 24). While many authors use approval rating (or popularity) in their models, some argue that it is not the approval level, but the change in approval leading up to the election that matters.7 Consider the following: if President Trump’s approval increases from today’s level of 43% by 5%, he would be at the same level of approval as the average president if their approval were to drop by 5%. A model based on approval level would place these two presidents equally, while a model based on the change in approval would favor Trump. So which one is correct? We compare the incumbent’s popular vote in post-WWII elections with four different “variations” of incumbent president approval: the average level in July of the election year (as in our model); the deviation of the average October level from the election-year average, the change during the last two years of the term; and the range throughout the entire term. Directionally, the results are as expected. Level and change in approval are positively correlated with the popular vote, while a less stable approval (higher range) is negatively correlated (Chart 25A). We also find that approval level has the best fit with the election outcome, followed by the change in approval in the two years leading up to the election. However, if we restrict the sample size to the range of elections used in our model, 1984 to 2016, we find that the change in approval has a much better fit than the level (Chart 25B). In other words, in modern elections the presidential candidate’s momentum matters more in the final outcome. Chart 25AHigh, Rising, And Stable Approval Ratings …
US Election 2020: Civil War Lite
US Election 2020: Civil War Lite
Chart 25B… Help Presidents Win Elections
US Election 2020: Civil War Lite
US Election 2020: Civil War Lite
We tested each variation of approval as an input in our model instead of the July approval level. Table 3 summarizes the results. Trump wins in all four versions. Table 3All Measures Of Approval Favor Trump In 2020
US Election 2020: Civil War Lite
US Election 2020: Civil War Lite
Our current model penalizes Trump the most, while the model based on approval range favors him. This makes sense, given that President Trump’s approval is relatively low but very stable (Chart 26). Chart 26Trump Approval Very Low … And Very Stable
US Election 2020: Civil War Lite
US Election 2020: Civil War Lite
We will continue to use approval level in our model to generate updated predictions, given that this measure has the best long-term historical fit with the election outcome. However, given that President Trump is performing relatively well on these other measures of approval, there is upside risk to his 2020 performance. Appendix 2: A Word About The Probit Model Table 4 presents the regression coefficients of our model. Since this is a probit model, the coefficients cannot be directly interpreted as they would in an ordinary regression. The coefficients in a probit regression model measure the change in the Z-score associated to each independent variable for a one-unit change in that variable. Table 4BCA 2020 US Presidential Election Model Statistics
US Election 2020: Civil War Lite
US Election 2020: Civil War Lite
The sign of the coefficient corresponds to the direction of change in probability. So increases in the state leading index, presidential approval, or the incumbent’s margin of victory in the last election increase the probability of the incumbent winning a state. Of course, the latter variable is fixed and will not change until the election. At the same time, having occupied the White House for two terms or more decreases the probability of an incumbent win. But this is not the case in the current election. Footnotes 1 Andrew Johnson, the first to be impeached, did not run in 1868; Ulysses Grant bowed out after two terms in 1876, amid the “Great Barbecue” scandal; Warren Harding died before the election of 1924, amid the infamous “Teapot Dome” scandal; Harry Truman stepped down amid scandal after two terms in 1952; Richard Nixon resigned before the election of 1976; Bill Clinton was impeached and hit the two-term limit before the election of 2000. For these examples, and the electoral impact of great scandals in general, please see Allan J. Lichtman, Predicting The Next Presidency: The Keys To The White House 2016 (Rowman and Littlefield, 2016). 2 Trump’s policy record contains one major legislative victory, the Tax Cut and Jobs Act of 2017, along with a number of works in progress. The Republicans’ failed attempt to repeal and replace the Affordable Care Act (Obamacare) exacted an opportunity cost: it deprived Trump and the GOP Congress of time needed to legislate a southern border wall, while mobilizing the opposition for all subsequent elections. As for other policies, the renegotiation of NAFTA is only a partial success as the USMCA has not been ratified. The promised infrastructure package will become a campaign pledge for the second term. We expect some kind of North Korea deal. 3 To this end, we use a probit model, where the dependent variable is stated as 1 = incumbent party won all Electoral College votes in this state, or 0 = incumbent party did not win any Electoral College votes in this state. This model allows us to measure the probability that a state with certain characteristics will fall into one of these two categories. 4 “The leading index for each state predicts the six-month growth rate of the state’s coincident index. In addition to the coincident index, the models include other variables that lead the economy: state-level housing permits (1 to 4 units), state initial unemployment insurance claims, delivery times from the Institute for Supply Management (ISM) manufacturing survey, and the interest rate spread between the 10-year Treasury bond and the 3-month Treasury bill.” See the Federal Reserve Bank of Philadelphia, www.philadelphiafed.org. 5 Alan I. Abramowitz, “Forecasting the 2008 Presidential Election with the Time-for-Change Model,” Political Science and Politics, Vol. 41, No. 4 (Oct., 2008), pp. 691-695. 6 We also assume that the Democrats always win the District of Columbia. 7 Please see Michael S. Lewis-Beck, Charles Tien, “Forecasting presidential elections: When to change the model,” International Journal of Forecasting, Volume 24, Issue 2, April–June 2008, Pages 227-236, and Mark Zandi, Dan White, Bernard Yaros, “2020 Presidential Election Model,” Moody’s Analytics, September 2019.