Elections

Highlights Our top five geopolitical “Black Swans” are risks that the market is seriously underpricing. With the “phase one” trade deal signed, Chinese policy could become less accommodative, resulting in a negative economic surprise. The trade deal may fall victim to domestic politics, raising the risk of a US-China military skirmish. A Biden victory at the Democratic National Convention or a Democratic takeover of the White House could trigger social unrest and violence in the US. A pickup in the flow of migrants to Europe would fundamentally undermine political stability there. Russia’s weak economy will add fuel to domestic unrest, risking an escalation beyond the point of containment. Feature Over the past four years, we have started off the year with our top five geopolitical “Black Swans.” These are low-probability events whose market impact would be significant enough to matter for global investors. Unlike the great Byron Wien’s perennial list of market surprises, we do not assign these events a “better than 50% likelihood of happening.” We offer risks that the market is seriously underpricing by assigning them only single-digit probabilities when we think the reality is closer to 10%-15%, a level at which a risk premium ought to be assigned. Some of our risks below are so obscure that it is not clear how exactly to price them. We exclude issues that are fairly probable, such as flare-ups in Indo-Pakistani conflict. The two major risks of the year – discussed in our annual outlook – are that either US President Donald Trump or Chinese President Xi Jinping overreaches in a major way. But what would truly surprise the market would be a policy-induced relapse in Chinese growth or a direct military clash between the two great powers. That is how we begin. Other risks stem from domestic affairs in the US, Europe, and Russia. Black Swan 1: China’s Financial Crisis Begins The risk of Xi Jinping’s concentration of power in his own person is that individuals can easily make mistakes, especially if unchecked by advisors or institutions. Lower officials will fear correcting or admonishing an all-powerful leader. Inconvenient information may not be relayed up the hierarchy. Such behavior was rampant in Chairman Mao Zedong’s time, leading to famine among other ills. Insofar as President Xi’s cult of personality successfully imitates Mao’s, it will be subject to similar errors. If President Xi overreaches and makes a policy mistake this year, it could occur in economic policy or other policies. We begin with economic policy, as we have charted the risks of Xi’s crackdown on the financial system since early 2017 (Chart 1). Chart 1A Crackdown On Financial Risk Could Cause China's Economy To Derail
A Crackdown On Financial Risk Could Cause China's Economy To Derail
A Crackdown On Financial Risk Could Cause China's Economy To Derail
Chart 2Easing Of Trade Tensions May Re-Incentivize Tighter Policy
Easing Of Trade Tensions May Re-Incentivize Tighter Policy
Easing Of Trade Tensions May Re-Incentivize Tighter Policy
This year is supposed to be the third and final year of Xi Jinping’s “three battles” against systemic risk, pollution, and poverty. The first battle actually focuses on financial risk, i.e. China’s money and credit bubble. The regime has compromised on this goal since mid-2018, allowing monetary easing to stabilize the economy amid the trade war. But with a “phase one” trade deal having been signed, there is an underrated risk that economic policy will return to its prior setting, i.e. become less accommodative (Chart 2). When Xi launched the “deleveraging campaign” in 2017, we posited that the authorities would be willing to tolerate an annual GDP growth rate below 6%. This would not only cull excesses in the economy but also demonstrate that the administration means business when it says that China must prioritize quality rather than quantity of growth. While Chinese authorities are most likely targeting “around 6%” in 2020, it is entirely possible that the authorities will allow an undershoot in the 5.5%-5.9% range. They will argue that the GDP target for 2020 has already been met on a compound growth rate basis (Chart 3), as astute clients have pointed out. They may see less need for stimulus than the market expects. Chart 3Chinese Authorities Might Tolerate A Growth Undershoot In 2020
Chinese Authorities Might Tolerate A Growth Undershoot In 2020
Chinese Authorities Might Tolerate A Growth Undershoot In 2020
Similarly, while urban disposable income is ostensibly lagging its target of doubling 2010 levels by 2020, China’s 13th Five Year Plan, which concludes in 2020, conspicuously avoided treating urban and rural income targets separately. Chart 4Lower Impetus For Economic Support Due To Improvements In National Income?
Lower Impetus For Economic Support Due To Improvements In National Income?
Lower Impetus For Economic Support Due To Improvements In National Income?
Chart 5Has China's Stimulus Peaked?
Has China's Stimulus Peaked?
Has China's Stimulus Peaked?
If the authorities focus only on general disposable income, then they are on track to meet their target (Chart 4). This would reduce the impetus for greater economic support. There are already tentative signs that Chinese authorities are “satisfied” with the amount of stimulus they have injected: some indicators of money and credit have already peaked (Chart 5). The crackdown on shadow banking has eased, but informal lending is still contracting. The regime is still pushing reforms that shake up state-owned enterprises. The Xi administration may aim only for stability, not acceleration, in the economy. An added headwind for the Chinese economy stems from the currency. The currency should track interest rate differentials. Beijing’s incremental monetary stimulus, in the form of cuts to bank reserve requirement ratios (RRRs), should also push the renminbi down over time (Chart 6). However, an essential aspect of any trade deal with the Trump administration is the need to demonstrate that China is not competitively devaluing. Hence the CNY-USD could overshoot in the first half of the year. This is positive for global exports to China, but it tightens Chinese financial conditions at home. A stronger than otherwise justified renminbi would add to any negative economic surprises from less accommodative monetary and fiscal policy. Conventional wisdom says China will stimulate the economy ahead of two major political events: the centenary of the Communist Party in 2021 and the twentieth National Party Congress in 2022. The former is a highly symbolic anniversary, as Xi has reasserted the supremacy of the party in all things, while the latter is more significant for policy, as it is a leadership reshuffle that will usher in the sixth generation of China’s political elite. But conventional wisdom may be wrong – the Xi administration may aim only for stability, not acceleration, in the economy. It would make sense to save dry powder for the next US or global recession. The obvious implication is that China’s economic rebound may lose steam as early as H2 – but the black swan risk is that negative surprises could cause a vicious spiral inside of China. This is a country with massive financial and economic imbalances, a declining potential growth profile, and persistent political obstacles to growth both at home and abroad. Corporate defaults have spiked sharply. While the default rate is lower than elsewhere, the market may be sniffing out a bigger problem as it charges a much higher premium for onshore Chinese bonds (Chart 7). Chart 6CNY-USD Overshoot Would Tighten Chinese Financial Conditions
CNY-USD Overshoot Would Tighten Chinese Financial Conditions
CNY-USD Overshoot Would Tighten Chinese Financial Conditions
Chart 7Is China's Bond Market Sniffing Out A Problem?
Is China's Bond Market Sniffing Out A Problem?
Is China's Bond Market Sniffing Out A Problem?
Bottom Line: Our view is that China’s authorities will remain accommodative in 2020 in order to ensure that growth bottoms and the labor market continues to improve. But Beijing has compromised its domestic economic discipline since 2018 in order to fight trade war. The risk now, with a “phase one” deal in hand, is that Xi Jinping returns to his three-year battle plan and underestimates the downward pressures on the economy. The result would be a huge negative surprise for the Chinese and global economy in 2020. Black Swan 2: The US And China Go To War In 2013, we predicted that US-China conflict was “more likely than you think.” This was not just an argument for trade conflict or general enmity that raises the temperature in the Asia-Pacific region – we included military conflict. Chart 8Americans' Attitudes Toward China Plunged …
Five Black Swans In 2020
Five Black Swans In 2020
At the time, the notion that a Sino-American armed conflict was the world’s greatest geopolitical threat seemed ludicrous to many of our clients. We published this analysis in October of that year, months after the Islamic State “Soldier’s Harvest” offensive into Iraq. Trying to direct investors to the budding rivalry between American and Chinese naval forces in the South China Sea amidst the Islamic State hysteria was challenging, to say the least. The suggestion that an accidental skirmish between the US and China could descend into a full-blown conflict involved a stretch of the imagination because China was not yet perceived by the American public as a major threat. In 2014, only 19%of the US public saw China as the “greatest threat to the US in the future.” This came between Russia, at 23%, and Iran, at 16%. Today, China and Russia share the top spot with 24%. Furthermore, the share of Americans with an unfavorable view of China has increased from 52% to 60% in the six intervening years (Chart 8). The level of enmity expressed by the US public toward China is still lower than that toward the Soviet Union at the onset of the Cold War in the 1950s (Chart 9). However, the trajectory of distrust is clearly mounting. We expect this trend to continue: anti-China sentiment is one of the few sources of bipartisan agreement remaining in Washington, DC (Chart 10). Chinese sentiment toward the United States has also darkened dramatically. The geopolitical rivalry is deepening for structural reasons: as China advances in size and sophistication, it seeks to alter the regional status quo in its favor, while the US grows fearful and seeks to contain China. Chart 9… But Not Yet To War-Inducing Levels
Five Black Swans In 2020
Five Black Swans In 2020
Chart 10Distrust Of China Is Bipartisan
Five Black Swans In 2020
Five Black Swans In 2020
Chart 11Newfound American Concern For China’s Repression
Five Black Swans In 2020
Five Black Swans In 2020
One example of rising enmity is the US public’s newfound concern for China’s domestic policies and human rights, specifically Beijing’s treatment of its Uyghur minority in Xinjiang. A Google Trends analysis of the term “Uyghur” or “Uyghur camps” shows a dramatic rise in mentions since Q2 of 2018, around the same time the trade war ramped up in a major way (Chart 11). While startling revelations of re-education camps in Xinjiang emerged in recent years, the reality is that Beijing has used heavy-handed tactics against both militant groups and the wider Uyghur minority since at least 2008 – and much earlier than that. As such, the surge of interest by the general American public and legislators – culminating in the Uyghur Human Rights Policy Act of 2019 – is a product of the renewed strategic tension between the two countries. The “phase one” trade deal risks falling victim to domestic politics due to greater public engagement in foreign policy. The same can be said for Hong Kong: the US did not pass a Hong Kong Human Rights and Democracy Act in 2014, during the first round of mass protests, which prompted Beijing to take heavy-handed legal, legislative, and censorship actions. It passed the bill in 2019, after the climate in Washington had changed. Why does this matter for investors? There are two general risks that come with a greater public engagement in foreign policy. First, the “phase one” trade deal between China and the US could fall victim to domestic politics. This deal envisions a large step up in Sino-American economic cooperation. But if China is to import around $200 billion of additional US goods and services over the next two years – an almost inconceivable figure – the US and China will have to tamp down on public vitriol. This is notably the case if the Democratic Party takes over the White House, given its likely greater focus on liberal concerns such as human rights. And yet the latest bills became law under President Trump and a Republican Senate, and we fully expect a second Trump term to involve a re-escalation of trade tensions to ensure compliance with phase one and to try to gain greater structural concessions in phase two. Second, mounting nationalist sentiment will make it more difficult for US and Chinese policymakers to reduce tensions following a potential future military skirmish, accidental or otherwise. While our scenario of a military conflict in 2013 was cogent, the public backlash in the United States was probably manageable.1 Today we can no longer guarantee that this is the case. China has greater control over the domestic narrative and public discourse, but the rise of the middle class and the government’s efforts to rebuild support for the single-party regime have combined to create an increase in nationalism. Thus it is also more difficult for Chinese policymakers to contain the popular backlash if conflict erupts. In short, the probability of a quick tamping down of public enmity is actively being reduced as American public vilification of China is closing the gap with China’s burgeoning nationalism at an alarming pace. Chart 12Tsai Ing-Wen Enjoys A Greater Mandate On Higher Turnout …
Five Black Swans In 2020
Five Black Swans In 2020
Another of our black swan risks – Taiwan island – is inextricably bound up in this dangerous US-China dynamic. To be clear, Washington will tread carefully, as a conflict over Taiwan could become a major war. Nevertheless Taiwan’s election, as we expected, has injected new vitality into this already underrated geopolitical risk. It is not only that a high-turnout election (Chart 12) gave President Tsai Ing-wen a greater mandate (Chart 13), or that her Democratic Progressive Party retained its legislative majority (Chart 14). It is not only that the trigger for this resounding victory was the revolt in Hong Kong and the Taiwanese people’s rejection of the “one country, two systems” formula for Taiwan. It is also that Tsai followed up with a repudiation of the mainland by declaring, “We don’t have a need to declare ourselves an independent state. We are an independent country already and we call ourselves the Republic of China, Taiwan.” Chart 13… Popular Support …
Five Black Swans In 2020
Five Black Swans In 2020
Chart 14… And A Legislative Majority
Five Black Swans In 2020
Five Black Swans In 2020
This statement is not a minor rhetorical flourish but will be received as a major provocation in Beijing: the crystallization of a long-brewing clash between Beijing and Taipei. Additional punitive economic measures against Taiwan are now guaranteed. Saber-rattling could easily ignite in the coming year and beyond. Taiwan is the epicenter of the US-China strategic conflict. First, Beijing cannot compromise on its security or its political legitimacy and considers the “one China principle” to be inviolable. Second, the US maintains defense relations with Taiwan (and is in the process of delivering on a relatively large new package of arms). Third, the US’s true willingness to fight a war on Taiwan’s behalf is in doubt, which means that deterrence has eroded and there is greater room for miscalculation. Bottom Line: A US-China military skirmish has been our biggest black swan risk since we began writing the BCA Geopolitical Strategy. The difference between then and now, however, is that the American public is actually paying attention. Political ideology – the question of democracy and human rights – is clearly merging with trade, security, and other differences to provoke Americans of all stripes. This makes any skirmish more than just a temporary risk-off event, as it could lead to a string of incidents or even protracted military conflict. Black Swan 3: Social Unrest Erupts In America There are numerous lessons that one can learn from the ongoing unrest in Hong Kong, but perhaps the most cogent one is that Millennials and Generation Z are not as docile and feckless as their elders think. Images of university students and even teenagers throwing flying kicks and Molotov cocktails while clad in black body armor have shocked the world. Perhaps all those violent video games did have a lasting impact on the youth! What is surprising is that so few commentators have made the cognitive leap from the ultra-first world streets of Hong Kong to other developed economies. Perhaps what is clouding analysts’ minds is the idiosyncratic nature of the dispute in Hong Kong, the “one China” angle. However, Hong Kong youth are confronted with similar socio-economic challenges that their peers in other advanced economies face: overpriced real estate and a bifurcated service-sector labor market with few mid-tier jobs that pay a decent wage. In the US, Millennials and Gen Z are also facing challenges unique to the US. First, their debt burden is much more toxic than that of the older cohorts, given that it is made up of student loans and credit card debt (Chart 15). Second, they find themselves at odds – demographically and ideologically – with the older cohorts (Chart 16). Chart 15Younger American Cohorts Plagued By Toxic Debt
Five Black Swans In 2020
Five Black Swans In 2020
Chart 16Younger And Older Cohorts At Odds Demographically
Five Black Swans In 2020
Five Black Swans In 2020
The adage that the youth are apolitical and do not turn out to vote may have ended thanks to President Trump. The 2018 midterm election, which the Democratic Party successfully turned into a referendum on the president, saw the youth (18-29) turnout nearly double from 20% to 36% (the 30-44 year-old cohort also saw a jump in turnout from 35.6% to 48.8%). The election saw one of the highest turnouts in recent memory, with a 53.4% figure, just two points off the 2016 general election figure (Chart 17). Chart 17Massive Turnout To The 2016 Referendum On Trump
Five Black Swans In 2020
Five Black Swans In 2020
Despite the high turnout in 2018, the-most-definitely-not-Millennial Vice President Joe Biden continues to lead the Democratic Party in the polls. Chart 18Biden Unpopular Among Young American Voters
Five Black Swans In 2020
Five Black Swans In 2020
Chart 19Bookies Pulled Down "Uncle Joe's" Odds, Capturing Democratic Party Zeitgeist
Five Black Swans In 2020
Five Black Swans In 2020
His probability of winning the nomination is not overwhelming, but it is the highest of any contender. In recent polls, Biden comes third place in Millennial/Gen-Z vote preferences (Chart 18). Yet he is hardly out of contention, especially for the 30-44 year-old cohort. The view that “Uncle Joe” does not fit the Democratic Party zeitgeist has become so entrenched in the Democratic Party narrative that it became conventional wisdom last year, pulling oddsmakers and betting markets away from the clear frontrunner (Chart 19). As such, a Biden victory at the Democratic National Convention in Milwaukee, Wisconsin on July 13-16 may come as an affront to the left-wing activists who will surely descend on the convention. This will particularly be the case if Biden wins despite the progressive candidates amassing a majority of overall delegates, which is possible judging by the combined progressive vote share in current polling (Chart 20). He would arrive in Milwaukee without clearing the 1990 delegate count required to win on the first ballot. On the second ballot, his presidency would then receive a boost from “superdelegates” and those progressives who are unwilling to “rock the boat,” i.e. unify against an establishment candidate with the largest share of votes. This is also how Mayor Michael Bloomberg could pull off a surprise win. Chart 20Progressives Come Closest To Victory
Five Black Swans In 2020
Five Black Swans In 2020
Such a “brokered” – or contested – convention has not occurred since 1952. However, several Democratic Party conventions came close, including 1968, 1972, and 1984. The 1968 one in Chicago was notable for considerable violence and unrest. Even if the Milwaukee Democratic Party convention does not produce unrest, it could sow the seeds for unrest later in the year. First, a breakout Biden performance in the primaries is unlikely. As such, he will likely need to pledge a shift to the left at the convention, including by accepting a progressive vice-presidential candidate. Second, an actual progressive may win the primary. Chart 21Zealots In Both Parties Perceive Each Other As A National Threat
Five Black Swans In 2020
Five Black Swans In 2020
It is likely that either of the two options would be seen as an existential threat to many of Trump’s loyal supporters across the United States. President Trump’s rhetoric often paints the scenario of a Democratic takeover of the White House in apocalyptic terms. And data suggests that the zealots in both parties perceive each other as a “threat to the nation’s wellbeing” (Chart 21). The American Civil War in the nineteenth century began with the election of a president. This is not just because Abraham Lincoln was a particularly reviled figure in the South, but because the states that ultimately formed the Confederacy saw in his election the demographic writing-on-the-wall. The election was an expression of a general will that, from that point onwards, was irreversible. Given demographic trends in the US today, it is possible that many would see in Trump’s loss a similar fait accompli. If one perceives progressive Democrats as an existential threat to the US constitution, rebellion is the obvious and rational response. There is a risk of rebellion from Trump’s most ardent supporters if he loses the White House. Bottom Line: Year 2020 may be a particularly violent one for the US. First, left wing activists may be shocked and angered to learn that Joe Biden (or Bloomberg) is the nominee of the Democratic Party come July. With so much hype behind the progressive candidates throughout the campaign, Biden’s nomination could be seen as an affront to what was supposed to be “the big year” for left-wing candidates. Second, investors have to start thinking about what happens if Biden – or a progressive candidate – goes on to defeat President Trump in the general election. While liberal America took Trump’s election badly, it has demographics – and thus time – on its side. Trump’s most ardent supporters may conclude that his defeat means the end of America as they know it. Black Swan 4: Europe’s Migration Crisis Restarts Chart 22Decline In Illegal Immigration Dampened European Populism
Five Black Swans In 2020
Five Black Swans In 2020
It is a testament to Europe’s resilience that we do not have a Black Swan scenario based on an election or a political crisis set on the continent in 2020. Support for the common currency and the EU as a whole has rebounded to its highest since 2013. Even early elections in Germany and Italy are unlikely to produce geopolitical risk. The populists in the former are in no danger of outperforming whereas the populists in the latter barely deserve the designation. But what if one of the reasons for the surge in populism – unchecked illegal immigration – were to return in 2020? The data suggests that the risk of migrant flows has massively subsided. From its peak of over a million arrivals in 2015, the data shows that only 125,472 migrants crossed into Europe via land and sea routes in the Mediterranean last year (Chart 22). Why? There are five reasons that we believe have checked the flow of migrants: Supply: The civil wars in Syria, Iraq, and Libya have largely subsided. Heterogenous regions, cities, and neighborhoods have been ethnically cleansed and internal boundaries have largely ossified. It is unlikely that any future conflict will produce massive outflows of refugees as the displacement has already taken place. These countries are now largely divided into armed, ethnically homogenous, camps. Enforcement: The EU has stepped up border enforcement since 2015, pouring resources into the land border with Turkey and naval patrols across the Mediterranean. Individual member states – particularly Italy and Hungary – have also stepped up border enforcement policy. While most EU member states have publicly chided both for “draconian” policies, there is no impetus to force Rome and Budapest to change policy. Libyan Imbroglio: Conflict in Libya has flared up in 2019 with military warlord Khalifa Haftar looking to wrest control from the UN-backed Government of National Accord led by Fayez al-Serraj. The Islamic State has regrouped in the country as well. Ironically, the conflict is helping stem the flow of migrants as African migrants from sub-Saharan countries dare not cross into Libya as they did in 2015 when there was a brief lull in fighting. Turkish benevolence: Ankara is quick to point out that it is the only thing standing between Europe and a massive deluge of migrants. Turkey is said to host somewhere between two and four million refugees from various conflicts in the Middle East. Fear of the crossing: If crossing the Mediterranean was easy, Europe would have experienced a massive influx of migrants throughout the twentieth century. Not only is it not easy, it is costly and quite deadly, with thousands lost each year. Furthermore, most migrants are not welcomed when they arrive to Europe, many are held in terrible conditions in holding camps in Italy and Greece. Over time, migrants who made it into Europe have reported these dangers and conditions, reducing the overall demand for illegal migration. We do not foresee these five factors changing, at least not all at once. However, there are several reasons to worry about the flow of migrants in 2020. US-Iran tensions have sparked outright military action, while unrest is flaring up across Iran’s sphere of influence. Going forward, Iran could destabilize Iraq or fuel Shia unrest against US-backed regimes. Second, Afghanistan has been the source of most migrants to Europe via sea and land Mediterranean routes – 19.2%. The conflict in the country continues and may flare up with President Trump’s decision to formally withdraw most US troops from the country in 2020. Third, a break in fighting in Libya may encourage sub-Saharan migrants to revisit routes to Europe. Migrants from Guinea, Cote d’Ivoire, and the Democratic Republic of Congo make up over 10% of migrants to Europe. Finally, Turkish relationship with the West could break up further in 2020, causing Ankara to ship migrants northward. We highly doubt that President Erdogan will risk such a break, given that 50% of Turkish exports go to Europe. A European embargo on Turkish exports – which would be a highly likely response to such an act – would crush the already decimated Turkish economy. Bottom Line: While we do not see a return to the 2015 level of migration in 2020, we flag this risk because it would fundamentally undermine political stability in Europe. Black Swan 5: Russia Faces A “Peasant Revolt” Our fifth and final black swan risk for the year stems from Russia. This risk may seem obvious, since the US election creates a dynamic that revives the inherent conflict in US-Russian relations. Russia could seek to accomplish foreign policy objectives – interfering in US elections, punishing regional adversaries. The Trump administration may be friendly toward Russia but Trump is unlikely to veto any sanctions passed by the House and Senate in an election year, should an occasion for new sanctions arise. Conversely Russia could anticipate greater US pressure if the Democrats win in November. Yet it is Russia’s domestic affairs that represent the real underrated risk. Putin’s fourth term as president has been characterized by increased focus on domestic political control and stability as opposed to foreign adventurism. The creation of a special National Guard in 2016, reporting directly to Putin and responsible for quelling domestic unrest, symbolizes the shift in focus. So too does Russia’s adherence to the OPEC 2.0 regime of production control to keep oil prices above their budget breakeven level. Meanwhile Putin’s courting of Europe for the Nordstream II pipeline, and his slight peacemaking efforts with Ukraine, has suggested a slightly more restrained international posture. Chart 23Sluggish Wage Growth Threatens Russian Stability
Sluggish Wage Growth Threatens Russian Stability
Sluggish Wage Growth Threatens Russian Stability
Strategically it makes little sense for Russia to court negative attention at a time when the US and Europe are at odds over trade and the Middle East, the US is preoccupied with China and Iran, and Russia itself faces mounting domestic problems. The domestic problems are long in coming. The central bank has maintained a stringent monetary policy for the better part of the decade. Despite cutting interest rates recently, monetary and credit conditions are still tight, hurting domestic demand. Moscow has also imposed fiscal austerity, namely by cutting back on state pensions and hiking the value added tax. Real wage growth is weak (Chart 23), retail sales are falling, and domestic demand looks to weaken further, as Andrija Vesic of BCA Emerging Markets Strategy observes in a recent Special Report. The effect of Russia’s policy austerity has been a drop in public approval of the administration (Chart 24). Protests erupted in 2019 but were largely drowned out by the larger and more globally significant protests in Hong Kong. These were met by police suppression that has not removed their underlying cause. Putin’s first major decision of the new year was to reshuffle the government, entailing Prime Minister Dmitri Medvedev’s transfer to a new post and the appointment of a new cabinet. This move reveals the need to show some accountability to reduce popular pressure. While Moscow now has room to cut interest rates and ease fiscal policy, it is behind the curve and the weak economy will add fuel to domestic unrest. Meanwhile Putin’s efforts to alter the Russian constitution so he can stay in power beyond current term limits, effectively becoming emperor for life, like Xi Jinping, should not be dismissed merely because they are expected. They reflect a need to take advantage of Putin’s popular standing to consolidate domestic political power at a time when the ruling United Russia party and the federal government face discontent. They also ensure that strategic conflict with the United States will take on an ideological dimension. Chart 24Austerity Weighed On The Administration's Popularity In Russia
Austerity Weighed On The Administration's Popularity In Russia
Austerity Weighed On The Administration's Popularity In Russia
Chart 25Russian Political Risk Is Unsustainably Low
Russian Political Risk Is Unsustainably Low
Russian Political Risk Is Unsustainably Low
Russia's recent cabinet shakeup is positive from the point of view of economic reform. And the country's monetary and fiscal room provide a basis for remaining overweight equities within EM, as our Emerging Markets Strategy recommends. However, Russian equities have rallied hard and the political risk is understated. Bottom Line: It is never easy predicting Putin’s next international move. Our market-based indicators of Russian political risk have hit multi-year lows, but both the domestic and international context suggest that these lows will not be sustained (Chart 25). A new bout of risk can emanate from Putin, or from changes in Washington, or from the Russian people themselves. What would take the world by surprise would be domestic unrest on a larger scale than Russia can easily suppress through the police force. Housekeeping We are closing our long European Union / short Chinese equities strategic trade with a 1.61% loss since inception on May 10, 2019. Dhaval Joshi of BCA’s European Investment Strategy downgraded the Eurostoxx 50 to underweight versus the S&P 500 and the Nikkei 225 this week. He makes the point that the Euro Area bond yield 6-month impulse hit 100 bps – a critical technical level – and will be a strong headwind to growth. We will look to reopen this trade at a later date when the euphoria over the “phase one” trade deal subsides, as we still favor European equities and DM bourses over EM. We will reinstitute our long Brent crude H2 2020 versus H2 2021 tactical position, which was stopped out on January 9, 2020. We remain bullish on oil fundamentals and expect Middle East instability to add a political risk premium. China's stimulus and the oil view also give reason for us to reinitiate our long Malaysian equities relative to EM as a tactical position. The Malaysian ringgit will benefit as oil prices move higher, helping Malaysian companies make payments on their large pile of dollar-denominated debt and improving household purchasing power. Higher oil prices also correlate with higher equity prices, while China's stimulus and the US trade ceasefire will push the US dollar lower and help trade revive in the region. Marko Papic Consulting Editor marko@bcaresearch.com Matt Gertken Vice President Geopolitical Strategist mattg@bcaresearch.com Footnotes 1 Observe how little attention the public paid to US-China saber-rattling around China’s announcement of an Air Defense Identification Zone in the East China Sea that year.
Highlights Duration: Despite recent setbacks, global growth looks set to improve and policy uncertainty set to ease during the next couple of months. Both will conspire to push bond yields higher. Investors should maintain below-benchmark portfolio duration. US political risks could flare again around mid-year, sending yields lower. TIPS: We recommend that investors enter TIPS breakeven curve flatteners, both because short-term inflation expectations will respond more quickly than long-term expectations to stronger realized inflation data and to hedge against the risk of an oil supply shock. High-Yield: Investors should add (or increase) exposure to the high-yield energy sector, within an overweight allocation to junk bonds. Junk energy spreads are attractive, and exposure to the sector will mitigate the impact of a potential oil supply shock. Feature Only a month ago, investors were becoming more optimistic about a global growth rebound and the US/China phase 1 trade deal was pushing political risk into the background. Both of those factors caused the 10-year Treasury yield to rise throughout December, hitting an intra-day Christmas Eve peak of 1.95% (Chart 1). But since then, softer global PMI data and the US/Iranian military conflict brought global growth concerns and political risk back to the fore, breaking the uptrend in yields. Chart 1Bond Bear On Pause
Bond Bear On Pause
Bond Bear On Pause
Global growth and political uncertainty are two of the five macro factors that we identify as important for US bond yields.1 And despite the recent setback, we think both factors will push yields higher in the coming months. Global Growth We have found that the Global Manufacturing PMI, the US ISM Manufacturing PMI and the CRB Raw Industrials index are the three global growth indicators that correlate most strongly with US bond yields. One reason for the recent pullback in yields is the disappointing December data from the Global and US Manufacturing PMIs. The ISM Manufacturing PMI moved deeper into recessionary territory. The Global Manufacturing PMI had been in a clear uptrend since mid-2019, but fell back to 50.1 in December, from 50.3 the month before (Chart 2). The US and Chinese PMIs also declined in December, though they remain well above the 50 boom/bust line (Chart 2, panels 3 & 4). The Eurozone and Japanese PMIs, meanwhile, are still in the doldrums (Chart 2, panels 2 & 5). More worrying than the small tick down in Global PMI is the US ISM Manufacturing PMI moving deeper into recessionary territory, from 48.1 to 47.2. However, we have good reason to think that stronger data are just around the corner (Chart 3). Chart 2Global PMI Ticks Down
Global PMI Ticks Down
Global PMI Ticks Down
Chart 3ISM Manufacturing Index Will Rebound
ISM Manufacturing Index Will Rebound
ISM Manufacturing Index Will Rebound
First, the difference between the new orders and inventories components of the ISM index often leads the overall index at turning points, 2016 being a prime example (Chart 3, top panel). Much like in 2016, a gap is opening up between new orders-less-inventories and the overall ISM. Second, the non-manufacturing ISM index remains strong despite the weakness in manufacturing (Chart 3, panel 2). With no contagion to the service sector of the economy, we’d expect manufacturing to pick back up. Third, the ISM Manufacturing index has diverged sharply from the Markit Manufacturing PMI, with the Markit index printing well above the ISM (Chart 3, panel 3).2 The ISM index has been more volatile than the Markit index in recent years, and should trend toward the Markit index over time. Fourth, regional Fed manufacturing surveys have generally been stronger than the ISM during the past few months. A simple regression model of the ISM index based on data from regional Fed surveys suggests that the ISM index should be at 49.7 today, instead of 47.2 (Chart 3, bottom panel). Finally, unlike the PMI surveys, the CRB Raw Industrials index has increased quite sharply in recent weeks (Chart 4). We should note that it is not the CRB index itself but rather the ratio between the CRB index and gold that tracks bond yields most closely, and this ratio has actually declined lately due to the strength in gold. Nonetheless, a sustained turnaround in the CRB index would mark a big change from 2019 and would send a strong bond-bearish signal. Chart 4CRB Sends A Bond-Bearish Signal
CRB Sends A Bond-Bearish Signal
CRB Sends A Bond-Bearish Signal
Political Uncertainty The second factor that sent bond yields lower during the past few weeks was the military conflict between the US and Iran. Tensions appear to have de-escalated for now, and we would expect any flight-to-quality flows to unwind during the next few weeks.3 But while we see policy uncertainty easing in the near-term, sending bond yields higher, we reiterate our view that US political uncertainty is the number one risk factor that could derail the 2020 bear market in bonds.4 Specifically, we see two looming US political risks. The first relates to President Trump’s re-election odds. For now, Trump’s approval rating is in line with past incumbent presidents that have won re-election (Chart 5). But if his approval doesn’t keep pace in the coming months, he will try to do something to change his fortunes. That could mean re-igniting the trade war with China, or once again ramping up tensions with Iran. A Bernie Sanders or Elizabeth Warren victory would send a flight-to-quality into bonds. The second risk is that one of the progressive candidates – Bernie Sanders or Elizabeth Warren – secures the Democratic nomination for president. Right now, both trail Joe Biden in the polls and betting markets (Chart 6), but things could change rapidly as the primary results come in during the next few months. The stock market would certainly sell off if an Elizabeth Warren or Bernie Sanders presidency seems likely, sending a flight to quality into bonds.5 Chart 5Trump’s Approval Rating Must Rise
Bond Market Implications Of An Oil Supply Shock
Bond Market Implications Of An Oil Supply Shock
Chart 6Democratic Nomination Betting Odds
Democratic Nomination Betting Odds
Democratic Nomination Betting Odds
Bottom Line: Despite recent setbacks, global growth looks set to improve and policy uncertainty set to ease during the next couple of months. Both will conspire to push bond yields higher. Investors should maintain below-benchmark portfolio duration. US political risks could flare again around mid-year, sending yields lower. Playing An Oil Supply Shock In US Bond Markets US/Iranian military tensions are easing for now, but could flare again in the future. For that reason, it’s worth considering how US bond markets would respond in the event of a conflict between the US and Iran that removed a significant amount of the world’s oil supply from the market, causing the oil price to spike. The first implication is that US bond yields would fall. Even though it’s tempting to say that the inflationary impact of higher oil prices would push yields up, this effect would not dominate the flight-to-quality into US bonds that would result from the increase in political uncertainty. Case in point, Chart 1 shows that, while the inflation component of yields was stable as tensions flared during the past few weeks, it didn’t come close to offsetting the drop in the 10-year real yield. Beyond the impact on Treasury yields, there are two other segments of the US bond market that would be materially impacted by an oil supply shock: the TIPS breakeven inflation curve and corporate bond spreads. Buy TIPS Breakeven Curve Flatteners Table 1CPI Swap Curve Sensitivity To Oil
Bond Market Implications Of An Oil Supply Shock
Bond Market Implications Of An Oil Supply Shock
When considering the impact of an oil supply shock on TIPS breakeven inflation rates, we first look at how the cost of inflation protection is influenced by changes in the oil price. Table 1 shows the sensitivity of weekly changes in different CPI swap rates to a $1 increase in the price of Brent crude oil. We use CPI swap rates instead of TIPS breakeven inflation rates because data are available for a wider maturity spectrum. Our analysis applies equally to the TIPS breakeven inflation curve. Two conclusions are apparent from Table 1. First, the entire CPI swap curve is positively correlated with the oil price, a higher oil price moves CPI swap rates higher and vice-versa. Second, the sensitivity of CPI swap rates to the oil price is greater at the short-end of the curve than at the long-end. This is fairly intuitive given that higher oil prices are inflationary in the short-term but could be deflationary in the long-run if they hamper economic growth. Chart 7Coefficients Stable Over Time
Coefficients Stable Over Time
Coefficients Stable Over Time
Chart 7 shows that our two main conclusions are not dependent on the chosen time horizon. The 2-year CPI swap rate is positively correlated with the oil price for our entire sample period, as is the 10-year rate except for a brief window in 2014. The 2-year rate’s sensitivity is also consistently higher than the 10-year’s. Based on this analysis, we can suggest two good ways to hedge against the risk of an oil supply shock that sends prices higher: Buy inflation protection, either in the CPI swaps market or by going long TIPS versus duration-equivalent nominal Treasuries. Buy CPI swap curve (or TIPS breakeven inflation curve) flatteners.6 But we can introduce one more wrinkle to our analysis. Oil prices can rise because of stronger demand or because a shock suddenly removes supply from the market. It’s possible that the cost of inflation protection behaves differently in each case. Fortunately, the New York Fed has made an attempt to distinguish between those two scenarios. In its weekly Oil Price Dynamics Report, the Fed decomposes Brent oil price changes into demand-driven changes and supply-driven changes.7 It does this by looking at how other financial assets respond to oil price changes each week. Chart 8 shows the cumulative change in the Brent oil price since 2010, along with the New York Fed’s supply and demand factors. According to the Fed, demand has pressured the oil price higher since 2010, but this has been more than offset by greater supply. Chart 8Supply & Demand Oil Price Decomposition
Supply & Demand Oil Price Decomposition
Supply & Demand Oil Price Decomposition
Using the New York Fed’s supply and demand series, we look at how CPI swap rates respond to higher oil prices in three different scenarios. First, we identify 252 weeks when demand and supply both contributed to higher oil prices. Second, we identify 95 weeks when higher oil prices were driven solely by demand. Finally, and most pertinently, we identify 92 weeks when higher oil prices were driven only by supply (Table 2). Table 2Weekly Change In CPI Swap Rate When Brent Oil Price Increases
Bond Market Implications Of An Oil Supply Shock
Bond Market Implications Of An Oil Supply Shock
Results for the ‘Demand & Supply Driven’ and ‘Demand Driven’ scenarios are consistent with our results from Table 1. CPI swap rates across the entire curve move higher more than half the time, with greater increases at the short-end of the curve. However, the scenario we are most interested in is the ‘Supply Driven’ scenario. Presumably, a military conflict with Iran that took oil supply off the market would lead to less supply and also a decrease in global demand. Results for this scenario are more mixed. The 1-year CPI swap rate still rises 60% of the time, but rates further out the curve are somewhat more likely to fall. With this in mind, CPI swap curve or TIPS breakeven curve flatteners look like the best way to hedge against an oil supply shock, better than an outright long position in inflation protection. This is good news, since we have previously argued that owning TIPS breakeven curve flatteners is a good idea even without an oil supply shock.8 Corporate bond excess returns respond positively to changes in the oil price. We recommend that investors enter TIPS breakeven curve flatteners, both because short-term inflation expectations will respond more quickly than long-term expectations to stronger realized inflation data and to hedge against the risk of an oil supply shock. Buy Energy Junk Bonds Table 3Corporate Bond Sensitivity To Oil
Bond Market Implications Of An Oil Supply Shock
Bond Market Implications Of An Oil Supply Shock
Corporate bonds are the second segment of the US fixed income market that could be materially impacted by an oil supply shock, particularly bonds in the energy sector. To assess the potential value of corporate bonds as a hedge, we repeat the above analysis but use weekly corporate bond excess returns versus duration-matched Treasuries instead of CPI swap rates. Table 3 shows that investment grade and high-yield corporate bond returns both respond positively to changes in the oil price. Further, we see that energy bonds are more sensitive to the oil price, outperforming the overall index when the oil price rises, and vice-versa. Chart 9 shows that, while oil price sensitivities vary considerably over time, they are almost always positive. Also, energy sector sensitivity has been consistently above that of the benchmark index since 2014. Chart 9Betas Mostly Positive
Betas Mostly Positive
Betas Mostly Positive
Going one step further, we once again use the New York Fed’s supply and demand decomposition to identify weeks when supply and/or demand was responsible for higher oil prices. Because we have more historical data for corporate bonds than for CPI swaps, this time we identify 340 weeks when both supply and demand drove the oil price higher, 123 weeks when only demand drove it higher and 142 weeks when only supply was responsible for the higher oil price (Table 4). Table 4Weekly Corporate Bond Excess Returns (BPs) When Brent Oil Price Increases
Bond Market Implications Of An Oil Supply Shock
Bond Market Implications Of An Oil Supply Shock
Results for the ‘Demand & Supply Driven’ and ‘Demand Driven’ scenarios show that higher oil prices boost excess returns to both investment grade and high-yield corporate bonds more than half the time. Energy bonds also tend to outperform their respective benchmark indexes in the ‘Demand & Supply Driven’ scenario, but perform roughly in-line with the benchmark in the ‘Demand Driven’ scenario. But once again, it is the ‘Supply Driven’ scenario that we are most interested in. Here, we see that an oil supply disruption that leads to higher oil prices also leads to lower corporate bond excess returns. This is true for both the investment grade and high-yield indexes and for energy bonds in both rating categories. However, we also note that high-yield energy debt significantly outperforms the overall junk index during these “risk off” periods. In contrast, investment grade energy debt is not a clear outperformer. Chart 10HY Energy Spreads Are Very Attractive
HY Energy Spreads Are Very Attractive
HY Energy Spreads Are Very Attractive
These results line up with our intuition. When oil prices are driven higher by demand it could simply be a sign of strong economic growth and not any specific trend related to the energy sector. As such, we’d expect all corporate bonds to perform well in those scenarios, but wouldn’t necessarily expect energy debt to outperform. However, supply disruptions in the Middle East directly benefit US shale oil players, whose debt is principally found in the high-yield energy sector. The investment grade energy sector is less exposed to the US shale space, and its documented outperformance in the ‘Supply Driven’ scenario is weaker as a result. We already recommend an overweight allocation to high-yield bonds and a neutral allocation to investment grade corporates. Within that overweight allocation to high-yield bonds, we recommend shifting some exposure toward the energy sector for two reasons. First, high-yield energy was severely beaten-down last year and is ripe for a rebound if global economic growth recovers, as we expect (Chart 10). Second, our analysis suggests that an allocation to energy will help mitigate losses in the event of a renewed flaring of US/Iranian tensions that removes oil supply from the market. Bottom Line: We recommend that investors initiate TIPS breakeven curve flatteners (or CPI swap curve flatteners) and add exposure to the high-yield energy sector. Both positions look attractive on their own terms, but will also help hedge the risk of an oil supply disruption if US/Iranian tensions flare back up in the months ahead. Ryan Swift US Bond Strategist rswift@bcaresearch.com Footnotes 1 The others are: the output gap, the US dollar and sentiment. For more details please see US Bond Strategy Weekly Report, “Bond Kitchen”, dated April 9, 2019, available at usbs.bcaresearch.com 2 The Markit index is used in the construction of the Global PMI shown in Chart 2, 3 For more details on the politics behind the US/Iran conflict please see Geopolitical Strategy Special Alert, “A Reprieve Amid The Bull Market In Iran Tensions”, dated January 8, 2020, available at gps.bcaresearch.com 4 Please see US Bond Strategy Special Report, “2020 Key Views: US Fixed Income”, dated December 10, 2019, available at usbs.bcaresearch.com 5 Please see Global Investment Strategy Weekly Report, “Elizabeth Warren And The Markets”, dated September 13, 2019, available at gis.bcaresearch.com 6 In the TIPS market, an example of a breakeven curve flattener would be to buy 2-year TIPS and short the 2-year nominal Treasury note, while also buying the 10-year nominal Treasury note and shorting the 10-year TIPS. 7 https://www.newyorkfed.org/research/policy/oil_price_dynamics_report 8 Please see US Bond Strategy Weekly Report, “Position For Modest Curve Steepening”, dated October 29, 2019, available at usbs.bcaresearch.com Fixed Income Sector Performance Recommended Portfolio Specification
Highlights Global Investment Strategy View Matrix
Time For A Breather
Time For A Breather
Receding trade tensions; diminished risks of a hard Brexit; reduced odds of a victory for Elizabeth Warren in the US presidential elections; liquidity injections by most major central banks; and improved sentiment about the state of the global economy all helped push stocks higher late last year. Some clouds have formed over the outlook since the start of the year, however. The December US ISM manufacturing index fell to the lowest level since 2009, while the PMIs in the euro area, UK, and Japan gave up some of their November gains. The conflict between the US and Iran also flared up. Although tensions have abated in recent days, BCA’s geopolitical strategists worry that the détente may not last. The US is seeking to shift its military focus towards East Asia in order to counter China’s ascendency. They argue that this could create a dangerous power vacuum in the Middle East. Stock market sentiment is quite bullish at the moment, which makes equities more vulnerable to any disappointing news. While we are maintaining our positive 12-month view on global equities and high-yield credit in anticipation that global growth will rebound convincingly later this year, we are downgrading our tactical 3-month view to neutral. Ho Ho Ho After handing investors a sack of coal last Christmas, Santa was back to his true self this past holiday season. Global equities rose 3.4% in December, finishing the year off with a stellar fourth quarter which saw the MSCI All-Country World index surge by 8.6%. Five forces helped push stocks higher: 1) Receding trade tensions; 2) Diminished risks of a hard Brexit; 3) Reduced odds of a victory for Elizabeth Warren in the US presidential elections; 4) Liquidity injections by the Fed, ECB, and the People’s Bank of China; and arguably most importantly 5) Improved sentiment about the state of the global economy. Tarrified No More Trade tensions subsided sharply after China and the US reached a “Phase One” agreement. The deal prevented tariffs from rising on December 15th on $160 billion of Chinese imports. It also rolls back the tariff rate from 15% to 7.5% on about $120 billion in imports that have been subject to levies since September (Chart 1). Chart 1The Evolution Of The US-China Trade War
The Evolution Of The US-China Trade War
The Evolution Of The US-China Trade War
In addition, the Trump Administration allowed the November 13th deadline on European auto tariffs to lapse. This suggests that the US is unlikely to impose tariffs under the Section 232 investigation of auto imports. The auto sector has been at the forefront of the global manufacturing slowdown, so any good news for that industry is welcome. To top it all off, the US House of Representatives ratified the USMCA, the successor to NAFTA, on December 19th. We expect it to be signed into law in the first quarter of this year. Brexit Risks Fading... Chart 2The Majority Of British Voters Aren't Keen On Brexit
The Majority Of British Voters Aren't Keen On Brexit
The Majority Of British Voters Aren't Keen On Brexit
Boris Johnson’s commanding victory in the UK elections has given him the votes necessary to push a withdrawal bill through parliament by the end of the month. The British government will then seek to negotiate a free trade agreement by the end of the year. A “no-deal” Brexit is unacceptable to the majority of British voters (Chart 2). As such, the Johnson government will have no choice but to strike a deal with the EU. ... While Trump Gains On the other side of the Atlantic, President Trump’s re-election prospects improved late last year despite (and perhaps because of) the ongoing impeachment process. There is an uncanny correlation between the probability that betting markets assign to a Trump victory and the value of the S&P 500 (Chart 3). Chart 3An Uncanny Correlation
An Uncanny Correlation
An Uncanny Correlation
Chart 4Who Will Win The 2020 Democratic Nomination?
Time For A Breather
Time For A Breather
It certainly has not hurt market sentiment that Elizabeth Warren’s poll numbers have been dropping recently (Chart 4). Warren’s best hope was to squeeze out Bernie Sanders as soon as possible, thereby leaving the far-left populist lane all to herself. That dream appears to have been dashed, which suggests that even if Trump loses, a centrist like Joe Biden could emerge as president. An Uneasy Truce It remains to be seen how President Trump’s decision to assassinate General Qassem Soleimani, a top Iranian commander, will affect the election outcome. A YouGov/HuffPost poll taken over the weekend revealed that 43% of Americans approved of the airstrike against Soleimani compared to 38% that disapproved.1 History suggests that the public’s patience for war will quickly wear thin if it results in American casualties or significantly higher gasoline prices. Neither side has an incentive to allow the conflict to spiral out of control. Foreign minister Mohammad Javad Zarif tweeted on Tuesday shortly after Iran lobbed missiles at two US military bases that Iran had “concluded” its retaliatory strike, adding that “We do not seek escalation or war.” Despite claims on Iranian public television that 80 “American terrorists” were killed in the attacks, no US troops were harmed. This suggests that the Iranians may be putting on a show for domestic consumption. The US economy is less vulnerable to spikes in oil prices than in the past. Nevertheless, plenty of things could still go wrong. BCA’s geopolitical team, led by Matt Gertken, has argued that the US is seeking to shift its military focus towards East Asia in order to counter China’s ascendency. This could create a dangerous power vacuum in the Middle East. There is also a risk that President Trump overplays his hand. Contrary to the President’s claims, Soleimani was quite popular in Iran (Chart 5). If Trump begins to mock the Iranian leadership’s feeble response, Iran will have no choice but to take more aggressive action. Chart 5Soleimani Was More Popular In Iran Than Trump Claims
Time For A Breather
Time For A Breather
Chart 6US Economy Is Less Vulnerable To Spikes In Oil Prices Than In The Past
US Economy Is Less Vulnerable To Spikes In Oil Prices Than In The Past
US Economy Is Less Vulnerable To Spikes In Oil Prices Than In The Past
One thing that could embolden Trump is that the US economy is less vulnerable to spikes in oil prices than in the past. US oil output reached as high as 12.9 mm b/d in 2019, allowing the country to become a net exporter of oil for the first time in history (Chart 6). Any increase in oil prices would incentivize further domestic production, which would help bring prices back down. The US economy has also become less energy intensive – it takes less than half as much oil to produce a unit of GDP today than it did in the early 1980s. Finally, unlike in the past, the Fed will not need to raise rates in response to higher oil prices due to the fact that inflation expectations are currently well anchored. In fact, as we discuss below, we expect the Fed and other central banks to continue to provide a tailwind for growth over the course of 2020. The Fed’s “It’s Not QE” QE Program The jump in overnight lending rates in mid-September torpedoed the Federal Reserve’s efforts to shrink its balance sheet. Thanks to a steady stream of Treasury bill purchases since then, the Fed’s asset holdings have swelled by over $400 billion, reversing more than half of the decline observed since early 2018 (Chart 7). Chart 7Fed's Asset Holdings Are Growing Anew
Fed's Asset Holdings Are Growing Anew
Fed's Asset Holdings Are Growing Anew
Chart 8The Fed's Balance-Sheet Expansion Helped Fuel The Dot-Com Bubble
The Fed's Balance-Sheet Expansion Helped Fuel The Dot-Com Bubble
The Fed's Balance-Sheet Expansion Helped Fuel The Dot-Com Bubble
The Fed has insisted that its latest intervention does not amount to a new QE program, stressing that it is buying short-term securities rather than long-dated bonds. In so doing, it is simply creating bank reserves, rather than seeking to suppress the term premium by altering the maturity structure of the private sector’s holdings of government debt. Nevertheless, even such straightforward interventions have proven to be powerful signaling tools. By growing its balance sheet, a central bank is implicitly promising to keep monetary policy very accommodative. It is worth remembering that the run-up in the NASDAQ in 1999 coincided with a significant balance-sheet expansion by the Fed in response to Y2K fears, which came on the heels of three “insurance cuts” in 1998 (Chart 8). Gentle Jay Paves The Way Chart 9Inflation Expectations Remain Muted
Inflation Expectations Remain Muted
Inflation Expectations Remain Muted
In 2000, the Fed moved quickly to reverse the liquidity injection it had orchestrated the prior year. We do not expect such a reversal anytime soon. Moreover, unlike in 2000, when the Federal Reserve kept raising rates – ultimately bringing the Fed funds rate up to 6.5% in May 2000 – the Fed is likely to stay on hold this year. The Fed’s ongoing strategic policy review is poised to move the central bank even closer towards explicitly adopting an average inflation target of 2% over the course of a business cycle. Since inflation tends to fall during recessions, this implies that the Fed will seek to target an inflation rate somewhat higher than 2% during expansions. Realized core PCE inflation has averaged only 1.6% since the recession ended. Both market-based and survey-based measures of long-term inflation expectations remain downbeat (Chart 9). This suggests that the bar for raising rates this year is quite high. More Monetary Easing In The Euro Area And China Chart 10Chinese Monetary Easing Should Help Global Growth Bottom Out
Chinese Monetary Easing Should Help Global Growth Bottom Out
Chinese Monetary Easing Should Help Global Growth Bottom Out
The ECB resumed its QE program in November after a 10-month hiatus. While the current pace of €20 billion in monthly asset purchases is well below the prior pace of €80 billion, the central bank did say it would continue buying assets for “as long as necessary” to bring inflation up to its target. The language harkens back to Mario Draghi’s 2012 “whatever it takes” pledge, this time applied to the ECB’s inflation mandate. Not to be outdone, the People’s Bank of China cut the reserve requirement ratio by 50 basis points last week, a move that will release RMB 800 billion ($US 115 billion) of fresh liquidity into the banking system. Historically, cuts in reserve requirements have led to faster credit growth and ultimately, to stronger economic growth both in China and abroad (Chart 10). The PBOC has also instructed lenders to adopt the Loan Prime Rate (LPR) as the new benchmark lending rate. The LPR currently sits 20bps below the old benchmark rate (Chart 11). Hence, the PBOC’s order amounts to a stealth rate cut. Our China strategists expect further reductions in the LPR over the next six months. In addition, the crackdown on shadow bank lending seems to be subsiding, which bodes well for overall credit growth later this year (Chart 12). Chart 11China: Stealth Monetary Easing
China: Stealth Monetary Easing
China: Stealth Monetary Easing
Chart 12Crackdown On Shadow Banking In China Is Easing
Crackdown On Shadow Banking In China Is Easing
Crackdown On Shadow Banking In China Is Easing
Rising Economic Confidence Chart 13Recession Fears Amongst Economists Began To Gather Steam At The Start Of Last Year
Recession Fears Amongst Economists Began To Gather Steam At The Start Of Last Year
Recession Fears Amongst Economists Began To Gather Steam At The Start Of Last Year
Chart 14The Wider Public Was Also Worried About A Downturn
The Wider Public Was Also Worried About A Downturn
The Wider Public Was Also Worried About A Downturn
At the start of 2019, nearly half of US CFOs thought the economy would be in a recession by the end of the year. Similarly, two-thirds of European CFOs and four-fifths of Canadian CFOs expected their respective economies to succumb to recession. Professional economists were equally dire (Chart 13). Households also became increasingly worried about a downturn. Google searches for “recession” spiked to near 2009-highs last summer (Chart 14). The mood has certainly improved since then. According to the latest Duke CFO survey, optimism about the economic outlook has increased. More importantly, CFO optimism about the prospects for their own firms has risen to the highest level in the 18-year history of the survey (Chart 15). Chart 15CFOs Have Become More Optimistic Of Late
CFOs Have Become More Optimistic Of Late
CFOs Have Become More Optimistic Of Late
Show Me The Money Going forward, global growth needs to accelerate in order to validate the improved confidence of CFOs and investors alike. We think that it will, thanks to the lagged effects from the easing in financial conditions in 2019, a turn in the global inventory cycle, a de-escalation in the trade war, easier fiscal policy in the UK and euro area, and re-upped fiscal/credit stimulus in China. For now, however, the economic data remains mixed. On the positive side, household spending is still robust across most of the world, a fact that has been reflected in the resilience of service-sector PMIs (Chart 16). Chart 16AThe Service Sector Has Remained Resilient (I)
The Service Sector Has Remained Resilient (I)
The Service Sector Has Remained Resilient (I)
Chart 16BThe Service Sector Has Remained Resilient (II)
The Service Sector Has Remained Resilient (II)
The Service Sector Has Remained Resilient (II)
Chart 17US Wage Growth Has Picked Up, Especially At The Bottom Of The Income Distribution
Time For A Breather
Time For A Breather
Chart 18US Housing Backdrop Is Solid
US Housing Backdrop Is Solid
US Housing Backdrop Is Solid
The US consumer, in particular, is showing little signs of fatigue. The Atlanta Fed GDPNow estimates that real personal consumption grew by 2.4% in the fourth quarter, having increased at an average annualized pace of 3% in the first three quarters of 2019. Both a strong labor market and housing market have buoyed US consumption. Payrolls have risen by an average of 200K per month for the past six months, double what is necessary to keep up with labor force growth. This week’s strong ADP release – which featured a 29K jump in jobs in goods-producing industries in December, the best since April – suggests that today’s jobs report will remain healthy. In addition, wage growth has picked up, particularly at the bottom of the income distribution (Chart 17). Residential construction has also been strong. Homebuilder sentiment reached the best level since June 1999 (Chart 18). Global Manufacturing: Too Early To Call The All-Clear The outlook for manufacturing remains the biggest question mark in the global economy. The US ISM manufacturing index dropped to 47.2 in December, its lowest level since June 2009. The composition of the report was poor, with the new orders-to-inventory ratio dropping close to recent lows. Chart 19Other US Manufacturing Gauges Are Not As Weak As The ISM
Other US Manufacturing Gauges Are Not As Weak As The ISM
Other US Manufacturing Gauges Are Not As Weak As The ISM
We would discount the ISM report to some extent. The regional Fed manufacturing indices have not been nearly as disappointing as the ISM (Chart 19). The Markit PMI, which tracks US manufacturing activity better than the ISM, clocked in at a respectable 52.4 in December, down only slightly from November’s reading of 52.6. Nevertheless, it is hard to be excited about the near-term outlook for US manufacturing, especially in light of Boeing’s decision to suspend production of the 737 Max temporarily. Most estimates suggest that the production halt will reduce real US GDP growth by 0.3%-to-0.5% in the first quarter. The euro area manufacturing PMI gave up some of its November gains, falling to 46.3 in December. While the index is still above its September low of 45.7, it has been under 50 for 11 straight months now. The UK and Japanese PMI also retreated. Chinese manufacturing has shown clearer signs of bottoming out. Despite dipping in December, the private sector Caixin manufacturing PMI remains near its 2017 highs. The official PMI published by the National Bureau of Statistics is less upbeat, but still managed to come in slightly above 50 in December. The production subcomponent reached the highest level since August 2018. Reflecting the positive trend in the Chinese economy, Korean exports to China rose by 3.3% in December, the first positive growth rate in 14 months (Chart 20). Taiwan’s exports have also rebounded. The manufacturing PMI rose above 50 in both economies in December. In Taiwan’s case, this was the first time the PMI moved into expansionary territory since September 2018. On balance, we continue to expect global manufacturing to recover in 2020. This is in line with our observation that global manufacturing cycles typically last three years, with 18 months of weaker growth followed by 18 months of stronger growth (Chart 21). That said, the weakness in European and US manufacturing (at least judged by the ISM) is likely to give investors pause. Chart 20Some Positive Signs Emerging From Korea And Taiwan
Time For A Breather
Time For A Breather
Chart 21A Fairly Regular Three-Year Manufacturing Cycle
A Fairly Regular Three-Year Manufacturing Cycle
A Fairly Regular Three-Year Manufacturing Cycle
Investment Conclusions We turned bullish on stocks in late 2018, having temporarily moved to the sidelines during the summer of that year. Global equities have gained 25% since our upgrade. We see another 10% of upside for 2020, led by European and EM bourses. Despite its recent gains, the real value of the MSCI All-Country World Index is only 3% above its prior peak in January 2018. The 12-month forward PE ratio of 16.3 is still somewhat lower than it was back then. The valuation picture is even more enticing if we compare equity earnings yields with bond yields, which is tantamount to computing a rough equity risk premium (ERP). The global ERP remains quite high by historic standards, especially outside the US where earnings yields are higher and bond yields are generally lower (Chart 22). Chart 22The Equity Risk Premium Is Fairly High, Especially Outside The US
The Equity Risk Premium Is Fairly High, Especially Outside The US
The Equity Risk Premium Is Fairly High, Especially Outside The US
Chart 23Stock Market Sentiment Is Quite Bullish
Stock Market Sentiment Is Quite Bullish
Stock Market Sentiment Is Quite Bullish
Nevertheless, sentiment is quite positive towards stocks at the moment (Chart 23). Elevated bullish sentiment, against the backdrop of ongoing uncertainty about the outlook for global manufacturing and an uneasy truce between the US and Iran, poses a near-term headwind to risk assets. As such, while we are maintaining our positive 12-month view on global equities and high-yield credit, we are downgrading our tactical 3-month view to neutral for the time being. We do not regard this as a major realignment of our views; we will turn tactically bullish again if stocks dip about 5% from current levels. Peter Berezin Chief Global Strategist peterb@bcaresearch.com Footnotes 1 Ariel Edwards-Levy, “Here's What Americans Think About Trump's Iran Policy,” TheHuffingtonPost.com (January 6, 2020). MacroQuant Model And Current Subjective Scores
Time For A Breather
Time For A Breather
Strategic Recommendations Closed Trades
Highlights The US and Iran are not rushing into a full-scale war for the moment – and yet the bull market in US-Iran tensions will continue for at least the next 2-3 years (Chart 1). This means that while global risk assets can take a breather from Iran geopolitical risk – if not other risks to the heady rally – the breather is not a fundamental resolution and Iran will remain market-relevant in 2020. A Reprieve … Chart 1Bull Market In US-Iran Tensions
Bull Market In US-Iran Tensions
Bull Market In US-Iran Tensions
On January 8 President Donald Trump spoke at the White House in response to a barrage of missiles fired by the Iranian Revolutionary Guards Corps (IRGC) at bases with US troops in al-Asad and Erbil, Iraq. Trump remarked that Iran “appears to be standing down,” judging by the fact that the missile strikes did not kill American citizens – Trump’s explicit red line – or cause any significant casualties or damage. Iran’s Foreign Minister Javad Zarif claimed that Iran’s strikes “concluded proportionate measures” in response to the US killing of Quds Force chief Qassem Soleimani in Baghdad on January 3, which itself followed unrest at the US embassy in Baghdad and American strikes on Iran-backed Iraqi militias (Map 1). Supreme Leader Ayatollah Ali Khamenei gave ambivalent comments, saying military operations were not in themselves sufficient but that Iran must focus on removing the US presence from the region. Map 1US And Iran Sparring Across The Region
A Reprieve Amid The Bull Market In Iran Tensions
A Reprieve Amid The Bull Market In Iran Tensions
President Trump’s speech was transparently a campaign speech, not a war speech. He did not imply in any way that the US military would retaliate to the missile strikes, but said Americans should be “grateful and happy” that Iran did a “good thing” for the world by refraining from drawing American blood. Instead Trump focused on Iran’s nuclear program, denouncing the 2015 nuclear deal with Iran (the Joint Comprehensive Plan of Action or JCPA). He implored the parties of that agreement – the UK, Germany, France, Russia, and China – to join him in negotiating a new deal to replace it. The goal of the new negotiations would be to prevent Iran from ever obtaining a nuclear weapon and to halt its sponsorship of regional militants in exchange for economic development and opening up to the outside world. He called for NATO to take a more active role in the Middle East and he highlighted the US’s shared interest with Iran in combating the Islamic State in Iraq and Syria. The takeaway is that the Trump administration is not pursuing regime change but rather nuclear non-proliferation and a change in Iran’s regional behavior. The administration has often said as much, but the assassination of Soleimani escalated tensions and called into question Trump’s intentions. Financial markets will cheer the successful reestablishment of US deterrence vis-à-vis Iran, as it makes Iran less likely to retaliate to US pressure in ways that lead to a major military confrontation. The near-term risk of a massive oil supply shock will decline. Oil prices have already fallen back to where they stood before Soleimani’s death. … Amid A Bull Market In US-Iran Tensions Yet the saga does not end here. Iran’s ineffectual military strike could have been a feint, or Iran could follow up with more consequential retaliation later. Chart 2US Strategic Deleveraging From The Middle East
US Strategic Deleveraging From The Middle East
US Strategic Deleveraging From The Middle East
Iran has the ability to dial up its nuclear program step by step, sponsor regional attacks with plausible deniability, and foment regional unrest in important oil-producing countries. It can do these things in ways that do not clearly cross America’s red lines but still cause market-relevant tensions or disrupt oil supply. After all, Iran is still under punitive sanctions and desirous of demoralizing the US to hasten its departure from the region. So far Iran has not irreversibly abandoned its nuclear commitments or crossed any red lines regarding levels of uranium enrichment, but we fully expect it to threaten to do so and use its nuclear program to build up negotiating leverage. We doubt any serious US-Iran negotiations will take shape until 2021 at the earliest – and any negotiations could fail and lead to another, more serious round of military exchanges. This means that today’s reprieve may be tomorrow’s negative surprise for the markets. The fundamental basis for this bull market in US-Iran tensions is that the US is seeking to withdraw its strategic commitment to the region to counter China (Chart 2), yet Iran is filling the power vacuum and could conceivably create a regional empire (Map 2). President Trump will not want to appear to have been chased out of Iraq in an election year, even if he is in favor of strategic deleveraging, but Iran may try to do exactly that. Iran will also try to solidify its influence among those left exposed by the US’s deleveraging, namely in Iraq. Map 2Iran's Strategic 'Land Bridge' To The Mediterranean
A Reprieve Amid The Bull Market In Iran Tensions
A Reprieve Amid The Bull Market In Iran Tensions
Chart 3A Succession Crisis Looms
A Succession Crisis Looms
A Succession Crisis Looms
Moreover President Donald Trump’s withdrawal from the 2015 nuclear deal sowed deep distrust between the US and Iran and discredited the reformist faction in Tehran, which faces a tough election in February. This makes it difficult for the two countries to find a new equilibrium anytime soon. The Iranian regime is at a crossroads. It has a large and restless youth population (Chart 3), an economy under crippling sanctions, and faces a leadership succession in the coming years that brings enormous uncertainties about economic policy and regime survival. At the same time, President Trump is a historically unpopular president who is being impeached and believes that showing a strong hand against terrorism – under which the US classifies Iran’s Revolutionary Guard as well as the Islamic State – is an important key to being re-elected in November. Terrorism and immigration are in fact the two clearest issues that got him elected (Chart 4). Economic growth is a necessary but not sufficient condition for his reelection. US-Iran tensions will persist at least until the US election is settled and likely beyond. The result is a cyclical increase in tensions between the two countries that will persist at least until after the US election is settled. The Iranians are loathe to reward President Trump for his tactics – it would be better for Tehran if Washington changed parties again. After November, the US and Iran will recalibrate. Ultimately, in the coming years, either President Trump will get a new deal, or a new Democratic administration will reinitiate diplomacy to update the JCPA, or “maximum pressure” tactics will persist and increase the odds of a major military conflict. There is room for many negative surprises in this time frame as the US and Iran jockey for better positioning. The writing on the wall is that the United States is deleveraging and this creates a transition period in which regional instability will rise. Even within 2020 the current de-escalation could prove short-lived. The US president has enormous leeway in foreign policy and even the economic constraint is limited. The US economy is less oil intensive and less dependent on imports for its energy, while households have ample savings and spend less of their disposable income on energy. While this may ultimately serve as a basis for withdrawing from the Middle East, it also enables the US president to take greater risks in the region. Even within 2020 the current de-escalation could prove short-lived. The Iranians would have to create and maintain an oil supply shock the size of the September attack in Saudi Arabia for four months in order to ensure that American voters would feel the negative impact at the gas station by the time of the election. Chart 5 illustrates this point by simulating a 5.7 million barrel-per-day oil outage for different time periods. The chart overstates the impact on gasoline prices because it does not take into account the inevitable release of global strategic petroleum reserves. In other words, Trump may believe he has a sufficient buffer for the economy – and he clearly believes saber-rattling is worth the risk amid impeachment and election campaigning. Chart 4Trump Benefits From Fighting Iran-Backed Militants
A Reprieve Amid The Bull Market In Iran Tensions
A Reprieve Amid The Bull Market In Iran Tensions
Chart 5Gasoline Price Cushion Could Embolden Trump
A Reprieve Amid The Bull Market In Iran Tensions
A Reprieve Amid The Bull Market In Iran Tensions
Investment Conclusions Chart 6Close Long EM Oil Producer Trade
Close Long EM Oil Producer Trade
Close Long EM Oil Producer Trade
The past month’s events have reached a crisis point and are tentatively de-escalating. We are booking gains on our tactical long Brent crude trade and our long emerging market energy producers trade (Chart 6). We are not changing our constructive view on China stimulus, commodities, and the global business cycle. Following BCA Research’s commodity strategists, we recommend going long Brent crude H2 2020 versus H2 2021 on the expectation that production will remain constrained, inventories will fall, and prices will backwardate further. The underlying US-Iran conflict will persist and create volatility in oil markets in 2020 and beyond. We also remain on guard for ways in which the Iran dynamic could affect Trump’s reelection odds and hence US policy and the markets over the coming year. Matt Gertken Vice President Geopolitical Strategist mattg@bcaresearch.com
Feature One of BCA Research’s key geopolitical views since May 2019, outlined recently in our 2020 Outlook, is rapidly materializing: a dramatic escalation in the US-Iran conflict. On January 3 the United States successfully conducted a drone strike against a convoy carrying two high-level targets near the Baghdad International Airport. These were Iranian General Qassim Soleimani and his key Iraqi associate, Abu Mahdi al-Muhandes. The former, Soleimani, was Iran’s most influential military and intelligence leader, and one of its most powerful leaders overall. He was the head of the formidable Quds Force, the overseas arm of the Iranian Revolutionary Guard Corps (IRGC), the staunchest military wing of the regime at home and abroad. The latter target, al-Muhandes, was the head of Iraq’s Kataib Hezbollah militia and the broader coalition of pro-Iran Shiite militias in Iraq known as the Popular Mobilization Forces (PMF). This coalition was partly responsible for defeating the Islamic State in Iraq and Syria. Since then it has sought to consolidate Iranian influence in Iraq, pushing back against Iraqi Sunnis and Shia nationalists, and their allies in the US and Persian Gulf. Chart 1Bull Market In US-Iran Tensions
Bull Market In US-Iran Tensions
Bull Market In US-Iran Tensions
The US assassinations follow a significant increase in Iranian and Iran-backed militant attacks against US allies in the Middle East this year. These stem from a breakdown in the US-Iran diplomatic detente that was enshrined in the 2015 nuclear agreement. President Donald Trump revoked this agreement in 2018 and in May 2019 imposed crippling sanctions on Iran’s oil exports and economy — initiating a “bull market” in US-Iran strategic tensions (Chart 1). Recent events show a clear path of strategic escalation — even in the wake of a summer of “fire and fury” and the extraordinary Iran-backed attack on Saudi Arabia’s Abqaiq oil refinery in September. Widespread popular unrest has dissolved the Iraqi government, creating intense competition between Iraqi nationalists, led by Moqtada al-Sadr, and Iran’s proxies, led by al-Muhandes and the PMF. This unrest marked a significant challenge to Iran’s sphere of influence and necessitated an Iranian backlash. For instance, al-Sadr’s enemies attacked his headquarters with a drone in early December. Meanwhile Kataib Hezbollah launched a spate of rocket strikes against US and Iraqi bases that culminated in the death of an American contractor near Kirkuk on December 28 — crossing an American red line. The US retaliated with damaging air strikes against Kataib Hezbollah in Iraq and Syria on December 29, prompting a PMF blockade of the US Embassy in Baghdad on December 31. While this was a limited blockade, the US has now retaliated by assassinating Soleimani and al-Muhandes, taking the conflict to a new level. There is every reason to expect tensions to escalate further in the new year. First, the Iranian regime is under severe economic stress due to the US sanctions and broader global slowdown (Charts 2A&B). Domestic protests have erupted in recent years, while the regime struggles with economic isolation, a restless youth population, and a looming succession when Supreme Leader Ali Khamenei eventually steps down. This is an existential struggle for the regime, while President Trump may only be in office for 12 months. Public opinion polls show that the Iranian populace blames the government for economic mismanagement, and yet that the renewed conflict with the US under the Trump administration is shifting the blame to US sanctions (Chart 3). Hence the regime will continue to distract the populace by resisting Trump’s pressure tactics. Chart 2ARegime Survival ...
Regime Survival...
Regime Survival...
Chart 2B... An Existential Challenge
... An Existential Challenge
... An Existential Challenge
Chart 3US Conflict Distracts From Domestic Woes
Trump And Iran: Will Maximum Pressure Work?
Trump And Iran: Will Maximum Pressure Work?
This tendency will be reinforced by the death of Soleimani, which heightens the regime’s vulnerability while rallying domestic support due to Soleimani’s popularity as a leader (Chart 4). The regime is looking to its survival over the long run. It would be a remarkable shift in policy for Tehran to enter negotiations with Trump, since it would then risk vindicating his “maximum pressure” doctrine, possibly helping him secure a second term in office. Chart 4Hard-Line Soleimani Was Popular (Reformist President Rouhani Is Not)
Trump And Iran: Will Maximum Pressure Work?
Trump And Iran: Will Maximum Pressure Work?
Meanwhile President Trump’s circumstances are apparently urging him to double down on his aggressive foreign policy against Iran. First, while he will not be removed from office by a Republican Senate, his impeachment trial threatens to mar his re-election chances. This is a prime motivation to pursue foreign policy objectives to distract the public and seek policy wins. Chart 5Falling Oil Import Dependency Emboldens US
Falling Oil Import Dependency Emboldens US
Falling Oil Import Dependency Emboldens US
Second, the Trump administration may feel emboldened by the rise of US shale oil production and decline in US oil import dependency (Chart 5). Simulations we published in our December 6 Strategic Outlook show that Iran would have to sustain an oil supply cutoff as large as the Abqaiq attack for four months in order to drive gasoline prices high enough to harm the US economy as a whole. This buffer may have convinced Trump he has plenty of room for maneuver in confronting Iran. Third, Trump undoubtedly feels the need to maintain the credibility of his threats against Iran, North Korea, and other nations given his impeachment, widely known electoral and economic vulnerability, and his recent capitulation to China in the trade war. The clear threat by Iran to create a humiliating US embassy crisis in Baghdad likely struck a nerve in the White House, reviving memories of Saigon under Gerald Ford, Tehran under Jimmy Carter, and Benghazi under Barack Obama. By taking the offensive, President Trump has reinforced the red line against the death of American citizens or attacks on US assets. Nevertheless he now runs the risk of driving Iran into further escalation rather than negotiation. Iran is not yet likely to court a full-scale American attack by shutting down the Strait of Hormuz. It is more likely to retaliate via regional proxy attacks, including cutting off oil production, pipelines, and shipping — at a time of its choosing. If Trump’s pressure tactics succeed, it will advance its nuclear program rather than staging large-scale attacks. Investment Conclusions Iraqi instability will worsen as a result of the past month’s events, bringing 3.5 million barrels of daily oil production under a higher probability of disruption than when we first flagged this risk. Supply disruptions there or elsewhere in the region would hasten the drawdown in global inventories and backwardation of prices occurring due to the revival in global demand on China stimulus and OPEC 2.0 production cuts. Continued oil volatility, as in 2018-19, should be expected, but the risk for now lies to the upside as Middle East tensions could cause an overshoot. We remain long Brent crude and overweight energy sector equities. Second, the US election — and hence US domestic and foreign policy over the next five years — could hang in the balance if the Iran conflict escalates to broader and more open hostilities as we expect. President Trump is favored for re-election. Yet we have contended since 2018 that the revocation of the Iran nuclear deal was a grave geopolitical decision that could jeopardize Trump’s economy and hence re-election — and that remains the case. Chart 6Trump 'Maximum Pressure' A Gamble In 2020
Trump 'Maximum Pressure' A Gamble In 2020
Trump 'Maximum Pressure' A Gamble In 2020
Trump was elected in part because he is viewed as strong on terrorism, and the confrontation with Iran and its proxies will reinforce that reputation in the short run. Iranian attacks will also boost Trump’s approval rating, other things being equal. However, much can change by November. Jimmy Carter’s election troubles with Iran point to a serious risk to Trump, as the initial surge in patriotic support could turn sour over time if unemployment rises as a result of any oil shocks (Chart 6). Even George Bush Jr saw a dramatic fall in approval, from a much higher base than Trump, despite foreign policy conditions that were more transparently favorable to him in 2004 than any conflict with Iran will be to Trump in 2020. Trump has campaigned against Middle Eastern wars to a war-weary public, so the rally around the flag effect will not necessarily play to his favor in the final count. It is too soon to speculate about these matters — our view remains unchanged — but the Iran conflict is now much more likely to be a major factor in the US election and Iran is certainly capable of frustrating US presidents. This reinforces our base case that Trump is only slightly favored to win. Moreover his foreign policy conflicts — in Asia as well as the Middle East — ensure that global policy uncertainty and geopolitical risk will remain elevated despite dropping off from the highs reached last year amid the trade war. We remain long pure play global defense stocks on a cyclical and secular basis. We see gold as the appropriate hedge given our expectation that the trade ceasefire and China stimulus will reinforce a global growth recovery despite Middle Eastern turmoil. Higher oil prices push up inflation expectations and limit any benefit to government bonds. Matt Gertken Vice President Geopolitical Strategist mattg@bcaresearch.com
As 2019 draws to a close, we thank you for your ongoing readership and support. We wish you and your loved ones a happy holiday season and all the best for a healthy and prosperous 2020. Highlights We explore the principal risks to our optimistic 2020 outlook. Trade and the 2020 US Presidential election remain potential landmines. A stronger dollar would tighten global financial conditions and be deflationary. Credit market tremors would end buybacks. Stronger-than-expected inflation would force a cycle-ending Federal Reserve tightening. Weaker-than-expected inflation would first allow for larger bubbles to form at the expense of a more painful recession and deeper a bear market down the road. Hedging against those risks warrants overweighting cash, TIPs and gold. Feature Chart I-1Timing is Ripe For A Recovery
Timing is Ripe For A Recovery
Timing is Ripe For A Recovery
As always, this year’s visit from Ms. and Mr. X was thought-provoking and generated diverse investment ideas.1 While we did not share Mr. X’s fears, his caution may be justified because an aging business cycle, elevated equity multiples and extremely expensive government bonds do not mesh with pro-risk portfolio positioning. With this in mind, we will explore the greatest risks to our positive market outlook, which include politics, the US dollar, problems in the credit market, a quicker resumption of inflation and lower inflation. The Central Scenario To understand how these five risks affect our central thesis, let’s review the key views and themes that underpin our bullish outlook. BCA expects global economic activity to recover in 2020. First, the global inventory contraction is advanced, which increases the chance that the manufacturing cycle will track its usual pattern of an 18-month decline followed by an 18-month acceleration (Chart I-1). Secondly, Chinese policymakers are putting a floor under domestic economic activity and the stabilization in credit growth and the climbing fiscal impulse already augur well for global growth (Chart I-2). Thirdly, global liquidity is in a major upswing, thanks to easing by central banks around the world (Chart I-3). Finally, the trade détente between the US and China agreed last week reduces the odds of a destructive trade war. Chart I-2China's Policy Turnaround
China's Policy Turnaround
China's Policy Turnaround
Chart I-3Easing Abound!
Easing Abound!
Easing Abound!
US monetary policy will remain accommodative next year. US inflation will remain subdued in the first half of 2020 in response to both the global growth slowdown underway since mid-2018 and the lagged effect of a stronger dollar. Moreover, Fed policy will remain sensitive to inflation expectations. According to BCA’s US Bond Strategy’s model, it could take an extended overshoot in realized inflation before inflation expectations move back to the 2.3% to 2.5% range consistent with achieving a 2% inflation target (Chart I-4). Thus, the Fed will remain on pause for all of 2020. BCA’s positive outlook depends on both China and the US respecting their trade truce. In this context, the dollar will depreciate. The USD is a countercyclical currency and typically suffers when global economic activity rebounds, especially if inflation remains tame (Chart I-5). This behavior is due to the low share of the US economy dedicated to manufacturing and exports, which makes the US less sensitive to global trade and industrial activity. Moreover, when the world economy strengthens, safe-haven flows that boost the dollar in times of duress reverse, which accentuates the selling pressure on the USD. Chart I-4Realized Inflation Will Guide Expectations
Realized Inflation Will Guide Expectations
Realized Inflation Will Guide Expectations
Chart I-5The Dollar Won't Respond Well To Stronger Global Growth
The Dollar Won't Respond Well To Stronger Global Growth
The Dollar Won't Respond Well To Stronger Global Growth
Global bond prices will be another victim of an improving economic outlook. Global safe-haven securities are extremely expensive and investors are too bullish toward this asset class (Chart I-6). This puts government bonds at risk in the face of positive economic surprises. However, the upside in Treasury yields will be capped between 2.25 and 2.5% because the Fed will be cautious about lifting rates. This move will likely be led by inflation expectations. As a result, we favor TIPs over nominal Treasurys. Chart I-6Safe-Haven Yields Have Upside
Safe-Haven Yields Have Upside
Safe-Haven Yields Have Upside
Chart I-7Investors Aren't Feeling Exuberant About Earnings Growth
Investors Aren't Feeling Exuberant About Earnings Growth
Investors Aren't Feeling Exuberant About Earnings Growth
Equities will outperform bonds. The S&P 500 is trading at 18-times forward earnings and 2.3-times sales. However, those elevated multiples are due to depressed risk-free rates. Long-term growth expectations embedded in stock prices are only 1%, toward the bottom of this series’ historical distribution (Chart I-7). Therefore, investors are not particularly optimistic on the long-term prospects of per-share earnings. This lack of euphoria implies that stocks are not as expensive as bonds, and that if yields climb because of improving global economic activity, then equities will outperform bonds. Moreover, with a backdrop of easy money and no recession forecast until 2022, the timing still favors positive returns for equities in the coming 12 to 18 months (Table I-1). Table I-1The End Game Can Be Rewarding
January 2020
January 2020
Finally, we favor European equities over US stocks. This regional slant is as much a reflection of the better value offered by European stocks as it is of their sector composition. European stocks are trading at a forward PE of 14, implying an equity risk premium of 846 basis points versus 546 basis points in the US. Moreover, our preference for industrials, energy and financials favors European equities (Table I-2). Additionally, European banks are our favorite equity bet worldwide because they trade at a price-to-book ratio of only 0.6 and the drivers of their return on tangible equity are perking up (Chart I-8). Table I-2Europe: Overweight In The Right Sectors
January 2020
January 2020
Chart I-8Brightening Prospects For Euro Area Banks
Brightening Prospects For Euro Area Banks
Brightening Prospects For Euro Area Banks
Risk 1: Politics BCA’s positive outlook depends on both China and the US respecting their trade truce. However, the two countries are long-term rivals and the rising geopolitical power of China relative to the US will cause tensions to escalate in the coming decades (Chart I-9). This also suggests that China and the US are highly unlikely to ever have an agreement that fully covers intellectual property transfers. Chart I-9China/US Tensions Are Structural
China/US Tensions Are Structural
China/US Tensions Are Structural
The US could still renege on the “Phase One” deal. President Trump faces an election in 2020 and the majority of Democratic hopefuls are also hawkish on China. If Trump’s low approval rating does not improve soon (Chart I-10), he could become a more war-like president, in the hope that electors will rally around the flag. A renewed trade war would hurt business sentiment and undermine consumer spending (Chart I-11). A bellicose approach to international relations, especially on trade, would spark another spike in global policy uncertainty that will hurt global capex intentions. Meanwhile, companies could cut employment, which would weigh on household incomes. A rising unemployment rate could also hurt household confidence, reinforcing the slowdown in consumer spending. This would guarantee an earlier recession. Stocks would decline along with global government bond yields. Chart I-10President Trump Can Still Make It
January 2020
January 2020
Chart I-11Households On The Edge
Households On The Edge
Households On The Edge
The US election creates an additional political risk. Democratic candidates are touting higher corporate taxes, a wealth tax, a greater regulatory burden, antitrust actions, and so on. These policies are worrisome to corporate leaders and business owners. For the time being, our Geopolitical Strategy team favors a Trump victory in 2020 (Chart I-12).2 However, if his odds deteriorate significantly, then business executives would likely curtail capex and hiring. This could also result in a US recession that would invalidate our central scenario for 2020. Chart I-12Our Model Still Favors President Trump
January 2020
January 2020
Risk 2: A Strong Dollar A strong US dollar would hurt growth. A continued dollar rally would counteract a large proportion of the easing in liquidity conditions created by accommodative central banks around the world. The dollar affects the global cost of capital. Both advanced economies and emerging markets have USD-denominated foreign currency debt totaling around $6 trillion each. A strong USD raises the cost of servicing this large debt load, which could force borrowers to curtail their spending. A continued dollar rally would counteract a large proportion of the easing in liquidity conditions created by accommodative central banks around the world. Despite our conviction that the US dollar will depreciate in 2020, the following factors may invalidate our thesis: The USD still possesses the highest carry in the G10. When the dollar is supported by some of the highest interest rates in the G10, it often continues to rally (Chart I-13). Chart I-13The Dollar Offers An Elevated Carry
The Dollar Offers An Elevated Carry
The Dollar Offers An Elevated Carry
The global growth rebound may be led by the US. If the US leads the rest of the world higher, then rates of return in the US would climb quicker than in the rest of the world. The resulting capital inflows would bid up the dollar. The shortage of USDs in offshore markets may flare up again. The September seize-up in the repo market was a reminder that because of the Basel III rules, global banks have a strong appetite for high-quality collateral and reserves. This generates substantial demand for the USD, which could put upward pressure on its exchange rate. The US dollar is a momentum currency. Among the G10 currencies, the USD responds most strongly to the momentum factor (Chart I-14).3 The dollar’s strength in the past 18 months could initiate another wave of appreciation. The dollar may not be as expensive as suggested by purchasing power parity (PPP) models. According to PPP estimates, the trade-weighted dollar is 24.2% overvalued. However, according to behavioral effective exchange rate models (BEER), the dollar may be trading closer to its fair value (Chart I-15). Chart I-14The Dollar Is A Momentum Currency
January 2020
January 2020
Chart I-15Is The Dollar Expensive?
Is The Dollar Expensive?
Is The Dollar Expensive?
Why are the five items listed above risks for the dollar, but not our central scenario? Regarding the dollar’s carry, in 1985, 1999, and 2006, the US still offered some of the highest short-term interest rates among advanced economies, nevertheless the dollar began to depreciate. In those three instances, an acceleration in foreign economic activity relative to the US was the key culprit behind the USD’s weakness. In 2020, we expect foreign economies to lead the US higher. Since mid-2018, the manufacturing sector has been at the center of the global slowdown. But now, inventory and monetary dynamics point towards a re-acceleration in manufacturing activity. The US was the last nation to be hit by the growth slowdown; it will also be the last to reap a dividend from the recovery. The marginal buyers of US equities have been US firms. On the danger created by the dollar and the collateral shortage, the Fed is tackling the lack of excess reserves head-on by injecting $60 billion per month of reserves via its asset purchases. Moreover, the US fiscal deficit, which is tabulated to reach $1.1 trillion in 2020, will add a similar amount of dollars to the pool of high-quality collateral around the world, especially as the US current account deficit is widening anew. On the momentum tendency of the USD, the dollar’s momentum seems to be petering off. A move in the Dollar Index below 96 would indicate a major change in the trend for the DXY. Finally, estimates of a currency’s fair value based on BEER fluctuate much more than those based on PPP. If the global growth pick-up allows foreign neutral rates to increase relative to the US over the coming 12 to 24 months, then the dollar’s BEER equilibrium will likely converge toward PPP, putting downward pressure on the USD. Risk 3: Credit Market Tremors A credit market selloff is not our base case, but it would be damaging to risk assets. A deterioration in credit quality would be the main culprit behind a widening in credit spreads. Our Corporate Health Monitor already shows that the credit quality of US firms is worsening (Chart I-16). Moreover, the return on capital of the US corporate sector is rapidly deteriorating. Accentuating these risks, US profit margins have begun to decline because a tight labor market is exerting an upward pull on real unit labor costs (Chart I-17). Furthermore, the near-total disappearance of covenants in new corporate bond issuance increases the risks to lenders and will likely depress recovery rates when a default wave emerges. Chart I-16Deteriorating Fundamentals For US Corporates
Deteriorating Fundamentals For US Corporates
Deteriorating Fundamentals For US Corporates
Chart I-17A Tight Labor Market Is Biting Into Margins
A Tight Labor Market Is Biting Into Margins
A Tight Labor Market Is Biting Into Margins
Widening credit spreads would signal a darkening economic outlook. Historically, wider spreads have been an excellent leading indicator of recessions (Chart I-18). Wider spreads have a reflexive relationship with the economy: they reflect anticipation of rising defaults by investors, but they also represent a price-based measure of lenders’ willingness to extend credit. Therefore, wider spreads force open the underlying cracks in the economy by depriving funds to weak borrowers. The resulting deterioration in capex and hiring would prompt a decline in consumer confidence and spending, ultimately leading to a recession. Chart I-18Widening Spreads Foreshadow Recessions
Widening Spreads Foreshadow Recessions
Widening Spreads Foreshadow Recessions
Chart I-19Who Is Buying Stocks? Businesses!
Who Is Buying Stocks? Businesses!
Who Is Buying Stocks? Businesses!
US equities may prove to be even more sensitive to the health of the credit market than in previous cycles. The marginal buyers of US equities have been US firms, which have engaged in equity retirements totaling $16.5 trillion since 2010. Since that date, pension plans, foreigners and households have sold a total of $7.7 trillion in US equities (Chart I-19). Both internally generated cash flows and borrowings have allowed for a decline in the equity portion of funding among US firms. Therefore, a weak credit market would hurt equities because a recession would depress firms’ free cash flows and hamper the capacity of firms to buy back their shares. Finally, the tendency of US firms to borrow to buy back their shares means that newly issued debt has not been matched by as much asset growth as in previous cycles. Therefore, borrowing is not backed by the same degree of collateral as in past cycles. If the credit market seizes up, then default and recovery rates will suffer even more than suggested by our corporate health monitor. The VIX will blow up and equities could suffer. Higher US inflation is potentially the most important downside risk for next year. While a widening in credit spreads would have a profound impact on stocks, it is unlikely to materialize when the Fed conducts a very accommodative monetary policy and global growth recovers. Risk 4: Higher Inflation Chart I-20The US Labor Market Is Tight
The US Labor Market Is Tight
The US Labor Market Is Tight
Higher US inflation is potentially the most important downside risk for next year as it would catalyze the aforementioned dangers. Inflation could surprise to the upside because the labor market is tight. At 3.5%, the unemployment rate is well below equilibrium estimates that range between 4.1% and 4.6%. Small firms are increasingly citing their inability to find qualified labor as the biggest constraint to expand production. In the Conference Board Consumer Confidence survey, the number of households reporting that jobs are easily procured is near a record high relative to those preoccupied by poor job prospects. Finally, the voluntary quit rate is at 2.3%, a near record high (Chart I-20). Core PCE remains at only 1.6% year-on-year, but investors should recall the experience of the late 1960s. Through the 1960s, the labor market was tight, yet core inflation remained between 1% and 2%. However, in 1966, inflation suddenly accelerated to 4% before peaking near 7% in 1970. Some inflation dynamics warrant close monitoring. The three-month annualized rate of service inflation excluding rent of shelter has already surged to 4.5% and the same metric for medical care inflation stands at 5.9%. A continued tightening in the labor market could solidify a broadening of these trends because a rising employment-to-population ratio for prime-age workers points toward stronger salaries and ultimately higher domestic demand (Chart I-21). A very weak dollar would also allow this scenario to develop. Chart I-21Household Income Growth Will Accelerate
January 2020
January 2020
A sudden flare in inflation would prompt an abrupt tightening in liquidity conditions that would be lethal for the economy. An out of the blue surge in CPI would likely cause a swift reassessment of inflation expectations by households and investors. Under these circumstances, the Fed could tighten monetary policy much faster than we currently envision. If interest rate markets are forced to price in a prompt removal of monetary accommodation, Treasury yields could easily spike above 3.5% by year end, which would hurt both the economy and the expensive equity market. If realized inflation turns out weaker than we expect in 2020, then central banks will maintain accommodative policies beyond next year. For now, this scenario remains a tail risk because the recent economic slowdown will probably continue to act as a dampener on US inflation in the first half of the year. Additionally, we do not expect the USD to collapse by 40% and fan inflation and inflation expectations, as occurred from 1985 to 1987. Instead, inflation expectations are much better anchored than they were in either the 1960s or 1980s, decreasing the risk that the Fed will suddenly have to tighten policy. Risk 5: Weaker-Than-Expected Inflation Chart I-22An Aggressive BoJ Did Not Achieve Inflation
An Aggressive BoJ Did Not Achieve Inflation
An Aggressive BoJ Did Not Achieve Inflation
The last risk is paradoxical, but it is the one with the highest probability. It is paradoxical because it involves greater upside for stocks next year than we currently anticipate, but at the expense of a much deeper bear market in the future. The labor market may be tight, but Japan’s experience cautions us against extrapolating that inflation is necessarily around the corner. In Japan, the unemployment rate has been below 3.5% since 2014 and minimal domestically generated inflation has emerged. Inflation excluding food and energy remains at a paltry 0.7% year-on-year, even as the Bank of Japan has kept the policy rate at -0.1% and expanded its balance sheet from 20% of GDP in 2008 to 102% today (Chart I-22). If realized inflation turns out weaker than we expect in 2020, then central banks will maintain accommodative policies beyond next year. Central banks are currently toying with their inflation targets, discussing allowing inflation overshoots and displaying deep paranoia in the face of deflation. By weighing on inflation expectations, low realized inflation would nail policy rates around the world at currently depressed levels or even lower. Chart I-23Bubbles Destroy Long-Term Return On Capital
Bubbles Destroy Long-Term Return On Capital
Bubbles Destroy Long-Term Return On Capital
In this context, bond yields would have even more limited upside than we envision and risk assets could experience higher multiples than today. In other words, we would have a perfect scenario for another stock market bubble. Vulnerability would escalate as valuations balloon and the perceived risk of monetary tightening dissipates from both investors’ and economic agents’ minds. Elevated asset valuations portend lower long-term expected returns (Chart I-23) and a larger share of the capital stock would become misallocated. Ultimately, the stimulative impact of such a bubble would create its own inflationary pressures. Consumers and companies would accumulate more debt and cyclical spending would rise (Chart I-24). In the end, the Fed would raise rates more aggressively, but the economy would be more vulnerable to those higher rates. Chart I-24Higher Cyclical Spending Creates Vulnerabilities
Higher Cyclical Spending Creates Vulnerabilities
Higher Cyclical Spending Creates Vulnerabilities
Therefore, we would see a larger recession and, because assets are more expensive, a greater decline in prices. This would be extremely destabilizing for the global economy, potentially much more so than if a recession were to emerge today. Moreover, since the resulting slump would be yet another balance-sheet recession, it would likely entail a lack of capacity by central banks to reflate their economies. Conclusion The scenarios above are all risks to our benign view for 2020. The first four represent downside threats for assets next year, but the last one (weaker-than-expected inflation) entails upside potential to our forecast next year with significantly more painful results down the line. These risks are important to consider when protecting our portfolio, which has a pro-cyclical bias. It is overweight stocks, underweight bonds, and favors cyclical equities as well as foreign bourses at the expense of the US. BCA’s Global Asset Allocation service recently published an article on safe havens, which studied the profile of risk assets under various circumstances.4 Treasurys normally are the best safe haven, however, at current levels of yields, this benefit will be small compared with previous cycles. Instead, we favor an overweight position in cash, TIPs and gold. The best defense against short-term gyrations is to think about long-term strategic asset allocation. In this regard, this month’s Special Report – co-authored with BCA’s Equity, Geopolitical and Foreign Exchange Strategists, and Marko Papic, Chief Strategist at Clocktower Group – discusses our top sector calls for the upcoming decade. Mathieu Savary Vice President The Bank Credit Analyst December 20, 2019 Next Report: January 30, 2020 II. Top US Sector Investment Ideas For The Next Decade Every decade a dominant theme captures investors’ imaginations and morphs into a bubble. Massive speculation typically propels the relevant asset class into the stratosphere as investors extrapolate the good times far into the future and go on a buying frenzy. Chart II-1 shows previous manic markets starting with the Nifty Fifty, gold bullion, the Nikkei 225, the NASDAQ 100, crude oil and most recently the FAANGs. Chart II-1Manias: An Historical Roadmap
Manias: An Historical Roadmap
Manias: An Historical Roadmap
What will be the dominant themes of the next decade? How should investors capitalize on some of these big trends? The purpose of this Special Report is to identify and provoke a healthy debate on the prevailing investment themes for the 2020s and to speculate on what the key US sector beneficiaries and likely losers may be. Theme #1: De-Globalization Picks Up Steam The first investment theme for the upcoming decade is the “apex of globalization” or “de-globalization”. We have written about this theme extensively at BCA Research and it is the mega-theme of our sister Geopolitical Strategy (GPS) service. Odds are high that countries will continue looking inward as the US adopts a more aggressive trade policy, China’s trend growth slows, and US-China strategic tensions intensify. The small cap preference is a secular view with a time horizon that spans the next decade. Chart II-2 shows that we are at the conclusion of a period of tranquility. Pax Americana underpinned globalization as much as Pax Britannica before it. The US is in a relative decline after decades of geopolitical stability allowed countries like China to rise to “great power” status and rivals like Russia to recover from the chaos of the 1990s. Chart II-2De-globalization Has Commenced
De-globalization Has Commenced
De-globalization Has Commenced
De-globalization has become the consensus since the election of Donald Trump. But Trump is not the prophet of de-globalization; he is its acolyte. Globalization is ending because of structural factors, not cyclical ones. Three factors stand at the center of this assessment, outlined in our 2014 Special Report, “The Apex Of Globalization – All Downhill From Here”: multipolarity, populism and protectionism. Events have since confirmed this view. One final long-term playable investment idea from the apex of globalization is a structural bull market in defense stocks. The three pillars of globalization are the free movement of goods, capital, and people across national borders. We expect to see marginally less of each in the future. Investment Implication #1: Profit Margin Peak The most profound and provocative investment implication from de-globalization is that SPX profit margins have peaked and will likely come under intense pressure, especially for US conglomerates that – on a relative basis to international peers – most enthusiastically embraced globalization. Chart II-3 shows reconstructed S&P 500 profits and sales data back to the late-1920s. Historically, corporate profit margins and globalization (depicted as global trade as a percentage of GDP) have been positively correlated. Chart II-3Profit Margin Trouble
Profit Margin Trouble
Profit Margin Trouble
As countries are more outward looking, trade flourishes and openness to trade allows the free flow of capital to take advantage of profit-maximizing projects. Following the Great Recession and similar to the Great Depression, trade has suffered and trade barriers have risen. The Sino-American trade war has accelerated the inward movement of countries, including Korea and Japan, and has had negative knock-on effects on trade as evidenced by the now two-year old global growth deceleration. China’s response to President Trump’s election was to redouble its pursuit of economic self-sufficiency, which meant a crackdown on corporate debt and a fiscal boost to household consumption. Trump’s tariffs then damaged sentiment and trade between the two countries. Any deal reached prior to the 2020 US election will remain in doubt among global investors. The longer the trade war remains unresolved, the deeper the cracks will be in the foundations of the global trading system. We are especially worried for the S&P interactive media & services index that includes GOOGL and FB. Such a backdrop is negative for profit margins, as inward looking countries prevent capital from being allocated most efficiently. Moreover, the uprooting of supply chains due to the trade war hurts margins and the redeployment of equipment in different jurisdictions will do the same at a time when final demand is suffering a setback. In addition, rising profit margins are synonymous with wealth accruing to the top 1% of US families and vice versa. This relationship dates back to the late-1920s, as far back as our dataset goes. Using Piketty and Saez data, which exclude capital gains, it is clear that profit margin expansion exacerbates income inequality (top panel, Chart II-4). Chart II-4Heightened Risk Of Wealth Re-distribution
Heightened Risk Of Wealth Re-distribution
Heightened Risk Of Wealth Re-distribution
Expanding margins lead to higher profits. Because families at the top of the income distribution are often business owners, income disparities are the widest when margins are in overshoot territory. Eventually this income chasm comes to a head and generates political discontent. Populism has emerged on both the right and left wings of the US political spectrum – and since the rise of Trump, even Republicans complain about inequality and the excesses of “corporate welfare” and laissez-faire capitalism. Because inequality is extreme – relative to America’s developed peers – and political forces are mobilizing against it, the probability of wealth re-distribution is rising in the coming decades (middle panel, Chart II-4). Labor’s share of national income has nowhere to go but higher in coming years and that is negative for profit margins, ceteris paribus (bottom panel, Chart II-4). Buy or add software stock exposure on any weakness with a 10-year investment time horizon. Drilling beneath the surface, the three secular US equity sector/factor implications of the apex of globalization paradigm shift are: prefer small caps over large caps prefer value over growth overweight the pure-play BCA Defense Index Investment Implication #2: Small Is Beautiful Chart II-5It's A Small World After All
It's A Small World After All
It's A Small World After All
While a small cap bias is contrary to the cyclical US Equity Strategy view of preferring large caps to small caps, the issue is timing: the small cap preference is a secular view with a time horizon that spans the next decade. The small versus large cap share price ratio’s ebbs and flows persist over long cycles. Small caps outshined large caps uninterruptedly from 1999 to 2010. Since then large caps have had the upper hand (Chart II-5). Were the apex of globalization theme to gain traction in the 2020s, small caps should reclaim the lead from large caps, especially in the wake of the next US recession. Similar to the death of the global banking model, companies with global footprints will suffer the most, especially compared with domestically focused outfits. One way to explore this theme is via domestic versus global sector preference. But a more investable way to position for this sea change, is to buy small caps (or microcaps) at the expense of large caps (or mega caps). Small caps are traditionally domestically geared compared with large caps that have significantly more foreign sales exposure. The closest ETF ticker symbols resembling this trade is long IWM:US/short SPY:US. Investment Implication #3: Buy Value At The Expense Of Growth Similar to the size bias, the style bias also moves in secular ways. Value outperformed growth from the dot com bust until the GFC. Since then growth has crushed value, even temporarily breaking below the year 2000 relative trough. This breakneck pace of appreciation for growth stocks is clearly unsustainable and offers long-term oriented investors a compelling entry point near two standard deviations below the historical mean (Chart II-6). Chart II-6Value Has The Upper Hand Versus Growth
Value Has The Upper Hand Versus Growth
Value Has The Upper Hand Versus Growth
Financials populate value indexes, a similarity with small cap outfits. Traditionally, financials are a domestically focused sector with export exposure registering at half of the S&P’s average 40% level of internationally sourced revenues. On the flip side, tech stocks sit atop the growth table and they garner 60% of their revenue from abroad. This value over growth style preference will pay handsome dividends if the de-globalization theme becomes more mainstream as countries become more hawkish on trade and the Sino-American war continues to erect barriers to trade that took decades to lift. We have created a basket of ten stocks that we think will be driven over the long term by the demographic rise of the Millennial. The caveat? President Trump's recent short-term deal with China could set back the de-globalization theme. But our geopolitical strategists do not anticipate it to be a durable deal, and they also expect the trade war to resume in some way, shape or form in 2021-22, regardless of the outcome of the US election. The closest ETF ticker symbols resembling this trade is long IVE:US/short IVW:US. Investment Implication #4: Defense Fortress Chart II-7Stick With Pure-play Defense Stocks
Stick With Pure-play Defense Stocks
Stick With Pure-play Defense Stocks
One final long-term playable investment idea from the apex of globalization is a structural bull market in defense stocks (Chart II-7). The US Equity Sector service's October 2016 “Brothers In Arms” Special Report drew parallels with the late nineteenth century period of European rearmament, and the American and Soviet arms race of the 1960s.5 These movements were greatly beneficial to the aerospace and defense industry. Currently, the move by several countries to adopt more independent foreign policies, i.e. to move away from collaboration and cooperation toward isolationism and self-sufficiency, entails an accompanying arms race. Table II-1
January 2020
January 2020
China’s challenge to the regional political status quo motivates a boost to defense spending globally. In fact, SIPRI data on global military spending by 2030 (Table II-1) increases our conviction that this trade will succeed on a five-to-ten year horizon. Beyond the global arms race, two additional forces are at work underpinning pure-play defense contractors. A global space race with China, India and the US wanting to have manned missions to the moon, and the rise of global cybersecurity breaches. Defense companies are levered to both of these secular forces and should be prime sales and profit beneficiaries of rising space budgets and increasing cybersecurity combat budgets. The ticker symbols for the stocks in the pure-play BCA defense index are: LMT, RTN, NOC, GD, HII, AJRD, BWXT, CW, MRCY. Theme #2: Tech Sector Regulation, US Enacts Privacy Laws The second long-term geopolitical theme that we are exploring is the regulatory or “stroke of pen” risk that is rising on FAANG stocks – Facebook, Apple, Amazon, Netflix, and Google. These companies were this decade’s undisputed stock market winners. The US anti-trust regulatory framework was designed to curb broad anti-competitive actions of trusts. As Lina Khan discusses in her seminal article, these actions “include not only cost but also product quality, variety, and innovation.” However, through subsequent regulatory evolution, the Chicago School has focused the US anti-trust process on consumer welfare and prices. If President Reagan and the courts could change how anti-trust laws were administered in the 1980s, so too can future administrations and courts. Today the US Congress, on both sides of the aisle, is looking into regulatory tightening, while the judicial system will take longer to change its approach. Moreover, the impetus for tougher anti-trust policy is here. It comes from a long period of slow growth, income inequality, and economic volatility – such as in the 1870s-80s. This was certainly the case for Standard Oil in 1911, which became a nation-wide boogeyman despite most of its transgressions occurring in the farm belt states. Today, income inequality is a prominent political theme and source of consumer discontent. A narrative is emerging – which will be super-charged during the next recession – that growth has been unequally distributed between the old economy and the twenty-first century technology leaders. While there are a few ESG related ETFs, we would rather explore this theme’s investment implications of sectors to avoid in the coming decade. With regard to privacy, the news is equally grim for large tech outfits. The EU General Data Protection Regulation (GDPR), which came into force on May 2018, imposes compliance burdens on any company handling user data. In the US, California has signed its own version of the law – the Consumer Privacy Act – which will go into effect in January 2020. These laws give consumers the right to know what information companies are collecting about them and who that data is shared with. They also allow consumers to ask technology companies to delete their data or not to sell it. While tech companies are likely to fight the new California law, and the US court system is a source of uncertainty, we believe the writing is on the wall. The EU is by some measures the largest consumer market on the planet. California is certainly the largest US market. It is unlikely that the momentum behind consumer protection will change, especially with the EU and California taking the lead. The odds of a federal privacy law, following in the footsteps of the Consumer Privacy Act, are also rising. Investment Implication #5: Shun Interactive Media & Services Stocks These risks introduce a severe overhang for FAANG stocks. We are especially worried for the S&P interactive media & services index that includes GOOGL and FB. Chart II-8Regulation Will Squeeze Tech Margins
Regulation Will Squeeze Tech Margins
Regulation Will Squeeze Tech Margins
Tack on the threat of federal regulation and this represents another major headwind for profits and margins that are extremely elevated for these near monopolies. Given that advertising revenue is crucial to the business model of social media companies (GOOGL and FB included), a significant uptick in privacy regulation will likely hurt their bottom line. With regard to profit margins, tech stocks in general command a profit margin twice as high as the SPX. Specifically, FB and GOOGL enjoy margins that are 500 basis points higher than the broad tech sector (Chart II-8)! This is unsustainable and they will likely serve as easy prey for policymakers. Our view does not necessarily call for breaking up these monopolies. The US will have to weigh the economic consequences of anti-trust policy in a context of multipolarity in which China’s national tech champions are emerging to compete with American companies for global market share. Nevertheless, increased regulation is inevitable and some forced sales of crown jewel assets may take place. Moreover, the threat of a breakup will lurk in the background, creating uncertainty until key legislative and judicial battles have already been fought. That will take years. Finally, we doubt the tech sector will be left alone to “self-regulate” its incumbents and negotiate a price on consumers’ privacy. More likely, a new privacy law will loom, serving as a negative catalyst for profit growth. Uncertainty will weigh on the S&P interactive media & services relative performance. The ticker symbols to short/underweight the S&P interactive media & services index are an equally weighted basket of GOOGL and FB (they command a 98% market cap weight in the index). Theme #3: SaaS, Artificial Intelligence, Augmented Reality And Autonomous Driving Are Not Fads The third big theme that will even outlive the upcoming decade is the proliferation of software as a service (SaaS). The move to cloud computing and SaaS, the wider adoption of artificial intelligence, machine learning, autonomous driving and augmented reality are not fads, but enjoy a secular growth profile. In the grander scheme of things today’s world is surrounded by software. Millions of lines of code go even into gasoline powered automobiles, let alone electric vehicles. Autonomous driving is synonymous with software, the Internet of Things (IoT) needs software, the space race depends on software, modern manufacturing and software are closely intertwined, phone calls for quite some time have been a software solution, and the list goes on and on. This tidal effect is hard to reverse and is already embedded in workflows across industries. Opportunities to penetrate health care and financial services more deeply remain unexplored and it is difficult to envision another competing industry unseating “king software”. These secular trends are not only productivity enhancing, but will also most likely prove recession-proof. When growth is scarce investors flock to any source of growth they can come by and we are foreseeing that when the next recession arrives, investors will likely seek shelter in pure play SaaS firms. Investment Implication #6: Software Is Eating The World Chart II-9Software Is Eating The World
Software Is Eating The World
Software Is Eating The World
Buying software stocks for the long haul seems like a bulletproof investment idea. But the recent stellar performance of software stocks has moved valuations to overshoot territory. Our recommended strategy is to buy or add software stock exposure on any weakness with a 10-year investment time horizon. All of these secular trends have pushed capital outlays on software into a structural uptrend. Software related capex is not only garnering a larger slice of the tech spending budgets but also of the overall capex pie. If it were not for software capex, the contraction in non-residential investment in recent quarters would have been more severe (Chart II-9). Private sector software capex is near all-time highs as a share of total outlays. Government investment in software is also reaccelerating at the fastest pace since the tech bubble. When productivity gains are anemic, both the business and government sectors resort to software upgrades in order to boost productivity. Cyber security is another more recent source of software related demand as governments around the globe are taking such risks extremely seriously (bottom panel, Chart II-9). Given this upbeat demand backdrop and ongoing equity retirement, software stocks are primed to grow into their pricey valuations. Finally, this long-term trade will also serve as a hedge to the short/underweight position we recommend in the S&P interactive media & services index. The closest ETF ticker symbol resembling the S&P software index is IGV:US. Theme #4: Millennials Already Are The Largest Cohort And Will Dominate Spending The fourth long-term theme we anticipate to gain traction in the 2020s is the demographic rise of the Millennial generation. Much has been made of preparing for the arrival of the Millennial generation, accompanied by well-worn stereotypes of general "failure to launch" as they reach adulthood. However, "arrival" is a misnomer as this age cohort is already the largest and "failure" is simply untrue. According to the US Census Bureau, Millennials are the US’s largest living generation. Millennials (or Echo Boomers) defined as people aged 18 to 37 (born 1982 to 2000), now number more than 80mn and represent more than one quarter of the US’s population. Baby Boomers (born 1946 to 1964) number about 75mn. Stealthily becoming the largest age group in the US over the last few years, Millennials per-year-birth-rate peaked at 4.3mn in 1990. Surprisingly, the pace matched that of the post-war Baby Boom peak-per-year-birth-rate in 1957 - the per-year average over the period was higher for the Baby Boomers (Chart II-10). Chart II-10Millennials Are The Largest Cohort
Millennials Are The Largest Cohort
Millennials Are The Largest Cohort
This gap is now set to grow rapidly as the death rate of Baby Boomers accelerates. What is more, the largest one-year age cohort is only 25 years old, thus, Millennials will be the dominant generation for many years. It is unclear how these “kids” will impact the market as they become the most important consumers, borrowers and investors, but make no mistake: this is a seismic shift in economic power and it is here to stay. The Echo Boom is a big, generational demographic wave. A difficult and painful delay has not tempered its looming importance. Finally, this wave of echo-boomers is educated, relatively unburdened by debt (please see BOX in the June 11, 2018 Special Report on demystifying the student debt load as it pertains to Millennials), and as they inevitably “grow up”, form new households and have kids. They will borrow, spend, earn, but not necessarily save and invest to the same extent as the Boomers. And this will be an important long-term theme going forward. Near term, we might already be seeing signs of their arrival and firms have begun to pivot accordingly. Investment Implication #7: Buy The BCA Millennials Equity Basket Millennials will boost consumption spending in a number of different ways. The relatively unburdened Millennial cohort will be entering prime home acquisition age soon and this should underpin the long-term prospects of the US housing market and related industries. Furthermore, Millennials consume differently from their parents; social media, online shopping and smart phones are not the consumption categories of the Baby Boomers. With this in mind, we have created a basket of ten stocks that we think will be driven over the long term by the demographic rise of the Millennial. We note that these stocks are heavily weighted to the technology and consumer discretionary sectors, which is logical as Millennial consumption habits tend to be discretionary focused and technology-based. Beginning with consumer discretionary, we are highlighting AMZN, NFLX and SPOT as core holdings in our Millennials basket. AMZN’s heft dwarfs consumer discretionary indexes but it could fall in several categories; the acquisition of Whole Foods makes it a Millennials-focused consumer staples retailer and its cloud computing web services segment is a tech leader. NFLX and SPOT represent the means by which Millennials consume media, by streaming movies and music over the internet. The idea of owning physical media is rapidly becoming an anachronism. The home ownership theme noted in this report leads us to add HD and LEN to the basket. Millennials are “doers” and are set to be the dominant DIYers in the next few years, making HD a logical choice. LEN, as the nation’s largest home builder, should benefit from the Millennials coming of age into home buyers. We are also adding TSLA to our basket as a lone clean tech-oriented equity. TSLA capitalizes on the increasing shift to clean energy of Millennials (the key reason why no traditional energy companies have a spot in our basket). Chart II-11Buy BCA's Millennial Equity Basket
Buy BCA's Millennial Equity Basket
Buy BCA's Millennial Equity Basket
The technology stocks in our Millennials basket are AAPL, UBER (which replaces FB as of today) and MSFT, together representing more than 9% of the total value of the S&P 500. AAPL’s inclusion in the list is predictable as the leading domestic purveyor of devices on which Millennials consume media content. FB is a predictable holding, with more than half of all Americans being monthly active users, dominated by the Millennial cohort. It has served our basket well since inception, but today we are compelled to remove it and replace it with UBER. UBER is a Millennial favorite and the epitome of the sharing economy. In reality UBER is a logistics company and while it is losing money, it is eerily reminiscent of AMZN in its early days. Maybe UBER will dominate all means of transportation and its ease of use will propel it to a mega cap in the coming decade. Our inclusion of MSFT is based on its leadership in cloud computing, a rapidly growing industry. We expect the connectivity and mobile computing demands of Millennials will accelerate. The last stock we are adding to our basket is also the only financial services equity. Though avid consumers, Millennials have shown an aversion to cash, preferring card payment systems, including both debit and credit-based. Accordingly, we are adding the leader in both of these, V, to our Millennials basket (Chart II-11). Investors seeking long-term exposure to stocks lifted by the supremacy of the Millennial generation should own our Millennial basket (AAPL, AMZN, UBER, HD, LEN, MSFT, NFLX, SPOT, TSLA, V). We would not hesitate to add other sharing economy stocks, including Airbnb, to this basket should they become investable in the near future. Theme #5: ESG Becomes Mainstream Investors are increasingly looking at allocating assets based on environmental, social, and governance (ESG) considerations, and this mini-theme has the potential to become a big trend in the 2020s. There are a number of factors that underpin ESG investing. First, Millennials are climate conscious and given that they already are the largest cohort in the US they will not only dominate spending, but also influence election results. Moreover, via social media Millennials can sway public opinion and participate in the ESG conversation. Second, ECB President Christine Lagarde recent speech to the Economic and Monetary Affairs Committee of the European Parliament is a must read.6 If the ECB were to explicitly focus on climate change policy as part of its monetary policy operations then this is a game changer. Green investment financing including “green bonds” could become mainstream. Keep in mind that as reported in the FT, “the European Parliament has declared a climate emergency; the new European Commission (EC) has taken office on a promise of an imminent “green new deal”, and Commission president Ursula von der Leyen has vowed to accelerate emissions cuts.” Last week, the EC released “The European Green Deal” with a pretty aggressive time table. The EC president said “The green deal is Europe’s man on the moon moment” and presented 50 policies slated to get rolled by 2022 to meet revamped climate goals. The implication is that once ESG takes center stage at a number of these institutions, it will be easier to become mainstream and propagate the world over. Third, large institutional investors are starting to adopt an ESG mindset, especially pension plans. These investors with trillions of dollars at their disposal can not only disfavor fossil fuel investment, but also undertake investments in “green projects” via private and public equity markets. Banks are also moving in the “greening of finance” direction and given that they are the pipelines of the global plumbing system, swift adoption will go a long way in taking ESG mainstream. Finally, the electric vehicle (EV) proliferation is another key driver on how the ESG theme will play out in the 2020s. As a reminder, in the US 50% of all energy consumption is gasoline related linked to automobiles. While battery technology still has limitations, EV is no longer a fad as the German and Japanese automakers are starting to make inroads on TSLA. These car manufacturers do not want to be left out, especially if this shift toward EV becomes mainstream in the 2020s. The Chinese are not far behind on the EV manufacturing front, however government policy can really become a game changer. If a number of countries and/or California mandate a large share of all new vehicles sold be EV, then the investment implications will be massive. Investment Implication #8: Avoid Fossil Fuels, Gambling, Alcohol And Tobacco… While there are a few ESG related ETFs, we would rather explore this theme’s investment implications of sectors to avoid in the coming decade. We are believers that ESG criteria will continue to gain in importance in institutional investment management decisions. Accordingly, we would tend to avoid ‘sin stocks’, including gambling, tobacco and alcohol; demand for their services is unlikely to decline but investment weightings should mean that share prices will underperform. Further, we think a clean energy shift will mean energy stocks will likely continue to be long-term underperformers (Chart II-12). Final Thoughts On The US Dollar In this report, we tried to focus on the upcoming decade’s big themes that we expect to play out, and centered our recommendations on US equities/sectors. We do not want to neglect some macroeconomic variables that tend to mean revert over time. Specifically, the US dollar, interest rates and most importantly US indebtedness, will also be key drivers of investment theses in the 2020s. Currently, debt is rising faster than nominal GDP growth with the government and non-financial business debt-to-GDP profiles on an unsustainable path (second panel, Chart II-13). Chart II-12Areas To Avoid As ESG Becomes Mainstream
Areas To Avoid As ESG Becomes Mainstream
Areas To Avoid As ESG Becomes Mainstream
Chart II-13Unsustainable Debt Profiles
Unsustainable Debt Profiles
Unsustainable Debt Profiles
Granted, the saving grace has been generationally low interest rates as the debt service ratios have fallen (top panel, Chart II-13). However, if the four decade bull market in Treasurys is over, or may end definitively with the next US recession sometime in the early 2020s, then rising interest rates are the only mechanism to concentrate CEOs’ and politicians’ minds. On the dollar front, Chart II-14 highlights the ebbs and flows of the trade-weighted US dollar since it floated in the early-1970s. The DXY index has moved in six-to-ten year bull and bear markets. The most recent trough was during the depths of the Great Recession, while the (tentative?) peak was in late-2016. If history repeats, eventually the dollar will mean revert lower in the 2020s, especially given the fiscal profligacy of the current administration that may continue into 2024, assuming President Trump gets re-elected next November. Chart II-14Greenback's Historical Ebbs And Flows
Greenback's Historical Ebbs And Flows
Greenback's Historical Ebbs And Flows
The US dollar remains the reserve currency of the world today, but that exorbitant privilege is clearly fraying on the edges as the balance-of-payments dynamics are heading in the wrong direction. Over the next five years, the US Congressional Budget Office (CBO) estimates that the US budget deficit will swell to 4.8% of GDP. Assuming the current account deficit widens a bit then stabilizes (usually happens when global growth improves), this will pin the twin deficits at 8% of GDP. This assumes no recession, which would have the potential to swell the deficit even further. The US saw its twin deficits swell to almost 13% of GDP following the financial crisis, but the difference then was that in the wake of the commodity boom the dollar was cheap (and commodity currencies overvalued). The subsequent shale revolution also greatly cushioned the US trade deficit. Shale productivity remains robust and US output will continue to rise, but the low-hanging fruit has already been plucked. Chart II-15Twin Deficits Will Weigh On The US Dollar
Twin Deficits Will Weigh On The US Dollar
Twin Deficits Will Weigh On The US Dollar
For one reason or another, foreign central banks are diversifying out of dollars. If due to the changing landscape in trade, this is set to continue. If it is an excuse to shy away from the rapidly rising US twin deficits, this will continue as well. In a nutshell, there has been hardly a time in recent history when the twin deficits in the US were rising and the dollar was in a secular uptrend (Chart II-15). Another dollar-negative force is its expensiveness. By rising 35% since its trough, the USD has sapped the competitiveness of the US manufacturing sector, which is accentuating the American trade deficit outside of the commodity sector. If the ESG trend ends up hurting oil prices, the US current account will follow the widening deficit in manufactured products. Moreover, the US is lagging Europe on the green revolution. Either the US will have to import green technologies, or the US government will have to provide more subsidies to the private sector. Either way, both of these dynamics will hurt the US current account deficit further. Historically, the currency market is the main vehicle to correct such imbalances. The apex of globalization will also hurt the greenback. In a world where all the markets are integrated, borrowers in EM nations often use the reserve currency to issue liabilities at a lower cost. This boosts the demand by EM central banks for US dollar reserves to protect domestic banking systems funded in USD. Moreover, some countries like China implement pegs (both official and unofficial) to the US dollar in order to maintain their competitiveness and export their production surpluses to the US. To do so they buy US assets. If the global economy becomes more fragmented and the Sino-US relationship continues to deteriorate structurally as we expect, then these sources of demand for the dollar will recede. Overlay the widening US current account deficit, and you have the perfect recipe for a depreciating trade-weighted US dollar. Finally, the US is likely to experience more inflation than the rest of the world following the next recession. The US economy has a smaller capital stock as a share of GDP than Europe or Japan, and American demographics are much more robust. This means that the neutral rate of interest is higher in the US than in other advanced economies. As a result, the Fed will have an easier time generating inflation by cutting real rates than both the ECB and the BoJ. Higher inflation will ultimately erode the purchasing power of the dollar and prove to be a structurally negative force for the USD. Anastasios Avgeriou US Equity Strategist Matt Gertken Geopolitical Strategist Marko Papic Chief Strategist, Clocktower Group Chester Ntonifor Foreign Exchange Strategist Mathieu Savary Vice President The Bank Credit Analyst III. Indicators And Reference Charts With a breakthrough in trade talks and Fed officials changing their language to suggest that policy will remain accommodative until inflation meaningfully overshoots 2%, the S&P 500 decisively broke out. Because it eases global financial conditions and boosts the profit outlook, the recent breakdown in the dollar should fuel the equity rally. Tactically, the S&P 500 may have overshot the mark, but on a cyclical basis, stronger growth and an easy Fed will propel US and global stocks higher. Our Revealed Preference Indicator (RPI) remains cautious towards equities. The RPI combines the idea of market momentum with valuation and policy measures. However, our Willingness-to-Pay (WTP) indicator for the US and Japan continues to improve. In Europe, this indicator has finally hooked up. The WTP indicator tracks flows, and thus provides information on what investors are actually doing, as opposed to sentiment indexes that track how investors are feeling. This broad-based improvement therefore bodes well for equities. Moreover, the pickup in Europe suggests that European stocks are increasingly ripe to outperform their US counterparts. Global yields have turned higher but they remain at exceptionally stimulating levels. Moreover, money and liquidity growth remains very strong as global central banks have adopted strongly dovish slants. Additionally, a Fed that will allow inflation to overshoot before tightening policy is adding to this supportive monetary backdrop. As a result, our Monetary Indicator remains at extremely elevated levels. Furthermore, our Composite Technical Indicator is still flashing a buy signal. Finally, our BCA Composite Valuation index is suggesting that stocks are expensive, but not so much as to cancel out the supportive monetary and technical backdrop. As a result, our Speculation Indicator remains in the neutral zone. 10-year Treasurys yields are becoming slightly less expensive, however, they are no bargain. Moreover, our Composite Technical Indicator is quickly moving away from overbought territory but has yet to flash oversold conditions, indicating that yields are roughly half way through their move. The strengthening of the Commodity Index Advance/Decline line and higher natural resource prices further confirm the upside for yields. Therefore, the current setup argues for a below-benchmark duration in fixed-income portfolios. Small signs that global growth is bottoming, such as the stabilization in the global PMIs, the pick-up in the German ZEW and IFO surveys, or the acceleration in Singapore’s container throughput growth, point to a worsening outlook for the counter-cyclical US dollar. Moreover, the dollar trades at a large premium of 24% relative to its purchasing-power parity equilibrium. Additionally, our Composite Technical Indicator is quickly deteriorating after having formed a negative divergence with the Greenback’s level. Since the dollar is a momentum currency, this represents a dark omen for the USD. In fact, we continue to believe that a breakdown in the dollar will be the clearest signal that global growth is rebounding for good. EQUITIES: Chart III-1US Equity Indicators
US Equity Indicators
US Equity Indicators
Chart III-2Willingness To Pay For Risk
Willingness To Pay For Risk
Willingness To Pay For Risk
Chart III-3US Equity Sentiment Indicators
US Equity Sentiment Indicators
US Equity Sentiment Indicators
Chart III-4Revealed Preference Indicator
Revealed Preference Indicator
Revealed Preference Indicator
Chart III-5US Stock Market Valuation
US Stock Market Valuation
US Stock Market Valuation
Chart III-6US Earnings
US Earnings
US Earnings
Chart III-7Global Stock Market And Earnings: Relative Performance
Global Stock Market And Earnings: Relative Performance
Global Stock Market And Earnings: Relative Performance
Chart III-8Global Stock Market And Earnings: Relative Performance
Global Stock Market And Earnings: Relative Performance
Global Stock Market And Earnings: Relative Performance
FIXED INCOME: Chart III-9US Treasurys And Valuations
US Treasurys And Valuations
US Treasurys And Valuations
Chart III-10Yield Curve Slopes
Yield Curve Slopes
Yield Curve Slopes
Chart III-11Selected US Bond Yields
Selected US Bond Yields
Selected US Bond Yields
Chart III-1210-Year Treasury Yield Components
10-Year Treasury Yield Components
10-Year Treasury Yield Components
Chart III-13US Corporate Bonds And Health Monitor
US Corporate Bonds And Health Monitor
US Corporate Bonds And Health Monitor
Chart III-14Global Bonds: Developed Markets
Global Bonds: Developed Markets
Global Bonds: Developed Markets
Chart III-15Global Bonds: Emerging Markets
Global Bonds: Emerging Markets
Global Bonds: Emerging Markets
CURRENCIES: Chart II-16US Dollar And PPP
US Dollar And PPP
US Dollar And PPP
Chart II-17US Dollar And Indicator
US Dollar And Indicator
US Dollar And Indicator
Chart II-18US Dollar Fundamentals
US Dollar Fundamentals
US Dollar Fundamentals
Chart II-19Japanese Yen Technicals
Japanese Yen Technicals
Japanese Yen Technicals
Chart II-20Euro Technicals
Euro Technicals
Euro Technicals
Chart II-21Euro/Yen Technicals
Euro/Yen Technicals
Euro/Yen Technicals
Chart II-22Euro/Pound Technicals
Euro/Pound Technicals
Euro/Pound Technicals
COMMODITIES: Chart II-23Broad Commodity Indicators
Broad Commodity Indicators
Broad Commodity Indicators
Chart II-24Commodity Prices
Commodity Prices
Commodity Prices
Chart III-25Commodity Prices
Commodity Prices
Commodity Prices
Chart III-26Commodity Sentiment
Commodity Sentiment
Commodity Sentiment
Chart III-27Speculative Positioning
Speculative Positioning
Speculative Positioning
ECONOMY: Chart III-28US And Global Macro Backdrop
US And Global Macro Backdrop
US And Global Macro Backdrop
Chart III-29US Macro Snapshot
US Macro Snapshot
US Macro Snapshot
Chart III-30US Growth Outlook
US Growth Outlook
US Growth Outlook
Chart III-31US Cyclical Spending
US Cyclical Spending
US Cyclical Spending
Chart III-32US Labor Market
US Labor Market
US Labor Market
Chart III-33US Consumption
US Consumption
US Consumption
Chart III-34US Housing
US Housing
US Housing
Chart III-35US Debt And Deleveraging
US Debt And Deleveraging
US Debt And Deleveraging
Chart III-36US Financial Conditions
US Financial Conditions
US Financial Conditions
Chart III-37Global Economic Snapshot: Europe
Global Economic Snapshot: Europe
Global Economic Snapshot: Europe
Chart III-38Global Economic Snapshot: China
Global Economic Snapshot: China
Global Economic Snapshot: China
Mathieu Savary Vice President The Bank Credit Analyst Footnotes 1 Please see The Bank Credit Analyst "OUTLOOK 2020: Heading Into The End Game," dated November 22, 2019, available at bca.bcaresearch.com 2 Please see Geopolitical Strategy Special Report "US Election 2020: Civil War Lite," dated November 22, 2019, available at gps.bcaresearch.com 3 Please see Foreign Exchange Strategy Special Report "Riding The Wave: Momentum Strategies In Foreign Exchange Markets," dated December 8, 2017, available at fes.bcaresearch.com 4 Please see Global Asset Allocation Special Report "Safe Haven Review: A Guide To Portfolio Protection In The 2020s," dated October 29, 2019, available at gaa.bcaresearch.com. 5 Please see US Equity Strategy Special Report "Brothers In Arms," dated October 31, 2016, available at uses.bcaresearch.com 6 https://www.imf.org/en/News/Articles/2019/09/04/sp090419-Opening-Statement-by-Christine-Lagarde-to-ECON-Committee-of-European-Parliament
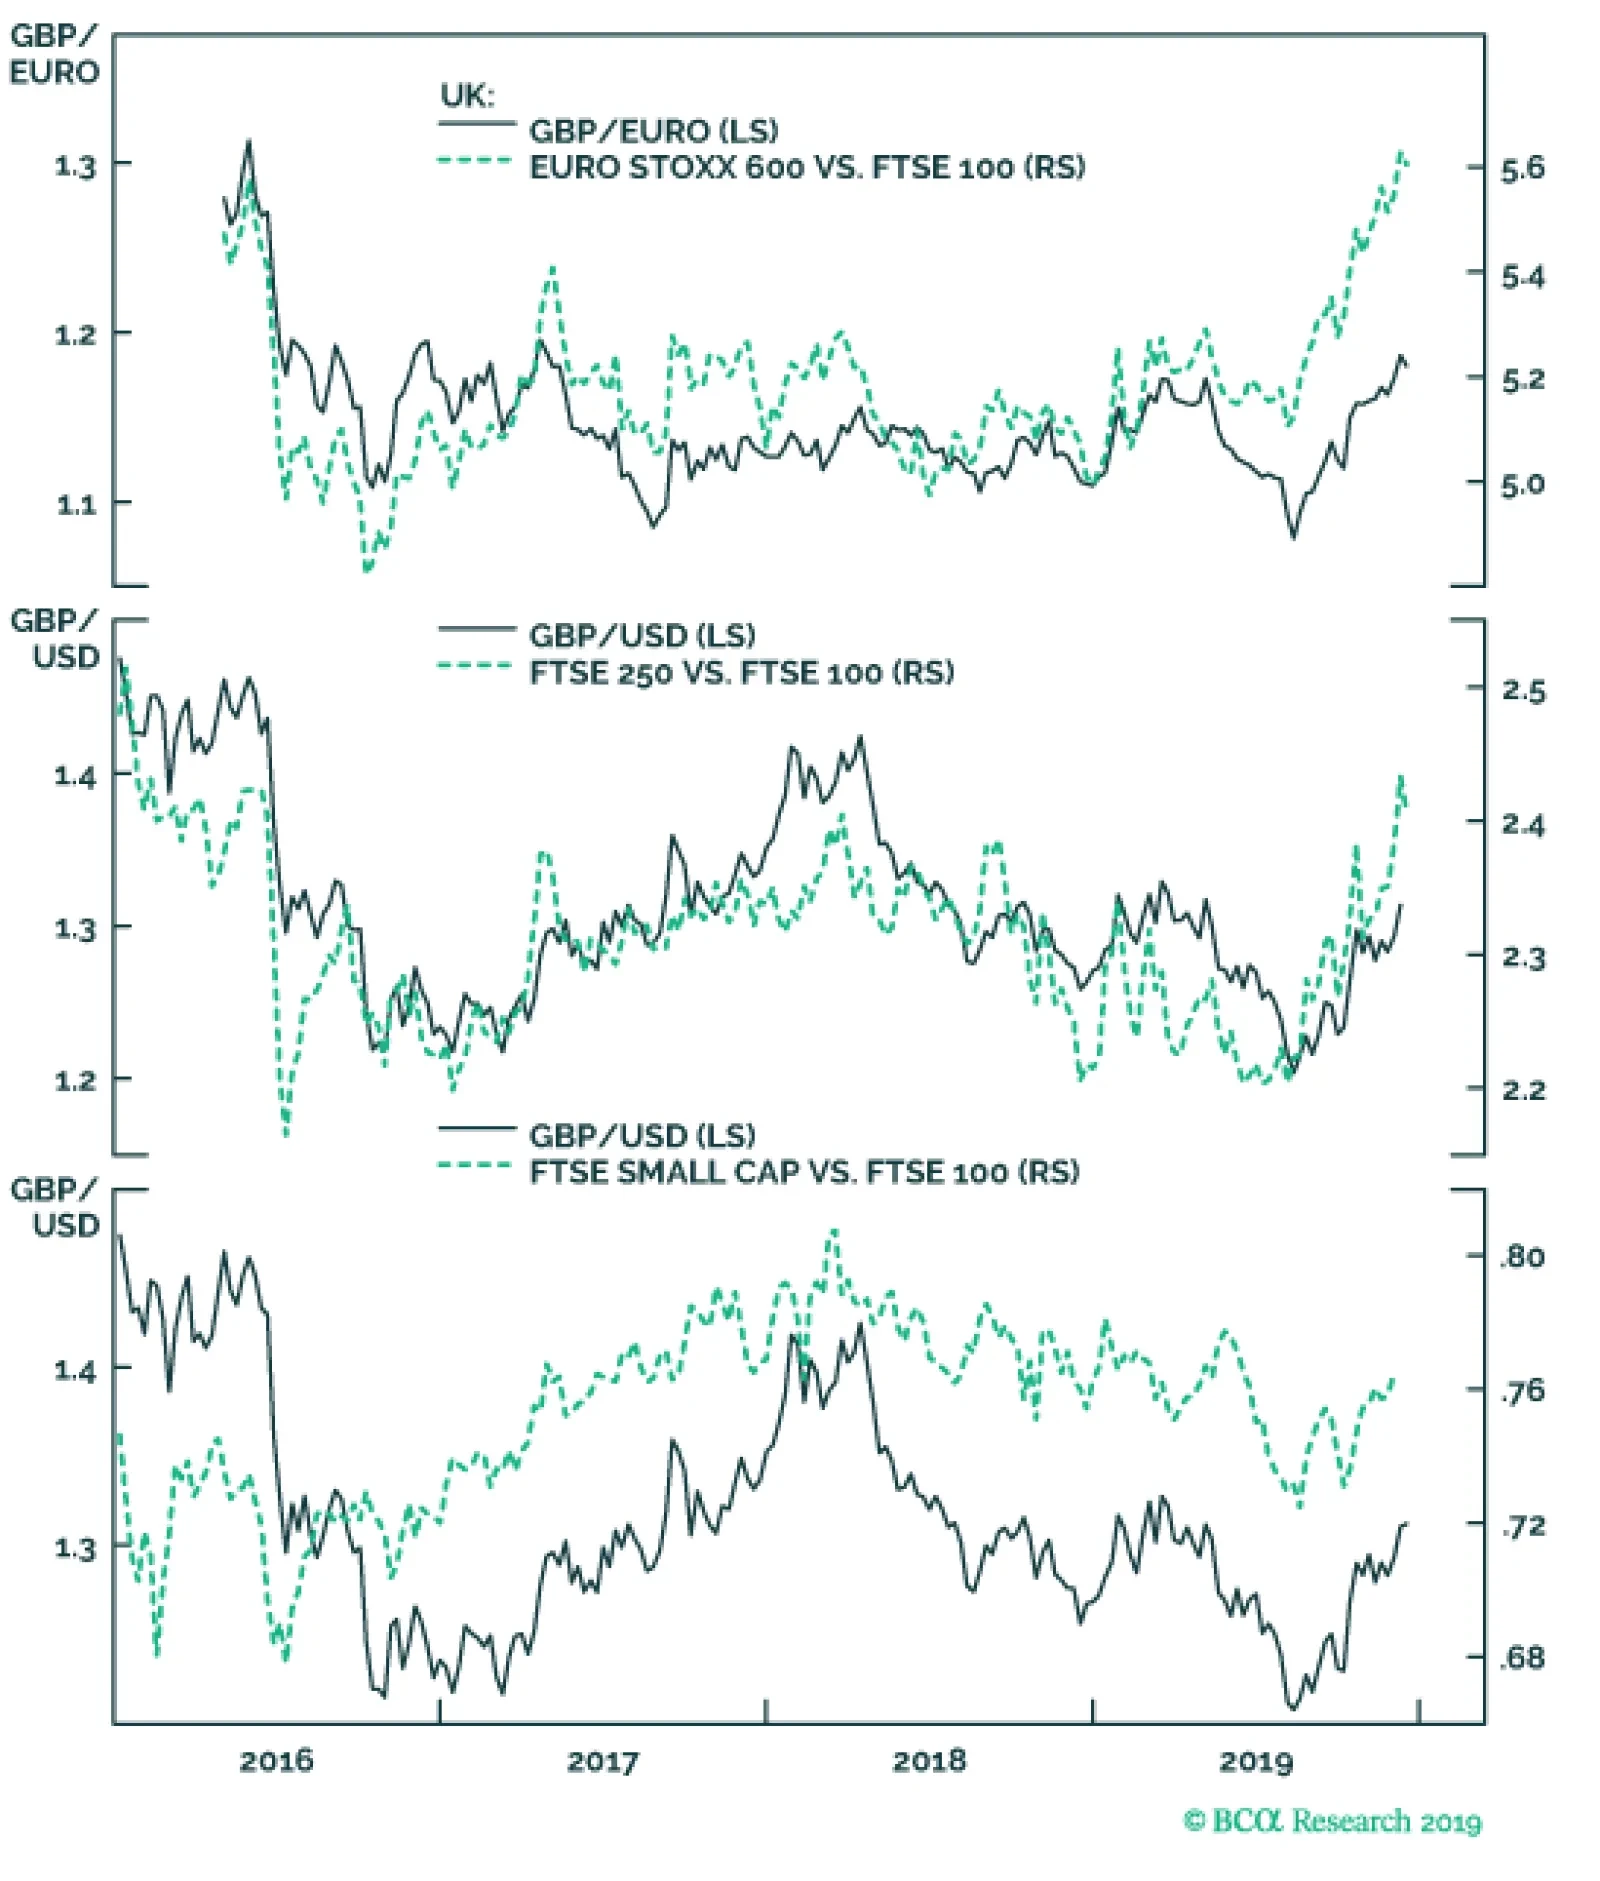
Conservatives won 364 seats last night. This comfortable majority for the Conservatives is a medium-term positive for UK exposed investments, as Prime Minister Boris Johnson is not dependent on the 20 or so hard Brexit extremists to pass any free trade…
Highlights 2019 was a good year for our constraint-based method of political analysis. Trump was impeached, the trade war escalated, and China (modestly) stimulated – all as predicted. Nevertheless Trump caught us by surprise in Q2, with sanctions on Iran and tariffs on China. Our best trades were long defense stocks, gold, and Swiss bonds. Our worst trade was long rare earth miners. Feature Jean Buridan’s donkey starved to death because, faced with equal bundles of grain on both sides, it could not decide which to eat. So the legend goes. Investors face indecision all the time. This is especially the case when a geopolitical sea change is disrupting the global economy. Two or more political outcomes may seem equally plausible, heightening uncertainty. What is needed is a method for eliminating the options that require the farthest stretch. That’s what we offer in these pages, but we obviously make mistakes. The purpose of our annual report card is to identify our biggest hits and misses so we can hone our ability to combine fundamental macro and market analysis with the “art of the possible,” delivering better research and greater returns for clients. This is our last report for 2019. Next week we will publish a joint report with Anastasios Avgeriou of BCA Research’s US Equity Strategy. We will resume publication in early January. We wish all our clients a merry Christmas, happy holidays, and a happy new year! American Politics: Unsurprising Surprises Chart 1Our 2019 Forecast Held Up
Our 2019 Forecast Held Up
Our 2019 Forecast Held Up
On the whole our 2019 forecast held up very well. We argued that the global growth divergence that began in 2018 would extend into 2019 with the Fed hiking rates, a lack of massive stimulus from China, and an escalation in the US-China trade war. The biggest miss was that the Fed actually cut rates three times – addressed at length in our BCA Research annual outlook. But the bulk of the geopolitical story panned out: the US dollar, US equities, and developed market equities all outperformed as we expected (Chart 1). Geopolitical risk in the Trump era is centered on Trump himself. Beginning in 2017, we argued that the Democrats would take the House of Representatives in the midterm elections and impeach the president. Congress would not be totally gridlocked: while we argued for a government shutdown in late 2018, we expected a large bipartisan budget agreement in late 2019 and always favored the passage of the USMCA trade deal. Still, Congress would encourage Trump to go abroad in pursuit of policy victories, increasing geopolitical risks. We also argued that, barring “smoking gun” evidence of high crimes, the Republican-held Senate would acquit Trump – assuming his popularity held up among Republican voters themselves (Chart 2). These views either transpired or remain on track. The implication is that Trump-related risk continues and yet that Trump’s policies are ultimately constrained by the guardrails of the election. The latter factor helped propel the equity rally in the second half of the year. We largely sat out that rally, however. We overestimated the chances that Senator Bernie Sanders would falter and Senator Elizabeth Warren would swallow his votes, challenging former Vice President Joe Biden for the leading position in the early Democratic Party primary. We expected a significant bout of equity volatility via fears of a sharp progressive-populist turn in US policy (Chart 3). Instead, Sanders staged a recovery, Warren fell back, Biden maintained his lead, and markets rallied on other news. Chart 2Trump Will Be Acquitted
How Are We Doing? ... Geopolitical Strategy 2019 Report Card
How Are We Doing? ... Geopolitical Strategy 2019 Report Card
Chart 3Fears Of A Progressive Turn Did Not Derail The H2 Rally
How Are We Doing? ... Geopolitical Strategy 2019 Report Card
How Are We Doing? ... Geopolitical Strategy 2019 Report Card
Warren could still recover and win the nomination next year. But the Democratic Primary was not a reason to remain neutral toward equities, as we did in September and October. China’s Tepid Stimulus In recent years China first over-tightened and then under-stimulated the economy – as we predicted. But we misread the credit surge in the first quarter as a sign that policymakers had given up on containing leverage. In total this year’s credit surge amounts to 3.4% of GDP, about 1.2% short of what we expected (based on half of the 9.2% surge in 2015-16) (Chart 4). China’s credit surge was about 1.2% short of what we expected, but the direction was correct. While the government maintained easy monetary policy as expected, its actions combined with negative sentiment to snuff out the resurgence in shadow banking by mid-year (Chart 5). Chart 4China's Credit Surge Was Underwhelming
China's Credit Surge Was Underwhelming
China's Credit Surge Was Underwhelming
Still, China’s policy direction is clear – and fiscal policy is indeed carrying a greater load. The authorities are extremely unlikely to reverse course next year, so global activity should turn upward (Chart 6). Our “China Play Index” – iron ore prices, Swedish industrials, Brazilian stocks, and EM junk bonds, all in USD terms – has appreciated steadily (Chart 7). Chart 5China's Shadow Banking Remained Under Pressure
China's Shadow Banking Remained Under Pressure
China's Shadow Banking Remained Under Pressure
Chart 6Global Activity Should Turn Upward In 2020
Global Activity Should Turn Upward In 2020
Global Activity Should Turn Upward In 2020
Chart 7Our 'China Play Index' Performed Well
Our 'China Play Index' Performed Well
Our 'China Play Index' Performed Well
US-China: Underestimating Trump’s Risk Appetite We have held a pessimistic assessment of US-China relations since 2012. We rejected the trade truces agreed at the G20 summits in December 2018 and June 2019 as unsustainable. Our subjective probabilities of Trump achieving a bilateral trade agreement with China have never risen above 50%. Since September we have expected a ceasefire but not a full-fledged deal. Nevertheless we struggled with the timing of the trade war ups and downs (Chart 8). In particular we accepted China's new investment law as a sufficient concession and were surprised on May 5 when talks collapsed and Trump increased the tariffs. The lack of constraints on tariffs prevailed in 2019 but in 2020 the electoral constraint will prevail as long as Trump still has a chance of winning. Our worst trade recommendation of the year emerged from our correct view that the June G20 summit would lead to trade war escalation. We went long rare earth miners based outside of China. We expected China to follow through on threats to impose a rare earth embargo on the US in retaliation for sanctions against Chinese telecom giant Huawei. Not only did the US grant Huawei a reprieve, but China’s rare earth companies outperformed their overseas rivals. The trade went deeply into the red as global sentiment and growth fell (Chart 9). Only with global growth turning a corner have these high-beta stocks begun to turn around. Chart 8Expect A Ceasefire, Not A Full-Fledged Trade Agreement
Expect A Ceasefire, Not A Full-Fledged Trade Agreement
Expect A Ceasefire, Not A Full-Fledged Trade Agreement
Chart 9Our Worst Call: Long Rare Earth Miners
Our Worst Call: Long Rare Earth Miners
Our Worst Call: Long Rare Earth Miners
Chart 10North Korean Diplomacy Has Not Collapsed (Yet)
North Korean Diplomacy Has Not Collapsed (Yet)
North Korean Diplomacy Has Not Collapsed (Yet)
Our sanguine view on North Korea was largely offside this year. Setbacks in US negotiations with North Korea have often preceded setbacks in US-China talks. This was the case with the failed Hanoi summit in February and the inconsequential summit at the demilitarized zone in June. This could also be the case in 2020, as Washington and Pyongyang are now on the verge of breaking off talks with the latter threatening a “Christmas surprise” such as a nuclear or missile test. It is not too late to return to talks. Beijing is the critical player and is still enforcing crippling sanctions on North Korea (Chart 10). Beijing would benefit if North Korea submitted to nuclear and missile controls while the US reduced its military presence on the peninsula. We view this year as a hiccup in North Korean diplomacy but if talks utterly collapse and military tensions break out then it would undermine our view on US-China talks, Trump’s reelection odds, and US Treasuries in 2020. Hong Kong, rather than Taiwan, became the site of the geopolitical “Black Swan” that we expected surrounding Xi Jinping’s aggressive approach to domestic dissent. We have never downplayed Hong Kong. The loss of faith in the governing arrangement with the mainland began with the Great Recession and shows no sign of abating (Chart 11). We shorted the Hang Seng after the protests began, but closed at the appropriate time (Chart 12). The problem is not resolved. Also, Taiwan can test its autonomy much farther than Hong Kong and we still expect Taiwan to become ground zero of Greater China political risk and the US-China conflict. Chart 11Hong Kong Discontent Is Structural
How Are We Doing? ... Geopolitical Strategy 2019 Report Card
How Are We Doing? ... Geopolitical Strategy 2019 Report Card
Chart 12Our Hang Seng Short Is Done
Our Hang Seng Short Is Done
Our Hang Seng Short Is Done
Chart 13Trump Needs A Trade Ceasefire
Trump Needs A Trade Ceasefire
Trump Needs A Trade Ceasefire
Trump is unlikely to seek another trade war escalation given the negative impact it would have on sentiment and the economy (Chart 13). He could engage in another round of “fire and fury” saber-rattling against North Korea, as the economic impact is small, but he will prefer a diplomatic track. Taiwan, however, cannot be contained so easily if tempers flare. As we go to press it is not clear if Trump will hike the tariff on China on December 15. Some investors would point to his tendency to take aggressive action when the market gives him ammunition (Chart 14). We doubt he will, as this would be a policy mistake – possibly quickly reversed or possibly fatal for Trump. Trump’s electoral constraint is more powerful in 2020 than it was in 2019. Chart 14Trump Ceasefire Will Last As Long As Economy Is At Risk
Trump Ceasefire Will Last As Long As Economy Is At Risk
Trump Ceasefire Will Last As Long As Economy Is At Risk
Chart 15Our 'Doomsday Basket' Captured Trump's First Three Years
Our 'Doomsday Basket' Captured Trump's First Three Years
Our 'Doomsday Basket' Captured Trump's First Three Years
Our best tactical trade of the year stemmed from the geopolitical risk in Asia (and the Fed’s pause): we recommended a long gold position this summer that gained 16%. We also closed out our “Doomsday Basket” of gold and Swiss bonds, initiated in Trump’s first year, for a gain of 14% (Chart 15). Now that the market has digested Trump’s tactical retreat, we have reinitiated the gold trade as a long-term strategic hedge against both short-term geopolitical crises and the long-term theme of populism. Iran: Fool Me Once, Shame On You … This is the second year in a row that we are forced to explain our analysis of Iran – we were only half-right. Our long-held view is that grand strategy will push the US to pivot to Asia to counter China while scaling back its military activity in the Middle East. Two American administrations have confirmed this trend. That said, there is still a risk that President Trump will get entangled in Iran and that risk is growing. Global oil volatility – which spiked during the market share wars of 2014 – declined through the beginning of 2018, until the Trump administration took clearer steps toward a policy of “maximum pressure” on Iran. The constraints on Trump are obvious: the US economy is still affected by oil prices, which are set globally, and Iran can damage supply and push up prices. Therefore Trump should back down prior to the 2020 election. Yet Trump imposed sanctions, waivered on them, and then re-imposed them in May 2019 – catching us by surprise each time (Chart 16). Chart 16Trump Flip-Flopped On Iran Policy
Trump Flip-Flopped On Iran Policy
Trump Flip-Flopped On Iran Policy
Chart 17Iran Tensions Backwardated Oil Markets
Iran Tensions Backwardated Oil Markets
Iran Tensions Backwardated Oil Markets
This saga is not resolved – we are witnessing what could become a secular bull market in Iran tensions. True, a Democratic victory in 2020 could lead to an eventual restoration of the 2015 nuclear deal. True, the Trump administration could strike a deal with the Iranians (especially after reelection). But no, it cannot be assumed that the US will restore the historic 2015 détente with Iran. Within Iran the regime hardliners are likely to regain control in advance of the extremely uncertain succession from Supreme Leader Ali Khamenei and this will militate against reform and opening up. We went long Brent crude Q1 2020 futures relative to Q1 2021 to show that tensions were not resolved (Chart 17) – the attack on Saudi Arabia in September confirmed this view. And yet the oil price shock was fleeting as global supply was adequate and demand was weak. Our current long Brent spot trade is not only about Iran. Global growth is holding up and likely to rebound thanks to monetary stimulus and trade ceasefire, OPEC 2.0 has strong incentives to maintain production discipline (driven by both Saudi Arabian and Russian interests), and the Iranian conflict has led to instability in Iraq, as we expected. The UK: Not Dead In A Ditch British Prime Minister Boris Johnson proclaimed this year that he would "rather be dead in a ditch” than extend the deadline for the UK to leave the EU. The relevant constraint was that a disorderly “no deal” exit would have meant a recession, which we used as our visual illustration of why Johnson would not actually die in a ditch (Chart 18). The test was whether parliament could overcome its coordination problems when it reconvened in September, which it immediately did, prompting us to go long GBP-USD on September 6 (Chart 19). This trade was successful and we remain long GBP-JPY. Chart 18The Reason We Rejected
How Are We Doing? ... Geopolitical Strategy 2019 Report Card
How Are We Doing? ... Geopolitical Strategy 2019 Report Card
Chart 19UK Parliament Voted Down No-Deal Brexit
UK Parliament Voted Down No-Deal Brexit
UK Parliament Voted Down No-Deal Brexit
Populism faltered in Europe, as expected. As we go to press, the UK Christmas election is reported to have produced a whopping Conservative majority. This year Johnson mounted the most credible threat of a no-deal Brexit that we are ever likely to see and yet ultimately delayed Brexit. The Conservative victory will produce an orderly Brexit. The trade deal that needs to be negotiated next year will bring volatility but it does not have a firm deadline and is not harder to negotiate than Brexit itself. The UK has passed through the murkiest parts of Brexit uncertainty. Moreover, our high-conviction view that more dovish fiscal policy would be the end-result of the Brexit saga is now becoming consensus. Europe: Not The Crisis You Were Looking For The European Union was a geopolitical “red herring” in 2019 as we expected. Anti-establishment feeling remained contained. Italy remains the weakest link in the Euro Area, but the political “turmoil” of 2018-19 is the populist exception that mostly proves the rule: Europeans are not as a whole rebelling against the EU or the euro. On France, Italy, and Spain our views were fundamentally correct. Even in the European parliament, where anti-establishment players have a better chance of taking seats than in their home governments, the true Euroskeptics who want to exit the union only make up about 16% of the seats (Chart 20). This is up from 11% prior to the elections in May this year. Chart 20Euroskepticism Was Overstated
How Are We Doing? ... Geopolitical Strategy 2019 Report Card
How Are We Doing? ... Geopolitical Strategy 2019 Report Card
Yet the European political establishment is losing precious time to prepare for the next wave of serious agitation, likely when a full-fledged recession comes. Chart 21Trump Did Not Pile Tariffs Onto Auto Sector
Trump Did Not Pile Tariffs Onto Auto Sector
Trump Did Not Pile Tariffs Onto Auto Sector
Germany is experiencing a slow transition from the long reign of Angela Merkel, whose successor has plummeted in opinion polls. The shock of the global slowdown – particularly heavy in the auto sector (Chart 21) – hastened Germany’s succession crisis. Chart 22Overstated EU Political Risk, Understated Chinese Risk
Overstated EU Political Risk, Understated Chinese Risk
Overstated EU Political Risk, Understated Chinese Risk
There is a silver lining: this shock is forcing the Germans to reckon with de-globalization. Attitudes across the country are shifting on the critical question of fiscal policy. Even the conservative Christian Democrats are loosening their belts in the face of the success of the Green Party and a simultaneous change in leadership among the Social Democrats to embrace bigger spending. The Trump administration refrained from piling car tariffs onto Europe amidst this slowdown in the automobile sector and overall economy. We expected this delay, as there is little support in the US for a trade war with Europe, contra China, and it is bad strategy to fight a two-front war. But if the US economy recovers robustly and Trump is emboldened by a China deal then this risk could reignite in future. With European political risk overstated, and Chinese mainland risk understated, we initiated a long European equities relative to Chinese equities trade (Chart 22), as recommended by our colleagues at BCA Research European Investment Strategy. And now we are initiating the strategic long EUR/USD recommendation that we flagged in September with a stop at 1.18. Japan: Shinzo Abe Has Peaked Japanese Prime Minister Shinzo Abe is still in power and still very popular, whether judged by the average prime minister in modern memory or his popular predecessor Junichiro Koizumi. But he is at his peak and 2019 did indeed mark the turning point – it is all downhill from here. First, he lost his historic double super-majority in the Diet by falling to a mere majority in the upper house (Chart 23). He is still capable of revising the constitution, but now it is now harder – and the high water mark of his legislative power has been registered. Chart 23Abe Lost His Double Super Majority
How Are We Doing? ... Geopolitical Strategy 2019 Report Card
How Are We Doing? ... Geopolitical Strategy 2019 Report Card
Chart 24Consumption Tax Hike Shows Limits Of Abenomics
Consumption Tax Hike Shows Limits Of Abenomics
Consumption Tax Hike Shows Limits Of Abenomics
Second, he proceeded with a consumption tax from 8% to 10% that predictably sent the economy into a tailspin given the global slowdown (Chart 24). We thought the tax hike would be delayed, but Abe opted to hike the tax and then pass a stimulus package to compensate. This decision further supports the view that Abe’s power will decline going forward. It is now incontrovertible that the Liberal Democrats are eschewing a radical plan of debt monetization in which they coordinate ultra-dovish fiscal policy with ultra-dovish monetary policy. “Abenomics” has not necessarily failed but it is a fully known quantity. Abe will next preside over the 2020 summer Olympics and prepare to step down as Liberal Democratic party leader in September 2021. It is conceivable he will stay longer, but the likeliest successors have been put into cabinet positions, including Shinjiro Koizumi, son of the aforementioned, whom we would not rule out as a future prime minister. Constitutional revision or a Russian peace deal could mark the high point of his premiership, but the peak macro consequences have been felt. Japan suffered a literal and figurative earthquake in 2011. Over the long run Tokyo will resort to more unorthodox economic policies and redouble its efforts at reflation. But not until the external environment demands it. This suggests that the JPY-USD is a good hedge against risks to the cyclically bullish House View in 2020 and supports an overweight stance on Japanese government bonds. Emerging Markets: Notable Mentions India: We were correct that Narendra Modi would be reelected as prime minister, but we did not expect that he would win a single-party majority for a second time (Chart 25). The risk is that this result leads to hubris – particularly in foreign policy and domestic social policy – rather than accelerating structural reform. But for now we remain optimistic about reform. Chart 25
How Are We Doing? ... Geopolitical Strategy 2019 Report Card
How Are We Doing? ... Geopolitical Strategy 2019 Report Card
East Asia: We are optimistic on Southeast Asia in the context of US-China competition. But we proved overly optimistic on Malaysia and Indonesia this year, while we missed a chance to close our long Thai equity trade when it would have been very profitable to do so. Turkey: Domestic political challenges to President Recep Tayyip Erdoğan have led to a doubling down on unorthodox monetary policy and profligate fiscal policy, as expected. Early in the year we advised clients that Erdoğan would delay deployment of the Russian S-400 air defense system in deference to the US but it quickly became clear that this was not the case. Thus we correctly anticipated the sharp drop in the lira over the autumn (Chart 26). The US-Turkey relationship continues to fray and additional American sanctions are likely. Russia: President Vladimir Putin focused on maintaining domestic stability amid tight fiscal and monetary policy in 2019. This solidified our positive relative view of Russian currency and equities (Chart 27). But it also highlighted longer-term political risks. We expect this trend to continue, but by the same token Russia is a potential “Black Swan” risk in 2020. Chart 26The Lira's Autumn Relapse
The Lira's Autumn Relapse
The Lira's Autumn Relapse
Chart 27Russia's Eerie Quiet In 2019
Russia's Eerie Quiet In 2019
Russia's Eerie Quiet In 2019
Venezuela: Venezuela’s President Nicolas Maduro eked out another year of regime survival in 2019 despite our high-conviction view since 2017 that he would be finished. However, the economy is still collapsing and Russian and Chinese assistance is still limited (Chart 28). Before long the military will need to renovate the regime, even if our global growth and oil outlook for next year is positive for the regime on the margin. Chart 28Maduro Clung To Power
Maduro Clung To Power
Maduro Clung To Power
Chart 29Our 2019 Winner: Global Defense Stocks
Our 2019 Winner: Global Defense Stocks
Our 2019 Winner: Global Defense Stocks
Brazil: We were late to the Brazilian equity rally. While we have given the Jair Bolsonaro administration the benefit of the doubt, a halt to structural reforms in 2020 would prove us wrong. Our worst trade of the year was long rare earth miners, mentioned above. Our best trade was long global defense stocks (Chart 29), a structural theme stemming from the struggle of multiple powerful nations in the twenty-first century. Matt Gertken Vice President Geopolitical Strategist mattg@bcaresearch.com Roukaya Ibrahim Editor/Strategist Geopolitical Strategy RoukayaI@bcaresearch.com Ekaterina Shtrevensky Research Analyst ekaterinas@bcaresearch.com Jingnan Liu Research Associate jingnan@bcaresearch.com Marko Papic Consulting Editor marko@bcaresearch.com
The 2019 UK General Election result offers four possible medium-term outcomes for UK exposed investments: Conservatives win 340 seats or more: This comfortable majority for the Conservatives is medium-term positive for UK exposed investments, as prime minister Johnson would not be dependent on the 20 or so hard Brexit extremists to pass any free trade deal (FTA) through parliament. Albeit the markets are already pricing the Conservatives to win 337-343 seats. Conservatives win 320-340 seats: This marginal majority for the Conservatives is medium-term risky for UK exposed investments, because the hard Brexit extremists would have disproportionate influence and leverage, keeping open the possibility of a hard Brexit on WTO terms after the standstill transition period ends on December 31 2020. Conservatives win 310-320 seats: This ‘marginally hung’ parliament is medium-term risky for UK exposed investments, as it is essentially no change from the current gridlocked parliament. Conservatives win less than 310 seats: This ‘comfortably hung’ parliament is medium-term positive for UK exposed investments, as it creates the possibility of the softest (or no) Brexit under a Labour-led minority government. At the same time, a minority government would be unable to pass its most contentious and supposedly ‘market unfriendly’ policies. If the result is 2. the marginal majority, and the market does not appreciate the risk, then it presents a sell opportunity. Conversely, if the result is 4. the comfortably hung parliament, and the market does not appreciate the upside, then it presents a buy opportunity. Fourth Time Lucky For The UK Pollsters? The 2019 UK General Election is the fourth major UK vote since 2015 in which the UK/EU relationship has featured front and centre. The first was the 2015 General Election, in which then prime minister David Cameron promised a referendum on EU membership, subject to the Conservative party winning an outright parliamentary majority, which it duly did. The second was the subsequent 2016 in/out EU referendum in which the UK voted to leave the EU. The third was the 2017 General Election called by prime minister May to bolster her Brexit negotiating position. But May’s plan backfired. She managed to lose the Conservative majority, her party’s Brexit negotiating position, and ultimately her job. So here we are at the fourth major UK vote in little over four years. Significantly, the pollsters got the 2015, 2016, and 2017 UK votes very wrong. In 2015, they predicted a hung parliament; but the actual outcome was a comfortable majority for the Conservatives, forcing Cameron to deliver his promise of an EU referendum. In the ensuing 2016 referendum, the pollsters predicted a narrow win for remain; the actual outcome was a narrow win for leave. Then in 2017, the pollsters predicted a very healthy vote share win for the Conservatives – and the spread betting markets priced the party to win 364-370 seats in the 650 seat UK parliament; but the actual outcome was 317 seats and a hung parliament – because the pollsters had underestimated the Labour vote by five percentage points. Today, just as in 2017, the pollsters are predicting a healthy vote share win and comfortable parliamentary majority for the Conservatives. At the time of writing (election eve) the spread betting markets are pricing the Conservative party to win 337-343 seats. When the election day exit poll comes out at 10pm UK time, we will get a good idea whether it is fourth time lucky for the pollsters. But irrespective of whether they are right or wrong, the immediate market reaction might still offer some medium-term investment opportunities. The Key Numbers… And Where The Immediate Market Reaction Could Be Wrong The Conservatives need a working majority – because having burnt their bridges with the DUP (Northern Ireland unionists), no other party is likely to support prime minister Johnson’s EU withdrawal agreement. Given that the speaker, deputy speakers, and Sinn Fein (Northern Ireland republicans) do not vote in the UK parliament, and depending on the number of seats that Sinn Fein win, the threshold for a working majority will be around 320 seats. This creates four potential outcomes for the markets: Conservatives win 340 seats or more: This comfortable majority for the Conservatives is medium-term positive for UK exposed investments, as Johnson would not be dependent on the 20 or so hard Brexit extremists to pass any free trade deal (FTA) through parliament. But as noted above, the markets are already pricing the Conservatives to win 337-343 seats. Conservatives win 320-340 seats: This marginal majority for the Conservatives is medium-term risky for UK exposed investments, because the hard Brexit extremists would have disproportionate influence and leverage, keeping open the possibility of a hard Brexit on WTO terms after the standstill transition period ends on December 31 2020. Conservatives win 310-320 seats: This ‘marginally hung’ parliament is medium-term risky for UK exposed investments, as it is essentially no change from the current gridlocked parliament. Conservatives win less than 310 seats: This ‘comfortably hung’ parliament is medium-term benign for UK exposed investments, as it creates the possibility of the softest (or no) Brexit under a Labour-led minority government. At the same time, a minority government would be unable to pass its most contentious and supposedly ‘market unfriendly’ policies. Of these four possibilities, if the immediate market reactions to 2. the marginal majority, or 4. the comfortably hung parliament do not appreciate the risk and upside respectively, then they will create sell and buy opportunities for UK exposed investments. What Are The UK Exposed Investments? The most obvious UK exposed investment is the pound, which is still trading at a near 10 percent discount versus the euro and the dollar, based on the pre-referendum relationship with real interest rate differentials (Chart I-1 and Chart I-2). However, the extent to which that discount can narrow depends on how much worse off (if at all) the UK economy finds itself in its new trading relationships with the EU and the rest of the world compared with full membership of the EU. Chart I-1The Pound Is Cheap Versus The Euro
The Pound Is Cheap Versus The Euro
The Pound Is Cheap Versus The Euro
Chart I-2The Pound Is Cheap Versus The Dollar
The Pound Is Cheap Versus The Dollar
The Pound Is Cheap Versus The Dollar
In this regard, the best outcomes are a rapidly negotiated and maximally-aligned FTA with the EU, or the softest (or no) Brexit. Meaning that the aforementioned possibilities 1. or 4. – a comfortable Conservative win or a comfortably hung parliament – are the best outcomes for the UK economy, and therefore for the pound. To the extent that the Bank of England policymakers recognise this, the same conclusion applies to the direction of UK gilt yields, and therefore inversely to UK gilt prices. Turning to the stock market, the FTSE100 is categorically not a UK exposed investment – because it comprises multinationals with minimal exposure to the UK economy. If anything, the FTSE100 is an anti-UK exposed investment. This is because sales and profits are denominated in international currencies, and if these non-pound currencies weaken versus the pound (meaning the pound strengthens) it weighs down the pound-denominated FTSE100 versus other markets (Chart I-3). In fact, the ‘real’ UK stock market is the more UK focussed FTSE250 (Chart I-4), or the FTSE Small Cap index (Chart I-5). Chart I-3When The Pound Strengthens, The FTSE 100 Underperforms
When The Pound Strengthens, The FTSE 100 Underperforms
When The Pound Strengthens, The FTSE 100 Underperforms
Chart I-4The 'Real' UK Stock Market Is The FTSE 250, Not The FTSE 100
The 'Real' UK Stock Market Is The FTSE 250, Not The FTSE 100
The 'Real' UK Stock Market Is The FTSE 250, Not The FTSE 100
Chart I-5Small Caps Are Exposed To The UK Economy
Small Caps Are Exposed To The UK Economy
Small Caps Are Exposed To The UK Economy
In terms of equity sectors, the least exposed to the UK economy are the multinationals with international currency earnings. As well as the obvious oil and gas, resources, and healthcare sectors, it includes the global banks and clothing and apparel (Chart I-6). Chart I-6Clothing Is Not Exposed To The UK Economy
Clothing Is Not Exposed To The UK Economy
Clothing Is Not Exposed To The UK Economy
The sectors most exposed to the UK economy are the homebuilders (Chart 7), real estate (Chart 8), and general retailers (Chart 9). All of these, plus the FTSE250 and FTSE Small Cap, and of course the pound, can outperform in the medium term in the aforementioned possibilities 1. and 4. – a comfortable win for the Conservatives or a comfortably hung parliament. But they will face pressure in possibilities 2. and 3. – a marginal win for the Conservatives or a marginally hung parliament. Chart I-7Homebuilders Are Exposed To The UK Economy
Homebuilders Are Exposed To The UK Economy
Homebuilders Are Exposed To The UK Economy
Chart I-8Real Estate Is Exposed To The UK Economy
Real Estate Is Exposed To The UK Economy
Real Estate Is Exposed To The UK Economy
Chart I-9General Retailers Are Exposed To The UK Economy
General Retailers Are Exposed To The UK Economy
General Retailers Are Exposed To The UK Economy
Fractal Trading System* This week's recommended trade is long nickel / short gold, the reverse of the successful trade we recommended on October 3. Back then the nickel price had become technically extended due to scares about an Indonesian export ban. And as predicted, the price subsequently collapsed (by 30 percent) to the point where the price has now become technically depressed. Accordingly, this week's recommendation is long nickel / short gold setting a profit target of 10 percent with a symmetrical stop-loss. The rolling 1-year win ratio stands at 64 percent.
A UK Election Special (Again)
A UK Election Special (Again)
When the fractal dimension approaches the lower limit after an investment has been in an established trend it is a potential trigger for a liquidity-triggered trend reversal. Therefore, open a countertrend position. The profit target is a one-third reversal of the preceding 13-week move. Apply a symmetrical stop-loss. Close the position at the profit target or stop-loss. Otherwise close the position after 13 weeks. Use the position size multiple to control risk. The position size will be smaller for more risky positions. * For more details please see the European Investment Strategy Special Report “Fractals, Liquidity & A Trading Model,” dated December 11, 2014, available at eis.bcaresearch.com. Dhaval Joshi Chief European Investment Strategist dhaval@bcaresearch.com Fractal Trading Model
A UK Election Special (Again)
A UK Election Special (Again)
A UK Election Special (Again)
A UK Election Special (Again)
Cyclical Recommendations Structural Recommendations
A UK Election Special (Again)
A UK Election Special (Again)
A UK Election Special (Again)
A UK Election Special (Again)
A UK Election Special (Again)
A UK Election Special (Again)
A UK Election Special (Again)
A UK Election Special (Again)
Trades Closed Trades Asset Performance Currency & Bond Equity Sector Country Equity Indicators Bond Yields Chart II-1Indicators To Watch - Bond Yields
Indicators To Watch - Bond Yields
Indicators To Watch - Bond Yields
Chart II-2Indicators To Watch - Bond Yields
Indicators To Watch - Bond Yields
Indicators To Watch - Bond Yields
Chart II-3Indicators To Watch - Bond Yields
Indicators To Watch - Bond Yields
Indicators To Watch - Bond Yields
Chart II-4Indicators To Watch - Bond Yields
Indicators To Watch - Bond Yields
Indicators To Watch - Bond Yields
Interest Rate Chart II-5Indicators To Watch - Interest Rate Expectations
Indicators To Watch - Interest Rate Expectations
Indicators To Watch - Interest Rate Expectations
Chart II-6Indicators To Watch - Interest Rate Expectations
Indicators To Watch - Interest Rate Expectations
Indicators To Watch - Interest Rate Expectations
Chart II-7Indicators To Watch - Interest Rate Expectations
Indicators To Watch - Interest Rate Expectations
Indicators To Watch - Interest Rate Expectations
Chart II-8Indicators To Watch - Interest Rate Expectations
Indicators To Watch - Interest Rate Expectations
Indicators To Watch - Interest Rate Expectations