Economic Growth

Dear Client, We are sending you our Strategy Outlook today where we outline our thoughts on the global economy and the direction of financial markets for 2022 and beyond. Next week, please join me for a webcast on Friday, December 10th at 10:00 AM EST (3:00 PM GMT, 4:00 PM CET, 11:00 PM HKT) to discuss the outlook. Also, we published a report this week transcribing our annual conversation with Mr. X, a long-standing BCA client. Please join my fellow BCA strategists and me on Tuesday, December 7th for a follow-up discussion hosted by my colleague, Jonathan LaBerge. Finally, you will receive a Special Report prepared by our Global Asset Allocation service on Monday, December 13th. Similarly to previous years, Garry Evans and his team have prepared a list of books and articles to read over the holiday period. This year they recommend reading materials on key themes of the moment, such as climate change, cryptocurrencies, supply-chain disruption, and gene technology. Included in this report are my team’s recommendations on what to read to understand the underlying causes of inflation. Best regards, Peter Berezin, Chief Global Strategist Highlights Macroeconomic Outlook: Despite the risks posed by the Omicron variant, global growth should remain above trend in 2022. Inflation will temporarily dip next year as goods prices come off the boil. However, the structural trend for inflation is to the upside, especially in the US. Equities: Remain overweight stocks in 2022, favoring cyclicals, small caps, value stocks, and non-US equities. Look to turn more defensive in mid-2023 in advance of a stagflationary recession in 2024 or 2025. Fixed income: Maintain below-average interest rate duration exposure. The US 10-year Treasury yield will rise to 2%-to-2.25% by the end of 2022. Underweight the US, UK, Canada, and New Zealand in a global bond portfolio. Credit: Corporate debt will outperform high-quality government bonds next year. Favor HY over IG. Spreads will widen again in 2023. Currencies: As a momentum currency, the US dollar could strengthen some more over the next month or two. Over a 12-month horizon, however, the trade-weighted dollar will weaken. The Canadian dollar will be the best performing G10 currency next year. Commodities: Oil prices will rise, with Brent crude averaging $80/bbl in 2022. Metals prices will remain resilient thanks to tight supply and Chinese stimulus. We prefer gold over cryptos. I. Macroeconomic Outlook Running out of Greek Letters Just as the world was looking forward to “life as normal”, a new variant of the virus has surfaced. While little is known about the Omicron variant, preliminary indications suggest that it is more transmissible than Delta. The emergence of the Omicron variant is coming in the midst of yet another Covid wave. The number of new cases has skyrocketed across parts of northern and central Europe, prompting governments to re-introduce stricter social distancing measures (Chart 1). New cases have also been trending higher in many parts of the US and Canada since the start of November.
Chart 1
Despite the risks posed by Omicron, there are reasons for hope. BioNTech has said that its vaccine, jointly developed with Pfizer, will provide at least partial immunity against the new strain. At present, 55% of the world’s population has had at least one vaccine shot; 44% is fully vaccinated (Chart 2). China is close to launching its own mRNA vaccine next year, which it intends to administer as a booster shot.
Chart 2
In a worst-case scenario, BioNTech has said that it could produce a new version of its vaccine within six weeks, with initial shipments beginning in about three months. New antiviral medications are also set to hit the market. Pfizer claims its newly developed pill cuts the risk of hospitalization by nearly 90% if taken within three days from the onset of symptoms. The drug-maker has announced its intention to produce enough of the medication to treat 50 million people in 2022. In addition, it is allowing generic versions to be manufactured in developing countries. The company has indicated that its antiviral pills will be effective in treating the new strain. Global Growth: Slowing but from a High Level Assuming the vaccines and antiviral drugs are able to keep the new strain at bay, global growth should remain solidly above trend in 2022. Table 1 shows consensus GDP growth projections for the major economies. G7 growth is expected to tick up from 3.6% in 2021Q3 to 4.5% in 2021Q4. Growth is set to cool to 4.1% in 2022Q1, 3.6% in 2022Q2, 2.9% in 2022Q3, 2.3% in 2022Q4, and 2.1% in 2023Q1. Table 1Growth Is Slowing, But From Very High Levels
Strategy Outlook - 2022 Key Views: The Beginning Of The End
Strategy Outlook - 2022 Key Views: The Beginning Of The End
Chart 3
According to the OECD, potential real GDP growth in the G7 is about 1.4% (Chart 3). Thus, while growth in developed economies will slow next year, it is unlikely to return to trend until the second half of 2023. Emerging markets face a more daunting outlook. The Chinese property market is weakening, and the recent collapse of the Turkish lira highlights the structural problems that some EMs face. Nevertheless, the combination of elevated commodity prices, forthcoming Chinese stimulus, and the resumption of the US dollar bear market starting next year should support EM growth. Relative to consensus, we think the risks to growth in both developed and emerging markets are tilted to the upside in 2022. Growth will likely start surprising to the downside in late 2023, however. The United States: No Shortage of Demand US growth slowed to only 2.1% in the third quarter, reflecting the impact of the Delta variant wave and supply-chain bottlenecks. The semiconductor shortage hit the auto sector especially hard. The decline in vehicle spending alone shaved 2.2 percentage points off Q3 GDP growth. Chart 4Durable Goods Spending Is Still Above Pre-Pandemic Trend, While Services Spending Is Catching Up
Durable Goods Spending Is Still Above Pre-Pandemic Trend, While Services Spending Is Catching Up
Durable Goods Spending Is Still Above Pre-Pandemic Trend, While Services Spending Is Catching Up
The fourth quarter is shaping up to be much stronger. The Bloomberg consensus estimate is for real GDP to expand by 4.9%. The Atlanta Fed’s GDPNow model is even more optimistic. It sees growth hitting 9.7%. The demand for goods will moderate in 2022. As of October, real goods spending was still 10% above its pre-pandemic trendline (Chart 4). In contrast, the demand for services will continue to rebound. While restaurant sales have recovered all their lost ground, spending on movie theaters, amusement parks, and live entertainment in October was still down 46% on a seasonally-adjusted basis compared to January 2020. Hotel spending was down 23%. Spending on public transport was down 25%. Spending on dental services was down 16% (Chart 5).
Chart 5
US households have accumulated $2.3 trillion in excess savings over the course of the pandemic. Some of this money will be spent over the course of 2022 (Chart 6). Increased borrowing should also help. After initially plunging during the pandemic, credit card balances are rising again (Chart 7). Banks are eager to make consumer loans (Chart 8). Chart 6Plenty Of Pent-Up Demand
Plenty Of Pent-Up Demand
Plenty Of Pent-Up Demand
Chart 7Credit Card Spending Is Recovering Following The Pandemic Slump
Credit Card Spending Is Recovering Following The Pandemic Slump
Credit Card Spending Is Recovering Following The Pandemic Slump
Household net worth has risen by over 100% of GDP since the start of the pandemic (Chart 9). In an earlier report, we estimated that the wealth effect alone could boost annual consumer spending by up to 4% of GDP. Chart 8Banks Are Easing Credit Standards For Consumer Loans
Banks Are Easing Credit Standards For Consumer Loans
Banks Are Easing Credit Standards For Consumer Loans
Chart 9A Record Rise In Household Net Worth
A Record Rise In Household Net Worth
A Record Rise In Household Net Worth
Business investment will rebound in 2022, as firms seek to build out capacity, rebuild inventories, and automate more production in the face of growing labor shortages. After moving sideways for the better part of two decades, core capital goods orders have broken out to the upside. Surveys of capex intentions have improved sharply (Chart 10). Nonresidential investment was 6% below trend in Q3 – an even bigger gap than for consumer services spending – so there is plenty of scope for capex to increase. Residential investment should also remain strong in 2022 (Chart 11). The homeowner vacancy rate has dropped to a record low, as have inventories of new and existing homes for sale. Homebuilder sentiment rose to a 6-month high in November. Building permits are 7% above pre-pandemic levels. Chart 10Business Investment Should Be Strong In 2022
Business Investment Should Be Strong In 2022
Business Investment Should Be Strong In 2022
Chart 11Residential Construction Will Be Well Supported
Residential Construction Will Be Well Supported
Residential Construction Will Be Well Supported
US Monetary and Fiscal Policy: Baby Steps Towards Tightening Policy is unlikely to curb US aggregate demand by very much next year. While the Federal Reserve will expedite the tapering of asset purchases and begin raising rates next summer, the Fed is unlikely to raise rates significantly until inflation gets out of hand. As we discuss in the Feature section later in this report, the next leg in inflation will be to the downside, even if the long-term trend for inflation is to the upside. The respite from inflation next year will give the Fed some breathing space. A major tightening campaign is unlikely until mid-2023. Reflecting the Fed’s dovish posture, long-term real bond yields hit record low levels in November (Chart 12). Despite giving up some of its gains in recent days, Goldman’s US Financial Conditions Index stands near its easiest level in history (Chart 13). Chart 12US Real Bond Yields Hitting Record Lows
US Real Bond Yields Hitting Record Lows
US Real Bond Yields Hitting Record Lows
Chart 13Easy Financial Conditions In The US
Easy Financial Conditions In The US
Easy Financial Conditions In The US
US fiscal policy will get tighter next year, but not by very much. In November, President Biden signed a $1.2 trillion infrastructure bill into law, containing $550 billion in new spending. BCA’s geopolitical strategists expect Congress to pass a $1.5-to-$2 trillion social spending bill using the reconciliation process. The emergence of the Omicron strain will facilitate passage of the bill because it will allow the Democrats to add some “indispensable” pandemic relief to the package. All in all, the IMF foresees the US cyclically-adjusted primary budget deficit averaging 4.9% of GDP between 2022 and 2026, compared to 2.0% of GDP between 2014 and 2019 (Chart 14).
Chart 14
It should also be noted that government spending on goods and services has been quite weak over the past two years (Chart 15). The budget deficit surged because transfer payments exploded. Unlike direct government spending, which is set to accelerate over the next few years, households saved a large share of transfer payments. Thus, the fiscal multiplier will increase next year, even as the budget deficit shrinks. Chart 15While Overall Consumption Has Recovered, Business Spending and Direct Government Expenditures Remain Below Trend
While Overall Consumption Has Recovered, Business Spending and Direct Government Expenditures Remain Below Trend
While Overall Consumption Has Recovered, Business Spending and Direct Government Expenditures Remain Below Trend
Chart 16European Banks Have Cleaned Up Their Act
European Banks Have Cleaned Up Their Act
European Banks Have Cleaned Up Their Act
Europe: Room to Grow The European economy faces near-term growth pressures. In addition to Covid-related lockdowns, high energy costs will take a bite out of growth. After having dipped in October, natural gas prices have jumped again due to delays in the opening of the Nord Stream 2 pipeline, strong Chinese gas demand, and rising risks of a colder winter due to La Niña. The majority of Germans are in favor of opening the pipeline, suggesting that it will ultimately be approved. This should help reduce gas prices. Meanwhile, the winter will pass and Chinese demand for gas should abate as domestic coal production increases. The combination of increased energy supplies, easing supply-chain bottlenecks, and hopefully some relief on the pandemic front, should all pave the way for better-than-expected growth across the euro area next year. After a decade of housecleaning, European banks are in much better shape (Chart 16). Capex intentions have risen (Chart 17). Consumer confidence is even stronger in the euro area than in the US (Chart 18).
Chart 17
Chart 18Consumer Confidence Is At Pre-Pandemic Levels In The Euro Area, Unlike In The US
Consumer Confidence Is At Pre-Pandemic Levels In The Euro Area, Unlike In The US
Consumer Confidence Is At Pre-Pandemic Levels In The Euro Area, Unlike In The US
Euro area fiscal policy should remain supportive. Infrastructure spending is set to increase as the Next Generation EU fund begins operations. Germany’s “Traffic Light” coalition will pursue a more expansionary fiscal stance. The IMF expects the euro area to run a cyclically-adjusted primary deficit of 1.2% of GDP between 2022 and 2026, compared to a surplus of 1.2% of GDP between 2014 and 2019. For its part, the ECB will maintain a highly accommodative monetary policy. While net asset purchases under the PEPP will end next March, the ECB is unlikely to raise rates until 2023 at the earliest. In contrast to the US, trimmed-mean inflation has barely risen in the euro area (Chart 19). Moreover, unlike their US counterparts, European firms are reporting few difficulties in finding qualified workers (Chart 20). In fact, euro area wage growth slowed to an all-time low of 1.35% in Q3 (Chart 21). Chart 19Trimmed-Mean Inflation: Higher In The US Than In The Euro Area And Japan
Trimmed-Mean Inflation: Higher In The US Than In The Euro Area And Japan
Trimmed-Mean Inflation: Higher In The US Than In The Euro Area And Japan
Chart 20
Chart 21Wage Growth Remains Contained Across The Euro Area
Wage Growth Remains Contained Across The Euro Area
Wage Growth Remains Contained Across The Euro Area
The UK finds itself somewhere between the US and the euro area. Trimmed-mean inflation is running above euro area levels, but below that of the US. UK labor market data remains very strong, as evidenced by robust employment gains, firm wage growth, and a record number of job vacancies. The PMIs stand at elevated levels, with the new orders component of November’s manufacturing PMI rising to the highest level since June. While worries about the impact of the Omicron variant will likely cause the Bank of England to postpone December’s rate hike, we expect the BoE to begin raising rates in February. Japan: Short-Term Stimulus Boost A major Covid wave during the summer curbed Japanese growth. Consumer spending rebounded after the government removed the state of emergency on October 1 but could falter again if the Omicron variant spreads. The government has already told airlines to halt reservations for all incoming international flights for at least one month. On the positive side, the economy will benefit from new fiscal measures. Following the election on October 31, the new government led by Prime Minister Fumio Kishida announced a stimulus package worth 5.6% of GDP. As with most Japanese stimulus packages, the true magnitude of fiscal support will be much lower than the headline figure. Nevertheless, the combination of increased cash payments to households, support for small businesses, and subsidies for domestic travel should spur consumption in 2022. The capex recovery in Japan has lagged other major economies. This is partly due to the outsized role of the auto sector in Japan’s industrial base. Motor vehicle shipments fell 37% year-over-year in October, dragging down export growth with it. As automotive chip supplies increase, Japan’s manufacturing sector should gain some momentum. Despite the prospect of stronger growth next year, the Bank of Japan will stand pat. Core inflation remains close to zero, while long-term inflation expectations remain far below the BOJ’s 2% target. We do not expect the BOJ to raise rates until 2024 at the earliest. China: Crosswinds The Chinese economy faces crosswinds going into 2022. On the one hand, the energy crisis should abate, helping to boost growth. China has reopened 170 coal mines and will probably begin re-importing Australian coal. Chinese coal prices have fallen drastically over the past 6 weeks (Chart 22). Coal accounts for about two-thirds of Chinese electricity generation. Chart 22Coal Prices Are Renormalizing In China
Coal Prices Are Renormalizing In China
Coal Prices Are Renormalizing In China
Chart 23China's Property Market Has Weakened
China's Property Market Has Weakened
China's Property Market Has Weakened
The US may also trim tariffs on Chinese goods, as Treasury Secretary Yellen hinted this week. This will help Chinese manufacturers. On the other hand, the property market remains under stress. Housing starts, sales, and land purchases were down 34%, 21%, and 24%, respectively, in October relative to the same period last year. The proportion of households planning to buy a home has plummeted. Loan growth to real estate developers has decelerated to the lowest level on record (Chart 23). Nearly half of their offshore bonds are trading at less than 70 cents on the dollar. The authorities have taken steps to stabilize the property market. They have relaxed restrictions on mortgage lending and land sales, cut mortgage rates in some cities, and have allowed some developers to issue asset backed securities to repay outstanding debt. Most Chinese property is bought “off-plan”. The government does not want angry buyers to be deprived of their property. Thus, the existing stock of planned projects will be built. Chart 24 shows that this is a large number; in past years, developers have started more than twice as many projects as they have completed. The longer-term problem is that China builds too many homes. Like Japan in the early 1990s, China’s working-age population has peaked (Chart 25). According to the UN, it will decline by over 400 million by the end of the century. China simply does not need to construct as many new homes as it once did. Chart 24Chinese Construction: Halfway Done
Chinese Construction: Halfway Done
Chinese Construction: Halfway Done
Chart 25Demographic Parallels Between China And Japan
Demographic Parallels Between China And Japan
Demographic Parallels Between China And Japan
Chart 26
Japan was unable to fill the gap that a shrinking property sector left in aggregate demand in the early 1990s. As a result, the economy fell into a deflationary trap. China is likely to have more success. Unlike Japan, which waited too long to pursue large-scale fiscal stimulus, China will be more aggressive. The authorities will raise infrastructure spending next year with a focus on clean energy. They will also boost social spending. A frayed social safety net has forced Chinese households to save more than they would otherwise for precautionary reasons. This has weighed on consumption. The fact that China is a middle-income country helps. In 1990, Japan’s output-per-worker was nearly 70% of US levels; China’s output-per-worker is still 20% of US levels (Chart 26). If Chinese incomes continue to grow at a reasonably brisk pace, this will make it easier to improve home affordability. It will also allow China to stabilize its debt-to-GDP ratio without a painful deleveraging campaign. II. Feature: The Long-Term Inflation Outlook Two Steps Up, One Step Down We expect inflation in the US, and to a lesser degree abroad, to follow a “two steps up, one step down” trajectory of higher highs and higher lows. The US is currently near the top of those two steps. Inflation should dip over the next 6-to-9 months as the demand for goods moderates and supply-chain disruptions abate. Chart 27 shows that container shipping costs have started to come down. The number of ships anchored off the ports of Los Angeles and Long Beach is falling. US semiconductor firms are working overtime (Chart 28). Chip production in Japan and Korea is rising swiftly. DRAM chip prices have already started to decline. Chart 27Signs Of Easing Supply Issues On The Rough Seas
Signs Of Easing Supply Issues On The Rough Seas
Signs Of Easing Supply Issues On The Rough Seas
Chart 28Semiconductor Manufacturers Are Stepping Up Their Game
Semiconductor Manufacturers Are Stepping Up Their Game
Semiconductor Manufacturers Are Stepping Up Their Game
Reflecting the easing of supply-chain bottlenecks, both the “prices paid” and “supplier delivery” components of the manufacturing ISM declined in November. The respite from inflation will not last long, however. The US labor market is heating up. So far, most of the wage growth has been at the bottom end of the income distribution (Chart 29). Wage growth will broaden out over the course of 2022, pushing up service price inflation in the process. Chart 29Wage Growth Has Picked Up, But Mainly At The Bottom Of The Income Distribution
Wage Growth Has Picked Up, But Mainly At The Bottom Of The Income Distribution (I)
Wage Growth Has Picked Up, But Mainly At The Bottom Of The Income Distribution (I)
Chart 30Rent Inflation Has Increased
Rent Inflation Has Increased
Rent Inflation Has Increased
Rent inflation will also rise, as the unemployment rate falls further. The Zillow rent index has spiked 14% (Chart 30). Rents account for 8% of the US CPI basket and 4% of the PCE basket. Biased About Neutral? Investors are assuming that the Fed will step in to extinguish any inflationary fires before they get out of hand. The widely-followed 5-year/5-year forward TIPS breakeven inflation rate has fallen back below the Fed’s comfort zone (Chart 31). Chart 31Long-Term Inflation Expectations Are Not A Source Of Worry For The Fed
Long-Term Inflation Expectations Are Not A Source Of Worry For The Fed (II)
Long-Term Inflation Expectations Are Not A Source Of Worry For The Fed (II)
Chart 32Both The Fed And Investors Have Lowered Their Estimate Of The Neutral Rate
Both The Fed And Investors Have Lowered Their Estimate Of The Neutral Rate
Both The Fed And Investors Have Lowered Their Estimate Of The Neutral Rate
This may be wishful thinking. Back in 2012, when the Fed began publishing its “dots”, it thought the neutral rate of interest was 4.25%. Today, it considers it to be around 2.5% (Chart 32). Market participants broadly agree. Both investors and policymakers have bought into the secular stagnation thesis hook, line, and sinker. If the neutral rate turns out to be higher than widely believed, the Fed could find itself woefully behind the curve. Given the “long and variable” lags between changes in monetary policy and the resulting impact on the economy, inflation is liable to greatly overshoot the Fed’s target. Structural Forces Turning More Inflationary Meanwhile, the forces that have underpinned low inflation over the past few decades are starting to fray: Globalization is in retreat: The ratio of global trade-to-manufacturing output has been flat for over a decade (Chart 33). Looking out, the ratio could decline as geopolitical tensions between China and the rest of the world continue to simmer, and more companies shift production back home in order to gain greater control over the supply chains of essential goods. Baby boomers are leaving the labor force en masse: As a group, baby boomers hold more than half of US household wealth (Chart 34). They will continue to run down their wealth once they retire. However, since they will no longer be working, they will no longer contribute to national output. Spending that is not matched by output tends to drive up inflation. Chart 33Globalization Plateaued Over a Decade Ago
Globalization Plateaued Over a Decade Ago
Globalization Plateaued Over a Decade Ago
Chart 34
Social stability is in peril: The US homicide rate increased by 27% in 2020, the biggest one-year jump on record. All indications suggest that crime has continued to rise in 2021, coinciding with the ongoing decline in the incarceration rate (Chart 35). Amazingly, the murder rate and inflation are highly correlated (Chart 36). If the government cannot credibly commit to keeping people safe, how can it credibly commit to keeping inflation low? Without trust in government, inflation expectations could quickly become unmoored. Chart 35The Homicide Rate Has Tended To Rise When The Institutionalization Rate Has Declined
The Homicide Rate Has Tended To Rise When The Institutionalization Rate Has Declined
The Homicide Rate Has Tended To Rise When The Institutionalization Rate Has Declined
Chart 36Bouts Of Inflation Tend To Coincide With Rising Crime
Bouts Of Inflation Tend To Coincide With Rising Crime
Bouts Of Inflation Tend To Coincide With Rising Crime
The temptation to monetize debt will rise: Public-sector debt levels have soared to levels last seen during World War II. If bond yields rise as the Congressional Budget Office expects, debt-servicing costs will triple by the end of the decade (Chart 37). Faced with the prospect of having to divert funds from social programs to pay off bondholders, the government may apply political pressure on the Fed to keep rates low.
Chart 37
A Post-Pandemic Productivity Boom?
Chart 38
Might faster productivity growth bail out the economy just like it did following the Second World War? Don’t bet on it. US labor productivity did increase sharply during the initial stages of the pandemic. However, that appears to have been largely driven by composition effects that saw many low-skilled, poorly-paid service workers lose their jobs. As these low-skilled workers have returned to the labor force, productivity growth has dropped. The absolute level of productivity declined by 5.0% at an annualized rate in the third quarter, leading to an 8.3% increase in labor costs. Productivity growth has been extremely weak outside the US (Chart 38). This gives weight to the view that the pandemic-induced changes in business practices have not contributed to higher productivity, at least so far. It is worth noting that a recent study of 10,000 skilled professionals at a major IT company revealed that work-from-home policies decreased productivity by 8%-to-19%, mainly because people ended up working longer. Increased investment spending should eventually boost productivity. However, the near-term impact of higher capex will be to boost aggregate demand, stoking inflation in the process. III. Financial Markets A. Portfolio Strategy Above-Trend Global Growth Will Support Equities Our golden rule of investing is about as simple as they come: Don’t bet against stocks unless you think that there is a recession around the corner. As Chart 39 shows, recessions and equity bear markets almost always overlap.
Chart 39
Chart 40Sentiment Towards Equities Is Already Bearish
Sentiment Towards Equities Is Already Bearish
Sentiment Towards Equities Is Already Bearish
Equity corrections can occur outside of recessionary periods. In fact, we are experiencing such a correction right now. Yet, with the percentage of bearish investors reaching the highest level in over 12 months in this week’s AAII survey, chances are that the correction will not last much longer (Chart 40). A sustained decline in stock prices requires a sustained decline in corporate earnings; the latter normally only happens during economic downturns. Admittedly, it is impossible to know for sure if a recession is lurking around the corner. If the Omicron variant is able to completely evade the vaccines, growth will slow considerably over the coming months. Yet, even in that case, the global economy is unlikely to experience a sudden-stop of the sort that occurred last March. As noted at the outset of this report, pharma companies have the tools to tweak the vaccines, and most experts believe that the soon-to-be-released antivirals will be effective against the new strain. If economic growth remains above trend, earnings will rise (Chart 41). S&P 500 companies generated $53.82 per share in profits in Q3. The bottom-up consensus is for these companies to generate an average of $54.01 in quarterly profits between 2021Q4 and 2022Q3, implying almost no growth from 2021Q3 levels. This is a very low bar to clear. We expect global equities to produce high single-digit returns next year. Chart 41Analysts Increased Earnings Estimates This Year
Analysts Increased Earnings Estimates This Year
Analysts Increased Earnings Estimates This Year
The Beginning of the End Our guess is that 2022 will be the last year of the secular equity bull market that began in 2009. In mid-2023 or so, the Fed will come around to the view that the neutral rate is higher than it once thought. Unfortunately, by then, it will be too late; a wage-price spiral will have already emerged. A nasty bear flattening of the yield curve will ensue: Long-term bond yields will rise but short-term rate expectations will increase even more. A recession will follow in 2024 or 2025. The most important real-time indicator we are focusing on to gauge when to turn more bearish on stocks is the 5y/5y forward TIPS breakeven rate. As noted earlier, it is still at the bottom end of the Fed’s comfort zone. If it were to rise above 3%, all hell could break loose, especially if this happened without a corresponding increase in crude oil prices. The Fed takes great pride in the success it has had in anchoring long-term expectations. Any evidence that expectations are becoming unmoored would cause the FOMC to panic. B. Equity Sectors, Regions, And Styles Favor Value, Small Caps, and Non-US Markets in 2022 Until the Fed takes away the punch bowl, a modestly procyclical stance towards equity sectors, styles, and regional equity allocation is warranted. Chart 42The Relative Performance Of Value Stocks Has Closely Tracked Bond Yields This Year
The Relative Performance Of Value Stocks Has Closely Tracked Bond Yields This Year
The Relative Performance Of Value Stocks Has Closely Tracked Bond Yields This Year
The relative performance of value versus growth stocks has broadly followed the trajectory of the 30-year Treasury yield this year (Chart 42). Rising yields should buoy value stocks, with banks being the biggest beneficiaries (Chart 43). In contrast, rising yields will weigh on tech stocks. Chart 43Rising Bond Yields Will Help Bank Shares But Hurt Tech Stocks
Rising Bond Yields Will Help Bank Shares But Hurt Tech Stocks
Rising Bond Yields Will Help Bank Shares But Hurt Tech Stocks
Chart 44The Winners And Losers Of Covid Waves
The Winners And Losers Of Covid Waves
The Winners And Losers Of Covid Waves
If we receive some good news on the pandemic front, this should disproportionately help value. As Chart 44 illustrates, the relative performance of value versus growth stocks has tracked the number of new Covid cases globally. The correlation between new cases and the relative performance of IT and energy has been particularly strong. Rising capex spending will buoy industrial stocks. Industrials are overrepresented in value indices both in the US and abroad (Table 2). Along with financials, industrials are also overrepresented in small cap indices (Table 3). US small caps trade at 15-times forward earnings compared to 21-times for the S&P 500. Table 2Breaking Down Growth And Value By Sector
Strategy Outlook - 2022 Key Views: The Beginning Of The End
Strategy Outlook - 2022 Key Views: The Beginning Of The End
Table 3Financials And Industrials Have A Larger Weight In US Small Caps
Strategy Outlook - 2022 Key Views: The Beginning Of The End
Strategy Outlook - 2022 Key Views: The Beginning Of The End
Time to Look Abroad? Given our preference for cyclicals and value in 2022, it stands to reason that we should also favor non-US markets. Table 4 shows that non-US stock markets have more exposure to cyclical and value sectors. Table 4Cyclicals Are Overrepresented Outside The US
Strategy Outlook - 2022 Key Views: The Beginning Of The End
Strategy Outlook - 2022 Key Views: The Beginning Of The End
Admittedly, favoring non-US stock markets has been a losing proposition for the past 12 years. US earnings have grown much faster than earnings abroad over this period (Chart 45). US stock returns have also benefited from rising relative valuations. Chart 45The US Has Been The Earnings Leader In Recent Years
The US Has Been The Earnings Leader In Recent Years
The US Has Been The Earnings Leader In Recent Years
At this point, however, US stocks are trading at a significant premium to their overseas peers, whether measured by the P/E ratio, price-to-book, or price-to-sales (Chart 46). US profit margins are also more stretched than elsewhere (Chart 47).
Chart 46
Chart 47US Profit Margins Look Stretched
US Profit Margins Look Stretched
US Profit Margins Look Stretched
Chart 48Non-US Stocks Tend To Do Best When The US Dollar Is Weakening
Non-US Stocks Tend To Do Best When The US Dollar Is Weakening
Non-US Stocks Tend To Do Best When The US Dollar Is Weakening
The US dollar may be the ultimate arbiter of whether the US or international stock markets outperform in the 2022. Historically, there has been a close correlation between the trade-weighted dollar and the relative performance of US versus non-US equities (Chart 48). In general, non-US stocks do best when the dollar is weakening. The usual relationship between the dollar and the relative performance of US and non-US stocks broke down in 2020 when the dollar weakened but the tech-heavy US stock market nonetheless outperformed. However, if “reopening plays” gain the upper hand over “pandemic plays” in 2022, the historic relationship between the dollar and US/non-US returns will reassert itself. As we discuss later on, while near-term momentum favors the dollar, the greenback is likely to weaken over a 12-month horizon. This suggests that investors should look to increase exposure to non-US stocks in a month or two. Around that time, the energy shortage gripping Europe will begin to abate, China will be undertaking more stimulus, and investors will start to focus more on the prospect of higher US corporate taxes. C. Fixed Income Maintain Below-Benchmark Duration The yield on a government bond equals the expected path of policy rates over the duration of the bond plus a term premium that compensates investors for locking in their savings at a fixed rate rather than rolling them over at the prevailing short-term rate. While expected policy rates have moved up in the US over the past 2 months, the market’s expectations of where policy rates will be in the second half of the decade have not changed much (Chart 49). Investors remain convinced of the secular stagnation thesis which postulates that the neutral rate of interest is very low.
Chart 49
As for the term premium, it remains stuck in negative territory, much where it has been for the past 10 years (Chart 50). Chart 50Negative Term Premium Across The Board
Negative Term Premium Across The Board
Negative Term Premium Across The Board
The Term Premium Will Increase The notion of a negative term premium may seem odd, as it implies that investors are willing to pay to take on duration risk. However, there is a good reason for why the term premium has been negative: The correlation between bond yields and stock prices has been positive (Chart 51). Chart 51Stocks And Bond Yields Have Not Always Been Positively Correlated
Stocks And Bond Yields Have Not Always Been Positively Correlated
Stocks And Bond Yields Have Not Always Been Positively Correlated
When bond yields are positively correlated with stock prices, bonds are a hedge against bad economic news. If the economy falls into recession, equity prices will drop; the value of your home will go down; you may not get a bonus, or even worse, you may lose your job. But at least the value of your bond portfolio will go up! There is a catch, however: Bonds are a hedge against bad economic news only if that news is deflationary in nature. The 2001 and 2008-09 recessions all saw bond yields drop as the economy headed south. Both recessions were due to deflationary shocks: first the dotcom bust, and later, the bursting of the housing bubble. In contrast, bond yields rose in the lead up to the recession in the 1970s and early 80s. Bonds were not a good hedge against falling stock prices back then because it was surging inflation and rising bond yields that caused stocks to fall in the first place. This raises a worrying possibility that investors have largely overlooked: The term premium may increase as it becomes increasingly clear that the next recession will be caused not by inadequate demand but by Fed tightening in response to an overheated economy. A rising term premium would exacerbate the upward pressure on bond yields stemming from higher-than-expected inflation as well as upward revisions to estimates of the real neutral rate of interest. Again, we do not think that a “term premium explosion” is a significant risk for 2022. However, it is a major risk for 2023 and beyond. Investors should maintain a modestly below-benchmark duration stance for now but look to go maximally underweight duration towards the end of next year. Global Bond Allocation BCA’s global fixed-income strategists recommend underweighting the US, Canada, the UK, and New Zealand in 2022. They suggest overweighting Japan, the euro area, and Australia. US Treasuries trade with a higher beta than most other government bond markets (Chart 52). Our bond strategists expect the US 10-year Treasury yield to hit 2%-to-2.25% by the end of next year. Chart 52High-And Low-Beta Bond Yields
High-And Low-Beta Bond Yields
High-And Low-Beta Bond Yields
As discussed earlier, neither the ECB nor the BoJ are in a hurry to raise rates. Both euro area and Japanese bonds have outperformed the global benchmark when Treasury yields have risen (Chart 53).
Chart 53
Chart 54UK Inflation Expectations Are Higher Than In Other Major Developed Economies
UK Inflation Expectations Are Higher Than In Other Major Developed Economies
UK Inflation Expectations Are Higher Than In Other Major Developed Economies
While rate expectations in Australia have come down on the Omicron news, the markets are still pricing in four hikes next year. With wage growth still below the RBA’s target, our fixed-income strategists think the central bank will pursue a fairly dovish path next year. In contrast, they think New Zealand will continue its hiking cycle. Like Canada, the Reserve Bank of New Zealand has become increasingly concerned about soaring home prices and household indebtedness. Inflation expectations are higher in the UK than elsewhere (Chart 54). With the BoE set to raise rates early next year, gilts will underperform the global benchmark. Overweight High-Yield Corporate Bonds… For Now Chart 55High-Yield Spreads Are Pricing In A Default Rate Of Close To 4%
High-Yield Spreads Are Pricing In A Default Rate Of Close To 4%
High-Yield Spreads Are Pricing In A Default Rate Of Close To 4%
The combination of above-trend economic growth and accommodative monetary policy will provide support for corporate bonds in 2022. For now, we prefer high yield over investment grade. According to our bond strategists, while high-yield spreads are quite tight, they are still pricing in a default rate of 3.8% (Chart 55). This is more than their fair value default estimate of 2.3%-to-2.8%. It is also above the year-to-date realized default rate of 1.7%. As with equities, the bull market in corporate credit will end in 2023 as the Fed is forced to accelerate the pace of rate hikes in the face of an overheated economy and rising long-term inflation expectations. D. Currencies and Commodities Dollar Strength Will Reverse in Early 2022 Since bottoming in May, the US dollar has been trending higher. The US dollar is a high momentum currency: When the greenback starts rising, it usually keeps rising (Chart 56). A simple trading rule that buys the dollar when it is trading above its various moving averages has delivered positive returns (Chart 57). This suggests that the greenback could very well strengthen further over the next month or two.
Chart 56
Chart 57
Over a 12-month horizon, however, we think the trade-weighted dollar will weaken. Both speculators and asset managers are net long the dollar (Chart 58). Current positioning suggests we are nearing a dollar peak. Rising US rate expectations have helped the dollar this year. Chart 59 shows that both USD/EUR and USD/JPY have tracked the spread between the yield on the December 2022 Eurodollar and Euribor/Euroyen contracts, respectively. While the Fed will expedite the pace of tapering, the overall approach will still be one of “baby-steps” towards tightening next year. BCA’s bond strategists do not expect US rate expectations for end-2022 to rise from current levels. Chart 58Long Dollar Positions Are Getting Crowded
Long Dollar Positions Are Getting Crowded
Long Dollar Positions Are Getting Crowded
Chart 59Interest Rates Have Played A Major Role On The Dollar's Performance This Year
Interest Rates Have Played A Major Role On The Dollar's Performance This Year
Interest Rates Have Played A Major Role On The Dollar's Performance This Year
The present level of real interest rate differentials is consistent with a much weaker dollar (Chart 60). Using CPI swaps as a proxy for expected inflation, 2-year real rates in the US are 42 basis points below other developed economies. This is similar to where real spreads were in 2013/14, when the trade-weighted dollar was 16% weaker than it is today. Chart 60AThe Dollar And Interest Rate Differentials (I)
The Dollar And Interest Rate Differentials (I)
The Dollar And Interest Rate Differentials (I)
Chart 60BThe Dollar And Interest Rate Differentials (II)
The Dollar And Interest Rate Differentials (II)
The Dollar And Interest Rate Differentials (II)
Meanwhile, growth outside the US will pick up next year as Europe’s energy crisis abates and China ramps up stimulus. If history is any guide, firmer growth abroad will put downward pressure on the dollar (Chart 61). Chart 61The Dollar Will Weaken As Global Growth Rotates From The US To The Rest Of The World
The Dollar Will Weaken As Global Growth Rotates From The US To The Rest Of The World
The Dollar Will Weaken As Global Growth Rotates From The US To The Rest Of The World
Chart 62Dollar Headwinds
Dollar Headwinds
Dollar Headwinds
Pricey Greenback The dollar’s lofty valuation has left it overvalued by nearly 20% on a Purchasing Power Parity (PPP) basis. The PPP exchange rate equalizes the price of a representative basket of goods and services between the US and other economies. Reflecting the dollar’s overvaluation, the US trade deficit has widened sharply. Excluding energy exports, the US trade deficit as a share of GDP is now the largest on record. Equity inflows have helped finance America’s burgeoning current account deficit (Chart 62). However, these inflows are starting to abate, and could drop further if global investors abandon their infatuation with US tech stocks. Favor Commodity Currencies We favor commodity currencies for 2022, especially the Canadian dollar, which we expect to be the best performing G10 currency. Canadian real GDP growth will average nearly 5% in Q4 and the first half of next year. The Bank of Canada will start hiking rates next April. Oil prices should remain reasonably firm next year, helping the loonie and other petrocurrencies. Bob Ryan, BCA’s chief Commodity Strategist, expects the price of Brent crude to average $80/bbl in 2022 and 81$/bbl in 2023, which is well above the forwards (Chart 63). Years of underinvestment in crude oil production have led to tight supply conditions (Chart 64). Proven global oil reserves increased by only 6% between 2010 and 2020, having risen by 26% over the preceding decade.
Chart 63
Chart 64
As with oil, there has been little investment in mining capacity in recent years. While a weaker property market in China will weigh on metals prices, this will be partly offset by Chinese fiscal stimulus. Looking further ahead, the outlook for metals remains bright. Whereas the proliferation of electric vehicles is bad news for oil demand over the long haul, it is good news for many metals. The typical electric vehicle requires about four times as much copper as a typical gasoline-powered vehicle. Huge amounts of copper will also be necessary to expand electrical grids. The RMB Will Be Stable in 2022 It is striking that despite the appreciation in the trade-weighted dollar since June and escalating concerns about the health of the Chinese economy, the RMB has managed to strengthen by 0.3% against the US dollar. Chinese export growth will moderate in 2022 as global consumption shifts from goods to services. Rising global bond yields may also narrow the yield differential between China and the rest of the world. Nevertheless, we doubt the RMB will weaken very much. China wants the RMB to be a global reserve currency. A weak RMB would run counter to that goal. Rather than weakening the yuan, the Chinese authorities will use fiscal stimulus to support growth. Gold Versus Cryptos? Gold prices tend to move closely with real bond yields (Chart 65). Since August 2020, however, the price of gold has slumped from a high of $2,067/oz to $1,768/oz, even though real yields remain near record lows. The divergence between real yields and gold prices may partly reflect growing demand for cryptocurrencies. Investors increasingly see cryptos as not just a disruptive economic force, but as the premier “anti-fiat” hedge. Whether that view pans out remains to be seen. So far, the vast majority of the demand for cryptocurrencies has stemmed from people hoping to get rich by buying cryptos. To the extent that people are using cryptos for online purchases, it is usually for illegal goods (Chart 66). Chart 65Gold Prices Tend To Correlate Closely With Real Interest Rates
Gold Prices Tend To Correlate Closely With Real Interest Rates
Gold Prices Tend To Correlate Closely With Real Interest Rates
Chart 66
Crypto proponents like to say that the supply of cryptos is finite. While this may be true for individual cryptocurrencies, it is not true for the sector as a whole. Over the past 8 years, the number of cryptocurrencies has swollen from 26 in 2013 to 7,877 (Chart 67). At least with gold, they are not adding any new elements to the periodic table.
Chart 67
At any rate, the easy money in the crypto space has already been made. Bitcoin has doubled in price seven times since the start of 2016. If it were to double just one more time to $120,000, it would be worth $2.2 trillion, equal to the entire stock of US dollars in circulation. Investors looking to hedge long-term inflation risk should shift back into gold. Peter Berezin Chief Global Strategist pberezin@bcaresearch.com Global Investment Strategy View Matrix
Image
Special Trade Recommendations
Image
Current MacroQuant Model Scores
Image
Dear Client, We will be working on our 2022 Outlook for China, which will be published on December 8. Next week we will be sending you BCA Research’s Annual Outlook, featuring long-time BCA client Mr. X, who visits towards the end of each year to discuss the economic and financial market outlook for the year ahead. Best regards, Jing Sima China Strategist Feature In meetings with our North American clients this past week, we expressed the view that China’s economic growth is on a downward trend and easing measures have been gradual and modest in scope. Most clients agreed that China’s economy faces tremendous headwinds, however, some investors were more optimistic about the outlook for Chinese stocks in the next 6 to 12 months. Valuations in both China’s onshore and offshore equity markets have dropped to multi-year lows and macro policies have started to ease. Cheaply valued Chinese stocks should have more upside in the wake of policy support. Policy tone recently pivoted to a more growth supporting bias, but the existing easing measures will not offset the deceleration in both credit growth and domestic demand. China’s economic activity may worsen before it stabilizes in mid-2022. Moreover, China’s financial markets do not seem to have priced in the economic weakness. Therefore, in the next one to two quarters, risks to Chinese stocks are tilted toward the downside. Chart 1Chinese Stocks Will Truly Bottom When The Economy Troughs
Chinese Stocks Will Truly Bottom When The Economy Troughs
Chinese Stocks Will Truly Bottom When The Economy Troughs
Below are some of the main questions from our meetings and our answers. Q: Policies have started to be more pro-growth. Why do you still underweight Chinese stocks? A: There are two reasons that we maintain a cautious view on Chinese stocks for at least the next six months, in both absolute terms and relative to global equities. First, we do not think that the magnitude of existing easing measures is sufficient to offset the economy’s downward momentum. Secondly, China’s business cycle lags credit growth by about six to nine months. The timing of a turnaround in the economy and stock prices may be later than investors have priced in. In short, we need to see more reflationary measures and a rebound in credit growth to have a legitimate macro fundamental basis to overweight Chinese stocks (Chart 1). Credit growth on a year-on-year basis stopped falling in October. The underlying data in credit creation, however, points to a weakening in demand for corporate loans (Chart 2). Loans to the housing sector are well below a year ago (Chart 3). Chart 2Weakening Loan Demand
Weakening Loan Demand
Weakening Loan Demand
Chart 3Bank Loans To The Housing Sector Have Not Turned Around
Bank Loans To The Housing Sector Have Not Turned Around
Bank Loans To The Housing Sector Have Not Turned Around
Chart 4It Will Take Time For Policy Easing To Restore Confidence In The Corporate Sector
It Will Take Time For Policy Easing To Restore Confidence In The Corporate Sector
It Will Take Time For Policy Easing To Restore Confidence In The Corporate Sector
Despite an acceleration in local government bond issuance in October and RMB300 billion in additional bank loans to support small and medium enterprises, growth in medium- to long-term corporate loans peaked (Chart 4). In previous cycles, a rollover in corporate demand for longer-term bank lending on average lasted more than nine months, suggesting that any policy adjustments will take a while to restore confidence in the corporate sector. Without a decisive pickup in credit growth, corporate earnings growth will be at risk of deteriorating. Moreover, policy tightening since earlier this year is still working its way through the economy and major economic indicators in China continue to decline (Chart 5). We think that China’s economy is set to decelerate even more in the next several months, suggesting that earnings uncertainty will likely rise. This, combined with reactive policymakers, already slowing earnings momentum, and a downward adjustment in 12-month forward earnings, suggests that investors have not yet reached the maximum bearishness for Chinese stock prices (Chart 6). Chart 5No Signs Of Improvement In The Economy
No Signs Of Improvement In The Economy
No Signs Of Improvement In The Economy
Chart 6The Earnings Adjustement Process Is Only Beginning
The Earnings Adjustement Process Is Only Beginning
The Earnings Adjustement Process Is Only Beginning
Q: What is the impact of China’s property market slowdown on the economy? Will recent policy easing stop deterioration in the real estate sector? A: Policy has been recalibrated by relaxing restrictions on mortgage lending and rules for land sales.1 However, the negative financing loop among developers, households and local governments may take longer to improve. Meanwhile, the market may underestimate the downside risks in housing-related activity in the next 6 to 12 months. Chart 7Households' Home Buying Intentions Have Plummeted
Households' Home Buying Intentions Have Plummeted
Households' Home Buying Intentions Have Plummeted
Our view is based on the following: Home sales will likely remain in contraction in the next two quarters. Aggressive crackdowns on property market speculation in the past 12 months have fundamentally shifted consumers’ expectations for future home prices. The impending pilot property tax reform2 (details yet to be disclosed) will only encourage the wait-and-see sentiment of potential buyers. Home sales contracted by 24% in October from a year ago. In previous cycles, contractions in home sales normally lasted for more than 12 months. Moreover, the proportion of households planning to buy a house dropped to only 7.7% in Q3 2021 from 11.6% in Q4 2020 (Chart 7). Real estate developers have slashed new projects and land purchases to preserve liquidity for debt servicing (Chart 8, first and second panels). Policymakers may succeed in prompting banks to resume lending to developers in order to alleviate the escalating risk of widespread defaults. However, so far the marginal easing has failed to reverse the downward trend in bank credit to developers along with home sales (Chart 8, third and bottom panels). Funding constraints for real estate developers will probably be sustained for another six months, despite the recent easing measures. Construction activity, housing starts, and real estate investment will likely remain in doldrum at least through 1H22 (Chart 9). Chart 8Housing Activities Are Still Falling
Housing Activities Are Still Falling
Housing Activities Are Still Falling
Chart 9Less Funding = Less Investment And Completions
Less Funding = Less Investment And Completions
Less Funding = Less Investment And Completions
The marked reduction in land sales will impede local governments’ revenues and weigh on infrastructure investment (Chart 10). Real estate and infrastructure financing contributed 50% of the increase in total Chart 10Local Government Revenues Largely Depend On The Housing Sector
Local Government Revenues Largely Depend On The Housing Sector
Local Government Revenues Largely Depend On The Housing Sector
social financing in 2020. Given that local governments face funding constraints from a slump in land sale incomes, policies on leverage from local government financing vehicles (LGFVs) will have to meaningfully loosen up to allow a rise in bank lending to support infrastructure investment. As discussed in previous reports, an acceleration in local government special-purpose bond issuance can only partially offset weak credit growth. Furthermore, shadow banking activity, which comprises LGFV borrowing and is highly correlated with China’s infrastructure investment growth, remains in contraction and indicates that growth in infrastructure investment is unlikely to rebound strongly (Chart 11). The sharp weakening of real estate construction activities will drag down the demand for building materials, machinery, home appliances and automobiles. Real estate accounts for about 60% of Chinese households’ wealth, thus any substantial drop in home prices will further weaken households’ propensity to consume (Chart 12). Chart 11More Easing Needed For A Meaningful Pickup In Infrastructure Investment
More Easing Needed For A Meaningful Pickup In Infrastructure Investment
More Easing Needed For A Meaningful Pickup In Infrastructure Investment
Chart 12Falling Demand For Commodities And Consumer Goods
Falling Demand For Commodities And Consumer Goods
Falling Demand For Commodities And Consumer Goods
Chart 13AOn The Surface Housing Inventories Are Lower Than Six Years Ago...
On The Surface Housing Inventories Are Lower Than Six Years Ago...
On The Surface Housing Inventories Are Lower Than Six Years Ago...
There are nontrivial risks that the real estate slowdown will evolve into a downturn similar to that of 2014-15. Although the existing housing inventory is more modest than the start of the 2014/15 property downturn, developers have accumulated more debt and unfinished projects in this cycle than in the past (Charts 13A & 13B). Policymakers will have to relax property sector policies much more forcefully to prevent the downturn from intensifying. In the interim, we will likely witness more deterioration in the sector. Chart 13B...But Developers Have Built Up Massive Leverages And Hidden Inventories In The Past Three Years
...But Developers Have Built Up Massive Leverages And Hidden Inventories In the Past Three Years
...But Developers Have Built Up Massive Leverages And Hidden Inventories In the Past Three Years
Q: If the property market accounts for such a big portion of local governments’ revenues, why hasn’t the waning housing market forced policymakers to loosen restrictions? A: We think regulators have been slow to backtrack property market reforms because this year China’s fiscal deficit has narrowed from last year due to lower government spending and improved income from corporate taxes. In previous property market downturns, such as 2011/12, 2015/16 and 2019, property policy restrictions were lightened following major declines in government revenues (Chart 14). However, in 2021 China’s fiscal balance sheet has been stronger than in previous cycles; central and local governments have collected much more taxes, particularly corporate taxes, than in 2020 (Chart 15). Meanwhile, government expenditures so far this year have been lower, resulting in a large improvement in the country’s fiscal deficit (Chart 16). Chart 14Falling Gov Revenues Forced Policymakers To Backtrack Reforms In The Past...
Falling Gov Revenues Forced Policymakers To Backtrack Reforms In The Past...
Falling Gov Revenues Forced Policymakers To Backtrack Reforms In The Past...
Chart 15...But This Year Gov Tax Revenues Have Been Strong
...But This Year Gov Tax Revenues Have Been Strong
...But This Year Gov Tax Revenues Have Been Strong
Chart 16Fiscal Deficit Improved This Year Despite Falling evenues From Land Sales
Fiscal Deficit Improved This Year Despite Falling evenues From Land Sales
Fiscal Deficit Improved This Year Despite Falling evenues From Land Sales
As discussed above, slightly loosened restrictions on land purchases by some regional governments will not restore developers’ confidence and boost the demand for land. The sharp increase in government's corporate tax collection will also start to ebb as economic growth slows and corporate profits decline. As such, even if government expenditures remain the same next year, the fiscal deficit will grow because revenues will be under substantial downward pressure. We expect that Chinese policymakers will have to take more actions to stabilize fiscal conditions. Forecasting exactly when this will occur is difficult, but a benign government balance sheet in much of this year is delaying policymakers’ response to the flagging housing market. Meantime, both policymakers and investors may be complacent about the state of the economy until the full scale of the property sector spillover risk becomes clear. Q: Rates are low and industrial profit growth has been strong this year. Why has capex been so sluggish? A: Investment growth in the manufacturing sector has been lackluster because their profit margins have been squeezed by rising input costs. On the other hand, investment in the mining industry has been constrained by policy restrictions. An acceleration in China’s de-carbonization efforts this year has likely constrained investment in the mining sector. Even though industrial profit growth has been concentrated among the upstream industries such as mining which profits grew by a stunning 100% this year, investment in the sector was mostly flat from a year ago (Chart 17). During the first half of the year, mid- to downstream firms were caught between rising input prices and a weak recovery in domestic consumption. Manufacturing investment grew faster than the mining sector, but manufacturing profit growth only increased by about 30% year to date (Chart 18). However, we think manufacturing investment growth may improve slightly into 2022 as the sector continues to gain pricing power. Chart 17Mining Sector's Profit Growth Way Outpaced Investment
Mining Sector's Profit Growth Way Outpaced Investment
Mining Sector's Profit Growth Way Outpaced Investment
Chart 18Manufacturing Sector Profit Growth Has Been Much More Muted Than Upstream Industries
Manufacturing Sector Profit Growth Has Been Much More Muted Than Upstream Industries
Manufacturing Sector Profit Growth Has Been Much More Muted Than Upstream Industries
Q: The RMB has been strong against the dollar, despite China’s maturing business cycle. What is your outlook for the RMB next year? A: The RMB exchange rate has been boosted by China’s record current account surplus, wide interest rate differentials and speculation that tension between the US and China will abate. However, all three favorable conditions supporting the RMB are in danger of reversing next year. Chart 19The RMB Has Been Appreciating Despite A Strong USD
The RMB Has Been Appreciating Despite A Strong USD
The RMB Has Been Appreciating Despite A Strong USD
Chart 20The RMB's Appreciation Deviates From Economic Fundamentals
The RMB's Appreciation Deviates From Economic Fundamentals
The RMB's Appreciation Deviates From Economic Fundamentals
Despite broad-based dollar strength, the CNY/USD has appreciated by 4.5% year to date (Chart 19). The RMB’s appreciation deviates from China’s economic fundamentals (Chart 20). Strong global demand for goods has boosted Chinese exports while travel restrictions curbed foreign exchange outflows by domestic households (Chart 21). China-US real interest rate differentials have been in favor of the CNY versus USD, bringing net foreign inflows to China’s onshore bond market (Chart 22). Additionally, the recent meeting between President Joe Biden and President Xi Jinping has prompted speculation that the US will lessen tariffs on Chinese imports. Chart 21Large Current Account Surplus
Large Current Account Surplus
Large Current Account Surplus
Chart 22Favorable Interest Rate Differentials And Strong Fund Inflows
Favorable Interest Rate Differentials And Strong Fund Inflows
Favorable Interest Rate Differentials And Strong Fund Inflows
Chart 23China's Extremely Robust Export Growth Unlikely To Sustain In 2022
China's Extremely Robust Export Growth Unlikely To Sustain In 2022
China's Extremely Robust Export Growth Unlikely To Sustain In 2022
Chart 24A Strong RMB Does Not Bode Well For Chinese Exporters' Profits
A Strong RMB Does Not Bode Well For Chinese Exporters' Profits
A Strong RMB Does Not Bode Well For Chinese Exporters' Profits
These factors will likely turn against the CNY next year. First, export growth will moderate as the composition of US consumption rotates from goods to services (Chart 23). Secondly, it would not be in the PBoC’s best interests to let the RMB strengthen too rapidly because an appreciating currency would be a deflationary force on China’s export and manufacturing sectors (Chart 24). While we expect policymakers to maintain their preference for a gradual approach to stimulus, we assign a high probability to a reserve requirement ratio (RRR) cut in early 2022. In this environment, Chinese bond yields will decline, which would narrow the China-US interest rate differential. Finally, while there may be some changes to US tariffs on China, it is doubtful that there would be a broad-based removal of tariffs. Chart 25The CNY/USD Will Likely Fall And Converge To Chinese Stocks' (Under)performance
The CNY/USD Will Likely Fall And Converge To Chinese Stocks' (Under)performance
The CNY/USD Will Likely Fall And Converge To Chinese Stocks' (Under)performance
The CNY’s outperformance stands out as it marks a break from its correlation with China’s relative equity performance vis-à-vis the US (Chart 25). The signal from the currency suggests that either global equity investors are overly pessimistic about economic and regulatory risks in China, or overly optimistic about the value of China’s currency. The latter option is more likely at the moment, and the CNY/USD exchange rate is at the risk of converging to the underperformance of Chinese investable stocks next year. Jing Sima China Strategist jings@bcaresearch.com Footnotes 1 China Cities Ease Land Bidding Rules as Property Stress Spreads - Bloomberg 2 China’s Pilot Property Tax Reforms Benefit Markets Despite Short-Term Pain, Analysts Say - Caixin Global Market/Sector Recommendations Cyclical Investment Stance
Dear Client, There will be no report next week as we will be working on our Quarterly Strategy Outlook, which will be published the following week. In the meantime, please keep an eye out for BCA Research’s Annual Outlook, featuring long-time BCA client Mr. X, who visits towards the end of each year to discuss the economic and financial market outlook for the year ahead. Best regards, Peter Berezin Chief Global Strategist Highlights Inflation in the US, and to a lesser extent, in other major economies, will follow a “two steps up, one step down” trajectory of higher highs and higher lows. While inflation will fall in the first half of next year as goods prices stabilize, an overheated labor market will cause inflation to re-accelerate into 2023. The Fed will be slow to respond to high inflation, implying that monetary policy will remain accommodative next year. This should help propel stocks to new highs. Chinese stimulus will offset much of the drag from a weaker domestic property market. The dollar is a high momentum currency, so we wouldn’t bet against the greenback in the near term. Nevertheless, with “long dollar” now a consensus trade, we would position for a weaker dollar over a 12-month horizon. A depreciating dollar next year should help non-US equities, especially beleaguered emerging market stocks. The dollar will strengthen anew in 2023, as the Fed is forced to turn more hawkish, and global equities begin to buckle. From Ice To Fire In past reports, we have contended that inflation in the US, and to a lesser extent, in other major economies, would follow a “two steps up, one step down” trajectory of higher highs and higher lows. We are currently near the top of those two steps. The pandemic ushered in a major re-allocation of spending from services to goods (Chart 1). US inflation should dip over the next 6-to-9 months as the demand for goods decelerates and supply-chain disruptions abate. Chart 1The Pandemic Caused A Major Shift In Spending From Services To Goods
The Pandemic Caused A Major Shift In Spending From Services To Goods
The Pandemic Caused A Major Shift In Spending From Services To Goods
CHart 2Those With Low Paid Jobs Are Enjoying Stronger Wage Gains
Those With Low Paid Jobs Are Enjoying Stronger Wage Gains
Those With Low Paid Jobs Are Enjoying Stronger Wage Gains
The respite from inflation will not last long, however. The labor market is heating up. So far, most of the wage growth has been at the bottom end of the income distribution (Chart 2). Wage growth will broaden over the course of 2022, setting the scene for a price-wage spiral in 2023. We doubt that either fiscal or monetary policy will tighten fast enough to prevent such a spiral from emerging. As a result, US inflation will surprise meaningfully on the upside. Our view has no shortage of detractors. In this week’s report, we address the main counterarguments in a Q&A format: Q: What makes you think that service spending will rebound fast enough to offset the drag from weaker goods consumption? Chart 3Inventory Restocking Could Be A Source Of Growth Next Year
Inventory Restocking Could Be A Source Of Growth Next Year
Inventory Restocking Could Be A Source Of Growth Next Year
A: There is still a lot of pent-up demand for goods. Try calling any auto dealership. You will hear the same thing: “We have nothing in stock now, but if you put in an order today, you might get a vehicle in 3-to-6 months.” Thus, durable goods sales are unlikely to weaken quickly. And with inventories near record low levels, firms will need to produce more than they sell (Chart 3). Inventory restocking will support GDP growth. As for services, real spending in the US grew by 7.9% in the third quarter, an impressive feat considering that this coincided with the Delta-variant wave. Service growth will stay strong in the fourth quarter. The ISM non-manufacturing index jumped to a record high of 66.7 in October, up from 61.9 in September. The Atlanta Fed’s GDPNow model is tracking real PCE growth of 9.2% in Q4. Goldman’s Current Activity Indicator has hooked up (Chart 4).
Chart 4
Q: Aren’t you worried that spending on services might stall next year? A: Not really. Chart 5 shows the percentage change in real spending for various types of services from January 2020 to September 2021, the last month of available data.
Chart 5
Chart 6
The greatest decline in spending occurred in those sectors that were most directly affected by the pandemic. Notably, spending on movie theaters, amusement parks, and live entertainment in September was still down 46% on a seasonally-adjusted basis compared to last January. Hotel spending was down 22%. Spending on public transport was down 26%. Only spending on restaurants was back to normal. The number of Covid cases has once again started to trend higher in the US, so that path to normalization will take time (Chart 6). Nevertheless, with vaccination rates still edging up and new antiviral drugs set to hit the market, it is reasonable to assume that many of the hardest-hit service categories will recover next year. Q: What about medical services? Some have speculated that the shift to telemedicine will require much lower spending down the road. A: It is true that spending on outpatient services in September was $43 billon below pre-pandemic levels. However, over two-fifths of that shortfall was in dental services, which are not amenable to telemedicine. Spending on dental services was down 16% from its January 2020 levels, compared to 6% for physician services. A more plausible theory is that many people are still worried about venturing to the doctor’s or dentist’s office. In addition, a lot of elective procedures were canceled or postponed due to the pandemic. Clearing that backlog will lift medical spending next year. Chart 7The Flow Of Savings Has Fallen Back To Pre-Pandemic Levels But The Stock Of Accumulated Savings Remains High
The Flow Of Savings Has Fallen Back To Pre-Pandemic Levels But The Stock Of Accumulated Savings Remains High
The Flow Of Savings Has Fallen Back To Pre-Pandemic Levels But The Stock Of Accumulated Savings Remains High
In any case, the cost of a telemedicine appointment is typically no different from an in-person one. And, to the extent that telemedicine does become more widespread, this could encourage more people to seek medical assistance. Lastly, even if spending on certain services does not fully recover after the pandemic, this will probably simply result in a permanent increase in spending on goods. The only way that overall consumer spending will falter is if the savings rate rises, which seems unlikely to us. Q: Why do you say that? The savings rate has been very high throughout the pandemic. A: The savings rate did spike during the pandemic, but that was mainly because fewer services were available, and because households were getting transfer payments from the government. Now that these payments have ended, the savings rate has dropped to 7.5%, roughly where it was prior to the pandemic. There is good reason to think the savings rate will keep falling next year. Households are sitting on $2.3 trillion in excess savings, most of which reside in bank deposits (Chart 7). As they run down those savings, consumption will rise in relation to income. The household deleveraging cycle is over. After initially plunging during the pandemic, credit card balances are rising (Chart 8). Banks are eager to make consumer loans (Chart 9). Household net worth has risen by over 100% of GDP since the start of the pandemic (Chart 10). As we discussed three weeks ago, the wealth effect alone could boost annual consumer spending by up to 4% of GDP. Chart 8APost-GFC Deleveraging Has Ended And People Are Swiping Credit Cards Again Following The Pandemic Scare
Post-GFC Deleveraging Has Ended And People Are Swiping Credit Cards Again Following The Pandemic Scare
Post-GFC Deleveraging Has Ended And People Are Swiping Credit Cards Again Following The Pandemic Scare
Chart 8BPost-GFC Deleveraging Has Ended And People Are Swiping Credit Cards Again Following The Pandemic Scare
Post-GFC Deleveraging Has Ended And People Are Swiping Credit Cards Again Following The Pandemic Scare
Post-GFC Deleveraging Has Ended And People Are Swiping Credit Cards Again Following The Pandemic Scare
Chart 9Banks Are Easing Credit Standards For Consumer Loans
Banks Are Easing Credit Standards For Consumer Loans
Banks Are Easing Credit Standards For Consumer Loans
Chart 10A Record Rise In Household Net Worth
A Record Rise In Household Net Worth
A Record Rise In Household Net Worth
Q: Household wealth could fall as the Fed starts tapering and eventually raising rates. Wouldn’t that cool the economy? A: The taper is a fait accompli, and markets are already pricing in rate hikes starting in the second half of next year. If the Fed were to signal its intention to raise rates more quickly than what has been priced in, then home prices and stocks could certainly weaken. We do not think the Fed will pivot in a more hawkish direction before the end of next year, however. The Fed’s estimate of the neutral rate is only 2.5%, a big step down from its estimate of 4.25% in 2012. The market’s view is broadly in line with the Fed’s (Chart 11). Despite the upward move in realized inflation, long-term inflation expectations remain in check – expected inflation 5-to-10 years out in the University of Michigan survey has increased from 2.3% in late 2019 to 2.9%, bringing it back to where it was between 2010 and 2015. The 5-year/ 5-year forward TIPS breakeven inflation rate is near the bottom end of the Fed’s comfort zone (Chart 12). Chart 11The Fed And Investors Still Believe In Secular Stagnation
The Fed And Investors Still Believe In Secular Stagnation
The Fed And Investors Still Believe In Secular Stagnation
Chart 12Long-Term Inflation Expectations Are Not Yet A Concern For The Fed
Long-Term Inflation Expectations Are Not Yet A Concern For The Fed
Long-Term Inflation Expectations Are Not Yet A Concern For The Fed
Q: What about fiscal policy? Isn’t it set to tighten sharply next year? A: The US budget deficit will decline next year. However, this will happen against the backdrop of strong private demand growth. Moreover, budget deficits are likely to remain elevated in the post-pandemic period. This week, President Biden signed a $1.2 trillion infrastructure bill into law, containing $550 billion in new spending. BCA’s geopolitical strategists expect Congress to pass a $1.5-to-$2 trillion social spending bill using the reconciliation process. All in all, the IMF foresees the US cyclically-adjusted primary budget deficit averaging 4.9% of GDP between 2022 and 2026, compared to 2.0% of GDP between 2014 and 2019 (Chart 13).
Chart 13
Chart 14While Overall Consumption Has Recovered, Business Spending and Direct Government Expenditures Remain Below Trend
While Overall Consumption Has Recovered, Business Spending and Direct Government Expenditures Remain Below Trend
While Overall Consumption Has Recovered, Business Spending and Direct Government Expenditures Remain Below Trend
It should also be noted that government spending on goods and services has been quite weak over the past two years (Chart 14). The budget deficit surged because transfer payments exploded. Unlike direct government spending, which is set to accelerate over the next few years, households saved a large share of transfer payments. Thus, the fiscal multiplier will increase next year, even as the budget deficit shrinks. Q: We have focused a lot on demand, but what about supply? There are over 4 million fewer Americans employed today than before the pandemic and yet the job openings rate is near a record high. Chart 15Despite A Notable Decline, There Are Still A Lot Of People Avoiding Work Because Of Worries About Contracting Or Transmitting Covid
Despite A Notable Decline, There Are Still A Lot Of People Avoiding Work Because Of Worries About Contracting Or Transmitting Covid
Despite A Notable Decline, There Are Still A Lot Of People Avoiding Work Because Of Worries About Contracting Or Transmitting Covid
A: Some people who left the workforce will regain employment. According to the Census Bureau’s Household Pulse Survey, there are still 2.5 million people not working because they are afraid of catching or transmitting the virus (Chart 15). That said, some workers may remain sidelined for a while longer. The very same survey also revealed that about 8 million of the 100 million workers currently subject to vaccine mandates say that “they will definitely not get the vaccine.” In addition, about 3.6 million workers have retired since the start of the pandemic, about 1.2 million more than one would have expected based on pre-existing demographic trends. Most of these retirees will not work again. Lifestyle choices may keep others from seeking employment. Female labor participation has declined much more during the pandemic and than it did during the Great Recession (Chart 16). While many mothers will re-enter the labor force now that schools have reopened, some may simply choose to stay at home.
Chart 16
The bottom line is that the pandemic has reduced labor supply at a time when labor demand remains very strong. This is likely to exacerbate the labor shortage. Q: Any chance that higher productivity will offset some of the damage to the supply side of the economy from decreased labor participation? A: US labor productivity did increase sharply during the initial stages of the pandemic. However, that appears to have been largely driven by composition effects in which low-skilled, poorly-paid service workers lost their jobs. As these low-skilled workers have returned to the labor force, productivity growth has dropped. The absolute level of productivity declined by 5.0% at an annualized rate in the third quarter, leading to an 8.3% increase in labor costs. It is telling that productivity growth has been extremely weak outside the US (Chart 17). This gives weight to the view that the pandemic-induced changes in business practices have not contributed to higher productivity, at least so far. It is also noteworthy that a recent study of 10,000 skilled professionals at a major IT company revealed that work-from-home policies decreased productivity by 8%-to-19%, mainly because people ended up working longer. Increased investment spending should eventually boost productivity. Core capital goods orders, which lead corporate capex, are up 18% since the start of the pandemic (Chart 18). However, the near-term impact of increased investment spending will be to boost aggregate demand, stoking inflation in the process.
Chart 17
Chart 18US Capex Should Pick Up
US Capex Should Pick Up
US Capex Should Pick Up
Q: We have spoken a lot about the US, but the world’s second biggest economy, China, is facing a massive deflationary shock from the implosion of its real estate market. Could that deflationary impulse potentially cancel out the inflationary impulse from an overheated US economy? A: You are quite correct that inflation has risen the most in the US. While inflation has picked up in Europe, this mainly reflects base effects (Chart 19). Inflation in China has fallen since the start of the pandemic despite booming exports. There are striking demographic parallels between China today and Japan in the early 1990s. The bursting of Japan’s property bubble corresponded with a peak in the country’s working-age population (Chart 20). China’s working-age population has also peaked and is set to decline by more than 40% over the remainder of the century. Chart 19The US Stands Out As The Inflation Leader
The US Stands Out As The Inflation Leader
The US Stands Out As The Inflation Leader
Chart 20Demographic Parallels Between China And Japan
Demographic Parallels Between China And Japan
Demographic Parallels Between China And Japan
That said, there are important differences between the two nations. In 1990, Japan was a rich economy; output-per-hour was nearly 70% of US levels. China is still a middle-income economy; output-per-hour is only 20% of US levels (Chart 21). China has the ability to outgrow some of its problems in a way that Japan did not. In addition, Chinese policymakers have learned from some of Japan’s mistakes. They have been trying to curb the economy’s dependence on property development; real estate development investment has fallen from 12% of GDP in 2014 to less than 10% of GDP (Chart 22). China is still building too many new homes, but unlike Japan in the 1990s, the government is likely to pursue stimulus measures to compensate for a shrinking property sector. This should keep the economy from entering a deflationary slump.
Chart 21
Chart 22Real Estate Investment Has Peaked In China
Real Estate Investment Has Peaked In China
Real Estate Investment Has Peaked In China
Q: Let’s bring this back to markets. What is the main investment takeaway from your view? A: The main takeaway is that investors should remain bullish on stocks and other risk assets for the next 12 months but be prepared to turn more cautious in 2023. The neutral rate of interest in the US is higher than generally assumed. This means that monetary policy is currently more accommodative than widely believed, which is good for stocks. Unfortunately, it also means that a policy error is likely: The Fed will keep rates too low for too long, causing the economy to overheat. Chart 23Bank Stocks Tend To Outperform When Yields Rise
Bank Stocks Tend To Outperform When Yields Rise
Bank Stocks Tend To Outperform When Yields Rise
This overheating will not be evident over the next six months. As we noted at the outset of this report, the US economy is currently at the top of the proverbial two steps in our projected “two steps up, one step down” trajectory for inflation. The cresting in durable goods inflation will provide a temporary respite from inflationary worries, even as the underlying long-term driver of higher inflation – an increasingly tight labor market – gains traction. Strong consumer demand and persistent labor shortages will incentivize companies to invest in new capacity and automate production. This will benefit industrial stocks and select tech names. Rising bond yields will also boost bank shares (Chart 23). A country’s current account balance is simply the difference between what it saves and what it invests. With savings on the downswing and investment on the upswing, the US will find it increasingly difficult to finance its burgeoning trade deficit. The US dollar is a high momentum currency, so we wouldn’t necessarily bet against the greenback in the near term (Chart 24). Nevertheless, with “long dollar” now a consensus trade, we would position for a weaker dollar over a 12-month horizon (Chart 25).
Chart 24
Chart 25Long Dollar Is A Crowded Trade
Long Dollar Is A Crowded Trade
Long Dollar Is A Crowded Trade
Chart 26A Depreciating Dollar Next Year Should Help Non-US Equities
A Depreciating Dollar Next Year Should Help Non-US Equities
A Depreciating Dollar Next Year Should Help Non-US Equities
A depreciating dollar next year should help non-US equities, especially beleaguered emerging markets (Chart 26). The dollar will strengthen anew in 2023, as the Fed is forced to turn more hawkish, and global equities begin to buckle. Peter Berezin Chief Global Strategist pberezin@bcaresearch.com Global Investment Strategy View Matrix
Image
Special Trade Recommendations
Image
Current MacroQuant Model Scores
Image
Dear Client, This week, the US Bond Strategy service is hosting its Quarterly Webcast (November 16 at 10:00 AM EST, 15:00 PM GMT, 16:00 PM CET and November 17 at 9:00 HKT, 11:00 AEST). In addition, we are sending this Quarterly Chartpack that provides a recap of our key recommendations and some charts related to those recommendations and other areas of interest for US bond investors. Please tune in to the Webcast and browse the Chartpack at your leisure, and do let us know if you have any questions or other feedback. To view the Quarterly Chartpack PDF please click here. Best regards, Ryan Swift, US Bond Strategist
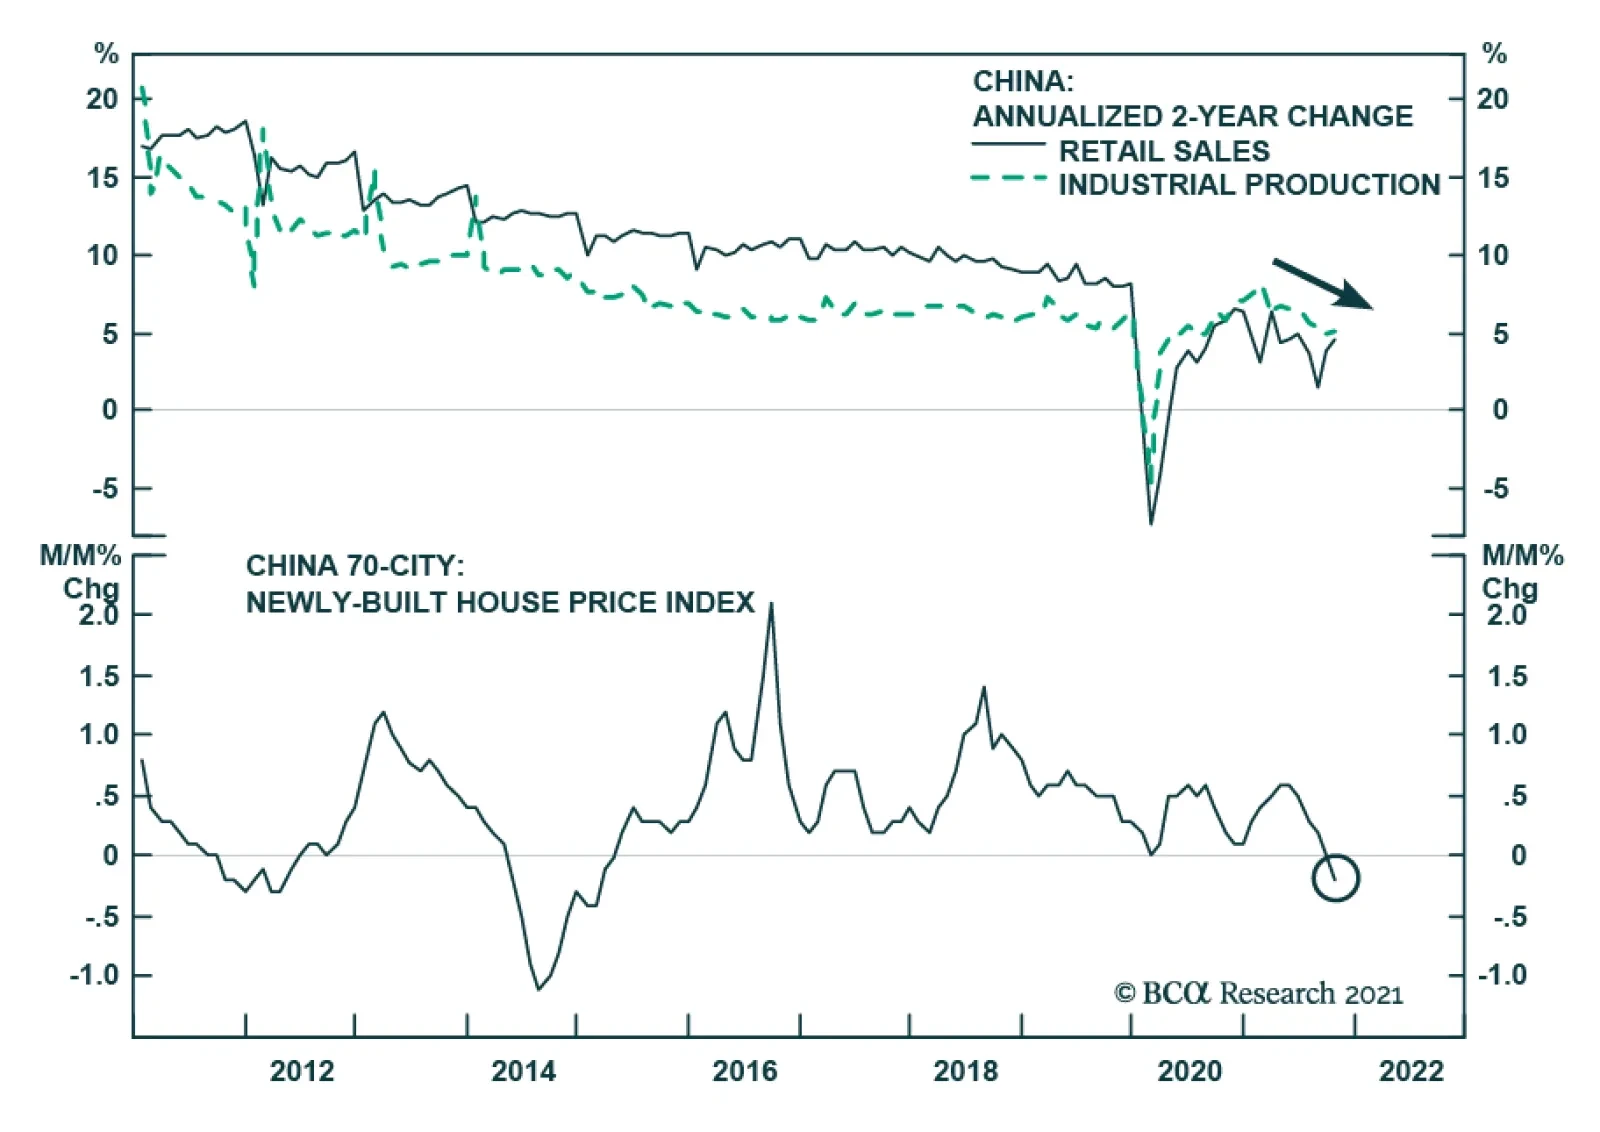
Chinese retail sales and industrial production data for October surprised to the upside. Retail sales growth accelerated slightly from 4.4% to 4.9% y/y and beat expectations of a slowdown to 3.7%. Similarly, industrial production expanded by 3.5% y/y versus…
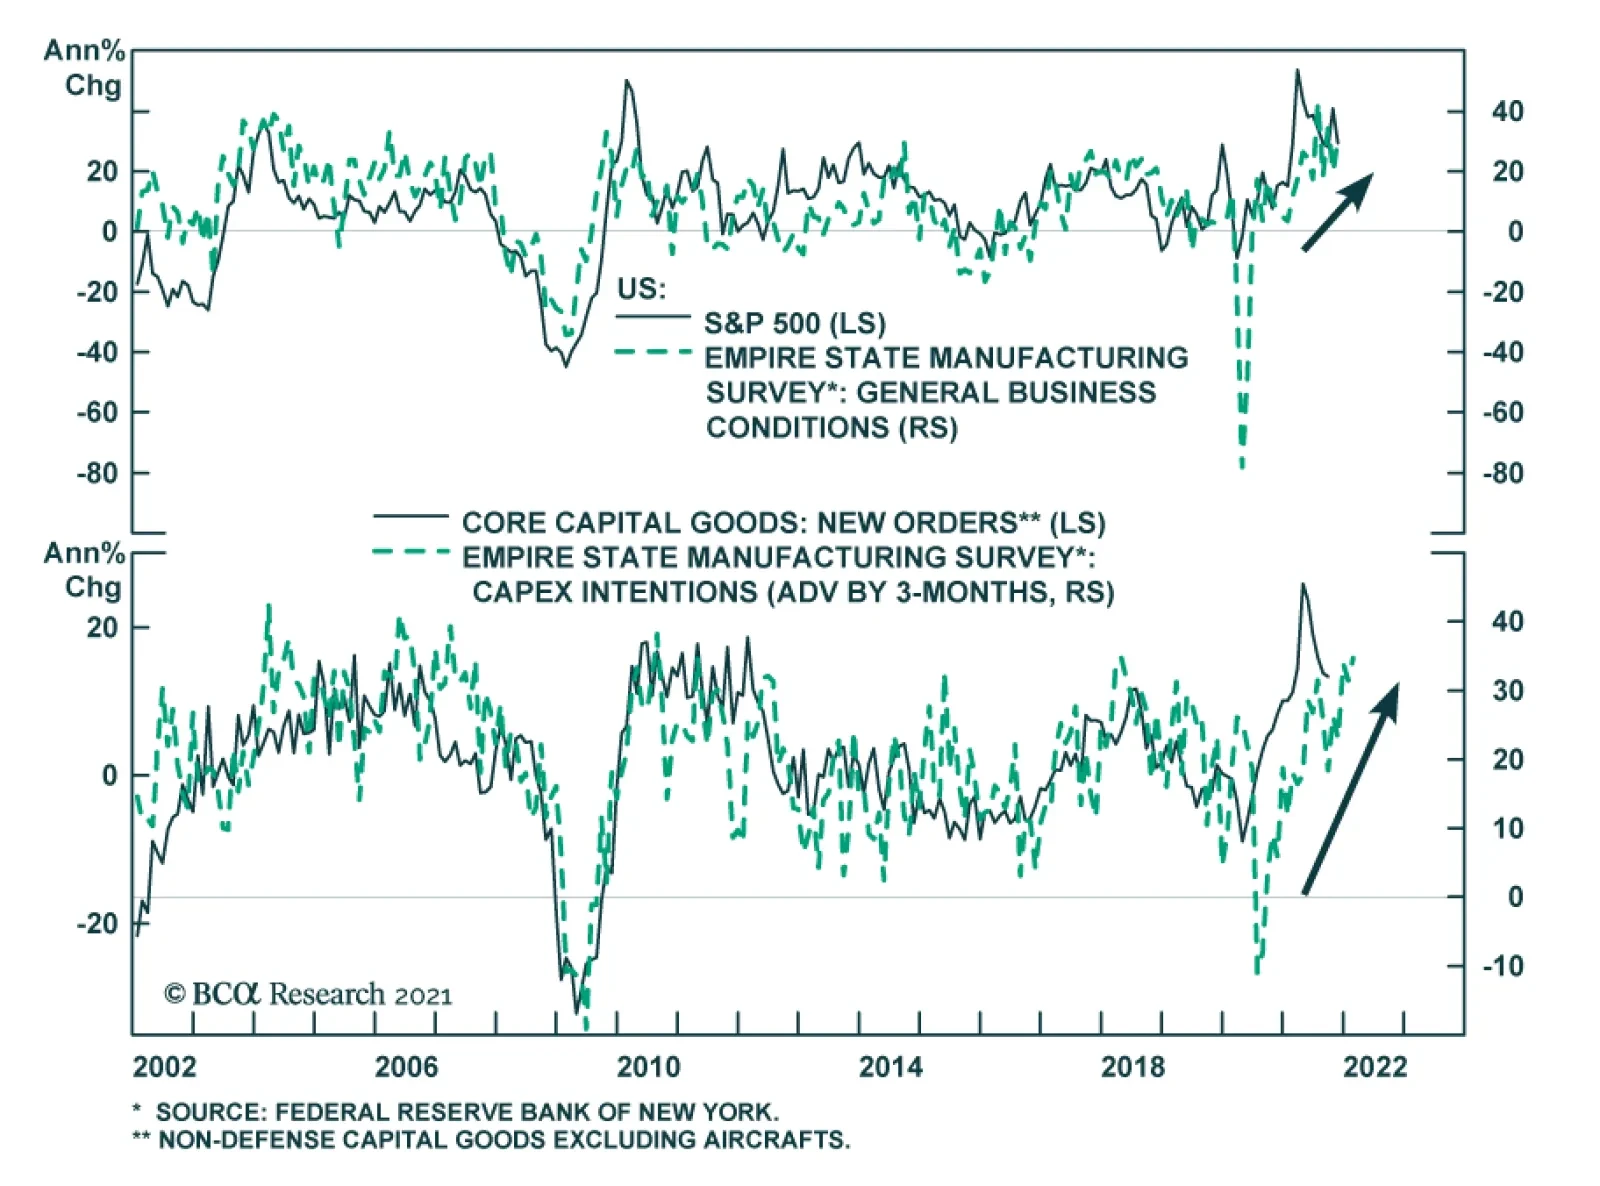
The November Empire State Manufacturing Survey sent a positive signal about the state of US manufacturing activity. The headline general business conditions index jumped 11 points to 30.9, beating expectations of a more muted 2.2 point rise. The improvement…
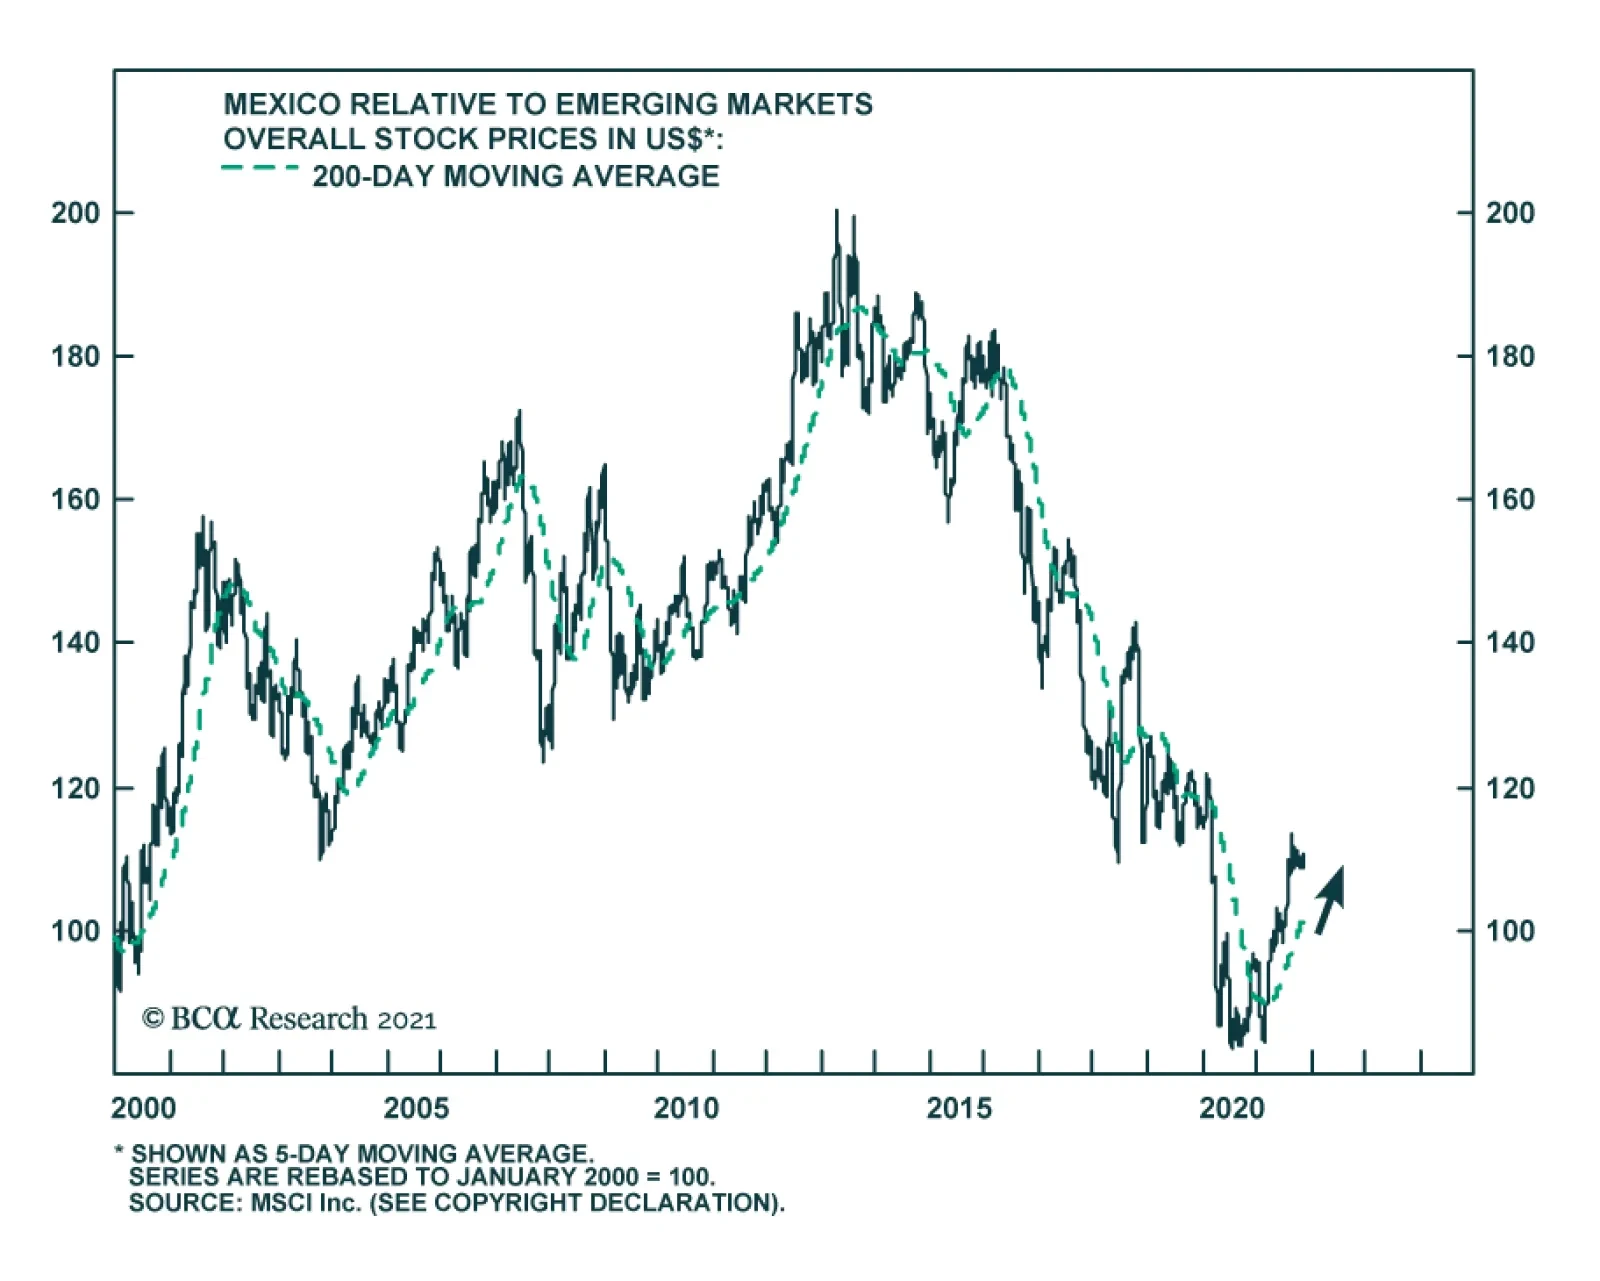
The Bank of Mexico raised rates by 25 bps on Thursday, marking the fourth consecutive rate increase this year and bringing the benchmark rate to 5%. These hikes come as the central bank attempts to temper rising inflation. At 6.24% y/y, CPI headline inflation…
Highlights Geopolitical conflicts point to energy price spikes and could add to inflation surprises in the near term. However, US fiscal drag and China’s economic slowdown are both disinflationary risks to be aware of. Specifically, energy-producers like Russia and Iran gain greater leverage amid energy shortages. Europe’s natural gas prices could spike again. Conflict in the Middle East could disrupt oil flows. President Biden’s $1.75 trillion social spending bill is a litmus test for fiscal fatigue in developed markets. It could fail, and even assuming it passes it will not prevent overall fiscal drag in 2022-23. However, it is inflationary over the long run. China’s slowdown poses the chief disinflationary risk. But we still think policy will ease to avoid an economic crash ahead of the fall 2022 national party congress. We are closing this year’s long value / short growth trade for a loss of 3.75%. Cyclical sectors ended up being a better way to play the reopening trade. Feature Equity markets rallied in recent weeks despite sharp upward moves in core inflation across the world (Chart 1). Inflation is fast becoming a popular concern and we see geopolitical risks that could drive headline inflation still higher in the short run. We also see underrated disinflationary factors, namely China’s property sector distress and economic slowdown. Several major developments have occurred in recent weeks that we will cover in this report. Our conclusions: Biden’s domestic agenda will pass but risks are high and macro impact is limited. Congress passed Biden’s infrastructure deal and will probably still pass his signature social spending bill, although inflation is creating pushback. Together these bills have little impact on the budget deficit outlook but they will add to inflationary pressures. Energy shortages embolden Russia and Iran. Winter weather is unpredictable, the energy crisis may not be over. But investors are underrating Russia’s aggressive posture toward the West. Any conflict with Iran could also cause oil disruptions in the near future. US-China relations may improve but not for long. A bilateral summit between Presidents Joe Biden and Xi Jinping will not reduce tensions for very long, if at all. Climate change cooperation is an insufficient basis to reverse the cold war-style confrontation over the long run. Chart 1Inflation Rattles Policymakers
Inflation Rattles Policymakers
Inflation Rattles Policymakers
The investment takeaway is that geopolitical tensions could push energy prices still higher in the short term. Iran and Russia need to be monitored. However, China’s economic slowdown will weigh on growth. China poses an underrated disinflationary risk to our views. US Congress: Bellwether For Fiscal Fatigue While inflation is starting to trouble households and voters, investors should bear in mind that the current set of politicians have long aimed to generate an inflation overshoot. They spent the previous decade in fear of deflation, since it generated anti-establishment or populist parties that threatened to disrupt the political system. They quietly built up an institutional consensus around more robust fiscal policy and monetary-fiscal coordination. Now they are seeing that agenda succeed but are facing the first major hurdle in the form of higher prices. They will not simply cut and run. Inflation is accompanied by rising wages, which today’s leaders want to see – almost all of them have promised households a greater share of the fruits of their labor, in keeping with the new, pro-worker, populist zeitgeist. Real wages are growing at 1.1% in the US and 0.9% across the G7 (Chart 2). Even more than central bankers, political leaders are focused on jobs and employment, i.e. voters. Yet the labor market still has considerable slack (Chart 3). Almost all of the major western governments have been politically recapitalized since the pandemic, either through elections or new coalitions. Almost all of them were elected on promises of robust public investment programs to “build back better,” i.e. create jobs, build infrastructure, revitalize industry, and decarbonize the energy economy. Thus while they are concerned about inflation, they will leave that to central banks, as they will be loathe to abandon their grand investment plans. Chart 2Higher Wages: Real Or Nominal?
Higher Wages: Real Or Nominal?
Higher Wages: Real Or Nominal?
Still, there will be a breaking point at which inflation forces governments to put their spending plans on hold. The US Congress is the immediate test of whether today’s inflation will trigger fiscal fatigue and force a course correction. Chart 3Policymakers Fear Populism, Focus On Employment
Policymakers Fear Populism, Focus On Employment
Policymakers Fear Populism, Focus On Employment
President Biden’s $550 billion infrastructure bill passed Congress last week and will be signed into law around November 15. Now he is worried that his signature $1.75 trillion social spending bill will falter due to inflation fears. He cannot spare a single vote in the Senate (and only three votes in the House of Representatives). Odds that the bill fails are about 35%. Democratic Party leaders will not abandon the cause due to recent inflation prints. They see a once-in-a-generation opportunity to expand the role of government, the social safety net, and the interests of their constituents. If they miss this chance due to inflation that ends up being transitory then they will lose the enthusiastic left wing of the party and suffer a devastating loss in next year’s midterm elections, in which they are already at a disadvantage. Biden’s social bill is also likely to pass because the budget reconciliation process necessary to pass the bill is the same process needed to raise the national debt limit by December 3. A linkage of the two by party leaders would ensure that both pass … and otherwise Democrats risk self-inflicting a national debt default. The reconciliation bill is more about long-term than short-term inflation risk. The bill does not look to have a substantial impact on the budget outlook: the new spending is partially offset by new taxes and spread out over ten years. The various legislative scenarios look virtually the same in our back-of-the-envelope budget projections (Chart 4).
Chart 4
However, given that the output gap is virtually closed, this bill combined with the infrastructure bill will add to inflationary pressures. The fiscal drag will diminish by 2024, not coincidentally the presidential election year 2024, not coincidentally the presidential election year. The deficit is not expected to increase or decrease substantially between 2023 and 2024. From then onward the budget deficit will expand. The increased government demand for goods and services and the increased disposable income for low-earning families will add to inflationary pressures. Other developed markets face a similar situation: inflation is picking up, but big spending has been promised and normalizing budgets will marginally weigh on growth in the next few years (Chart 5). True, growth should hold up since the private economy is rebounding in the wake of the pandemic. But politicians will not be inclined to renege on campaign promises of liberal spending in the face of fiscal drag. The current crop of leaders is primed to make major public investments. This is true of Germany, Japan, Canada, and Italy as well as the United States. It is partly true in France, where fiscal retrenchment has been put on hold given the presidential election in the spring. The effect will be inflationary, especially for the US where populist spending is more extravagant than elsewhere.
Chart 5
The long run will depend on structural factors and how much the new investments improve productivity. Bottom Line: A single vote in the US Senate could derail the president’s social spending bill, so the US is now the bellwether for fiscal fatigue in the developed world. Biden is likely to pass the bill, as global fiscal drag is disinflationary over the next 12 months. Yet inflation could stay elevated for other reasons. And this fiscal drag will dissipate later in the business cycle. Russia And Iran Gain Leverage Amid Energy Crunch The global energy price spike arose from a combination of structural factors – namely the pandemic and stimulus. It has abated in recent weeks but will remain a latent problem through the winter season, especially if La Niña makes temperatures unusually cold as expected. Rising energy prices feed into general producer prices, which are being passed onto consumers (Chart 6). They look to be moderating but the weather is unpredictable. There is another reason that near-term energy prices could spike or stay elevated: geopolitics. Tight global energy supply-demand balances mean that there is little margin of safety if unexpected supply disruptions occur. This gives greater leverage to energy producers, two of which are especially relevant at the moment: Russia and Iran. Russia’s long-running conflict with the West is heating up on several fronts, as expected. Russia may not have caused the European energy crisis but it is exacerbating shortages by restricting flows of natural gas for political reasons, as it is wont to do (Chart 7). Moscow always maintains plausible deniability but it is currently flexing its energy muscles in several areas: Chart 6Energy Price Depends On Winter ... And Russia/Iran!
Energy Price Depends On Winter ... And Russia/Iran!
Energy Price Depends On Winter ... And Russia/Iran!
Ukraine: Russia has avoided filling up and fully utilizing pipelines and storage facilities in Ukraine, where the US is now warning that Russia could stage a large military action in retaliation for Ukrainian drone strikes in the still-simmering Russia-Ukraine war. Belarus: Russia says it will not increase the gas flow through the major Yamal-Europe natural gas pipeline in 2022 even as Belarus threatens to halt the pipeline’s operation entirely. Belarus, backed by Russia, is locked in a conflict with Poland and the EU over Belarus’s funneling of migrants into their territory (Chart 8). The conflict could lead not only to energy supply disruptions but also to a broader closure of trade and a military standoff.1 Russia has flown two Tu-160 nuclear-armed bombers over Belarus and the border area in a sign of support. Moldova: Russia is withholding natural gas to pressure the new, pro-EU Moldovan government.
Chart 7
Chart 8
Russia’s main motive is obvious: it wants Germany and the EU to approve and certify the new Nord Stream II pipeline. Nord Stream II enables Germany and Russia to bypass Ukraine, where pipeline politics raise the risk of shortages and wars. Lame duck German Chancellor Angela Merkel worked with Russia to complete this pipeline before the end of her term, convincing the Biden administration to issue a waiver on congressional sanctions that could have halted its construction. However, two of the parties in the incoming German government, the Greens and the Free Democrats, oppose the pipeline. While these parties may not have been able to stop the pipeline from operating, Russia does not want to take any chances and is trying to force Germany’s and the EU’s hand. The energy crisis makes it more likely that the pipeline will be approved, since the European Commission will have to make its decision during a period when cold weather and shortages will make it politically acceptable to certify the pipeline.2 The decision will further drive a wedge between Germany and eastern EU members, which is what Russia wants. EU natural gas prices will likely subside sometime next year and will probably not derail the economic recovery, according to both our commodity and Europe strategists. A bigger and longer-lasting Russian energy squeeze would emerge if the Nord Stream II pipeline is not certified. This is a low risk at this point but the next six months could bring surprises. More broadly, the West’s conflict with Russia can easily escalate from here. First, President Vladimir Putin faces economic challenges and weak political support. He frequently diverts popular attention by staging aggressive moves abroad. There is no reason to believe his post-2004 strategy of restoring Russia’s sphere of influence in the former Soviet space has changed. High energy prices give him greater leverage even aside from pipeline coercion – so it is not surprising that Russia is moving troops to the Ukraine border again. Growing military support for Belarus, or an expanded conflict in Ukraine, are likely to create a crisis now or later. Second, the US-Germany agreement to allow Nord Stream II explicitly states that Russia must not weaponize natural gas supply. This statement has had zero effect so far. But when the energy shortage subsides, the EU could pursue retaliatory measures along with the United States. Of course, Russia has been able to weather sanctions. But tensions are already escalating significantly. After Russia, Iran also gains leverage during times of tight energy supplies. With global oil inventories drawing down, Iran is in the position to inflict “maximum pressure” on the US and its allies, a role reversal from the 2017-20 period in which large inventories enabled the US to impose crippling sanctions on Iran after pulling out of the 2015 nuclear deal (Chart 9). Iran is rapidly advancing on its nuclear program and a new round of diplomatic negotiations may only serve to buy time before it crosses the “breakout” threshold of uranium enrichment capability as early as this month or next. In a recent special report we argued that there is a 40% chance of a crisis over Iran in the Middle East. Such a crisis could ultimately lead to an oil shock in the Persian Gulf or Strait of Hormuz. Chart 9Now Iran Can Use 'Maximum Pressure'
Now Iran Can Use 'Maximum Pressure'
Now Iran Can Use 'Maximum Pressure'
Bottom Line: Russia’s natural gas coercion of Europe could keep European energy prices high through March or May. More broadly Russia’s renewed tensions with the West confirm our view that oil producers gain geopolitical leverage amid the current supply shortages. Iran also gains leverage and its conflict with the US could lead to global oil supply disruptions anytime over the next 12 months. Until Nord Stream II is certified and a new Iranian nuclear agreement is signed, there are two clear sources of potential energy shocks. Moreover in today’s inflationary context there is limited margin of safety for unexpected supply disruptions regardless of source. Xi’s Historical Rewrite China continues to be a major source of risk for the global economy and financial markets in the lead-up to the twentieth national party congress in fall 2022. While Chinese assets have sold off this year, global risk assets are still vulnerable to negative surprises from China. The five-year political reshuffle in 2022 is more important than usual since President Xi Jinping was originally supposed to step down but will instead stick around as leader for life, like China’s previous strongmen Mao Zedong and Deng Xiaoping.3 Xi’s rejection of term limits became clear in 2017 and is not really news. But Xi will fortify himself and his faction in 2022 against any opposition whatsoever. He is extremely vigilant about any threats that could disrupt this process, whether at home or abroad. The Communist Party’s sixth plenary session this week highlights both Xi’s success within the Communist Party and the sensitivity of the period. Xi produced a new “historical resolution,” or interpretation of the party’s history, which is only the third such resolution. A few remarks on this historical resolution are pertinent: Mao’s resolution: Chairman Mao wrote the first such resolution in 1945 to lay down his version of the party’s history and solidify his personal control. It is naturally a revolutionary leftist document. Deng’s revision of Mao: General Deng Xiaoping then produced a major revision in 1981, shortly after initiating China’s economic opening and reform. Deng’s interpretation aimed to hold Mao accountable for “gross mistakes” during the Cultural Revolution and yet to recognize the Communist Party’s positive achievements in founding the People’s Republic. His version gave credit to the party and collective leadership rather than Mao’s personal rule. Two 30-year periods: The implication was that the party’s history should be divided into two thirty-year periods: the period of foundations and conflict with Mao as the party’s core and the period of improvement and prosperity with Deng as the core. Jiang’s support of Deng: Deng’s telling came under scrutiny from new leftists in the wake of Tiananmen Square incident in 1989. But General Secretary Jiang Zemin largely held to Deng’s version of the story that the days of reform and opening were a far better example of the party’s leadership because they were so much more stable and prosperous.4 Xi’s reaction to Jiang and Deng: Since coming to power in 2012, Xi Jinping has shown an interest in revising the party’s official interpretation of its own history. The central claim of the revisionists is that China could never have achieved its economic success if not for Mao’s strongman rule. Mao’s rule and the Communist Party’s central control thus regain their centrality to modern China’s story. China’s prosperity owes its existence to these primary political conditions. The two periods cannot be separated. Xi’s synthesis of Deng and Mao: Now Xi has written himself into that history above all other figures – indeed the communique from the Sixth Plenum mentions Xi more often than Marx, Mao, or Deng (Chart 10). The implication is that Xi is the synthesis of Mao and Deng, as we argued back in 2017 at the end of the nineteenth national party congress. The synthesis consists of a strongman who nevertheless maintains a vibrant economy for strategic ends.
Chart 10
What are the practical policy implications of this history lesson? Higher Country Risk: China’s revival of personal rule, as opposed to consensus rule, marks a permanent increase in “country risk” and political risk for investors. Autocratic governments lack institutional guardrails (checks and balances) that prevent drastic policy mistakes. When Xi tries to step down there will probably be a succession crisis. Higher Macroeconomic Risk: China is more likely to get stuck in the “middle-income trap.” Liberal or pro-market economic reform is de-emphasized both in the new historical resolution and in the Xi administration’s broader program. Centralization is already suppressing animal spirits, entrepreneurship, and the private sector. Higher Geopolitical Risk: The return to autocracy and the withdrawal from economic liberalism also entail a conflict with the United States, which is still the world’s largest economy and most powerful military. The US is not what it once was but it will put pressure on China’s economy and build alliances aimed at strategic containment. Bottom Line: China is trying to escape the middle-income trap, like Taiwan, Japan, and South Korea, but it is trying to do so by means of autocracy, import substitution, and conflict with the United States. These other Asian economies improved productivity by democratizing, embracing globalization, and maintaining a special relationship with the United States. China’s odds of succeeding are low. China will focus on power consolidation through fall 2022 and this will lead to negative surprises for financial markets. China Slowdown: The Disinflationary Risk While it is very unlikely that Xi will face serious challenges to his rule, strange things can happen at critical junctures. Therefore the regime will be extremely alert for any threats, foreign or domestic, and will ultimately prioritize politics above all other things, which means investors will suffer negative surprises. The lingering pandemic still poses an inflationary risk for the rest of the world while the other main risk is disinflationary: Inflationary Risk – Zero COVID: The “Covid Zero” policy of attempting to stamp out any trace of the virus will still be relevant at least over the next 12 months (Chart 11). Clampdowns serve a dual purpose since the Xi administration wants to minimize foreign interference and domestic dissent before the party congress. Hence the global economy can suffer more negative supply shocks if ports or factories are closed. Inflationary Risk – Energy Closures: The government is rationing electricity amid energy shortages to prioritize household heating and essential services. This could hurt factory output over the winter if the weather is bad. Disinflationary Risk – Property Bust: The country is still flirting with overtightening monetary, fiscal, and regulatory policies. Throughout the year we have argued that authorities would avoid overtightening. But China is still very much in a danger zone in which policy mistakes could be made. Recent rumors suggest the government is trying to “correct the overcorrection” of regulatory policy. The government is reportedly mulling measures to relax the curbs on the property sector. We are inclined to agree but there is no sign yet that markets are responding, judging by corporate defaults and the crunch in financial conditions (Chart 12).
Chart 11
Chart 12China Has Not Contained Property Turmoil
China Has Not Contained Property Turmoil
China Has Not Contained Property Turmoil
Evergrande, the world’s most indebted property developer, is still hobbling along, but its troubles are not over. There are signs of contagion among other developers, including state-owned enterprises, that cannot meet the government’s “three red lines.” 5 Credit growth has now broken beneath the government’s target range of 12%, though money growth has bounced off the lower 8% limit set for this year (Chart 13). China is dangerously close to overtightening. China’s economic slowdown has not yet been fully felt in the global economy based on China’s import volumes, which are tightly linked to the combined credit-and-fiscal-spending impulse (Chart 14). The implication is that recent pullbacks in industrial metal prices and commodity indexes will continue. Chart 13China Tries To Avoid Over-Tightening
China Tries To Avoid Over-Tightening
China Tries To Avoid Over-Tightening
Chart 14China Slowdown Not Yet Fully Felt
China Slowdown Not Yet Fully Felt
China Slowdown Not Yet Fully Felt
Until China eases policy more substantially, it poses a disinflationary risk and a strong point in favor of the transitory view of global inflation. It is difficult for China to ease policy – let alone stimulate – when producer prices are so high (see Chart 6 above). The result is a dangerous quandary in which the government’s regulatory crackdowns are triggering a property bust yet the government is prevented from providing the usual policy support as the going gets tough. Asset prices and broader risk sentiment could go into free fall. However, the party has a powerful incentive to prevent a generalized crisis ahead of the party congress. So we are inclined to accept signs that property curbs and other policies will be eased. Bottom Line: The full disinflationary impact of China’s financial turmoil and economic slowdown has yet to be felt globally. Biden-Xi Summit Not A Game Changer As long as inflation prevents robust monetary and fiscal easing, Beijing is incentivized to improve sentiment in other ways. One way is to back away from the regulatory crackdown in other sectors, such as Big Tech. The other is to improve relations with the United States. A stabilization of US ties would be useful before the party congress since President Xi would prefer not to have the US interfering in China’s internal affairs during such a critical hour. No surprise that China is showing signs of trying to stabilize the relationship. The US is apparently reciprocating. Presidents Biden and Xi also agreed to hold a virtual bilateral summit next week, which could lead to a new series of talks. The US Trade Representative also plans to restart trade negotiations. The plan is to enforce the Phase One trade deal, issue waivers for tariffs that hurt US companies, and pursue new talks over outstanding structural disputes. The Phase One trade deal has fallen far short of its goals in general but on the energy front it is doing well. China will continue importing US commodities amid global shortages (Chart 15).
Chart 15
Chart 15
The summit alone will have a limited impact. Biden had a summit with Putin earlier this year but relations could deteriorate tomorrow over cyber-attacks, Ukraine, or Belarus. However, there is some basis for the US and China to cooperate next year: Iran. Xi is consolidating power at home in 2022 and probably wants to use negotiations to keep the Americans at bay. Biden is pivoting to foreign policy in 2022, since Congress will not get anything done, and will primarily focus on halting Iran’s nuclear program. If China assists the US with Iran, then there is a basis for a reduction in tensions. The problem is not only Iran itself but also that China will not jump to enforce sanctions on Iran amid energy shortages. And China is not about to make sweeping structural economic concessions to the US as the Xi administration doubles down on state-guided industrial policy. Meanwhile the US is pursuing a long-term policy of strategic containment and Biden will not want to be seen as appeasing China ahead of midterm elections, especially given Xi’s reversion to autocracy. What about cooperation on climate change? The US and China also delivered a surprise joint statement at the United Nations climate change conference in Scotland (COP26), confirming the widely held expectation that climate policy is an area of engagement. These powers and Europe have a strategic interest in reducing dependency on Middle Eastern oil (Chart 16). Climate talks will begin in the first half of next year. However, climate cooperation is not significant enough alone to outweigh the deeper conflicts between the US and China. Moreover climate policy itself is somewhat antagonistic, as the EU and US are looking at applying “carbon adjustment fees” to carbon-intensive imports, e.g. iron and steel exports from China and other high-polluting producers (Chart 17). While the EU and US are not on the same page yet, and these carbon tariffs are far from implementation, the emergence of green protectionism does not bode well for US-China relations even aside from their fundamental political and military disputes.
Chart 16
Bottom Line: Some short-term stabilization of US-China relations is possible but not guaranteed. Markets will cheer if it happens but the effect will be fleeting. Chinese assets are still extremely vulnerable to political and geopolitical risks.
Chart 17
Investment Takeaways Gold can still go higher. Financial markets are pricing higher inflation and weak real rates. Gold has been our chief trade to prepare both for higher inflation and geopolitical risk. We are closing our long value / growth equity trade for a loss of 3.75%. We are maintaining our long DM Europe / short EM Europe trade. This trade has performed poorly due to the rally in energy prices and hence Russian equities. But while energy prices may overshoot in the near term, investors will flee Russian equities as geopolitical risks materialize. We are maintaining our long Korea / short Taiwan trade despite its being deeply in the red. This trade is valid over a strategic or long-term time horizon, in which a major geopolitical crisis and/or war is likely. Our expectation that China will ease policy to stabilize the economy ahead of fall 2022 should support Korean equities. Matt Gertken Vice President Geopolitical Strategy mattg@bcaresearch.com Footnotes 1 Over the past year President Alexander Lukashenko’s repression of domestic unrest prompted the EU to impose sanctions. Lukashenko responded by organizing an immigration scheme in which Middle Eastern migrants are flown into Belarus and funneled into the EU via Poland. The EU is threatening to expand sanctions while Belarus is threatening to cut off the Yamal-Europe pipeline amid Europe’s energy crisis. See Pavel Felgenhauer, “Belarus as Latest Front in Acute East-West Standoff,” Jamestown Foundation, November 11, 2021, Jamestown.org. 2 Both Germany and the EU must approve of Nord Stream II for it to enter into operation. The German Federal Network Agency has until January 8, 2022 to certify the project. The Economy Ministry has already given the green light. Then the European Commission has two-to-four months to respond. The EU is supposed to consider whether the pipeline meets the EU’s requirement that gas transport be “unbundled” or separated from gas production and sales. This is a higher hurdle but Germany’s clout will be felt. Hence final approval could come by March 8 or May 8, 2022. The energy crisis will put pressure for an early certification but the EU Commission may take the full time to pretend that it is not being blackmailed. See Joseph Nasr and Christoph Steitz, “Certifying Nord Stream 2 poses no threat to gas supply to EU – Germany,” Reuters, October 26, 2021, reuters.com. 3 Xi is not serving for an “unprecedented third term,” as the mainstream media keeps reporting. China’s top office is not constant nor were term limits ever firmly established. Each leader’s reign should be measured by their effective control rather than technical terms in office. Mao reigned for 27 years (1949-76), Deng for 14 years or more (1978-92), Jiang Zemin for 10 years (1992-2002), and Hu Jintao for 10 years (2002-2012). 4 See Joseph Fewsmith, “Mao’s Shadow” Hoover Institution, China Leadership Monitor 43 (2014), and “The 19th Party Congress: Ringing In Xi Jinping’s New Age,” Hoover Institution, China Leadership Monitor 55 (2018), hoover.org. 5 Liability-to-asset ratios less than 70%, debt-to-equity less than 100%, and cash-to-short-term-debt ratios of more than 1.0x. Strategic View Open Tactical Positions (0-6 Months) Open Cyclical Recommendations (6-18 Months) Open Trades & Positions
Image
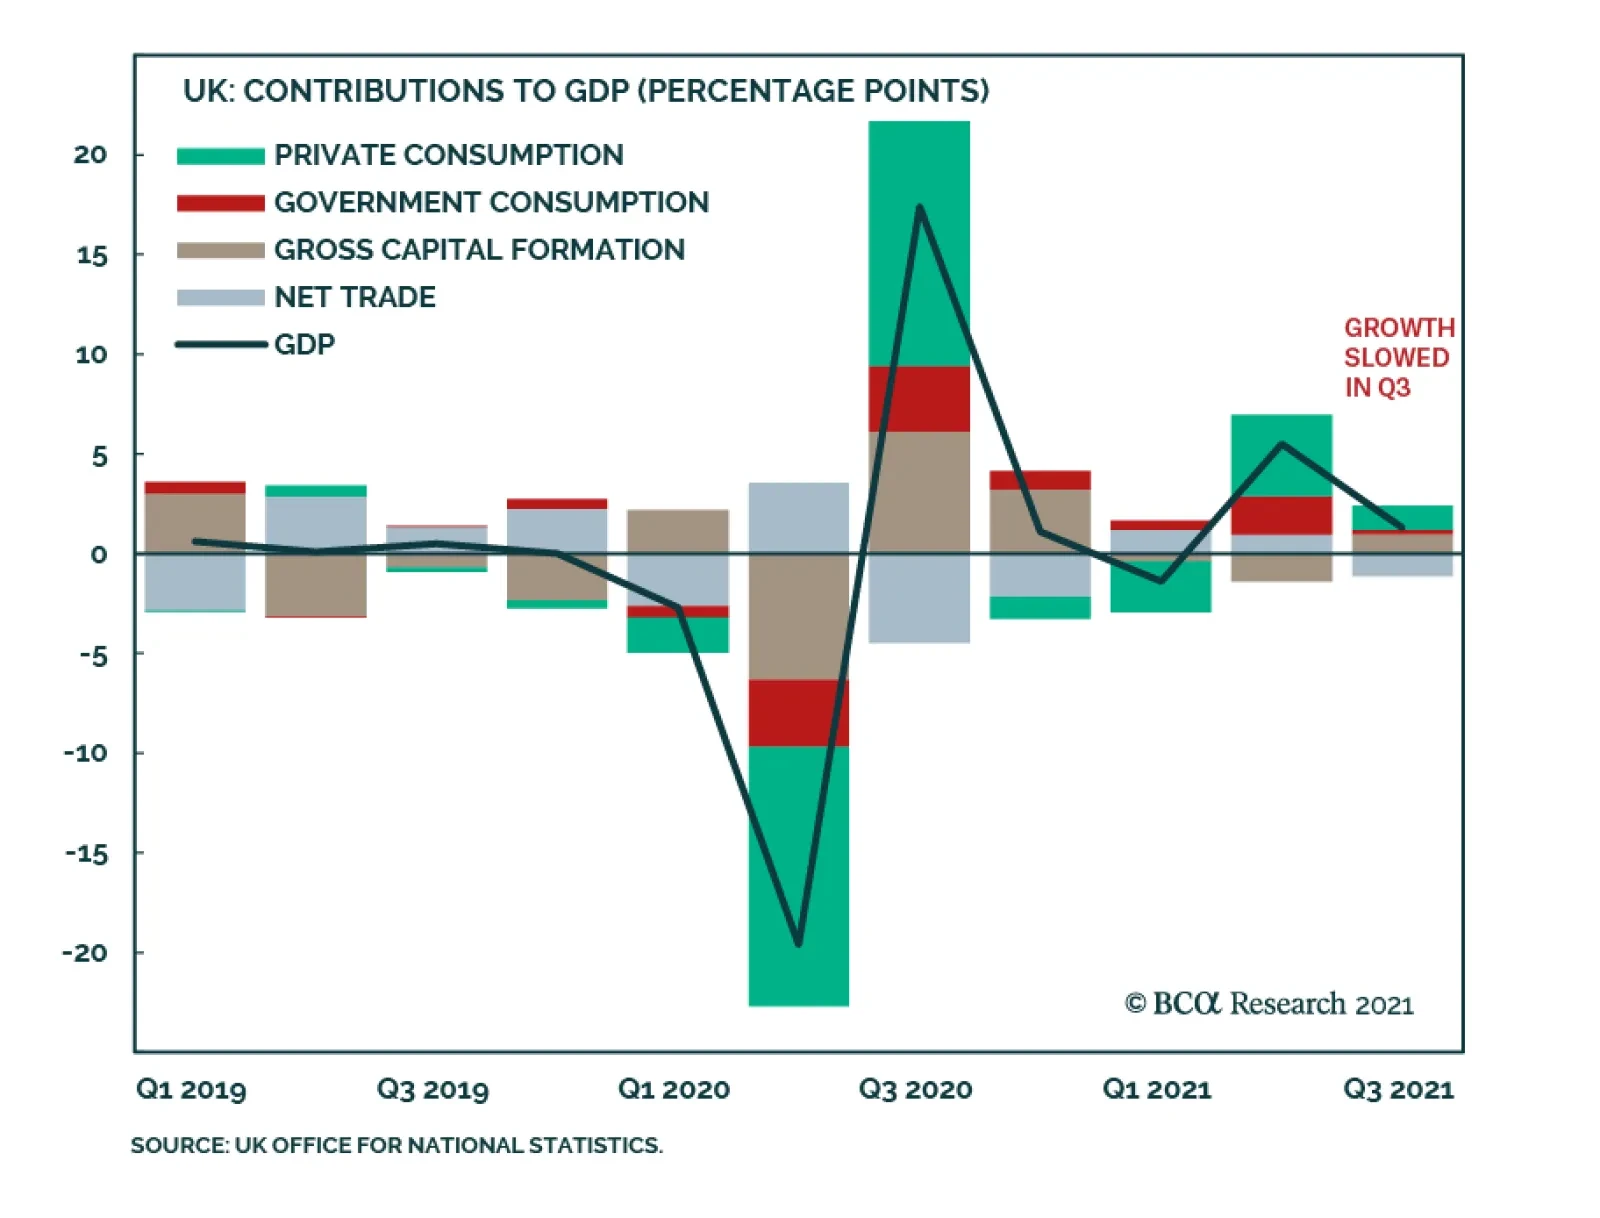
The UK economy decelerated in Q3 with the GDP print falling below expectations. Economic growth slowed from 5.5% to 1.3% q/q versus an anticipated 1.5% rate. Similarly, year-over-year growth moderated to 6.6% from 23.6%. However, the month-on-month momentum…
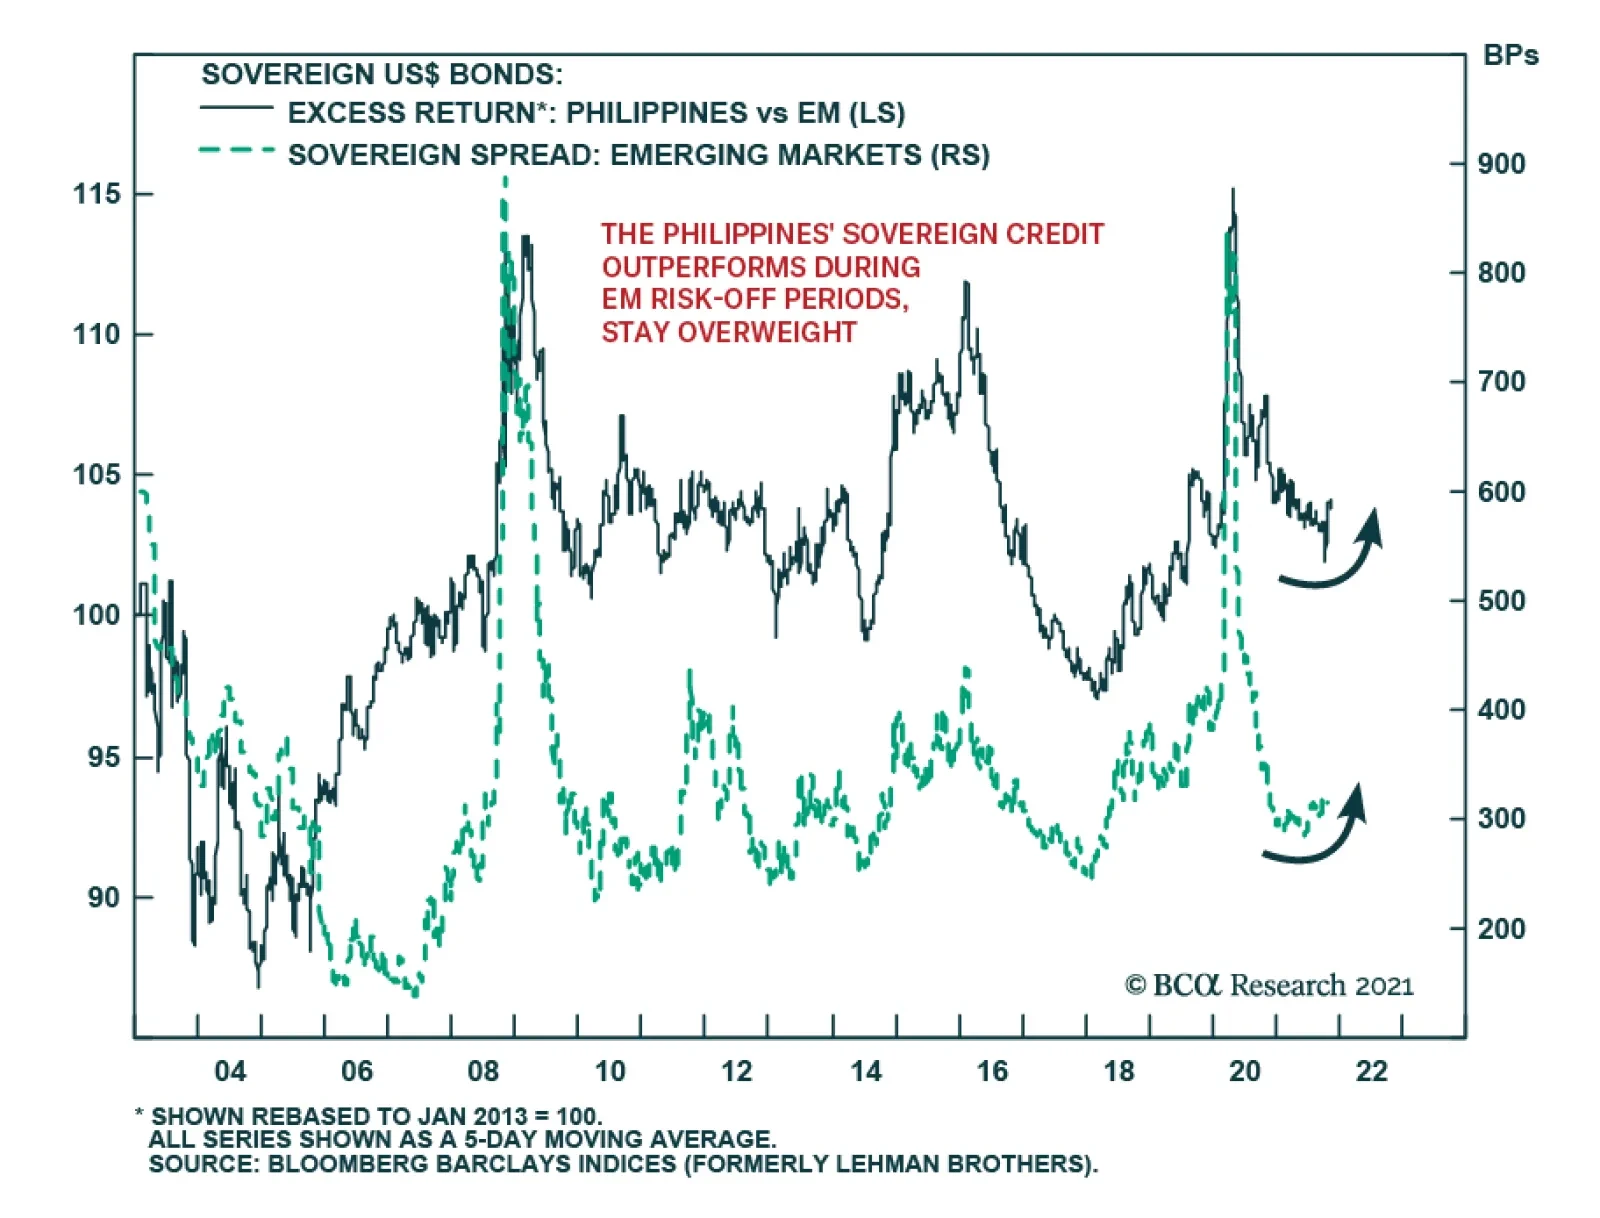
BCA Research’s Emerging Markets Strategy service expects Philippine sovereign credit to outperform its EM counterparts. A negative outlook on overall EM sovereign credit warrants overweighting Philippine sovereign credit relative to its EM brethren. The…