China

Dear Client, We are sending you our Strategy Outlook today where we outline our thoughts on the global economy and the direction of financial markets for 2022 and beyond. Next week, please join me for a webcast on Friday, December 10th at 10:00 AM EST (3:00 PM GMT, 4:00 PM CET, 11:00 PM HKT) to discuss the outlook. Also, we published a report this week transcribing our annual conversation with Mr. X, a long-standing BCA client. Please join my fellow BCA strategists and me on Tuesday, December 7th for a follow-up discussion hosted by my colleague, Jonathan LaBerge. Finally, you will receive a Special Report prepared by our Global Asset Allocation service on Monday, December 13th. Similarly to previous years, Garry Evans and his team have prepared a list of books and articles to read over the holiday period. This year they recommend reading materials on key themes of the moment, such as climate change, cryptocurrencies, supply-chain disruption, and gene technology. Included in this report are my team’s recommendations on what to read to understand the underlying causes of inflation. Best regards, Peter Berezin, Chief Global Strategist Highlights Macroeconomic Outlook: Despite the risks posed by the Omicron variant, global growth should remain above trend in 2022. Inflation will temporarily dip next year as goods prices come off the boil. However, the structural trend for inflation is to the upside, especially in the US. Equities: Remain overweight stocks in 2022, favoring cyclicals, small caps, value stocks, and non-US equities. Look to turn more defensive in mid-2023 in advance of a stagflationary recession in 2024 or 2025. Fixed income: Maintain below-average interest rate duration exposure. The US 10-year Treasury yield will rise to 2%-to-2.25% by the end of 2022. Underweight the US, UK, Canada, and New Zealand in a global bond portfolio. Credit: Corporate debt will outperform high-quality government bonds next year. Favor HY over IG. Spreads will widen again in 2023. Currencies: As a momentum currency, the US dollar could strengthen some more over the next month or two. Over a 12-month horizon, however, the trade-weighted dollar will weaken. The Canadian dollar will be the best performing G10 currency next year. Commodities: Oil prices will rise, with Brent crude averaging $80/bbl in 2022. Metals prices will remain resilient thanks to tight supply and Chinese stimulus. We prefer gold over cryptos. I. Macroeconomic Outlook Running out of Greek Letters Just as the world was looking forward to “life as normal”, a new variant of the virus has surfaced. While little is known about the Omicron variant, preliminary indications suggest that it is more transmissible than Delta. The emergence of the Omicron variant is coming in the midst of yet another Covid wave. The number of new cases has skyrocketed across parts of northern and central Europe, prompting governments to re-introduce stricter social distancing measures (Chart 1). New cases have also been trending higher in many parts of the US and Canada since the start of November.
Chart 1
Despite the risks posed by Omicron, there are reasons for hope. BioNTech has said that its vaccine, jointly developed with Pfizer, will provide at least partial immunity against the new strain. At present, 55% of the world’s population has had at least one vaccine shot; 44% is fully vaccinated (Chart 2). China is close to launching its own mRNA vaccine next year, which it intends to administer as a booster shot.
Chart 2
In a worst-case scenario, BioNTech has said that it could produce a new version of its vaccine within six weeks, with initial shipments beginning in about three months. New antiviral medications are also set to hit the market. Pfizer claims its newly developed pill cuts the risk of hospitalization by nearly 90% if taken within three days from the onset of symptoms. The drug-maker has announced its intention to produce enough of the medication to treat 50 million people in 2022. In addition, it is allowing generic versions to be manufactured in developing countries. The company has indicated that its antiviral pills will be effective in treating the new strain. Global Growth: Slowing but from a High Level Assuming the vaccines and antiviral drugs are able to keep the new strain at bay, global growth should remain solidly above trend in 2022. Table 1 shows consensus GDP growth projections for the major economies. G7 growth is expected to tick up from 3.6% in 2021Q3 to 4.5% in 2021Q4. Growth is set to cool to 4.1% in 2022Q1, 3.6% in 2022Q2, 2.9% in 2022Q3, 2.3% in 2022Q4, and 2.1% in 2023Q1. Table 1Growth Is Slowing, But From Very High Levels
Strategy Outlook - 2022 Key Views: The Beginning Of The End
Strategy Outlook - 2022 Key Views: The Beginning Of The End
Chart 3
According to the OECD, potential real GDP growth in the G7 is about 1.4% (Chart 3). Thus, while growth in developed economies will slow next year, it is unlikely to return to trend until the second half of 2023. Emerging markets face a more daunting outlook. The Chinese property market is weakening, and the recent collapse of the Turkish lira highlights the structural problems that some EMs face. Nevertheless, the combination of elevated commodity prices, forthcoming Chinese stimulus, and the resumption of the US dollar bear market starting next year should support EM growth. Relative to consensus, we think the risks to growth in both developed and emerging markets are tilted to the upside in 2022. Growth will likely start surprising to the downside in late 2023, however. The United States: No Shortage of Demand US growth slowed to only 2.1% in the third quarter, reflecting the impact of the Delta variant wave and supply-chain bottlenecks. The semiconductor shortage hit the auto sector especially hard. The decline in vehicle spending alone shaved 2.2 percentage points off Q3 GDP growth. Chart 4Durable Goods Spending Is Still Above Pre-Pandemic Trend, While Services Spending Is Catching Up
Durable Goods Spending Is Still Above Pre-Pandemic Trend, While Services Spending Is Catching Up
Durable Goods Spending Is Still Above Pre-Pandemic Trend, While Services Spending Is Catching Up
The fourth quarter is shaping up to be much stronger. The Bloomberg consensus estimate is for real GDP to expand by 4.9%. The Atlanta Fed’s GDPNow model is even more optimistic. It sees growth hitting 9.7%. The demand for goods will moderate in 2022. As of October, real goods spending was still 10% above its pre-pandemic trendline (Chart 4). In contrast, the demand for services will continue to rebound. While restaurant sales have recovered all their lost ground, spending on movie theaters, amusement parks, and live entertainment in October was still down 46% on a seasonally-adjusted basis compared to January 2020. Hotel spending was down 23%. Spending on public transport was down 25%. Spending on dental services was down 16% (Chart 5).
Chart 5
US households have accumulated $2.3 trillion in excess savings over the course of the pandemic. Some of this money will be spent over the course of 2022 (Chart 6). Increased borrowing should also help. After initially plunging during the pandemic, credit card balances are rising again (Chart 7). Banks are eager to make consumer loans (Chart 8). Chart 6Plenty Of Pent-Up Demand
Plenty Of Pent-Up Demand
Plenty Of Pent-Up Demand
Chart 7Credit Card Spending Is Recovering Following The Pandemic Slump
Credit Card Spending Is Recovering Following The Pandemic Slump
Credit Card Spending Is Recovering Following The Pandemic Slump
Household net worth has risen by over 100% of GDP since the start of the pandemic (Chart 9). In an earlier report, we estimated that the wealth effect alone could boost annual consumer spending by up to 4% of GDP. Chart 8Banks Are Easing Credit Standards For Consumer Loans
Banks Are Easing Credit Standards For Consumer Loans
Banks Are Easing Credit Standards For Consumer Loans
Chart 9A Record Rise In Household Net Worth
A Record Rise In Household Net Worth
A Record Rise In Household Net Worth
Business investment will rebound in 2022, as firms seek to build out capacity, rebuild inventories, and automate more production in the face of growing labor shortages. After moving sideways for the better part of two decades, core capital goods orders have broken out to the upside. Surveys of capex intentions have improved sharply (Chart 10). Nonresidential investment was 6% below trend in Q3 – an even bigger gap than for consumer services spending – so there is plenty of scope for capex to increase. Residential investment should also remain strong in 2022 (Chart 11). The homeowner vacancy rate has dropped to a record low, as have inventories of new and existing homes for sale. Homebuilder sentiment rose to a 6-month high in November. Building permits are 7% above pre-pandemic levels. Chart 10Business Investment Should Be Strong In 2022
Business Investment Should Be Strong In 2022
Business Investment Should Be Strong In 2022
Chart 11Residential Construction Will Be Well Supported
Residential Construction Will Be Well Supported
Residential Construction Will Be Well Supported
US Monetary and Fiscal Policy: Baby Steps Towards Tightening Policy is unlikely to curb US aggregate demand by very much next year. While the Federal Reserve will expedite the tapering of asset purchases and begin raising rates next summer, the Fed is unlikely to raise rates significantly until inflation gets out of hand. As we discuss in the Feature section later in this report, the next leg in inflation will be to the downside, even if the long-term trend for inflation is to the upside. The respite from inflation next year will give the Fed some breathing space. A major tightening campaign is unlikely until mid-2023. Reflecting the Fed’s dovish posture, long-term real bond yields hit record low levels in November (Chart 12). Despite giving up some of its gains in recent days, Goldman’s US Financial Conditions Index stands near its easiest level in history (Chart 13). Chart 12US Real Bond Yields Hitting Record Lows
US Real Bond Yields Hitting Record Lows
US Real Bond Yields Hitting Record Lows
Chart 13Easy Financial Conditions In The US
Easy Financial Conditions In The US
Easy Financial Conditions In The US
US fiscal policy will get tighter next year, but not by very much. In November, President Biden signed a $1.2 trillion infrastructure bill into law, containing $550 billion in new spending. BCA’s geopolitical strategists expect Congress to pass a $1.5-to-$2 trillion social spending bill using the reconciliation process. The emergence of the Omicron strain will facilitate passage of the bill because it will allow the Democrats to add some “indispensable” pandemic relief to the package. All in all, the IMF foresees the US cyclically-adjusted primary budget deficit averaging 4.9% of GDP between 2022 and 2026, compared to 2.0% of GDP between 2014 and 2019 (Chart 14).
Chart 14
It should also be noted that government spending on goods and services has been quite weak over the past two years (Chart 15). The budget deficit surged because transfer payments exploded. Unlike direct government spending, which is set to accelerate over the next few years, households saved a large share of transfer payments. Thus, the fiscal multiplier will increase next year, even as the budget deficit shrinks. Chart 15While Overall Consumption Has Recovered, Business Spending and Direct Government Expenditures Remain Below Trend
While Overall Consumption Has Recovered, Business Spending and Direct Government Expenditures Remain Below Trend
While Overall Consumption Has Recovered, Business Spending and Direct Government Expenditures Remain Below Trend
Chart 16European Banks Have Cleaned Up Their Act
European Banks Have Cleaned Up Their Act
European Banks Have Cleaned Up Their Act
Europe: Room to Grow The European economy faces near-term growth pressures. In addition to Covid-related lockdowns, high energy costs will take a bite out of growth. After having dipped in October, natural gas prices have jumped again due to delays in the opening of the Nord Stream 2 pipeline, strong Chinese gas demand, and rising risks of a colder winter due to La Niña. The majority of Germans are in favor of opening the pipeline, suggesting that it will ultimately be approved. This should help reduce gas prices. Meanwhile, the winter will pass and Chinese demand for gas should abate as domestic coal production increases. The combination of increased energy supplies, easing supply-chain bottlenecks, and hopefully some relief on the pandemic front, should all pave the way for better-than-expected growth across the euro area next year. After a decade of housecleaning, European banks are in much better shape (Chart 16). Capex intentions have risen (Chart 17). Consumer confidence is even stronger in the euro area than in the US (Chart 18).
Chart 17
Chart 18Consumer Confidence Is At Pre-Pandemic Levels In The Euro Area, Unlike In The US
Consumer Confidence Is At Pre-Pandemic Levels In The Euro Area, Unlike In The US
Consumer Confidence Is At Pre-Pandemic Levels In The Euro Area, Unlike In The US
Euro area fiscal policy should remain supportive. Infrastructure spending is set to increase as the Next Generation EU fund begins operations. Germany’s “Traffic Light” coalition will pursue a more expansionary fiscal stance. The IMF expects the euro area to run a cyclically-adjusted primary deficit of 1.2% of GDP between 2022 and 2026, compared to a surplus of 1.2% of GDP between 2014 and 2019. For its part, the ECB will maintain a highly accommodative monetary policy. While net asset purchases under the PEPP will end next March, the ECB is unlikely to raise rates until 2023 at the earliest. In contrast to the US, trimmed-mean inflation has barely risen in the euro area (Chart 19). Moreover, unlike their US counterparts, European firms are reporting few difficulties in finding qualified workers (Chart 20). In fact, euro area wage growth slowed to an all-time low of 1.35% in Q3 (Chart 21). Chart 19Trimmed-Mean Inflation: Higher In The US Than In The Euro Area And Japan
Trimmed-Mean Inflation: Higher In The US Than In The Euro Area And Japan
Trimmed-Mean Inflation: Higher In The US Than In The Euro Area And Japan
Chart 20
Chart 21Wage Growth Remains Contained Across The Euro Area
Wage Growth Remains Contained Across The Euro Area
Wage Growth Remains Contained Across The Euro Area
The UK finds itself somewhere between the US and the euro area. Trimmed-mean inflation is running above euro area levels, but below that of the US. UK labor market data remains very strong, as evidenced by robust employment gains, firm wage growth, and a record number of job vacancies. The PMIs stand at elevated levels, with the new orders component of November’s manufacturing PMI rising to the highest level since June. While worries about the impact of the Omicron variant will likely cause the Bank of England to postpone December’s rate hike, we expect the BoE to begin raising rates in February. Japan: Short-Term Stimulus Boost A major Covid wave during the summer curbed Japanese growth. Consumer spending rebounded after the government removed the state of emergency on October 1 but could falter again if the Omicron variant spreads. The government has already told airlines to halt reservations for all incoming international flights for at least one month. On the positive side, the economy will benefit from new fiscal measures. Following the election on October 31, the new government led by Prime Minister Fumio Kishida announced a stimulus package worth 5.6% of GDP. As with most Japanese stimulus packages, the true magnitude of fiscal support will be much lower than the headline figure. Nevertheless, the combination of increased cash payments to households, support for small businesses, and subsidies for domestic travel should spur consumption in 2022. The capex recovery in Japan has lagged other major economies. This is partly due to the outsized role of the auto sector in Japan’s industrial base. Motor vehicle shipments fell 37% year-over-year in October, dragging down export growth with it. As automotive chip supplies increase, Japan’s manufacturing sector should gain some momentum. Despite the prospect of stronger growth next year, the Bank of Japan will stand pat. Core inflation remains close to zero, while long-term inflation expectations remain far below the BOJ’s 2% target. We do not expect the BOJ to raise rates until 2024 at the earliest. China: Crosswinds The Chinese economy faces crosswinds going into 2022. On the one hand, the energy crisis should abate, helping to boost growth. China has reopened 170 coal mines and will probably begin re-importing Australian coal. Chinese coal prices have fallen drastically over the past 6 weeks (Chart 22). Coal accounts for about two-thirds of Chinese electricity generation. Chart 22Coal Prices Are Renormalizing In China
Coal Prices Are Renormalizing In China
Coal Prices Are Renormalizing In China
Chart 23China's Property Market Has Weakened
China's Property Market Has Weakened
China's Property Market Has Weakened
The US may also trim tariffs on Chinese goods, as Treasury Secretary Yellen hinted this week. This will help Chinese manufacturers. On the other hand, the property market remains under stress. Housing starts, sales, and land purchases were down 34%, 21%, and 24%, respectively, in October relative to the same period last year. The proportion of households planning to buy a home has plummeted. Loan growth to real estate developers has decelerated to the lowest level on record (Chart 23). Nearly half of their offshore bonds are trading at less than 70 cents on the dollar. The authorities have taken steps to stabilize the property market. They have relaxed restrictions on mortgage lending and land sales, cut mortgage rates in some cities, and have allowed some developers to issue asset backed securities to repay outstanding debt. Most Chinese property is bought “off-plan”. The government does not want angry buyers to be deprived of their property. Thus, the existing stock of planned projects will be built. Chart 24 shows that this is a large number; in past years, developers have started more than twice as many projects as they have completed. The longer-term problem is that China builds too many homes. Like Japan in the early 1990s, China’s working-age population has peaked (Chart 25). According to the UN, it will decline by over 400 million by the end of the century. China simply does not need to construct as many new homes as it once did. Chart 24Chinese Construction: Halfway Done
Chinese Construction: Halfway Done
Chinese Construction: Halfway Done
Chart 25Demographic Parallels Between China And Japan
Demographic Parallels Between China And Japan
Demographic Parallels Between China And Japan
Chart 26
Japan was unable to fill the gap that a shrinking property sector left in aggregate demand in the early 1990s. As a result, the economy fell into a deflationary trap. China is likely to have more success. Unlike Japan, which waited too long to pursue large-scale fiscal stimulus, China will be more aggressive. The authorities will raise infrastructure spending next year with a focus on clean energy. They will also boost social spending. A frayed social safety net has forced Chinese households to save more than they would otherwise for precautionary reasons. This has weighed on consumption. The fact that China is a middle-income country helps. In 1990, Japan’s output-per-worker was nearly 70% of US levels; China’s output-per-worker is still 20% of US levels (Chart 26). If Chinese incomes continue to grow at a reasonably brisk pace, this will make it easier to improve home affordability. It will also allow China to stabilize its debt-to-GDP ratio without a painful deleveraging campaign. II. Feature: The Long-Term Inflation Outlook Two Steps Up, One Step Down We expect inflation in the US, and to a lesser degree abroad, to follow a “two steps up, one step down” trajectory of higher highs and higher lows. The US is currently near the top of those two steps. Inflation should dip over the next 6-to-9 months as the demand for goods moderates and supply-chain disruptions abate. Chart 27 shows that container shipping costs have started to come down. The number of ships anchored off the ports of Los Angeles and Long Beach is falling. US semiconductor firms are working overtime (Chart 28). Chip production in Japan and Korea is rising swiftly. DRAM chip prices have already started to decline. Chart 27Signs Of Easing Supply Issues On The Rough Seas
Signs Of Easing Supply Issues On The Rough Seas
Signs Of Easing Supply Issues On The Rough Seas
Chart 28Semiconductor Manufacturers Are Stepping Up Their Game
Semiconductor Manufacturers Are Stepping Up Their Game
Semiconductor Manufacturers Are Stepping Up Their Game
Reflecting the easing of supply-chain bottlenecks, both the “prices paid” and “supplier delivery” components of the manufacturing ISM declined in November. The respite from inflation will not last long, however. The US labor market is heating up. So far, most of the wage growth has been at the bottom end of the income distribution (Chart 29). Wage growth will broaden out over the course of 2022, pushing up service price inflation in the process. Chart 29Wage Growth Has Picked Up, But Mainly At The Bottom Of The Income Distribution
Wage Growth Has Picked Up, But Mainly At The Bottom Of The Income Distribution (I)
Wage Growth Has Picked Up, But Mainly At The Bottom Of The Income Distribution (I)
Chart 30Rent Inflation Has Increased
Rent Inflation Has Increased
Rent Inflation Has Increased
Rent inflation will also rise, as the unemployment rate falls further. The Zillow rent index has spiked 14% (Chart 30). Rents account for 8% of the US CPI basket and 4% of the PCE basket. Biased About Neutral? Investors are assuming that the Fed will step in to extinguish any inflationary fires before they get out of hand. The widely-followed 5-year/5-year forward TIPS breakeven inflation rate has fallen back below the Fed’s comfort zone (Chart 31). Chart 31Long-Term Inflation Expectations Are Not A Source Of Worry For The Fed
Long-Term Inflation Expectations Are Not A Source Of Worry For The Fed (II)
Long-Term Inflation Expectations Are Not A Source Of Worry For The Fed (II)
Chart 32Both The Fed And Investors Have Lowered Their Estimate Of The Neutral Rate
Both The Fed And Investors Have Lowered Their Estimate Of The Neutral Rate
Both The Fed And Investors Have Lowered Their Estimate Of The Neutral Rate
This may be wishful thinking. Back in 2012, when the Fed began publishing its “dots”, it thought the neutral rate of interest was 4.25%. Today, it considers it to be around 2.5% (Chart 32). Market participants broadly agree. Both investors and policymakers have bought into the secular stagnation thesis hook, line, and sinker. If the neutral rate turns out to be higher than widely believed, the Fed could find itself woefully behind the curve. Given the “long and variable” lags between changes in monetary policy and the resulting impact on the economy, inflation is liable to greatly overshoot the Fed’s target. Structural Forces Turning More Inflationary Meanwhile, the forces that have underpinned low inflation over the past few decades are starting to fray: Globalization is in retreat: The ratio of global trade-to-manufacturing output has been flat for over a decade (Chart 33). Looking out, the ratio could decline as geopolitical tensions between China and the rest of the world continue to simmer, and more companies shift production back home in order to gain greater control over the supply chains of essential goods. Baby boomers are leaving the labor force en masse: As a group, baby boomers hold more than half of US household wealth (Chart 34). They will continue to run down their wealth once they retire. However, since they will no longer be working, they will no longer contribute to national output. Spending that is not matched by output tends to drive up inflation. Chart 33Globalization Plateaued Over a Decade Ago
Globalization Plateaued Over a Decade Ago
Globalization Plateaued Over a Decade Ago
Chart 34
Social stability is in peril: The US homicide rate increased by 27% in 2020, the biggest one-year jump on record. All indications suggest that crime has continued to rise in 2021, coinciding with the ongoing decline in the incarceration rate (Chart 35). Amazingly, the murder rate and inflation are highly correlated (Chart 36). If the government cannot credibly commit to keeping people safe, how can it credibly commit to keeping inflation low? Without trust in government, inflation expectations could quickly become unmoored. Chart 35The Homicide Rate Has Tended To Rise When The Institutionalization Rate Has Declined
The Homicide Rate Has Tended To Rise When The Institutionalization Rate Has Declined
The Homicide Rate Has Tended To Rise When The Institutionalization Rate Has Declined
Chart 36Bouts Of Inflation Tend To Coincide With Rising Crime
Bouts Of Inflation Tend To Coincide With Rising Crime
Bouts Of Inflation Tend To Coincide With Rising Crime
The temptation to monetize debt will rise: Public-sector debt levels have soared to levels last seen during World War II. If bond yields rise as the Congressional Budget Office expects, debt-servicing costs will triple by the end of the decade (Chart 37). Faced with the prospect of having to divert funds from social programs to pay off bondholders, the government may apply political pressure on the Fed to keep rates low.
Chart 37
A Post-Pandemic Productivity Boom?
Chart 38
Might faster productivity growth bail out the economy just like it did following the Second World War? Don’t bet on it. US labor productivity did increase sharply during the initial stages of the pandemic. However, that appears to have been largely driven by composition effects that saw many low-skilled, poorly-paid service workers lose their jobs. As these low-skilled workers have returned to the labor force, productivity growth has dropped. The absolute level of productivity declined by 5.0% at an annualized rate in the third quarter, leading to an 8.3% increase in labor costs. Productivity growth has been extremely weak outside the US (Chart 38). This gives weight to the view that the pandemic-induced changes in business practices have not contributed to higher productivity, at least so far. It is worth noting that a recent study of 10,000 skilled professionals at a major IT company revealed that work-from-home policies decreased productivity by 8%-to-19%, mainly because people ended up working longer. Increased investment spending should eventually boost productivity. However, the near-term impact of higher capex will be to boost aggregate demand, stoking inflation in the process. III. Financial Markets A. Portfolio Strategy Above-Trend Global Growth Will Support Equities Our golden rule of investing is about as simple as they come: Don’t bet against stocks unless you think that there is a recession around the corner. As Chart 39 shows, recessions and equity bear markets almost always overlap.
Chart 39
Chart 40Sentiment Towards Equities Is Already Bearish
Sentiment Towards Equities Is Already Bearish
Sentiment Towards Equities Is Already Bearish
Equity corrections can occur outside of recessionary periods. In fact, we are experiencing such a correction right now. Yet, with the percentage of bearish investors reaching the highest level in over 12 months in this week’s AAII survey, chances are that the correction will not last much longer (Chart 40). A sustained decline in stock prices requires a sustained decline in corporate earnings; the latter normally only happens during economic downturns. Admittedly, it is impossible to know for sure if a recession is lurking around the corner. If the Omicron variant is able to completely evade the vaccines, growth will slow considerably over the coming months. Yet, even in that case, the global economy is unlikely to experience a sudden-stop of the sort that occurred last March. As noted at the outset of this report, pharma companies have the tools to tweak the vaccines, and most experts believe that the soon-to-be-released antivirals will be effective against the new strain. If economic growth remains above trend, earnings will rise (Chart 41). S&P 500 companies generated $53.82 per share in profits in Q3. The bottom-up consensus is for these companies to generate an average of $54.01 in quarterly profits between 2021Q4 and 2022Q3, implying almost no growth from 2021Q3 levels. This is a very low bar to clear. We expect global equities to produce high single-digit returns next year. Chart 41Analysts Increased Earnings Estimates This Year
Analysts Increased Earnings Estimates This Year
Analysts Increased Earnings Estimates This Year
The Beginning of the End Our guess is that 2022 will be the last year of the secular equity bull market that began in 2009. In mid-2023 or so, the Fed will come around to the view that the neutral rate is higher than it once thought. Unfortunately, by then, it will be too late; a wage-price spiral will have already emerged. A nasty bear flattening of the yield curve will ensue: Long-term bond yields will rise but short-term rate expectations will increase even more. A recession will follow in 2024 or 2025. The most important real-time indicator we are focusing on to gauge when to turn more bearish on stocks is the 5y/5y forward TIPS breakeven rate. As noted earlier, it is still at the bottom end of the Fed’s comfort zone. If it were to rise above 3%, all hell could break loose, especially if this happened without a corresponding increase in crude oil prices. The Fed takes great pride in the success it has had in anchoring long-term expectations. Any evidence that expectations are becoming unmoored would cause the FOMC to panic. B. Equity Sectors, Regions, And Styles Favor Value, Small Caps, and Non-US Markets in 2022 Until the Fed takes away the punch bowl, a modestly procyclical stance towards equity sectors, styles, and regional equity allocation is warranted. Chart 42The Relative Performance Of Value Stocks Has Closely Tracked Bond Yields This Year
The Relative Performance Of Value Stocks Has Closely Tracked Bond Yields This Year
The Relative Performance Of Value Stocks Has Closely Tracked Bond Yields This Year
The relative performance of value versus growth stocks has broadly followed the trajectory of the 30-year Treasury yield this year (Chart 42). Rising yields should buoy value stocks, with banks being the biggest beneficiaries (Chart 43). In contrast, rising yields will weigh on tech stocks. Chart 43Rising Bond Yields Will Help Bank Shares But Hurt Tech Stocks
Rising Bond Yields Will Help Bank Shares But Hurt Tech Stocks
Rising Bond Yields Will Help Bank Shares But Hurt Tech Stocks
Chart 44The Winners And Losers Of Covid Waves
The Winners And Losers Of Covid Waves
The Winners And Losers Of Covid Waves
If we receive some good news on the pandemic front, this should disproportionately help value. As Chart 44 illustrates, the relative performance of value versus growth stocks has tracked the number of new Covid cases globally. The correlation between new cases and the relative performance of IT and energy has been particularly strong. Rising capex spending will buoy industrial stocks. Industrials are overrepresented in value indices both in the US and abroad (Table 2). Along with financials, industrials are also overrepresented in small cap indices (Table 3). US small caps trade at 15-times forward earnings compared to 21-times for the S&P 500. Table 2Breaking Down Growth And Value By Sector
Strategy Outlook - 2022 Key Views: The Beginning Of The End
Strategy Outlook - 2022 Key Views: The Beginning Of The End
Table 3Financials And Industrials Have A Larger Weight In US Small Caps
Strategy Outlook - 2022 Key Views: The Beginning Of The End
Strategy Outlook - 2022 Key Views: The Beginning Of The End
Time to Look Abroad? Given our preference for cyclicals and value in 2022, it stands to reason that we should also favor non-US markets. Table 4 shows that non-US stock markets have more exposure to cyclical and value sectors. Table 4Cyclicals Are Overrepresented Outside The US
Strategy Outlook - 2022 Key Views: The Beginning Of The End
Strategy Outlook - 2022 Key Views: The Beginning Of The End
Admittedly, favoring non-US stock markets has been a losing proposition for the past 12 years. US earnings have grown much faster than earnings abroad over this period (Chart 45). US stock returns have also benefited from rising relative valuations. Chart 45The US Has Been The Earnings Leader In Recent Years
The US Has Been The Earnings Leader In Recent Years
The US Has Been The Earnings Leader In Recent Years
At this point, however, US stocks are trading at a significant premium to their overseas peers, whether measured by the P/E ratio, price-to-book, or price-to-sales (Chart 46). US profit margins are also more stretched than elsewhere (Chart 47).
Chart 46
Chart 47US Profit Margins Look Stretched
US Profit Margins Look Stretched
US Profit Margins Look Stretched
Chart 48Non-US Stocks Tend To Do Best When The US Dollar Is Weakening
Non-US Stocks Tend To Do Best When The US Dollar Is Weakening
Non-US Stocks Tend To Do Best When The US Dollar Is Weakening
The US dollar may be the ultimate arbiter of whether the US or international stock markets outperform in the 2022. Historically, there has been a close correlation between the trade-weighted dollar and the relative performance of US versus non-US equities (Chart 48). In general, non-US stocks do best when the dollar is weakening. The usual relationship between the dollar and the relative performance of US and non-US stocks broke down in 2020 when the dollar weakened but the tech-heavy US stock market nonetheless outperformed. However, if “reopening plays” gain the upper hand over “pandemic plays” in 2022, the historic relationship between the dollar and US/non-US returns will reassert itself. As we discuss later on, while near-term momentum favors the dollar, the greenback is likely to weaken over a 12-month horizon. This suggests that investors should look to increase exposure to non-US stocks in a month or two. Around that time, the energy shortage gripping Europe will begin to abate, China will be undertaking more stimulus, and investors will start to focus more on the prospect of higher US corporate taxes. C. Fixed Income Maintain Below-Benchmark Duration The yield on a government bond equals the expected path of policy rates over the duration of the bond plus a term premium that compensates investors for locking in their savings at a fixed rate rather than rolling them over at the prevailing short-term rate. While expected policy rates have moved up in the US over the past 2 months, the market’s expectations of where policy rates will be in the second half of the decade have not changed much (Chart 49). Investors remain convinced of the secular stagnation thesis which postulates that the neutral rate of interest is very low.
Chart 49
As for the term premium, it remains stuck in negative territory, much where it has been for the past 10 years (Chart 50). Chart 50Negative Term Premium Across The Board
Negative Term Premium Across The Board
Negative Term Premium Across The Board
The Term Premium Will Increase The notion of a negative term premium may seem odd, as it implies that investors are willing to pay to take on duration risk. However, there is a good reason for why the term premium has been negative: The correlation between bond yields and stock prices has been positive (Chart 51). Chart 51Stocks And Bond Yields Have Not Always Been Positively Correlated
Stocks And Bond Yields Have Not Always Been Positively Correlated
Stocks And Bond Yields Have Not Always Been Positively Correlated
When bond yields are positively correlated with stock prices, bonds are a hedge against bad economic news. If the economy falls into recession, equity prices will drop; the value of your home will go down; you may not get a bonus, or even worse, you may lose your job. But at least the value of your bond portfolio will go up! There is a catch, however: Bonds are a hedge against bad economic news only if that news is deflationary in nature. The 2001 and 2008-09 recessions all saw bond yields drop as the economy headed south. Both recessions were due to deflationary shocks: first the dotcom bust, and later, the bursting of the housing bubble. In contrast, bond yields rose in the lead up to the recession in the 1970s and early 80s. Bonds were not a good hedge against falling stock prices back then because it was surging inflation and rising bond yields that caused stocks to fall in the first place. This raises a worrying possibility that investors have largely overlooked: The term premium may increase as it becomes increasingly clear that the next recession will be caused not by inadequate demand but by Fed tightening in response to an overheated economy. A rising term premium would exacerbate the upward pressure on bond yields stemming from higher-than-expected inflation as well as upward revisions to estimates of the real neutral rate of interest. Again, we do not think that a “term premium explosion” is a significant risk for 2022. However, it is a major risk for 2023 and beyond. Investors should maintain a modestly below-benchmark duration stance for now but look to go maximally underweight duration towards the end of next year. Global Bond Allocation BCA’s global fixed-income strategists recommend underweighting the US, Canada, the UK, and New Zealand in 2022. They suggest overweighting Japan, the euro area, and Australia. US Treasuries trade with a higher beta than most other government bond markets (Chart 52). Our bond strategists expect the US 10-year Treasury yield to hit 2%-to-2.25% by the end of next year. Chart 52High-And Low-Beta Bond Yields
High-And Low-Beta Bond Yields
High-And Low-Beta Bond Yields
As discussed earlier, neither the ECB nor the BoJ are in a hurry to raise rates. Both euro area and Japanese bonds have outperformed the global benchmark when Treasury yields have risen (Chart 53).
Chart 53
Chart 54UK Inflation Expectations Are Higher Than In Other Major Developed Economies
UK Inflation Expectations Are Higher Than In Other Major Developed Economies
UK Inflation Expectations Are Higher Than In Other Major Developed Economies
While rate expectations in Australia have come down on the Omicron news, the markets are still pricing in four hikes next year. With wage growth still below the RBA’s target, our fixed-income strategists think the central bank will pursue a fairly dovish path next year. In contrast, they think New Zealand will continue its hiking cycle. Like Canada, the Reserve Bank of New Zealand has become increasingly concerned about soaring home prices and household indebtedness. Inflation expectations are higher in the UK than elsewhere (Chart 54). With the BoE set to raise rates early next year, gilts will underperform the global benchmark. Overweight High-Yield Corporate Bonds… For Now Chart 55High-Yield Spreads Are Pricing In A Default Rate Of Close To 4%
High-Yield Spreads Are Pricing In A Default Rate Of Close To 4%
High-Yield Spreads Are Pricing In A Default Rate Of Close To 4%
The combination of above-trend economic growth and accommodative monetary policy will provide support for corporate bonds in 2022. For now, we prefer high yield over investment grade. According to our bond strategists, while high-yield spreads are quite tight, they are still pricing in a default rate of 3.8% (Chart 55). This is more than their fair value default estimate of 2.3%-to-2.8%. It is also above the year-to-date realized default rate of 1.7%. As with equities, the bull market in corporate credit will end in 2023 as the Fed is forced to accelerate the pace of rate hikes in the face of an overheated economy and rising long-term inflation expectations. D. Currencies and Commodities Dollar Strength Will Reverse in Early 2022 Since bottoming in May, the US dollar has been trending higher. The US dollar is a high momentum currency: When the greenback starts rising, it usually keeps rising (Chart 56). A simple trading rule that buys the dollar when it is trading above its various moving averages has delivered positive returns (Chart 57). This suggests that the greenback could very well strengthen further over the next month or two.
Chart 56
Chart 57
Over a 12-month horizon, however, we think the trade-weighted dollar will weaken. Both speculators and asset managers are net long the dollar (Chart 58). Current positioning suggests we are nearing a dollar peak. Rising US rate expectations have helped the dollar this year. Chart 59 shows that both USD/EUR and USD/JPY have tracked the spread between the yield on the December 2022 Eurodollar and Euribor/Euroyen contracts, respectively. While the Fed will expedite the pace of tapering, the overall approach will still be one of “baby-steps” towards tightening next year. BCA’s bond strategists do not expect US rate expectations for end-2022 to rise from current levels. Chart 58Long Dollar Positions Are Getting Crowded
Long Dollar Positions Are Getting Crowded
Long Dollar Positions Are Getting Crowded
Chart 59Interest Rates Have Played A Major Role On The Dollar's Performance This Year
Interest Rates Have Played A Major Role On The Dollar's Performance This Year
Interest Rates Have Played A Major Role On The Dollar's Performance This Year
The present level of real interest rate differentials is consistent with a much weaker dollar (Chart 60). Using CPI swaps as a proxy for expected inflation, 2-year real rates in the US are 42 basis points below other developed economies. This is similar to where real spreads were in 2013/14, when the trade-weighted dollar was 16% weaker than it is today. Chart 60AThe Dollar And Interest Rate Differentials (I)
The Dollar And Interest Rate Differentials (I)
The Dollar And Interest Rate Differentials (I)
Chart 60BThe Dollar And Interest Rate Differentials (II)
The Dollar And Interest Rate Differentials (II)
The Dollar And Interest Rate Differentials (II)
Meanwhile, growth outside the US will pick up next year as Europe’s energy crisis abates and China ramps up stimulus. If history is any guide, firmer growth abroad will put downward pressure on the dollar (Chart 61). Chart 61The Dollar Will Weaken As Global Growth Rotates From The US To The Rest Of The World
The Dollar Will Weaken As Global Growth Rotates From The US To The Rest Of The World
The Dollar Will Weaken As Global Growth Rotates From The US To The Rest Of The World
Chart 62Dollar Headwinds
Dollar Headwinds
Dollar Headwinds
Pricey Greenback The dollar’s lofty valuation has left it overvalued by nearly 20% on a Purchasing Power Parity (PPP) basis. The PPP exchange rate equalizes the price of a representative basket of goods and services between the US and other economies. Reflecting the dollar’s overvaluation, the US trade deficit has widened sharply. Excluding energy exports, the US trade deficit as a share of GDP is now the largest on record. Equity inflows have helped finance America’s burgeoning current account deficit (Chart 62). However, these inflows are starting to abate, and could drop further if global investors abandon their infatuation with US tech stocks. Favor Commodity Currencies We favor commodity currencies for 2022, especially the Canadian dollar, which we expect to be the best performing G10 currency. Canadian real GDP growth will average nearly 5% in Q4 and the first half of next year. The Bank of Canada will start hiking rates next April. Oil prices should remain reasonably firm next year, helping the loonie and other petrocurrencies. Bob Ryan, BCA’s chief Commodity Strategist, expects the price of Brent crude to average $80/bbl in 2022 and 81$/bbl in 2023, which is well above the forwards (Chart 63). Years of underinvestment in crude oil production have led to tight supply conditions (Chart 64). Proven global oil reserves increased by only 6% between 2010 and 2020, having risen by 26% over the preceding decade.
Chart 63
Chart 64
As with oil, there has been little investment in mining capacity in recent years. While a weaker property market in China will weigh on metals prices, this will be partly offset by Chinese fiscal stimulus. Looking further ahead, the outlook for metals remains bright. Whereas the proliferation of electric vehicles is bad news for oil demand over the long haul, it is good news for many metals. The typical electric vehicle requires about four times as much copper as a typical gasoline-powered vehicle. Huge amounts of copper will also be necessary to expand electrical grids. The RMB Will Be Stable in 2022 It is striking that despite the appreciation in the trade-weighted dollar since June and escalating concerns about the health of the Chinese economy, the RMB has managed to strengthen by 0.3% against the US dollar. Chinese export growth will moderate in 2022 as global consumption shifts from goods to services. Rising global bond yields may also narrow the yield differential between China and the rest of the world. Nevertheless, we doubt the RMB will weaken very much. China wants the RMB to be a global reserve currency. A weak RMB would run counter to that goal. Rather than weakening the yuan, the Chinese authorities will use fiscal stimulus to support growth. Gold Versus Cryptos? Gold prices tend to move closely with real bond yields (Chart 65). Since August 2020, however, the price of gold has slumped from a high of $2,067/oz to $1,768/oz, even though real yields remain near record lows. The divergence between real yields and gold prices may partly reflect growing demand for cryptocurrencies. Investors increasingly see cryptos as not just a disruptive economic force, but as the premier “anti-fiat” hedge. Whether that view pans out remains to be seen. So far, the vast majority of the demand for cryptocurrencies has stemmed from people hoping to get rich by buying cryptos. To the extent that people are using cryptos for online purchases, it is usually for illegal goods (Chart 66). Chart 65Gold Prices Tend To Correlate Closely With Real Interest Rates
Gold Prices Tend To Correlate Closely With Real Interest Rates
Gold Prices Tend To Correlate Closely With Real Interest Rates
Chart 66
Crypto proponents like to say that the supply of cryptos is finite. While this may be true for individual cryptocurrencies, it is not true for the sector as a whole. Over the past 8 years, the number of cryptocurrencies has swollen from 26 in 2013 to 7,877 (Chart 67). At least with gold, they are not adding any new elements to the periodic table.
Chart 67
At any rate, the easy money in the crypto space has already been made. Bitcoin has doubled in price seven times since the start of 2016. If it were to double just one more time to $120,000, it would be worth $2.2 trillion, equal to the entire stock of US dollars in circulation. Investors looking to hedge long-term inflation risk should shift back into gold. Peter Berezin Chief Global Strategist pberezin@bcaresearch.com Global Investment Strategy View Matrix
Image
Special Trade Recommendations
Image
Current MacroQuant Model Scores
Image
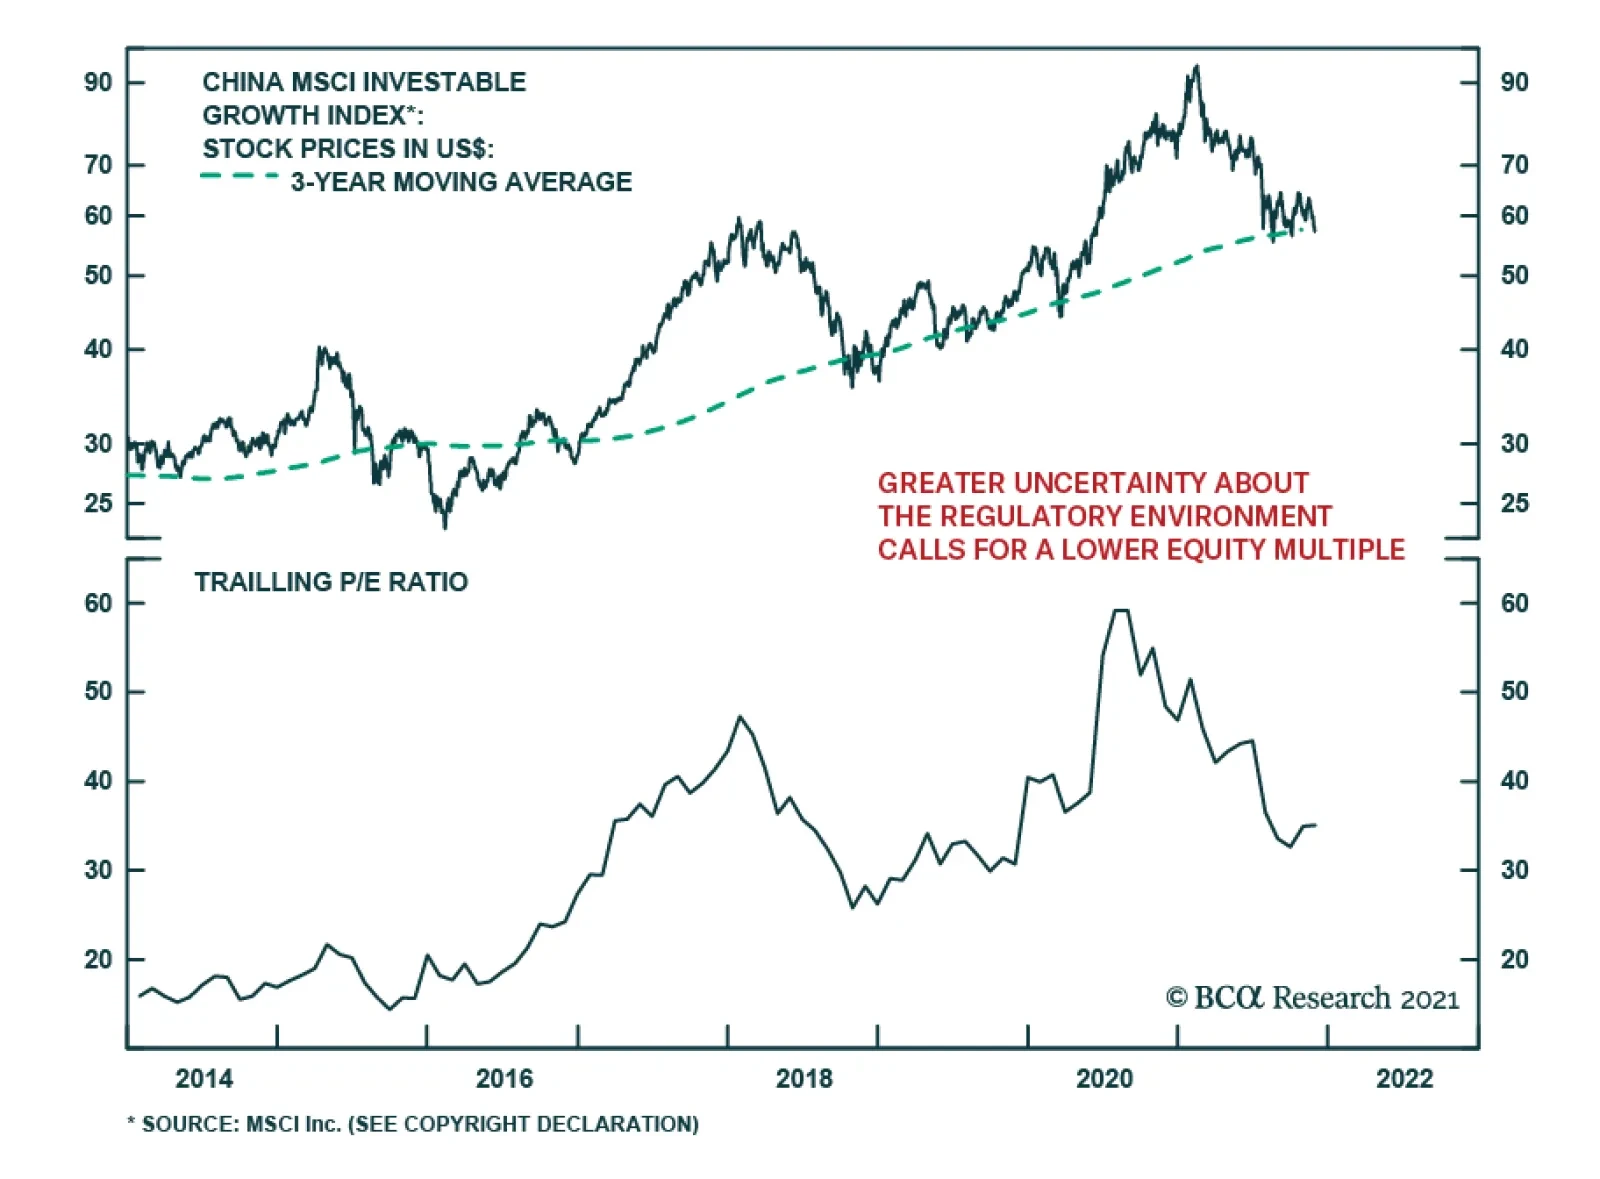
Chinese authorities are taking steps to limit foreign listings of Chinese companies. According to media reports, Beijing is planning to ban companies from using the variable interest entities structure – a loophole used by Chinese tech companies – to go…
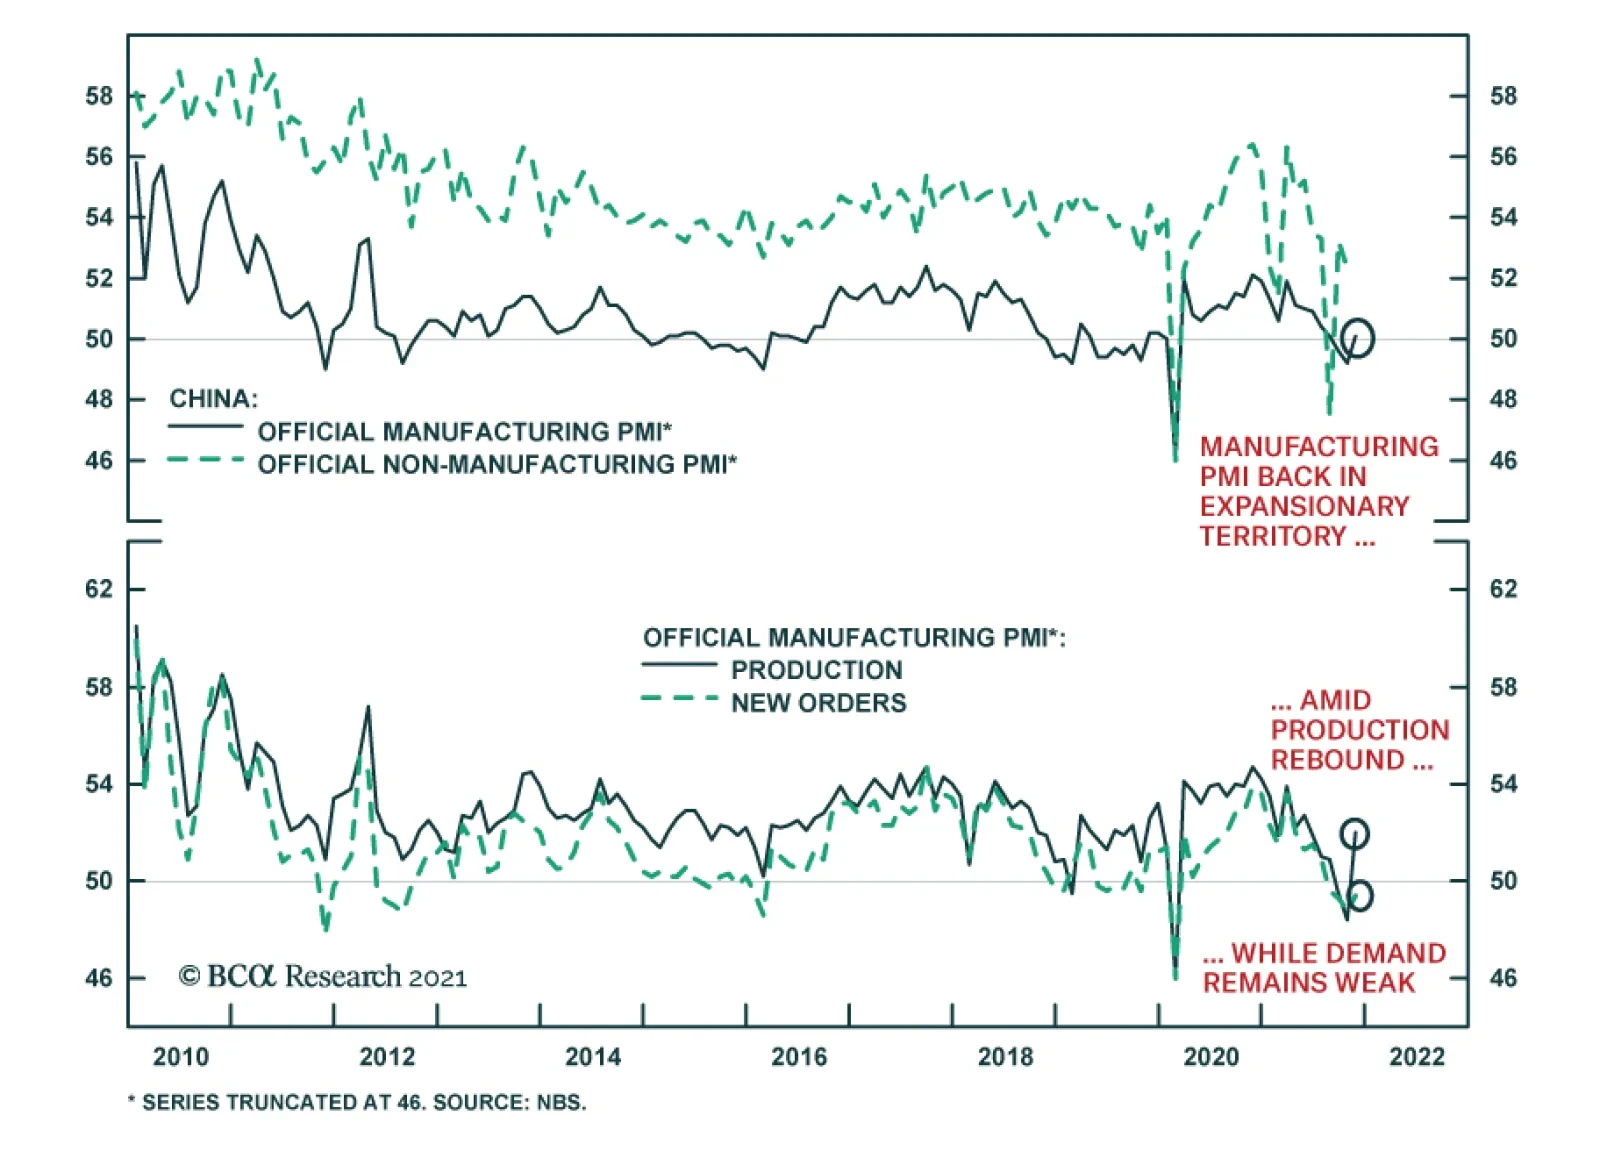
According to China’s National Bureau of Statistics, Chinese economic activity accelerated in November. The composite PMI increased by 1.4 percentage points to 52.2. This improvement reflects the manufacturing PMI’s rebound from 49.2 to 50.1 – above the…
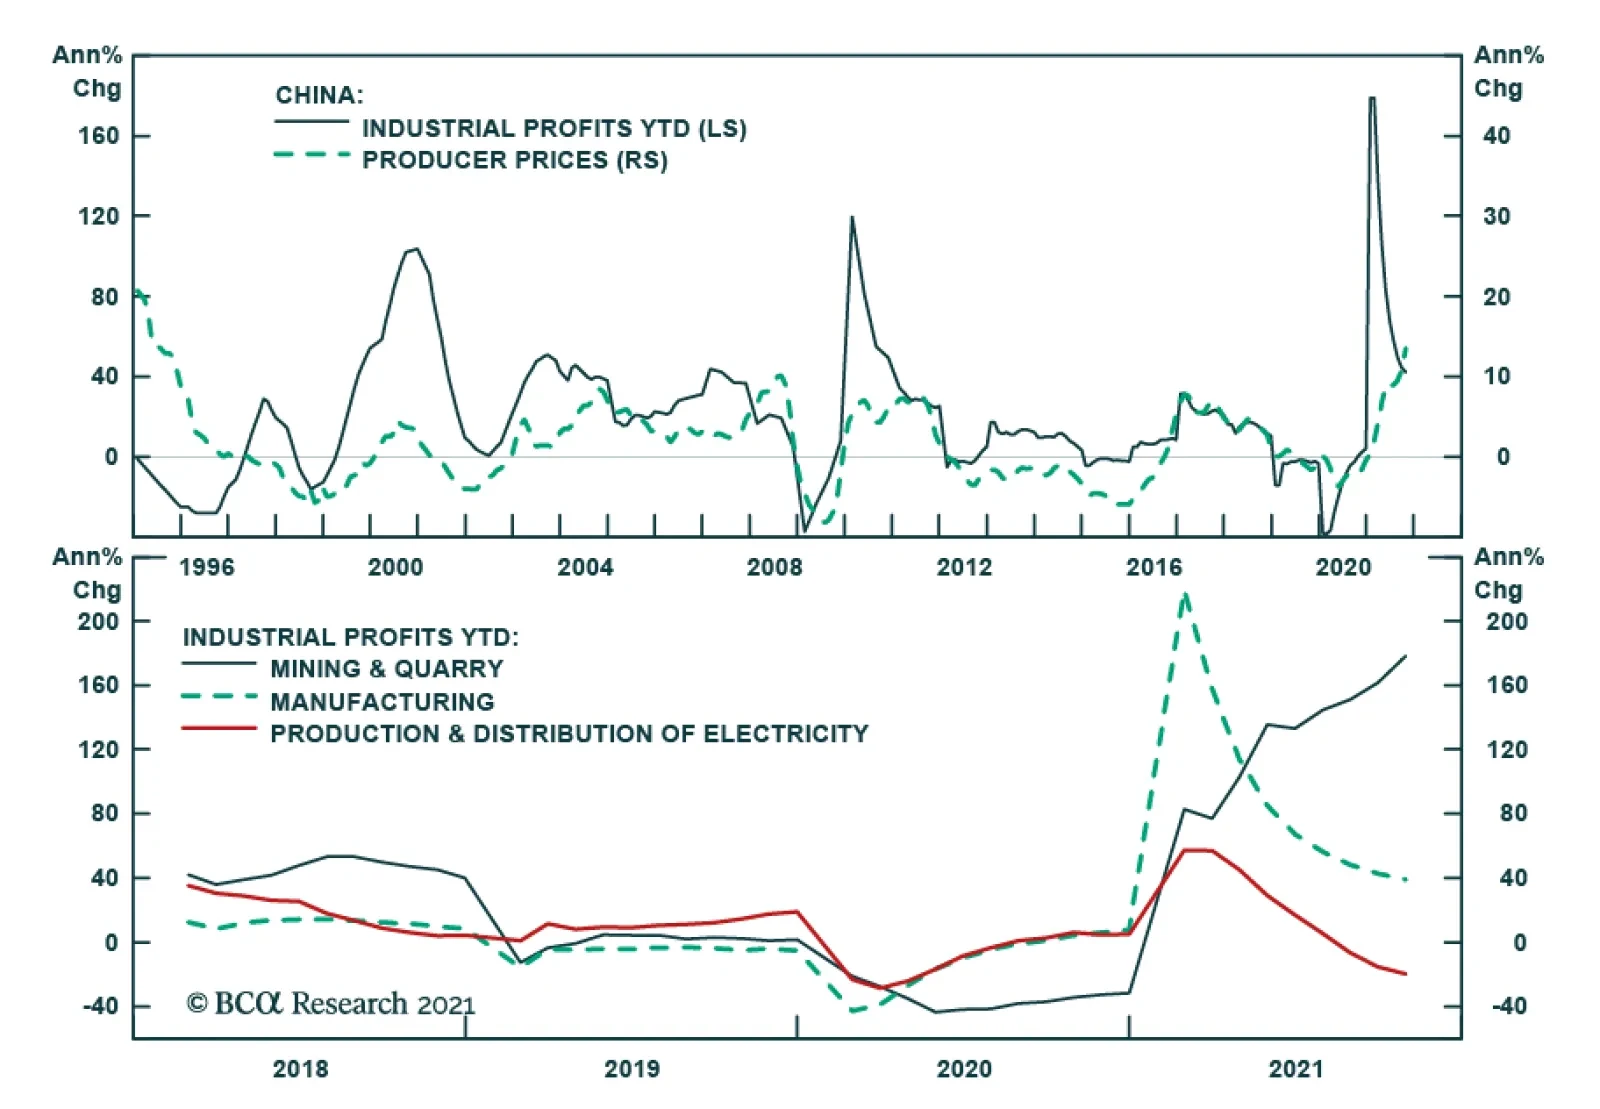
Chinese industrial profit growth accelerated to 24.6% y/y in October from the prior month’s 16.3% y/y. This brings the year-to-date increase in profits to 42.2% y/y for the first 10 months of the 2021. Higher commodity prices boosted Chinese industrial…
Dear Client, Next week, we will be sending you BCA Research’s Annual Outlook, featuring long-time BCA client Mr. X, who visits towards the end of each year to discuss the economic, financial and commodity market outlook for the year ahead. All the best, Bob Ryan Chief Commodity & Energy Strategist Highlights Local politics in Chile and Peru will become critical to the global energy transition, particularly as regards the supply side of the most critical metal for this transition: copper. Chile's runoff elections next month will pit a former congressman portrayed as a hard-right candidate against a protest leader-turned-legislator in a battle for the presidency of a country that accounts for ~ 30% of global copper mining output. In Peru, which accounts for just over 10% of global copper production, the left-of-center administration indicated it will mediate talks to close two gold and silver mines, despite protests from its corporate owners. Tightly balanced supply-demand fundamentals will keep inventories of refined copper extremely low, which will slow the early-stage global transition to renewable power generation until these stocks can be replenished (Chart of the Week). Chinese copper smelters reportedly are collaborating to move refined metal to LME-approved warehouses to restock depleted inventories. While this could reduce backwardations in futures markets, it has not overly depressed flat-price levels, which are within ~ 7% of all-time highs of $4.78/lb ($10,533/MT) put up in May. Fundamentally, base metals – especially copper and aluminum – will remain tight, which supports our long positions in the S&P GSCI and the COMT ETF. Feature Despite a marked deceleration of growth in China brought on by fuel and power shortages, and a strong USD creating tighter financial conditions globally, copper prices – and base metals generally – remain well supported, even as speculative interest, for the most part, has waned this year (Chart 2). Chart of the WeekTight Copper Inventories Support Prices, Backwardation
Tight Copper Inventories Support Prices, Backwardation
Tight Copper Inventories Support Prices, Backwardation
Chart 2Specs Back The Truck Up For Copper Spec Interest Wanes
Specs Back The Truck Up For Copper Spec Interest Wanes
Specs Back The Truck Up For Copper Spec Interest Wanes
Copper and the other metals are well bid because of tight fundamentals – the level of demand has been and remains above the level of supply globally (Chart3). This will continue to exert pressure on inventories and force a re-shuffling of stocks globally – likely from China bonded warehouses to the LME (Chart 4). The London Metal Exchange (LME) was forced to take extraordinary measures to maintain orderly markets and has prompted Chinese smelters to collaborate on shifting material to LME sheds in Asia.1 However, much more refined copper will have to be shipped to these sheds to keep markets from launching into another steep backwardation on the LME similar to last month's $1,100/MT first-to-third-month spread last month – an indication of desperation on the buy side. Chart 3Low Copper Stocks Will Persist
Low Copper Stocks Will Persist
Low Copper Stocks Will Persist
That said, if the only thing that improves LME stocks is a re-shuffle from existing inventories, the net position of the world will largely remain unchanged over time. Demand will be met with inventory draw-downs, but supply will not have increased, which, at the end of the day, means markets will continue to tighten. Chart 4Globally, Exchange Warehouses Tighten
Globally, Exchange Warehouses Tighten
Globally, Exchange Warehouses Tighten
Chile, Peru Politics Become Fundamental Geopolitics always is at the heart of commodity markets: Who's in power and the agendas being pursued matter so much, because, in many cases, unrefined exports of raw commodities sustain governments and important elements of economies in many states. This is becoming clear in Chile and Peru, two states with contestable elections, where the outcomes can profoundly affect the supply side of global fundamentals. Earlier this year, it looked like Chile's presidential and congressional elections would favor left-of-center candidates who did not campaign on market-oriented policies. National elections this past weekend resulted in a run-off that will be held 19 December, as neither the left- nor right-of-center candidates polled an absolute majority. Right-of-center candidates also polled unexpectedly well in congressional elections. This likely translates into something resembling the divided government in the US, which means neither side will be able to get all it wants through the legislature. In the lead-up to the Constitutional re-write expected following elections, the agendas of the left and right are markedly opposed. On the left, greater government involvement in the resources sector has been part of the campaigning, while on the right increased private investment in the stated-owned Codelco, the largest copper producer in the world, is advocated. Both sides also disagree on changes in taxes and royalties, which obviously is of great concern to investors and copper-market participants.2 Chile also is a world-class supplier of lithium, zinc, gold, silver and lead, so it's not just copper markets following developments there with concern. In Peru, the country's newly sworn-in prime minister said she is willing to broker talks on shutting down gold and silver mines in communities where residents have been protesting as soon as possible. This drew a heated reply from mining interests immediately. Peru is the second largest copper miner in the world behind Chile, and the treatment of the owner of the disputed gold and silver mines, Hochschild Mining, is being followed closely. Base and precious metals markets are being forced to factor in a new set of political dynamics, as local political tensions spill into the supply side, causing overall political uncertainty in critical mining states to increase. This will restrain investment, which bodes ill for the global renewable- energy transition. Copper Defies Stronger USD Despite a stronger-than-expected USD this year – boosted most recently by the re-appointment of Jay Powell as Fed Chair and the elevation of Lael Brainard as Vice Chair – copper and base metals have held up well.3 Generally, a strong dollar is bearish for base metals prices (Chart 5), and copper especially (Chart 6). A stronger USD tightens global financial conditions, which, not unexpectedly, is bearish for copper; however, as Chart 7 shows, this effect also has been overcome by the tight copper fundamentals globally.4 We remain bearish the USD going into next year, in line with our colleagues at BCA's Foreign Exchange Strategy. Massive fiscal stimulus in the US in particular, along with continued monetary accommodation from the Fed to fund the deficits this will produce, is expected to weaken the dollar and boost trade. Chart 5Base Metals Defy Strong USD
Base Metals Defy Strong USD
Base Metals Defy Strong USD
Chart 6Copper Defies USD Strength, Boosted By Cyclicals Performance
Copper Defies USD Strength, Boosted By Cyclicals Performance
Copper Defies USD Strength, Boosted By Cyclicals Performance
Chart 7Copper Overcomes Tighter Global Financial Conditions
Copper Overcomes Tighter Global Financial Conditions
Copper Overcomes Tighter Global Financial Conditions
In a recent simulation, we show a 10% fall in the USD and a 5% pick-up in EM imports, along with continued strong performance from cyclicals would lift copper prices to $5.30/lb on the CME Comex by year-end 2022, in our estimation (Chart 8). Chart 8Weaker USD, Stronger EM Imports, Cyclical Strength Would Booster Copper.
Weaker USD, Stronger EM Imports, Cyclical Strength Would Booster Copper.
Weaker USD, Stronger EM Imports, Cyclical Strength Would Booster Copper.
Investment Implications Base metals markets, particularly copper, have withstood tightening financial conditions brought on by a strong USD, a sharp slowdown in Chinese growth brought on by an energy shortage and rising interest rates. This is largely due to extremely tight supply-demand fundamentals, which continue to keep global inventories under pressure. Copper, metals generally, and precious metals also will get a lift from local political tensions spilling into the supply side of markets as overall political uncertainty in critical mining states restrains investment. We remain long the S&P GSCI and the COMT ETF, anticipating higher copper prices and a return to steeper backwardation. Robert P. Ryan Chief Commodity & Energy Strategist rryan@bcaresearch.com Ashwin Shyam Research Associate Commodity & Energy Strategy ashwin.shyam@bcaresearch.com Paula Struk Research Associate Commodity & Energy Strategy paula.struk@bcaresearch.com Commodities Round-Up Energy: Bullish Oil markets looked right through the announcement the US will tap its Strategic Petroleum Reserve (SPR) for 50mm barrels beginning next month, rallying 3.3% to $82.31/bbl by Tuesday's close following the announcement (Chart 9). Under a Congressionally mandated release, the 18mm barrels already authorized had been factored into market balances. The incremental 32mm barrels of crude oil being supplied to the market will be released to successful bidders between 16Dec21 and 30Apr22. These volumes will be repaid during US fiscal years 2022-24, with a volumetric premium added to the initial volume lifted by the successful bidders, which will be specified in the terms of the crude-oil loan. The US fiscal year begins on 1 October. The longer it takes to return the crude oil back to the SPR, the higher the premium volume of crude oil will be required, per the SPR's terms and conditions. The Biden administration succeeded in persuading the governments of China, India, Japan, South Korea and the UK to release unspecified volumes from their SPRs as well. Although volume commitments and release dates were not included in the press release from the White House some 20mm to 30mm barrels reportedly could be supplied from these SPRs. Precious Metals: Bullish Gold prices fell violently, and the US dollar rose following Jay Powell’s re-nomination to Fed chair (Chart 10). Markets assume the Fed will stay the course on its current monetary policy, as opposed to loosening further, which would have lifted gold prices on the back of higher inflation expectations. We believe interest rate hikes will not be brought forward unless inflation expectations become unhinged. In the short run, however, high fuel prices and logistical bottlenecks will continue to feed into higher inflation, implying the Fed will remain behind the curve. Both Powell and Lael Brainard, who was nominated as vice chair of the Fed, stressed vigilance against inflation. In his statement following Biden's decision to re-appoint him as Fed Chair, Powell noted: "Today, the economy is expanding at its fastest pace in many years, carrying the promise of a return to maximum employment. … We know that high inflation takes a toll on families, especially those less able to meet the higher costs of essentials like food, housing, and transportation. We will use our tools both to support the economy and a strong labor market, and to prevent higher inflation from becoming entrenched." Brainard's remarks struck a similar tone. Chart 9
Brent Prices Are Going Up...
Brent Prices Are Going Up...
Chart 10
...As Well As Gold Prices
...As Well As Gold Prices
Footnotes 1 Please see Column: All eyes on China as LME copper spreads collapse: Andy Home, published by reuters.com 18 November 2021. 2 Please see Chile elections may impact a third of the world’s copper supply, published by mining.com on November 19, 2021. 3 Please see Precious Metals commentary in the Commodity Round-Up section. 4 The model shown in Chart 7 also includes iron ore and steel traded in China as explanatory variables. It is noteworthy that copper prices remain resilient to a collapse in iron ore prices brought on by forced closures in China of steel mills to conserve coal and natural gas supplies for human-needs use going into what is expected to be a colder-than-normal winter on the back of a second La Niña in the Northern Hemisphere. Please see our report published 30 September entitled La Niña And The Energy Transition for additional discussion. Investment Views and Themes Strategic Recommendations
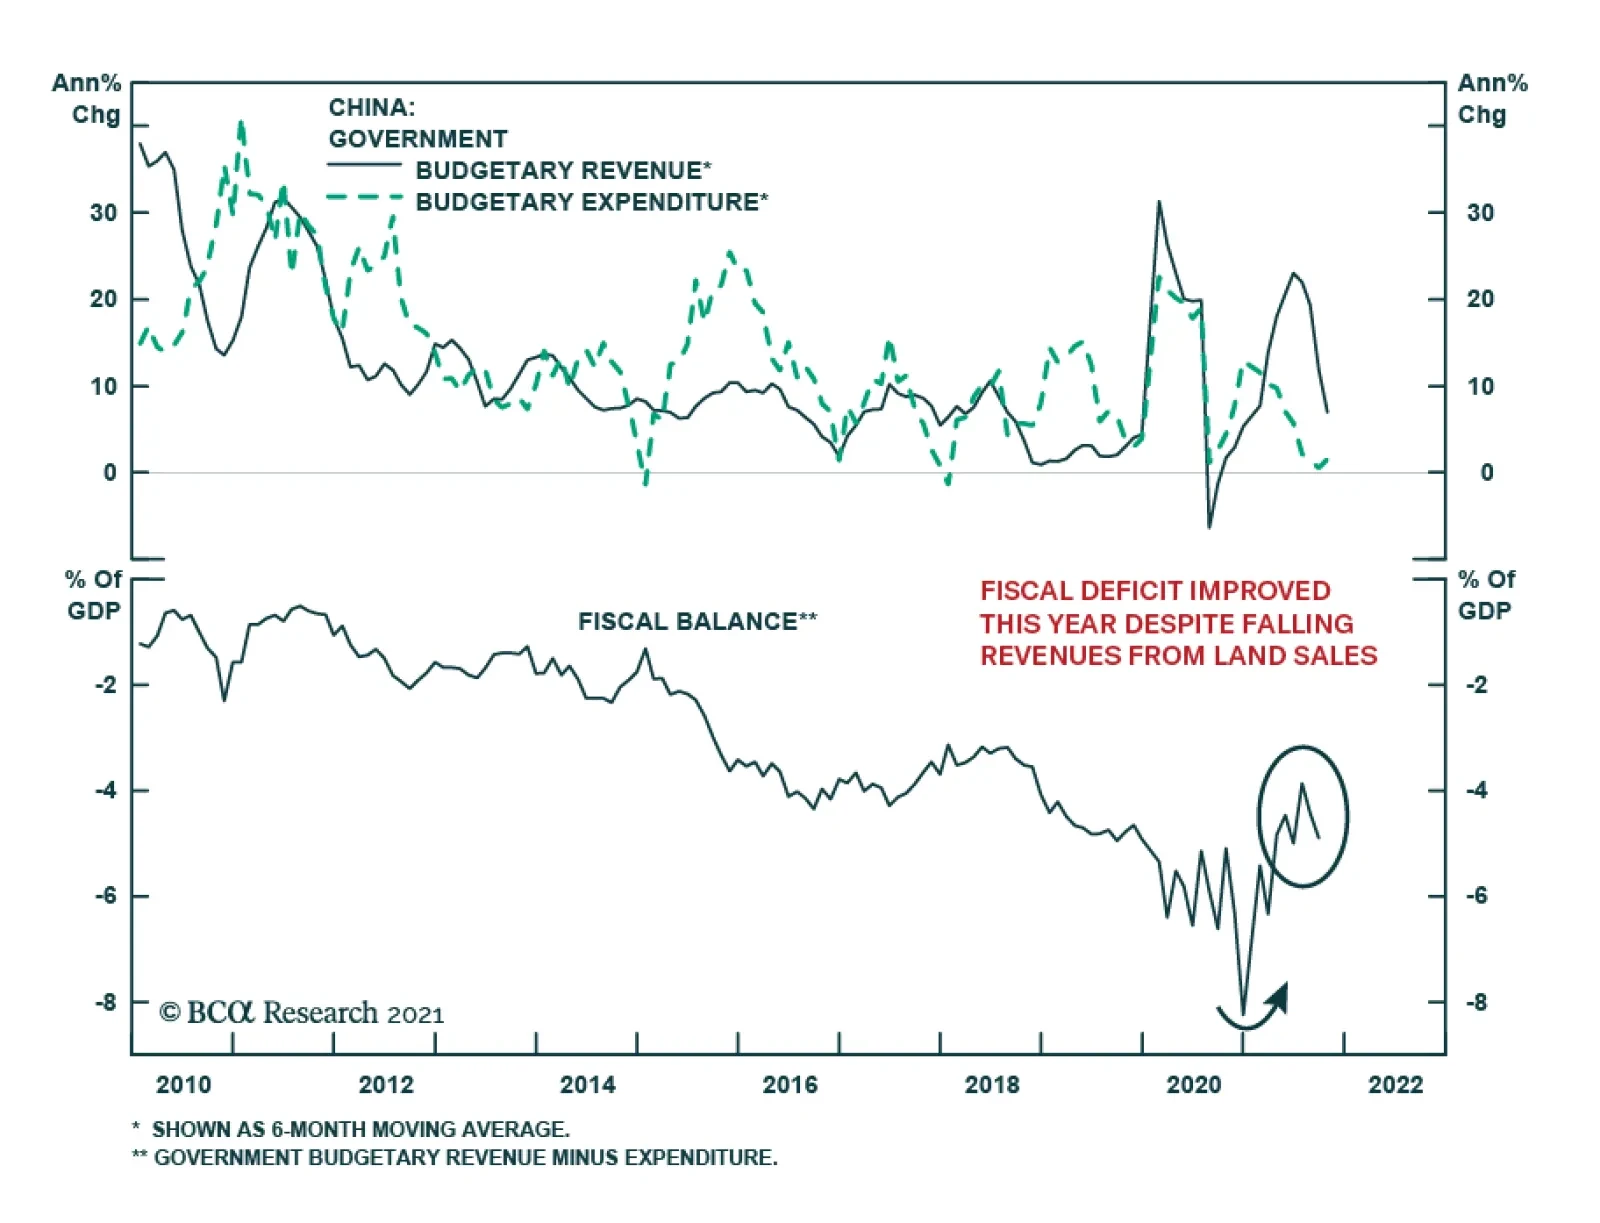
According to BCA Research’s China Investment Strategy service, regulators have been slow to backtrack property market reforms because China’s fiscal deficit has narrowed this year. In previous property market downturns, such as 2011/12, 2015/16 and 2019,…
Dear Client, We will be working on our 2022 Outlook for China, which will be published on December 8. Next week we will be sending you BCA Research’s Annual Outlook, featuring long-time BCA client Mr. X, who visits towards the end of each year to discuss the economic and financial market outlook for the year ahead. Best regards, Jing Sima China Strategist Feature In meetings with our North American clients this past week, we expressed the view that China’s economic growth is on a downward trend and easing measures have been gradual and modest in scope. Most clients agreed that China’s economy faces tremendous headwinds, however, some investors were more optimistic about the outlook for Chinese stocks in the next 6 to 12 months. Valuations in both China’s onshore and offshore equity markets have dropped to multi-year lows and macro policies have started to ease. Cheaply valued Chinese stocks should have more upside in the wake of policy support. Policy tone recently pivoted to a more growth supporting bias, but the existing easing measures will not offset the deceleration in both credit growth and domestic demand. China’s economic activity may worsen before it stabilizes in mid-2022. Moreover, China’s financial markets do not seem to have priced in the economic weakness. Therefore, in the next one to two quarters, risks to Chinese stocks are tilted toward the downside. Chart 1Chinese Stocks Will Truly Bottom When The Economy Troughs
Chinese Stocks Will Truly Bottom When The Economy Troughs
Chinese Stocks Will Truly Bottom When The Economy Troughs
Below are some of the main questions from our meetings and our answers. Q: Policies have started to be more pro-growth. Why do you still underweight Chinese stocks? A: There are two reasons that we maintain a cautious view on Chinese stocks for at least the next six months, in both absolute terms and relative to global equities. First, we do not think that the magnitude of existing easing measures is sufficient to offset the economy’s downward momentum. Secondly, China’s business cycle lags credit growth by about six to nine months. The timing of a turnaround in the economy and stock prices may be later than investors have priced in. In short, we need to see more reflationary measures and a rebound in credit growth to have a legitimate macro fundamental basis to overweight Chinese stocks (Chart 1). Credit growth on a year-on-year basis stopped falling in October. The underlying data in credit creation, however, points to a weakening in demand for corporate loans (Chart 2). Loans to the housing sector are well below a year ago (Chart 3). Chart 2Weakening Loan Demand
Weakening Loan Demand
Weakening Loan Demand
Chart 3Bank Loans To The Housing Sector Have Not Turned Around
Bank Loans To The Housing Sector Have Not Turned Around
Bank Loans To The Housing Sector Have Not Turned Around
Chart 4It Will Take Time For Policy Easing To Restore Confidence In The Corporate Sector
It Will Take Time For Policy Easing To Restore Confidence In The Corporate Sector
It Will Take Time For Policy Easing To Restore Confidence In The Corporate Sector
Despite an acceleration in local government bond issuance in October and RMB300 billion in additional bank loans to support small and medium enterprises, growth in medium- to long-term corporate loans peaked (Chart 4). In previous cycles, a rollover in corporate demand for longer-term bank lending on average lasted more than nine months, suggesting that any policy adjustments will take a while to restore confidence in the corporate sector. Without a decisive pickup in credit growth, corporate earnings growth will be at risk of deteriorating. Moreover, policy tightening since earlier this year is still working its way through the economy and major economic indicators in China continue to decline (Chart 5). We think that China’s economy is set to decelerate even more in the next several months, suggesting that earnings uncertainty will likely rise. This, combined with reactive policymakers, already slowing earnings momentum, and a downward adjustment in 12-month forward earnings, suggests that investors have not yet reached the maximum bearishness for Chinese stock prices (Chart 6). Chart 5No Signs Of Improvement In The Economy
No Signs Of Improvement In The Economy
No Signs Of Improvement In The Economy
Chart 6The Earnings Adjustement Process Is Only Beginning
The Earnings Adjustement Process Is Only Beginning
The Earnings Adjustement Process Is Only Beginning
Q: What is the impact of China’s property market slowdown on the economy? Will recent policy easing stop deterioration in the real estate sector? A: Policy has been recalibrated by relaxing restrictions on mortgage lending and rules for land sales.1 However, the negative financing loop among developers, households and local governments may take longer to improve. Meanwhile, the market may underestimate the downside risks in housing-related activity in the next 6 to 12 months. Chart 7Households' Home Buying Intentions Have Plummeted
Households' Home Buying Intentions Have Plummeted
Households' Home Buying Intentions Have Plummeted
Our view is based on the following: Home sales will likely remain in contraction in the next two quarters. Aggressive crackdowns on property market speculation in the past 12 months have fundamentally shifted consumers’ expectations for future home prices. The impending pilot property tax reform2 (details yet to be disclosed) will only encourage the wait-and-see sentiment of potential buyers. Home sales contracted by 24% in October from a year ago. In previous cycles, contractions in home sales normally lasted for more than 12 months. Moreover, the proportion of households planning to buy a house dropped to only 7.7% in Q3 2021 from 11.6% in Q4 2020 (Chart 7). Real estate developers have slashed new projects and land purchases to preserve liquidity for debt servicing (Chart 8, first and second panels). Policymakers may succeed in prompting banks to resume lending to developers in order to alleviate the escalating risk of widespread defaults. However, so far the marginal easing has failed to reverse the downward trend in bank credit to developers along with home sales (Chart 8, third and bottom panels). Funding constraints for real estate developers will probably be sustained for another six months, despite the recent easing measures. Construction activity, housing starts, and real estate investment will likely remain in doldrum at least through 1H22 (Chart 9). Chart 8Housing Activities Are Still Falling
Housing Activities Are Still Falling
Housing Activities Are Still Falling
Chart 9Less Funding = Less Investment And Completions
Less Funding = Less Investment And Completions
Less Funding = Less Investment And Completions
The marked reduction in land sales will impede local governments’ revenues and weigh on infrastructure investment (Chart 10). Real estate and infrastructure financing contributed 50% of the increase in total Chart 10Local Government Revenues Largely Depend On The Housing Sector
Local Government Revenues Largely Depend On The Housing Sector
Local Government Revenues Largely Depend On The Housing Sector
social financing in 2020. Given that local governments face funding constraints from a slump in land sale incomes, policies on leverage from local government financing vehicles (LGFVs) will have to meaningfully loosen up to allow a rise in bank lending to support infrastructure investment. As discussed in previous reports, an acceleration in local government special-purpose bond issuance can only partially offset weak credit growth. Furthermore, shadow banking activity, which comprises LGFV borrowing and is highly correlated with China’s infrastructure investment growth, remains in contraction and indicates that growth in infrastructure investment is unlikely to rebound strongly (Chart 11). The sharp weakening of real estate construction activities will drag down the demand for building materials, machinery, home appliances and automobiles. Real estate accounts for about 60% of Chinese households’ wealth, thus any substantial drop in home prices will further weaken households’ propensity to consume (Chart 12). Chart 11More Easing Needed For A Meaningful Pickup In Infrastructure Investment
More Easing Needed For A Meaningful Pickup In Infrastructure Investment
More Easing Needed For A Meaningful Pickup In Infrastructure Investment
Chart 12Falling Demand For Commodities And Consumer Goods
Falling Demand For Commodities And Consumer Goods
Falling Demand For Commodities And Consumer Goods
Chart 13AOn The Surface Housing Inventories Are Lower Than Six Years Ago...
On The Surface Housing Inventories Are Lower Than Six Years Ago...
On The Surface Housing Inventories Are Lower Than Six Years Ago...
There are nontrivial risks that the real estate slowdown will evolve into a downturn similar to that of 2014-15. Although the existing housing inventory is more modest than the start of the 2014/15 property downturn, developers have accumulated more debt and unfinished projects in this cycle than in the past (Charts 13A & 13B). Policymakers will have to relax property sector policies much more forcefully to prevent the downturn from intensifying. In the interim, we will likely witness more deterioration in the sector. Chart 13B...But Developers Have Built Up Massive Leverages And Hidden Inventories In The Past Three Years
...But Developers Have Built Up Massive Leverages And Hidden Inventories In the Past Three Years
...But Developers Have Built Up Massive Leverages And Hidden Inventories In the Past Three Years
Q: If the property market accounts for such a big portion of local governments’ revenues, why hasn’t the waning housing market forced policymakers to loosen restrictions? A: We think regulators have been slow to backtrack property market reforms because this year China’s fiscal deficit has narrowed from last year due to lower government spending and improved income from corporate taxes. In previous property market downturns, such as 2011/12, 2015/16 and 2019, property policy restrictions were lightened following major declines in government revenues (Chart 14). However, in 2021 China’s fiscal balance sheet has been stronger than in previous cycles; central and local governments have collected much more taxes, particularly corporate taxes, than in 2020 (Chart 15). Meanwhile, government expenditures so far this year have been lower, resulting in a large improvement in the country’s fiscal deficit (Chart 16). Chart 14Falling Gov Revenues Forced Policymakers To Backtrack Reforms In The Past...
Falling Gov Revenues Forced Policymakers To Backtrack Reforms In The Past...
Falling Gov Revenues Forced Policymakers To Backtrack Reforms In The Past...
Chart 15...But This Year Gov Tax Revenues Have Been Strong
...But This Year Gov Tax Revenues Have Been Strong
...But This Year Gov Tax Revenues Have Been Strong
Chart 16Fiscal Deficit Improved This Year Despite Falling evenues From Land Sales
Fiscal Deficit Improved This Year Despite Falling evenues From Land Sales
Fiscal Deficit Improved This Year Despite Falling evenues From Land Sales
As discussed above, slightly loosened restrictions on land purchases by some regional governments will not restore developers’ confidence and boost the demand for land. The sharp increase in government's corporate tax collection will also start to ebb as economic growth slows and corporate profits decline. As such, even if government expenditures remain the same next year, the fiscal deficit will grow because revenues will be under substantial downward pressure. We expect that Chinese policymakers will have to take more actions to stabilize fiscal conditions. Forecasting exactly when this will occur is difficult, but a benign government balance sheet in much of this year is delaying policymakers’ response to the flagging housing market. Meantime, both policymakers and investors may be complacent about the state of the economy until the full scale of the property sector spillover risk becomes clear. Q: Rates are low and industrial profit growth has been strong this year. Why has capex been so sluggish? A: Investment growth in the manufacturing sector has been lackluster because their profit margins have been squeezed by rising input costs. On the other hand, investment in the mining industry has been constrained by policy restrictions. An acceleration in China’s de-carbonization efforts this year has likely constrained investment in the mining sector. Even though industrial profit growth has been concentrated among the upstream industries such as mining which profits grew by a stunning 100% this year, investment in the sector was mostly flat from a year ago (Chart 17). During the first half of the year, mid- to downstream firms were caught between rising input prices and a weak recovery in domestic consumption. Manufacturing investment grew faster than the mining sector, but manufacturing profit growth only increased by about 30% year to date (Chart 18). However, we think manufacturing investment growth may improve slightly into 2022 as the sector continues to gain pricing power. Chart 17Mining Sector's Profit Growth Way Outpaced Investment
Mining Sector's Profit Growth Way Outpaced Investment
Mining Sector's Profit Growth Way Outpaced Investment
Chart 18Manufacturing Sector Profit Growth Has Been Much More Muted Than Upstream Industries
Manufacturing Sector Profit Growth Has Been Much More Muted Than Upstream Industries
Manufacturing Sector Profit Growth Has Been Much More Muted Than Upstream Industries
Q: The RMB has been strong against the dollar, despite China’s maturing business cycle. What is your outlook for the RMB next year? A: The RMB exchange rate has been boosted by China’s record current account surplus, wide interest rate differentials and speculation that tension between the US and China will abate. However, all three favorable conditions supporting the RMB are in danger of reversing next year. Chart 19The RMB Has Been Appreciating Despite A Strong USD
The RMB Has Been Appreciating Despite A Strong USD
The RMB Has Been Appreciating Despite A Strong USD
Chart 20The RMB's Appreciation Deviates From Economic Fundamentals
The RMB's Appreciation Deviates From Economic Fundamentals
The RMB's Appreciation Deviates From Economic Fundamentals
Despite broad-based dollar strength, the CNY/USD has appreciated by 4.5% year to date (Chart 19). The RMB’s appreciation deviates from China’s economic fundamentals (Chart 20). Strong global demand for goods has boosted Chinese exports while travel restrictions curbed foreign exchange outflows by domestic households (Chart 21). China-US real interest rate differentials have been in favor of the CNY versus USD, bringing net foreign inflows to China’s onshore bond market (Chart 22). Additionally, the recent meeting between President Joe Biden and President Xi Jinping has prompted speculation that the US will lessen tariffs on Chinese imports. Chart 21Large Current Account Surplus
Large Current Account Surplus
Large Current Account Surplus
Chart 22Favorable Interest Rate Differentials And Strong Fund Inflows
Favorable Interest Rate Differentials And Strong Fund Inflows
Favorable Interest Rate Differentials And Strong Fund Inflows
Chart 23China's Extremely Robust Export Growth Unlikely To Sustain In 2022
China's Extremely Robust Export Growth Unlikely To Sustain In 2022
China's Extremely Robust Export Growth Unlikely To Sustain In 2022
Chart 24A Strong RMB Does Not Bode Well For Chinese Exporters' Profits
A Strong RMB Does Not Bode Well For Chinese Exporters' Profits
A Strong RMB Does Not Bode Well For Chinese Exporters' Profits
These factors will likely turn against the CNY next year. First, export growth will moderate as the composition of US consumption rotates from goods to services (Chart 23). Secondly, it would not be in the PBoC’s best interests to let the RMB strengthen too rapidly because an appreciating currency would be a deflationary force on China’s export and manufacturing sectors (Chart 24). While we expect policymakers to maintain their preference for a gradual approach to stimulus, we assign a high probability to a reserve requirement ratio (RRR) cut in early 2022. In this environment, Chinese bond yields will decline, which would narrow the China-US interest rate differential. Finally, while there may be some changes to US tariffs on China, it is doubtful that there would be a broad-based removal of tariffs. Chart 25The CNY/USD Will Likely Fall And Converge To Chinese Stocks' (Under)performance
The CNY/USD Will Likely Fall And Converge To Chinese Stocks' (Under)performance
The CNY/USD Will Likely Fall And Converge To Chinese Stocks' (Under)performance
The CNY’s outperformance stands out as it marks a break from its correlation with China’s relative equity performance vis-à-vis the US (Chart 25). The signal from the currency suggests that either global equity investors are overly pessimistic about economic and regulatory risks in China, or overly optimistic about the value of China’s currency. The latter option is more likely at the moment, and the CNY/USD exchange rate is at the risk of converging to the underperformance of Chinese investable stocks next year. Jing Sima China Strategist jings@bcaresearch.com Footnotes 1 China Cities Ease Land Bidding Rules as Property Stress Spreads - Bloomberg 2 China’s Pilot Property Tax Reforms Benefit Markets Despite Short-Term Pain, Analysts Say - Caixin Global Market/Sector Recommendations Cyclical Investment Stance
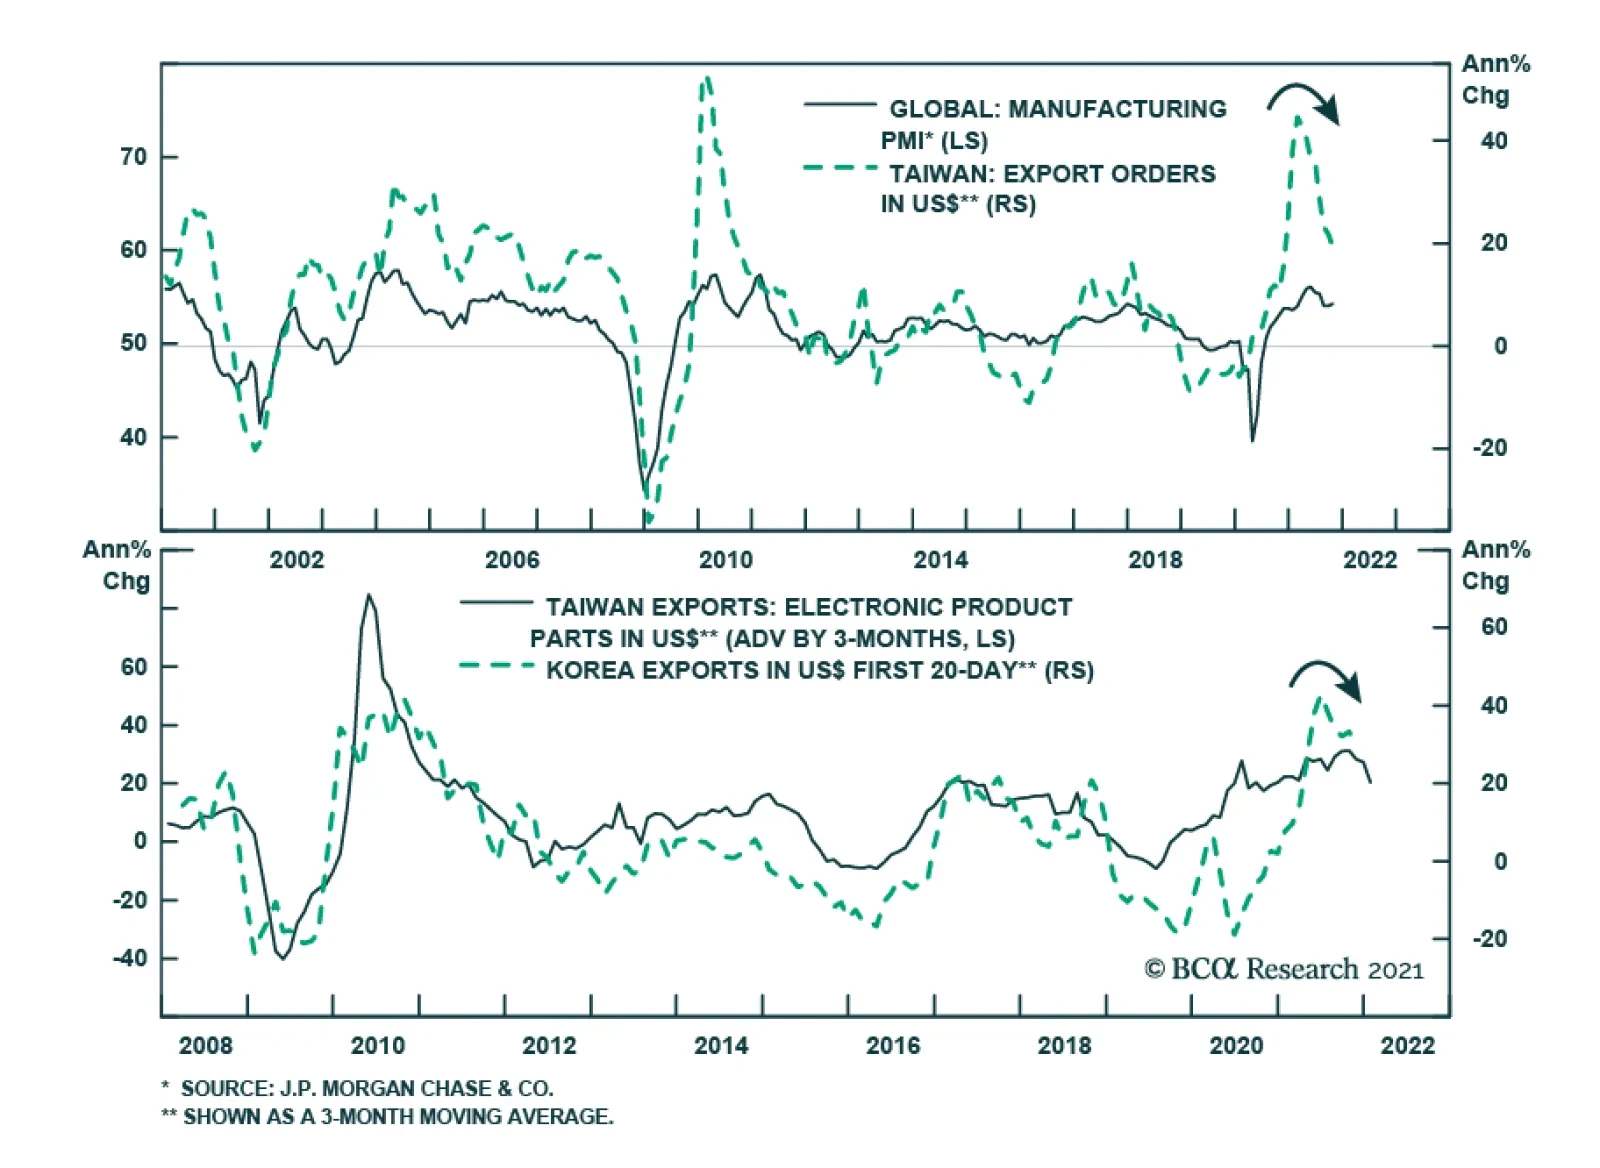
Taiwanese export orders decelerated sharply in October which suggests that global demand for manufactured goods is softening. Aggregate orders rose 14.6% y/y following a 25.7% y/y increase in September, and fell below expectations of 22.9% y/y. In particular,…
Highlights The euro has entered a period of acute stress. Some of the EUR/USD’s plunge reflects the dollar’s broad-based strength. The dollar is supported by the market’s pricing of the Fed and China’s economic weakness. The euro also suffers from idiosyncratic forces. Investors appreciate better now that the Eurozone’s inflation is much narrower than that of the US. They are adjusting their ECB pricing accordingly. Europe’s growth prospects are also hurt by a renewed wave of lockdowns and China’s property woes. The revival of the European natural gas surge is the coup de grâce that is hurting the Euro. Nonetheless, euro sentiment is extremely depressed, which suggests that the euro already discounts many of these negatives. Consequently, we are adhering to our long EUR/USD trade implemented four weeks ago, but we will not re-open it if the stop-loss is triggered. Feature Four weeks ago, we tentatively recommended buying the euro, acknowledging that this view was fraught with near-term risks. However, the recent collapse in the euro forces us to revisit this stance. 2022 will be a better year for EUR/USD; nevertheless, the next three months could result in pronounced weakness in the currency, and the odds have increased that this pair might retest the pandemic lows. We are sticking with our long EUR/USD bet for now, as we have a floor under the position, the result of our stop at 1.1175. If this stop is reached, we will wait before reinstating a long euro position. What’s Going Well With The USD? The first element of the euro’s weakness is the generalized strength in the USD. The dollar is rallying against all the components of the DXY, which is pushing the USD’s Advanced/Decline line up (Chart 1). Moreover, as BCA’s Emerging Market Strategy team recently highlighted, the dollar is breaking out above its three-year moving average, which constitutes an important technical signal. The dollar strength is multi-faceted and reflects both domestic and international factors. On the domestic front, markets are responding to growing inflationary forces and signs of economic vigor to price in a more aggressive Fed outlook than two months ago (Chart 2), especially following the implementation of the Fed’s tapering program this month. Chart 1The Dollar Is Strong
The Dollar Is Strong
The Dollar Is Strong
Chart 2More Hikes Prices In
More Hikes Prices In
More Hikes Prices In
The inflation picture is of prime concern to investors. As Chart 3highlights, US core CPI is at a 30-year high and median inflation measures are also strengthening. Most concerning, inflationary pressures are broadening beyond energy and goods, with shelter prices accelerating anew (Chart 3, bottom panel). The labor market is also gearing up to move toward full employment conditions. The quits rate is near a record high, which corroborates the impression among households that jobs are easy to secure (Chart 4). Moreover, wages among low-skill employees are strengthening, which indicates that the labor market is tight (Chart 4, bottom panel). Granted, this is happening in a context in which the labor force participation rate is low, especially for women, and could rise anew, which would alleviate the labor market’s tightness. However, this process will likely entail higher wages first. Chart 3Broadening US Inflation
Broadening US Inflation
Broadening US Inflation
Chart 4Getting To Maximum Employment?
Getting To Maximum Employment?
Getting To Maximum Employment?
Economic data is also firming up, despite rises in COVID cases in many states. For example, nominal retail sales were robust in October, even if inflation contributed to their strength. Moreover, both the New York Fed’s Empire State Manufacturing Survey and the Philly Fed’s Manufacturing Business Outlook Survey highlighted an acceleration in activity (Chart 5). As a result, the Atlanta Fed’s Q4 GDPNow Forecast has rebounded to 8.2%, which would represent a marked improvement from the 2.2% quarterly annualized rate recorded in Q3. Whether or not this is an error, market participants may continue to use this economic backdrop to price in additional hikes by the Fed and feed the dollar rally. The international backdrop also helps the USD. The main positive comes from China. BCA’s emerging market strategists highlight that the weakness in the Chinese credit impulse is often a harbinger of dollar strength (Chart 6). The US economy is less exposed to manufacturing and trade than the economies of Europe, Australia, and EM, which means that it is less impacted by Chinese growth slowdowns than other parts of the world. This explains why the dollar loves a slowing Chinese economy. Chart 5A Pick Up In US Growth
A Pick Up In US Growth
A Pick Up In US Growth
Chart 6The Dollar Loves A Weaker China
The Dollar Loves A Weaker China
The Dollar Loves A Weaker China
China’s economic problems have once again become more relevant to market participants, as recent prints have been weak. Following the fall of Chinese GDP growth to 4.9% in the third quarter, new releases have shown that house prices are contracting and property investment is decelerating. These data sets are feeding the dollar rally. The dollar’s strength will beget further dollar appreciation. We have often highlighted that the dollar is the premier momentum currency within the G-10, along with the yen (Chart 7). Today, the most reliable momentum indicator for the greenback, the crossover of the 20-day MA above the 200-day one, continues to send a very supportive signal, which the economic backdrop reinforces (Chart 8). Moreover, historically, the dollar’s trading in the first few weeks of January often echoes the trend of the previous year. Hence, we may witness a continued blow off until February 2022.
Chart 7
Chart 8Positive Momentum Signal For The Dollar
Positive Momentum Signal For The Dollar
Positive Momentum Signal For The Dollar
Bottom Line: The dollar is breaking out on a broad basis. Not only is the US economy inviting investors to reprice the Fed’s expected policy path, but the economic weakness in China is also contributing to the rally. Technically, the dollar’s pro-momentum attribute accentuates the risk that this breakout morphs into a melt-up until February 2022, especially if US equities continue to outperform the rest of world and attract flows into the USD. The Euro’s Specific Problems Chart 9Europe Doesn't Have The US Inflation Problem
Europe Doesn't Have The US Inflation Problem
Europe Doesn't Have The US Inflation Problem
The spectacular collapse in EUR/USD goes beyond the strength in the dollar, because crucial catalysts are also pushing the euro lower. First, investors are increasingly differentiating between the Eurozone and the US inflation picture. We have often made the case that European inflation is much more limited than that of the US. For example, the dynamics in the trimmed-mean inflation and the CPI adjusted for VAT highlights that lack of broad inflation in Europe (Chart 9). Moreover, recent ECB’s communications have made it eminently clear that it is in no rush to raise rates. As a result, investors have been curtailing the number of ECB hikes priced in for 2022 compared to early November. Second, European economic activity is unable to catch a break. The recent uptick of COVID-19 cases in Germany, the Netherlands, and Austria is prompting local governments to impose renewed lockdowns of various scales, as worries emerge that hospital capacity will suffer as it did last winter (Chart 10). We doubt these lockdowns will last as long or will be as severe from a pan-European perspective, but, for now, they are weighing on investor sentiment and contributing to the euro-bearish widening in US-German 2-year yield differentials (Chart 11). Chart 10A New Wave
A New Wave
A New Wave
Chart 11Rate Differentials Hurt The Euro
Rate Differentials Hurt The Euro
Rate Differentials Hurt The Euro
Third, the Chinese economy continues to act as a drag on Europe. China’s real estate activity is slowing, as credit spreads and share prices of property developers remain distressed (Chart 12). It is of concern that the Chinese and EM credit market stresses are broadening beyond this sector, which indicates a tightening in financial conditions for a large swath of the Eurozone’s important trading partners. Moreover, Europe’s machinery exports are particularly exposed to the Chinese construction sector. Under these circumstances, the wave of weakness in Chinese construction activity could herald additional problems for EUR/USD, since they amount to a weakening in Euro Area growth relative to the US (Chart 13). Chart 12Downside To Chinese Construction Activity
Downside To Chinese Construction Activity
Downside To Chinese Construction Activity
Chart 13Slowing Chinese Construction Is A Threat to EUR/USD
Slowing Chinese Construction Is A Threat to EUR/USD
Slowing Chinese Construction Is A Threat to EUR/USD
Fourth, equity outflows out of the Eurozone into the US are likely to continue as long as China suffers. BCA’s Emerging Market strategists anticipate the deterioration in China’s stock-to-bond ratio (SBR) to last, because this economy is weakening. Over the past five years, a deteriorating Chinese SBR has coexisted with a deepening underperformance of European equities relative to those of the US (Chart 14). Over this timeframe, equity flows have played a significant role in the EUR/USD exchange rate determination; thus, the weaker Chinese SBR also correlates well with a softer euro (Chart 14, bottom panel). Finally, the renewed energy crisis is particularly painful for the euro. German regulators indicated that they will temporarily suspend the approval of the Nord Stream 2 pipeline, which prompted European natural gas prices to surge anew. As Chart 15 shows, this proved to be the coup de grâce for the euro. The response of the euro to higher natural gas prices is rational. Surging natural gas prices are a growth shock for the region, yet they are unlikely to prompt a tightening in policy by the ECB, because they only push headline inflation, not the core measure. In fact, they could widen the dichotomy between underlying and headline inflation, because rising energy costs sap other spending categories. In other words, rising energy prices point to a stagflationary outcome this winter in Europe, which is poison for the euro. Chart 14More European Equity Outflows?
More European Equity Outflows?
More European Equity Outflows?
Chart 15The Nat-Gas Coup De Grace
The Nat-Gas Coup De Grace
The Nat-Gas Coup De Grace
Bottom Line: The weakness of the euro reflects more than the strength in the USD. The narrower nature of European inflation prevents a hawkish repricing of the ECB to take place, while renewed lockdowns are hurting growth sentiment. Moreover, the travails of China’s property sector are harming European economic activity, while also inviting equity outflows. Finally, the recent revival of the natural gas price surge is once again raising the specter of stagflation this winter in Europe, which is a dreadful scenario for the euro. What To Do? Our long EUR/USD bet initiated four weeks ago has a stop loss at 1.1175. Due to the bullish dollar forces and bearish euro factors described in this report, we will not re-open the trade if the stop-loss is triggered. Its activation would indicate that the bear-trend in the euro is gathering steam. When coupled with the momentum nature of the dollar and the euro’s anti-dollar behavior imparted by EUR/USD’s great market liquidity, this combination could easily push EUR/USD to 1.08 or lower by January 2022. We are not closing the trade either. While the list of euro-negative forces is long, sentiment toward EUR/USD is now quite lopsided, which suggests that a significant proportion of the euro bearish factors are already discounted. One-month, three-month, and six-month risk reversals in EUR/USD have fallen close to their Q2 2020 levels. Moreover, investors now hold large short positions in EUR/USD, especially compared to their large long bets on the DXY (Chart 16); meanwhile, the Euro Capitulation Index is now depressed relative to that of the dollar (Chart 16, bottom panel). Finally, the most important signal comes from our Intermediate-Term Timing Model (ITTM), which is an augmented interest-rate parity model that accounts for global risk aversion and the currency’s trend. The ITTM is now trading at 1 sigma, a level that has historically been followed by a positive return six months later 75% of the time since 2002 (Chart 17). Chart 16Negative Euro Sentiment
Negative Euro Sentiment
Negative Euro Sentiment
Chart 17Much Pessimism Is In The Price
Much Pessimism Is In The Price
Much Pessimism Is In The Price
Chart 18Peak US Inflation?
Peak US Inflation?
Peak US Inflation?
Finally, the US is likely experiencing peak inflationary pressures right now. If inflation rolls over in the near future, investors will breathe a collective sigh of relief, and they will not price in more rate hikes. The decline in DRAM prices and the recent ebb in shipping costs, with the Baltic Dry down 57% from its peak and the WCI Composite Container Freight Benchmark 12% below its September apex, suggest that the most severe supply bottlenecks are passing while energy indexes are also softening (Chart 18). In this context, the best strategy remains to keep the trade open and to follow the discipline imposed by the stop loss. Mathieu Savary, Chief European Strategist Mathieu@bcaresearch.com Tactical Recommendations
What’s Going Wrong With The Euro?
What’s Going Wrong With The Euro?
Cyclical Recommendations
What’s Going Wrong With The Euro?
What’s Going Wrong With The Euro?
Structural Recommendations
What’s Going Wrong With The Euro?
What’s Going Wrong With The Euro?
Closed Trades
Image
Currency Performance Fixed Income Performance Equity Performance
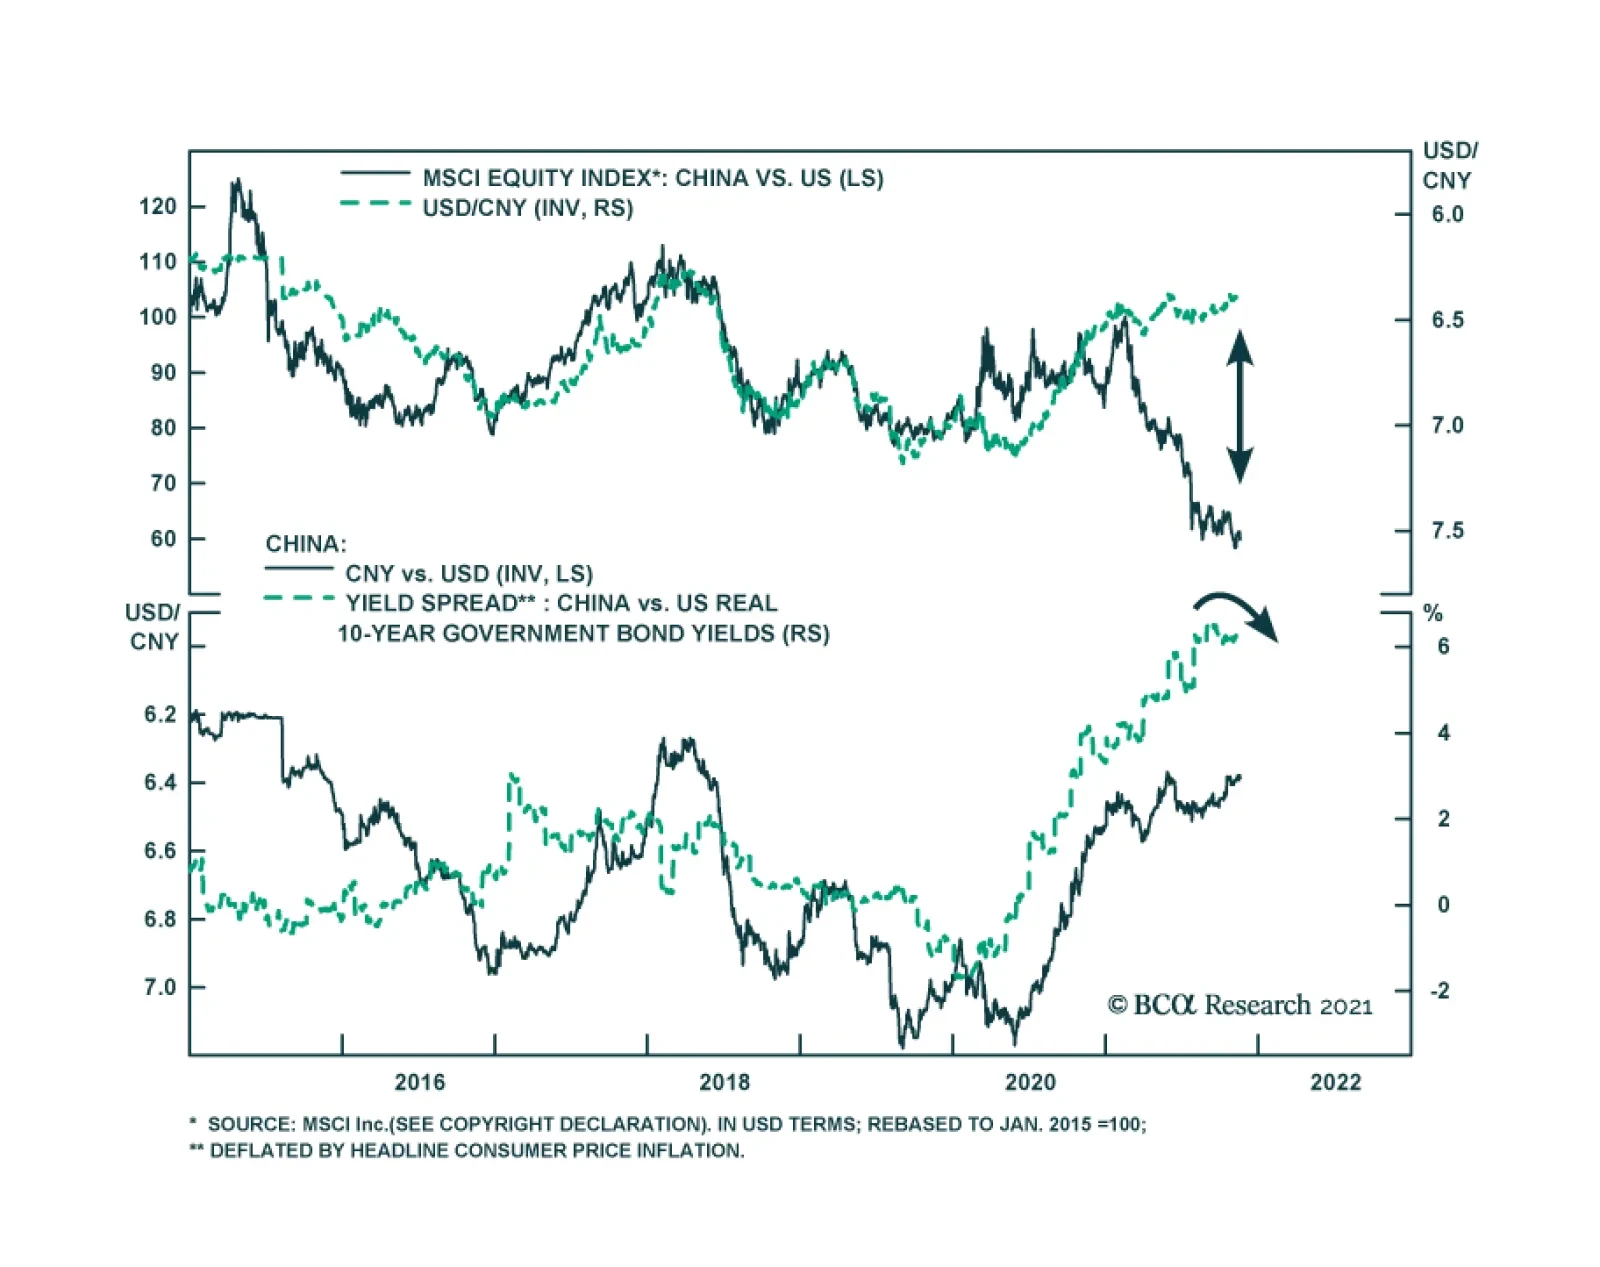
Despite broad-based dollar strength, USD/CNY has been depreciating recently. The CNY’s outperformance stands out as it marks a break from its correlation with China’s relative equity performance vis-à-vis the US. The signal from the currency is that global…