China
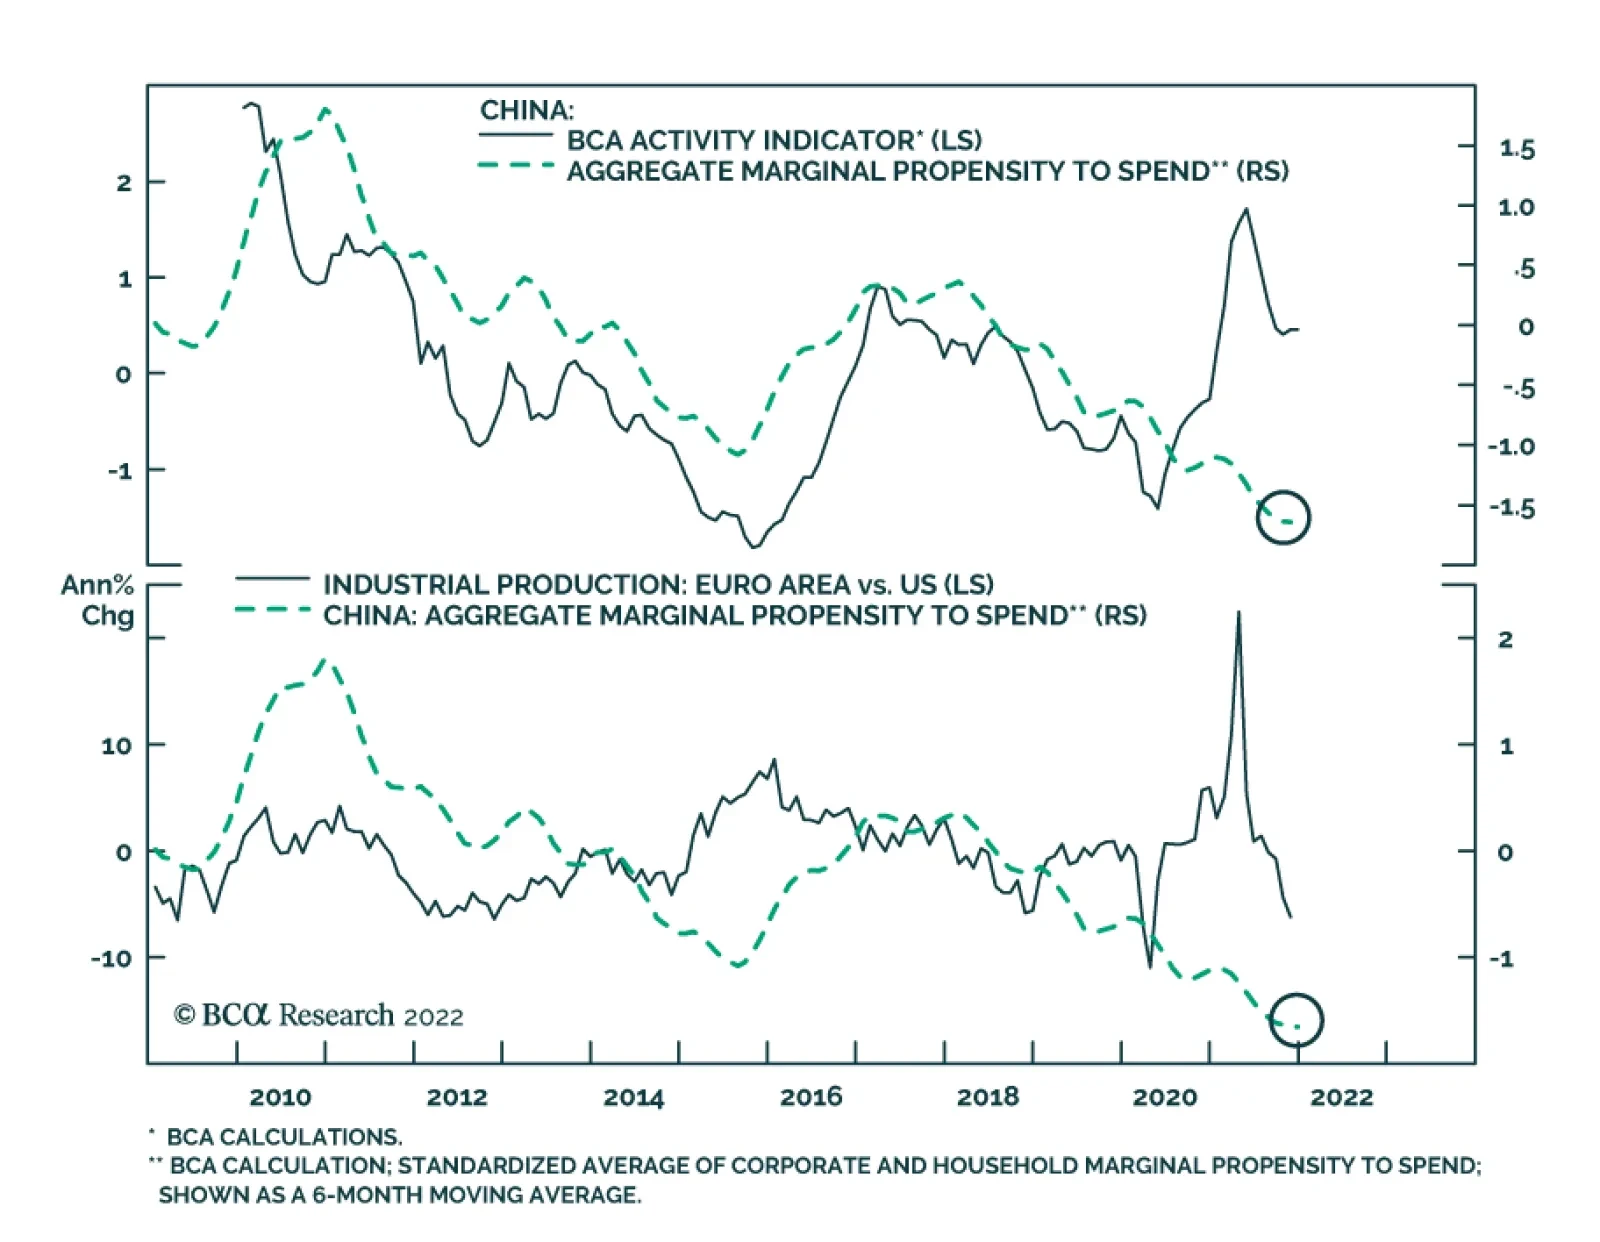
Among the reasons why our China Investment strategists do not anticipate a rapid recovery in Chinese demand is that private sector sentiment is depressed. BCA Research’s marginal propensity to spend indicators for both households and firms – calculated as the…
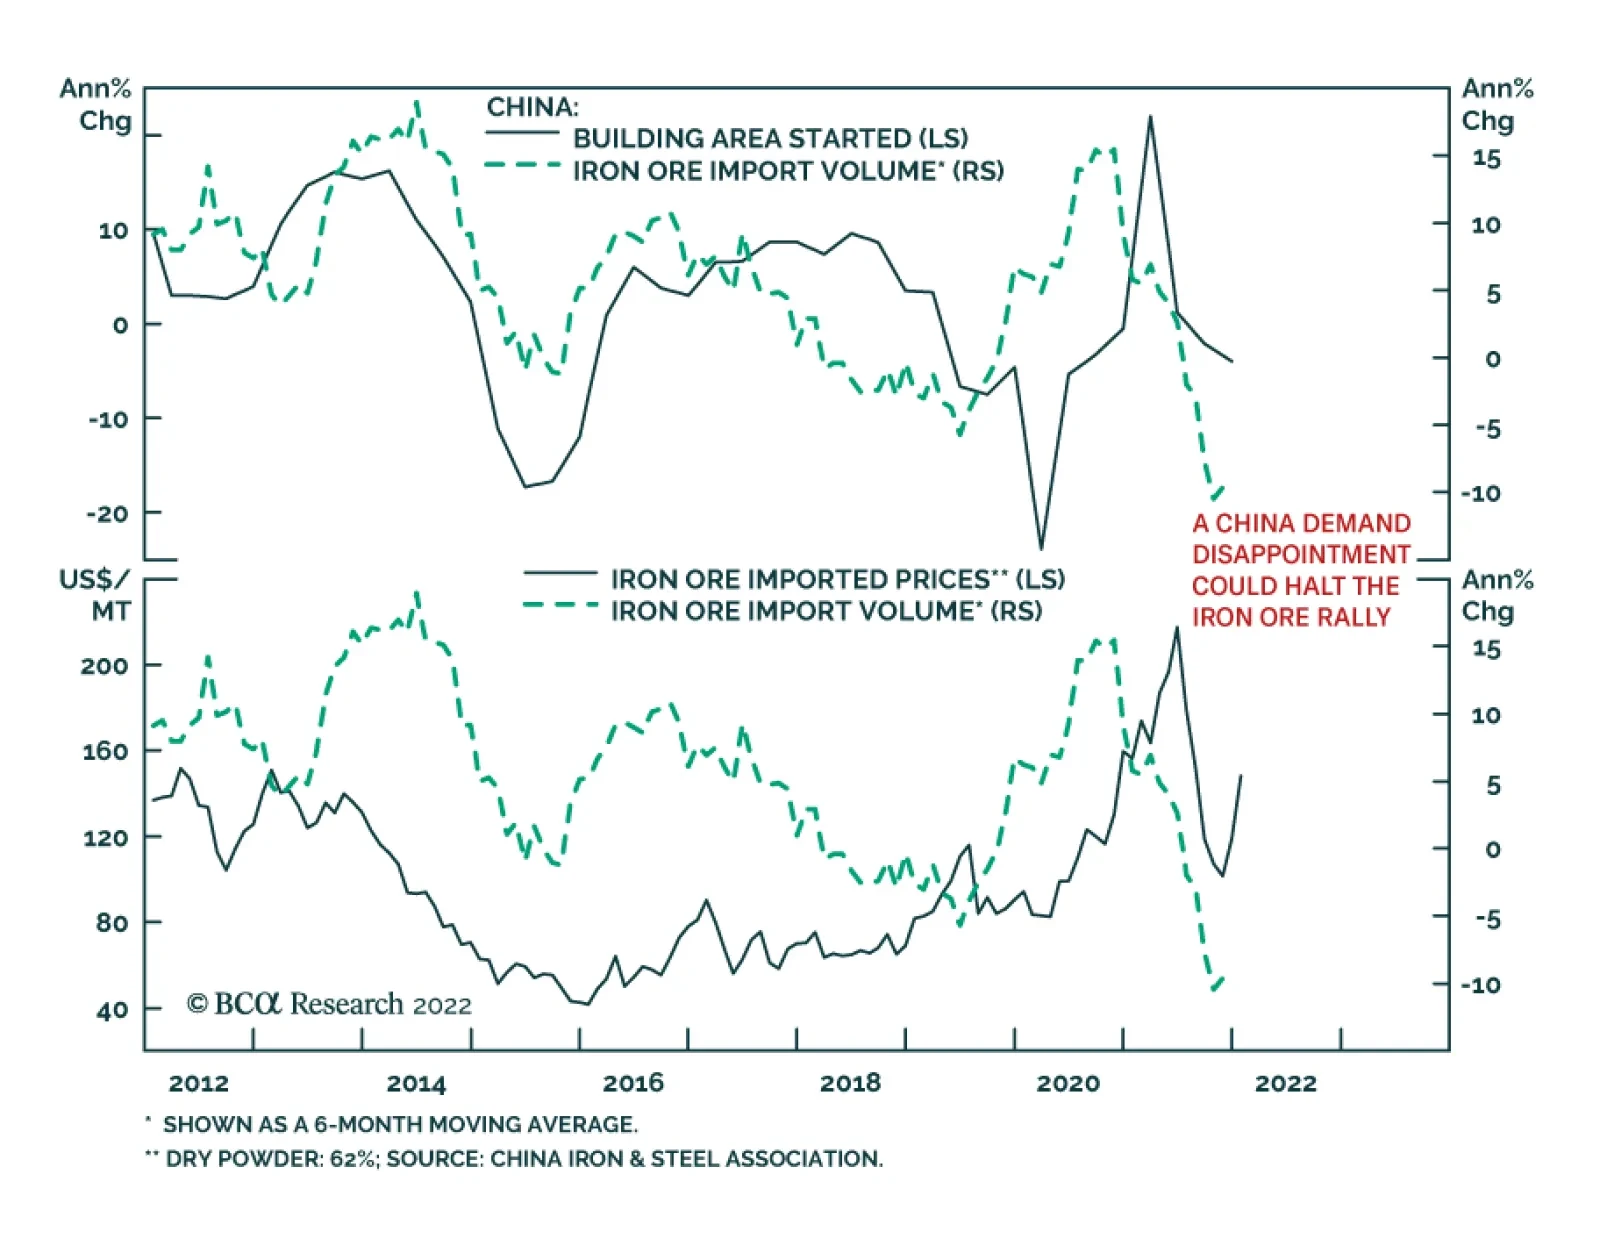
The price of iron ore is up a stunning 73% since mid-November. Both demand- and supply-side factors are likely responsible for this increase. On the demand-side, China has intensified its monetary policy support for the domestic economy. Over the past…

BCA Research is proud to announce a new feature to help clients get the most out of our research: an Executive Summary cover page on each of the BCA Research Reports. We created these summaries to help you quickly capture the main points of each report through an at-a-glance read of key insights, chart of the day, investment recommendations and a bottom line. For a deeper analysis, you may refer to the full BCA Research Report. Executive Summary China’s Property Bust To Dwarf Japan’s
China Geopolitical Outlook 2022
China Geopolitical Outlook 2022
China’s confluence of internal and external risks will continue to weigh on markets in 2022. Internally China’s property sector turmoil is one important indication of a challenging economic transition. The Xi administration will clinch another term but sociopolitical risks are underrated. Externally China faces economic and strategic pressure from the US and its allies. The US is distracted with other issues in 2022 but US-China confrontation will revive beyond that. China will strengthen relations with Russia and Iran, though it will not encourage belligerence. It needs their help to execute its Eurasian strategy to bypass US naval dominance and improve its supply security over the long run. China will ease monetary and fiscal policies in 2022 but it has no interest in a massive stimulus. Policy easing will be frontloaded in the first half of the year. Featured Trade: Strategically stay short the renminbi versus an equal-weighted basket of the dollar and the euro. Stay short TWD-USD as well. Recommendation INCEPTION Date Return SHORT TWD / USD 2020-06-11 0.5% SHORT CNY / EQUAL-WEIGHTED BASKET OF EURO AND USD 2021-06-21 -3.9% Bottom Line: Beijing is easing policy to secure the post-pandemic recovery, which is positive for global growth and cyclical financial assets. But structural headwinds will still weigh on Chinese assets in 2022. China’s Historic Confluence Of Risks Global investors continue to clash over China’s outlook. Ray Dalio, founder of Bridgewater Associates, recently praised China’s “Common Prosperity” plan and argued that the US and “a lot of other countries” need to launch similar campaigns of wealth redistribution. He warned about the US’s 2024 elections and dismissed accusations of human rights abuses by saying that China’s government is a “strict parent.”1 By contrast George Soros, founder of the Open Society Foundations, recently warned against investing in China’s autocratic government and troubled property market. He predicted that General Secretary Xi Jinping would fail to secure another ten years in power in the Communist Party’s upcoming political reshuffle.2 Geopolitics can bring perspective to the debate: China is experiencing a historic confluence of internal (political) and external (geopolitical) risk, unlike anything since its reform era began in 1979. At home it is struggling with the Covid-19 pandemic and a difficult economic transition that began with the Great Recession of 2008-09. Abroad it faces rising supply insecurity and an increase in strategic pressure from the United States and its allies. The implication is that the 2020s will be an even rockier decade than the 2010s. In the face of these risks the Chinese Communist Party is using the power of the state to increase support for the economy and then repress any other sources of instability. Strict “zero Covid” policies will be maintained for political reasons as much as public health reasons. Arbitrary punitive measures will put pressure on the business elite and foreigners. The geopolitical outlook is negative over the long run but it will not worsen dramatically in 2022 given America’s preoccupation with Russia, Iran, and midterm elections. Bottom Line: Global investor sentiment toward China will remain pessimistic for most of the year – but it will turn more optimistic toward foreign markets, especially emerging markets, that sell into China. China’s Internal Risks Chart 1China's Demographic Cliff
China's Demographic Cliff
China's Demographic Cliff
By the end of 2021, China accounted for 17.7% of global economic output and 12.1% of global imports. However, the secular slowdown in economic growth threatens to generate opposition to the single-party regime, forcing the Communist Party to seek a new base of political legitimacy. Most countries saw a drop in fertility rates in the third quarter of the twentieth century but China’s “one child policy” created a demographic cliff (Chart 1). At first this generated savings needed for national development. But now it leaves China with excess capacity and insufficient household demand. Across the region, falling fertility rates have led to falling potential growth and falling rates of inflation. Excess savings increased production relative to consumption and drove down the rate of interest. The shift toward debt monetization in the US and Japan, in the post-pandemic context, is now threatening this trend with a spike in inflation. China is also monetizing debt after a decade of deflationary fears. But it remains to be seen whether inflation is sustainable when fertility remains below the replacement rate over the long run, as is projected for China as well as its neighbors (Chart 2). China’s domestic situation is fundamentally deflationary as a result of chronic over-investment over the past 40 years. China’s gross fixed capital formation stands at 43% of GDP, well above the historic trend of other major countries for the past 30 years (Chart 3). Chart 2Will Inflation Decouple From Falling Fertility?
Will Inflation Decouple From Falling Fertility?
Will Inflation Decouple From Falling Fertility?
Chart 3Over-Investment Is Deflationary, Not Inflationary
China Geopolitical Outlook 2022
China Geopolitical Outlook 2022
Like other countries, China financed this buildup of fixed capital by means of debt, especially state-owned corporate debt. While building a vast infrastructure network and property sector, it also built a vast speculative bubble as investors lacked investment options outside of real estate. The growth in property prices has tracked the growth in private non-financial sector debt. The downside is that if property prices fall, debt holders will begin a long and painful process of deleveraging, just like Japan in the 1990s and 2000s. Japan only managed to reverse the drop in corporate investment in the 2010s via debt monetization (Chart 4). Chart 4Japan’s Property Bust Coincided With Debt Deleveraging
China Geopolitical Outlook 2022
China Geopolitical Outlook 2022
Chart 5China's Debt Growth Halts
China's Debt Growth Halts
China's Debt Growth Halts
Looking at the different measures of Chinese debt, it is likely that deleveraging has begun. Total debt, public and private, peaked and rolled over in 2020 at 290% of GDP. Corporate debt has peaked twice, in 2015 and again in 2020 at around 160% of GDP. Even households are taking on less debt, having gone on a binge over the past decade (Chart 5). In short China is following the Japanese and East Asian growth model: the stark drop in fertility and rise in savings created a huge manufacturing workshop and a highly valued property sector, albeit at the cost of enormous private and considerable public debt. If the private sector’s psychology continues to shift in favor of deleveraging, then the government will be forced to take on greater expenses and fund them through public borrowing to sustain aggregate demand, maximum employment, and social stability. The central bank will be forced to keep rates low to prevent interest rates from rising and stunting growth. China’s policymakers are stuck between a rock and a hard place. New regulations aimed at controlling the property bubble (the “three red lines”) precipitated distress across the sector, emblematized by the failure of the world’s most indebted property developer, Evergrande. Other property developers are looking to raise cash and stay solvent. Property prices peaked in 2015-16 and are now dropping, with third-tier cities on the verge of deflation (Chart 6). Chart 6China's Property Crisis Weighs On Construction
China's Property Crisis Weighs On Construction
China's Property Crisis Weighs On Construction
As the property bubble tops out, Chinese policymakers are looking for new sources of productivity and growth. Chart 7Productivity In Decline
China Geopolitical Outlook 2022
China Geopolitical Outlook 2022
Productivity growth is subsiding after the export and property boom earlier in the decade, in keeping with that of other Asian economies. And sporadic initiatives to improve governance, market pricing, science, and technology have not succeeded in lifting total factor productivity (Chart 7). The initial goal of the Xi administration’s reforms, to rebalance the economy away from manufacturing toward services, has stumbled and will continue to face headwinds from the financial and real estate sectors that powered much of the recent growth in services (Chart 8). Chart 8China’s Structural Transition Falters
China Geopolitical Outlook 2022
China Geopolitical Outlook 2022
Indeed the Communist Party is rediscovering the value of export-manufacturing in the wake of the pandemic, which led to a surge in durable goods orders as global consumers cut back on services and businesses initiated a new cycle of capital expenditures (Chart 9). The party encouraged the workforce to shift out of manufacturing over the past decade but is now rethinking that strategy in the face of the politically disruptive consequences of deindustrialization in the US and UK – such that the state can be expected to recommit to supporting manufacturing going forward (Chart 10). Policymakers are emphasizing economic self-sufficiency and “dual circulation” (import substitution) as solutions to the latent socioeconomic and political threat posed by disillusioned former manufacturing workers. Chart 9China Turns Back To Exports
China Turns Back To Exports
China Turns Back To Exports
Chart 10De-Industrialization Will Be Halted
De-Industrialization Will Be Halted
De-Industrialization Will Be Halted
Even beyond ex-manufacturing workers, the country’s economic transition risks generating social instability. The middle class, defined as those who consume from $10 to $50 per day in purchasing power parity terms, now stands at 55% of total population, comparable to where it stood when populist and anti-populist political transformations occurred in Turkey, Thailand, and Brazil (Chart 11). China’s middle class may not be willing or able to intervene into the political process, but the government is still concerned about the long-term potential for discontent. Otherwise it would not have launched anti-corruption, anti-pollution, and anti-industrial measures in recent years. These measures vary in effectiveness but they all share the intention to boost the government’s legitimacy through social improvements and thus fall in line with the new mantra of “common prosperity.” For decades the ruling party claimed that the “principle contradiction” in society arose from a failure to meet the people’s “material needs,” but beginning in 2021 it emphasized that the principle contradiction is the people’s need for a “better life.” Real wages continue to grow but the pace of growth has downshifted from previous decades. The bigger problem is the stark rise in inequality, here proxied by skyrocketing housing prices. Hong Kong’s inequality erupted into social unrest in recent years even though it has a much higher level of GDP per capita than mainland China (Chart 12). In major cities on the mainland, housing prices have outpaced disposable income over the past two decades. Youth unemployment also concerns the authorities. Chart 11Social Instability A Genuine Risk
China Geopolitical Outlook 2022
China Geopolitical Outlook 2022
Bottom Line: The Chinese regime faces historic social and political challenges as a result of a difficult structural economic transition. The ongoing emphasis on “common prosperity” reveals the regime’s fear of social instability. The underlying tendency is deflationary, though Beijing’s use of debt monetization introduces a long-term inflationary risk that should be monitored. Chart 12Causes Of Hong Kong Unrest Also Present In China
Causes Of Hong Kong Unrest Also Present In China
Causes Of Hong Kong Unrest Also Present In China
China’s External Risks Geopolitically speaking, China’s greatest challenge throughout history has been maintaining domestic stability. Because China is hemmed in by islands that superior foreign powers have often used as naval bases, it is isolated as if it is a landlocked state. A stark north-south division within its internal geography and society creates inherent political tension, while buffer regions are difficult to control. Hence foreign powers can meddle with internal affairs, undermine unity and territorial integrity, and exploit China’s large labor force and market. However, in the twenty-first century China has the potential to project power outward – as long as it can maintain internal stability. Power projection is increasingly necessary because China’s economy increasingly depends on imports of energy, leaving it vulnerable to western maritime powers (Chart 13). Beijing’s conversion of economic into military might has also created frictions with neighbors and aroused the antagonism of the United States, which increasingly seeks to maintain the strategic anchor in the western Pacific that it won in World War II. Chart 13Import Dependency A Strategic Security Threat
Import Dependency A Strategic Security Threat
Import Dependency A Strategic Security Threat
As China’s influence expands into East Asia and the rest of Asia, conflicts with the US and its allies are increasingly likely, especially over critical sea lines of communication, including the Taiwan Strait. China’s reinforcement of its manufacturing prowess will also provoke the United States, while the US’s erratic attempts to retain its strategic position in Asia Pacific will threaten to contain China. Yet the US cannot concentrate exclusively on countering China – it is distracted by internal politics and confrontations with Russia and Iran, especially in 2022. China will strengthen relations with Russia and Iran. As an energy importer, China would prefer that neither Russia nor Iran take belligerent actions that cause a global energy shock. But both Moscow and Tehran are essential to China’s Eurasian strategy of bypassing American naval dominance to reduce its supply insecurity. And yet, in 2022 specifically, the US and China are both concerned about maintaining positive domestic political dynamics due to the midterm elections and twentieth national party congress. This includes a desire to reduce inflation. Hence both would prefer diplomacy over trade war, with regard to each other, and over real war, with regard to Ukraine and Iran. So there is a temporary overlap in interests that will discourage immediate confrontation. China might offer limited cooperation on Iranian or North Korean nuclear and missile talks. But the same domestic political dynamics prevent a significant improvement in US-China relations, as neither side will grant trade concessions in 2022, and the underlying strategic tensions will revive over the medium and long run. Bottom Line: China faces historic external risks stemming from import dependency and conflict with the United States. In the short run, the US conflicts with Russia and Iran might lead to energy shocks that harm China’s economy. Japan never recovered its rapid growth rates after the 1973 Arab oil embargo. In the long run, while Washington has little interest in fighting a war with China, its strategic competition will focus on galvanizing allies to penalize China’s economy and to substitute away from China, in favor of India and ASEAN. China’s Macro Policy In 2022: Going “All In” For Stability In last year’s China Geopolitical Outlook, we maintained our underweight position on Chinese equities and warned that Beijing’s policy tightening posed a significant risk to global cyclical assets – and yet we concluded that policymakers would avoid overtightening policy to the extent of spoiling the global recovery. This view prevailed over the course of 2021. Policymakers tightened monetary and fiscal policy in the first half of the year, then started loosening up in the summer. Chinese equities crashed but global equities powered through the year. In December 2020, at the Central Economic Work Conference, policymakers stated that China would “maintain necessary policy support for economic recovery and avoid sharp turns in policy” in 2021. In the event they did the minimal necessary, though they did avoid sharp turns. For 2022, the key word is “stability.” At the Central Economic Work Conference last month, the final communique mentioned “stability” or “stabilize” 25 times (Table 1). Hence the main objective of Chinese policymakers this year is to prioritize both economic and social stability ahead of the twentieth national party congress. Authorities will avoid last year’s tight policies. Table 1Key Chinese Policy Guidance 2021-22
China Geopolitical Outlook 2022
China Geopolitical Outlook 2022
China’s quarterly GDP growth slipped to just 4% in Q4 2021, from rapid recovery growth of 18.3% in Q1 2021. Considering the low base effect of 2020, the average growth of 2020 and 2021 ranged from 5-5.5% (Chart 14). This growth rate is in line with the pre-pandemic trajectory of 2015-2019. In Jan 2022, the IMF cut China’s 2022 growth forecast to 4.8%, while the World Bank lowered its forecasts to 5.1%. Considering the two-year average growth and government’s goal of “all in for stability,” we see an implicit GDP target of 5-5.5%. Chart 14Breakdown Of China’s GDP Growth
China Geopolitical Outlook 2022
China Geopolitical Outlook 2022
Does this target matter? Although China stopped announcing explicit GDP growth targets, understanding the implicit target helps investors predict the turning point in macro policy. Due to robust global demand, net exports are now making a sizable contribution to GDP growth. However, due to the high base effect of 2021, there is limited room for exports to grow in 2022. Hence economic growth has to rely on final consumption expenditure and gross capital formation. Yet as a result of policy tightening, gross capital formation’s contribution to GDP has decreased significantly, from positive in H1 2021 to a rare negative contribution to GDP in the second half. At the same time, the contribution from final consumption expenditure also slipped over the course of 2021, due to worsening Covid conditions, one of the three pressures stated by the government. What does that mean? It means that loosening up macro policies is the pre-condition for stabilizing growth and the economy. Just like the officials said (see Table 1), the Chinese economy is “facing triple pressure from demand contraction, supply shocks, and weakening expectations,” so that “all sides need to take the initiative and launch policies conducive to economic stability.” Bottom Line: It is reasonable to expect accommodative fiscal and monetary policies in 2022, at least until the party congress ends. In fact, authorities have already started to make these adjustments since Q4 2021. China Avoids Monetary Overtightening Credit growth can be seen as an indicator for gross capital formation. In the second half of 2021, China’s total social financing (total private credit) growth plunged below 12% (Chart 15), the threshold we identified for determining whether authorities overtightened policy. Correspondingly, gross capital formation’s contribution to GDP dropped into the negative zone (see Chart 14 above). However, money growth did not dip below the threshold, and authorities are now trying to boost credit growth. Starting from December 2021, the market has seen marginally positive news out of the People’s Bank of China: December 15, 2021: The PBOC conducted its second reserve requirement ratio (RRR) cut in 2021. The 50 bps cut was expected to release $188 billion in liquidity to support the real economy. December 20, 2021: The PBOC conducted its first interest rate cut since April 2020 by cutting 1-Year LPR by 5 bps on December 20 (Chart 16). Chart 15China's Money And Credit Growth Hits Pain Threshold
China's Money And Credit Growth Hits Pain Threshold
China's Money And Credit Growth Hits Pain Threshold
Chart 16China Monetary Policy Easing
China Monetary Policy Easing
China Monetary Policy Easing
January 17, 2022: The PBOC cut the interest rate on medium-term lending facility (MLF) loans and 7-day reverse repurchase (repos) rate both by 10 bps. January 20, 2022: The PBOC further lowered the 1-year LPR by 10 basis points and cut the 5-year LPR by 5 basis points, the first cut since April 2020. Chart 17China Policy Easing Will Boost Import Volumes
China Policy Easing Will Boost Import Volumes
China Policy Easing Will Boost Import Volumes
The timing and size of the last two rate cuts came as a surprise to the market, signaling more comprehensive easing than was expected (confirming our expectations).3 The market saw a clear turning point: Chinese authorities are now fully aware of the need to loosen up monetary policy to counter intensifying downward pressure on the economy. Incidentally, the fine-tuning of the different lending facilities suggests the government aims to lower borrowing costs and stimulate the market without over-heating the property sector again. PBOC officials claim there is still some space for further cuts, though narrower now, when asked about if there is any room to further cut the RRR and interest rates in Q1. They added that the PBOC should “stay ahead of the market curve” and “not procrastinate.”4 Recent movements have validated this point. Going forward, M2 growth should stay above 8%. Total social financing growth should move up above our “too tight” threshold, although weak sentiment among private borrowers could force authorities to ease further to ensure that credit growth picks up. If the government is still committed to fighting housing speculation, as before, then we could see a smaller adjustment to the 5-Year LPR in the future. Otherwise the government is taking its foot off the brake for stability reasons, at least temporarily. Bottom Line: China will keep easing monetary policy in 2022, at least in the first half. This will result in an improvement in Chinese import volumes and ultimately emerging market corporate earnings, albeit with a six-to-12-month lag (Chart 17). China Avoids Fiscal Overtightening China will also avoid over-tightening fiscal policy in 2022. In December the government stressed the need to “maintain the intensity of fiscal spending, accelerate the pace, and moderately advance infrastructure investment.” In 2021, local government bond issuance did not pick up until the second half of the year. Considering the time lag of construction projects, it was too late for local government investment to stimulate the economy. By Q3 2021, local government bond issuance had just completed roughly 70% of the annual quota. By comparison, in 2018-2020, local governments all completed more than 95% of the annual quota by the end of September each year (Chart 18A). Chart 18AChina: No Pause In Local Bond Issuance In H1 2022
China Geopolitical Outlook 2022
China Geopolitical Outlook 2022
Chart 18BChina: No Pause In Local Bond Issuance In H1 2022
China Geopolitical Outlook 2022
China Geopolitical Outlook 2022
There are several reasons behind the slow pace last year. The central government refused to pre-approve and pre-authorize the quota for bond issuance at the beginning of the year in 2021, in order to restore discipline after the massive 2020 stimulus measures. The quota was not released until after the Two Sessions in March, which means local government bond issuance did not pick up until April 2021, causing a 3-month vacuum in local government fiscal support (see Chart 18B). In contrast, for 2019 and 2020, the central government pre-authorized the bond issuance quota ahead of time to try to provide fiscal support evenly throughout the year. Starting from 2020, the central government strengthened supervision and evaluation of local government investment projects, again to instill discipline. Previously local governments could easily issue general-purpose bonds and the funds were theirs to spend. But now local governments are required to increase the transparency of their investment projects and mainly finance these projects via special-purpose bonds, i.e. targeted money for authorized projects (Table 2). In 2021 local governments were less willing to issue bonds. At the April 2021 Politburo meeting, the central government vowed to “establish a disposal mechanism that will hold local government officials accountable for fiscal and financial risks.” This triggered risk-aversion. Beijing wanted to prevent a growth “splurge” in the wake of its emergency stimulus, like what happened in 2008-11. The fiscal turning point came in the second half of the year. The central government called for accelerating local government bond issuance several times from July to October. The pace significantly picked up in the second half of 2021 and Q4 accounted for a significant portion of annual issuance (Chart 18). As a result, fixed asset investment and fiscal impulse should pick up in Q1 2022. Thus, unlike last year, authorities are trying to avoid a sharp drop in the fiscal impulse. The Ministry of Finance has already frontloaded 1.46 trillion yuan ($229 billion) from the 2022 special purpose bonds quota. This amount is part of the 2022 annual local government bond issuance quota, with the rest to be released at the Two Sessions in March. Pulling these funds forward indicates the rising pressure to stabilize economic growth in Q1 this year. That being said, investors should differentiate easing up fiscal policy and “flood-like” stimulus in the past. The government still claims it will “contain increases in implicit local government debts.” In fact, pilot programs to clean up implicit debts have already started in Shanghai and Guangdong. This means, China will not reverse past efforts on curbing hidden debts. Hence fiscal support will be more tightly controlled in future, like water taps in the hands of the central government. The risk of fiscal tightening is backloaded in 2022. The tremendous amount of local government bonds issued in Q4 2021 will start to kick in early 2022. These will combine with the frontloaded special purposed bonds. Fiscal impulse should tick up in Q1. However, fiscal impulse might decelerate in the second half. A total of $2.7 trillion yuan worth of local government bonds will reach maturity this year, with $2.2 trillion yuan reaching maturity after June 2022 (Table 3). This means that in the second half, local governments will need to issue more re-financing bonds to prevent insolvency risk, thus undermining fiscal support for the economy. And this last point underscores the threat of economic and financial instability that China faces over the long run. Table 2Breakdown Of China Local Government Bond Issuance
China Geopolitical Outlook 2022
China Geopolitical Outlook 2022
Bottom Line: Stability is the top priority in 2022. China will continue to easy up monetary and fiscal policy in H1, to combat the economic downward pressure ahead of the twentieth national party congress (Chart 19). Policy tightening risk is backloaded. Structural reforms will likely subside for now until the Xi administration re-consolidates power for the next ten years. Table 3China: Local Government Debt Maturity Schedule
China Geopolitical Outlook 2022
China Geopolitical Outlook 2022
Chart 19Policy Support Expected For 20th Party Congress
Policy Support Expected For 20th Party Congress
Policy Support Expected For 20th Party Congress
Note: An error in an earlier version of this report has been corrected. Chinese fixed asset investment in Chart 19 is growing at 0.1%, not 57.6% as originally shown. The chart has been adjusted. Matt Gertken Chief Geopolitical Strategist mattg@bcaresearch.com Yushu Ma Research Associate yushu.ma@bcaresearch.com Footnotes 1 See Bei Hu and Bloomberg, “Ray Dalio thinks the U.S. needs more of China’s common prosperity drive to create a ‘fairer system,’” Fortune, January 10, 2022, fortune.com. 2 See George Soros, “China’s Challenges,” Project Syndicate, January 31, 2022, project-syndicate.org. 3 The 5-year LPR had remained unchanged after the December 2021 cut. At that time, only the 1-Year LPR was cut by 5bps. Furthermore, the different magnitudes of the January 20 LPR cut also have some implications. The 1-Year LPR mostly affects new and outstanding loans, short-term liquidity loans of firms, and consumer loans of households. In comparison, the 5-Year LPR has a larger impact, affecting the borrowing costs of total social financing, including mortgage loans, medium- to long-term investment loans, etc. The MLF rate was cut by 10 basis points on January 17; in theory the LPR should also be cut by the same size. However, the 5-Year LPR adjustments was very cautious and was only cut by 5 bps, smaller than the MLF cut and the 1-Year LPR cut. The 5-year LPR serves as the benchmark lending rate for mortgage loans. 4 To combat the negative shock caused by the initial outburst of COVID-19, altogether China lowered the MLF and 1-year LPR by 30 bps and 5-year LPR by 15 bps in H1 2020. This also suggests that there is still room for future interest rate cuts or RRR cuts in the coming months. Strategic Themes Open Tactical Positions (0-6 Months) Open Cyclical Recommendations (6-18 Months)
BCA Research is proud to announce a new feature to help clients get the most out of our research: an Executive Summary cover page on each of the BCA Research Reports. We created these summaries to help you quickly capture the main points of each report through an at-a-glance read of key insights, chart of the day, investment recommendations and a bottom line. For a deeper analysis, you may refer to the full BCA Research Report. Executive Summary The golden rule for investing in the stock market simply states: “Stay bullish on stocks unless you have good reason to think that a recession is imminent.” The catch, of course, is that it is difficult to know whether a recession is lurking around the corner. Still, we can learn a lot from past recessions. As we document in this week’s report, every major downturn was caused by the buildup of imbalances within the economy, which were then laid bare by some sort of catalyst, usually monetary tightening. Today, the US is neither suffering from an overhang of capital spending, as it did in the lead-up to the 2001 recession, nor an overhang of housing, as it did in the lead-up to the Great Recession. US inflation has risen, but unlike in the early 1980s, long-term inflation expectations remain well anchored. This gives the Fed scope to tighten monetary policy in a gradual manner. Outside the US, vulnerabilities are more pronounced, especially in China where the property market is weakening, and debt levels stand at exceptionally high levels. Fortunately, the Chinese government has enough tools to keep the economy afloat, at least for the time being. Equity Bear Markets And Recessions Go Hand In Hand
Equity Bear Markets And Recessions Go Hand In Hand
Equity Bear Markets And Recessions Go Hand In Hand
Bottom Line: Equity bear markets rarely occur outside of recessions. With global growth set to remain above trend at least for the next 12 months, investors should continue to overweight equities. However, they should underweight the tech sector since tech stocks remain disproportionately vulnerable to rising rates, increased regulation, and a retrenchment in pandemic-induced spending on electronics and online services. Macro Matters Investors tend to underestimate the importance of macroeconomics for stock market outcomes. That is a pity. Charts 1, 2, and 3 show that the business cycle drives the evolution of corporate earnings; corporate earnings, in turn, drive the stock market; and as a result, the business cycle determines the path for stock prices. Chart 1The Business Cycle Drives Earnings…
The Business Cycle Drives Earnings...
The Business Cycle Drives Earnings...
Chart 2…Earnings In Turn Drive Stock Prices…
...Earnings In Turn Drive Stock Prices...
...Earnings In Turn Drive Stock Prices...
An appreciation of macro forces leads to our golden rule for investing in the stock market. It simply states: Stay bullish on stocks unless you have good reason to think that a recession is imminent. Chart 3…Hence, The Business Cycle Is The Main Driver Of Equity Returns
...Hence, The Business Cycle Is The Main Driver Of Equity Returns
...Hence, The Business Cycle Is The Main Driver Of Equity Returns
Historically, stocks have peaked about six months before the onset of a recession. Thus, it usually does not pay to turn bearish on stocks if you expect the economy to grow for at least another 12 months. In fact, aside from the brief but violent 1987 stock market crash, during the past 50 years, the S&P 500 has never fallen by more than 20% outside of a recessionary environment (Chart 4). Peering Around The Corner The catch, of course, is that it is difficult to know whether a recession is lurking around the corner. Leo Tolstoy began his novel Anna Karenina with the words “Happy families are all alike; every unhappy family is unhappy in its own way.” By the same token, every economic boom seems the same, whereas every recession has its own unique features. This makes forecasting recessions difficult. Difficult, but not impossible. Even though recessions differ substantially in their magnitude and causes, they all share the following three characteristics: 1) The buildup of imbalances that make the economy vulnerable to a downturn; 2) A catalyst that exposes these imbalances; and 3) Amplifiers or dampeners that either exacerbate or mitigate the slump. Let us review six past recessions to better understand what these three characteristics reveal about the current state of the global economy. Chart 4Equity Bear Markets And Recessions Go Hand In Hand
Equity Bear Markets And Recessions Go Hand In Hand
Equity Bear Markets And Recessions Go Hand In Hand
The 1980 And 1982 Recessions The double-dip recessions of 1980 and 1982 were the last in which inflation played a starring role. Throughout the 1970s, the Fed consistently overstated the degree of slack in the economy (Chart 5). This led to a prolonged period in which interest rates stayed below their equilibrium level. The resulting upward pressure on inflation from an overheated economy was compounded by a series of oil shocks, the last of which occurred in 1979 following the Iranian revolution. Chart 6The Volcker Era: It Took Massive Monetary Tightening To Bring Down Inflation
The Volcker Era: It Took Massive Monetary Tightening To Bring Down Inflation
The Volcker Era: It Took Massive Monetary Tightening To Bring Down Inflation
Chart 5The Fed Continuously Overstated The Magnitude Of Economic Slack In The 1970s
The Fed Continuously Overstated The Magnitude Of Economic Slack In The 1970s
The Fed Continuously Overstated The Magnitude Of Economic Slack In The 1970s
In an effort to break the back of inflation, newly appointed Fed chair Paul Volcker raised rates, first to 17% in April 1980, and then following a brief interlude in which the effective fed funds rate dropped back to 9%, to a peak of 19% in July 1981 (Chart 6). The 1990-91 Recession Overheating also contributed to the early 1990s recession. After reaching a high of 10.8% in 1982, the unemployment rate fell to 5% in 1989, about one percentage point below its equilibrium level at that time. Core inflation began to accelerate, reaching 5.5% by August 1990. The Fed initially responded to the overheating economy by hiking interest rates. The fed funds rate rose from 6.6% in March 1988 to a high of 9.8% by May 1989. By the summer of 1990, the economy had already slowed significantly. Commercial real estate, still reeling from the effects of the Savings and Loan crisis, weakened sharply. Defense outlays continued to contract following the collapse of the Soviet Union. The final straw was Saddam Hussein’s invasion of Kuwait, which caused oil prices to surge and consumer confidence to plunge (Chart 7). The 2001 Recession An overhang of IT equipment sowed the seeds of the 2001 recession. Spending on telecommunications equipment rose almost three-fold over the course of the 1990s, which helped lift overall nonresidential capital spending from 11.2% of GDP in 1992 to 14.7% in 2000 (Chart 8). Chart 7Overheating In The Leadup To The 1990-91 Recession
Overheating In The Leadup To The 1990-91 Recession
Overheating In The Leadup To The 1990-91 Recession
The recession itself was fairly mild. After subsequent revisions to the data, growth turned negative for just one quarter, in Q3 of 2001. However, due to the lopsided influence of the tech sector in aggregate profits – and even more so, in market capitalization – the dotcom bust had a major impact on equity prices (Chart 9). Chart 9The Dotcom Bust Dragged Down Tech Earnings
The Dotcom Bust Dragged Down Tech Earnings
The Dotcom Bust Dragged Down Tech Earnings
Chart 8A Glut Of I.T. Equipment Sowed The Seeds Of The 2001 Recession
A Glut Of I.T. Equipment Sowed The Seeds Of The 2001 Recession
A Glut Of I.T. Equipment Sowed The Seeds Of The 2001 Recession
Having raised rates to 6.5% in May 2000, the Fed responded to the downturn by easing monetary policy. Falling rates were effective in reviving the economy – indeed, perhaps too effective. The resulting housing boom paved the way for the Great Recession. The Great Recession (2007-2009) The housing sector was the source of imbalances in the lead-up to the Great Recession. In the US, and in other countries such as Spain and Ireland, house prices soared as lenders doled out credit on increasingly lenient terms. Chart 10A Long House Party
A Long House Party
A Long House Party
Rising house prices stoked a consumption boom and incentivized developers to build more homes. In the US, the personal savings rate fell to historic lows. Residential investment reached a high of 6.7% of GDP, up from an average of 4.3% of GDP in the 1990s (Chart 10). While the housing bubble would have burst at some point anyway, tighter monetary policy helped expedite the downturn. Starting in June 2004, the Fed raised rates 17 times, pushing the fed funds rate to 5.25% by June 2006. The ECB also hiked rates; it raised the refi rate from 2% in December 2005 to 4.25% in July 2008, continuing to tighten policy even after the Fed had begun to cut rates. Once global growth started to weaken, a number of accelerants kicked in. As is the case in every recession, rising unemployment led to less spending, which in turn led to even higher unemployment. To make matters worse, a vicious circle engulfed the housing market. Falling home prices eroded the collateral underlying mortgage loans, producing more defaults, tighter lending standards, and even lower home prices. The Fed responded to the crisis by cutting rates and introducing an alphabet soup of programs to support the financial system. However, the zero lower-bound constraint limited the degree to which the Fed could cut rates, forcing it to resort to unorthodox measures such as quantitative easing. While these measures arguably helped, they fell short of what was needed to resuscitate the economy. Fiscal policy could have picked up the slack, but political considerations limited the scale and scope of the 2009 Recovery Act. The result was a needlessly long and drawn-out recovery. The Euro Crisis (2012) Chart 11The State Is Here To Mop Up The Mess
The State Is Here To Mop Up The Mess
The State Is Here To Mop Up The Mess
A reoccurring theme in economic history is that financial crises often force governments to assume private-sector liabilities in order to avoid a full-scale economic collapse. Unlike Greece, where government debt stood at very high levels even before the GFC, debt levels in Spain and Ireland were quite modest before the crisis. However, all that changed when Spain and Ireland were forced to bail out their banks (Chart 11). Unlike the US, UK, and Japan, euro area member governments did not have access to central banks that could serve as buyers of last resort for their debts. This limitation created a feedback loop where rising bond yields made it more onerous for governments to service their debts, which led to a higher perceived likelihood of default and even higher yields (Chart 12). Chart 12Multiple Equilibria In The Debt Market Are Possible Without A Lender Of Last Resort
The Golden Rule For Investing In The Stock Market
The Golden Rule For Investing In The Stock Market
The ECB could have short-circuited this vicious cycle. Unfortunately, under the hapless leadership of Jean-Claude Trichet, instead of providing assistance, the central bank raised rates twice in 2011. This helped spread the crisis to Italy and other parts of core Europe. It ultimately took Mario Draghi’s “whatever it takes pledge” to restore some semblance of normality to European sovereign debt markets. Lessons For Today The current environment bears some resemblance to the one preceding the recessions of the early 1980s. As was the case back then, inflation today has surged well above the Federal Reserve’s target, forcing the Fed to turn more hawkish. Oil prices have also risen, despite slowing global growth. Even Russia has returned to its status as the world’s leading geopolitical boogeyman. Yet, digging below the surface, there is a big difference between today and the early ‘80s. For one thing, long-term inflation expectations remain well anchored. While expected inflation 5-to-10 years out has risen to 3.1% in the latest University of Michigan survey, this just takes the reading back to where it was not long after the Great Recession. It is still nowhere near the double-digit levels reached in the early ‘80s (Chart 13). Market-based inflation expectations are even more subdued. In fact, the widely watched 5-year/5-year forward TIPS breakeven inflation rate is currently well below the Fed’s comfort zone (Chart 14). Chart 13Long-Term Inflation Expectations Are Inching Up But Are Still Low
Long-Term Inflation Expectations Are Inching Up But Are Still Low
Long-Term Inflation Expectations Are Inching Up But Are Still Low
Chart 14Market-Based Long-Term Inflation Expectations Are Below The Fed's Comfort Zone
Market-Based Long-Term Inflation Expectations Are Below The Fed's Comfort Zone
Market-Based Long-Term Inflation Expectations Are Below The Fed's Comfort Zone
Higher oil prices are unlikely to have the sting that they once did. The energy intensity of the global economy has fallen steadily over time, especially in advanced economies (Chart 15). Today, the US generates three-times as much output for every joule of energy consumed than it did in 1970. Household spending on energy has declined from a peak of 8.3% of disposable income in 1980 to 3.8% in December 2021. The US also produces over 11 million barrels of oil per day, more than Saudi Arabia (Chart 16). Chart 15The Global Economy Has Become Less Energy Intensive Over Time
The Global Economy Has Become Less Energy Intensive Over Time
The Global Economy Has Become Less Energy Intensive Over Time
Chart 16When It Comes To Energy Production, The USA Is Now #1
When It Comes To Energy Production, The USA Is Now #1
When It Comes To Energy Production, The USA Is Now #1
Unlike in the late 1990s, advanced economies do not face a significant capex overhang. Quite the contrary. Capital spending has been fairly weak across much of the OECD. In the US, the average age of the nonresidential capital stock has risen to the highest level since the 1960s (Chart 17). Looking out, far from cratering, capital spending is set to rise, as foreshadowed by the jump in core capital goods orders (Chart 18). Chart 17The Aging Capital Stock
The Aging Capital Stock
The Aging Capital Stock
Chart 18The Outlook For US Capex Is Bright
The Outlook For US Capex Is Bright
The Outlook For US Capex Is Bright
Chart 19Need More Houses
Need More Houses
Need More Houses
In contrast to the glut of housing that helped precipitate the Global Financial Crisis, housing remains in short supply in many developed economies. In the US, the homeowner vacancy rate has fallen to a record low. There are currently half as many new homes available for sale as there were in early 2020 (Chart 19). Even in Canada, where homebuilding has held up well, government officials have been hitting the panic button over a brewing home shortage. The Biggest Risk Is Debt The biggest macroeconomic risk the global economy faces stems from high debt levels. While household debt has fallen by 20% of GDP in the US, it has risen in a number of other economies. Corporate debt has generally increased everywhere, in many cases to finance share buybacks and M&A activity (Chart 20). Public debt has also soared to the highest levels since during World War II. Chart 20Mo' Debt
Mo' Debt
Mo' Debt
Among emerging markets, China’s debt burden is especially pronounced. Total private and public debt reached 285% of GDP in 2021, nearly double what it was in early 2008. The property market is also slowing, which will weigh on growth. Like many countries, China finds itself in a paradoxical situation: Any effort to pare back debt is likely to crush nominal GDP by so much that the debt-to-GDP ratio rises rather than falls. Ironically, the only solution is to adopt reflationary policies that allow the economy to run hot. In the near term, this could prove to be a favorable outcome for investors since it will mean that monetary policy stays highly accommodative. Over the long haul, however, it may lead to a stagflationary environment, which would be detrimental to equities and other risk assets. In summary, investors should remain overweight stocks for now. However, they should underweight the tech sector since tech stocks remain disproportionately vulnerable to rising rates, increased regulation, and a retrenchment in pandemic-induced spending on electronics and online services. Peter Berezin Chief Global Strategist peterb@bcaresearch.com Global Investment Strategy View Matrix
The Golden Rule For Investing In The Stock Market
The Golden Rule For Investing In The Stock Market
Special Trade Recommendations Current MacroQuant Model Scores
The Golden Rule For Investing In The Stock Market
The Golden Rule For Investing In The Stock Market
BCA Research’s China Investment Strategy service recommends investors with a cyclical investment horizon long MSCI China Value Index /Short MSCI China Growth Index. On a cyclical basis, Chinese investable stocks will not be immune to global market selloffs…
BCA Research is proud to announce a new feature to help clients get the most out of our research: an Executive Summary cover page on each of the BCA Research Reports. We created these summaries to help you quickly capture the main points of each report through an at-a-glance read of key insights, chart of the day, investment recommendations and a bottom line. For a deeper analysis, you may refer to the full BCA Research Report. Dear Clients, On behalf of the China Investment Strategy team, I would like to wish you a very happy, healthy, and prosperous Chinese New Year of the Tiger! Gong Xi Fa Chai, Best regards, Jing Sima China Strategist Executive Summary Chinese Investable Value Stocks Earnings Growth Will Likely Stabilize By Mid-2022
Chinese Investable Value Stocks Earnings Growth Will Likely Stabilize By Mid-2022
Chinese Investable Value Stocks Earnings Growth Will Likely Stabilize By Mid-2022
Chinese investable stocks passively outperformed their global counterparts in the first month of the year. However, we do not think January’s outperformance in the aggregate MSCI China Index will be sustained beyond the next six months. On a cyclical basis, when global stocks recover, growth stocks will likely underperform value stocks. The tech-heavy MSCI China Index is therefore less attractive to investors than other EM and developed market (DM) equities that are more value centric. Chinese investable ex-tech stocks are cheaply valued versus their global peers. Even if the earnings recovery in 2H22 are modest, Chinese investable value stocks are still attractive on a risk-reward basis. For investors that look to increase exposure to China on a cyclical basis, we recommend long Chinese investable value stocks while minimizing exposure to the tech sector. CYCLICAL RECOMMENDATIONS (6 - 18 MONTHS) INITIATION DATE RETURN SINCE INCEPTION (%) COMMENT EQUITIES Long MSCI China Value Index /Short MSCI China Growth Index 02-02-22 Bottom Line: We expect the tech sector’s passive outperformance in January to be short lived. Value stocks in Chinese investable equities, on the other hand, offer a better risk-reward profile relative to their TMT peers and for investors with a 6- to 12-month investment horizon. Feature Chart 1Chinese Investable Stocks Passively Outperformed In January This Year
Chinese Investable Stocks Passively Outperformed In January This Year
Chinese Investable Stocks Passively Outperformed In January This Year
Chinese investable stocks dropped by 5% in January from December last year, giving up a 3% gain in the first three weeks (Chart 1). Still, the MSCI China Index outperformed global stocks by 2%. Some media reports stated that global investors have been drawn to Chinese offshore equities for their relatively cheap valuations and China’s easier monetary policy compared with other major economies . In our January 19 report we recommended investors tactically (0 to 6 months) upgrade the MSCI China Index to overweight within a global equity portfolio, based on the notion that the MSCI China Index would passively outperform since it would fall less than global equities. We maintain this view but do not expect the outperformance in aggregate Chinese investable stocks to endure on a cyclical basis. Our judgment is that while both China’s investable TMT (technology, media, and telecommunications) and ex-TMT stocks have been deeply discounted versus global stocks, beyond the next six months the investable TMT stocks will likely be a drag on the aggregate MSCI China Index. Thus, for investors looking for trades to increase their cyclical exposure to Chinese stocks, we recommend minimize their exposure to the tech sector. Meanwhile, we continue to favor onshore stocks versus their offshore counterparts, despite cheaper relative valuations in offshore stocks. We will discuss our view of the onshore market in next week’s report. A Valuation Catch-Up A valuation catch-up, as opposed to an improvement in China’s economic fundamentals, appears to be driving the passive outperformance in Chinese investable stocks. Our assessment is based on the following observations: Chart 2Chinese Stocks Normally Fall In Risk-Off Environment
Chinese Stocks Normally Fall In Risk-Off Environment
Chinese Stocks Normally Fall In Risk-Off Environment
The beta of Chinese investable stocks has been steadily increasing over the past few years, versus both EM and global stocks. The high beta and pro-risk nature of Chinese investable stocks suggest their prices should fall in a risk-off market. Generally investors would not favor Chinese stocks during global market selloffs. Chart 2 shows that both EM and global stock benchmarks have fallen below their 200-day moving averages. Therefore, investors have been buying Chinese stocks against a risk-off market backdrop because Chinese stocks offer better risk-reward profile either due to their favorable valuations or higher earnings growth. It is simplistic to assume that investors favor Chinese investable stocks because of the country’s easier monetary policy versus the rest of the world. Chinese A-share stocks, which valuations are neutral, have been selling off more than the offshore stocks (Chart 3). Chinese onshore tech company stocks also suffered large losses in January, similar to their US peers (Chart 3, middle and bottom panels). Therefore, the divergence in the relative performance between the Chinese onshore and offshore markets suggests that discounted valuations in offshore Chinese stocks rather than economic fundamentals have driven the relative gains in the investable bourse. The mirror image in regional equity performance this year compared with last year also suggests that factors other than monetary policy explain equity dynamics (Chart 4). While the tech-heavy US bourse was the worst performer among major indices, markets that generated the greatest returns in 2021 have suffered the biggest losses so far in 2022. This phenomenon suggests that investors may be locking in last year’s gains, which is accentuating the underperformance of 2021’s winners and the outperformance of last year’s losers. Chart 42022 Is A Mirror Image Of 2021
Chinese Investable Stocks In A Global Equity Selloff
Chinese Investable Stocks In A Global Equity Selloff
Chart 3Chinese Onshore Stocks Followed The Global Market Downtrend
Chinese Onshore Stocks Followed The Global Market Downtrend
Chinese Onshore Stocks Followed The Global Market Downtrend
Bottom Line: Chinese investable stocks ended January with a much smaller loss than their global peers. The relative outperformance in the MSCI China Index has been mainly driven by its cheaper valuations relative to its global peers. Complacency Risk And Chinese Investable Stocks We see the recent global stock market selloff as a sharp reduction in complacency in the market, particularly in the high-flying tech sector (Chart 5). The correction in global tech stock prices will likely continue for a few months while the market digests a sudden rise in bond yields. As such, the prices in Chinese offshore tech companies will also fall in absolute terms but can still passively outperform their global counterparts, given their deeply discounted relative valuations. Nonetheless, several factors make us cautious about the exposure of China's outsized tech sector beyond the next six months. Hence, our overweight stance on Chinese investable stocks (in relative terms) is limited to the short term (i.e. in the next 0 to 6 months). The growth rates of the 12-month trailing and forward earnings for global tech stocks are both above the 85th percentiles (Chart 6). This indicates that a substantial amount of profit growth has already been priced into global tech stocks, raising the risk of earnings disappointment in the next 6 to 12 months. By contrast, China's TMT-stock 12-month trailing and forward earnings have fallen to below the 25th percentiles (Chart 6, bottom panel). This suggests that the global exuberance in tech earnings is less priced in among Chinese TMT stocks. Chart 5A Sharp Complacency Reduction In The Tech Sector
A Sharp Complacency Reduction In The Tech Sector
A Sharp Complacency Reduction In The Tech Sector
Chart 6Global Tech Earnings Growth Remains Significantly Stretched
Global Tech Earnings Growth Remains Significantly Stretched
Global Tech Earnings Growth Remains Significantly Stretched
However, as noted in our previous reports, Chinese growth/tech companies’ price discount relative to their earnings reflects structural risks that investors are pricing in. These structural headwinds may not intensify in the near term but are not going away either. The regulatory backdrop has not improved enough to justify a sustained faster multiple expansion in China’s internet giants. Beijing continues to rein in its internet behemoths and tighten regulations related to data. It is not yet clear what impact some of the new regulations announced last year will have on the tech sector’s business models. At the very least, antitrust regulations will chip away at the competitive advantage of these tech titans. Furthermore, China's investable TMT sector appears to be a domestic consumer play and thus, likely to weaken in the coming 6 to 12 months given the poor outlook for consumption (Chart 7). Even though China has stepped up its policy support for the aggregate economy, its stringent measures to counter the domestic COVID situation will significantly weigh on its service sector and consumption. The downbeat prospect on China's housing market will also curb consumption growth based on the expectations for employment and income dynamics (Chart 8). Chart 7Outlook For Chinese Internet Sales Remains Downbeat
Outlook For Chinese Internet Sales Remains Downbeat
Outlook For Chinese Internet Sales Remains Downbeat
Chart 8Housing Market Slump A Significant Drag On Household Consumption
Housing Market Slump A Significant Drag On Household Consumption
Housing Market Slump A Significant Drag On Household Consumption
Chart 9Rising Rates Are A Tailwind For Value Stocks
Rising Rates Are A Tailwind For Value Stocks
Rising Rates Are A Tailwind For Value Stocks
Lastly, we expect the pace of increases in bond yields to slow and global equities to trend higher beyond the next couple months. In this case, we are not convinced that Chinese investable stocks will continue to outperform their global peers. The reason for our skepticism is that in a climate of rising interest rates, growth stocks tend to underperform value ones (Chart 9). Given that China's TMT sector’s weight (43%) is considerably higher than the global benchmark (30%), Chinese investable stocks will underperform once valuations in China’s TMT stocks catch up to be in line with those of the global tech sector. Bottom Line: From a valuation perspective, Chinese investable stocks currently look reasonable. In the next a few months when global tech stocks continue to sell off, Chinese offshore tech companies and stocks in general will likely passively outperform their global peers. However, from a risk-reward standpoint and beyond the next six months, the MSCI China Index is at a disadvantage due to a high concentration of stocks in the tech sector. Investment Conclusions On a cyclical basis, Chinese investable stocks will not be immune from global market selloffs due to the offshore market’s high volatility and positive correlation with global stocks. In addition, the MSCI China Index will likely underperform global equities in an up market because of a higher-than-average stake in tech stocks. As such, in a global portfolio we continue to favor onshore stocks over the investable bourse, despite cheaper relative valuations in offshore market equities. Next week’s report will discuss our views on the onshore market. Meanwhile, given the risks facing stocks in China’s tech sector, we propose a new trade recommendation for investors with a cyclical time horizon: long MSCI China Value Index /Short MSCI China Growth Index. The trade will increase cyclical exposure to Chinese offshore stocks, while minimizing stake in the offshore tech sector. The MSCI's China growth index is almost entirely made up of TMT equities, meaning that a relative value play will effectively mimic an ex-TMT position. Extremely cheap valuations in Chinese ex-TMT equities versus global stocks indicate that investors have already priced in a degree of weakness in China's economy (Chart 10). We remain alert to the possibility of a more pronounced near-term slowdown in the business cycle, but we expect China’s economy to regain its footing and stabilize by mid-2022. Our model shows that earnings will decelerate sharply in 1H22 (Chart 11). However, even if the upcoming stimulus and earnings recovery in 2H22 are modest, Chinese value stocks are still attractive on a risk-reward basis given the sizeable valuation discount levied on China relative to global stocks. Chart 10Chinese Investable Value Stocks Are Trading At A Huge Discount Versus Global
Chinese Investable Value Stocks Are Trading At A Huge Discount Versus Global
Chinese Investable Value Stocks Are Trading At A Huge Discount Versus Global
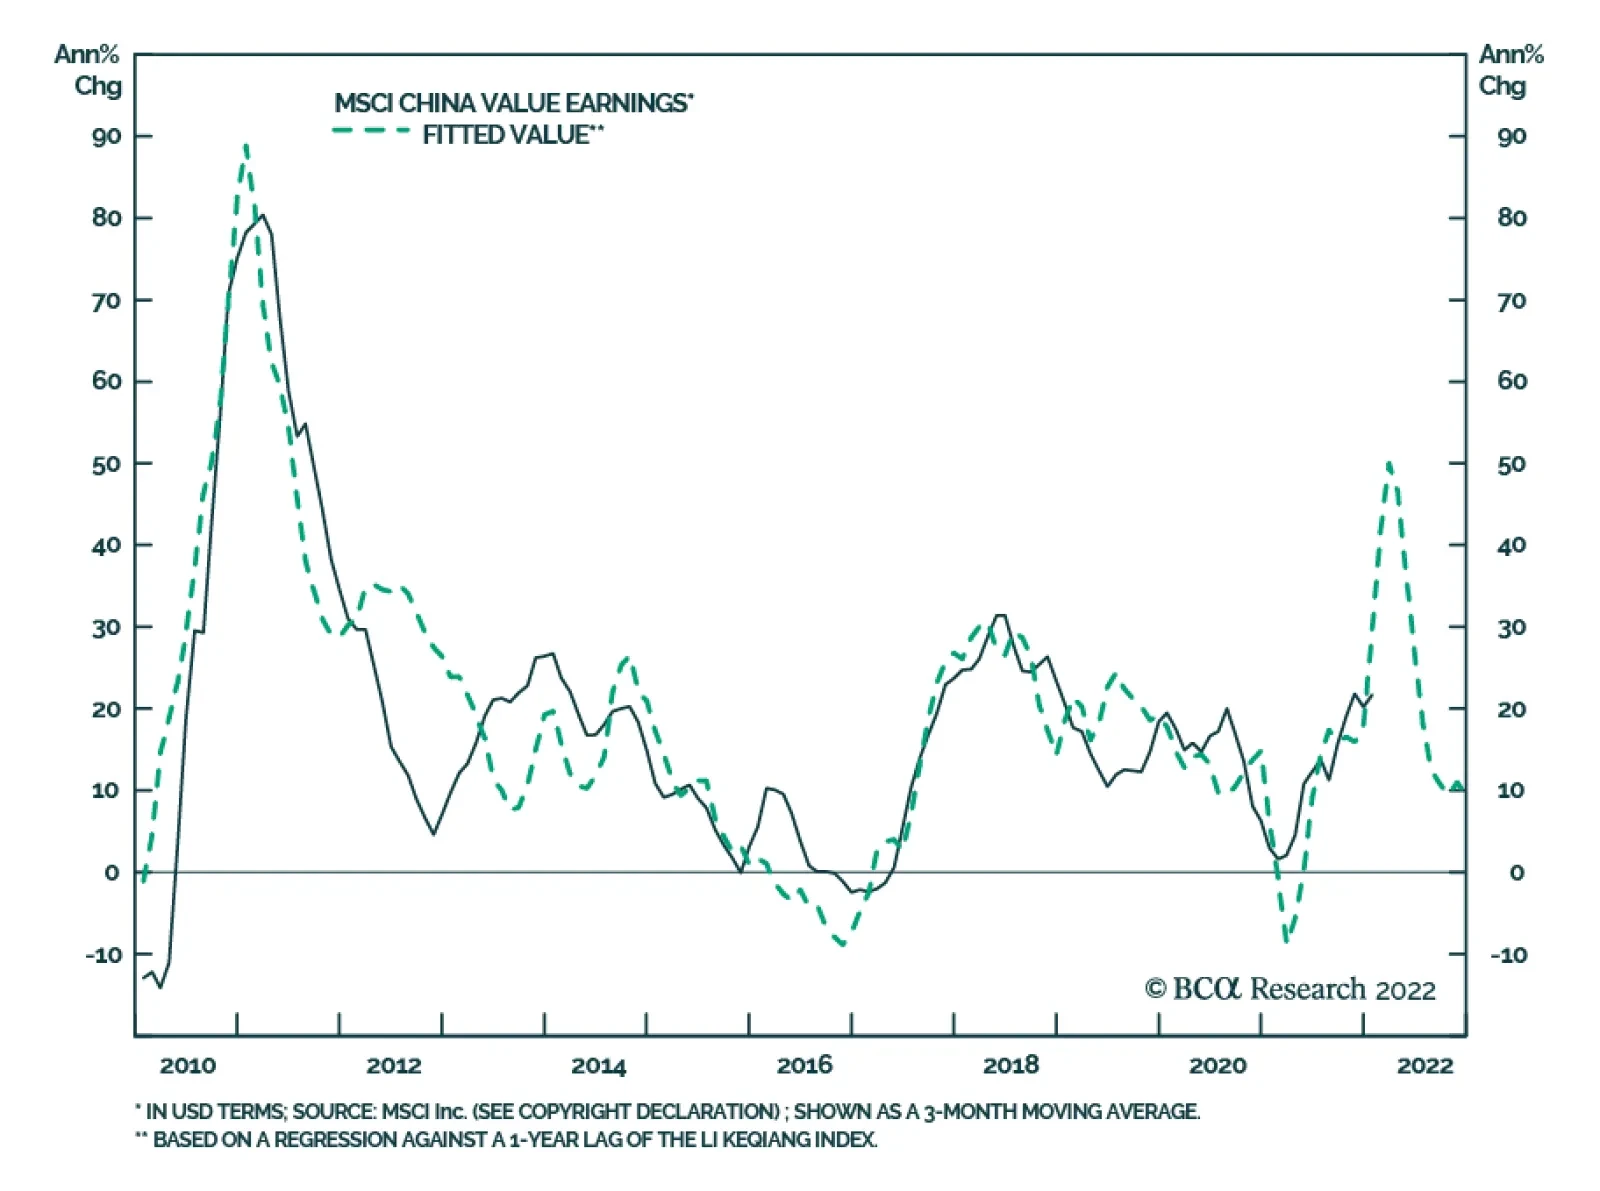
Chart 11Chinese Investable Value Stocks Earnings Growth Will Likely Stabilize By Mid-2022
Chinese Investable Value Stocks Earnings Growth Will Likely Stabilize By Mid-2022
Chinese Investable Value Stocks Earnings Growth Will Likely Stabilize By Mid-2022
Jing Sima China Strategist jings@bcaresearch.com Strategic Themes Cyclical Recommendations Tactical Recommendations
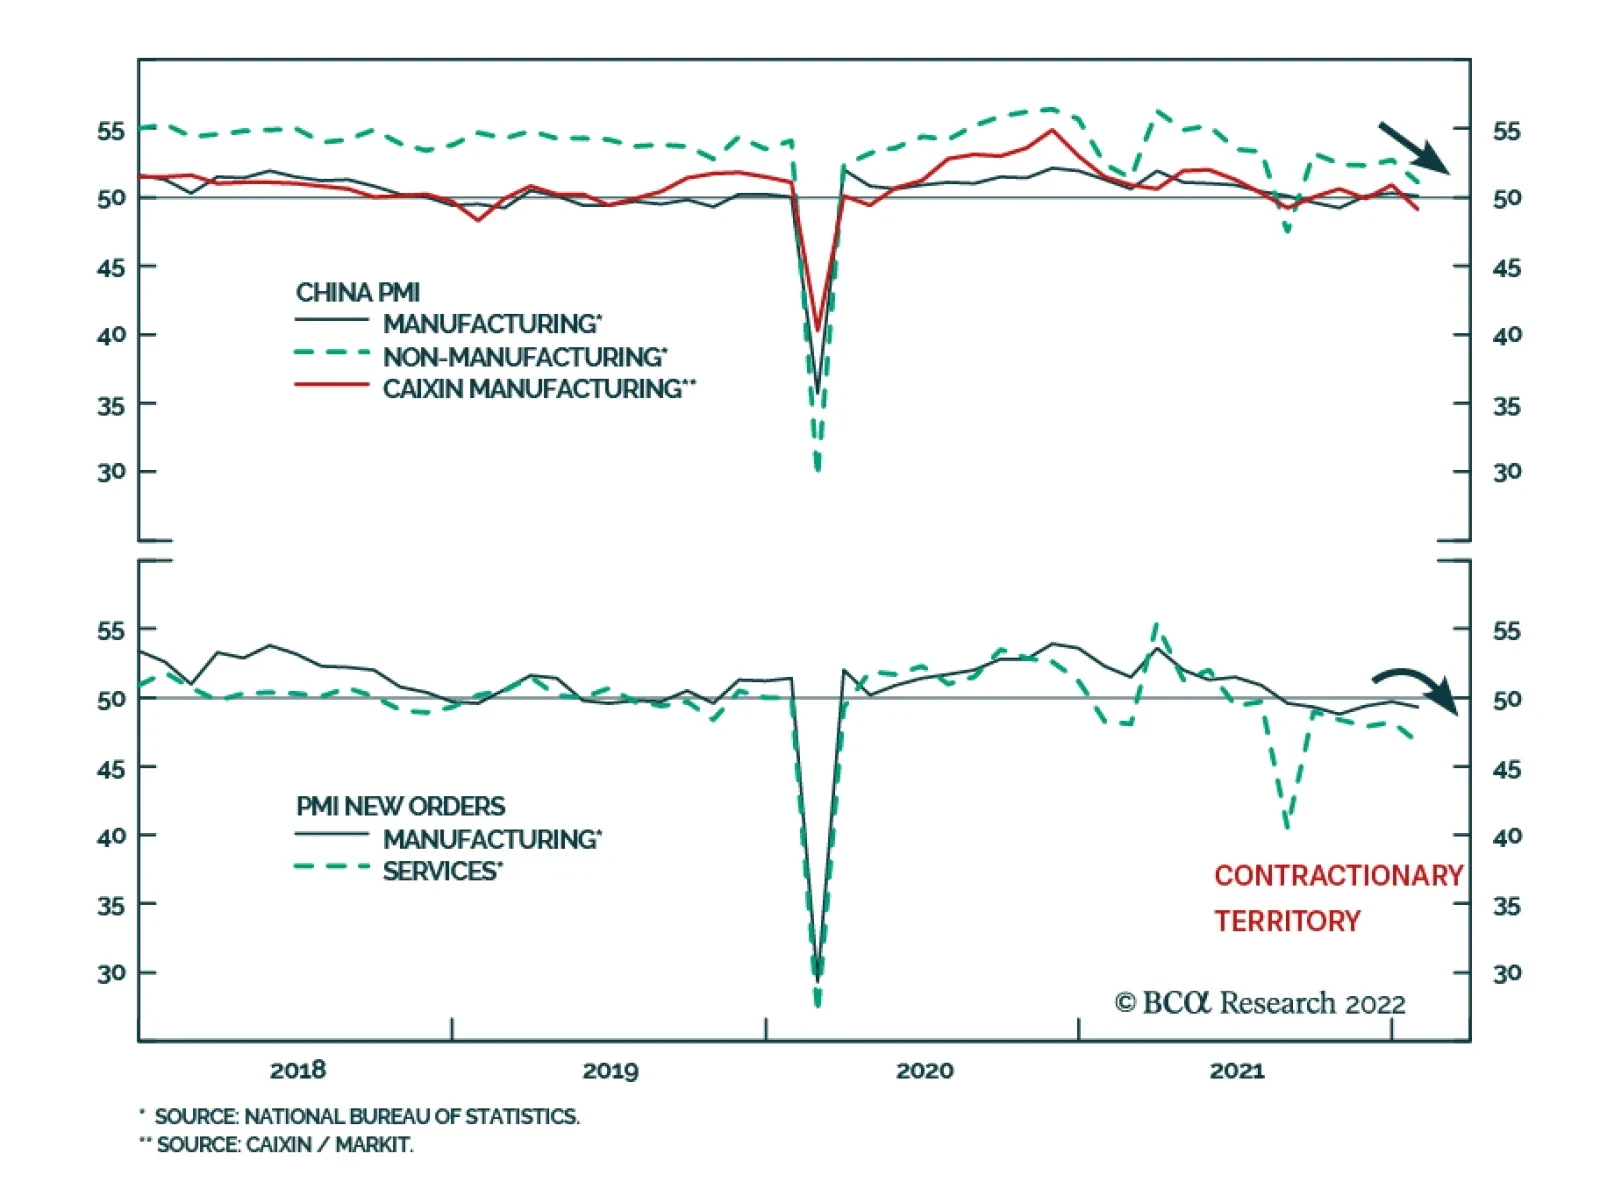
Chinese PMIs suggest that economic growth was subdued in January. The composite PMI compiled by the National Bureau of Statistics slid from 52.2 and now sits at 51.0 – the neutral line which is consistent with unchanged economic activity versus December. The…
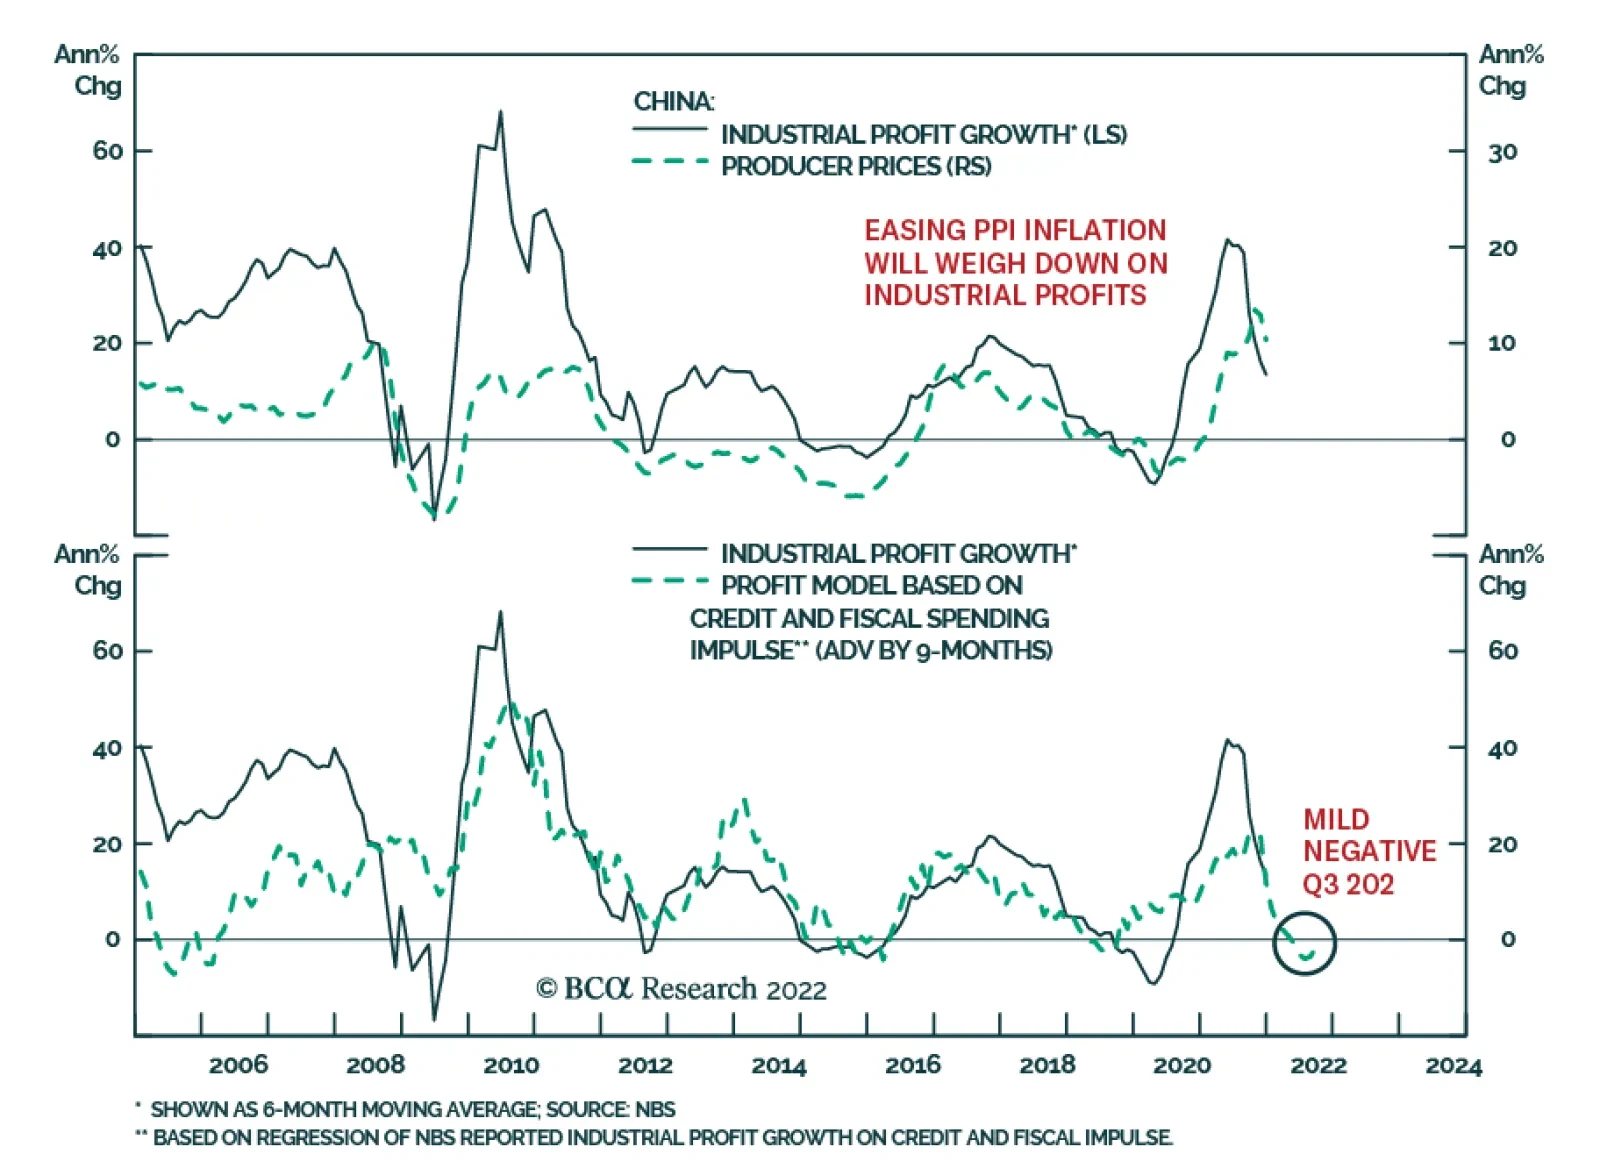
Chinese industrial profit growth eased to 4.2% y/y in December from November’s 9% rate. Chinese policymakers have recently been more proactive in supporting the domestic economy by easing monetary policy. However, industrial profit growth will be slow to…
Highlights The faster-than-expected oil-demand recovery from the COVID-19 omicron variant points to higher EM trade volumes this year and next, which, along with a weaker USD, will boost base-metals demand and prices (Chart of the Week). The recovery in iron-ore prices on the back of China stimulus and omicron-induced labor shortages at miners will lift copper prices, the base-metals' bellwether. Supply-demand balances in refined copper showed a physical deficit of 438K MT for the January-October 2021 period, indicating the market extended its years-long deficit in 2021. Despite the IMF's mark-down in global growth due to slowdowns in the US and China this year, metals demand will continue to exceed supply, which will support prices. Short squeezes – most recently in nickel, following a headline-grabbing copper squeeze in October – will keep base metals' inventories under pressure and forward curves backwardated. We remain long the S&P GSCI and the COMT ETF, as well as the PICK ETF, to remain exposed to backwardation. At tonight's close, we are getting long the SPDR S&P Metals and Mining ETF (XME) ETF, following its recent sell-off. We are raising our 2022 copper target to $5.00/lb on COMEX, and keeping our 2023 expectation at $6.00/lb. Feature Inadequate development in new base metals supply, which has been apparent for years, means economic recovery and expansion will continue to tax existing supplies over the short run (to end-2023).1 Chart of the WeekExpected Global Trade Pick-Up Will Boost Base Metals Demand
Expected Global Trade Pick-Up Will Boost Base Metals Demand
Expected Global Trade Pick-Up Will Boost Base Metals Demand
Chart 2Physical Deficits Will Persists In Copper...
Physical Deficits Will Persists In Copper...
Physical Deficits Will Persists In Copper...
At a global level, prolonged supply-demand imbalances mean inventories will continue to be drawn hard to cover for prompt supply shortfalls. This can be seen in the principal base metals we cover: copper (Chart 2), aluminum (Chart 3), nickel (Chart 4), and zinc (Chart 5). As a result, short squeezes in base metals markets will continue to grab headlines, as persistent physical deficits periodically drain inventories.2 Longer term, the global effort to decarbonize energy supply could be stretched out well beyond 2050, when most policymakers assume the task of replacing fossil-fuel energy sources will largely be completed. The longer it takes to mobilize capex, the more expensive the energy transition becomes, as markets are continually forced to adjust to short-term shortages leading to price spikes and squeezes in an effort to meet demand. Chart 3...Aluminum...
...Aluminum...
...Aluminum...
Chart 4...Nickel...
...Nickel...
...Nickel...
Chart 5...And Zinc.
...And Zinc.
...And Zinc.
Faster Demand Recovery In Metals Faster-than-expected oil-demand recovery will translate to higher trade volumes globally this year and next. This is particularly important for EM markets, given oil and metals prices – particularly copper, the base metals bellwether – share a common long-term equilibrium (i.e., they're cointegrated, as seen in the Chart of the Week).3 A pick-up in EM trade volumes, along with a weakening USD this year, will help lift copper prices. Most trade is in manufactured goods, which will translate into a pick-up in cyclical stocks vs. defensive stocks as well, which also is supportive of copper prices (Chart 6). Copper prices also will be supported by the recovery in iron-ore prices, which have been bid up on the back of increasing stimulus in China and global growth ex-China, as well as omicron-induced labor shortages among miners. As is typical, copper demand will follow in the wake of steel demand, as construction and infrastructure projects are finished off (i.e., plumbing and wiring are installed) (Chart 7). Chart 6Global Trade Recovery Will Boost Copper
Global Trade Recovery Will Boost Copper
Global Trade Recovery Will Boost Copper
Chart 7Iron Ore Rally Will Boost Copper
Iron Ore Rally Will Boost Copper
Iron Ore Rally Will Boost Copper
Supply Side Remains Challenged Impressive gains put up on the supply side last year in Indonesia – which, according to the International Copper Study Group, posted a 51% increase in copper output at the Grasberg mine over the first 10 months of 2021, – and other smaller producers notwithstanding, geopolitical uncertainty continues to dominate the supply-side risks to base metals generally, copper in particular.4 Economic and political uncertainty in Chile and Peru, which account for 30% and 10% of global copper output, respectively, will continue to keep miners hesitant in their capex allocations, in our view. Both states have elected left-of-center governments, which still are working through how they will deliver on their election mandates, including revenue re-distribution, taxation and royalties.5 The combination of stronger demand and tepid supply growth will keep base metals inventories under pressure, which will translate into continued backwardation. This is particularly apparent in the copper (Chart 8) and nickel (Chart 9). Both of these squeezes resulted from buyers treating the London Metal Exchange as a supplier of last resort – which is an extremely rare occurrence in futures markets – and both required the intervention of the London Metal Exchange to address.6 Chart 8Copper Backwardation Will Persist
Copper Backwardation Will Persist
Copper Backwardation Will Persist
Chart 9...As Will Nickels
...As Will Nickels
...As Will Nickels
Investment Implications Base metals markets will continue to find it difficult to match supply with demand, as they have for the past several years. This further compounds the global energy transition – largely because the suppliers of the metals needed to pull it off are starting from a deep physical deficit position – and likely delays it considerably. In an environment in which obstacles to developing the supply needed to phase out fossil fuels in favor of renewable generation continue to mount, we remain long commodity index exposure – the S&P GSCI and COMT ETF – and favor exposure to miners and trading companies that are responsible for moving metals around the globe. At tonight's close, we are getting long the SPDR S&P Metals and Mining ETF (XME) ETF, following its recent sell-off of 10% for its highs of $47/share. Our view on base metals is they are a long-term value play, in which miners and the supply side generally, will benefit from the high prices needed to develop the supply the energy transition will require. The big risk here is these companies once again lose the plot and fail to control costs to produce at the expense of the health of their margins. If we see this, we will exit the position. Robert P. Ryan Chief Commodity & Energy Strategist rryan@bcaresearch.com Ashwin Shyam Research Associate Commodity & Energy Strategy ashwin.shyam@bcaresearch.com Paula Struk Research Associate Commodity & Energy Strategy paula.struk@bcaresearch.com Commodities Round-Up Energy: Bullish We expect OPEC 2.0 to announce they'll continue with the return of another 400k b/d at next week's monthly meeting. In reality, the producer coalition most likely will fail to return these volumes to market and will fall short of the mark again. The real news markets are waiting for is whether the four states capable of increasing supply and sustaining higher output – Saudi Arabia, Iraq, the UAE and Kuwait – will step up to cover the growing gap between volumes that were pledged and what's actually been delivered. The coalition agreed in July 2021 to begin returning some of the 5.8mm b/d of output pulled from the market during the COVID-19 pandemic starting in August 2021. To date, the producer group has fallen short by about 800k b/d, based on the IEA's January 2022 estimates. Failure to increase production by the four core OPEC 2.0 states could keep prices above $90/bbl this year and next (Chart 10). Base Metals: Bullish Iron ore prices have rallied ~ 14% since the start of this year, as markets expect China to ease steel production cuts in 2022 and loosen monetary policy. Last week, the People’s Bank of China (PBoC) cut its policy interest rate for the first time in nearly two years. Markets expect more stimulus and policy easing in China as the central bank and government attempt to stimulate an economy mired by COVID-19 lockdowns, a property market slump and high energy prices. Higher stimulus implies more commodity refining and manufacturing activity, including steel production, which will lead to higher iron ore demand. Precious Metals: Bullish In line with market expectations, the Federal Reserve signaled an initial rate hike in March, in its January Federal Open Market Committee (FOMC) meeting. While nominal interest rates will rise, the Fed will remain behind the inflation curve. The US CPI reading for December showed that inflation was 7% higher year-on-year, the highest annual increase in inflation since 1982 (Chart 11). High inflation and the Fed’s slow start to raise nominal interest rates will keep real rates, the opportunity cost of holding gold, low. Chart 10
Brent Forecast Restored To $80/bbl For 2022
Brent Forecast Restored To $80/bbl For 2022
Chart 11
Short Squeezes In Copper, Nickel Highlight Tight Metals Markets
Short Squeezes In Copper, Nickel Highlight Tight Metals Markets
Footnotes 1 Please see 2022 Key Views: Past As Prelude For Commodities, published on December 16, 2021 for additional discussion. 2 Please see Column: Nickel gripped by ferocious squeeze as stocks disappear: Andy Home, published by reuters.com on January 20, 2022; and LME copper spreads backwardated amid stock squeeze, published by argusmedia.com on October 20, 2021. 3 This was flagged most recently in the IEA's January 2022 Oil Market Report, which noted, "While the number of Omicron cases is surging worldwide, oil demand defied expectations in 4Q21, rising by 1.1 mb/d to 99 mb/d. In 1Q22, demand is set for a seasonal decline, exacerbated by more teleworking and less air travel. We have raised our global demand estimates by 200 kb/d for 2021 and 2022 – resulting in growth of 5.5 mb/d and 3.3 mb/d, respectively – due to softer Covid restrictions." Please see Higher Output Needed To Constrain Oil Prices for our latest oil balances and price forecasts. We published this report last week. 4 Please see International Copper Study Group press release of January 2022. 5 Please see Add Local Politics To Copper Supply Risks, which we published on November 25, 2021, for a discussion of these risks. 6 Please see Footnote 2 above. Investment Views and Themes Recommendations Strategic Recommendations Trades Closed In 2021
Image
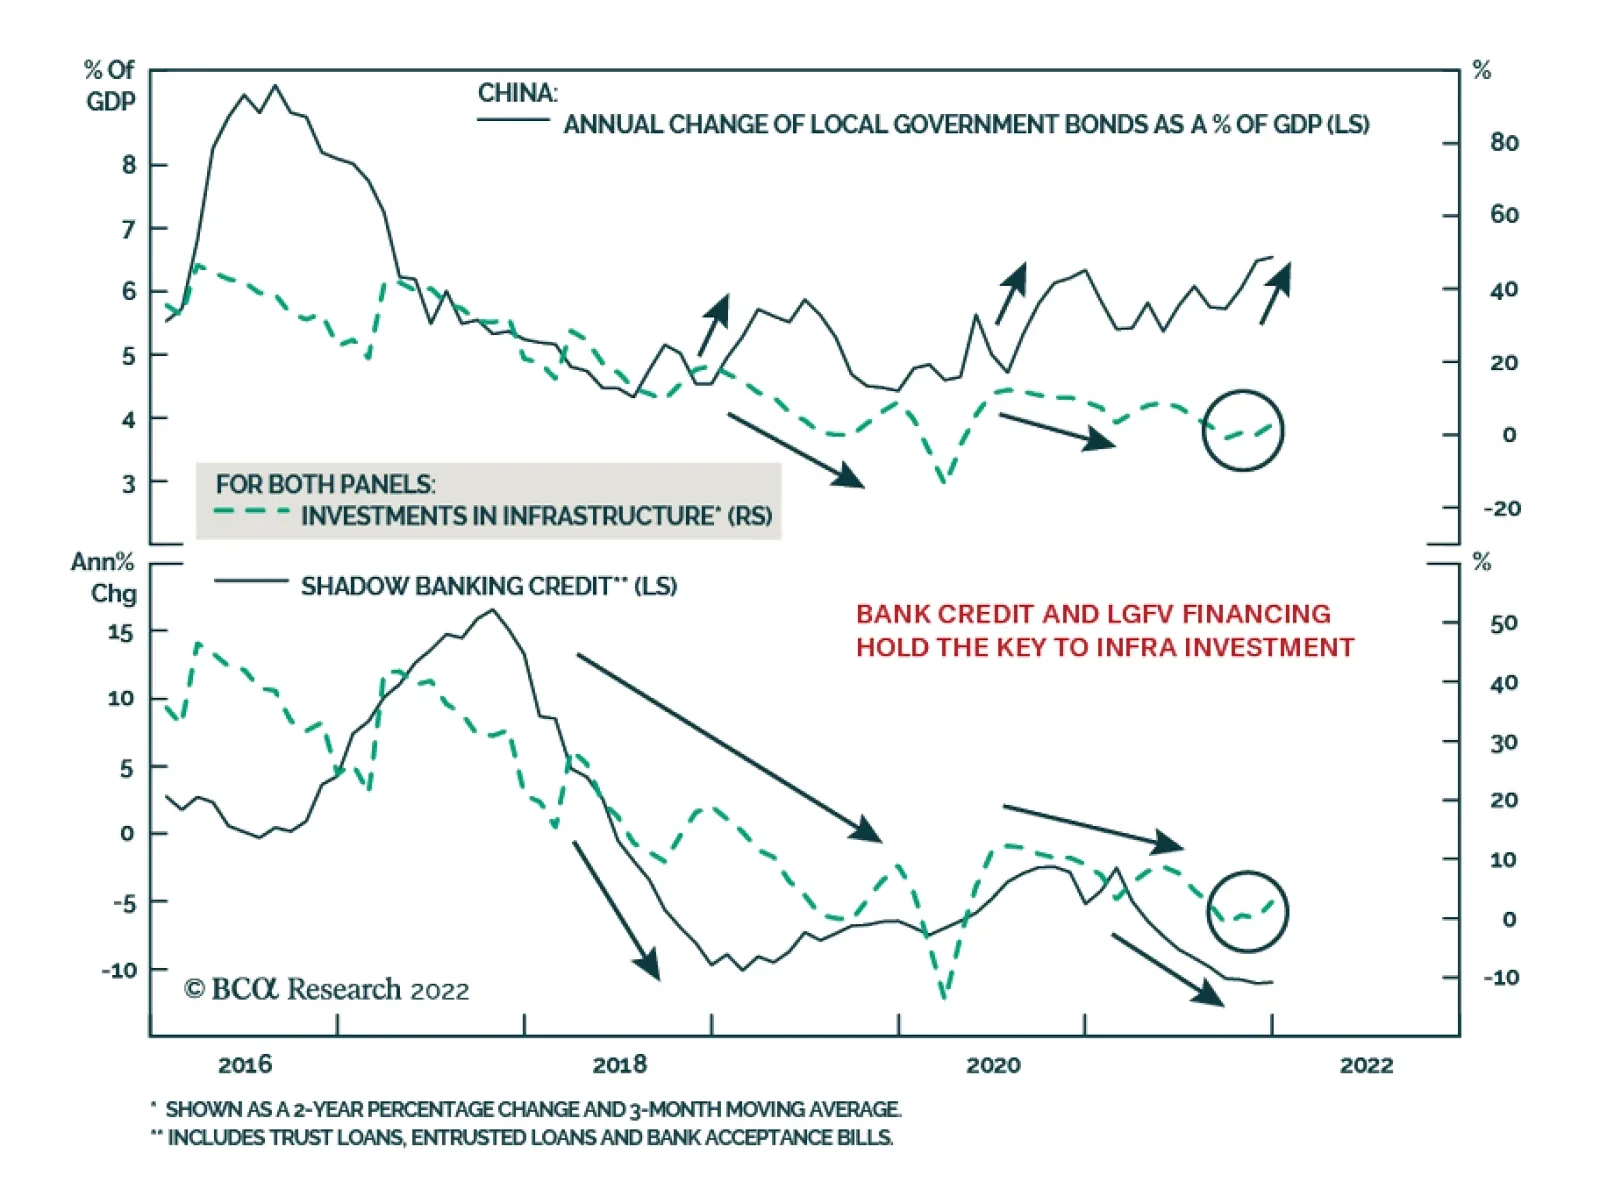
BCA Research’s China Investment Strategy service concludes that proactive fiscal policy will have a limited impact on infrastructure investments this year. The team expects the total SPBs quota for 2022 to be roughly the same as 2021. However, there…