China
With Russia and Ukraine accounting for less than 3% of Chinese exports, the Ukraine conflict is likely to have a limited direct impact on the Chinese economy. Data released on Monday reveal that China’s trade surplus beat expectations in the first two months…
According to BCA Research’s China Investment Strategy service, Russia’s invasion of Ukraine should have a limited direct impact on China’s domestic economy, inflation and monetary policy. Chinese stocks were not immune last week to the global financial…

Executive Summary Chinese Onshore Stocks Are Less Impacted By External Factors
Upgrading Chinese Onshore Stocks To Neutral
Upgrading Chinese Onshore Stocks To Neutral
We are upgrading Chinese onshore stocks from underweight to neutral relative to global stocks. At the same time, we are closing our tactical trade of long Chinese investable stocks/short global stocks. In the near term, Russia’s armed invasion of Ukraine will spark a further selloff in global risk assets. Volatility in Chinese onshore stock prices will remain high; A-share prices in absolute terms may also drop but should fall by less than their peers in European and emerging markets. On the other hand, Chinese offshore stocks are more vulnerable to geopolitical risks compared with their onshore counterparts. There are tentative signs that home prices may be stabilizing, although demand for housing remains in deep contraction. Chinese policymakers remain vigilant in preventing the property market from overheating and credit creation from overshooting. However, the ongoing Russia/Ukraine incursion has the potential to catalyze a larger stimulus package in China. If the escalating geopolitical crisis threatens the global economy, China’s authorities will likely strengthen policy supports at home to buttress the country’s domestic political, economic and financial conditions. Bottom Line: Chinese onshore stocks will weather the ongoing geopolitical storm better than their offshore and global peers. China’s economy is also less negatively impacted by the Russia/Ukraine hostilities. If the crisis deepens, China’s leadership will likely step up measures to support its economy and ensure stable domestic financial and political dynamics. Feature The conflict between Russia and Ukraine unnerved global financial markets in the past few weeks. Chinese offshore stocks were not insulated from the geopolitical event; the MSCI China Index declined by about 4% in February, in-line with the selloff in global stocks. Chart 1Chinese Onshore Financial Markets Held Up Relatively Well Last Month
Chinese Onshore Financial Markets Held Up Relatively Well Last Month
Chinese Onshore Financial Markets Held Up Relatively Well Last Month
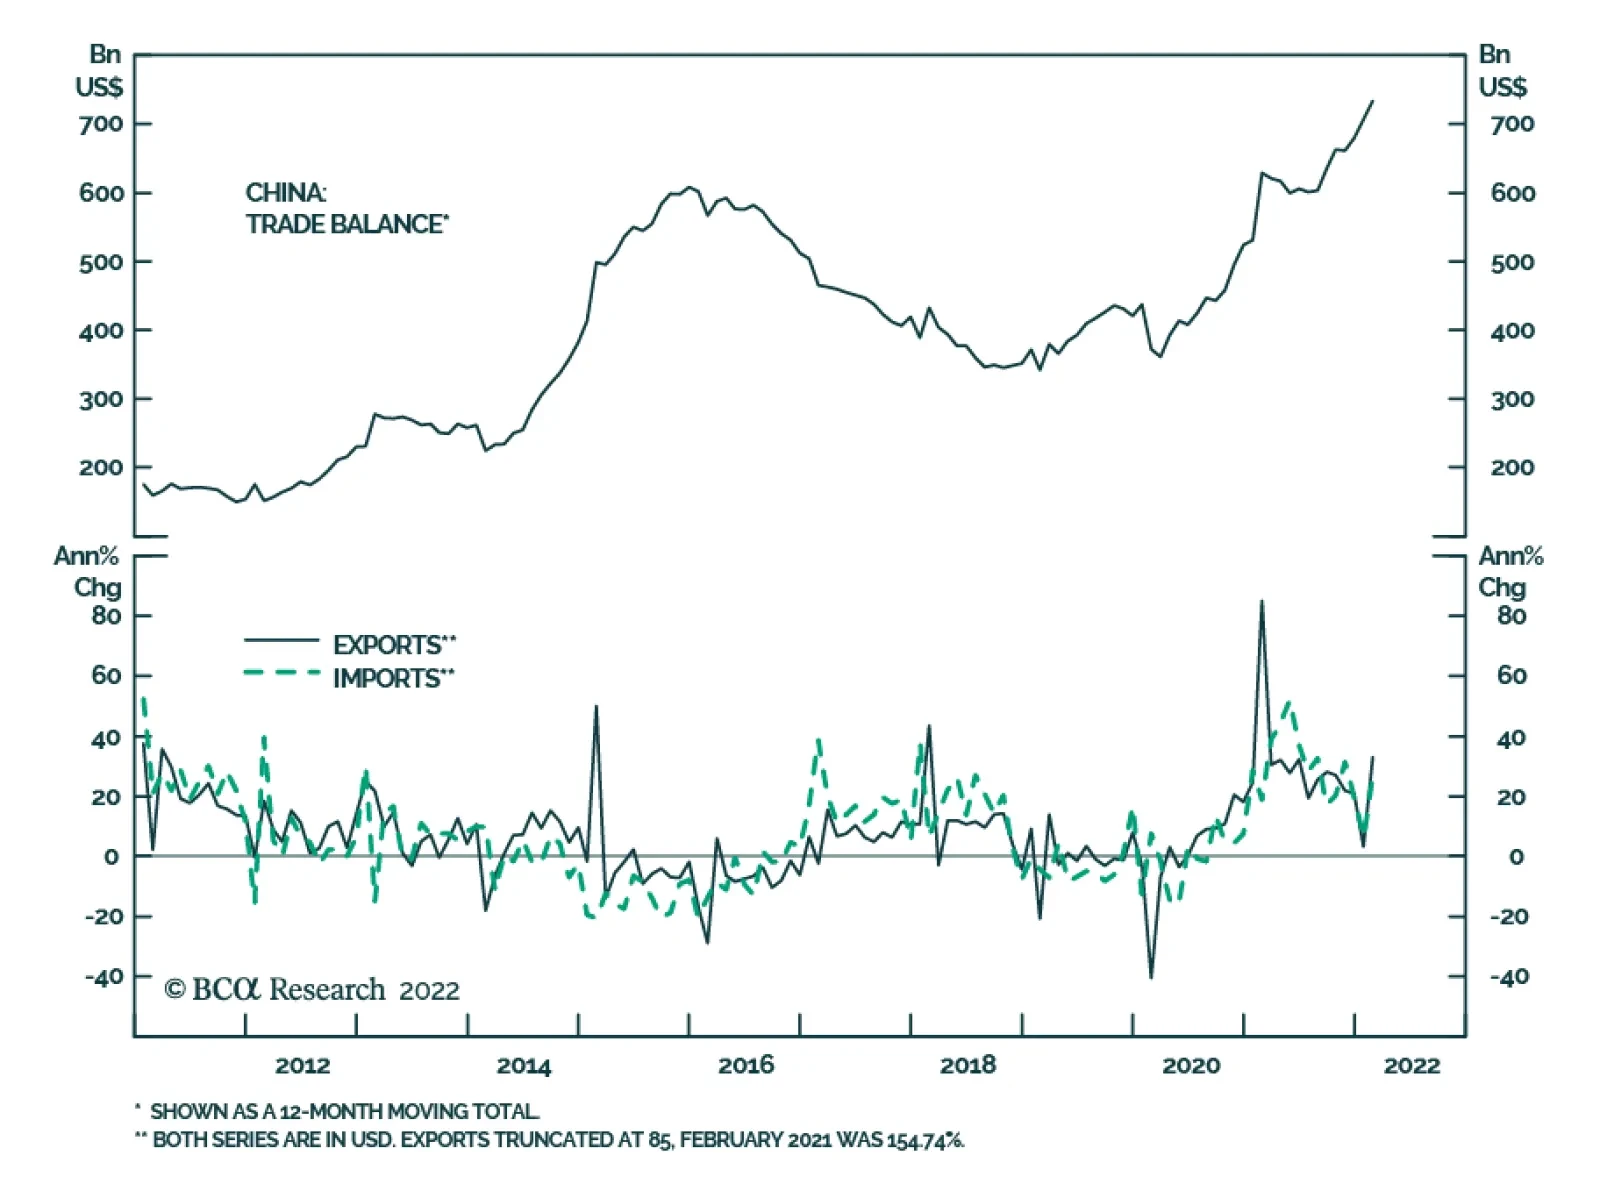
The current global geopolitical environment, however, has turned us a bit more positive on Chinese onshore stocks in relative terms. In the near term, the onshore market should hold up better than its offshore and European counterparts. China’s closed capital market prevents panic capital outflows and its large current account surplus as well as favorable real interest rate differentials help to maintain strength in the RMB (Chart 1). On a cyclical basis, China’s domestic economic fundamentals will continue to drive prices in the A-share market. China’s aggregate economy is less affected by the Russia/Ukraine conflict than Europe. Energy supplies from Russia to China will likely continue and may even accelerate, mitigating the risks of energy shock-induced inflation spikes. As such, we are upgrading Chinese onshore stocks from underweight to neutral in a global portfolio, both in tactical and cyclical time horizons. We remain cautious about the size of Chinese stimulus for the year and, therefore, are neutral in our cyclical view on Chinese onshore stocks relative to global equities. Despite some nascent signs of reflation and an easing of housing policy in a few Chinese cities, aggregate property demand remains weak and overall policy easing in the sector has been marginal. Nonetheless, the situation surrounding Ukraine and the global sanctions against Russia are highly fluid and may provide some ground for Chinese policymakers to ramp up stimulus at home. If the conflict intensifies and derails the European/global economy, Beijing will be more inclined to adopt measures to ensure the stability of its domestic economy, financial markets and political dynamics. Meanwhile, we are closing our long MSCI China/short MSCI global tactical trade. Chinese offshore stocks are more vulnerable to geopolitical tensions and risk-off sentiment among global investors. The Russia Incursion Has Limited Direct Impact On China’s Economy Chinese stocks were not immune last week to the global financial market’s gyrations triggered by Russia’s invasion of Ukraine. While Russia’s attack on its neighbor will create short-term disruptions on the prices of global commodities and China’s A-shares, the cyclical performance of Chinese onshore stocks is tied to the country’s domestic economic fundamentals. The military conflict between Russia and Ukraine should have a limited knock-on effect on China’s business cycle dynamics for the following reasons: Russia and Ukraine together account for less than 3% of Chinese total exports as of 2021, limiting the negative impact from reduced demand in the region on China’s current account balance. Chart 2Ukraine: China’s Major Source Of Agricultural Commodity Supplies
Upgrading Chinese Onshore Stocks To Neutral
Upgrading Chinese Onshore Stocks To Neutral
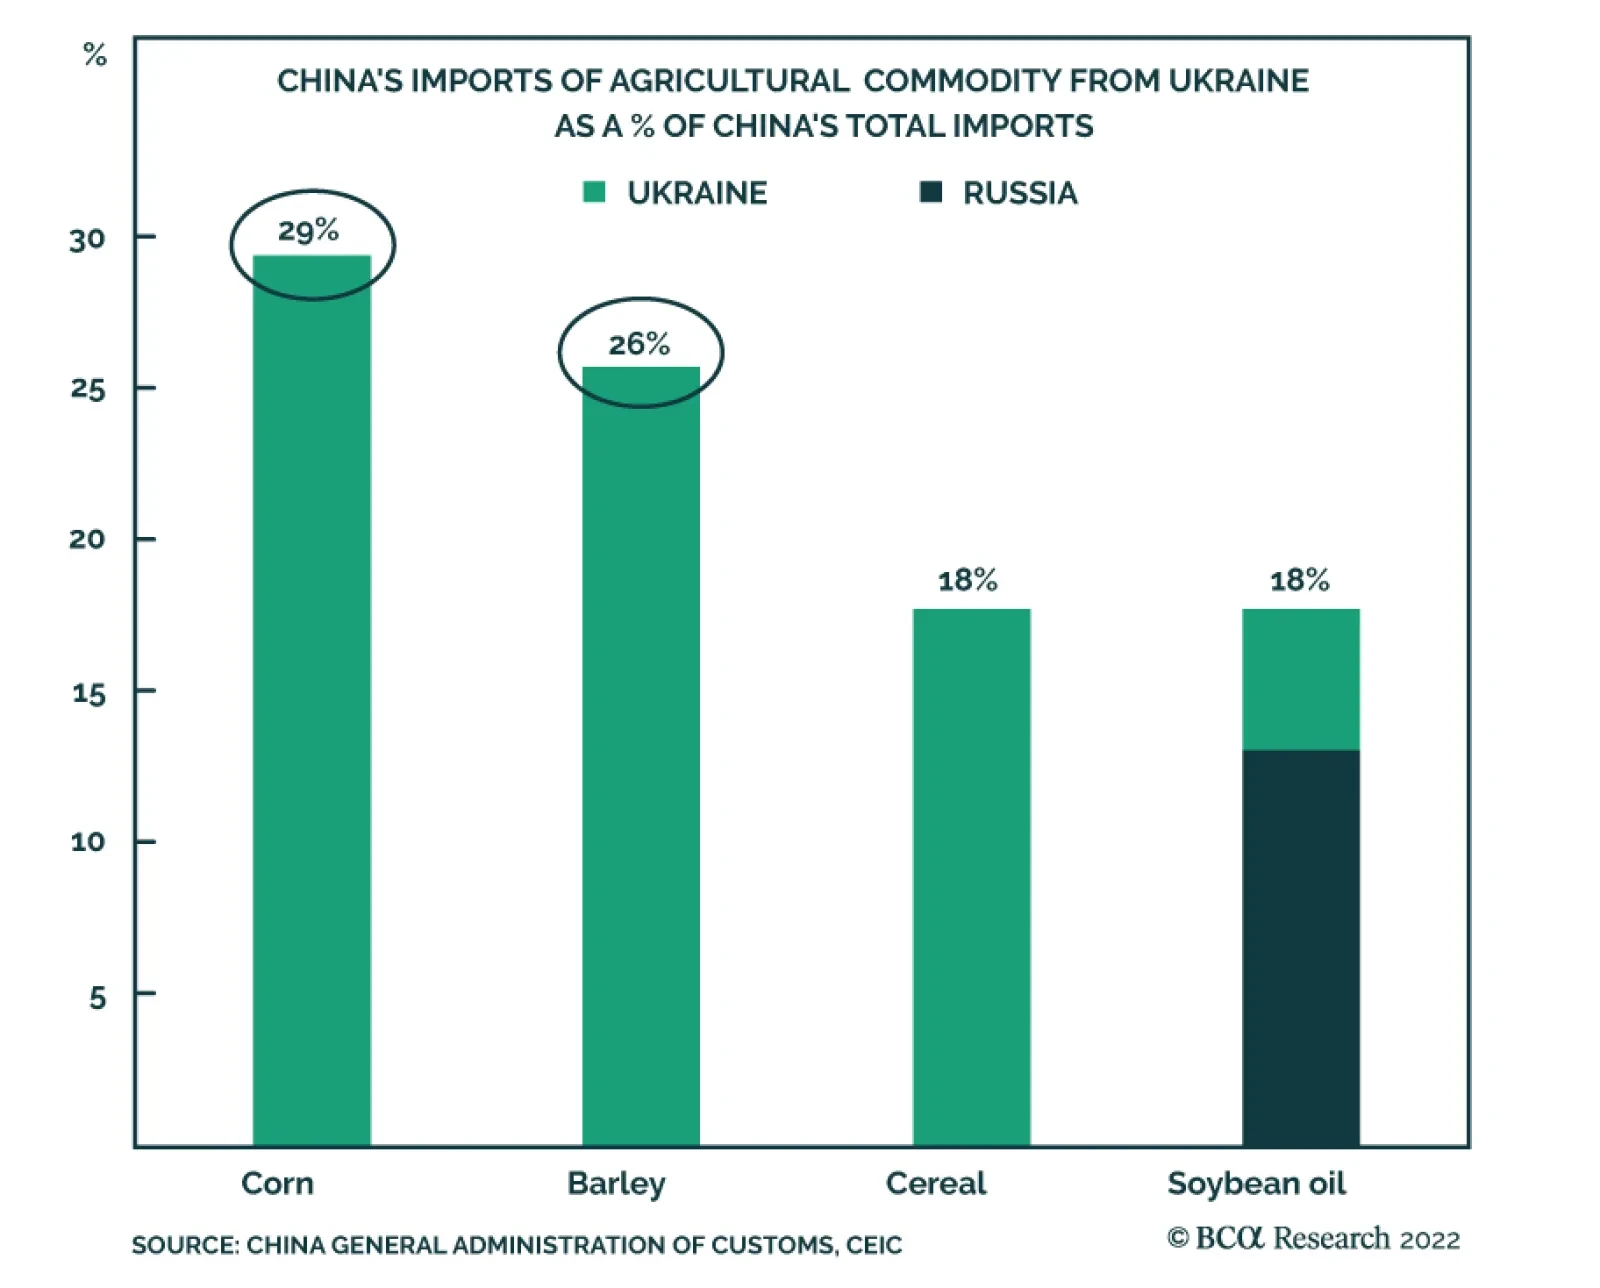
Russia’s incursion of Ukraine may have consequences on China’s food prices. Ukraine is a major agricultural commodity exporter to China, hence a prolonged military conflict may disrupt agricultural supplies and push up imported food prices in China (Chart 2). In this scenario, we expect that Beijing will provide subsidies to ease pressures on domestic food prices due to supply shocks, rather than tighten monetary policy to reduce demand. China is unlikely to experience shocks linked to possible energy disruptions. Russia is a core exporter of energy to China and supplies of crude oil, natural gas and coal have increased in recent years (Chart 3). We do not expect that Russia’s energy supply to China will be disrupted. Indeed, following the 2014 Russia’s invasion of Crimea, Russia’s crude oil exports to China increased by 40% (Chart 3, top panel). We anticipate that oil prices will fall from the current level in the second half of the year, limiting the upshot from higher oil prices on Chinese inflation. So far, the US and EU have announced tough sanctions on Russia’s non-energy sectors, but they have avoided halting Russia’s energy exports. In the unlikely scenario that energy flows from Russia to Europe are disrupted in any meaningful and long-lasting way, either through European sanctions or a Russian embargo, Russia would probably turn to China to absorb its energy exports. Given that Russia cannot easily replace Europe with any other alternative market, particularly natural gas, China would gain an upper hand in price negotiations with the Russians (Chart 4). Thus, a steady supply of cheap natural gas and other forms of energy would be a net positive for China’s economy. Chart 4Russia Cannot Easily Replace Europe With Any Alternative Consumer Other Than China
Upgrading Chinese Onshore Stocks To Neutral
Upgrading Chinese Onshore Stocks To Neutral
Chart 3Russia's Ties With China On Energy Supplies Will Likely Strengthen
Russia's Ties With China On Energy Supplies Will Likely Strengthen
Russia's Ties With China On Energy Supplies Will Likely Strengthen
Meanwhile, oil’s current price spike may widen the gap in profits between China’s upstream and downstream industrial enterprises (Chart 5). However, the effect from higher oil prices on Chinese downstream manufacturers should be temporary. Our Commodity and Energy Strategists believe that the Russian invasion will prompt increased production from core OPEC producers. These production increases would reduce prices from last week’s $105 per barrel level to $85 per barrel by the second half of 2022 and keep it at that level throughout 2023 (Chart 6). Chart 6Crude Oil Price Risk Premium Will Abate But Not Disappear
Crude Oil Price Risk Premium Will Abate But Not Disappear
Crude Oil Price Risk Premium Will Abate But Not Disappear
Chart 5Rising Oil Prices May Temporarily Widen Profit Gaps Between China's Up- And Downstream Industries
Rising Oil Prices May Temporarily Widen Profit Gaps Between China's Up- And Downstream Industries
Rising Oil Prices May Temporarily Widen Profit Gaps Between China's Up- And Downstream Industries
Bottom Line: Russia’s invasion of Ukraine should have a limited direct impact on China’s domestic economy, inflation and monetary policy. Tentative Signs Of Home Price Stabilization Although the property market is showing some signs of improvement, the aggregate demand for homes remains very sluggish. Recently released housing data in China show some slight progress, as fewer cities reported a month-on-month drop in new home prices in January (Chart 7). The monthly average new home prices among China’s 70 cities were broadly flat last month following four consecutive months of falling prices. Tier 1 and Tier 2 cities had the largest increases in home prices, whereas prices in other regions continued to contract through January, albeit to a lesser degree (Chart 7, bottom panel). The minor improvement in home prices reflects recently implemented measures to help shore up the flagging market. Last month, the PBoC cut the policy rate by 10 bps and reduced the one- and five-year loan prime rates by 10 bps and 5 bps, respectively. Moreover, last week several regional banks lowered the down payments on mortgages for homebuyers. Chart 8...Demand For Housing Remains In Deep Contraction
...Demand For Housing Remains In Deep Contraction
...Demand For Housing Remains In Deep Contraction
Chart 7Although There Are Some Early Signs Of Stabilization In Home Prices...
Although There Are Some Early Signs Of Stabilization In Home Prices...
Although There Are Some Early Signs Of Stabilization In Home Prices...
Nonetheless, the aggregate demand for housing remains weak. China’s 100 largest developers experienced a roughly 40% year-on-year plunge in total sales in January, indicating that recent easing measures failed to revive the downbeat sentiment among homebuyers (Chart 8). Bottom Line: Policymakers will remain vigilant in not inducing another surge in house prices and will continue to target steady home prices. As such, it is too early to upgrade our cyclical view on China’s property market, stimulus and economic recovery. Investment Conclusions We are upgrading Chinese onshore stocks to neutral relative to global equities (both tactically and in the next 6 to 12 months), while closing our tactical trade of long MSCI China/short MSCI global index. Chart 9Chinese Onshore Stock Prices Are Largely Driven By Domestic Rather Than External Factors...
Chinese Onshore Stock Prices Are Largely Driven By Domestic Rather Than External Factors...
Chinese Onshore Stock Prices Are Largely Driven By Domestic Rather Than External Factors...
Given the limited impact of the Russia/Ukraine conflict on China’s domestic economy and the low correlation to the global equity index, Chinese onshore stock prices may also fall in absolute terms in the coming weeks, but not by as much as their offshore and European counterparts (Chart 9). Furthermore, while we maintain a cautious cyclical outlook for China’s stimulus, the ongoing geopolitical crisis has the potential to provide a catalyst for Chinese policymakers to stimulate the domestic economy more forcefully. If the clash evolves into a real risk to the European economy and global financial markets, odds are high that Chinese policymakers will step up stimulus measures to ensure domestic stability. In this scenario, Chinese onshore stocks will likely outperform global equities. In the past, Chinese authorities refrained from a credit overshoot when the business cycle slowed in an orderly manner, but they stimulated substantially following an exogenous shock. For example, China rolled out massive stimulus packages after the 2008 Global Financial and the 2011/12 European credit crises. Beijing did not directly respond to Russia’s 2014 annexation of Crimea with additional monetary support to China’s domestic economy. However, the Chinese authorities started to aggressively stimulate when a collapse in domestic demand coincided with a global manufacturing recession in 2015. Chart 10...Whereas Chinese Offshore Stocks Are More Vulnerable To Global Risk-Off Sentiment
...Whereas Chinese Offshore Stocks Are More Vulnerable To Global Risk-Off Sentiment
...Whereas Chinese Offshore Stocks Are More Vulnerable To Global Risk-Off Sentiment
The PBoC’s outsized liquidity injection in the interbank system last Friday is also a sign that Beijing is willing to accelerate policy easing if the geopolitical backdrop meaningfully worsens. Regarding Chinese investable stocks, we maintain our cyclical underweight stance relative to global equities. In the near term, risk-off sentiment among global investors will undermine the performance of Chinese offshore stocks in both absolute and relative terms (Chart 10). Over a longer time horizon (6 to 12 months), growth stocks will likely underperform value stocks when global stocks recover. Thus, the tech-heavy MSCI China Index is less attractive to investors compared with other emerging and developed market equities that are more value-centric. Jing Sima China Strategist jings@bcaresearch.com Strategic Themes Cyclical Recommendations Tactical Recommendations
Executive Summary Wars Don’t Usually Affect Markets For Long
Monthly Portfolio Update: Keep Calm And Stay Invested
Monthly Portfolio Update: Keep Calm And Stay Invested
We expect the war in Ukraine to stay within its borders, and therefore to have little impact on global growth. Markets will be volatile, but we recommend allocators stay invested – with some moderate hedges in place. The Fed won’t tighten as fast as markets expect, and US long rates will not rise much further this year. So, within fixed-income, we raise government bonds to neutral. Flat rates remove a positive for the Financials equity sector, which we lower to neutral. The oil price will fall back to $85 by the second half, as Saudi and others increase supply. We reduce our recommendation for Canadian equities and the CAD. Recommendation Changes
Monthly Portfolio Update: Keep Calm And Stay Invested
Monthly Portfolio Update: Keep Calm And Stay Invested
Bottom Line: Stay invested in risk assets, but have some hedges. We shift from Financials to the defensive-growth IT sector, raise our weight in UK equities, and suggest long positions in cash, CHF and JPY. Recommended Allocation
Monthly Portfolio Update: Keep Calm And Stay Invested
Monthly Portfolio Update: Keep Calm And Stay Invested
The war in Ukraine is likely to have only a limited impact on markets beyond the short term. As disturbing as the human tragedy is, Russia’s aims are limited to regime change in Kyiv. The European Union and US face restraints on how draconian sanctions against Russia can be, balking (so far at least) at blocking imports of Russian energy to the EU, given how much this would hurt the economy. The risk of the conflict spreading beyond Ukraine’s borders is low, limited perhaps to cyberattacks on Western targets. A Russian attack on a NATO member, such as Poland or one of the Baltic states, is extraordinarily unlikely – though Moldova and Georgia (not NATO members) might be more vulnerable at some point in the future. For more detailed analysis, please read the two reports on the Ukraine situation by our Geopolitical Service that we have made available to all BCA Research subscribers.1 Asset allocators need to look at these events dispassionately. Markets are likely to remain volatile over the coming months, as events in Ukraine unfold. But the lesson of most major conflicts is that they typically do not have a long-lasting impact on asset performance (Chart 1). There is little chance that the Ukraine war will significantly dent global growth. The only exception would be if the oil price were to rise much further to, say, $120 a barrel as some are forecasting. Certainly, in the past, a jump in the oil price has often been associated with recessions – even though the causality is unclear (Chart 2). But BCA’s Energy strategists expect to see an increase in oil supply by Saudi Arabia and Gulf states which will bring Brent crude back to $85 by the second half (from $98 now). Chart 1Wars Don't Usually Affect Markets For Long
Wars Don't Usually Affect Markets For Long
Wars Don't Usually Affect Markets For Long
Chart 2But A Jump In Oil Prices Would
But A Jump In Oil Prices Would
But A Jump In Oil Prices Would
Meanwhile, global growth remains robust, with all major economies expected to continue to grow well above trend this year, supported by robust consumption and capex (Chart 3). And sentiment towards equities has turned very pessimistic since the start of the year, with indicators such the US Association of Individual Investors’ weekly survey at its most bearish level since 2008 (Chart 4). These sort of sentiment levels have typically pointed to a rebound in risk assets. Chart 4Sentiment Is At Rock-Bottom
Sentiment Is At Rock-Bottom
Sentiment Is At Rock-Bottom
Chart 3Economic Growth Still Above Trend
Monthly Portfolio Update: Keep Calm And Stay Invested
Monthly Portfolio Update: Keep Calm And Stay Invested
Our advice now would be to stay invested, but with some moderate safe-haven hedges in place – largely as we have recommended since late last year. We continue to recommend an overweight in cash, but will look to allocate this to risk assets when it becomes clearer how the situation in Ukraine will pan out. The trajectory of markets over the rest of this year still largely comes down to what the Fed and other central banks will do. The hawkish turn by the Fed in December has been the driver of markets in the past two months, with the result that none of the major asset classes have produced positive returns year to-date – only inflation hedges such as commodities and gold (Chart 5). Chart 5Most Asset Classes Are Down Year-To-Date
Monthly Portfolio Update: Keep Calm And Stay Invested
Monthly Portfolio Update: Keep Calm And Stay Invested
The futures market is pricing the Fed to raise rates seven times over the next 12 months, the fastest rate of predicted tightening since the early 2000s (Chart 6). We think that is a little excessive. Inflation, as we have argued previously, is likely to fade over the coming quarters, as the supply response to strong consumer demand for manufactured goods brings down the price of cars, semiconductors, shipping and other major items. The Fed may well start in March with the intention of raising rates by 25bps every meeting, but the slowing of inflation we expect, and the tightening of financial conditions already under way (Chart 7), make it unlikely that it will continue at that pace. And remember that Fed policy will need to be even more hawkish than the market is currently pricing in for it to have an incrementally negative impact on risk assets. Chart 6Market Believes Fed Will Hike Fast
Market Believes Fed Will Hike Fast
Market Believes Fed Will Hike Fast
Chart 7Financial Conditions Have Already Tightened
Financial Conditions Have Already Tightened
Financial Conditions Have Already Tightened
There are certainly risks to this scenario. The forward yield curve is pointing to inversion one year ahead, something which normally presages recession over the following 1-3 years (Chart 8). Higher prices are starting to hurt consumer confidence, though there is a big disparity between the two main US indicators (Chart 9). Chart 8Will Yield Curve Invert Within A Year?
Will Yield Curve Invert Within A Year?
Will Yield Curve Invert Within A Year?
Chart 9Inflation May Be Hurting Consumer Confidence
Inflation May Be Hurting Consumer Confidence
Inflation May Be Hurting Consumer Confidence
What all this boils down to is how high a level of interest rates the economy is able to withstand. The futures markets imply that, in most countries, central banks will raise rates aggressively this year, but then be forced to stop or even cut rates after that because their actions cause an economic slowdown (Table 1). Our view is that the terminal rate is much higher than what is priced by markets and projected by central banks: In the US perhaps 3-4% in nominal terms.2 Even with seven Fed hikes over the next year, the policy rate would therefore remain well below neutral – an environment in which historically equities have outperformed bonds (Chart 10). Table 1Central Banks Will Hike Aggressively – But Then Stop Soon
Monthly Portfolio Update: Keep Calm And Stay Invested
Monthly Portfolio Update: Keep Calm And Stay Invested
Chart 10Even In A Year, Rates Will Be Well Below Neutral
Even In A Year, Rates Will Be Well Below Neutral
Even In A Year, Rates Will Be Well Below Neutral
One final comment: On long-term returns. As a result of the recent moderate equity correction, strong earnings growth, and higher long-term rates, the outlook is somewhat rosier than when we published our most recent report on Return Assumptions in May 2021 – though admittedly forward long-term returns are still likely to be lower than over the past 20 years (Table 2). This is not, then, a time to turn defensive. Table 2Long-Term Return Outlook No Longer Looks So Gloomy
Monthly Portfolio Update: Keep Calm And Stay Invested
Monthly Portfolio Update: Keep Calm And Stay Invested
Fixed Income: In the short-term, government bonds look oversold (Chart 11). With inflation set to peak and the Fed likely to be less hawkish than the market has priced in, we do not see the 10-year US Treasury yield rising more than another 25 basis points or so above its current level this year. Accordingly, we are changing our duration call from underweight to neutral, and raise our recommendation for government bonds within the (still underweight) fixed-income bucket to neutral. For more cautious investors, a slight increase in government bond holdings might be warranted. Within credit, investment-grade bonds still offer little pickup, despite the moderate rise in spreads this year (from 92 to 121 in the US, for example), and so we lower this asset class to underweight. We continue to prefer high-yield bonds, which in the US now imply a jump in the default rate from 1.2% over the past 12 months to 4.5% over the coming year (Chart 12). As long as the economy grows in line with our expectations, that is very unlikely. Chart 11Government Bonds Look Oversold
Government Bonds Look Oversold
Government Bonds Look Oversold
Chart 12Will Defaults Really Jump This Much?
Will Defaults Really Jump This Much?
Will Defaults Really Jump This Much?
Equities: With the economy continuing to grow above-trend, global earnings should remain robust. This will not be a classic year for equity returns, but we expect them to do better than bonds. We continue to prefer US over European equities. As was seen in the aftermath of the invasion of Ukraine, US stocks are more defensive, and European growth will continue to be under threat from higher energy prices (Chart 13). We also move our recommended portfolio a little in the defensive direction by going overweight UK equities (which have a particularly high weight in defensive growth sectors, such as a 13 point overweight in Consumer Staples); we fund this by lowering Canadian equities to underweight, given their close linkage with oil (Chart 14), and the vulnerability of the Canadian housing market to rising rates. We remain underweight EM, but Chinese stocks (which were very oversold in late 2021) have been a relative safe haven as China started to stimulate, and so we continue with our neutral position for now. Chart 13Higher Energy Prices Threaten Europe
Higher Energy Prices Threaten Europe
Higher Energy Prices Threaten Europe
Chart 14Canadian Stocks Move With The Oil Price
Canadian Stocks Move With The Oil Price
Canadian Stocks Move With The Oil Price
Chart 15Financials Not So Attractive If Rates Don't Rise
Financials Not So Attractive If Rates Don't Rise
Financials Not So Attractive If Rates Don't Rise
Our view that long-term rates have limited upside this year makes us more cautious on Financials stocks, which are closely correlated with rates, and so we cut this sector to neutral (Chart 15). A period of slowing growth points towards a preference for defensive growth, and so we raise our recommended weight in the IT sector to overweight from neutral. It is tempting to think of this sector as being composed of ridiculously overvalued speculative internet names, but it is in fact dominated by established hardware and software titans with deep competitive moats (Table 3). While the sector is not exactly cheap, its risk premium over bonds is quite reasonable by historical standards (Chart 16). Table 3Tech Sector Is Not Made Up Of Speculative Stocks
Monthly Portfolio Update: Keep Calm And Stay Invested
Monthly Portfolio Update: Keep Calm And Stay Invested
Chart 16Tech Is Not Unreasonably Priced
Tech Is Not Unreasonably Priced
Tech Is Not Unreasonably Priced
Chart 17Relative Rates Suggest Some Upward Pressure On USD
Relative Rates Suggest Some Upward Pressure On USD
Relative Rates Suggest Some Upward Pressure On USD
Currencies: A neutral position on the US dollar still makes sense. Short-term rates are likely to rise somewhat faster in the US, relative to expectations, than in Europe or Japan (Chart 17). Nevertheless, the USD is expensive, and long-dollar is a consensus trade – reasons why the dollar has risen by less than 1% year-to-date on a trade-weighted basis, despite all the higher rate expectations and geopolitical shocks. Investors looking for hedges against downside risk might look to the Japanese yen, which is particularly cheap, and the Swiss franc. By contrast, the Canadian dollar, like Canadian equities, is closely linked to the oil price and a fallback in the Brent price would be negative; we move underweight. We also raise the CNY to neutral, since it may become a safe haven currency in the current geopolitical situation, though the Chinese authorities won’t let it rise too much since that would slow the economy. Commodities: China’s stimulus remains somewhat halfhearted (Chart 18). Although the credit and fiscal impulse has bottomed, we expect to see it rebound only moderately, with just minor cuts in interest rates and the reserve ratio. This will stabilize Chinese growth, but not cause a boom as in 2020, 2016 or 2013. The rise in industrial commodities prices, therefore, is likely to be limited from here. For oil, as mentioned above, we expect to see Brent crude return to around $85 by the second half, as new supply comes onto the market. Gold has done well, as expected, in the face of a major geopolitical event. But it is expensive by historical standards, vulnerable to a rise in real (as opposed to nominal rates) as inflation eases (Chart 19), and faces cryptocurrencies as a rival. We keep our neutral, as a hedge against the tail-risk of much higher inflation, but would not chase the price at this level. Chart 18China's Stimulus Isn't Enough To Help Metals Prices
China's Stimulus Isn't Enough To Help Metals Prices
China's Stimulus Isn't Enough To Help Metals Prices
Chart 19Rising Real Rates Are Negative For Gold
Rising Real Rates Are Negative For Gold
Rising Real Rates Are Negative For Gold
Garry Evans, Senior Vice President Global Asset Allocation garry@bcaresearch.com Footnotes 1 Please see Geopolitical Strategy Special Reports, “Russia Takes Ukraine: What Next?” dated February 24, 2022, and "From Nixon-Mao To Putin-Xi," dated February 25, 2022. 2 Please see Global Investment Strategy, “The New Neutral” dated January 14, 2022. Recommended Asset Allocation Model Portfolio (USD Terms)
Executive Summary Hopes of an imminent peace deal between Russia and Ukraine will be dashed. The conflict will worsen over the coming days. As was the case during the original Cold War, both sides will eventually forge an understanding that allows the pursuit of mutually beneficial arrangements. A stabilization in geopolitical relations, coupled with fading pandemic headwinds, should keep global growth above trend this year, helping to support corporate earnings. The era of hyperglobalization is over. While central banks will temper their plans to raise rates in the near term, increased spending on defense and energy independence will lead to higher interest rates down the road. How Stocks Fared During The Cuban Missile Crisis
How Stocks Fared During The Cuban Missile Crisis
How Stocks Fared During The Cuban Missile Crisis
Bottom Line: The near-term outlook for risk assets has deteriorated. We are downgrading global equities from overweight to neutral on a tactical 3-month horizon. We continue to expect stocks to outperform bonds on a 12-month horizon as the global economic recovery gains momentum. On an even longer 2-to-5-year horizon, equities are likely to struggle as interest rates rise more than expected. Dear Client, Given the rapidly evolving situation in Ukraine, we are sending you our thoughts earlier than normal this week. We will continue to update you as events warrant it. Best regards, Peter Berezin Chief Global Strategist False Dawn In the lead-up to the invasion, Vladimir Putin assumed that Ukrainian forces would fold just as quickly as US-backed Afghan forces did last summer. He also presumed that the rest of the world would reluctantly accept Russia’s takeover of Ukraine. Both assumptions appear to have been proven wrong. Even if Putin succeeds in installing a puppet government in Kyiv, a protracted insurgency is sure to follow. In the initial days of the invasion, Russian troops generally tried to avoid harming civilians, partly in the hope that Ukrainians would see the Russian military as liberators. Now that this hope has been dashed, a more brutal offensive could unfold. This would trigger even more sanctions, leading to a wider gulf between Russia and the West. It is highly doubtful that sanctions will dissuade Putin from trying to subdue Ukraine. Putin made a name for himself by staging a successful invasion of Chechnya in 1999, just three years after the Yeltsin government had suffered a major defeat there. To withdraw from Ukraine now, without having fomented a regime change in Kyiv, would be a humiliating outcome for him. In this light, BCA’s geopolitical team, led by Matt Gertken, has argued that ongoing peace talks taking place on the border of Ukraine and Belarus are unlikely to amount to much. The situation will get worse before it gets better. Market Implications It always feels a bit crass writing about finance during times like this, but as investment strategists, it is our job to do so. With that in mind, we would make the following observations: Global equities are likely to suffer another leg down in the near term as hopes of an imminent peace deal fizzle. Consequently, we are downgrading our view on global stocks from overweight to neutral on a 3-month horizon. Nimble investors with a low risk tolerance should consider going underweight equities. We are shifting our stance on US stocks from underweight to neutral on a 3-month horizon. Europe could face significant pressures from near-term disruptions to Russian gas supplies. It does not make much sense for Russia to export gas if it is effectively barred from accessing the proceeds of its sales. Central and Eastern Europe will be particularly hard hit (Chart 1). Chart 1Central and Eastern Europe Would Suffer The Most From A Russian Energy Blockade
A New Cold War
A New Cold War
For now, we are maintaining an overweight to stocks on a 12-month horizon. While it will take a month or two, both sides will ultimately forge an understanding whereby Russia and the West continue to publicly bad-mouth each other while still pursuing mutually beneficial arrangements. Remember that during the Cold War, the Soviet Union continued to sell oil to the West. Even the Cuban Missile Crisis had only a fleeting impact on equities (Chart 2). Chart 2How Stocks Fared During The Cuban Missile Crisis
How Stocks Fared During The Cuban Missile Crisis
How Stocks Fared During The Cuban Missile Crisis
Chart 3European Fiscal Policy Will Remain Structurally Looser Over The Coming Years
A New Cold War
A New Cold War
Assuming that any reduction in Russian energy exports is temporary, oil prices will eventually recede. BCA’s commodities team, led by Bob Ryan, expects Brent to settle to $88/bbl by the end of 2022 (down from the current spot price of $101/bbl and close to the forward price of $87/bbl). Like oil, gold prices have upside in the near term but should edge lower once the dust settles. Global growth should remain solidly above trend in 2022 as pandemic-related headwinds fade and fiscal policy turns more expansionary. Even before the Ukraine invasion, the structural primary budget deficit in Europe was set to swing from a small surplus to a deficit (Chart 3). The emerging new world order will lead to sizable additional military spending, as well as increased outlays towards achieving energy independence (new LNG terminals, more investment in renewables, and perhaps even some steps towards restarting nuclear power programs). China will also step up credit easing and fiscal stimulus. This will not only benefit the Chinese economy, but it will also provide some much-needed support to European exporters (Chart 4). While credit spreads are apt to widen further in the near term, corporate bonds should benefit from stronger growth later this year. US high-yield bonds are pricing in a jump in the default rate from 1.3% over the past 12 months to 4.2% over the coming year, which seems somewhat excessive (Chart 5). Chart 4Chinese Policy Will Be A Tailwind For Growth
Chinese Policy Will Be A Tailwind For Growth
Chinese Policy Will Be A Tailwind For Growth
Chart 5Credit Markets Are Pricing In An Excessive Default Rate
Credit Markets Are Pricing In An Excessive Default Rate
Credit Markets Are Pricing In An Excessive Default Rate
Central banks will temper their plans to raise rates in the near term. Investors and speculators are net short duration at the moment, which could amplify any downward move in bond yields (Chart 6). However, over a multi-year horizon, recent events will lead to both higher inflation and interest rates. Larger budget deficits will sap global savings. The retreat from globalization will also put upward pressure on wages and prices. As defensive currencies, the US dollar and the Japanese yen will strengthen in the near term as the conflict in Ukraine escalates. Looking beyond the next few months, the dollar will weaken. On a purchasing power parity basis, the dollar is amongst the most expensive currencies (Chart 7). For example, relative to the euro, the dollar is 22% overvalued (Chart 8). The US trade deficit has doubled since the start of the pandemic, even as equity inflows have dipped (Chart 9). Speculators are long the greenback, which raises the risk of an eventual reversal in dollar sentiment. Chart 6Short Duration Is A Crowded Trade
Short Duration Is A Crowded Trade
Short Duration Is A Crowded Trade
Chart 7The US Dollar Is Overvalued…
A New Cold War
A New Cold War
Chart 8...Especially Against The Euro
A New Cold War
A New Cold War
The freezing of Russia’s foreign exchange reserves will encourage China to diversify away from US dollars towards hard assets such as land and infrastructure in economies where they are less likely to be seized. It will also encourage the Chinese authorities to bolster domestic demand and permit a further modest appreciation of the RMB since these two steps will reduce the current account surpluses that make foreign exchange accumulation necessary. EM currencies will benefit from this trend. Chart 9The Trade Deficit Is A Headwind For The Dollar
The Trade Deficit Is A Headwind For The Dollar
The Trade Deficit Is A Headwind For The Dollar
In summary, the near-term outlook for risk assets has deteriorated. We are downgrading global equities from overweight to neutral on a tactical 3-month horizon. We continue to expect stocks to outperform bonds on a 12-month horizon as the global economic recovery gains momentum. On an even longer 2-to-5-year horizon, equities are likely to struggle as interest rates rise more than expected. Trade Update: We closed our long Brent oil trade for a gain of 24% last week. Earlier today, we were stopped out of the trade we initiated on September 16, 2021 going long the Russian ruble and the Brazilian real. The BRL leg was up 6.2% at the time of termination while the RUB leg was down 23.1% (based on the Bloomberg RUB/USD Carry Return Index as of 4pm EST today). Peter Berezin Chief Global Strategist peterb@bcaresearch.com View Matrix
A New Cold War
A New Cold War
Special Trade Recommendations
A New Cold War
A New Cold War
Current MacroQuant Model Scores
A New Cold War
A New Cold War
On Friday the PBoC boosted liquidity support in the financial system by injecting $45.8 billion through seven-day reverse repo agreements. This is the greatest liquidity injection since September 2020. There are two main reasons why the PBoC typically…

Executive Summary Risk Premium Abates, But Does Not Disappear
Oil Risk Premium Abates, But Still Remains
Oil Risk Premium Abates, But Still Remains
The risk premium in crude oil and natural gas prices is abating, and we expect that to continue. In the immediate aftermath of Russia's invasion, Brent crude oil traded close to $105/bbl on Thursday. At the urging of China's Xi Jinping, Russian President Vladimir Putin suggested he is prepared to enter negotiations with Ukraine in Minsk to discuss the latter's neutrality. Whether Ukraine is amenable to negotiations framed in this manner remains to be seen. Nothing has changed in supply-demand balances for oil or natgas. Markets are tight, and more supply is needed. In this highly fluid situation, we project Brent crude oil will average $100.00/bbl in 1Q22; $90.30/bbl in 2Q22; $85.00/bbl in 3Q22; and $85.00/bbl in 4Q22 (see Chart). Our estimate for 2023 Brent averages $85.00/bbl. Upside risk dominates in the near term. We expect the Kingdom of Saudi Arabia (KSA), the United Arab Emirates (UAE), and Kuwait, the only members of OPEC 2.0 with the capacity to increase and sustain higher production, to lift output by 1.75mm b/d. The Iran nuclear deal likely gets a boost from the Russian invasion, which will hasten the return of ~ 1.0mm b/d of production in 2H22, perhaps sooner. We also expect the US, and possibly the OECD, to release strategic petroleum reserves, but, as typically is the case, this will have a fleeting impact on markets and pricing. These supply increases will return prices closer to our base case forecast, which we raise slightly to $85/bbl from 2H22 to end-2023. If we fail to see an increase in core-OPEC production, or the US shales, or if Iranian barrels are not returned to export markets, oil prices have a good chance of moving to $140/bbl, as can be seen in the accompanying Chart. Bottom Line: We remain long commodity-index exposure (S&P GSCI and the COMT ETF), along with equity exposure to oil and gas producers via the XOP ETF.
Executive Summary From Nixon-Mao To Putin-Xi
From Nixon-Mao To Putin-Xi
From Nixon-Mao To Putin-Xi
The geopolitical “big picture” of Russia’s invasion of Ukraine is the deepening of the Russo-Chinese strategic partnership. While Russia’s economic and military constraints did not prohibit military action in Ukraine, they are still relevant. Most likely they will prevent a broader war with NATO or a total energy embargo of Europe. Still, volatility will persist in the near term as saber-rattling, aftershocks, and spillover incidents will occur this year. Russo-Chinese relations are well grounded. Russia needs investment capital and resource sales, while China needs overland supply routes and supply security. Both seek to undermine the US in a new game of Great Power competition that will prevent global politics and globalization from normalizing. Tactically we remain defensive but buying opportunities are emerging. We maintain a cyclically constructive view. Favor equity markets of US allies and partners that are geopolitically secure. Trade Recommendation Inception Date Return Long Gold (Strategic) 2019-12-06 32.7% Bottom Line: Tactically investors should remain defensive but cyclically they should look favorably on cheap, geopolitically secure equity markets like those of Australia, Canada, and Mexico. Feature To understand the Russian invasion of Ukraine and the likely consequences, investors need to consider three factors: 1. Why Russia’s constraints did not prohibit war and how constraints must always be measured against political will. 2. Why Russia’s constraints will grow more relevant going forward, as the costs of occupation and sanctions take hold, the economy weakens, and sociopolitical pressures build. 3. Why the struggle of the Great Powers will drive a Russo-Chinese alliance, whose competition with the US-led alliance will further destabilize global trade and investment. Russia’s Geopolitical Will Perhaps the gravest national security threat that Russia can face, according to Russian history, is a western military power based in the Ukraine. Time and again Russia has staged dramatic national efforts at great cost of blood and treasure to defeat western forces that try to encroach on this broad, flat road to Moscow. Putin has been in power for 22 years and his national strategy is well-defined: he aims to resurrect Russian primacy within the former Soviet Union, carve out a regional sphere of influence, and reduce American military threats in Russia’s periphery. He has long aimed to prevent Ukraine from becoming a western defense partner. Chart 1Russia Structured For Conflict
From Nixon-Mao To Putin-Xi
From Nixon-Mao To Putin-Xi
While Moscow faced material limitations to military action in Ukraine, these were not prohibitive, as we have argued. Consider the following constraints and their mitigating factors: Costs of war: The first mistake lay in assuming that Russia was not willing to engage in war. Russia had already invaded Ukraine in 2014 and before that Georgia in 2008. The modern Russian economy is structured for conflict: it is heavily militarized (Chart 1). Military spending accounts for 4.3% of GDP, comparable to the United States, also known for waging gratuitous wars and preemptive invasions. Financial burdens: The second mistake was to think that Moscow would avoid conflict for fear of the collapse of the ruble or financial markets. Since Putin rose to power in 2000, the ruble has depreciated by 48% against the dollar and the benchmark stock index has fallen by 57% against EMs. Each new crackdown on domestic or foreign enemies has led to a new round of depreciation and yet Putin remains undeterred from his long-term strategy (Chart 2). Chart 2Putin Doesn't Eschew Conflict For Sake Of Ruble Or Stocks
Putin Doesn't Eschew Conflict For Sake Of Ruble Or Stocks
Putin Doesn't Eschew Conflict For Sake Of Ruble Or Stocks
Economic health: Putin’s foreign policy is not constrained by the desire to make the Russian economy more open, complex, advanced, or productive. While China long practiced a foreign policy of lying low, so as to focus on generating wealth that could later be converted into strategic power (which it is doing now), Russia pursued a hawkish foreign policy for the past twenty years despite the blowback on the economy. Russia is still an undiversified petro-state and total factor productivity is approaching zero (Chart 3). Chart 3Putin Doesn't Eschew Conflict For Sake Of Productivity
Putin Doesn't Eschew Conflict For Sake Of Productivity
Putin Doesn't Eschew Conflict For Sake Of Productivity
Chart 4Putin Doesn’t Eschew Conflict For Fear Of Sanctions
From Nixon-Mao To Putin-Xi
From Nixon-Mao To Putin-Xi
Western sanctions: Western sanctions never provided a powerful argument against Russian intervention into Ukraine. Russia knew all along that if it invaded Ukraine, the West would impose a new round of sanctions, as it has done periodically since 2014. The 2014 oil crash had a much greater impact on Russia than the sanctions. Of course, Russia’s overall economic competitiveness is suffering, although it is capable of gaining market share in exporting raw materials, especially as it depreciates its currency (Chart 4). Chart 5Putin Doesn't Eschew Conflict For Sake Of Popular Opinion
Putin Doesn't Eschew Conflict For Sake Of Popular Opinion
Putin Doesn't Eschew Conflict For Sake Of Popular Opinion
Public opinion: Surely the average Russian is not interested in Ukraine and hence Putin lacks popular support for a new war? True. But Putin has a strong record of using foreign military adventures as a means of propping up domestic support. Of course, opinion polls, which confirm this pattern, are manipulated and massaged (Chart 5). Nevertheless Russians like all people are highly likely to side with their own country in a military confrontation with foreign countries, at least in the short run. Over the long haul, the public will come to rue the war. Moscow believes that it can manage the domestic fallout when that time comes because it has done so since 2014. We doubt it but that is a question for a later time. Investors also need to consider Putin’s position if he did not stage ever-escalating confrontations with the West. Russia is an autocracy with a weak economy – it cannot win over the hearts and minds of its neighboring nations in a fair, voluntary competition with the West, the EU, and NATO. Russia’s neighbors are made up of formerly repressed Soviet ethnic minorities who now have a chance at national self-determination. But to secure their nationhood, they need economic and military support, and if they receive that support, then they inherently threaten Russia and help the US keep Russia strategically contained. Russia traditionally fights against this risk. Bottom Line: Investors and the media focused on the obstacles to Russian military intervention without analyzing whether there was sufficient political will to surmount the hurdles. Constraints Eroded None of the above suggests that Putin can do whatever he wants. Economic and military constraints are significant. However, constraints erode over time – and they may not be effective when needed. Europe did not promise to cancel all energy trade if Russia invaded: Exports make up 27% of Russian GDP, and 51% of exports go to advanced economies, especially European. Russia is less exposed to trade than the EU but more exposed than the US or even China (Chart 6). However, Russia trades in essential goods, natural resources, and the Europeans cannot afford to cut off their own energy supply. When Russia first invaded Ukraine in 2014, the Germans responded by building the Nord Stream pipeline, basically increasing energy cooperation. Russia concluded that Europeans, not bound to defend Ukraine by any treaty, would continue to import energy in the event of a conflict limited to Ukraine. Chart 6Putin Limits Conflict For Sake Of EU Energy Trade
From Nixon-Mao To Putin-Xi
From Nixon-Mao To Putin-Xi
Chart 7Putin Limits Conflict For Sake Of Chinese Trade
From Nixon-Mao To Putin-Xi
From Nixon-Mao To Putin-Xi
Russia substitutes China for Europe: As trade with the West declines, Russia is shifting toward the Far East, especially China (Chart 7). China is unlikely to reduce any trade and investment for the sake of Ukraine – it desperately needs the resources and the import-security that strong relations with Russia can provide. It cannot replace Europe – but Russia does not expect to lose the European energy trade entirely. (Over time, of course, the EU/China shift to renewables will undermine Russia’s economy and capabilities.) Ukraine is right next door: Aside from active military personnel, the US advantage over Iraq in 2002-03 was greater than the Russian advantage over Ukraine in 2022 (Chart 8). And yet the US got sucked into a quagmire and ultimately suffered political unrest at home. However, Ukraine is not Afghanistan or Iraq. Russia wagers that it can seize strategic territory, including Kiev, without paying the full price that the Soviets paid in Afghanistan and the US paid in Afghanistan and Iraq. This is a very risky gamble. But the point is that the bar to invading Ukraine was lower than that of other recent invasions – it is not on the opposite side of the world. Chart 8Putin Limits Conflict For Fear Of Military Overreach
From Nixon-Mao To Putin-Xi
From Nixon-Mao To Putin-Xi
Chart 9Putin Limits Conflict For Fear Of Military Weakness
From Nixon-Mao To Putin-Xi
From Nixon-Mao To Putin-Xi
NATO faces mutually assured destruction: NATO’s conventional military weight far surpasses Russia’s. For example, Russia, with its Eurasian Union, does not have enough air superiority to engage in offensive initiatives against Europe, even assuming that the United States is not involved. Even if we assume that China joins Russia in a full-fledged military alliance under the Shanghai Cooperation Organization (SCO), NATO’s military budget is more than twice as large (Chart 9). However, this military constraint is not operable in the case of Ukraine, which is not a NATO member. Indeed, Russia’s aggression toward Ukraine stems from its fear that Ukraine will become a real or de facto member of NATO. It is the fear of NATO that prompted Russia to attack rather than deterring it, precisely because Ukraine was not a member but wanted to join. Bottom Line: Russia’s constraints did not prohibit military action because several of them had eroded over time. NATO was so threatening as to provoke rather than deter military action. Going forward, Russia’s economic and military constraints will prevent it from expanding the war beyond Ukraine. Isn’t Russia Overreaching? Yes, Russia is overreaching – the military balances highlighted in Charts 8 and 9 above should make that plain. The Ukrainian insurgency will be fierce and Russia will pay steep costs in occupation and economic sanctions. These will vitiate the economy and popular support for Putin’s regime over the long run. Chart 10The West Is Politically Divided And Vulnerable
From Nixon-Mao To Putin-Xi
From Nixon-Mao To Putin-Xi
The West is also vulnerable, however, which has given rise to a fiscal and commodity cycle that helps to explain why Putin staged his risky invasion at this juncture in time: The US and West are politically divided. Western elites see themselves as surrounded by radical parties that threaten to throw them out and overturn the entire political establishment. Their tenuous grip on power is clear from the thin majorities they hold in their legislatures (Chart 10). Nowhere is this clearer than in the United States, where Democrats cannot spare a single seat in the Senate, five in the House of Representatives, in this fall’s midterm elections, yet are facing much bigger losses. Russia believes that its hawkish foreign policy can keep the democracies divided. Elites are turning to populist spending: Governments have adopted liberal fiscal policies in the wake of the global financial crisis and the pandemic. They are trying to grow their way out of populist unrest, debt, and various strategic challenges, from supply chains to cyber security to research and development (Chart 11). China is also part of this process, despite its mixed economic policies. The result is greater demand for commodities, which benefits Russia. Elites are turning to climate change to justify public spending: Governments, particularly in Europe and China, are using fears of climate change to increase their political legitimacy and launch a new government “moonshot” that justifies more robust public investment and pump-priming. The long-term trend toward renewable energy is fundamentally threatening to Russia, although in the short term it makes Russian natural gas and metals all the more necessary. Germany especially envisions natural gas as the fossil-fuel bridge to a green future as it has turned against both nuclear power and coal (Chart 12). Russian aggression will provoke a rethink in some countries but Germany, as a manufacturing economy, is unlikely to abandon its goals for green industrial innovation. Chart 11Politically Vulnerable States Need Fiscal Stimulus
Politically Vulnerable States Need Fiscal Stimulus
Politically Vulnerable States Need Fiscal Stimulus
Chart 12The West Reluctant To Abandon Climate Goals
From Nixon-Mao To Putin-Xi
From Nixon-Mao To Putin-Xi
Proactive fiscal and climate policy motivate new capex and commodity cycle: The West’s attempt to revive big government and strategic spending will require vast resource inputs – resources that Russia can sell at higher prices. The new commodity cycle gives Russia maximum leverage over Europe, especially Germany, at this point in time (Chart 13). Later, as inflation and fiscal fatigue halt this cycle, Russia will lose leverage. Chart 13Commodity Cycle Gives Russia Advantage (For Now)
Commodity Cycle Gives Russia Advantage (For Now)
Commodity Cycle Gives Russia Advantage (For Now)
Meanwhile Russia’s economic and hence strategic power will subside over time. Russia’s potential GDP growth has fallen since the Great Recession as productivity growth slows and the labor force shrinks (Chart 14). Chart 14Future Will Not Yield Strategic Opportunities For Russia
Future Will Not Yield Strategic Opportunities For Russia
Future Will Not Yield Strategic Opportunities For Russia
Chart 15Younger Russians Not Calling The Shots (But Will Someday)
From Nixon-Mao To Putin-Xi
From Nixon-Mao To Putin-Xi
In short, the Kremlin has chosen the path of economic austerity and military aggression as a means of maintaining political legitimacy and achieving national security objectives. Western divisions, de-carbonization, the commodity cycle, and Russia’s bleak economic outlook indicated that 2022 was the opportunity to achieve a pressing national security objective, rather than some future date when Russia will be less capable relative to its opponents. In the worst-case scenario – not our base case – the invasion of Ukraine will trigger an escalation of European sanctions that will lead to Russia cutting off Europe’s energy and producing a global energy price shock. And yet that outcome would upset US and European politics in Russia’s favor, while Putin would maintain absolute control at home in a society that is already used to economic austerity and that benefits from high commodity prices. Note that Putin’s strategy will not last forever. Ukraine will mark another case of Russian strategic overreach that will generate a social and political backlash in coming years. While Putin has sufficient support among older, more Soviet-minded Russians for his Ukraine adventure, he lacks support among the younger and middle-aged cohorts who will have to live with the negative economic consequences (Chart 15). The entire former Soviet Union is vulnerable to social unrest and revolution in the coming decade and Russia is no exception. The Russo-Chinese Geopolitical Realignment Chart 16From Nixon-Mao To Putin-Xi
From Nixon-Mao To Putin-Xi
From Nixon-Mao To Putin-Xi
From a broader, geopolitical point of view, Russia’s invasion of Ukraine drives another nail into the coffin of the post-Cold War system and hyper-globalization. Russia is further divorcing itself from the western economy, with even the linchpin European energy trade falling victim to renewables and diversification. The US and its allies are imposing export controls on critical technologies such as semiconductors against Russia to cripple any attempts at modernization. The US is already restricting China’s access to semiconductors and from now on is locked into a campaign to try to enforce these export controls via secondary sanctions, giving rise to proxy battles in countries that Russia and China use to circumvent the sanctions. Russia will be forced to link its austere, militarized, resource-driven economy to the Chinese economy. Hence a major new geopolitical realignment is taking place between the US, Russia, and China, on the order of previous realignments since World War II. When the Sino-Soviet communist bloc first arose it threatened to overwhelm the US in economic heft and dominate Eurasia. This communist threat drove the US to undertake vast expeditionary wars, such as in South Korea and Vietnam. These were too costly, so the US sought economic engagement with China in 1972, which isolated the Soviet Union and ultimately helped bring about its demise. Yet China’s economic boom predictably translated into a strategic rise that began to threaten US preeminence, especially since the Great Recession. Today Russia and China have no option other than to cooperate in the face of the US’s increasingly frantic attempts to preserve its global status – and China’s economic growth and technological potential makes this alliance formidable (Chart 16). In short, the last vestiges of the “Nixon-Mao” moment are fading and the “Putin-Xi” alignment is already well-established. Russia cannot accept vassalage to China but it can make many compromises for the sake of strategic security. Their economies are much more complimentary today than they were at the time of the Sino-Soviet split. And Russia’s austere economy will not collapse as long as it retains some energy trade with Europe throughout the pivot to China. In turn the US will attempt to exploit Russian and Chinese regional aggression as a basis for a revitalization of its alliances. But Europe will dampen US enthusiasm by preserving economic engagement with Russia and China. The EU is increasingly an independent geopolitical actor and a neutral one at that. This environment of multipolarity – or Great Power Struggle – will define the coming decades. It will ensure not only periodic shocks, like the Ukraine war, but also a steady undercurrent of growing government involvement in the global economy in pursuit of supply security, energy security, and national security. Competition for security is not stabilizing but destabilizing. Hyper-globalization has given way to hypo-globalization, as regional geopolitical blocs take the place of what once promised to be a highly efficient and thoroughly interconnected global economy. Investment Takeaways Tactically, Geopolitical Strategy believes it is too soon to go long emerging markets. Russia is at war, China is reverting to autocracy, and Brazil is still on the path to debt crisis. Multiples have compressed sharply but the bad news is not fully priced (Chart 17). The dollar is likely to be resilient as the Fed hikes rates and a major European war rages. Europe’s geopolitical and energy insecurity will weigh on investment appetite and corporate earnings. American equities are likely to outperform in the short run. Chart 17Investors Should Not Bet On Russian And European Equities In This Context
Investors Should Not Bet On Russian And European Equities In This Context
Investors Should Not Bet On Russian And European Equities In This Context
Chart 18Investors Find Value, Minimize Risk In Geopolitically Secure Equity Markets
Investors Find Value, Minimize Risk In Geopolitically Secure Equity Markets
Investors Find Value, Minimize Risk In Geopolitically Secure Equity Markets
Cyclically, global equities outside the US, and pro-cyclical assets offer better value, as long as the war in Ukraine remains contained, a Europe-wide energy shock is averted, and China’s policy easing secures its economic recovery. While European equities will snap back, Europe still faces structural challenges and eastern European emerging markets face a permanent increase in geopolitical risk due to Russian geopolitical decline and aggression. Investors should seek markets that are both cheap and geopolitically secure – namely Australia, Canada, and Mexico (Chart 18). We are also bullish on India over the long run. Matt Gertken Chief Geopolitical Strategist mattg@bcaresearch.com Strategic Themes Open Tactical Positions (0-6 Months) Open Cyclical Recommendations (6-18 Months)
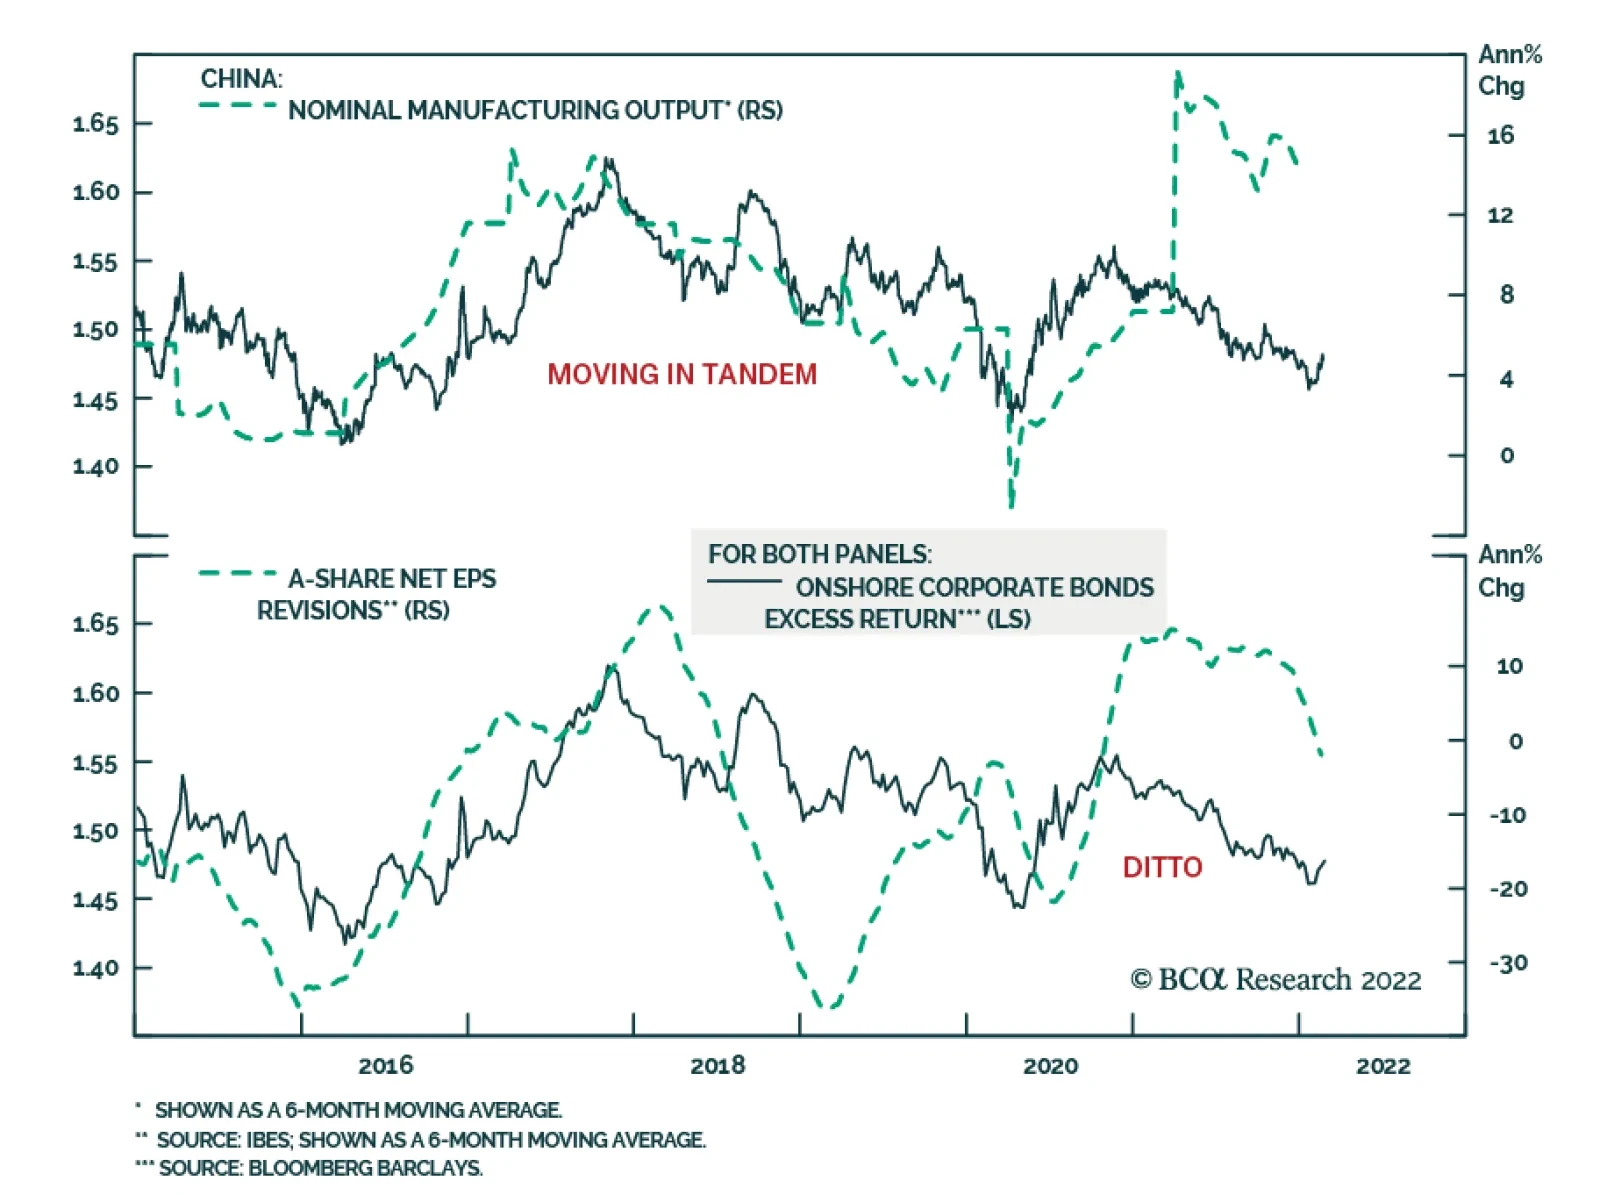
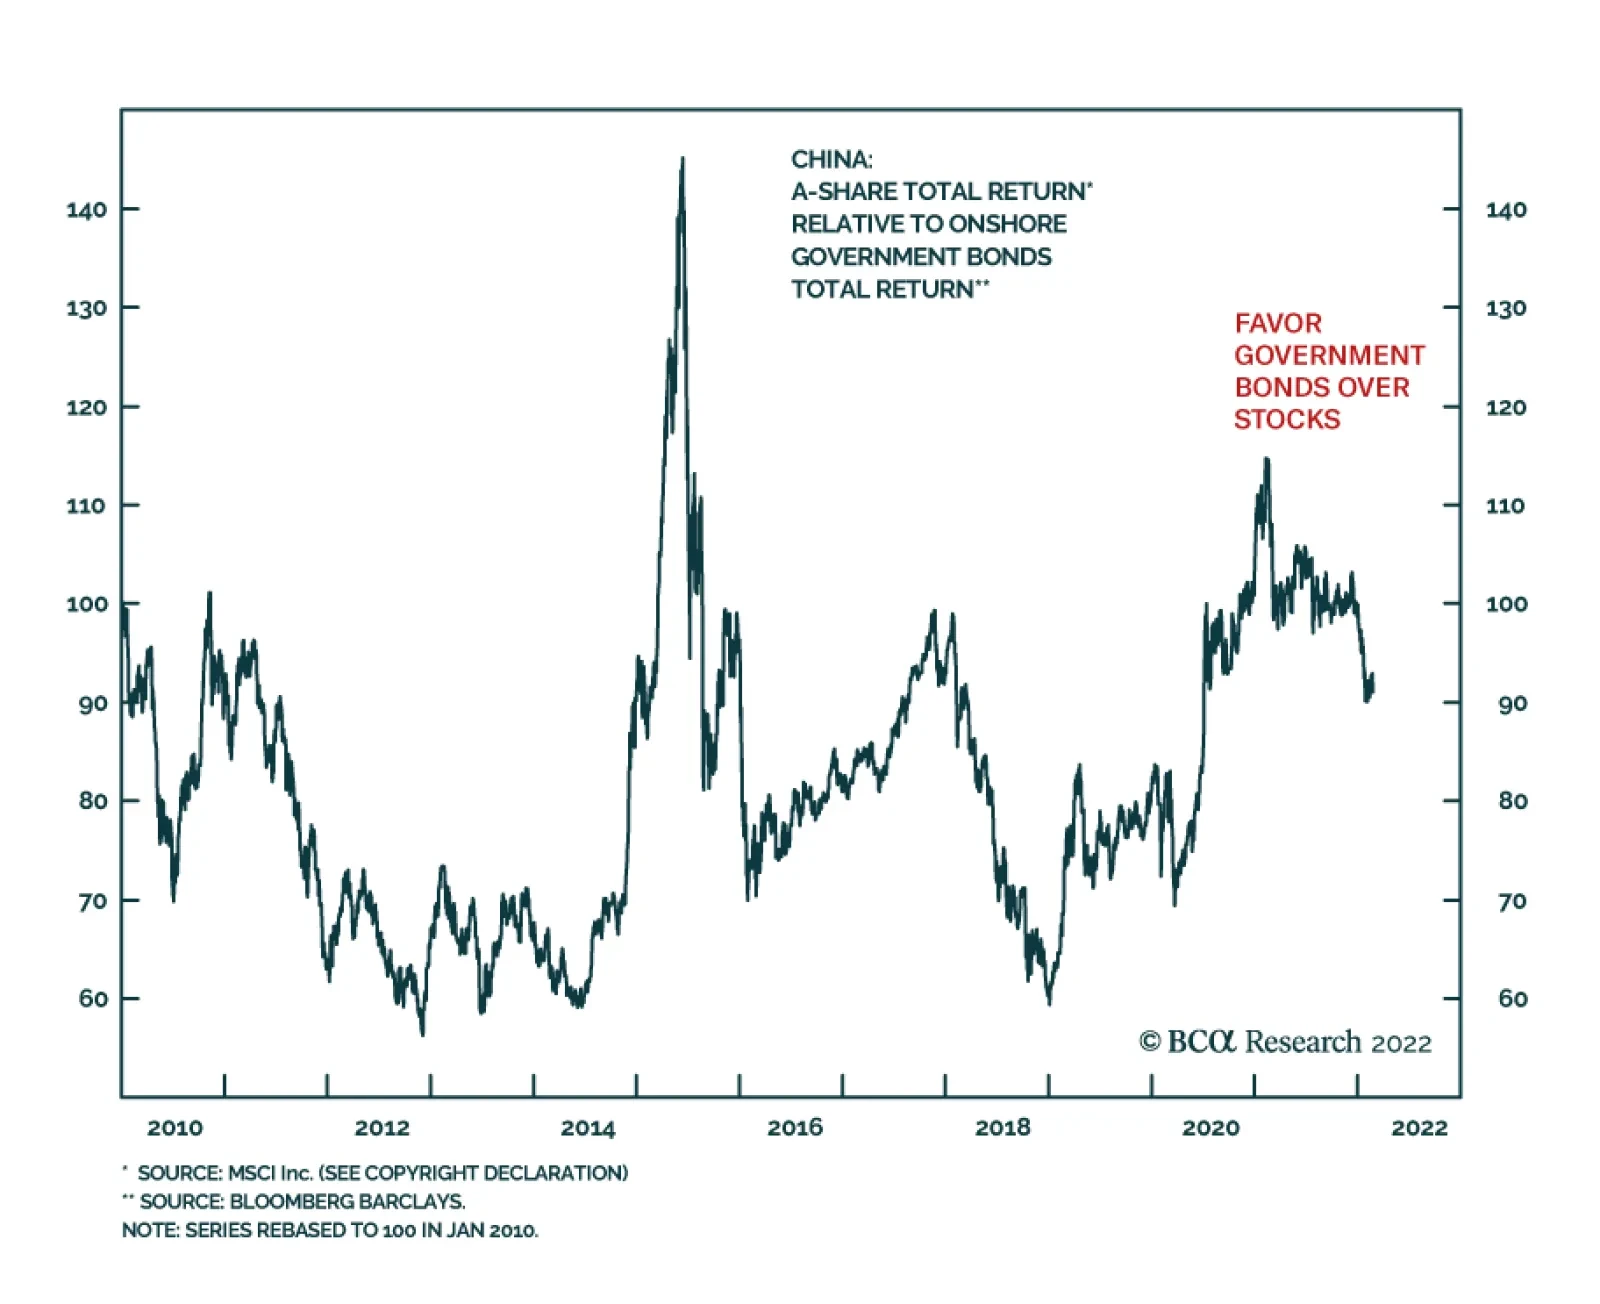
BCA Research’s Emerging Markets Strategy service concludes that fixed-income investors should continue to favor Chinese government bonds over corporate bonds. The proper measure of corporate bond performance is excess return over similar government bonds…
Executive Summary Copper Demand Follows GDP
Copper Demand Follows GDP
Copper Demand Follows GDP
European copper demand will increase on the back of still-accommodative monetary policy, coupled with a loosening of COVID-19-related gathering and mobility restrictions as the virus becomes endemic. Copper demand will be supported by the EU's need to diversify natural gas supplies in favor of increased LNG import capacity over the next 10 years, which will require incremental infrastructure investment. Increasing policy stimulus in China and government measures to increase lending to metals-intensive sectors – e.g., construction and grid infrastructure – will boost global copper demand. In the US, the Biden administration is backing a $550 billion bill to fund its renewable-energy buildout, which will result in higher demand for metals and steel over the next decade. Global copper supply growth will be restrained by local politics going forward, particularly in the Americas. Bottom Line: Copper prices have been grinding higher even as China maintains its zero-tolerance COVID-19 public health policy, and markets wait out the Russia-Ukraine standoff. We are maintaining our forecast for COMEX copper to trade to $5.00/lb this year and $6.00/lb next year. We remain long commodity-index exposure (S&P GSCI and the COMT ETF), along with equity exposure to miners and traders via the XME and PICK ETFs. Feature Ever since it hit its record high in May 2021, copper prices have been range-bound, despite tight market fundamentals and record low inventories in 3Q21, which, as it happens, have not significantly rebuilt since then (Chart 1, panel 1). This can be explained by weak global macro conditions since prices peaked, which have not been especially conducive to higher copper prices, particularly in Europe and China. Activity in these two markets accounting for ~ 60% and 11% of global refined copper demand, respectively, has had a stop-start aspect that has hindered full recovery to now. Chart 1Global Copper Inventories Remain Tight
Global Copper Inventories Remain Tight
Global Copper Inventories Remain Tight
Chart 2Copper Demand Follows GDP
Copper Demand Follows GDP
Copper Demand Follows GDP
As GDP in these regions rises, demand for copper will rise, as Chart 2 shows. Per our modelling, refined copper demand in China, the EU and the world are highly cointegrated with Nominal GDP estimates provided by the IMF. The coefficient associated with nominal GDP in all three instances is positive. Further, running Granger Causality tests indicate that past and present values of nominal GDP explain present refined copper demand values for all three entities. These results indicate that economic growth and refined copper demand have a positive long-run relationship. China’s zero-COVID tolerance policy and the property-market crisis there have restricted economic growth, activity and hence demand for the metal used heavily in construction and manufacturing. In Europe, lockdowns due to the Omicron variant restricted activity causing supply chain disruptions, which contributed to inflation. Now, Europe is relying on immunity among large shares of its population to keep economies open, as COVID-19 becomes endemic. Germany is loosening restrictions at a slower rate than its neighbors, as COVID still has not reached endemicity (Chart 3). Europe’s top manufacturer reportedly is expected to ease restrictions and increase economic activity by March-end. Chart 3New EU COVID-19 Cases Collapse
Copper Will Grind Higher
Copper Will Grind Higher
Natural Gas Remains Critical To Europe Apart from COVID, elevated natural gas prices have and will continue to affect economic activity in Europe. These prices will only get more volatile as fears of a Russian invasion of Ukraine increase. In the short term, we do not expect Russia to cut off all gas supplies to the EU in case of an invasion.1 However, supplies going through Ukraine likely would be cut. Coupled with the region’s precariously low natgas inventory levels, this could fuel a gas price spike (Chart 4). Higher gas prices could lead to demand destruction, if, as occurred this winter, higher power-generating costs arising from higher natgas costs makes electricity too expensive to keep industrial processes like aluminum smelters up and running. In addition, another regional bidding war could incentivize more re-routing of LNG to Europe instead of Asia. This would reduce European prices, but could force Asian markets to raise their bids. Chart 4EU's Natgas Inventories Remain Critical
Copper Will Grind Higher
Copper Will Grind Higher
Assuming gas prices do not remain significantly higher for the rest of the year, Europe will start seeing economic activity improve, and as our European Investment Strategy notes, PMIs will bottom out by the second quarter of this year. High immunity levels are allowing European nations to relax restrictions as it becomes apparent that COVID in the continent – at least in Western Europe – appears to be reaching endemicity. Importantly for base metals generally, and copper in particular, lower natgas prices will allow smelters and refining units to remain in service as electricity prices stabilize or even fall in the EU. During the pandemic, households – primarily in DM economies – built up significant levels of excess savings, particularly in Europe. The IMF reported that households in Europe have amassed nearly 1 trillion euros more in savings vs. normal levels over the last two years than if the pandemic had never occurred.2 While the entirety of excess savings will not be released as spending, even a portion of it will spur economic activity, once supply-chain issues are ironed out when the global economy reopens. China's Copper Demand Will Revive China’s property sector crisis last year was a major drag on economic growth. The Chinese government’s efforts to stabilize this sector seem to be paying off. China’s National Bureau of Statistics reported that for January housing prices in China’s first-tier cities reversed a month-on-month decline from December. The number of cities that saw home prices fall in January also was lower compared to December. Continued improvements in the property sector in China will be bullish for copper. Once macro hurdles related to COVID and high gas prices dissipate, and China’s property market stabilizes, economic activity will increase and copper demand will rebound (Chart 5). However, a timeline for this is difficult to handicap, given China's insistence – at least for now – on maintaining a zero-covid public-health policy. The zero-covid policy has resulted in sharply lower infection rates than the rest of the world, but, because it has not been accompanied by wide distribution of mRNA vaccines, immunity in the population is low. As global macro factors become conducive for copper, investors’ focus will switch to tight fundamentals in the copper market (Chart 6). Unlike the first half of 2021, copper’s high prices will be more sustained, given COVID’s current trajectory towards endemicity globally, and relatively higher immunity rates. Chart 5China's Demand Will Rebound
Copper Will Grind Higher
Copper Will Grind Higher
Chart 6Coppers Tight Fundamentals Will Come Into Focus Again
Coppers Tight Fundamentals Will Come Into Focus Again
Coppers Tight Fundamentals Will Come Into Focus Again
In addition, markets will have to factor in additional demand from the US that heretofore did not exist: The Biden administration is backing a $550 billion bill to fund renewable-energy development. More such funding can be expected in coming years as the US leans into decarbonization, and competes with the likes of the EU and China for limited base metals supplies. Supply Side Difficulties Mount Local governance is becoming increasingly critical to the supply side of base metals, no moreso than in the Americas – chiefly in Chile, Peru and, of late, the US., where the Biden administration recently shut down a Minnesota mining proposal in a major win for environmental groups.3 A number of these critical commodity-producing states in the Americas have elected – or are leaning toward – left-of-center candidates, some of whom are proposing fundamental changes in the laws and regulations governing resource extraction. Gabriel Boric, Chile’s new president, takes office in March. He has largely focused his campaign on the environment, human rights, and closer ties with other Latin American countries. Boric promotes a “turquoise” foreign policy, which includes “green” policies to combat climate change, and “blue” ones to protect oceans. He is likely to commit Chile, which accounts for ~ 30% of global copper mining, to participation in the Escazú Agreement, is being positioned to span the region.4 Of greatest import to the global metals and mining markets, Boric will push for a constitutional re-write affecting taxes on copper mining, decarbonization, Chile's water crisis and the nationalization of lithium mining. Chile's new constitution is expected to be put up for a vote by the end of 2022. In Peru, which accounts for ~ 10% of global copper output, President Pedro Castillo announced at the UN General Assembly that Peru would declare a "climate emergency," and promised to reach net-zero in Peru by 2050. Civil unrest in Peru directed at mining operations is becoming more widespread, as citizens become increasingly frustrated with pollution and poverty.5 Colombia is not a major metals producer, but it is a resource-based economy leaning left. In May it will hold its general elections to Congress and Presidency. The future president will have pressure on the ratification of the Escazú Agreement, fight against illegal mining, and work on the Amazon deforestation. Presently, a left-of-center candidate, Gustavo Petro, leads the polling, according to the latest December survey by the National Consulting Center.6 Petro is promising to stop approving oil exploration contracts to restructure Colombia's economy away from hydrocarbons, and plans to accelerate the transition towards renewable energy.7 In addition, Petro is trying to gather ideological allies across Latin America and the world to fight against climate change. He hopes Chile’s president-elect Gabriel Boric will be joining this alliance.8 Caution: Downside Risks Remain Apart from the Russia-Ukraine crisis discussed above, there are more headwinds to the bullish copper view. China’s zero-covid policy will lead to reduced activity in the world’s largest producer and consumer of refined copper. This will disrupt global supply chains and, along with high energy prices, spur global inflation, prolonging slow economic growth and activity. Central bank tightening globally – led by the Federal Reserve – will increase borrowing costs, reduce manufacturing, and act as a downside risk to copper, particularly if the Fed miscalculates and lifts rates too high too soon and sparks a USD rally. Finally, while DM economies have high vaccination rates, EM states do not have the same level of immunity (Chart 7). Europe exhibits this dichotomy in immunization rates between advanced and developing countries well. While most of Western Europe appears to be nearing endemicity and reopening, Omicron is spreading quickly into Eastern Europe, where immunity is low. As long as a majority of the global population is not vaccinated, COVID-19 mutations into more virulent and transmissive variants remain a major risk. Chart 7COVID-19 Remains A Risk
Copper Will Grind Higher
Copper Will Grind Higher
Investment Implications Copper prices have been grinding higher even as China maintains its zero-tolerance COVID-19 public-health policy, and markets wait out the Russia-Ukraine standoff (Chart 8). As large economies continue to emerge from COVID-19-related disruptions demand for base metals can be expected to increase, particularly for copper. We are maintaining our forecast for COMEX copper to trade to $5.00/lb this year and $6.00/lb next year. We remain long commodity-index exposure (S&P GSCI and the COMT ETF), along with equity exposure to miners and traders via the XME and PICK ETFs. Chart 8Copper Continues To Grid Higher
Copper Continues To Grid Higher
Copper Continues To Grid Higher
Ashwin Shyam Research Associate Commodity & Energy Strategy ashwin.shyam@bcaresearch.com Paula Struk Research Associate Commodity & Energy Strategy paula.struk@bcaresearch.com Robert P. Ryan Chief Commodity & Energy Strategist rryan@bcaresearch.com Commodities Round-Up Energy: Bullish The US will expand its leading position as the EU-27's and UK's top liquified natural gas (LNG) supplier this year, in our view, although Qatar will provide stiff competition (Chart 9). In January, the EIA reported half of the Europe's LNG originated in the US. For all of 2021, 26% of Europe's LNG came from the US, while 24% came from Qatar and 20% came from Russia. We expect the Russia-Ukraine military standoff, which has the potential to become a kinetic engagement, will prompt Europe to diversify its natural gas supplies away from Russia to reduce its exposure to military and geopolitical pressure on its energy supplies. This also would apply, in our estimation, to pipeline supplies of natural gas from Russia, which shipped 10.7 Bcf/d to Europe in 2021 (vs. 11.8 Bcf and 14.8 Bcf/d in 2020 and 2019, respectively. Norway supplied 10.4 Bcf/d in 2019 and 2020, rising to 11.1 Bcf/d in 2021. We also would expect additional North Sea supplies to be developed to supply Europe in the wake of the current Russia-Ukraine tensions. Base Metals: Bullish Russia’s recognition of the two breakaway states of Donetsk and Luhansk People’s Republics (DPR and LPR), elicited US sanctions targeting Russian sovereign debt and its banking sector. The possibility of sanctions on Russian nickel and aluminum exports sent both metals to multi-year highs in LME trading. Russia constitutes around 6% and 9% of global primary aluminum and nickel ore supply, respectively. Precariously low inventory levels for both nickel and aluminum are inducing high price volatility. Year-over-year, global January LME aluminum and nickel stocks are 45% and 64% lower respectively. Precious Metals: Bullish Geopolitical uncertainty due to the Russia-Ukraine crisis and Western sanctions levied on Russia has pushed gold prices to levels not seen since its last bull run last year. While gold has risen, Bitcoin – once considered to be a safe-haven asset – has fallen on this uncertainty. Over the last two years, Bitcoin has been moving more in tandem with equity markets than with other safe-haven assets, as cryptocurrency has become more popular and central banks began large asset purchase programs in response to the pandemic (Chart 10). From beginning 2018 to end-2019 the coefficient measuring daily Bitcoin prices’ correlation with the S&P 500 index was ~0.31. From beginning 2020 to present day, this value has increased to ~ 0.86. Chart 9
Copper Will Grind Higher
Copper Will Grind Higher
Chart 10
Bitcoin Price Aligns With Gold Price And S&P 500 INDEX
Bitcoin Price Aligns With Gold Price And S&P 500 INDEX
Footnotes 1 Please see our report from February 3, 2022 entitled Long-Term EU Gas Volatility Will Increase. It is available as ces.bcaresearch.com. 2 Please see Europe’s Consumers are Sitting on 1 Trillion Euros in Pandemic Savings published by the International Monetary Fund on February 10, 2022. 3 Please see our report from on November 25, 2021 entitled Add Local Politics To Copper Supply Risks, and Biden administration kills Antofagasta's Minnesota copper project published by reuters.com on January 26, 2022. 4 Please see Chile Turns Left: The Foreign Policy Agenda of President Gabriel Boric, published by Australian Institute of Mining Affairs on January 28, 2022. 5 Please see China's MMG faces Peru whack-a-mole as mining protests splinter, published by reuters.com on February 16, 2022. 6 Please see Six Challenges Facing Colombia in 2022, published by Global Americas on January 6, 2022. 7 Please see Gustavo Petro, who leads polls in Colombia, seeks to create an anti-oil front published by Bloomberg on January 14, 2022. 8 Please see Colombia Presidential Favorite Gustavo Petro Wants to Form a Global Anti-Oil Bloc, published by Time on January 14, 2022. Investment Views and Themes Strategic Recommendations Trades Closed in 2021
Image