China
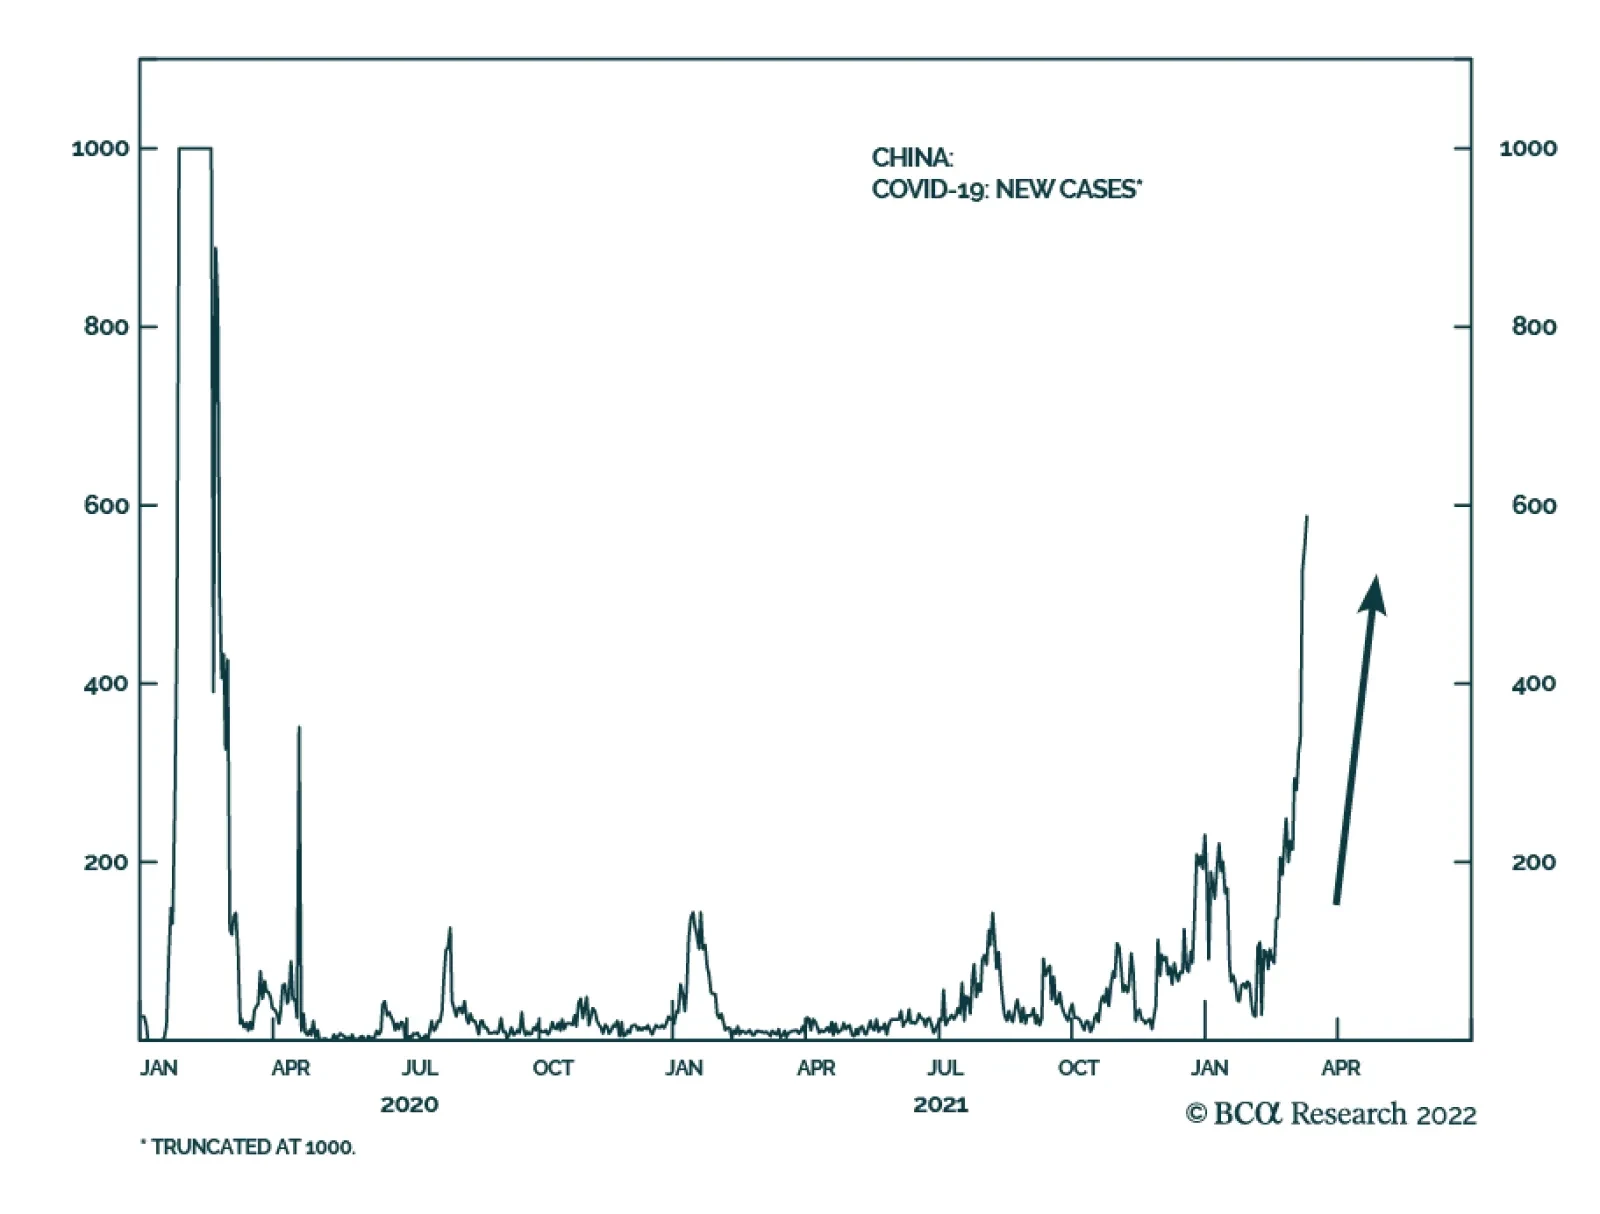
China’s zero tolerance policy towards the COVID-19 virus is a source of downside risk to the near-term economic outlook. Multiple Chinese cities have been placed under lockdown in an effort to tame surging COVID-19 cases across the country. Among these cities…
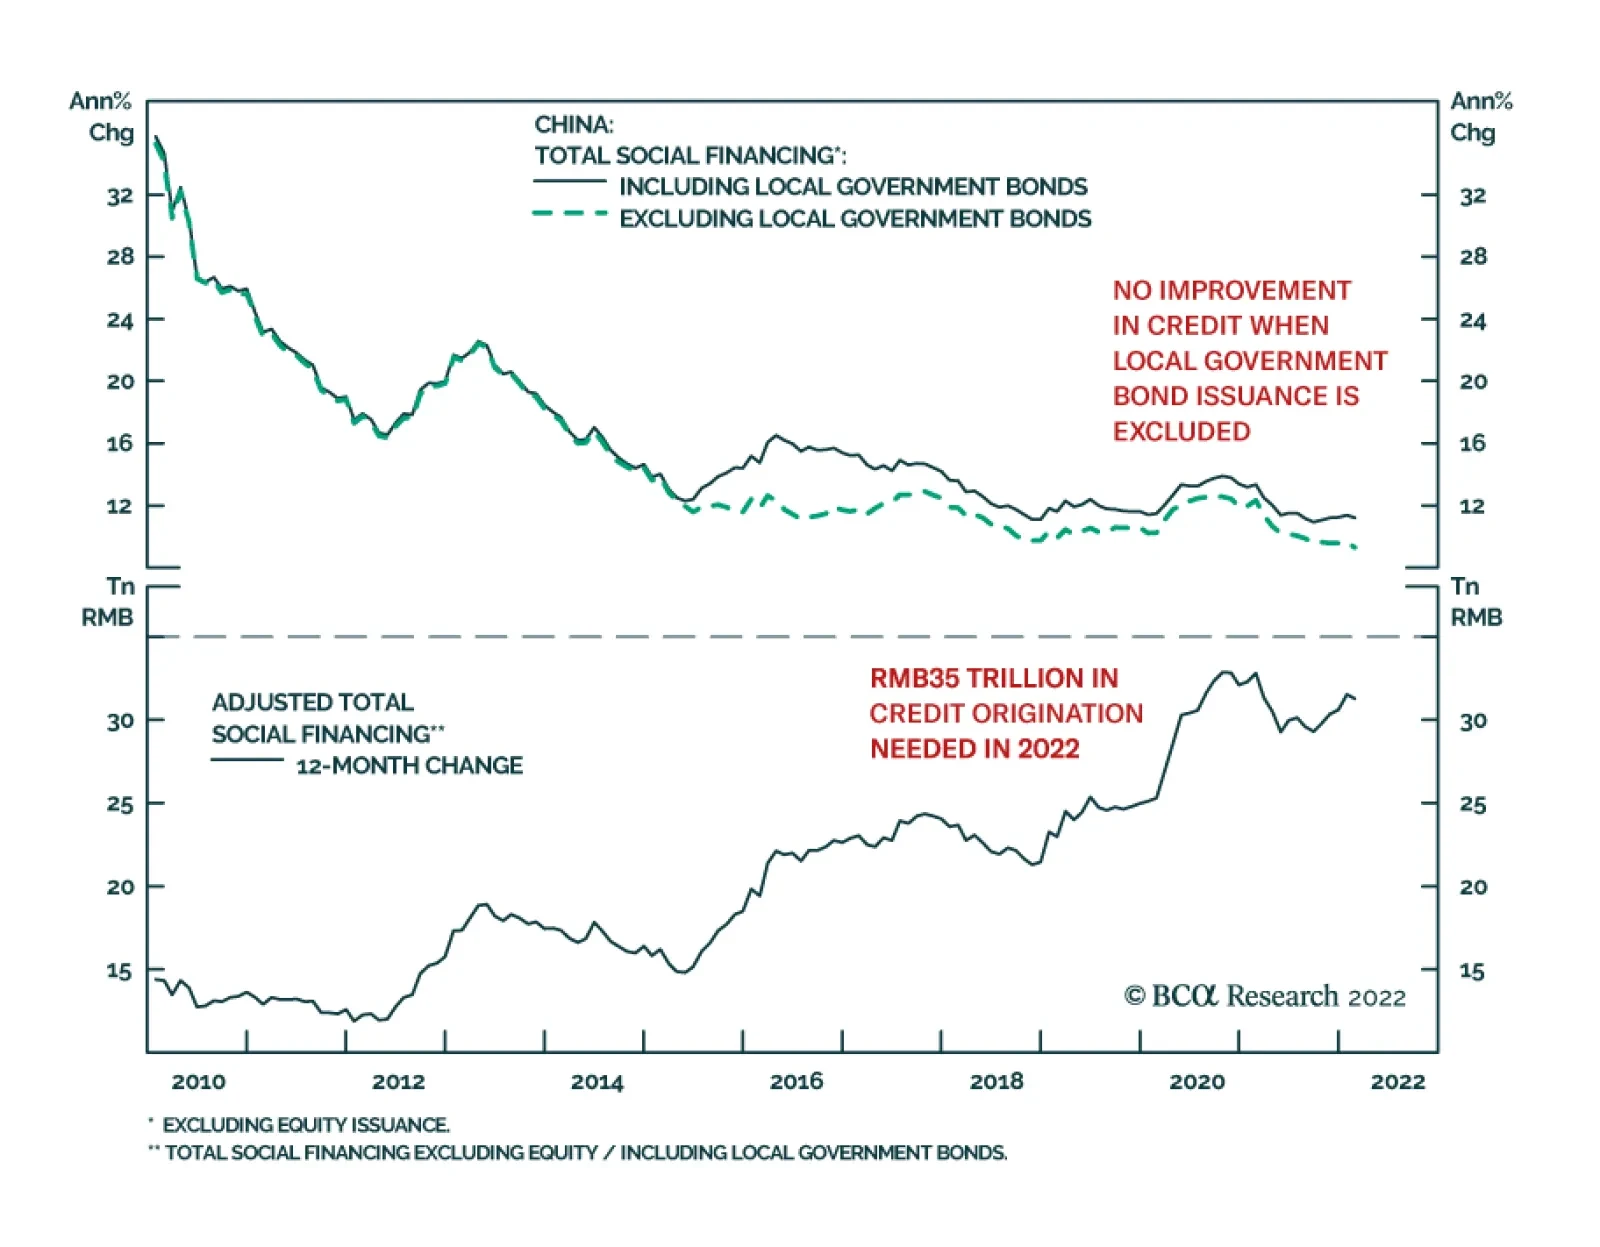
Chinese money and credit data were weaker than expected in February. New total social financing amounted to RMB1.19 trillion – below January’s RMB6.17 trillion surge and lower than expectations of a RMB2.20 trillion increase. Similarly, loans extended by…

Dear client, This week we are sending you a joint Special Report with my colleague Chester Ntonifor, Foreign Exchange Strategist. The Special Report provides our outlook on the RMB. I trust that you will find the report very insightful. Best regards, Jing Sima China Strategist Executive Summary The RMB And Real Interest Rates
The RMB And Real Interest Rates
The RMB And Real Interest Rates
The RMB has overshot and will likely consolidate gains in the coming months. That said, the yuan remains underpinned by a current account surplus, positive real rates, and a valuation cushion. This will support modest appreciation over the next 12-18 months (Feature Chart). The dollar is likely to enter a period of weakness beyond the Russo-Ukrainian crisis, underpinning a firm RMB. Yield spreads between China and the US will narrow across the bond curve, slowing the pace of any RMB appreciation. In its quest to dominate Asian trade flows, China will also seek a stable yuan which can be an anchor for regional currencies. Low volatility in the Chinese bond and currency market will increasingly make it an attractive hedge for global portfolio managers. This will encourage RMB inflows. The financial sanctions on Russia from the ongoing Ukrainian conflict will accelerate Chinese diversification from US assets. It will also boost the use of RMB in global trade, lifting its share in global FX reserves. Bottom Line: In the near term, USD/CNY is due for a bounce and could retrace to 6.5. It is also the case that a lot of the gains in the Chinese RMB have been frontloaded, suggesting a flattish path ahead. Beyond the near term, we expect the DXY to hit 90 in the next 12-18 months, which will boost the RMB towards 6.0. Feature The RMB has been strong across the board versus most major currencies (Chart 1). Year-to-date, the DXY dollar index is up 2% while the CFETS basket is up 3%. This places the Chinese yuan as one of the best performing major currencies this year. Such a configuration where USD/CNY diverges from the broad dollar trend has been very rare in recent history (Chart 2). More importantly, this has occurred amidst very low volatility. Chart 1A Bull Market In Yuans
A Bull Market In Yuans
A Bull Market In Yuans
Chart 2USD/CNY And The Dollar Diverge
USD/CNY And The Dollar Diverge
USD/CNY And The Dollar Diverge
In this Special Report, we try to understand the driving forces behind a rising RMB, to gauge its likely path going forward. In our view, while the yuan is vulnerable tactically, it is underpinned by strong structural forces that support modest appreciation over the next 12-18 months. The Chinese Economy, Interest Rates, And The RMB An exchange rate is simply a mechanism to equalize rates of returns across countries. For most currencies, the key determinants of this arbitrage window are real interest rate differentials. In China, while nominal interest rates vis-à-vis the US have been collapsing, real interest rate differentials are near a record high. This has been the key driver of a rising RMB (Chart 3). Real interest rates tend to matter because high and rising inflation destroys the purchasing power of any currency. Our bias is that higher real rates in China versus the US will persist and keep the RMB firm. Five key reasons underpin this view: The Chinese economy is expected to accelerate this year relative to the US. The IMF expects 4.8% GDP growth in China, versus 4% in the US. Bloomberg consensus estimates corroborate this view – 5.2% growth is expected for China this year, versus 3.6% for the US. Even the Chinese government’s GDP growth target this year is 5.5%, much higher than street estimates. US interest rates are likely to rise over the medium term, but so will those in China. The Chinese credit impulse has bottomed, and it is usually a good precursor to both stronger economic activity and higher relative government bond yields (Chart 4). Chart 3The RMB And Real Versus Nominal Rates
The RMB And Real Versus Nominal Rates
The RMB And Real Versus Nominal Rates
Chart 4Interest Rate Differentials And The Credit Impulse
Interest Rate Differentials And The Credit Impulse
Interest Rate Differentials And The Credit Impulse
While Chinese productivity growth is slowing, it remains structurally higher compared to that in the US or Europe. Stronger productivity growth suggests the neutral rate of interest in China will remain higher than in Western economies for years to come. This will continue to attract further fixed-income inflows. The RMB is a procyclical currency and tends to benefit when flows into emerging market assets in general, and Chinese stocks in particular, are fervent. While the Chinese authorities have cracked down on the property and information technology/communication service sectors, they have done so without causing widespread capital flight and hurting the RMB (Chart 5). Going forward, odds are that the interest from foreign bargain hunters will rise as these sectors reset from lower and much cheaper levels. It is well known that the Chinese economy has excess capacity, which is inherently deflationary (and positive for real rates). Like Japan, China has excess savings and deficient demand (Chart 6). However, in an inflationary world, this excess capacity can easily be exported, especially to the US, which is on the verge of overheating. A healthy trade balance in China suggests there is little reason for the RMB to depreciate meaningfully. Chart 6Excess Savings In China And Low Inflation
Excess Savings In China And Low Inflation
Excess Savings In China And Low Inflation
Chart 5The RMB And Chinese Equities
The RMB And Chinese Equities
The RMB And Chinese Equities
It is remarkable that despite being the largest commodity importer in the world, terms of trade in China is picking up. Rising terms of trade is usually synonymous with a stronger currency. On the flip side, a stronger currency will also temper inflationary pressures in China (Chart 7). Chart 7The RMB, Terms Of Trade And Inflation
The RMB, Terms Of Trade And Inflation
The RMB, Terms Of Trade And Inflation
The bottom line is that real interest rates will remain relatively high in China, even as the US begins to tighten monetary policy while China eases. The reason is that the US economy is much more inflationary, and Chinese bond yields tend to rise when the PBoC stimulates growth. Market Liberalization And Portfolio Flows With attractive real yields, Chinese bonds have been gaining widespread investor appeal. Their inclusion in the world’s three major bond indices has been a seminal milestone in the process of liberalizing the Chinese fixed-income market. Chinese bonds have also acted as perfect portfolio hedges, moving inversely to US and global equities (Chart 8). The result has been significant portfolio inflows into Chinese bonds. As a reminder, Chinese bonds were initially included in the Bloomberg Barclays Global Aggregate Index (BBGA) in April 2019. Following that, they were added to the JP Morgan Government Bond - Emerging Market Index (GBI-EM) in February 2020. Finally, FTSE Russell announced their inclusion of in the FTSE World Government Bond Index (WGBI) as of October 2021. Since their inclusion, a net US$350 billion has flowed into Chinese bonds. We estimate that about 35% of that has been due to index inclusion. The amount of Chinese onshore bonds held by overseas investors has breached US$600 billion, a record high (Chart 9). Chart 9A Healthy Appetite From Foreign Investors
A Healthy Appetite From Foreign Investors
A Healthy Appetite From Foreign Investors
Chart 8RMB Bonds As A Portfolio Hedge
RMB Bonds As A Portfolio Hedge
RMB Bonds As A Portfolio Hedge
In a nutshell, the path of the RMB in the short term will follow relative growth dynamics between China and the rest of the world, but structural factors such the inclusion of RMB bonds in global portfolios will underpin strong inflows into the Chinese fixed-income market. The Dollar, Trade, And Lessons From The Ukrainian Conflict Chart 10China Is Destocking USDs
China Is Destocking USDs
China Is Destocking USDs
Another factor to consider vis-à-vis the RMB is the dollar’s reserve status, and the overreach that it commands. Quite simply, transactions conducted in US dollars anywhere fall under US law. This means that if a company in any country buys energy from Iran and the transaction is done in US dollars, the Treasury has powers to sanction the parties involved. Russian holdings of US Treasurys peaked during the Georgian war and have since fallen to near 0% of total reserves. Even so, the world has witnessed how vulnerable the Russian economy has been to a cut-off from the Society For Worldwide Interbank Financial Telecommunication (SWIFT) messaging system. China is the largest holder of US Treasurys and what it decides to do with this war chest of savings is of critical importance. At a minimum, a few trends that have been underway in recent years are likely to accelerate. China will continue to destock its holding of Treasurys into gold and other currencies (Chart 10). This will put downward pressure on the dollar and boost the RMB. In fact, ever since China started destocking Treasurys in earnest in 2015, the DXY has been unable to sustainably punch through the 100 level. Trade flows in Asia remain rather buoyant, even as globalization has peaked (Chart 11A and 11B). With most Asian countries having China as a large trading partner, the logical step will be more and more invoicing in RMB. Most global trade hubs in history (such as Hong Kong for example) have always sought a stable currency with low volatility to instill confidence in trade. China is likely to also favor a stable RMB. Chart 11AChina Could Dominate Asian Trade
China Could Dominate Asian Trade
China Could Dominate Asian Trade
Chart 11BAsian Trade Is Booming
What Next For The RMB?
What Next For The RMB?
As Asian trade continues to expand, the PBoC can step in as the regional central bank and lender of last resort. It is notable that China is already engaging in this role. Since the global financial crisis, the number of bilateral swap lines offered to foreign central banks by the PBoC has ballooned (Chart 12). According to the most recent data (from the PBoC), the Chinese central bank had bilateral local currency swap agreements with central banks or monetary authorities in 40 countries and regions, with a total amount of around 4 trillion yuan. The People’s Bank of China has massive foreign exchange reserves, worth about US$3.2 trillion. This means it can provide swap agreements that will almost cover the totality of EM foreign dollar debt. The Cross-Border Interbank Payment System (CIPS) already allows the transfer and clearing of yuan-denominated payments. In 2021, the system processed US$12.7 trillion, a 75% increase in turnover from the previous year.1 While the system still largely relies on SWIFT messaging for most cross-border transactions, progress towards independence is moving fast. The key point is that as China continues to rise as an economic power and increases the share of RMB trade within its sphere of influence, the yuan will naturally become the de facto Asian currency. This will allow the RMB to continue to gain international appeal (Chart 13). Chart 12The People's Bank Of Asia?
What Next For The RMB?
What Next For The RMB?
Chart 13The RMB And International Appeal
The RMB And International Appeal
The RMB And International Appeal
Valuation Concerns Most of the discussion above has focused on the cyclical outlook for the Chinese economy and bond yields, as well as the geopolitical ramifications from the Russo-Ukrainian conflict. While the macro environment is by far the most important driver of currencies, valuation and sentiment tend to matter as well. On this note: Our productivity model suggests the RMB is at fair value. Productivity in China remains higher than among its western trading partners, but the gap has been closing. This has flattened the slope of the fair-value model (Chart 14). That said, the US and Europe are generating much higher inflation than China, suggesting there is higher pressure for unit labor costs to rise in these countries. This will improve the competitive profile of the RMB. Our PPP model for the RMB, using an apples-to-apples consumer basket vis-à-vis the US suggests the RMB is undervalued by 11% (Chart 15). Historically, such levels of undervaluation have seen the RMB appreciate by 2% per year over the next 4 years (Chart 16). Chart 14The RMB Is At Fair Value Based On Productivity Trends
The RMB Is At Fair Value Based On Productivity Trends
The RMB Is At Fair Value Based On Productivity Trends
Chart 15The RMB Is Cheap Based On Relative Prices
The RMB Is Cheap Based On Relative Prices
The RMB Is Cheap Based On Relative Prices
Chart 16Potential RMB Returns For Foreign Investors
Potential RMB Returns For Foreign Investors
Potential RMB Returns For Foreign Investors
Valuation tends to be important because it is usually the trigger for imbalances to manifest themselves. Back in 2015-20162 when Chinese capital outflows (especially illicit flows) were rampant amongst global and Chinese concerns, the RMB also happened to be very overvalued. Today, such a risk is much limited. Concluding Thoughts The RMB and the dollar tend to move in harmony, and so a discussion of one entails talking about the other. We have characterized the dollar this year as caught in a tug of war. Specifically, aggressive rate hikes by the Federal Reserve will boost interest rate differentials in favor of the US but undermine the equity market via a derating in stocks. This will tighten financial conditions, nudging the Fed to pivot. On the other hand, less accommodation by the Fed will significantly unwind the rate-driven rally that has nudged the DXY close to 100. On the other hand, the Chinese credit impulse has bottomed meaning bond investors will benefit from rising bond yields in China. Equity investors will also benefit from a cheaper market, as well as exposure to sectors that are primed to benefit as the global economy reopens. This combination could sustain the pace of foreign capital inflows. In the near term, USD/CNY is due for a bounce and could retrace to 6.5. It is also the case that a lot of the gains in the Chinese RMB have been front loaded, suggesting a flattish path ahead. Beyond the near term, we expect the DXY to hit 90 in the next 12-18 months, which will boost the RMB towards 6.0. Chester Ntonifor Foreign Exchange Strategist chestern@bcaresearch.com Footnotes 1 Reuters: https://www.reuters.com/markets/europe/what-is-chinas-onshore-yuan-clearing-settlement-system-cips-2022-02-28/ 2 Please see Chinese Investment Strategy Special Report, titled “Monitoring Chinese Capital Outflows,” dated March 20, 2019, available at cis.bcaresearch.com Strategic Themes Cyclical Recommendations Tactical Recommendations
Executive Summary The RMB And Real Interest Rates
The RMB And Real Interest Rates
The RMB And Real Interest Rates
The RMB has overshot and will likely consolidate gains in the coming months. That said, the yuan remains underpinned by a current account surplus, positive real rates, and a valuation cushion. This will support modest appreciation over the next 12-18 months (Feature Chart). The dollar is likely to enter a period of weakness beyond the Russo-Ukrainian crisis, underpinning a firm RMB. Yield spreads between China and the US will narrow across the bond curve, slowing the pace of any RMB appreciation. In its quest to dominate Asian trade flows, China will also seek a stable yuan which can be an anchor for regional currencies. Low volatility in the Chinese bond and currency market will increasingly make it an attractive hedge for global portfolio managers. This will encourage RMB inflows. The financial sanctions on Russia from the ongoing Ukrainian conflict will accelerate Chinese diversification from US assets. It will also boost the use of RMB in global trade, lifting its share in global FX reserves. Bottom Line: In the near term, USD/CNY is due for a bounce and could retrace to 6.5. It is also the case that a lot of the gains in the Chinese RMB have been frontloaded, suggesting a flattish path ahead. Beyond the near term, we expect the DXY to hit 90 in the next 12-18 months, which will boost the RMB towards 6.0. Feature The RMB has been strong across the board versus most major currencies (Chart 1). Year-to-date, the DXY dollar index is up 2% while the CFETS basket is up 3%. This places the Chinese yuan as one of the best performing major currencies this year. Such a configuration where USD/CNY diverges from the broad dollar trend has been very rare in recent history (Chart 2). More importantly, this has occurred amidst very low volatility. Chart 1A Bull Market In Yuans
A Bull Market In Yuans
A Bull Market In Yuans
Chart 2USD/CNY And The Dollar Diverge
USD/CNY And The Dollar Diverge
USD/CNY And The Dollar Diverge
In this Special Report, we try to understand the driving forces behind a rising RMB, to gauge its likely path going forward. In our view, while the yuan is vulnerable tactically, it is underpinned by strong structural forces that support modest appreciation over the next 12-18 months. The Chinese Economy, Interest Rates, And The RMB An exchange rate is simply a mechanism to equalize rates of returns across countries. For most currencies, the key determinants of this arbitrage window are real interest rate differentials. In China, while nominal interest rates vis-à-vis the US have been collapsing, real interest rate differentials are near a record high. This has been the key driver of a rising RMB (Chart 3). Real interest rates tend to matter because high and rising inflation destroys the purchasing power of any currency. Our bias is that higher real rates in China versus the US will persist and keep the RMB firm. Five key reasons underpin this view: The Chinese economy is expected to accelerate this year relative to the US. The IMF expects 4.8% GDP growth in China, versus 4% in the US. Bloomberg consensus estimates corroborate this view – 5.2% growth is expected for China this year, versus 3.6% for the US. Even the Chinese government’s GDP growth target this year is 5.5%, much higher than street estimates. US interest rates are likely to rise over the medium term, but so will those in China. The Chinese credit impulse has bottomed, and it is usually a good precursor to both stronger economic activity and higher relative government bond yields (Chart 4). Chart 3The RMB And Real Versus Nominal Rates
The RMB And Real Versus Nominal Rates
The RMB And Real Versus Nominal Rates
Chart 4Interest Rate Differentials And The Credit Impulse
Interest Rate Differentials And The Credit Impulse
Interest Rate Differentials And The Credit Impulse
While Chinese productivity growth is slowing, it remains structurally higher compared to that in the US or Europe. Stronger productivity growth suggests the neutral rate of interest in China will remain higher than in Western economies for years to come. This will continue to attract further fixed-income inflows. The RMB is a procyclical currency and tends to benefit when flows into emerging market assets in general, and Chinese stocks in particular, are fervent. While the Chinese authorities have cracked down on the property and information technology/communication service sectors, they have done so without causing widespread capital flight and hurting the RMB (Chart 5). Going forward, odds are that the interest from foreign bargain hunters will rise as these sectors reset from lower and much cheaper levels. It is well known that the Chinese economy has excess capacity, which is inherently deflationary (and positive for real rates). Like Japan, China has excess savings and deficient demand (Chart 6). However, in an inflationary world, this excess capacity can easily be exported, especially to the US, which is on the verge of overheating. A healthy trade balance in China suggests there is little reason for the RMB to depreciate meaningfully. Chart 6Excess Savings In China And Low Inflation
Excess Savings In China And Low Inflation
Excess Savings In China And Low Inflation
Chart 5The RMB And Chinese Equities
The RMB And Chinese Equities
The RMB And Chinese Equities
It is remarkable that despite being the largest commodity importer in the world, terms of trade in China is picking up. Rising terms of trade is usually synonymous with a stronger currency. On the flip side, a stronger currency will also temper inflationary pressures in China (Chart 7). Chart 7The RMB, Terms Of Trade And Inflation
The RMB, Terms Of Trade And Inflation
The RMB, Terms Of Trade And Inflation
The bottom line is that real interest rates will remain relatively high in China, even as the US begins to tighten monetary policy while China eases. The reason is that the US economy is much more inflationary, and Chinese bond yields tend to rise when the PBoC stimulates growth. Market Liberalization And Portfolio Flows With attractive real yields, Chinese bonds have been gaining widespread investor appeal. Their inclusion in the world’s three major bond indices has been a seminal milestone in the process of liberalizing the Chinese fixed-income market. Chinese bonds have also acted as perfect portfolio hedges, moving inversely to US and global equities (Chart 8). The result has been significant portfolio inflows into Chinese bonds. As a reminder, Chinese bonds were initially included in the Bloomberg Barclays Global Aggregate Index (BBGA) in April 2019. Following that, they were added to the JP Morgan Government Bond - Emerging Market Index (GBI-EM) in February 2020. Finally, FTSE Russell announced their inclusion of in the FTSE World Government Bond Index (WGBI) as of October 2021. Since their inclusion, a net US$350 billion has flowed into Chinese bonds. We estimate that about 35% of that has been due to index inclusion. The amount of Chinese onshore bonds held by overseas investors has breached US$600 billion, a record high (Chart 9). Chart 9A Healthy Appetite From Foreign Investors
A Healthy Appetite From Foreign Investors
A Healthy Appetite From Foreign Investors
Chart 8RMB Bonds As A Portfolio Hedge
RMB Bonds As A Portfolio Hedge
RMB Bonds As A Portfolio Hedge
In a nutshell, the path of the RMB in the short term will follow relative growth dynamics between China and the rest of the world, but structural factors such the inclusion of RMB bonds in global portfolios will underpin strong inflows into the Chinese fixed-income market. The Dollar, Trade, And Lessons From The Ukrainian Conflict Chart 10China Is Destocking USDs
China Is Destocking USDs
China Is Destocking USDs
Another factor to consider vis-à-vis the RMB is the dollar’s reserve status, and the overreach that it commands. Quite simply, transactions conducted in US dollars anywhere fall under US law. This means that if a company in any country buys energy from Iran and the transaction is done in US dollars, the Treasury has powers to sanction the parties involved. Russian holdings of US Treasurys peaked during the Georgian war and have since fallen to near 0% of total reserves. Even so, the world has witnessed how vulnerable the Russian economy has been to a cut-off from the Society For Worldwide Interbank Financial Telecommunication (SWIFT) messaging system. China is the largest holder of US Treasurys and what it decides to do with this war chest of savings is of critical importance. At a minimum, a few trends that have been underway in recent years are likely to accelerate. China will continue to destock its holding of Treasurys into gold and other currencies (Chart 10). This will put downward pressure on the dollar and boost the RMB. In fact, ever since China started destocking Treasurys in earnest in 2015, the DXY has been unable to sustainably punch through the 100 level. Trade flows in Asia remain rather buoyant, even as globalization has peaked (Chart 11A and 11B). With most Asian countries having China as a large trading partner, the logical step will be more and more invoicing in RMB. Most global trade hubs in history (such as Hong Kong for example) have always sought a stable currency with low volatility to instill confidence in trade. China is likely to also favor a stable RMB. Chart 11AChina Could Dominate Asian Trade
China Could Dominate Asian Trade
China Could Dominate Asian Trade
Chart 11BAsian Trade Is Booming
What Next For The RMB?
What Next For The RMB?
As Asian trade continues to expand, the PBoC can step in as the regional central bank and lender of last resort. It is notable that China is already engaging in this role. Since the global financial crisis, the number of bilateral swap lines offered to foreign central banks by the PBoC has ballooned (Chart 12). According to the most recent data (from the PBoC), the Chinese central bank had bilateral local currency swap agreements with central banks or monetary authorities in 40 countries and regions, with a total amount of around 4 trillion yuan. The People’s Bank of China has massive foreign exchange reserves, worth about US$3.2 trillion. This means it can provide swap agreements that will almost cover the totality of EM foreign dollar debt. The Cross-Border Interbank Payment System (CIPS) already allows the transfer and clearing of yuan-denominated payments. In 2021, the system processed US$12.7 trillion, a 75% increase in turnover from the previous year.1 While the system still largely relies on SWIFT messaging for most cross-border transactions, progress towards independence is moving fast. The key point is that as China continues to rise as an economic power and increases the share of RMB trade within its sphere of influence, the yuan will naturally become the de facto Asian currency. This will allow the RMB to continue to gain international appeal (Chart 13). Chart 12The People's Bank Of Asia?
What Next For The RMB?
What Next For The RMB?
Chart 13The RMB And International Appeal
The RMB And International Appeal
The RMB And International Appeal
Valuation Concerns Most of the discussion above has focused on the cyclical outlook for the Chinese economy and bond yields, as well as the geopolitical ramifications from the Russo-Ukrainian conflict. While the macro environment is by far the most important driver of currencies, valuation and sentiment tend to matter as well. On this note: Our productivity model suggests the RMB is at fair value. Productivity in China remains higher than among its western trading partners, but the gap has been closing. This has flattened the slope of the fair-value model (Chart 14). That said, the US and Europe are generating much higher inflation than China, suggesting there is higher pressure for unit labor costs to rise in these countries. This will improve the competitive profile of the RMB. Our PPP model for the RMB, using an apples-to-apples consumer basket vis-à-vis the US suggests the RMB is undervalued by 11% (Chart 15). Historically, such levels of undervaluation have seen the RMB appreciate by 2% per year over the next 4 years (Chart 16). Chart 14The RMB Is At Fair Value Based On Productivity Trends
The RMB Is At Fair Value Based On Productivity Trends
The RMB Is At Fair Value Based On Productivity Trends
Chart 15The RMB Is Cheap Based On Relative Prices
The RMB Is Cheap Based On Relative Prices
The RMB Is Cheap Based On Relative Prices
Chart 16Potential RMB Returns For Foreign Investors
Potential RMB Returns For Foreign Investors
Potential RMB Returns For Foreign Investors
Valuation tends to be important because it is usually the trigger for imbalances to manifest themselves. Back in 2015-20162 when Chinese capital outflows (especially illicit flows) were rampant amongst global and Chinese concerns, the RMB also happened to be very overvalued. Today, such a risk is much limited. Concluding Thoughts The RMB and the dollar tend to move in harmony, and so a discussion of one entails talking about the other. We have characterized the dollar this year as caught in a tug of war. Specifically, aggressive rate hikes by the Federal Reserve will boost interest rate differentials in favor of the US but undermine the equity market via a derating in stocks. This will tighten financial conditions, nudging the Fed to pivot. On the other hand, less accommodation by the Fed will significantly unwind the rate-driven rally that has nudged the DXY close to 100. On the other hand, the Chinese credit impulse has bottomed meaning bond investors will benefit from rising bond yields in China. Equity investors will also benefit from a cheaper market, as well as exposure to sectors that are primed to benefit as the global economy reopens. This combination could sustain the pace of foreign capital inflows. In the near term, USD/CNY is due for a bounce and could retrace to 6.5. It is also the case that a lot of the gains in the Chinese RMB have been front loaded, suggesting a flattish path ahead. Beyond the near term, we expect the DXY to hit 90 in the next 12-18 months, which will boost the RMB towards 6.0. Chester Ntonifor Foreign Exchange Strategist chestern@bcaresearch.com Footnotes 1 Reuters: https://www.reuters.com/markets/europe/what-is-chinas-onshore-yuan-clearing-settlement-system-cips-2022-02-28/ 2 Please see Chinese Investment Strategy Special Report, titled “Monitoring Chinese Capital Outflows,” dated March 20, 2019, available at cis.bcaresearch.com Trades & Forecasts Strategic View Tactical Holdings (0-6 months) Limit Orders Forecast Summary
Executive Summary The RMB And Real Interest Rates
The RMB And Real Interest Rates
The RMB And Real Interest Rates
The RMB has overshot and will likely consolidate gains in the coming months. The said, the yuan remains underpinned by a current account surplus, positive real rates, and a valuation cushion. This will support modest appreciation over the next 12-18 months (Feature Chart). The dollar is likely to enter a period of weakness beyond the Russo-Ukrainian crisis, underpinning a firm RMB. Yield spreads between China and the US will narrow across the bond curve, slowing the pace of any RMB appreciation. In its quest to dominate Asian trade flows, China will also seek a stable yuan which can be an anchor for regional currencies. Low volatility in the Chinese bond and currency market will increasingly make it an attractive hedge for global portfolio managers. This will encourage RMB inflows. The financial sanctions on Russia from the ongoing Ukrainian conflict will accelerate Chinese diversification from US assets. It will also boost the use of RMB in global trade, lifting its share in global FX reserves. Bottom Line: In the near term, USD/CNY is due for a bounce and could retrace to 6.5. It is also the case that a lot of the gains in the Chinese RMB have been frontloaded, suggesting a flattish path ahead. Beyond the near term, we expect the DXY to hit 90 in the next 12-18 months, which will boost the RMB towards 6.0. Feature The RMB has been strong across the board versus most major currencies (Chart 1). Year-to-date, the DXY dollar index is up 2% while the CFETS basket is up 3%. This places the Chinese yuan as one of the best performing major currencies this year. Such a configuration where USD/CNY diverges from the broad dollar trend has been very rare in recent history (Chart 2). More importantly, this has occurred amidst very low volatility. Chart 1A Bull Market In Yuans
A Bull Market In Yuans
A Bull Market In Yuans
Chart 2USD/CNY And The Dollar Diverge
USD/CNY And The Dollar Diverge
USD/CNY And The Dollar Diverge
In this Special Report, we try to understand the driving forces behind a rising RMB, to gauge its likely path going forward. In our view, while the yuan is vulnerable tactically, it is underpinned by strong structural forces that support modest appreciation over the next 12-18 months. The Chinese Economy, Interest Rates, And The RMB An exchange rate is simply a mechanism to equalize rates of returns across countries. For most currencies, the key determinants of this arbitrage window are real interest rate differentials. In China, while nominal interest rates vis-à-vis the US have been collapsing, real interest rate differentials are near a record high. This has been the key driver of a rising RMB (Chart 3). Real interest rates tend to matter because high and rising inflation destroys the purchasing power of any currency. Our bias is that higher real rates in China versus the US will persist and keep the RMB firm. Five key reasons underpin this view: The Chinese economy is expected to accelerate this year relative to the US. The IMF expects 4.8% GDP growth in China, versus 4% in the US. Bloomberg consensus estimates corroborate this view – 5.2% growth is expected for China this year, versus 3.6% for the US. Even the Chinese government’s GDP growth target this year is 5.5%, much higher than street estimates. US interest rates are likely to rise over the medium term, but so will those in China. The Chinese credit impulse has bottomed, and it is usually a good precursor to both stronger economic activity and higher relative government bond yields (Chart 4). Chart 3The RMB And Real Versus Nominal Rates
The RMB And Real Versus Nominal Rates
The RMB And Real Versus Nominal Rates
Chart 4Interest Rate Differentials And The Credit Impulse
Interest Rate Differentials And The Credit Impulse
Interest Rate Differentials And The Credit Impulse
While Chinese productivity growth is slowing, it remains structurally higher compared to that in the US or Europe. Stronger productivity growth suggests the neutral rate of interest in China will remain higher than in Western economies for years to come. This will continue to attract further fixed-income inflows. The RMB is a procyclical currency and tends to benefit when flows into emerging market assets in general, and Chinese stocks in particular, are fervent. While the Chinese authorities have cracked down on the property and information technology/communication service sectors, they have done so without causing widespread capital flight and hurting the RMB (Chart 5). Going forward, odds are that the interest from foreign bargain hunters will rise as these sectors reset from lower and much cheaper levels. It is well known that the Chinese economy has excess capacity, which is inherently deflationary (and positive for real rates). Like Japan, China has excess savings and deficient demand (Chart 6). However, in an inflationary world, this excess capacity can easily be exported, especially to the US, which is on the verge of overheating. A healthy trade balance in China suggests there is little reason for the RMB to depreciate meaningfully. Chart 6Excess Savings In China And Low Inflation
Excess Savings In China And Low Inflation
Excess Savings In China And Low Inflation
Chart 5The RMB And Chinese Equities
The RMB And Chinese Equities
The RMB And Chinese Equities
It is remarkable that despite being the largest commodity importer in the world, terms of trade in China is picking up. Rising terms of trade is usually synonymous with a stronger currency. On the flip side, a stronger currency will also temper inflationary pressures in China (Chart 7). Chart 7The RMB, Terms Of Trade And Inflation
The RMB, Terms Of Trade And Inflation
The RMB, Terms Of Trade And Inflation
The bottom line is that real interest rates will remain relatively high in China, even as the US begins to tighten monetary policy while China eases. The reason is that the US economy is much more inflationary, and Chinese bond yields tend to rise when the PBoC stimulates growth. Market Liberalization And Portfolio Flows With attractive real yields, Chinese bonds have been gaining widespread investor appeal. Their inclusion in the world’s three major bond indices has been a seminal milestone in the process of liberalizing the Chinese fixed-income market. Chinese bonds have also acted as perfect portfolio hedges, moving inversely to US and global equities (Chart 8). The result has been significant portfolio inflows into Chinese bonds. As a reminder, Chinese bonds were initially included in the Bloomberg Barclays Global Aggregate Index (BBGA) in April 2019. Following that, they were added to the JP Morgan Government Bond - Emerging Market Index (GBI-EM) in February 2020. Finally, FTSE Russell announced their inclusion of in the FTSE World Government Bond Index (WGBI) as of October 2021. Since their inclusion, a net US$350 billion has flowed into Chinese bonds. We estimate that about 35% of that has been due to index inclusion. The amount of Chinese onshore bonds held by overseas investors has breached US$600 billion, a record high (Chart 9). Chart 9A Healthy Appetite From Foreign Investors
A Healthy Appetite From Foreign Investors
A Healthy Appetite From Foreign Investors
Chart 8RMB Bonds As A Portfolio Hedge
RMB Bonds As A Portfolio Hedge
RMB Bonds As A Portfolio Hedge
In a nutshell, the path of the RMB in the short term will follow relative growth dynamics between China and the rest of the world, but structural factors such the inclusion of RMB bonds in global portfolios will underpin strong inflows into the Chinese fixed-income market. The Dollar, Trade, And Lessons From The Ukrainian Conflict Chart 10China Is Destocking USDs
China Is Destocking USDs
China Is Destocking USDs
Another factor to consider vis-à-vis the RMB is the dollar’s reserve status, and the overreach that it commands. Quite simply, transactions conducted in US dollars anywhere fall under US law. This means that if a company in any country buys energy from Iran and the transaction is done in US dollars, the Treasury has powers to sanction the parties involved. Russian holdings of US Treasurys peaked during the Georgian war and have since fallen to near 0% of total reserves. Even so, the world has witnessed how vulnerable the Russian economy has been to a cut-off from the Society For Worldwide Interbank Financial Telecommunication (SWIFT) messaging system. China is the largest holder of US Treasurys and what it decides to do with this war chest of savings is of critical importance. At a minimum, a few trends that have been underway in recent years are likely to accelerate. China will continue to destock its holding of Treasurys into gold and other currencies (Chart 10). This will put downward pressure on the dollar and boost the RMB. In fact, ever since China started destocking Treasurys in earnest in 2015, the DXY has been unable to sustainably punch through the 100 level. Trade flows in Asia remain rather buoyant, even as globalization has peaked (Chart 11A and 11B). With most Asian countries having China as a large trading partner, the logical step will be more and more invoicing in RMB. Most global trade hubs in history (such as Hong Kong for example) have always sought a stable currency with low volatility to instill confidence in trade. China is likely to also favor a stable RMB. Chart 11AChina Could Dominate Asian Trade
China Could Dominate Asian Trade
China Could Dominate Asian Trade
Chart 11BAsian Trade Is Booming
What Next For The RMB?
What Next For The RMB?
As Asian trade continues to expand, the PBoC can step in as the regional central bank and lender of last resort. It is notable that China is already engaging in this role. Since the global financial crisis, the number of bilateral swap lines offered to foreign central banks by the PBoC has ballooned (Chart 12). According to the most recent data (from the PBoC), the Chinese central bank had bilateral local currency swap agreements with central banks or monetary authorities in 40 countries and regions, with a total amount of around 4 trillion yuan. The People’s Bank of China has massive foreign exchange reserves, worth about US$3.2 trillion. This means it can provide swap agreements that will almost cover the totality of EM foreign dollar debt. The Cross-Border Interbank Payment System (CIPS) already allows the transfer and clearing of yuan-denominated payments. In 2021, the system processed US$12.7 trillion, a 75% increase in turnover from the previous year.1 While the system still largely relies on SWIFT messaging for most cross-border transactions, progress towards independence is moving fast. The key point is that as China continues to rise as an economic power and increases the share of RMB trade within its sphere of influence, the yuan will naturally become the de facto Asian currency. This will allow the RMB to continue to gain international appeal (Chart 13). Chart 12The People's Bank Of Asia?
What Next For The RMB?
What Next For The RMB?
Chart 13The RMB And International Appeal
The RMB And International Appeal
The RMB And International Appeal
Valuation Concerns Most of the discussion above has focused on the cyclical outlook for the Chinese economy and bond yields, as well as the geopolitical ramifications from the Russo-Ukrainian conflict. While the macro environment is by far the most important driver of currencies, valuation and sentiment tend to matter as well. On this note: Our productivity model suggests the RMB is at fair value. Productivity in China remains higher than among its western trading partners, but the gap has been closing. This has flattened the slope of the fair-value model (Chart 14). That said, the US and Europe are generating much higher inflation than China, suggesting there is higher pressure for unit labor costs to rise in these countries. This will improve the competitive profile of the RMB. Our PPP model for the RMB, using an apples-to-apples consumer basket vis-à-vis the US suggests the RMB is undervalued by 11% (Chart 15). Historically, such levels of undervaluation have seen the RMB appreciate by 2% per year over the next 4 years (Chart 16). Chart 14The RMB Is At Fair Value Based On Productivity Trends
The RMB Is At Fair Value Based On Productivity Trends
The RMB Is At Fair Value Based On Productivity Trends
Chart 15The RMB Is Cheap Based On Relative Prices
The RMB Is Cheap Based On Relative Prices
The RMB Is Cheap Based On Relative Prices
Chart 16Potential RMB Returns For Foreign Investors
Potential RMB Returns For Foreign Investors
Potential RMB Returns For Foreign Investors
Valuation tends to be important because it is usually the trigger for imbalances to manifest themselves. Back in 2015-20162 when Chinese capital outflows (especially illicit flows) were rampant amongst global and Chinese concerns, the RMB also happened to be very overvalued. Today, such a risk is much limited. Concluding Thoughts The RMB and the dollar tend to move in harmony, and so a discussion of one entails talking about the other. We have characterized the dollar this year as caught in a tug of war. Specifically, aggressive rate hikes by the Federal Reserve will boost interest rate differentials in favor of the US but undermine the equity market via a derating in stocks. This will tighten financial conditions, nudging the Fed to pivot. On the other hand, less accommodation by the Fed will significantly unwind the rate-driven rally that has nudged the DXY close to 100. On the other hand, the Chinese credit impulse has bottomed meaning bond investors will benefit from rising bond yields in China. Equity investors will also benefit from a cheaper market, as well as exposure to sectors that are primed to benefit as the global economy reopens. This combination could sustain the pace of foreign capital inflows. In the near term, USD/CNY is due for a bounce and could retrace to 6.5. It is also the case that a lot of the gains in the Chinese RMB have been front loaded, suggesting a flattish path ahead. Beyond the near term, we expect the DXY to hit 90 in the next 12-18 months, which will boost the RMB towards 6.0. Chester Ntonifor Foreign Exchange Strategist chestern@bcaresearch.com Footnotes 1 Reuters: https://www.reuters.com/markets/europe/what-is-chinas-onshore-yuan-clearing-settlement-system-cips-2022-02-28/ 2 Please see Chinese Investment Strategy Special Report, titled “Monitoring Chinese Capital Outflows,” dated March 20, 2019, available at cis.bcaresearch.com Trades & Forecasts Strategic View Tactical Holdings (0-6 months) Limit Orders Forecast Summary
Executive Summary Tight Inventories Spike Metals
Commodities' Watershed Moment
Commodities' Watershed Moment
Russia's war against Ukraine is a watershed moment, which will realign production, distribution and consumption of commodities globally. The development of new sources of the critical metals desperately needed to build out renewable energy grids and the drive to secure access to oil, gas and coal will intensify along political lines. China, reinforced by Russia, will lead the East, while the US and its allies will lead the West, in a redux of the Cold War. Local politics will intrude on this process, as left-of-center governments in important commodity-producing states secure their electoral victories and claim greater shares of commodity revenues. The rebuilding of defense systems, particularly in Europe, will compete with the renewable-energy transition. This will stress already-tight metals markets, where low inventories will predispose markets to higher volatility a la this week's oil, natgas and nickel price spikes. This will retard economic growth. In the short term, CO2 emissions will surge. Longer term, the transition to net-zero carbon emissions by 2050 will be pushed back years, as states compete for access to commodities. East-West trade restrictions and hoarding of commodities secured via trade within these respective blocs, as is occurring presently, will increase. Bottom Line: Russia's war against Ukraine is a watershed moment. The development of new sources of the critical metals desperately needed to build out renewable energy grids, and the drive to secure access to oil, gas and coal will intensify. China, reinforced by Russia, will lead the East, while the US and its allies will lead the West, in a redux of the Cold War. Feature Russia's war with Ukraine provoked a watershed moment for Europe: Leaders suddenly realized they had to reverse decades of energy dependence on Russia, rebuild their militaries, and sustain a massive buildout of the continent's renewable-energy generation and grid. This occurred as inventories of the basic commodities required to achieve all of these objectives were stretched so tight that the mere threat of the cutoff of pipeline natural gas was enough to send benchmark EU natgas prices to a record $113/MMBtu, up nearly 80% from the previous day's close before it settled back to still-elevated levels (Chart 1). Oil inventories also were stretched extremely thin even before Russia launched its invasion of Ukraine 24 February (Chart 2). The situation is not improving, since, in the wake of the Ukraine war, numerous refiners and trading companies now are observing self-imposed sanctions against taking any Russian oil or refined products. It is worthwhile remembering this began before the US and UK announced they would ban all imports of Russian material this week.1 This will stretch supply chains by unknow durations – the movement of crude from Russia to a refiner could take months instead of weeks, until new trade patterns are established. Chart 1Little Flex In EU Gas Inventories
Commodities' Watershed Moment
Commodities' Watershed Moment
Chart 2Little Flex In EU Gas Inventories
Little Flex In EU Gas Inventories
Little Flex In EU Gas Inventories
Global economic and policy uncertainty is massively elevated, with percent changes in oil and gas prices swinging on a double-digit basis daily. This makes it extremely difficult to bid or offer oil cargoes in the physical market or make markets (i.e., bid or offer) in the futures markets, which has the effect of compounding uncertainty and volatility. Fundamentals – supply, demand and inventories – take a back seat to fear and uncertainty in such markets. This makes it virtually impossible to assign a probability to any price outcomes based on supply and demand – the true definition of uncertainty in the Frank Knight sense – and to make long-term capex decisions over the long term.2 We raised our 2022 and 2023 Brent forecasts on the back of the massive uncertainty in the markets to $90/bbl and $85/bbl, respectively, right after Russia's invasion of Ukraine. We assume 1Q22 Brent will average $100/bbl. We expect core OPEC 2.0 producers – Saudi Arabia, UAE and Kuwait – will increase production beginning in 2Q22; US shale-oil output will rise, and ~ 1.2mm b/d of Iranian production will return to market in 2H22. Among the risks to our forecasts are a failure by core OPEC 2.0 to lift output (we expect an announcement at the end of this month when the producer coalition meets); lower-than-expected US shale output, and a failure to resolve the Iran nuclear deal with the US. Our modeling indicated these outcomes could lift Brent to between $120/bbl and $140/bbl by 2023 (Chart 3). We will be updating our forecasts next week.3 Chart 3Brent Forwards Lift
Brent Forwards Lift
Brent Forwards Lift
EU's Watershed Metals Moment EU leadership is setting out to reverse decades of energy dependence on Russia, rebuild their militaries, and sustain a massive buildout of the continent's renewable-energy grid, all a result of the Ukraine war. This will require massive investment in metals mining and refining, along with steel-making capacity. Already, Germany is pledging to increase LNG import capacity and measures to reduce its dependence on Russian natural gas by 75% this year.4 The EU is looking to restore its natgas inventories to 90% of capacity before next winter, and has pledged to double down on renewables, in order to remove member-state dependence on Russian energy exports.5 These ambitious goals are up against the hard reality of scarce base metals supply globally. This will be exacerbated going forward by actions taken by and against Russia. The Russia-Ukraine crisis will destabilize metal markets, given supply uncertainty from Russia and its contribution to global supply. The commodities heavyweight constitutes 6%, 5% and 4% of global primary aluminum, refined nickel and copper production. Against the backdrop of very low global inventories in these metals (Chart 4), the prices of all three hit record highs over the last few days due to uncertain supply (Chart 5). LME nickel prices more than quadrupled on Tuesday as traders rushed to cover short positions and margin calls. Chart 4Low Inventories...
Low Inventories...
Low Inventories...
Chart 5...Lead To Price Volatility
...Lead To Price Volatility
...Lead To Price Volatility
Uncertainty has engulfed metal markets, with a Western ban on Russian metal imports still a possibility. Putin’s announcement regarding raw material export restrictions will further fuel supply uncertainty.6 As in the case of oil, private entities’ self-sanctioning, sanctions on the Russian financial system, and war-related supply chain disruptions are causing current Russian metal export disruptions.7 So far, Western sanctions on commodities have not directly interfered with metal flows from Russia. But markets are taking it day to day. Supply disruptions and sanctions force the formation of new trade patterns, as private entities aim to maximize arbitrage opportunities. For example, high European aluminum price spreads incentivized shipments from China, the world’s largest producer and consumer of refined aluminum. Normally, Europe relies on Russia for aluminum supplies. Rising European physical premiums for delivered metal, caused by Russian export disruptions, will see trading companies take advantage of arbitrage opportunities in other commodities as well. Europe's Risk Profile Rising Since the Ukraine war began, rising European physical premiums in commodities ranging from metals to natgas indicate the continent – more so than others – is particularly vulnerable to Russian export disruptions. Europe’s reliance on Russian energy and its supply disruptions will raise operating costs for smelters and refiners on the continent, threatening smelter shutdowns similar to those we saw this past winter. Markets were expecting power price relief over the warmer months and higher smelting activity. Elevated fuel and power prices, however, will constrain metals refining in Europe, and could shut or close even more smelters, keeping refined metals supply scarce and prices high. Rebuilding Europe's Defenses EU leaders are scheduled to take up a new energy and defense funding proposal today, which media reports are describing as "massive" (no detail provided ahead of the meeting, of course). This program reportedly will be akin to the EU's $2 trillion COVID-relief fund.8 The EU's fast response to defense shortfalls comes against the backdrop discussed above regarding super-tight metals markets, which now face a further complication of unpredictable local politics in metals-producing states. Some of these states have voted left-of-center governments into office, which now appear to be intent on nationalizing mining operations.9 Chile, e.g., accounts for ~ 30% of global copper ore output, and is in the process of re-writing its constitution, which will change tax and royalty law, and could pave the way for nationalization of copper and lithium mines. This political risk compounds any long-term planning operations by consumers like the EU and producers. Investment Implications Energy markets – broadly defined to include oil, gas and coal along with the base metals required for renewables and their supporting grids and electric vehicles – are being rocked by Russia's war with Ukraine. Base metals, in particular, will have to find price levels that destroy demand among competing uses, if the EU's dual-track plan to build out its renewables generation and restore a military capability is approved. A "massive" funding effort in Europe, coupled with equally massive efforts in the US and China – both intent on building out their renewable generation and grids, as well as expanding their defensive capabilities – will be extremely difficult to pull off. Critical base metals inventories remain low, and prices are high because demand exceeds supply for the foreseeable future (Chart 6). Chart 6Tight Inventories Spike Metals
Commodities' Watershed Moment
Commodities' Watershed Moment
The EU will join a world in which the other two great economic centers – the US and China – will engage in a geopolitical competition over access to and control of scarce base metals, oil, gas and coal resources. Russia will remain aggressive toward the West, at least until the Putin regime falls, and will play an ancillary role to China. Fossil fuels and base metals have been starved for capex for more than a decade. Governmental pronouncements will not reverse this. These markets will remain tight, and will get tighter in order to allocate increasingly scarce supply with rapidly growing demand. As such, we remain long commodity-index exposure (S&P GSCI and the COMT ETF), along with equity exposure to oil and gas producers via the XOP ETF, and the XME and PICK ETFs to retain exposure to base metals and bulks producers and traders. Robert P. Ryan Chief Commodity & Energy Strategist rryan@bcaresearch.com Ashwin Shyam Research Associate Commodity & Energy Strategy ashwin.shyam@bcaresearch.com Footnotes 1 Please see Russian tankers at sea despite ‘big unknown’ over who will buy oil, published by ft.com on March 7, 2022. 2 Please see Explained: Knightian uncertainty, published by mit.edu for discussion. 3 Please see Oil Risk Premium Abates, But Still Remains, which we published on February 25, 2022. 4 Please see Germany Revives LNG Import Plans to Cut Reliance on Russian Natural Gas in Marked Policy Shift, published by naturalgasintel.com on March 1, 2022. 5 Please see Climate change: EU unveils plan to end reliance on Russian gas, published by bbc.co.uk on March 8, 2022, and The EU plan to drastically ramp renewables to replace Russian gas, published by pv-magazine.com on March 9, 2022. 6 Please see Russia to Omit Raw Material Exports but Omits Details, published by Bloomberg on March 9, 2022. 7 Please see here for Which companies have stopped doing business with Russia? 8 Please see Ukraine: ECB governing council to meet as crisis intensifies, published on March 8, 2022 by greencentralbanking.com. 9 Please see Chile a step closer to nationalizing copper and lithium, published by mining.com on March 7, 2022, and Add Local Politics To Copper Supply Risks, which we published on November 25, 2021. Investment Views and Themes Recommendations Strategic Recommendations
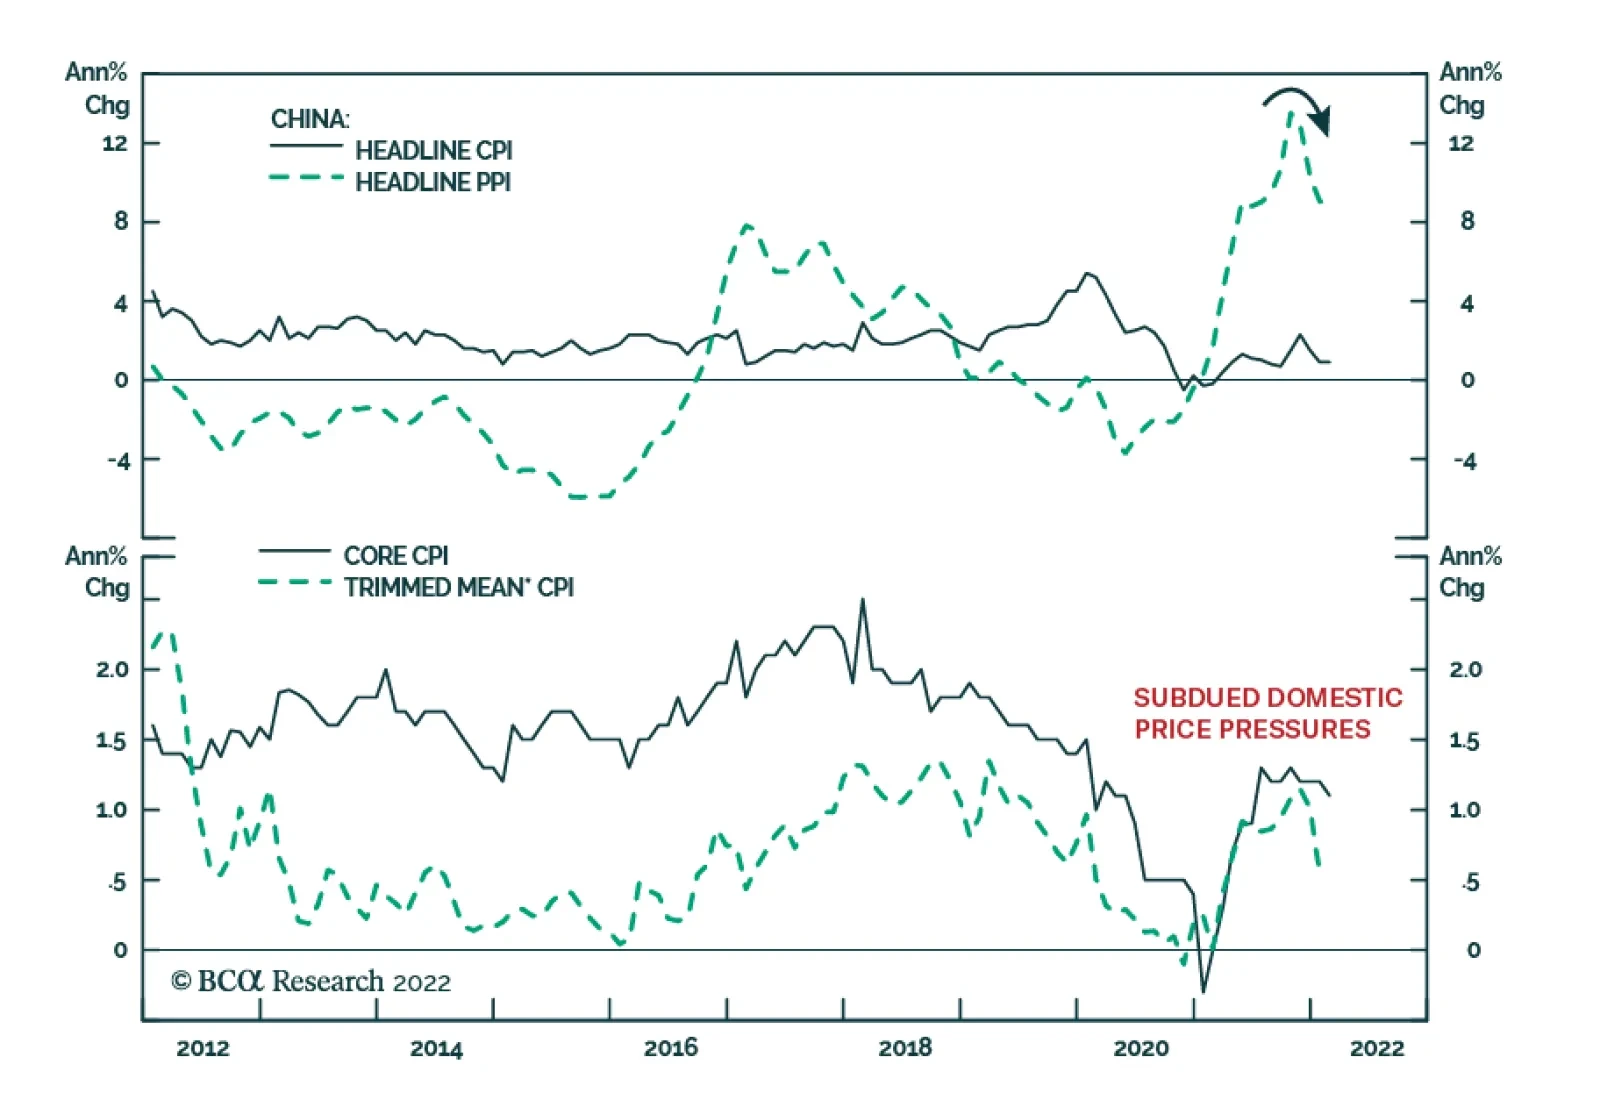
Price pressures in China eased in February. The producer price index increased by 8.8% – the slowest pace in eight months and below January’s 9.1% y/y growth rate. Meanwhile, CPI inflation was unchanged at January’s 0.9% y/y. Surging commodity prices due…
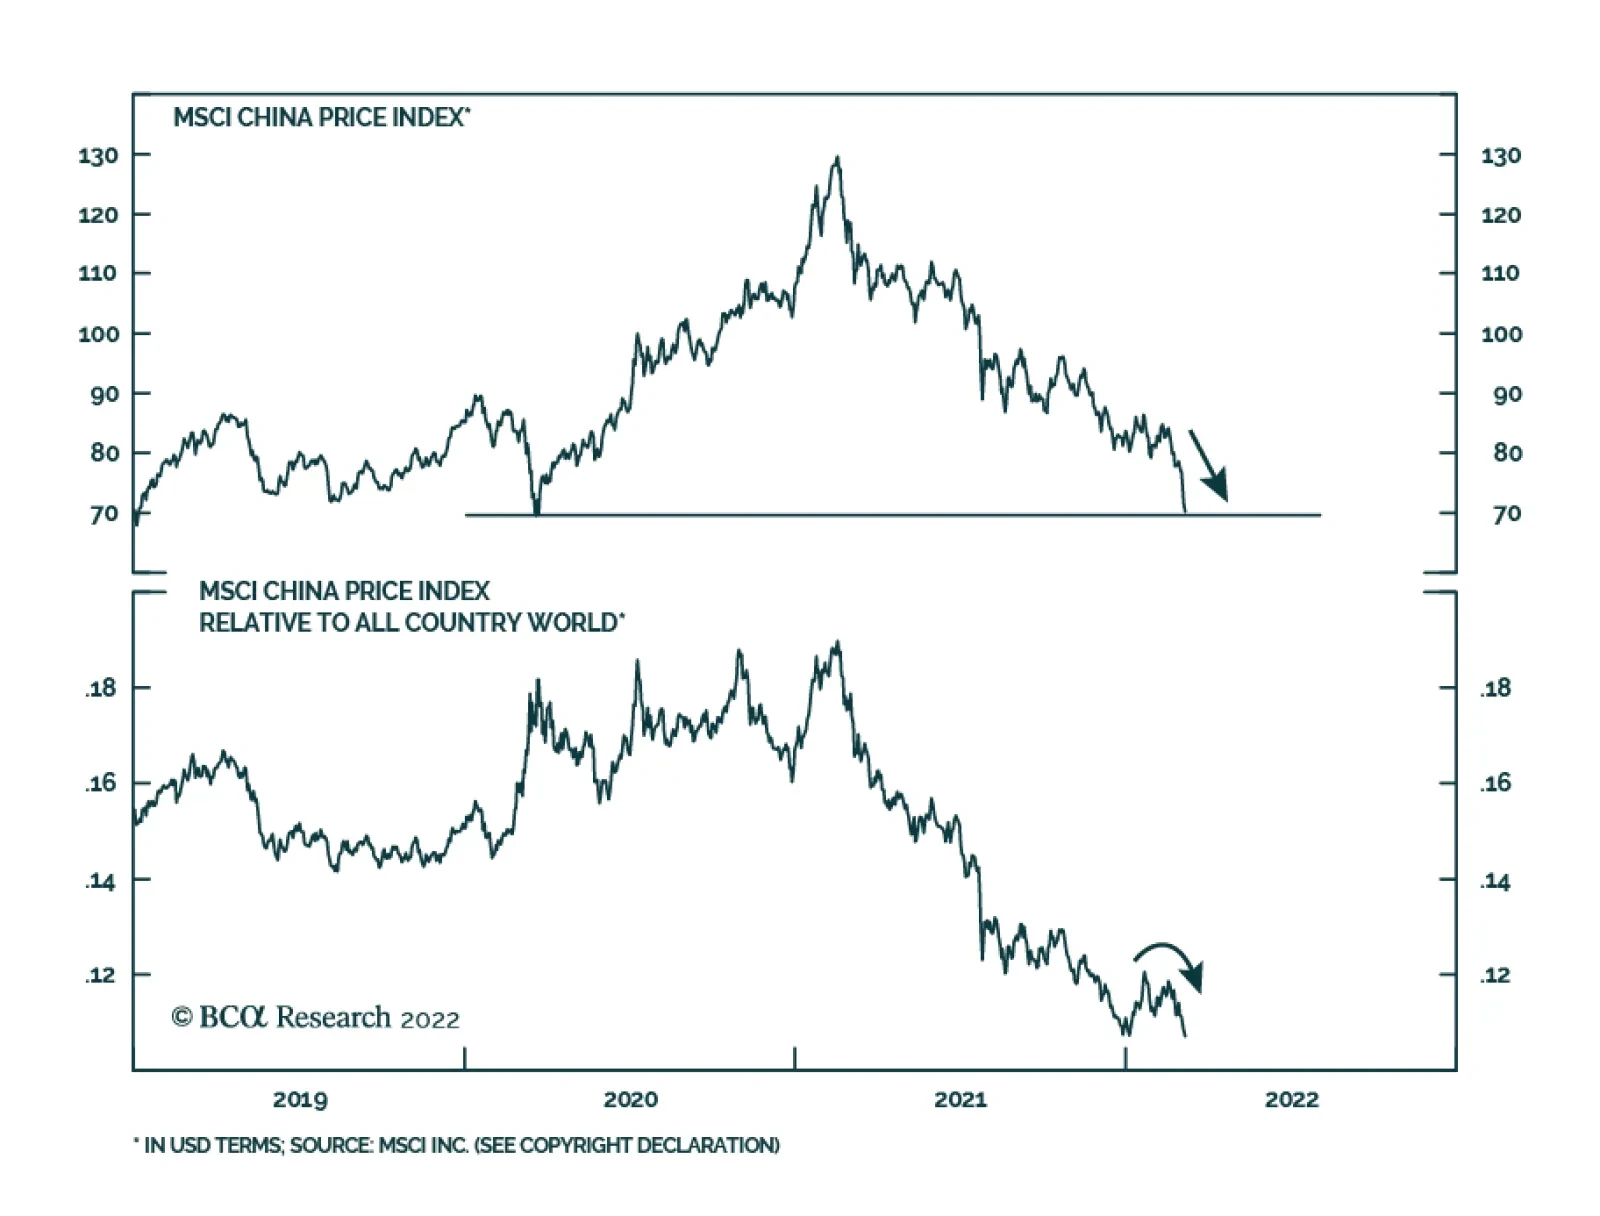
Chinese investable stocks have collapsed 12.4% since the start of the Russia-Ukraine war in late-February. The MSCI investable index is now at its mid-March 2020 pandemic low. Several factors are contributing to the selloff. First, domestic economic…
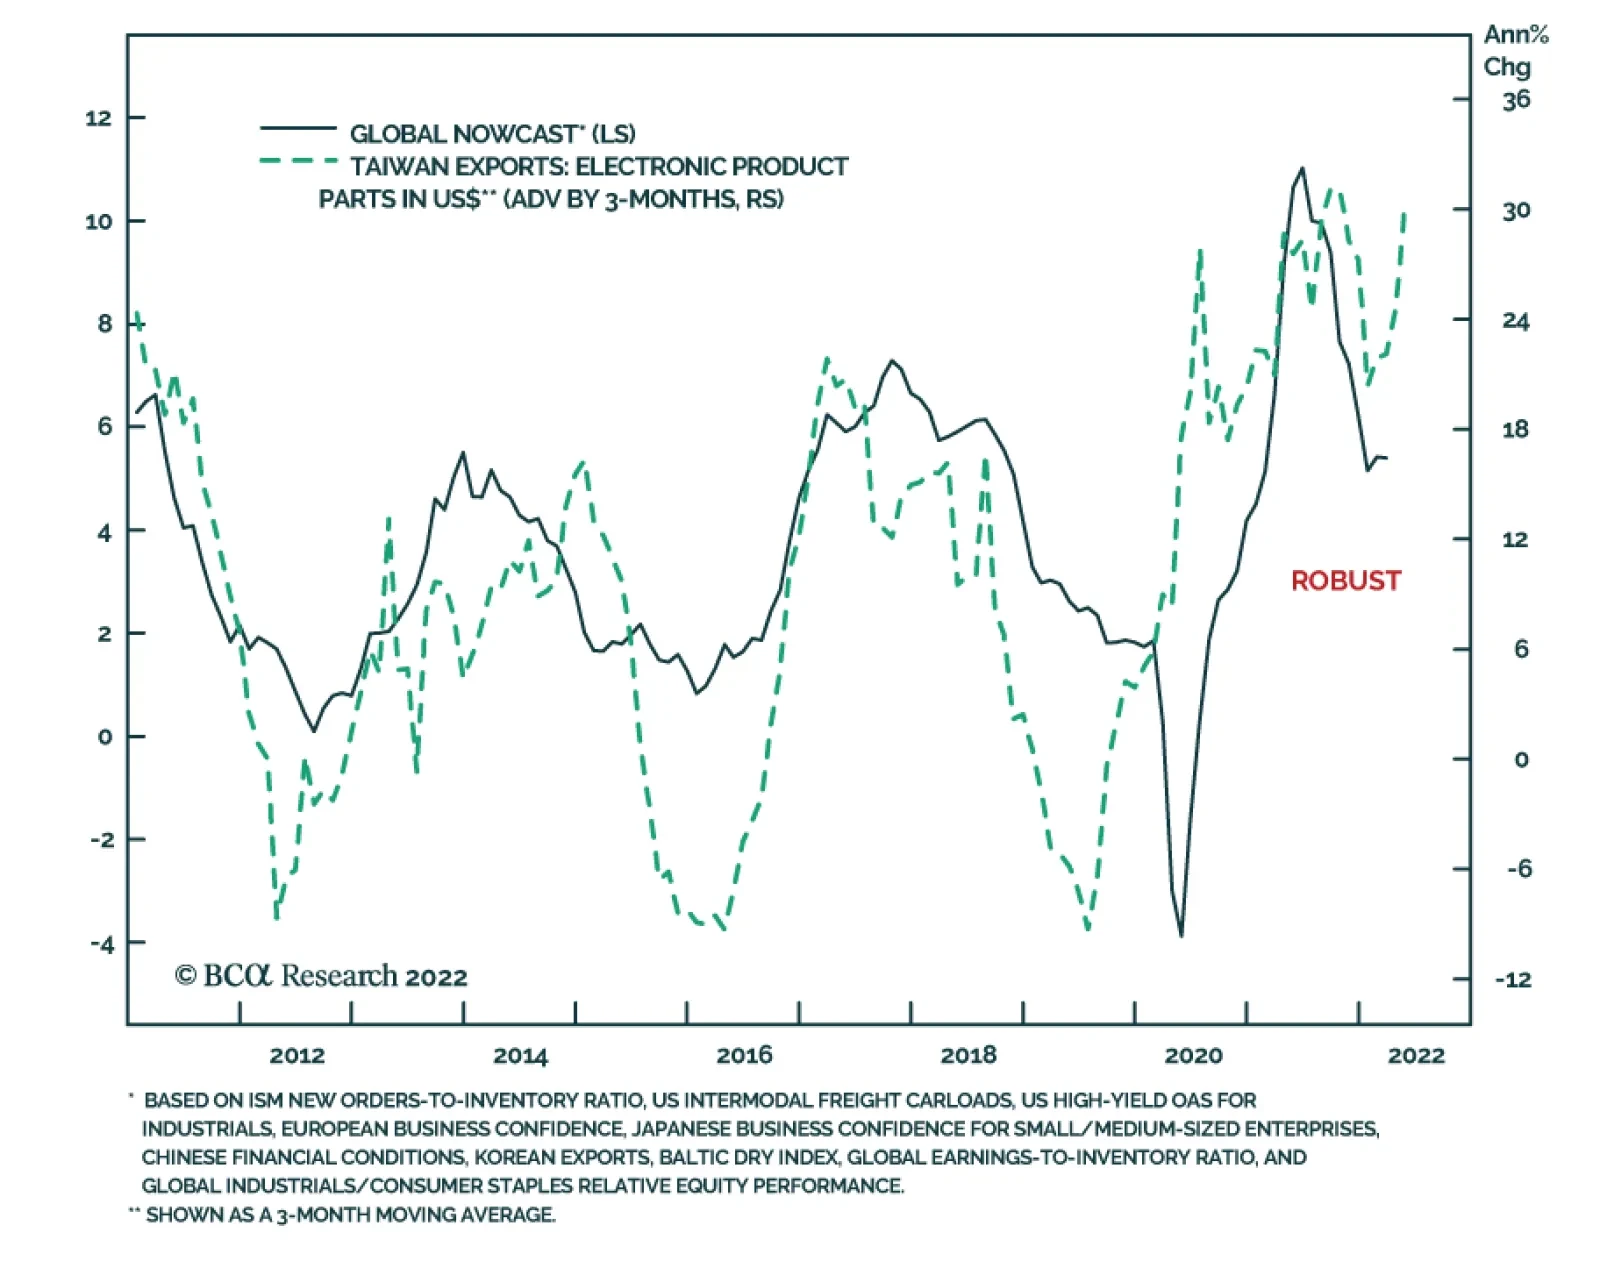
Taiwanese exports surged 34.8% y/y in February – accelerating from January’s 16.7% increase and more than double expectations of 15.7% y/y. In particular, exports of electronic product parts – which account for roughly 40% of total exports – were up 47% y/y…
Executive Summary Euro Natgas Soars; LME Nickel Squeezed
Euro Natgas, Nickel Soar
Euro Natgas, Nickel Soar
Russian Energy Minister Alexander Novak's threat to halt shipmentsof natgas on Nord Stream 1 to Europe lifted European gas prices 25% overnight, and will reverberate for years. We make the odds of a cut-off of Russian natgas exports to the EU low but not extremely low. Russia’s war is about the status of Ukraine. Russia needs the EU markets, and the EU needs Russia's gas. However, if Russia follows through on Novak's threat, it would be a major disruption for gas markets in the short term. Over the medium to long term, US shale gas producers, LNG terminal operators and exporters will benefit from new demand. On the import side, China likely benefits most from Russia's need to re-route gas. But this will require substantial infrastructure investment to monetize Russia's gas supplies and as such will take years to realize. Separately, the LME has shut down its nickel markets following an explosive 250% rally over two days that took prices above $100,000/MT. Nickel settled at ~ $80,000/MT before the LME closed the market today for margin calls on shorts squeezed by the surge in prices to make margin calls. Bottom Line: We remain long commodity-index exposure (S&P GSCI and the COMT ETF), along with equity exposure to oil and gas producers via the XOP ETF. We also remain long the XME and PICK ETFs to retain exposure to base metals and bulks.