China

Executive Summary The Ukraine war reinforces our key view that commodity producers will use their geopolitical leverage this year. The market is growing complacent again about Russian risks. Iran is part of the same dynamic. If US-Iran talks fail, as we expect, the Middle East will destabilize and add another energy supply risk on top of the Russian risk. The Ukraine war also interacts with our other two key views for 2022: China’s reversion to autocracy and the US’s policy insularity. Both add policy uncertainty and weigh on risk sentiment. The war also reinforces our strategic themes for the 2020s: Great Power Rivalry, Hypo-Globalization, and Populism/Nationalism. Stagflation Cometh
Stagflation Cometh
Stagflation Cometh
Trade Recommendation Inception Date Return Cyclically Long Global Defensives Versus Cyclicals 2022-01-20 10.8% Bottom Line: Tactically stay long global defensives and large caps. Cyclically stay long gold, US equities, aerospace/defense, and cyber security. Feature In our annual outlook, “The Gathering Storm,” we argued that the post-pandemic world economy would destabilize due to intensifying rivalry among the leading nations. We argued that China’s reversion to autocracy, US domestic divisions, and Russia’s commodity leverage would produce a toxic brew for global investors in 2022. By January 27 it was clear to us that Russia would invade Ukraine, so the storm was arriving sooner than we thought, and we doubled down on our defensive and risk-averse market positioning. We derived these three key views from new cyclical trends and the way they interact with our underlying strategic themes – Great Power Rivalry, Hypo-Globalization, and Populism/Nationalism (Table 1). These themes are mutually reinforcing, rooted in solid evidence over many years, and will not change easily. Table 1Three Geopolitical Strategic Themes
Second Quarter Outlook 2022: When It Rains, It Pours
Second Quarter Outlook 2022: When It Rains, It Pours
Related Report Geopolitical Strategy2022 Key Views: The Gathering Storm The Ukraine war reinforces them: Russia took military action to increase its security relative to the US and NATO; the West imposed sanctions that reduce globalization with Russia and potentially other states; Russian aggression stemmed from nationalism and caused a spike in global prices that will spur more nationalism and populism going forward. In this report we examine how these trends will develop in the second quarter and beyond. We see stagflation taking shape and recommend investors prepare for it by continuing to favor defensive sectors, commodities, and value plays. Checking Up On Our Russia View For 2022 Our third key view for 2022 – that oil producers like Russia and Iran possessed immense geopolitical leverage and would most likely use it – is clearly the dominant geopolitical trend of the year, as manifested in the Russian invasion of Ukraine.1 Russia first invaded Ukraine in 2014 and curtailed operations after commodity prices crashed. It launched a new and larger invasion in 2022 when a new commodity cycle began (Chart 1). Facing tactical setbacks, Russia has begun withdrawing forces from around the Ukrainian capital Kyiv. But it will redouble its efforts to conquer the eastern Donbas region and the southern coastline. The coast is the most strategic territory at stake (Map 1). Chart 1Russia's Commodity-Enabled Aggression
Russia's Commodity-Enabled Aggression
Russia's Commodity-Enabled Aggression
Map 1Russian Invasion Of Ukraine, 2022
Second Quarter Outlook 2022: When It Rains, It Pours
Second Quarter Outlook 2022: When It Rains, It Pours
The most decisive limitation on Russia’s military effort would come from a collapse of commodity exports or prices, which has not happened yet. Europe continues to buy Russian oil and natural gas, although it is debating a ban on the $4.4 billion worth of coal that it imports. With high energy prices making up for a drop in export volumes, Russian armed forces can still attempt a summer and fall campaign (Chart 2). The aim would be to conquer remaining portions of Donetsk and Luhansk, the “land bridge” to Crimea, and potentially the stretch of land between the Dnieper river and eastern Moldova, where Russian troops are already stationed. Chart 2Russia’s War Financing
Second Quarter Outlook 2022: When It Rains, It Pours
Second Quarter Outlook 2022: When It Rains, It Pours
Ukraine’s military neutrality is the core Russian objective. Ukraine is offering neutrality in exchange for security guarantees in the current ceasefire talks. Hence a durable ceasefire is possible if the details of neutrality are agreed – Ukraine forswears joining NATO and hosting foreign military infrastructure while accepting limitations on military exercises and defense systems. The security guarantees that Ukraine demands are mostly symbolic, as the western powers that would be credible guarantors are already unwilling to use military force against Russia (e.g. the US, UK, NATO members). However, Russia’s withdrawal from Kyiv will embolden the Ukrainians, so we do not expect a durable ceasefire in the second quarter. Global investors will be mistaken if they ignore Ukraine in the second quarter, at least until core problems are resolved. What matters most is whether the war expands beyond Ukraine: The likelihood of a broader war is low but not negligible. So far the Russian regime is behaving somewhat rationally: Moscow attacked a non-NATO member to prevent it from joining NATO; it limited the size of the military commitment; and it is now accepting reality and withdrawing from Kyiv while negotiating on Ukrainian neutrality. But a major problem emerges if Russia’s military fails in the Donbas while Ukraine reneges on offers of neutrality. Any ceasefire could fall apart and the war could re-escalate. Russia could redouble its attacks on the country or conduct a limited attack outside of Ukraine to trigger a crisis in the western alliance. Moreover, if sanctions keep rising until Russia’s economy collapses, Moscow could become less rational. Finland and Sweden have seen a shift of public opinion in favor of joining NATO. Any intention to do so would trigger a belligerent reaction from Russia. These governments are well aware of the precarious balance that must be maintained to prevent war, so war is unlikely. But if their stance changes then Russia will threaten to attack. Russia would threaten to bomb these states since it cannot now credibly threaten invasion by land (Charts 3A & 3B). Chart 3ANordic States Joining NATO Would Trigger Larger War
Second Quarter Outlook 2022: When It Rains, It Pours
Second Quarter Outlook 2022: When It Rains, It Pours
Chart 3BNordic States Joining NATO Would Trigger Larger War
Second Quarter Outlook 2022: When It Rains, It Pours
Second Quarter Outlook 2022: When It Rains, It Pours
The Black Sea is vulnerable to “Black Swan” events or military spillovers. Russia is re-concentrating its military efforts in the Donbas and land bridge to Crimea. Russia could expand its offensive to Odessa and the Moldovan border. Or Russia could attempt to create a new norm of naval dominance in the Black Sea. Or ships from third countries could hit mines or become casualties of war. For these and other reasons, investors should not take on additional risk in their portfolios on the basis that a durable ceasefire will be concluded quickly. Russia’s position is far too vulnerable to encourage risk-taking. Moscow could escalate tensions to try to save face. It is also critical to ensure that Russia and Europe maintain their energy trade: Neither side has an interest in total energy cutoff. Russia needs the revenue to finance its war and needs to discourage Europe from fulfilling its pledges to transition rapidly to other sources and substitutes. Europe needs the energy to avoid recession, maintain some tie with Russia, and enable its energy diversification strategy. So far natural gas flows are continuing (Chart 4). Chart 4Natural Gas Flows Continuing (So Far)
Natural Gas Flows Continuing (So Far)
Natural Gas Flows Continuing (So Far)
Chart 5Global Oil Supply/Demand Balance
Global Oil Supply/Demand Balance
Global Oil Supply/Demand Balance
However, risks to energy trade are rising. Russia is threatening to cut off energy exports if not paid in rubles, while the EU is beginning to entertain sanctions on energy. Russia can reduce oil or gas flows incrementally to keep prices high and prevent Europe from rebuilding stockpiles for fall and winter. Partial energy cutoff is possible. Europe’s diversification makes Russia’s predicament dire. Substantial sanction relief is highly unlikely, as western powers will want to prevent Russia from rebuilding its economy and military. Russia could try to impose significant pain on Europe to try to force a more favorable diplomatic solution. A third factor that matters is whether the US will expand its sanction enforcement to demand strict compliance from other nations, at pain of secondary sanctions: Secondary sanctions are likely in the case of China and other nations that stand at odds with the US and help Russia circumvent sanctions. In China’s case, the US is already interested in imposing sanctions on the financial or technology sector as part of its long-term containment strategy. While the Biden administration’s preference is to control the pace of escalation with China, and thus not to slap sanctions immediately, nevertheless substantial sanctions cannot be ruled out in the second quarter. Secondary sanctions will be limited in the case of US allies and partners, such as EU members, Turkey, and India. Countries that do business with Russia but are critical to US strategy will be given waivers or special treatment. Russia is not the only commodity producer that enjoys outsized geopolitical leverage amid a global commodity squeeze. Iran is the next most critical producer. Iran is also critical for the stability of the Middle East. In particular, the consequential US-Iran talks over whether to rejoin the 2015 nuclear deal are likely to come to a decision in the second quarter. Chart 6Failure Of US-Iran Talks Jeopardizes Middle East Oil Supply
Failure Of US-Iran Talks Jeopardizes Middle East Oil Supply
Failure Of US-Iran Talks Jeopardizes Middle East Oil Supply
If the US and Iran agree to a strategic détente, then regional tensions will briefly subside, reducing global oil disruption risks and supply pressures. Iran could bring 1.3 million barrels per day of oil back online, adding to President Biden’s 1 million per day release of strategic petroleum reserves. The combination would amount to 2.3% of global demand and more than cover the projected quarterly average supply deficit, which ranges from 400k to 900k barrels per day for the rest of 2022 (Chart 5). If the US and Iran fail to agree, then the Middle East will suffer another round of instability, adding a Middle Eastern energy shock on top of the Russian shock. Not only would Iran’s 1.3 million barrels per day be jeopardized but so would Iraq’s 4.4 million, Saudi Arabia’s 10.3 million, the UAE’s 3.0 million, or the Strait of Hormuz’s combined 24 million per day (Chart 6). This gives Iran leverage to pursue nuclear weaponization prior to any change in US government that would strengthen Israel’s ability to stop Iran. We would not bet on an agreement – but we cannot rule it out. The Biden administration can reduce sanctions via executive action to prevent a greater oil shock, while the Iranians can accept sanction relief in exchange for easily reversible moves toward compliance with the 2015 nuclear deal. But this would be a short-term, stop-gap measure, not a long-term strategic détente. Conflict between Iran and its neighbors will revive sooner than expected after the deal is agreed, as Iran’s nuclear ambitions will persist. OPEC states are already producing more oil rapidly, suggesting no quick fix if the US-Iran deal falls apart. While core OPEC states have 3.5 million barrels per day in spare capacity to bring to bear, a serious escalation of tensions with Iran would jeopardize this solution. Finally, if commodity producers have geopolitical leverage, then commodity consumers are lacking in leverage. This is clear from Europe’s inability to prevent Russia’s attack or ban Russian energy. It is clear from the US’s apparent unwillingness to give up on a short-term deal with Iran. It is clear from China’s inability to provide sufficient monetary and fiscal stimulus as it struggles with Covid-19. Turkey, Egypt, and Pakistan are geopolitically significant importers of Russian and Ukrainian grain that are likely to face food insecurity and social unrest. We will address this issue below under our Populism/Nationalism theme. Bottom Line: Investors should not be complacent. Russia’s military standing in Ukraine is weak, but its ability to finance the war has not yet collapsed, which means that it will escalate the conflict to save face. What About Our Other Key Views For 2022? Our other two key views for 2022 are even more relevant in the wake of the Ukraine re-invasion. China’s reversion to autocracy is a factor in China’s domestic and foreign policy: Domestically China needs economic and social stability in the advance of the twentieth national party congress, when President Xi Jinping hopes to clinch 10 more years in power. In pursuit of this goal China is easing monetary and fiscal policy. However, with depressed animal spirits, a weakening property sector, and high debt levels, monetary policy is proving insufficient. Fiscal policy will have to step up. But even here, inflation is likely to impose a limitation on how much stimulus the authorities can utilize (Chart 7). Chart 7China Stimulus Impaired By Inflation
China Stimulus Impaired By Inflation
China Stimulus Impaired By Inflation
Chart 8Chinese Supply Kinks To Persist Due To Covid-19
Chinese Supply Kinks To Persist Due To Covid-19
Chinese Supply Kinks To Persist Due To Covid-19
China is also trying but failing to maintain a “Covid Zero” policy. The more contagious Omicron variant of the virus is breaking out and slipping beyond the authorities’ ability to suppress cases of the virus to zero. Shanghai is on lockdown and other cities will follow suit. China will attempt to redouble its containment efforts before it will accept the reality that the virus cannot be contained. Chinese production and shipping will become delayed and obstructed as a result, putting another round of upward pressure on global prices (Chart 8). Stringent pandemic restrictions could trigger social unrest. China is ripe for social unrest, which is why it launched the “Common Prosperity” program last year to convince citizens that quality of life will improve. But this program is a long-term program that will not bring immediate relief. On the contrary, the economy is still suffering and the virus will spread more widely, as well as draconian social restrictions. The result is that the lead up to the national party congress will not be as smooth as the Xi administration had hoped. Global investors will remain pessimistic toward Chinese stocks. In foreign affairs, China’s reversion to autocracy is reinforced by Russia’s clash with the West and the need to coordinate more closely. Xi hosted Putin in Beijing on February 4, prior to the invasion, and the two declared that their strategic partnership ushers in a “new era” of “multipolarity” and that their cooperation has “no limits,” which really means that military cooperation is not forbidden. China agreed to purchase an additional 10 billion cubic meters of Russian natural gas over 30-years. While this amount would only replace 3% of Russian natural gas exports to Europe, it would mark a 26% increase in Russian exports to China. More importantly it acts as a symbol of Chinese willingness to substitute for Europe over time. There is a long way to go for China to replace Europe as a customer (Chart 9). But China knows it needs to convert its US dollar foreign exchange reserves, vulnerable to US sanctions, into hard investments in supply security within the Eurasian continent. Chart 9Long Way To Go For China NatGas Imports To Replace EU
Second Quarter Outlook 2022: When It Rains, It Pours
Second Quarter Outlook 2022: When It Rains, It Pours
China is helping Russia circumvent sanctions. China’s chief interest is to minimize the shock to its domestic economy. This means keeping Russian energy and commodities flowing. China could also offer military equipment for Russia. The US has expressly warned China against taking such an action. China could mitigate the blowback by stipulating that the assistance cannot be used in Ukraine. This would be unenforceable but would provide diplomatic cover. While China is uncomfortable with the disturbance of the Ukraine war – it does not want foreign affairs to cause even larger supply shocks. At the same time, China does not want Russia to lose the war or Putin’s regime to fall from power. If Russia loses, Taiwan and its western allies would be emboldened, while Russia could pursue a détente with the West, leaving China isolated. Since China faces US containment policy regardless of what happens in Russia, it is better for China to have Putin making an example out of Ukraine and keeping the Americans and Europeans preoccupied. Chart 10China Strives To Preserve EU Trade Ties
China Strives To Preserve EU Trade Ties
China Strives To Preserve EU Trade Ties
China must also preserve ties with Europe. Diplomacy will likely succeed in the short run since Europe has no interest or desire to expand sanctions to China. The Biden administration will defer to Europe on the pace of sanctions – it is not willing or able to force Europe to break with China suddenly. Eventually Europe and China may sever relations but not yet – China has a powerful incentive to preserve them (Chart 10). China will also court India and other powers in an attempt to hedge its bets on Russia while weakening any American containment. Beyond the party congress, China will be focused on securing the economic recovery and implementing the common prosperity agenda. The first step is to maintain easy monetary and fiscal policy. The second step is to “let 100 flowers bloom,” i.e. relaxing social and regulatory controls to try to revive entrepreneurship and animal spirits, which are heavily depressed. Xi will have the ability to do this after re-consolidating power. The third step will be to try to stabilize economic relations with Europe and others (conceivably even the US temporarily, though no serious détente is likely). The remaining key view for 2022 is that the Biden administration’s domestic focus will be defensive and will invite foreign policy challenges. The Ukraine war vindicates this view but the question now is whether Biden has or will change tack: The Biden administration is focused on the midterm elections and the huge risk to the Democratic Party’s standing. Biden has not received a boost in opinion polls from the war. He is polling even worse when it comes to handling of the economy (Chart 11). While he should be able to repackage his budget reconciliation bill as an energy security bill, his thin majorities in both houses make passage difficult. Chart 11Biden And Democrats Face Shellacking In Midterm Election
Second Quarter Outlook 2022: When It Rains, It Pours
Second Quarter Outlook 2022: When It Rains, It Pours
Biden’s weak standing – with or without a midterm shellacking – raises the prospect that Republicans could take back the White House in 2024, which discourages foreign nations from making any significant concessions to the United States in their negotiations. They must assume that partisanship will continue to contaminate foreign policy and lead to abrupt policy reversals. In foreign policy, the US remains reactive in the face of Russian aggression. If Russia signs a ceasefire, the US will not sabotage it to prolong Russian difficulties. Moreover Biden continues to exempt Europe and other allies and partners from enforcing the US’s most severe sanctions for fear of a larger energy shock. Europe’s avoidance of an energy ban is critical and any change in US policy to try to force the EU to cut off Russian energy is unlikely. China will not agree to structural reform or deep concessions in its trade negotiations, knowing that former President Trump could come back. The Biden administration’s own trade policy toward China is limited in scope, as the US Trade Representative Katherine Tai admitted when she said that the US could no longer aim to change China’s behavior via trade talks. Biden’s only proactive foreign policy initiative, Iran, will not bring him public kudos if it is achieved. But American inconstancy is one of the reasons that Iran may walk away from the 2015 nuclear deal. Why should Iran’s hawkish leaders be expected to constrain their nuclear program and expose their economy to future US sanctions if they can circumvent US sanctions anyway, and Republicans have a fair chance of coming back into power as early as January 2025? Biden’s unprecedented release of strategic petroleum reserves will not be able to prevent gasoline prices from staying high given the underlying supply pressures at home and abroad. This is especially true if the Iran talks fail as we expect. Even if inflation abates before the election, it is unlikely to abate enough to save his party from a shellacking. That in turn will weaken the global impression of his administration’s staying power. Hence Biden will focus on maintaining US alliances, which means allowing Europe, India, and others to proceed at a more pragmatic and dovish pace in their relations with Russia and China. Bottom Line: China’s reversion to autocracy and America’s policy insularity suggest that global investors face considerable policy uncertainty this year even aside from the war in Europe. Checking Up On Our Strategic Themes For The 2020s Russia’s invasion strongly confirmed our three strategic themes of Great Power Rivalry, Hypo-Globalization, and Populism/Nationalism. These themes are mutually reinforcing: insecurity among the leading nation-states encourages regionalization rather than globalization, while populism and nationalism encourage nations to pursue economic and security interests at the expense of their neighbors. First, the Ukraine war confirms and exacerbates Great Power Rivalry: Chart 12China And Russia Both Need To Balance Against US Preponderance
Second Quarter Outlook 2022: When It Rains, It Pours
Second Quarter Outlook 2022: When It Rains, It Pours
Russia’s action vindicates the “realist” school of international relations (in which we count ourselves) by forcing the world to wake up to the fact that nations still care primarily about national security defined in material ways, such as armies, resources, and territories. The paradox of realism is that if at least one of the great nations pursues its national self-interest and engages in competition for security, then all other nations will be forced to do the same. If a nation neglects its national security interests in pursuit of global economic engagement and cooperation, then it will suffer, since other nations will take advantage of it to enhance their security. Hence, as a result of Ukraine, nations will give a higher weight to national security relative to economic efficiency. The result will be an acceleration of decisions to use fiscal funds and guide the private economy in pursuit of national interests – i.e. the Return of Big Government. Since actions to increase deterrence will provoke counteractions for the same reason, overall insecurity will rise. For example, the US and China will take extra precautions in case of future sanctions and war. But these precautions will reduce trust and cooperation and increase the probability of war over the long run. For the same reason, China cannot reject Russia’s strategic overture – it cannot afford to alienate and isolate Russia. China and Russia have a shared interest in countering the United States because it is the only nation that could conceivably impose a global empire over all nations (Chart 12). The US could deprive Beijing and Moscow of the regional spheres of influence that they each need to improve their national security. This is true not only in Ukraine and Taiwan but in other peripheral areas such as Belarus, the Caucasus, Central Asia, and Southeast Asia. China has much to gain from Russia. Russia is offering China privileged overland access to Russian, Central Asian, and Middle Eastern resources and markets. This resource base is vital to China’s strategic needs, given its import dependency and vulnerability to US maritime power (Chart 13). Chart 13China’s Maritime Vulnerability Forces Eurasian Strategy, Russian Alliance
Second Quarter Outlook 2022: When It Rains, It Pours
Second Quarter Outlook 2022: When It Rains, It Pours
Investors should understand Great Power Rivalry in a multipolar rather than bipolar sense. As Russia breaks from the West, investors are quick to move rapidly to the bipolar Cold War analogy because that is what they are familiar with. But the world today has multiple poles of political power, as it did for centuries prior to the twentieth. While the US is the preponderant power, it is not hegemonic. It faces not one but two revisionist challengers – Russia and China. Meanwhile Europe and India are independent poles of power that are not exclusively aligned with the US or China. For example, China and the EU need to maintain economic ties with each other for the sake of stability, and neither the US nor Russia can prevent them from doing so. The same goes for India and Russia. China will embrace Russia and Europe at the same time, while hardening its economy against US punitive measures. India will preserve ties with Russia and China, while avoiding conflict with the US and its allies (the maritime powers), whom it needs for its long-term strategic security in the Indian Ocean basin. Ultimately bipolarity may be the end-game – e.g. if China takes aggressive action to revise the global order like Russia has done – but the persistence of Sino-European ties and Russo-Indian ties suggest we are not there yet. Second, the Ukraine war reinforces Hypo-Globalization: Since the pandemic we have argued that trade would revive on the global economic snapback but that globalization – the deepening of trade integration – would ultimately fall short of its pre-2020 and pre-2008 trajectory. Instead we would inhabit a new world of “hypo-globalization,” in which trade flows fell short of potential. So far the data support this view (Chart 14). Chart 14Globalization Falling Short Of Potential
Second Quarter Outlook 2022: When It Rains, It Pours
Second Quarter Outlook 2022: When It Rains, It Pours
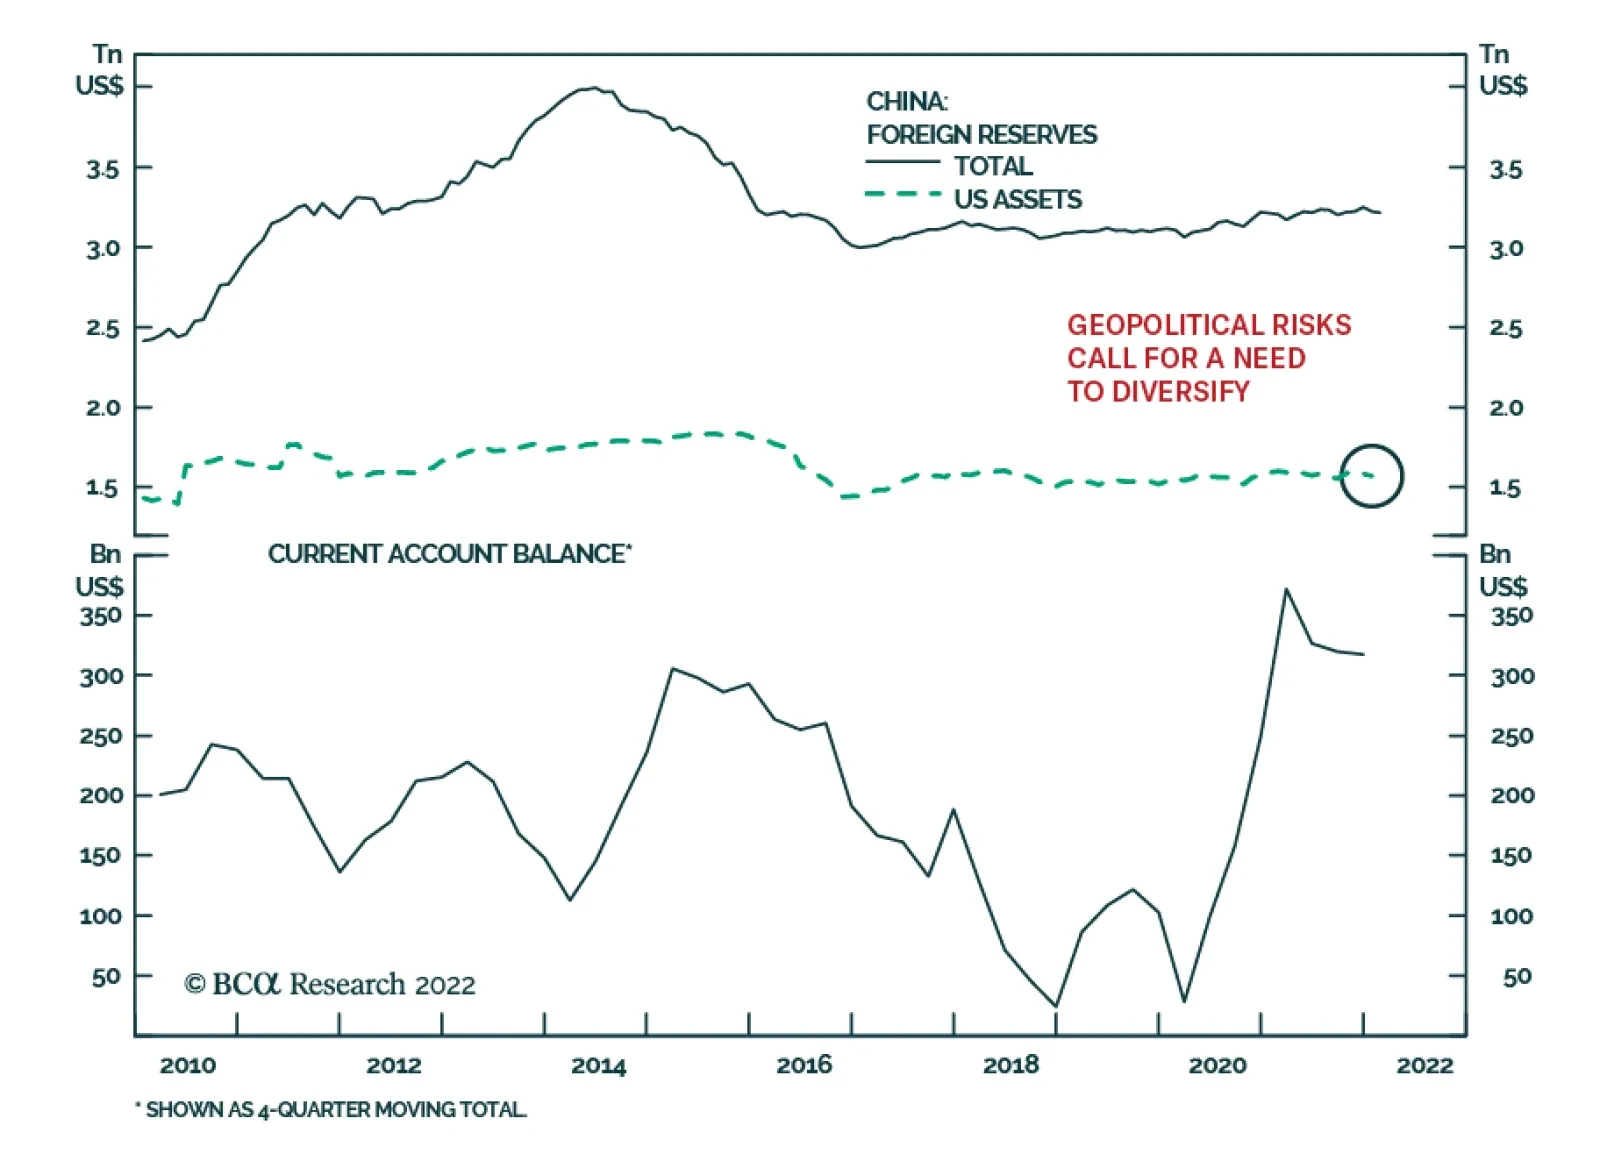
The Ukraine war has strengthened this thesis not only by concretely reducing Russia’s trajectory of trade with the West – reversing decades of integration since the fall of the Soviet Union – but also by increasing the need for nations to guard against a future Chinese confrontation with the Western world. Trust between China and the West will further erode. China will need to guard against any future sanctions, and thus diversify away from the US dollar and assets, while the US will need to do a better job of deterring China against aggression in Asia, and will thus have to diversify away from Chinese manufacturing and critical resources like rare earths. While China and Europe need each other now, the US and China are firmly set on a long-term path of security competition in East Asia. Eventually either the US or China will take a more aggressive stance and Europe will be forced to react. Since Europe will still need US support against a decaying and aggressive Russia, it will likely be dragged into assisting the US against China. Third, the Ukraine war reflects and amplifies Populism/Nationalism: Populism and nationalism are not the same thing but they both stem from the slowing trend of global income growth, the rise of inequality, the corruption of the elite political establishments, and now the rise in inflation. Nations have to devote more resources to pacifying an angry populace, or distracting that populace through foreign adventures, or both. The Ukraine war reflects the rise in nationalism. First, the collapse of the Soviet Union ushered in a period in which Moscow lost control of its periphery, while the diverse peoples could pursue national self-determination and statehood. The independence and success of the Baltic states depended on economic and military cooperation with the West, which eroded Russian national security and provoked a nationalist backlash in the form of President Putin’s regime. Ukraine became the epicenter of this conflict. Ukraine’s successful military resistance is likely to provoke a dangerous backlash from Moscow until either policy changes or the regime changes. American nationalism has flared repeatedly since the fall of the Soviet Union, namely in the Iraq war. The American state has suffered economically and politically for that imperial overreach. But American nationalism is still a potent force and could trigger a more aggressive shift in US foreign policy in 2024 or beyond. European states have kept nationalism in check and tried to subsume their various nationalist sentiments into a liberal and internationalist project, the European Union. The wave of nationalist forces in the wake of the European debt crisis has subsided, with the exception of the United Kingdom, where it flowered in Brexit. The French election in the second quarter will likely continue this trend with the re-election of President Emmanuel Macron, but even if he should suffer a surprise upset to nationalist Marine Le Pen, Europe’s centripetal forces will prevent her from taking France out of the EU or euro or NATO (Chart 15). Over the coming decade, nationalist forces will revive and will present a new challenge to Europe’s ruling elites – but global great power competition strongly supports the EU’s continued evolution into a single geopolitical entity, since the independent states are extremely vulnerable to Russia, China, and even the US unless they unite and strengthen their superstructure. Chart 15Macron Favored, Le Pen Would Be Ineffective
Macron Favored, Le Pen Would Be Ineffective
Macron Favored, Le Pen Would Be Ineffective
In fact the true base of global nationalism is migrating to Asia. Chinese and Indian nationalism are very potent forces under President Xi Jinping and Prime Minister Narendra Modi. Xi is on the verge of clinching another ten years in power while Modi is still favored for re-election in 2024, so there is no reason to anticipate a change anytime soon. The effects are various but what is most important for investors is to recognize that as China’s potential GDP has fallen over the past decade, the Communist Party has begun to utilize nationalism as a new source of legitimacy, and this is expressed through a more assertive foreign policy. President Xi is the emblem of this shift and it will not change, even if China pursues a lower profile over certain periods to avoid provoking the US and its allies into a more effective coalition to contain China. Chart 16Food Insecurity Will Promote Global Unrest, Populism
Food Insecurity Will Promote Global Unrest, Populism
Food Insecurity Will Promote Global Unrest, Populism
The surge in global prices will destabilize regimes that lack food security and contribute to new bouts of populism and nationalism. Turkey is the most vulnerable due to a confluence of political, economic, and military risks that will unsettle the state. But Egypt is vulnerable to an Arab Spring 2.0 that would have negative security implications for Israel and add powder to the Middle Eastern powder keg. Pakistan is already witnessing political turmoil. Investors may overlook any Indonesian unrest due to its attractiveness in a world where Russia and China are scaring away western investment (Chart 16). All three of these strategic themes are mutually reinforcing – and they tend to be inflationary over the long run. Great powers that redouble the pursuit of national interest – through defense spending and energy security investments – while simultaneously being forced to expand their social safety nets to appease popular discontent, will drive up budget deficits, consume a lot of natural resources, and purchase a lot of capital equipment. They will also more frequently engage in economic or military conflicts that constrain supply (Chart 17). Chart 17War And Preparation For War Are Inflationary
War And Preparation For War Are Inflationary
War And Preparation For War Are Inflationary
Bottom Line: The Ukraine war is a powerful confirmation of our three strategic themes. It is also a confirmation that these themes have inflationary macroeconomic implications. Investment Takeaways Chart 18Global Investors Still Flee To US For Safety
Global Investors Still Flee To US For Safety
Global Investors Still Flee To US For Safety
Now that great power rivalry is intensifying immediately and rapidly, and yet China’s and Europe’s economies are encountering greater difficulties, we expect stagflation to arrive sooner rather than later. High headline and core inflation, the Ukraine war, tacit Chinese support for Russia, persistent Chinese supply kinks, US and EU sanctions, US midterm elections, and a potential US-Iran diplomatic breakdown will all weigh on risk sentiment in the second quarter. In Ukraine, Russia’s position is too weak to give comfort for investors, who should continue to favor defensive over cyclical equities and US stocks over global stocks. Russia’s break with the West, and the West’s use of sanctions to prevent Russia from accessing its foreign exchange reserves, has raised new questions about the global currency reserve system and the dollar’s status within that system. Over the coming years China will redouble the efforts it began in the wake of the Great Recession to reduce its dependency on US dollar assets within its reserve basket, while also recycling new current account surpluses into non-dollar assets. However, the evidence does not suggest that King Dollar will suffer a structural breakdown. First, the world lacks alternative safe-haven assets to US Treasuries – and net foreign purchases of US bonds rose in the face of the Ukraine war (Chart 18). Second, the return of war to Europe will weaken the perceived long-term security of European currency and government bonds relative to US counterparts. Even if the Ukraine war is contained in the short run, as we expect, Russia is in structural decline and will remain a disruptive player for some time. We are not at all bearish on the euro or European bonds but we do not see the Ukraine war as increasing their value proposition, to put it lightly. The same logic extends to Japanese bonds, since China, like Russia, is an autocratic and revisionist state that threatens to shake up the security order in its neighborhood. Japan is relatively secure as a nation and we are bullish on the yen, but China’s de facto alliance with Russia weakens Japan’s security outlook over the very long run, especially relative to the United States. Thus, on a cyclical basis the dollar can depreciate, but on a structural basis the US dollar will remain the dominant reserve currency. The US is not only the wealthiest and most secure country in the world but also the largest oil producer. Meanwhile Chinese potential growth, domestic political stability, and foreign relations are all worsening. The US-Iran talks are the most critical geopolitical dynamic in the second quarter aside from Russia’s clash with the West. The fate of the 2015 nuclear deal will be decided soon and will determine whether an even bigger energy shock begins to emanate from the Middle East. We would not bet on a new US-Iran deal but we cannot rule it out. Any deal would be a short-term, stop-gap deal but would prevent an immediate destabilization of the Middle East this year. As such it would reduce the risk of stagflation. Since we expect the deal to fail, we expect a new energy shock to emerge. We see stagflation as more likely than the BCA House View. It will be difficult to lift productivity in an environment of geopolitical and political uncertainty combined with slowing global growth, rising interest rates, and a worsening commodity shock (Chart 19). We will gladly revise this stance if Biden clinches an Iran deal, China relaxes its Covid Zero policy and stabilizes domestic demand, Russia and Europe maintain energy trade, and commodity prices fall to more sustainable levels for global demand. Chart 19Stagflation Cometh
Stagflation Cometh
Stagflation Cometh
Strategically we remain long gold, overweight US equities, overweight UK equities, long British pound and Japanese yen, long aerospace/defense stocks and cyber security stocks. We remain short Chinese renminbi and Taiwanese dollar and short emerging European assets. Our short Chinese renminbi trade and our short Taiwanese versus Korean equity trade are our worst-performing recommendations. However, the above analysis should highlight – and the Ukraine war should underscore – that these two economies face a fundamentally negative geopolitical dynamic. Both Chinese and Taiwanese stocks have been underperforming global peers since 2021 and our short TWD-USD trade is in the money. While we do not expect war to break out in Taiwan this year, we do expect various crisis events to occur, particularly in the lead up to the crucial Taiwanese and American 2022 midterms and 2024 presidential election. We also expect China to depreciate the renminbi when inflation peaks and commodity prices subside. Cyclically we remain long North American and Latin American oil producers and short Middle Eastern producers, based on our pessimistic read of the Iran situation. The Americas are fundamentally better protected from geopolitical risks than other regions, although they continue to suffer from domestic political risks on a country-by-country basis. Cyclically we continue to take a defensive positioning, overweighting defensive sectors and large cap equities. Matt Gertken Chief Geopolitical Strategist mattg@bcaresearch.com Footnotes 1 That the Russian threat fell under our third key view for 2022 implies that we did not get our priorities straight. However, consider the timing: shortly after publishing our annual outlook on December 15, the Russians issued an ultimatum to the western powers demanding that NATO stop expanding toward Russia. Diplomats from Russia and the West met on January 12-13 but Russia’s demands were not met. We upgraded the odds that Russia would invade Ukraine from 50% to 75% on January 27. Shuttle diplomacy ensued but failed. Russia invaded on February 24. Strategic Themes Open Tactical Positions (0-6 Months) Open Cyclical Recommendations (6-18 Months) Regional Geopolitical Risk Matrix "Batting Average": Geopolitical Strategy Trades () Section II: Special (EDIT this Header) Section III: Geopolitical Calendar
Western sanctions against Russia following its invasion of Ukraine have essentially frozen a large share of the country’s foreign exchange reserves. Last month, Russia’s finance minister Anton Siluanov revealed that about $300 billion of the country’s $640…
Executive Summary Natgas Price Surge Boosts Hydrogen's Prospects
EU Gas Crisis Boosts Hydrogen's Prospects
EU Gas Crisis Boosts Hydrogen's Prospects
Russia's invasion of Ukraine and the surge in EU natural gas prices it provoked will accelerate investment in clean-hydrogen technology, which uses renewable energy to separate water into hydrogen and oxygen. This already has pushed the cost of clean – or "green" – hydrogen below the cost of competing forms of the fuel on the continent. Widespread adoption of carbon pricing will further enhance the attractiveness of green hydrogen, making it more competitive in transportation and refining applications. The cost of producing clean hydrogen in China also has fallen, owing to the competition for liquified natural gas (LNG) with the EU. Relatively low US natural gas prices are keeping the cost of green hydrogen above alternatives. The US DOE is prioritizing hydrogen development, and is funding research to reduce its cost from ~ $5/kg to $1/kg over the next 10 years. Falling clean-hydrogen costs raise the risk of stranded investment in natural-gas exploration and production. Bottom Line: The EU's drive to diversify away from Russian natural gas as quickly as possible will keep competition for scarce LNG between the EU and Asian markets high, as both bid for scarce supplies. This will redound to the benefit of clean hydrogen and its supporting technology, but might limit natgas E+P. Feature The war in Ukraine will keep the price of natural gas, particularly in its liquid state (LNG), elevated, as the EU and Asia compete for scarce supplies to refill inventories and prepare for the coming winter, along with keeping their heavy industries operating (Chart 1). In the Europe-Middle East-Africa (EMEA) markets and China, higher natgas prices, including LNG, already have lifted the cost of pulling hydrogen from natgas – so-called blue and grey hydrogen – above that of green (or "clean") hydrogen, which is produced by separating the hydrogen and oxygen in water via electrolysis. With natgas prices remaining elevated this year and next, investment in clean-hydrogen technology and its supporting infrastructure can be expected to increase. Government support for hydrogen as a clean fuel – i.e., research funding and tax support – will allow this technology to reach economies of scale and lower costs over the coming decade. Chart 1Russia's Invasion Of Ukraine Will Boost Hydrogen's Prospects
EU Gas Crisis Boosts Hydrogen's Prospects
EU Gas Crisis Boosts Hydrogen's Prospects
Related Report Commodity & Energy StrategySurging Metals Prices And The Case For Carbon-Capture Government policy can increase the advantage of green-hydrogen and other clean-energy technologies by adopting carbon-pricing schemes on a large scale, as well. Such schemes would assess actual – and avoidable – costs of pollution to incentivize investment in non-polluting technologies. We have argued in the past that this is best done via taxes that can provide revenues to support and fund the development of renewable energy. Ideally, such schemes would include mechanisms to offset the regressive nature of such taxes. Absent a tax, Carbon Clubs that impose tariffs or duties on states not abiding by carbon-reduction policies seeking to export to states that do employ such policies, as developed by William Nordhaus, would be useful.1 Ukraine War Improves Hydrogen Economics Governments supporting low- or zero-carbon emission technologies in their push to contain the rise in the Earth's temperature are focused on hydrogen, which, when consumed in a fuel cell, emits no pollution. Apart from being a fuel source, hydrogen also can be used to store energy. It can power electric grids when there is intermittent electricity supply, making it ideal as a back-up energy source for renewable-energy technologies – solar and wind, in particular – which, as the UK and Europe discovered last summer, can be extremely variable and unreliable. Based on its method of production, hydrogen is assigned a color – grey, blue, or green (Chart 2). In a nutshell: Chart 2Types of Hydrogen By Color
EU Gas Crisis Boosts Hydrogen's Prospects
EU Gas Crisis Boosts Hydrogen's Prospects
Grey hydrogen is produced when steam reacts with a hydrocarbon fuel (typically natural gas) to produce hydrogen via a process known as steam-methane reforming (SMR). The downside of this technology is it can result in CO2 and carbon escaping into the environment. Blue hydrogen is created by the same SMR process as grey hydrogen; however, carbon capture and storage (CCS) technology is added to the process to reduce carbon emissions from the steam and fuel reaction. Green hydrogen – aka "clean hydrogen" – is produced with electricity from renewables like wind or solar – in a process that separates water into oxygen and hydrogen via electrolysis. Electricity is the primary cost driver in the production of green hydrogen, followed by the elctrolyzers used to separate oxygen and hydrogen (Chart 3). For this reason, countries where renewable electricity is abundant will be ideal candidates for so-called clean hydrogen. Among renewables, wind and solar are the most developed, and cheapest sources of electricity (Chart 4). As a result, the International Renewable Energy Agency (IRENA) believes countries in the Middle East, Africa, and Oceania have the highest potential to become green hydrogen exporters.2 A constant electric load is crucial for efficient and cost-effective hydrogen production. Electrolyzers will either underperform or overheat if subjected to a variable electric load, reducing their lifespan, and hence increasing overall capital costs. This is yet another reason why countries with vast quantities of wind and solar energy will be at an advantage producing clean hydrogen. Chart 3Renewables Are Primary Cost For Green Hydrogen
EU Gas Crisis Boosts Hydrogen's Prospects
EU Gas Crisis Boosts Hydrogen's Prospects
Chart 4Cheap Wind And Solar Electricity Can Reduce Green Hydrogen Costs
EU Gas Crisis Boosts Hydrogen's Prospects
EU Gas Crisis Boosts Hydrogen's Prospects
Until now, deficient electrolyzer investment and production have resulted in high capital costs. Low innovation in the technology is due to a dearth of consumer demand due to the high prices, leading to a vicious cycle (Diagram 1). According to IRENA, increasing the manufacturing intensity of stacks – the primary component of the electrolyzer – could reduce the share of its cost from 45% to 30% of the total.3 Russia's invasion of Ukraine and the surge in EU natural gas prices it provoked will accelerate investment in green-hydrogen technology. The war already has pushed the cost of clean hydrogen below the cost of competing grey and blue forms of the fuel on the continent. We expect this will persist over the next two years, as the EU and Asia compete for scarce natural gas and LNG supplies going into the coming winter to rebuild depleted gas inventories, and to keep base metals smelters and refineries up and running. Diagram 1The Vicious Cycle Plaguing Hydrogen
EU Gas Crisis Boosts Hydrogen's Prospects
EU Gas Crisis Boosts Hydrogen's Prospects
The cost of grey hydrogen from natgas was ~ $6.70/kg last month vs a mid-point estimate of ~ $5.75/kg for green hydrogen in the Europe-Middle East-Africa (EMEA) markets.4 In China, green hydrogen was running at ~ $3.20/kg vs a grey cost of ~ $5.30/kg. The US is the outlier here, given its abundance of natural gas production. Grey hydrogen cost $1.20/kg, while green hydrogen was running at ~ $3.30/kg. It is difficult to determine whether green hydrogen will remain cheaper than blue in the EMEA and China markets. Under normal conditions – absent highly backwardated fuel markets – blue hydrogen is considered a bridge to the green variant, since it only builds on the incumbent grey hydrogen production process and is cheaper (Chart 5). Approximately 90% of total hydrogen produced annually is grey. If the EU is forced to ration natgas – Germany, e.g., is preparing its population for such a contingency in the event Russian supplies are shut off – reduced fuel availability will act as a hard constraint for blue-hydrogen production. This would prolong green-hydrogen's cost advantage. Chart 5Green Hydrogen Typically Most Expensive Hue
EU Gas Crisis Boosts Hydrogen's Prospects
EU Gas Crisis Boosts Hydrogen's Prospects
That being said, green hydrogen has its own geopolitical problems. Procuring the critical minerals and metals required to build electrolyzers can prove to be challenging, given the metals’ locations are highly concentrated in states with stressed electrical infrastructures like South Africa, which produces 85% and 70% of global iridium and platinum supply respectively (Chart 6). Both metals are in commonly used electrolyzers. Metals supply disruptions in China similar to those that occurred this past winter can affect numerous metal supply chains necessary for hydrogen production. Chart 6Concentration Risks In Hydrogen Materials
EU Gas Crisis Boosts Hydrogen's Prospects
EU Gas Crisis Boosts Hydrogen's Prospects
Displacing High-Polluting Technology According to the IRENA, hydrogen could cover up to 12% of global energy use by 2050.5 Green hydrogen has numerous potential applications: Backstopping intermittent renewable energy; Performing as a “zero-emissions” fuel for maritime shipping and aviation; An energy source for high-heat industrial processes that cannot otherwise be electrified; A feedstock in some industrial processes, like steel production.6 The adoption of hydrogen for new applications has been slow, with uptake limited to the last decade, when fuel cell electric vehicle (FCEV) deployment started gaining traction. In addition, this energy source can be used to produce commodities such as steel, cement and glass used in construction, and ammonia needed to fertilize crops.7 In terms of size, global hydrogen demand was 90 Mt in 2020, with most of it coming from refining and industrial uses. Governments have committed to greater hydrogen use, but not nearly enough to meet net-zero energy emissions by 2050 (Chart 7).8 IRENA estimates that over 30% of hydrogen could be traded across borders by 2050, a higher share than natural gas today.9 According to the Energy Networks Association, up to a fifth of natural gas consumption currently used could be replaced by hydrogen.10 Countries most able to generate cheap renewable electricity will be best placed to produce competitive green hydrogen.11 Chart 7Hydrogen Contributes To Lower Emissions
EU Gas Crisis Boosts Hydrogen's Prospects
EU Gas Crisis Boosts Hydrogen's Prospects
Investment Implications High natgas prices – in its pipeline and liquid forms – will redound to the benefit of clean hydrogen and its supporting technology. The relative cost advantage green hydrogen has over its grey and blue competition will persist this year and most likely in 2023, as the EU and China continue to bid for scarce natgas supplies in the wake of Russia's invasion of Ukraine. This could persist, if markets begin pricing the availability and future reliability of clean hydrogen on par with fossil-fuel availability. However, this will require significant increases in green-hydrogen technology investment, particularly in electrolysers. Government support – e.g., the US DOE's efforts to reduce the cost of green hydrogen to $1/kg over the next 10 years from $5/kg – will be important in this regard. The development of green-hydrogen capacity and its infrastructure could limit the further development of natural gas, which will be increasingly important during the global energy transition. The conventional natgas resource base benefits from a fully developed global infrastructure, which, if augmented with funding and tax support for carbon-capture and storage technology, will provide a necessary bridge to a low-carbon energy grid. Robert P. Ryan Chief Commodity & Energy Strategist rryan@bcaresearch.com Ashwin Shyam Research Associate Commodity & Energy Strategy ashwin.shyam@bcaresearch.com Paula Struk Research Associate Commodity & Energy Strategy paula.struk@bcaresearch.com Commodity Round-Up Industrial bulks (iron ore and steel) and metals are becoming more expensive, increasing the cost of Europe’s effort to diversify away from Russian natural gas. European countries that relied on pipeline natgas from Russia will need to construct import facilities and regasification plants to switch to LNG from other exporters. Cross-border European pipelines also will be required to transport imported natural gas from the Iberian Peninsula and Eastern Europe to inland Europe. The US will be expanding LNG export facilities in the Gulf out to 2025, after which growth in export capacity will level off at ~ 10 Bcf/d. It has a large latent export capacity of ~ 187 million tons of LNG, however 48% of that capacity will come via projects currently under construction or awaiting permits. The build-out and expansion of LNG import and export facilities will be steel- and metals- intensive. Renewables-based energy the EU will look to as another alternative to Russian gas will compete with new LNG facilities’ metal demand, given green energy’s infrastructure requirements (Chart 8). The US and China will compete with the EU for these metals, as the world aims to achieve net-zero carbon emissions by 2050. The downside risk is the current COVID wave in China, and the stringent lockdown accompanying it, which started in end-March. Lockdowns will slow down economic activity and demand for metals. So far, however, copper - widely used in the nation’s large property sector - seems to have been untouched by activity in China. This is likely due to low inventory levels, the Ukraine crisis, and political uncertainty in the copper rich countries of Peru and Chile, which has slowed investment activity in the region. According to BCA’s China Investment Strategy, China’s zero-tolerance COVID policy will lead to frequent lockdowns and outweigh the positive effects of stimulus, given the high transmissibility of the Omicron variant now spreading there. Copper demand growth likely slows in China, but outside China demand for steel and base metals is holding up.. Chart 8
EU Gas Crisis Boosts Hydrogen's Prospects
EU Gas Crisis Boosts Hydrogen's Prospects
Footnotes 1 Please see Surging Metals Prices And The Case For Carbon-Capture, which we published 13 May 2021. It is available at ces.bcaresearch.com. Nordhaus is the 2018 Nobel Laureate in Economics in 2018. Please see Carbon Market Clubs and the New Paris Regime published by the World Bank in July 2016. The intellectual and computational framework for this technology was developed by Nordhaus. 2 Please see Geopolitics of The Energy Transformation: The Hydrogen Factor, published by IRENA. 3 Please see Green Hydrogen Cost Reduction: Scaling Up Electrolyzers to Meet the 1.5°C Climate Goal, published by IRENA. 4 Please see Ukraine war | Green hydrogen 'now cheaper than grey in Europe, Middle East and China': BNEF, published by rechargenews.com on March 7, 2022. 5 https://www.irena.org/newsroom/pressreleases/2022/Jan/Hydrogen-Economy-… 6 Please see Hydrogen: Future of Clean Energy or a False Solution? published by Sierra Club 5 January 2022. 7 Please see Green hydrogen has long been hyped as a replacement for fossil fuels. Now, one of the industry’s biggest players is preparing its IPO published by Fortune on January 10, 2022. 8 Please see Global Hydrogen Review 2021 published by IEA November 2021. 9 Please see Hydrogen Economy Hints at New Global Power Dynamics published by IRENA on January 15, 2022. 10 Please see Hydrogen could replace 20% of natural gas in the grid from next year published by Institution for Mechanical Engineers 14 January 2022. 11 See footnote #9. Investment Views and Themes Strategic Recommendations Trades Closed in 2021
Image
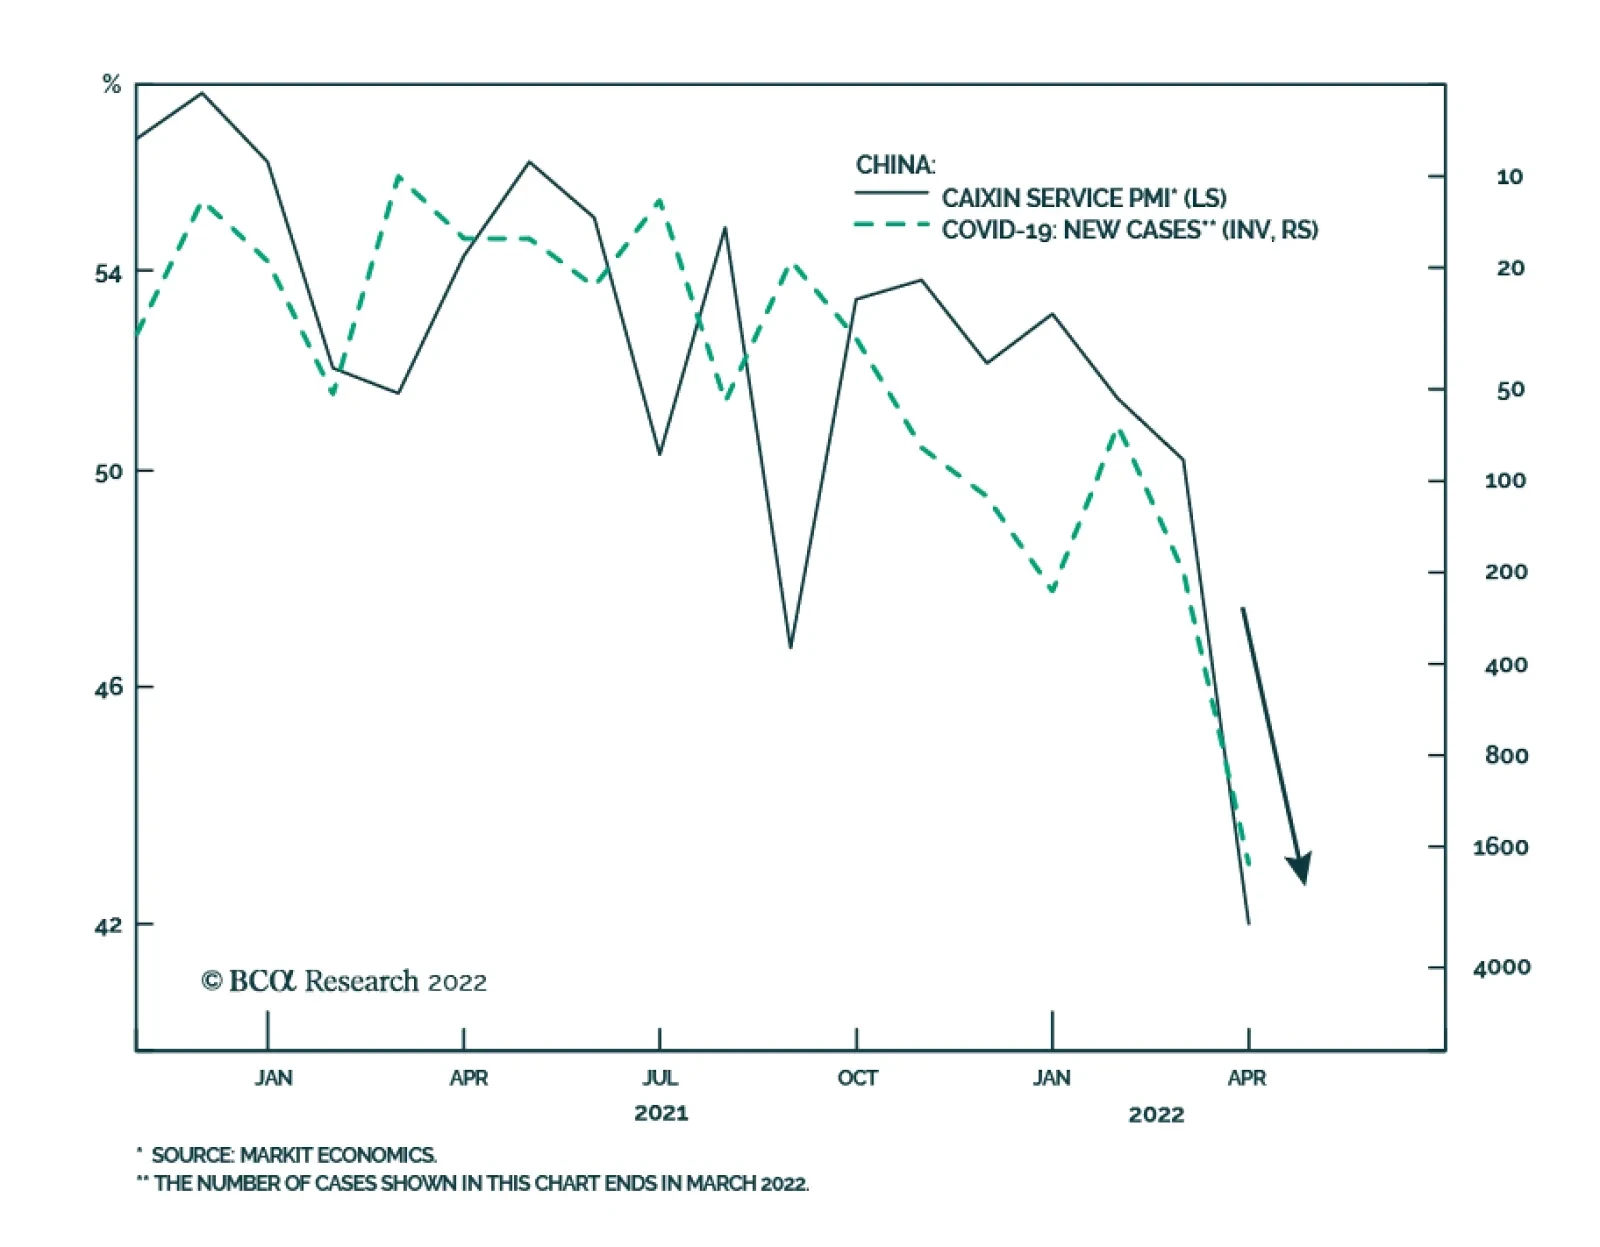
Unsurprisingly, service sector activity slowed in China in March, reflecting the impact of COVID-19 restrictions amid surging infection rates. However, the magnitude of the Caixin Services PMI’s drop was much greater than consensus expectations. The Services…
Executive Summary Shanghai Is Extending Lockdowns Due To Exponentially Rising COVID Cases
Shanghai Is Extending Lockdowns Due To Exponentially Rising COVID Cases
Shanghai Is Extending Lockdowns Due To Exponentially Rising COVID Cases
The economic impact of China’s struggle with another wave of COVID outbreaks is showing up in March’s PMI and high-frequency data. The highly contagious nature of the Omicron variant suggests that Shanghai’s battle against the virus spread may last longer than the market has priced in. Chinese authorities will continue playing whack-a-mole in efforts to eliminate the country’s COVID cases. The zero-COVID approach and the virus’ mutating to more contagious variants mean that the country may have to impose more frequent mobility restrictions going forward than in the past two years. Although Chinese policymakers are determined to stabilize the economy, the ongoing combat with COVID will weigh down the effectiveness of the stimulus. In relative terms, we maintain a neutral position on Chinese onshore stocks. However, downshifting corporate profits and the economic shock from lockdowns remain significant risks to the absolute performance of Chinese stocks. Bottom Line: China’s combat against the current COVID-19 outbreaks may last longer than the market has priced in. In the near term, the lockdowns will weigh down the effectiveness of the stimulus. In the second half of the year, the more contagious virus mutations and China’s sticking to zero-COVID strategy may lead to more frequent disruptions to business activity. Chart 1China Is Bracing For The Worst COVID Outbreak Since Early 2020
China Is Bracing For The Worst COVID Outbreak Since Early 2020
China Is Bracing For The Worst COVID Outbreak Since Early 2020
China’s efforts to stabilize economic growth are facing new challenges, dampening an already fragile recovery. The current wave of COVID-19 outbreaks — the worst since early 2020 — has infected more than 100,000 (TK) people across the country, and the number of new cases is still rising at an exponential rate (Chart 1). Measures to contain the spread of the virus have led to city lockdowns, halted factory production and have dragged down the tourism and catering industries. In previous reports, we noted that it is challenging for China to reach this year’s 5.5% growth target due to downbeat private-sector sentiment and subdued demand for housing. The outlook for China’s economy is grimmer now. The highly contagious COVID virus mutations, including the emerging Omicron BA.2 variant, will make it more difficult for China to control its domestic outbreaks going forward. We do not expect that China will fundamentally change its zero-COVID policy throughout the rest of this year. Therefore, the country will probably see more frequent regional and city lockdowns this year than in the past two years. The leadership will calibrate its handling of these lockdowns to minimize damage to the economy, and Beijing will continue stepping up its growth support policies. However, the whack-a-mole strategy to eliminate domestic COVID cases will be disruptive to business activity and dampen the effectiveness of policy easing. A One-Two Punch… Related Report China Investment StrategyA Choppy Bottom The downside risks to China’s economy stemming from the ongoing domestic COVID outbreaks are adding to the difficulties the country is already facing due to subdued domestic demand. As we have been highlighting in our previous reports, weak private sector sentiment has been weighing down the effectiveness of authorities’ efforts to stimulate the Chinese economy. The sluggish PMI data released last week in part reflects the impact of restrictions imposed to control the latest wave of COVID-19 infections, but also highlights the bleak domestic demand conditions. Notably, the March PMI survey does not capture the full impact of the Shanghai lockdown as the data collection period ended before the restrictions went into effect on March 28. The official composite PMI fell from 51.2 to 48.8 – below the 50 boom-bust threshold and the lowest reading since February 2020. The drop reflects a slump in the manufacturing and – to a greater extent – the non-manufacturing sectors, which both fell into a contractionary territory. The manufacturing PMI slid 0.7 points to 49.5, while the non-manufacturing PMI dropped 3.2 points to 48.4 (Chart 2). The new orders sub-index of the manufacturing PMI lost nearly two percentage points and deteriorated more sharply than the production index (Chart 3). Moreover, the spread between the new orders component and new export orders – a proxy for domestic demand – ticked down in March (Chart 3, bottom panel). This indicates that weak production does not just stem from COVID-related supply-side issues, but also from poor domestic demand conditions. Chart 2Chinese PMIs Slide Into Contractionary Territory
Chinese PMIs Slide Into Contractionary Territory
Chinese PMIs Slide Into Contractionary Territory
Chart 3Economic Shock From Lockdowns Compounds An Already Weak Domestic Demand
Economic Shock From Lockdowns Compounds An Already Weak Domestic Demand
Economic Shock From Lockdowns Compounds An Already Weak Domestic Demand
Chart 4Auto Inventory Index Jumped To Highest Since Early 2020
Auto Inventory Index Jumped To Highest Since Early 2020
Auto Inventory Index Jumped To Highest Since Early 2020
In addition, high-frequency data from the China Automobile Dealers Association shows that the Vehicle Inventory Alert Index (VIAI) – a survey that measures destocking pressures in the automobile industry – jumped to the highest level since the first wave of COVID-19 hit China in early 2020 (Chart 4). A rising VIAI above the 50-percent threshold indicates that auto inventories are cumulating at a faster pace than demand. Importantly, the cities and regions that have been worst hit by this round of COVID outbreaks are mostly coastal metropolises and business hubs such as Shanghai, Shenzhen and cities in Jiangsu and Zhejiang provinces. These cities and provinces represent more than 20% of China’s aggregate GDP and almost 30% of the country’s total import and export volume. As such, the negative impact on China’s overall economy from the lockdowns will be more substantive than during the previous waves. Measures to contain Shanghai’s worst-ever COVID outbreak are also disrupting operations at the world’s busiest container port, adding strains to the already overstretched global shipping industry (Chart 5). The supplier delivery times subindex of the manufacturing PMI dropped to 46.5 in March, the lowest reading since March 2020 (Chart 6). This suggests that suppliers’ delivery times have lengthened with near-term supply chain pressure, since lower readings reflect longer delivery times. Chart 5Shanghai Lockdowns Will Disrupt The Already Overstretched Global Shipping Industry
Shanghai Lockdowns Will Disrupt The Already Overstretched Global Shipping Industry
Shanghai Lockdowns Will Disrupt The Already Overstretched Global Shipping Industry
Chart 6Chinese Suppliers' Delivery Times Have Lengthened
Chinese Suppliers' Delivery Times Have Lengthened
Chinese Suppliers' Delivery Times Have Lengthened
Bottom Line: The economic shock from the current COVID outbreaks is compounding an already weak domestic demand in China. Since the cities and regions that are affected by this round of lockdowns are some of China’s most developed metropolitan areas, the negative impact will likely be larger than during the past two years. How Long Will The Battle Last? China’s struggle to contain the current round of domestic COVID outbreaks will likely last longer than the market has priced in. There is also a non-trivial risk that during the rest of the year, the country will need to shutter large parts of its economy more frequently to combat the spread of COVID variants, which appear to become more contagious as the mutation continues. The lockdowns in Shanghai have already been extended beyond the originally announced two-phased, eight-day restriction plan (Chart 7). The first phase of the lockdown, for which restrictions were due to be lifted on the morning of April 1, has now been extended to anywhere between 3 to 10 days. It may take Shanghai, a city of 25 million residents, between four to six weeks to bring the number of new cases down to a level that is acceptable to the authorities. Chart 7Shanghai Is Extending Its Two-Phased, Eight-Day Lockdowns
Bracing For More Turbulence
Bracing For More Turbulence
Shenzhen, a dynamic metropolitan city bordering Hong Kong, seems to have successfully contained its COVID outbreaks after only one week of a city-wide lockdown. However, Shenzhen imposed lockdowns at an early stage of the outbreak, when both confirmed and asymptomatic case numbers in the city were in the low double digits. Shanghai, on the other hand, took more stringent measures when the number of asymptomatic cases had already reached nearly a thousand. The Omicron variant is four times more transmissible than the earlier Delta mutation, which means it will generate an explosive rise in cases and make containing the virus spread much more difficult than with Delta. In a fully susceptible (unvaccinated and uninfected) population, one person with Delta would on average infect five other people, while one person with Omicron could transmit the virus to about 20 others. As a result, despite a relatively low number of newly confirmed cases, the surging asymptomatic cases in Shanghai imply that a larger population in the city might have already been infected (Chart 8). China’s struggle with the current wave of COVID outbreaks may be an example of what lies ahead, as continuously mutating variants become more contagious and will pose fresh new challenges to China’s zero-COVID approach. The latest strain of Omicron BA.2 appears to be 40% more contagious than the original Omicron strain and is quickly spreading around the world. The number of cases has spiked across much of Europe, parts of Asia, and has begun to rise in North America (Chart 9). It took only two months from when China reported its first local Omicron BA.1 case in early January to the outbreaks of Omicron BA.2 in March. Chart 8Surging Asymptomatic Patients In Shanghai Imply More Confirmed Cases Still To Come
Surging Asymptomatic Patients In Shanghai Imply More Confirmed Cases Still To Come
Surging Asymptomatic Patients In Shanghai Imply More Confirmed Cases Still To Come
Chart 9Covid Cases Are On The Rise Again Globally
Bracing For More Turbulence
Bracing For More Turbulence
This presents the Chinese authorities with a difficult dilemma: impose severe mobility restrictions when domestic cases pop up, or let the virus run rampant and develop a herd immunity among much of its population. China’s leadership has recently reiterated that the country will stick to its zero-COVID strategy. The success that China has had in suppressing the virus in the past two years has left its population with little natural immunity. Moreover, while China’s overall vaccination rate is high at 85%, less than 50% of people over the age of 80 in the country are fully vaccinated. The authorities have been fine tuning their measures to control the virus spread while sticking to a zero-COVID approach. The recently calibrated measures include allowing residents to take rapid antigen tests at home, quarantining people with asymptomatic COVID cases at dedicated isolation centers rather than hospitals, and monitoring patients for shorter periods than previously required. China has also fast-tracked the approval for the importing and domestic manufacturing of Paxlovid, which is highly effective at preventing hospitalization if taken within five days of the onset of symptoms. In addition, the global production of antiviral drugs is starting to ramp up (Chart 10). Nonetheless, China will probably wait until the antiviral drugs are in sufficient supply before fundamentally relaxing its zero-COVID policy. In the meantime, while the country’s economic growth will rebound when the current wave of COVID cases subsides, disruptive outbreaks and lockdowns may become more frequent as the authorities continue to play whack-a-mole with COVID (Chart 11). As a result, business activity in China will suffer. Chart 10Production Of New COVID Drugs Is Picking Up
Production Of New COVID Drugs Is Picking Up
Production Of New COVID Drugs Is Picking Up
Chart 11China Has The Most Stringent COVID-Control Measures Among Large Economies
China Has The Most Stringent COVID-Control Measures Among Large Economies
China Has The Most Stringent COVID-Control Measures Among Large Economies
Bottom Line: Shanghai’s current battle with COVID outbreaks will likely continue in the coming weeks. Before China can relax its zero-COVID policy, the more contagious COVID virus mutations in the future will see Chinese authorities adopt even harsher quarantine and control measures, which will disrupt economic activity further. Investment Conclusion Chinese stocks in both onshore and offshore markets have recovered some ground from their deeply oversold conditions in mid-March (Chart 12A). While the risk-reward profile for the A-share market warrants a neutral position in a global portfolio, in absolute terms both on- and offshore Chinese stock prices have probably not reached their bottom (Chart 12B). Chart 12AChinese Stocks Will Likely Fall Further In Q2
Chinese Stocks Will Likely Fall Further In Q2
Chinese Stocks Will Likely Fall Further In Q2
Chart 12BIn Relative Terms, Stay Neutral On Chinese Onshore Stocks
In Relative Terms, Stay Neutral On Chinese Onshore Stocks
In Relative Terms, Stay Neutral On Chinese Onshore Stocks
The private sector’s downbeat sentiment, households’ subdued demand for housing, and the ongoing COVID-19 lockdowns pose significant near-term downside risks to China’s economy and corporate profits. February’s credit impulse shows that corporate and household demand for credit has been weakening. Without a major reversal in corporate credit and the property market, a strong business cycle recovery is unlikely in China. Moreover, the March PMI readings suggest that the lockdowns in China’s business and manufacturing hubs will have substantial negative impacts on the economy. As such, we maintain our neutral stance on Chinese onshore stocks and continue to recommend underweight Chinese offshore stocks in a global portfolio. Jing Sima China Strategist jings@bcaresearch.com Strategic Themes Cyclical Recommendations
Executive Summary Equities Are Still Attractive Versus Bonds
Equities Are Still Attractive Versus Bonds
Equities Are Still Attractive Versus Bonds
Macroeconomic Outlook: Global growth will reaccelerate in the second half of this year provided a ceasefire in Ukraine is reached. Inflation will temporarily come down as the dislocations caused by the war and the pandemic subside, before moving up again in late 2023. Equities: Maintain a modest overweight in stocks over a 12-month horizon, favoring non-US equities, small caps, and value stocks. Look to turn more defensive in the second half of 2023 in advance of another wave of inflation. Fixed income: The neutral rate of interest in the US is around 3.5%-to-4%, which is substantially higher than the consensus view. Bond yields will move sideways this year but will rise over the long haul. Overweight Germany, France, Japan, and Australia while underweighting the US and the UK in a global bond portfolio. Credit: Corporate debt will outperform high-quality government bonds over the next 12 months. Favor HY over IG and Europe over the US. Spreads will widen again in late 2023. Currencies: As a countercyclical currency, the US dollar will weaken later this year, with EUR/USD rising to 1.18. We are upgrading our view on the yen from bearish to neutral due to improved valuations. The CNY will strengthen as the Chinese authorities take steps to boost domestic demand. Commodities: Oil prices will dip in the second half of 2022 as the geopolitical premium in crude declines and more OPEC supply comes to market. However, oil and other commodity prices will start moving higher by mid-2023. Bottom Line: The cyclical bull market in stocks that began in 2009 is running long in the tooth, but the combination of faster global growth later this year and a temporary lull in inflation should pave the way for one final hurrah for equities. Dear Client, Instead of our regular report this week, we are sending you our Quarterly Strategy Outlook, where we explore the major trends that are set to drive financial markets in the rest of 2022 and beyond. Next week, please join me for a webcast on Monday, April 11 at 9:00 AM EDT (2:00 PM BST, 3:00 PM CEST, 9:00 PM HKT) where I will discuss the outlook. Best regards, Peter Berezin, Chief Global Strategist P.S. You can now follow me on LinkedIn and Twitter. I. Overview We continue to recommend overweighting global equities over a 12-month horizon. However, we see downside risks to stocks both in the near term (next 3 months) and long term (2-to-5 years). In the near term, stocks will weaken anew if Russia’s stated intentions to scale back operations in Ukraine turn out to be a ruse. There is also a risk that China will need to temporarily shutter large parts of its economy to combat the spread of the highly contagious BA.2 Omicron variant. While stocks could suffer a period of indigestion in response to monetary tightening by the Fed and a number of other central banks, we doubt that rates will rise enough over the next 12 months to undermine the global economy. This reflects our view that the neutral rate of interest in the US and most other countries is higher than widely believed. If the neutral rate ends up being between 3.5% and 4% in the US, as we expect, the odds are low that the Fed will induce a recession by raising rates to 2.75%, as the latest dot plot implies (Chart 1). Chart 1The Market Sees The Fed Raising Rates To Around 3% And Then Backing Off
2022 Second Quarter Strategy Outlook – The New Neutral
2022 Second Quarter Strategy Outlook – The New Neutral
The downside of a higher neutral rate is that eventually, investors will need to value stocks using a higher real discount rate. How fast markets mark up their estimate of neutral depends on the trajectory of inflation. We were warning about inflation before it was cool to warn about inflation (see, for example, our January 2021 report, Stagflation in a Few Months?; or our February 2021 report, 1970s-Style Inflation: Yes, It Could Happen Again). Our view has been that inflation will follow a “two steps up, one step down” pattern. We are currently near the top of those two steps: US inflation will temporarily decline in the second half of this year, as goods inflation drops but service inflation is slow to rise. The decline in inflation will provide some breathing room for the Fed, allowing it to raise rates by no more than what markets are already discounting over the next 12 months. Unfortunately, the respite in inflation will not last long. By the end of 2023, inflation will start to pick up again, forcing the Fed to resume hiking rates in 2024. This second round of Fed tightening is not priced by the markets, and so when it happens, it could be quite disruptive for stocks and other risk assets. Investors should overweight equities on a 12-month horizon but look to turn more defensive in the second half of 2023. II. The Global Economy War and Pestilence Are Near-Term Risks BCA’s geopolitical team, led by Matt Gertken, was ringing the alarm bell about Ukraine well before Russia’s invasion. Recent indications from Russia that it will scale back operations in Ukraine could pave the way for a ceasefire; or they could turn out to be a ruse, giving Russia time to restock supply lines and fortify its army in advance of a new summertime campaign against Kyiv. It is too early to tell, but either way, our geopolitical team expects more fighting in the near term. The West is not keen to give Putin an easy off-ramp, and even if it were, it is doubtful he would take it. The only way that Putin can salvage his legacy among his fan base in Russia is to decisively win the war in order to ensure Ukraine’s military neutrality. For his part, Zelensky cannot simply agree to Russia’s pre-war demands that Ukraine demilitarize and swear off joining NATO unless Russian forces first withdraw. To give in to such demands without any concrete security guarantees would raise the question of why Ukraine fought the war to begin with. The Impact of the Ukraine War on the Global Economy The direct effect of the war on the global economy is likely to be small. Together, Russia and Ukraine account for 3.5% of global GDP in PPP terms and 1.9% in dollar terms. Exports to Russia and Ukraine amount to only 0.2% of G7 GDP (Chart 2). Most corporations have little direct exposure to Russia, although there are a few notable exceptions (Chart 3). Chart 2Little Direct Trade Exposure To Russia And Ukraine
2022 Second Quarter Strategy Outlook – The New Neutral
2022 Second Quarter Strategy Outlook – The New Neutral
In contrast to the direct effects, the indirect effects have the potential to be sizable. Russia is the world’s second largest oil producer, accounting for 12% of annual global output (Chart 4). It is the world’s top exporter of natural gas. About half of European natural gas imports come from Russia. Russia is also a significant producer of nickel, copper, aluminum, steel, and palladium. Chart 3Only A Handful Of Firms Have Significant Sales Exposure To Russia
2022 Second Quarter Strategy Outlook – The New Neutral
2022 Second Quarter Strategy Outlook – The New Neutral
Chart 4Russia is The World's Second Largest Oil Producer
Russia is The World's Second Largest Oil Producer
Russia is The World's Second Largest Oil Producer
Russia and Ukraine are major agricultural producers. Together, they account for a quarter of global wheat exports, with much of it going to the Middle East and North Africa (Chart 5). They are also significant producers of potatoes, corn, sugar beets, and seed oils. In addition, Russia produces two-thirds of all ammonium nitrate, the main source of nitrogen-based fertilizers. Largely as a result of higher commodity prices and other supply disruptions, the OECD estimates that the war could shave about 1% off of global growth this year, with Europe taking the brunt of the hit (Chart 6). At present, the futures curves for most commodities are highly backwardated (Chart 7). While one cannot look to the futures as unbiased predictors of where spot prices are heading, it is fair to say that commodity markets are discounting some easing in prices over the next two years. If that does not occur, global growth could weaken more than the OECD expects. Chart 5Developing Economies Buy The Bulk Of Russian And Ukrainian Wheat
2022 Second Quarter Strategy Outlook – The New Neutral
2022 Second Quarter Strategy Outlook – The New Neutral
Chart 6The War In Ukraine Could Shave One Percentage Point Off Of Global Growth
2022 Second Quarter Strategy Outlook – The New Neutral
2022 Second Quarter Strategy Outlook – The New Neutral
Chart 7Futures Curves For Most Commodities Are Backwardated
2022 Second Quarter Strategy Outlook – The New Neutral
2022 Second Quarter Strategy Outlook – The New Neutral
Another Covid Wave Two years after “two weeks to flatten the curve,” the world continues to underappreciate the power of exponential growth. Suppose that it takes five days for someone with Covid to infect someone else. If everyone with Covid infects an average of six people, the cumulative number of Covid cases would rise from 1,000 to 10 million in around four weeks. Suppose you could cut the number of new infections in half to three per person. In that case, it would take about six weeks for 10 million people to be infected. In other words, mitigation measures that cut the infection rate by half would only extend how long it takes for 10 million people to be infected by two weeks. That’s not a lot. The point is that any infection rate above one will generate an explosive rise in cases. In the pre-Omicron days, keeping the infection rate below one was difficult, but not impossible for countries with the means and motivation to do so. As the virus has become more contagious, however, keeping it at bay has grown more difficult. The latest strain of Omicron, BA.2, appears to be 40% more contagious than the original Omicron strain, which itself was about 4-times more contagious than Delta. BA.2 is quickly spreading around the world. The number of cases has spiked across much of Europe, parts of Asia, and has begun to rise in North America (Chart 8). In China, the authorities have locked down Shanghai, home to 25 million people. Chart 8Covid Cases Are On The Rise Again
2022 Second Quarter Strategy Outlook – The New Neutral
2022 Second Quarter Strategy Outlook – The New Neutral
The success that China has had in suppressing the virus has left its population with little natural immunity; and given the questionable efficacy of its vaccines, with little artificial immunity as well. Moreover, as is the case in Hong Kong, a large share of mainland China’s elderly population remains completely unvaccinated. Chart 9New Covid Drugs Are Set To Hit The Market
2022 Second Quarter Strategy Outlook – The New Neutral
2022 Second Quarter Strategy Outlook – The New Neutral
This presents the Chinese authorities with a difficult dilemma: Impose severe lockdowns over much of the population, or let the virus run rampant. As the logic of exponential change described above suggests, there is not much of a middle ground. Our guess is that the Chinese government will choose the former option. China has already signed a deal to commercialize Pfizer’s Paxlovid. The drug is highly effective at preventing hospitalization if taken within five days from the onset of symptoms. Fortunately, Paxlovid production is starting to ramp up (Chart 9). China will probably wait until it has sufficient supply of the drug before relaxing its zero-Covid policy. While beneficial to growth later this year, this strategy could have a negative near-term impact on activity, as the authorities continue to play whack-a-mole with Covid. Chart 10Inflation Is Running High, Especially In The US
Inflation Is Running High, Especially In The US
Inflation Is Running High, Especially In The US
Central Banks in a Bind Standard economic theory says that central banks should adjust interest rates in response to permanent shocks, while ignoring transitory ones. This is especially true if the shock in question emanates from the supply side of the economy. After all, higher rates cool aggregate demand; they do not raise aggregate supply. The lone exception to this rule is when a supply shock threatens to dislodge long-term inflation expectations. If long-term inflation expectations become unanchored, what began as a transitory shock could morph into a semi-permanent one. The problem for central banks is that the dislocations caused by the Ukraine war are coming at a time when inflation is already running high. Headline CPI inflation reached 7.9% in the US in February, while core CPI inflation clocked in at 6.4%. Trimmed-mean inflation has increased in most economies (Chart 10). Fortunately, while short-term inflation expectations have moved up, long-term expectations have been more stable. Expected US inflation 5-to-10 years out in the University of Michigan survey stood at 3.0% in March, down a notch from 3.1% in January, and broadly in line with the average reading between 2010 and 2015 (Chart 11). Survey-based measures of long-term inflation expectations are even more subdued in the euro area and Japan (Chart 12). Market-based inflation expectations have risen, although this partly reflects higher oil prices. Even then, the widely-watched 5-year, 5-year forward TIPS inflation breakeven rate remains near the bottom of the Fed’s comfort range of 2.3%-to-2.5% (Chart 13).1 Chart 11Long-Term Inflation Expectations Remain Contained In The US...
Long-Term Inflation Expectations Remain Contained In The US...
Long-Term Inflation Expectations Remain Contained In The US...
Chart 12... And In The Euro Area And Japan
... And In The Euro Area And Japan
... And In The Euro Area And Japan
Chart 13The Market's Long-Term Inflation Expectations Are Near The Bottom Of The Fed's Comfort Zone
The Market's Long-Term Inflation Expectations Are Near The Bottom Of The Fed's Comfort Zone
The Market's Long-Term Inflation Expectations Are Near The Bottom Of The Fed's Comfort Zone
Goods versus Services Inflation Most of the increase in consumer prices has been concentrated in goods rather than services (Chart 14). This is rather unusual in that goods prices usually fall over time; but in the context of the pandemic, it is entirely understandable. Chart 14Goods Prices Have Been A Major Driver Of Overall Inflation
2022 Second Quarter Strategy Outlook – The New Neutral
2022 Second Quarter Strategy Outlook – The New Neutral
The pandemic caused spending to shift from services to goods (Chart 15). This occurred at the same time as the supply of goods was being adversely affected by various pandemic-disruptions, most notably the semiconductor shortage that is still curtailing automobile production. Chart 15AGoods Inflation Should Fade As Consumption Shifts Back Towards Services (I)
Goods Inflation Should Fade Goods Inflation Should Fade As Consumption Shifts Back Towards Services (I)
Goods Inflation Should Fade Goods Inflation Should Fade As Consumption Shifts Back Towards Services (I)
Chart 15BGoods Inflation Should Fade As Consumption Shifts Back Towards Services (II)
Goods Inflation Should Fade Goods Inflation Should Fade As Consumption Shifts Back Towards Services (II)
Goods Inflation Should Fade Goods Inflation Should Fade As Consumption Shifts Back Towards Services (II)
Looking out, the composition of consumer spending will shift back towards services. Supply chain bottlenecks should also abate, especially if the situation in Ukraine stabilizes. It is worth noting that the number of ships on anchor off the coast of Los Angeles and Long Beach has already fallen by half (Chart 16). The supplier delivery components of both the manufacturing and nonmanufacturing ISM indices have also come off their highs (Chart 17). Even used car prices appear to have finally peaked (Chart 18). Chart 16Shipping Delays Are Abating
Shipping Delays Are Abating
Shipping Delays Are Abating
Chart 17Delivery Times Are Slowly Coming Down
Delivery Times Are Slowly Coming Down
Delivery Times Are Slowly Coming Down
Chart 18Used Car Prices May Have Finally Peaked
Used Car Prices May Have Finally Peaked
Used Car Prices May Have Finally Peaked
On the Lookout for a Wage-Price Spiral Could rising services inflation offset any decline in goods inflation this year? It is possible, but for that to happen, wage growth would have to accelerate further. For now, much of the acceleration in US wage growth has occurred at the bottom end of the income distribution (Chart 19). It is easy to see why. Chart 20 shows that low-paid workers have not returned to the labor market to the same degree as higher-paid workers. However, now that extended unemployment benefits have lapsed and savings deposits are being drawn down, the incentive to resume work will strengthen. Chart 19Wage Growth Has Picked Up, But Mostly At The Bottom End Of The Income Distribution
Wage Growth Has Picked Up, But Mostly At The Bottom End Of The Income Distribution
Wage Growth Has Picked Up, But Mostly At The Bottom End Of The Income Distribution
Chart 20More Low-Wage Employees Should Return To Work
More Low-Wage Employees Should Return To Work
More Low-Wage Employees Should Return To Work
Chart 21More Workers Will Return To Their Jobs Once The Pandemic Ends
More Workers Will Return To Their Jobs Once The Pandemic Ends
More Workers Will Return To Their Jobs Once The Pandemic Ends
The end of the pandemic should allow more workers to remain at their jobs. In January, during the height of the Omicron wave, 8.75 million US workers (5% of the total workforce) were absent from work due to the virus (Chart 21). How High Will Interest Rates Eventually Rise? If goods inflation comes down swiftly later this year, and services inflation is slow to rise, then overall inflation will decline. This should allow the Fed to pause tightening in early 2023. Whether the Fed will remain on hold beyond then depends on where the neutral rate of interest resides. Chart 22The Yield Curve Inverted in Mid-2019 But Growth Accelerated
The Yield Curve Inverted in Mid-2019 But Growth Accelerated
The Yield Curve Inverted in Mid-2019 But Growth Accelerated
The neutral rate, or equilibrium rate as it is sometimes called, is the interest rate consistent with full employment and stable inflation. If the Fed pauses hiking before interest rates have reached neutral, the economy will eventually overheat, forcing the Fed to resume hiking. In contrast, if the Fed inadvertently raises rates above neutral, unemployment will start rising, requiring the Fed to cut rates. Markets are clearly worried about the latter scenario. The 2/10 yield curve inverted earlier this week. With the term premium much lower than in the past, an inversion in the yield curve is not the powerful harbinger of recession that it once was. After all, the 2/10 curve inverted in August 2019 and the economy actually strengthened over the subsequent six months before the pandemic came along (Chart 22). Nevertheless, an inverted yield curve is consistent with markets expectations that the Fed will raise rates above neutral. That is always a dangerous undertaking. Raising rates above neutral would likely push up the unemployment rate. There has never been a case in the post-war era where the 3-month moving average of the unemployment rate has risen by more than 30 basis points without a recession occurring (Chart 23). Chart 23When Unemployment Starts Rising, It Usually Keeps Rising
When Unemployment Starts Rising, It Usually Keeps Rising
When Unemployment Starts Rising, It Usually Keeps Rising
As discussed in the Feature Section below, the neutral rate of interest is probably between 3.5% and 4% in the US. This is good news in the short term because it lowers the odds that the Fed will raise rates above neutral during the next 12 months. It is bad news in the long run because it means that the Fed will find itself even more behind the curve than it is now, making a recession almost inevitable. The Feature Section builds on our report from two weeks ago. Readers familiar with that report should feel free to skip ahead to the next section. III. Feature: A Higher Neutral Rate Conceptually, the neutral rate is the interest rate that equates the amount of investment a country wants to undertake at full employment with the amount of savings that it has at its disposal.2 Anything that reduces savings or increases investment would raise the neutral rate (Chart 24). Chart 24The Savings-Investment Balance Determines The Neutral Rate Of Interest
2022 Second Quarter Strategy Outlook – The New Neutral
2022 Second Quarter Strategy Outlook – The New Neutral
A number of factors are likely to lower desired savings in the US over the next few years: Households will spend down their accumulated pandemic savings. US households are sitting on $2.3 trillion (10% of GDP) in excess savings, the result of both decreased spending on services during the pandemic and the receipt of generous government transfer payments (Chart 25). Household wealth has soared since the start of the pandemic (Chart 26). Conservatively assuming that households spend three cents of every additional dollar in wealth, the resulting wealth effect could boost consumption by 4% of GDP. Chart 25Plenty Of Pent-Up Demand
Plenty Of Pent-Up Demand
Plenty Of Pent-Up Demand
Chart 26Net Worth Has Soared Since The Pandemic
Net Worth Has Soared Since The Pandemic
Net Worth Has Soared Since The Pandemic
The household deleveraging cycle has ended (Chart 27). Household balance sheets are in good shape. After falling during the initial stages of the pandemic, consumer credit has begun to rebound. For the first time since the housing boom, mortgage equity withdrawals are rising. Banks are easing lending standards on consumer loans across the board. Chart 27US Household Deleveraging Pressures Have Abated
US Household Deleveraging Pressures Have Abated
US Household Deleveraging Pressures Have Abated
Chart 28Baby Boomers Have Amassed A Lot Of Wealth
2022 Second Quarter Strategy Outlook – The New Neutral
2022 Second Quarter Strategy Outlook – The New Neutral
Baby boomers are retiring. They hold over half of US household wealth, considerably more than younger generations (Chart 28). As baby boomers transition from being savers to dissavers, national savings will decline. Government budget deficits will stay elevated. Fiscal deficits subtract from national savings. While the US budget deficit will come down over the next few years, the IMF estimates that the structural budget deficit will still average 4.9% of GDP between 2022 and 2026 compared to 2.0% of GDP between 2014 and 2019 (Chart 29).Chart 29Fiscal Policy: Tighter But Not Tight
2022 Second Quarter Strategy Outlook – The New Neutral
2022 Second Quarter Strategy Outlook – The New Neutral
On the investment front: The deceleration in trend GDP growth, which depressed investment spending, has largely run its course.3 According to the Congressional Budget Office, real potential GDP growth fell from over 3% in the early 1980s to about 1.9% today. The CBO expects potential growth to edge down only slightly to 1.7% over the next few decades (Chart 30). After moving broadly sideways for two decades, core capital goods orders – a leading indicator for capital spending – have broken out to the upside (Chart 31). Capex intention surveys remain upbeat (Chart 32). The average age of the nonresidential capital stock currently stands at 16.3 years, the highest since 1965 (Chart 33). Chart 30Much Of The Deceleration In Potential Growth Has Already Happened
Much Of The Deceleration In Potential Growth Has Already Happened
Much Of The Deceleration In Potential Growth Has Already Happened
Chart 31Positive Signs For Capex (I)
Positive Signs For Capex (I)
Positive Signs For Capex (I)
Chart 32Positive Signs For Capex (II)
Positive Signs For Capex (II)
Positive Signs For Capex (II)
Chart 33An Aging Capital Stock
An Aging Capital Stock
An Aging Capital Stock
Similar to nonresidential investment, the US has been underinvesting in residential real estate (Chart 34). The average age of the housing stock has risen to a 71-year high of 31 years. The homeowner vacancy rate has plunged to the lowest level on record. The number of newly finished homes for sale is half of what it was prior to the pandemic. Chart 34US Housing Is In Short Supply
US Housing Is In Short Supply
US Housing Is In Short Supply
The New ESG: Energy Security and Guns The war in Ukraine will put further upward pressure on the neutral rate, especially outside of the United States. After staging a plodding recovery following the euro debt crisis, European capital spending received a sizable boost from the launch of the NextGenerationEU Recovery Fund (Chart 35). As Mathieu Savary points out in his latest must-read report on Europe, capital spending will rise further in the years ahead as European governments accelerate efforts to make their economies less reliant on Russian energy. Germany has already announced plans to construct three new LNG terminals. The push to build out Europe’s energy infrastructure is coming at a time when businesses are looking to ramp up capital spending. As in the US, Europe’s capital stock has aged rapidly over the past decade (Chart 36). Chart 35European Capex Should Recover
European Capex Should Recover
European Capex Should Recover
Chart 36European Machines Need More Than Just An Oil Change
European Machines Need More Than Just An Oil Change
European Machines Need More Than Just An Oil Change
Chart 37The War In Ukraine Calls For More Spending Across Europe
The War In Ukraine Calls For More Spending Across Europe
The War In Ukraine Calls For More Spending Across Europe
Meanwhile, European governments are trying to ease the burden from rising energy costs. For example, France has introduced a rebate on fuel. It is part of a EUR 20 billion package aimed at cutting heating and electricity bills. European military spending will rise. Military spending currently amounts to 1.5% of GDP, well below NATO’s threshold of 2% (Chart 37). Germany has announced that it will spend EUR 100 billion more on defense. European governments will also need to boost spending to accommodate Ukrainian refugees. The UN estimates that four million refugees have left Ukraine, with the vast majority settling in the EU. A Smaller Chinese Current Account Surplus? The difference between what a country saves and invests equals its current account balance. Historically, China has been a major exporter of savings, which has helped depress interest rates abroad. While China’s current account surplus has declined as a share of its own GDP, it has remained very large as a share of global ex-China GDP, reflecting China’s growing weight in the global economy (Chart 38). Many analysts assume that China will double down on efforts to boost exports in order to offset the drag from falling property investment. However, there is a major geopolitical snag with that thesis: A country that runs a current account surplus must, by definition, accumulate assets from the rest of the world. As the freezing of Russia’s foreign exchange reserves demonstrates, that is a risky proposition for a country such as China. Rather than increasing its current account surplus, China may seek to bolster its economy by raising domestic demand. This could be achieved by either boosting domestic infrastructure spending or raising household consumption. Notably, China’s credit impulse appears to have bottomed and is set to increase in the second half of the year. This is good news not just for Chinese growth but growth abroad (Chart 39). Chart 38Will China Be A Source Of Excess Savings?
Will China Be A Source Of Excess Savings?
Will China Be A Source Of Excess Savings?
Chart 39China's Credit Impulse Appears To Have Bottomed
China's Credit Impulse Appears To Have Bottomed
China's Credit Impulse Appears To Have Bottomed
The IMF’s latest projections foresee China’s current account surplus falling by more than half between 2021 and 2026 as a share of global ex-China GDP. If this were to happen, the neutral rate in China and elsewhere would rise. IV. Financial Markets A. Portfolio Strategy Chart 40The Markets Wobbled And Then Recovered After The Beginning Of The Last Four Fed Rate Cycles
The Markets Wobbled And Then Recovered After The Beginning Of The Last Four Fed Rate Cycles
The Markets Wobbled And Then Recovered After The Beginning Of The Last Four Fed Rate Cycles
As noted in the overview, if the neutral rate turns out to be higher than currently perceived, the Fed is unlikely to induce a recession by raising rates over the next 12 months. That is good news for equities. A look back at the past four Fed tightening cycles shows that stocks often wobble when the Fed starts hiking rates, but then usually rise as long as rates do not move into restrictive territory (Chart 40). Unfortunately, a higher neutral rate also means that investors will eventually need to value stocks using a higher discount rate. It also means that any decline in inflation this year will not last. The US economy will probably start to overheat again in the second half of 2023. This will set the stage for a second, and more painful, tightening cycle in 2024. Admittedly, there is a lot of uncertainty over our “two steps up, one step down” forecast for inflation. It is certainly possible that the “one step down” phase does not last long and that the resurgence in inflation we are expecting in the second half of next year occurs earlier. It is also possible that investors will react negatively to rising rates, even if the economy is ultimately able to withstand them. As such, only a modest overweight to equities is justified over the next 12 months, with risks tilted to the downside in the near term. More conservative asset allocators should consider moving to a neutral stance on equities already, as my colleague Garry Evans advised clients to do in his latest Global Asset Allocation Quarterly Portfolio Outlook. B. Fixed Income Stay Underweight Duration Over a 2-to-5 Year Horizon Our recommendation to maintain below-benchmark duration in fixed-income portfolios panned out since the publication of our Annual Outlook in December, with the US 10-year Treasury yield rising from 1.43% to 2.38%. We continue to expect bond yields in the US to rise over the long haul. Conceptually, the yield on a government bond equals the expected path of policy rates over the duration of the bond plus a term premium. The term premium is the difference between the return investors can expect from buying a long-term bond that pays a fixed interest rate, and the return from rolling over a short-term bill. The term premium has been negative in recent years. Investors have been willing to sacrifice return to own long-term bonds because bond prices usually rise when the odds of a recession go up. The fact that monthly stock returns and changes in bond yields have been positively correlated since 2001 underscores the benefits that investors have received from owning long-term bonds as a hedge against unfavorable economic news (Chart 41). However, now that inflation has emerged as an increasingly important macroeconomic risk, the correlation between stock returns and changes in bond yields could turn negative again. Unlike weak economic growth, which is bad for only stocks, high inflation is bad for both bonds and stocks. Chart 41Correlation Between Stock Returns And Bond Yields Could Turn Negative
Correlation Between Stock Returns And Bond Yields Could Turn Negative
Correlation Between Stock Returns And Bond Yields Could Turn Negative
If bond yields start to rise whenever stock prices fall, the incentive to own long-term bonds will decline. This will cause the term premium to increase. Assuming the term premium rises to about 0.5%, and a neutral rate of 3.5%-to-4%, the long-term fair value for the 10-year US Treasury yield is 4%-to-4.5%. This is well above the 5-year/5-year forward yield of 2.20%. Move from Underweight to Neutral Duration Over a 12-Month Horizon Below benchmark duration positions usually do well when the Fed hikes rates by more than expected over the subsequent 12 months (Chart 42). Chart 42The Golden Rule Of Bond Investing
The Golden Rule Of Bond Investing
The Golden Rule Of Bond Investing
Given our view that US inflation will temporarily decline later this year, the Fed will probably not need to raise rates over the next 12 months by more than the 249 basis points that markets are already discounting. Thus, while a below-benchmark duration position is advisable over a 2-to-5-year time frame, it could struggle over a horizon of less than 12 months. Our end-2022 target range for the US 10-year Treasury yield is 2.25%-to-2.5%. Chart 43Bond Sentiment And Positioning Are Bearish
Bond Sentiment And Positioning Are Bearish
Bond Sentiment And Positioning Are Bearish
Supporting our decision to move to a neutral benchmark duration stance over a 12-month horizon is that investor positioning and sentiment are both bond bearish (Chart 43). From a contrarian point of view, this is supportive of bonds. Global Bond Allocation BCA’s global fixed-income strategists recommend overweighting German, French, Australian, and Japanese government bonds, while underweighting those of the US and the UK. They are neutral on Italy and Spain given that the ECB is set to slow the pace of bond buying. The neutral rate of interest has risen in the euro area, partly on the back of more expansionary fiscal policy across the region. In absolute terms, however, the neutral rate in the euro area is still quite low, and possibly negative. Unlike in the US, where inflation has risen to uncomfortably high levels, much of Europe would benefit from higher inflation expectations, as this would depress real rates across the region, giving growth a boost. This implies that the ECB is unlikely to raise rates much over the next two years. As with the euro area, Japan would benefit from lower real rates. The Bank of Japan’s yield curve control policy has been put to the test in recent weeks. To its credit, the BoJ has stuck to its guns, buying bonds in unlimited quantities to prevent yields from rising. We expect the BoJ to stay the course. Unlike in the euro area and Japan, inflation expectations are quite elevated in the UK and wage growth is rising quickly there. This justifies an underweight stance on UK gilts. Although job vacancies in Australia have climbed to record levels, wage growth is still not strong enough from the RBA’s point of view to justify rapid rate hikes. As a result, BCA’s global fixed-income strategists remain overweight Australian bonds. Finally, our fixed-income strategists are underweight Canadian bonds but are contemplating upgrading them given that markets have already priced in 238 basis points in tightening over the next 12 months. Unlike in the US, high levels of consumer debt will also limit the Bank of Canada’s ability to raise rates. Modest Upside in High-Yield Corporate Bonds Credit spreads have narrowed in recent days but remain above where they were prior to Russia’s invasion of Ukraine. Since the start of the year, US investment-grade bonds have underperformed duration-matched Treasurys by 154 basis points, while high-yield bonds have underperformed by 96 basis points (Chart 44). The outperformance of high-yield relative to investment-grade debt can be explained by the fact that the former has more exposure to the energy sector, which has benefited from rising oil prices. Looking out, falling inflation and a rebound in global growth later this year should provide a modestly supportive backdrop for corporate credit. High-yield spreads are still pricing in a default rate of 3.8% over the next 12 months (Chart 45). This is well above the trailing 12-month default rate of 1.3%. Our fixed-income strategists continue to prefer US high-yield over US investment-grade. Chart 44Spreads Have Narrowed Over The Past Two Weeks But Remain Above Pre-War Levels
Spreads Have Narrowed Over The Past Two Weeks But Remain Above Pre-War Levels
Spreads Have Narrowed Over The Past Two Weeks But Remain Above Pre-War Levels
Chart 45Spread-Implied Default Rate Is Too High
2022 Second Quarter Strategy Outlook – The New Neutral
2022 Second Quarter Strategy Outlook – The New Neutral
European credit is attractively priced and should benefit from any stabilization in the situation in Ukraine. Our fixed-income strategists prefer both European high-yield and investment-grade bonds over their US counterparts. As with equities, the bull market in corporate credit will end in late 2023 as the Fed is forced to resume raising rates in 2024 in the face of an overheated economy. C. Currencies Chart 46Widening Interest Rate Differentials Have Supported The Dollar
Widening Interest Rate Differentials Have Supported The Dollar
Widening Interest Rate Differentials Have Supported The Dollar
The US Dollar Will Weaken Starting in the Second Half of 2022 Since bottoming last May, the US dollar has been trending higher. While the dollar could strengthen further in the near term if the war in Ukraine escalates, the fundamental backdrop supporting the greenback is starting to fray. If US inflation comes down later this year, the Fed is unlikely to raise rates by more than what markets are already discounting over the next 12 months. Thus, widening rate differentials will no longer support the dollar (Chart 46). The dollar is a countercyclical currency: It usually weakens when global growth is strengthening and strengthens when global growth is weakening (Chart 47). The dollar tends to be particularly vulnerable when growth expectations are rising more outside the US than in the US (Chart 48). Chart 47The Dollar Is A Countercyclical Currency
The Dollar Is A Countercyclical Currency
The Dollar Is A Countercyclical Currency
Chart 48Better Growth Prospects Abroad Will Weigh On The US Dollar
Better Growth Prospects Abroad Will Weigh On The US Dollar
Better Growth Prospects Abroad Will Weigh On The US Dollar
Global growth should rebound in the second half of the year once the pandemic finally ends and the situation in Ukraine stabilizes. Growth is especially likely to recover in Europe. This will support the euro, a dovish ECB notwithstanding. Chester Ntonifor, BCA’s Foreign Exchange Strategist, expects EUR/USD to end the year at 1.18. The Dollar is Overvalued The dollar’s ascent has left it overvalued by more than 20% on a Purchasing Power Parity (PPP) basis (Chart 49). The PPP exchange rate equalizes the price of a representative basket of goods and services between the US and other economies. PPP deviations from fair value have done a reasonably good job of predicting dollar movements over the long run (Chart 50). Chart 49USD Remains Overvalued
2022 Second Quarter Strategy Outlook – The New Neutral
2022 Second Quarter Strategy Outlook – The New Neutral
Chart 50Valuations Matter For FX Long-Term Returns
Valuations Matter For FX Long-Term Returns
Valuations Matter For FX Long-Term Returns
Reflecting the dollar’s overvaluation, the US trade deficit has widened sharply (Chart 51). Excluding energy exports, the US trade deficit as a share of GDP is now the largest on record. Equity inflows have helped finance America’s burgeoning current account deficit (Chart 52). However, these inflows have ebbed significantly as foreign investors have lost their infatuation with US tech stocks. Chart 51The US Trade Deficit Has Widened
The US Trade Deficit Has Widened
The US Trade Deficit Has Widened
Chart 52Net Inflows Into US Equities Have Dried Up
Net Inflows Into US Equities Have Dried Up
Net Inflows Into US Equities Have Dried Up
Dollar positioning remains stretched on the long side (Chart 53). That is not necessarily an obstacle in the short run, given that the dollar tends to be a momentum currency, but it does suggest that the greenback could weaken over a 12-month horizon as more dollar bulls jump ship. The Yen: Cheaper but Few Catalysts for a Bounce The trade-weighted yen has depreciated by 6.4% since the start of the year. The yen is 31% undervalued relative to the dollar on a PPP basis (Chart 54). In a nod to these improved valuations, we are upgrading our 12-month and long-term view on the yen from bearish to neutral. Chart 53Still A Lot of Dollar Bulls
Still A Lot of Dollar Bulls
Still A Lot of Dollar Bulls
Chart 54The Yen Has Gotten Cheaper
The Yen Has Gotten Cheaper
The Yen Has Gotten Cheaper
While the yen is unlikely to weaken much from current levels, it is unlikely to strengthen. As noted above, the Bank of Japan has no incentive to abandon its yield curve control strategy. Yes, the recent rapid decline in the yen is a shock to the economy, but it is a “good” shock in the sense that it could finally jolt inflation expectations towards the BoJ’s target of 2%. If inflation expectations rise, real rates would fall, which would be bearish for the currency. Favor the RMB and other EM Currencies The Chinese RMB has been resilient so far this year, rising slightly against the dollar, even as the greenback has rallied against most other currencies. Real rates are much higher in China than in the US, and this has supported the RMB (Chart 55). Chart 55Higher Real Rates In China Have Supported The RMB
Higher Real Rates In China Have Supported The RMB
Higher Real Rates In China Have Supported The RMB
Chart 56The RMB Is Undervalued Based On PPP
The RMB Is Undervalued Based On PPP
The RMB Is Undervalued Based On PPP
Despite the RMB’s strength, it is still undervalued by 10.5% relative to its PPP exchange rate (Chart 56). While productivity growth has slowed in China, it remains higher than in most other countries. The real exchange rates of countries that benefit from fast productivity growth typically appreciates over time. China holds about half of its foreign exchange reserves in US dollars, a number that has not changed much since 2012 (Chart 57). We expect China to diversify away from dollars over the coming years. Moreover, as discussed earlier in the report, the incentive for China to run large current account surpluses may fade, which will result in slower reserve accumulation. Both factors could curb the demand for dollars in international markets. Chart 57Half Of Chinese FX Reserves Are Held In USD Assets
2022 Second Quarter Strategy Outlook – The New Neutral
2022 Second Quarter Strategy Outlook – The New Neutral
A resilient RMB will provide a tailwind for other EM currencies. Many EM central banks began to raise rates well before their developed market counterparts. In Brazil, for example, the policy rate has risen to 11.75% from 2% last April. With inflation in EMs likely to come down later this year as pandemic and war-related dislocations subside, real policy rates will rise, giving EM currencies a boost. D. Commodities Longer-Term Bullish Thesis on Commodities Remains Intact BCA’s commodity team, led by Bob Ryan, expects crude prices to fall in the second half of the year, before moving higher again in 2023. Their forecast is for Brent to dip to $88/bbl by end-2022, which is below the current futures price of $97/bbl. Chart 58Dearth Of Oil Capex Will Put A Floor Under Oil Prices
2022 Second Quarter Strategy Outlook – The New Neutral
2022 Second Quarter Strategy Outlook – The New Neutral
The risk to their end-2022 forecast is tilted to the upside. The relationship between the Saudis and the US has become increasingly strained. This could hamper efforts to bring more oil to market. Hopes that Iranian crude will reach global markets could also be dashed if, as BCA’s geopolitical strategists expect, the US-Iran nuclear deal falls through. A cut-off of Russian oil could also cause prices to rise. While Urals crude is being sold at a heavy discount of $30/bbl to Brent (compared to a discount of around $2/bbl prior to the invasion), it is still leaving the country. In fact, Russian oil production actually rose in March over February. An escalation of the war would make it more difficult for Russia to divert enough oil to China, India, and other countries in order to evade Western sanctions. Looking beyond this year, Bob and his team see upside to oil prices. They expect Brent to finish 2023 at $96/bbl, above the futures price of $89/bbl. Years of underinvestment in crude oil production have led to tight supply conditions (Chart 58). Proven global oil reserves increased by only 6% between 2010 and 2020, having risen by 26% over the preceding decade. Stay Positive on Metals As with oil, there has been little investment in mining capacity in recent years. While a weaker property market in China will weigh on metals prices, this will be partly offset by increased infrastructure spending. The shift towards green energy will also boost metals prices. The typical electric vehicle requires about four times as much copper as a typical gasoline-powered vehicle. Huge amounts of copper will also be necessary to expand electrical grids. Favor Gold Over Cryptos After breaking above $2,000/oz, the price of gold has retreated to $1,926/oz. In the near term, gold prices will be swayed by geopolitical developments. Longer term, real rates will dictate the direction of gold prices. Chart 59 shows that there is a very strong correlation between the price of gold and TIPS yields. If we are correct that the neutral rate of interest is 3.5%-to-4% in the US, real bond yields will eventually need to rise from current levels. Gold prices are quite expensive by historic standards, which represents a long-term risk (Chart 60). Chart 59Strong Correlation Between Real Rates And Gold
Strong Correlation Between Real Rates And Gold
Strong Correlation Between Real Rates And Gold
Chart 60Gold Is Quite Pricey From A Historical Perspective
Gold Is Quite Pricey From A Historical Perspective
Gold Is Quite Pricey From A Historical Perspective
That said, we expect the bulk of the increase in real bond yields to occur only after mid-2023. As mentioned earlier, the Fed will probably not have to deliver more tightening that what markets are already discounting over the next 12 months. Thus, gold prices are unlikely to fall much in the near term. In any case, we continue to regard gold as a safer play than cryptocurrencies. As we discussed in Who Pays for Cryptos?, the long-term outlook for cryptocurrencies remains daunting. Many of the most hyped blockchain applications, from DeFi to NFTs, will turn out to be duds. Concerns that cryptocurrencies are harming the environment, contributing to crime, and enriching a small group of early investors at the expense of everyone else will lead to increased regulatory scrutiny. Our long-term target for Bitcoin is $5,000. E. Equities Equities Are Still Attractively Priced Relative to Bonds Corporate earnings are highly correlated with the state of the business cycle (Chart 61). A recovery in global growth later this year will bolster revenue, while easing supply-chain pressures should help contain costs in the face of rising wages. It is worth noting that despite all the shocks to the global economy, EPS estimates in the US and abroad have actually risen this year (Chart 62). Chart 61The Business Cycle Drives Earnings
The Business Cycle Drives Earnings
The Business Cycle Drives Earnings
Chart 62Global EPS Estimates Have Held Up Reasonably Well
2022 Second Quarter Strategy Outlook – The New Neutral
2022 Second Quarter Strategy Outlook – The New Neutral
Chart 63Equities Are Still Attractive Versus Bonds
Equities Are Still Attractive Versus Bonds
Equities Are Still Attractive Versus Bonds
As Doug Peta, BCA’s Chief US Strategist has pointed out, the bar for positive earnings surprises for Q1 is quite low: According to Refinitiv/IBES, S&P 500 earnings are expected to fall by 4.5% in Q1 over Q4 levels. Global equities currently trade at 18-times forward earnings. Relative to real bond yields, stocks continue to look reasonably cheap (Chart 63). Even in the US, where valuations are more stretched, the earnings yield on stocks exceeds the real bond yield by 570 basis points. At the peak of the market in 2000, the gap between earnings yields and real bond yields was close to zero. Favor Non-US Markets, Small Caps, and Value Valuations are especially attractive outside the US. Non-US equities trade at 13.7-times forward earnings. Emerging markets trade at a forward P/E of only 12.1. Correspondingly, the gap between earnings yields and real bond yields is about 200 basis points higher outside the US. In general, non-US markets fare best in a setting of accelerating growth and a weakening dollar – precisely the sort of environment we expect to prevail in the second half of the year (Chart 64). US small caps also perform best when growth is strengthening and the dollar is weakening (Chart 65). In contrast to the period between 2003 and 2020, small caps now trade at a discount to their large cap brethren. The S&P 600 currently trades at 14.4-times forward earnings compared to 19.7-times for the S&P 500, despite the fact that small cap earnings are projected to grow more quickly both over the next 12-months and over the long haul (Chart 66). Chart 64A Weaker Dollar And Stronger Global Economy Are Tailwinds For Non-US Stocks
A Weaker Dollar And Stronger Global Economy Are Tailwinds For Non-US Stocks
A Weaker Dollar And Stronger Global Economy Are Tailwinds For Non-US Stocks
Chart 65US Small Caps Usually Fare Well When The Economy Is Strengthening And The Dollar Is Weakening
US Small Caps Usually Fare Well When The Economy Is Strengthening And The Dollar Is Weakening
US Small Caps Usually Fare Well When The Economy Is Strengthening And The Dollar Is Weakening
Globally, growth stocks have outperformed value stocks by 60% since 2017. However, only one-tenth of that outperformance has come from faster earnings growth (Chart 67). This has left value trading nearly two standard deviations cheap relative to growth. Chart 66Small Caps Look Attractive Relative To Large Caps
Small Caps Look Attractive Relative To Large Caps
Small Caps Look Attractive Relative To Large Caps
Chart 67Value Remains Cheap
Value Remains Cheap
Value Remains Cheap
Chart 68Higher Yields Tend To Flatter Bank Stocks And Usually Weigh On Tech
Higher Yields Tend To Flatter Bank Stocks And Usually Weigh On Tech
Higher Yields Tend To Flatter Bank Stocks And Usually Weigh On Tech
Tech stocks are overrepresented in growth indices, while banks are overrepresented in value indices. US banks have held up relatively well since the start of the year but have not gained as much as one would have expected based on the significant increase in bond yields (Chart 68). With the deleveraging cycle in the US coming to an end, US banks sport both attractive valuations and the potential for better-than-expected earnings growth. European banks should also recover as the situation in Ukraine stabilizes. They trade at only 7.9-times forward earnings and 0.6-times book. On the flipside, structurally higher bond yields will weigh on tech shares. Moreover, as we discussed in our recent report entitled The Disruptor Delusion, a cooling in pandemic-related tech spending, increasing market saturation, and concerns about Big Tech’s excessive power will all hurt tech returns. Peter Berezin Chief Global Strategist peterb@bcaresearch.com Footnotes 1 The Federal Reserve targets an average inflation rate of 2% for the personal consumption expenditures (PCE) index. The TIPS breakeven is based on the CPI index. Due to compositional differences between the two indices, CPI inflation has historically averaged 30-to-50 basis points higher than PCE inflation. This is why the Fed effectively targets a CPI inflation rate of about 2.3%-to-2.5%. 2 These savings can either by generated domestically or imported from abroad via a current account deficit. 3 Theoretically, there is a close relationship between trend growth and the equilibrium investment-to-GDP ratio. For example, if real trend growth is 3% and the capital stock-to-GDP ratio is 200%, a country would need to invest 6% of GDP net of depreciation to maintain the existing capital stock-to-GDP ratio. In contrast, if trend growth were to fall to 2%, the country would only need to invest 4% of GDP. Global Investment Strategy View Matrix
2022 Second Quarter Strategy Outlook – The New Neutral
2022 Second Quarter Strategy Outlook – The New Neutral
Special Trade Recommendations Current MacroQuant Model Scores
2022 Second Quarter Strategy Outlook – The New Neutral
2022 Second Quarter Strategy Outlook – The New Neutral
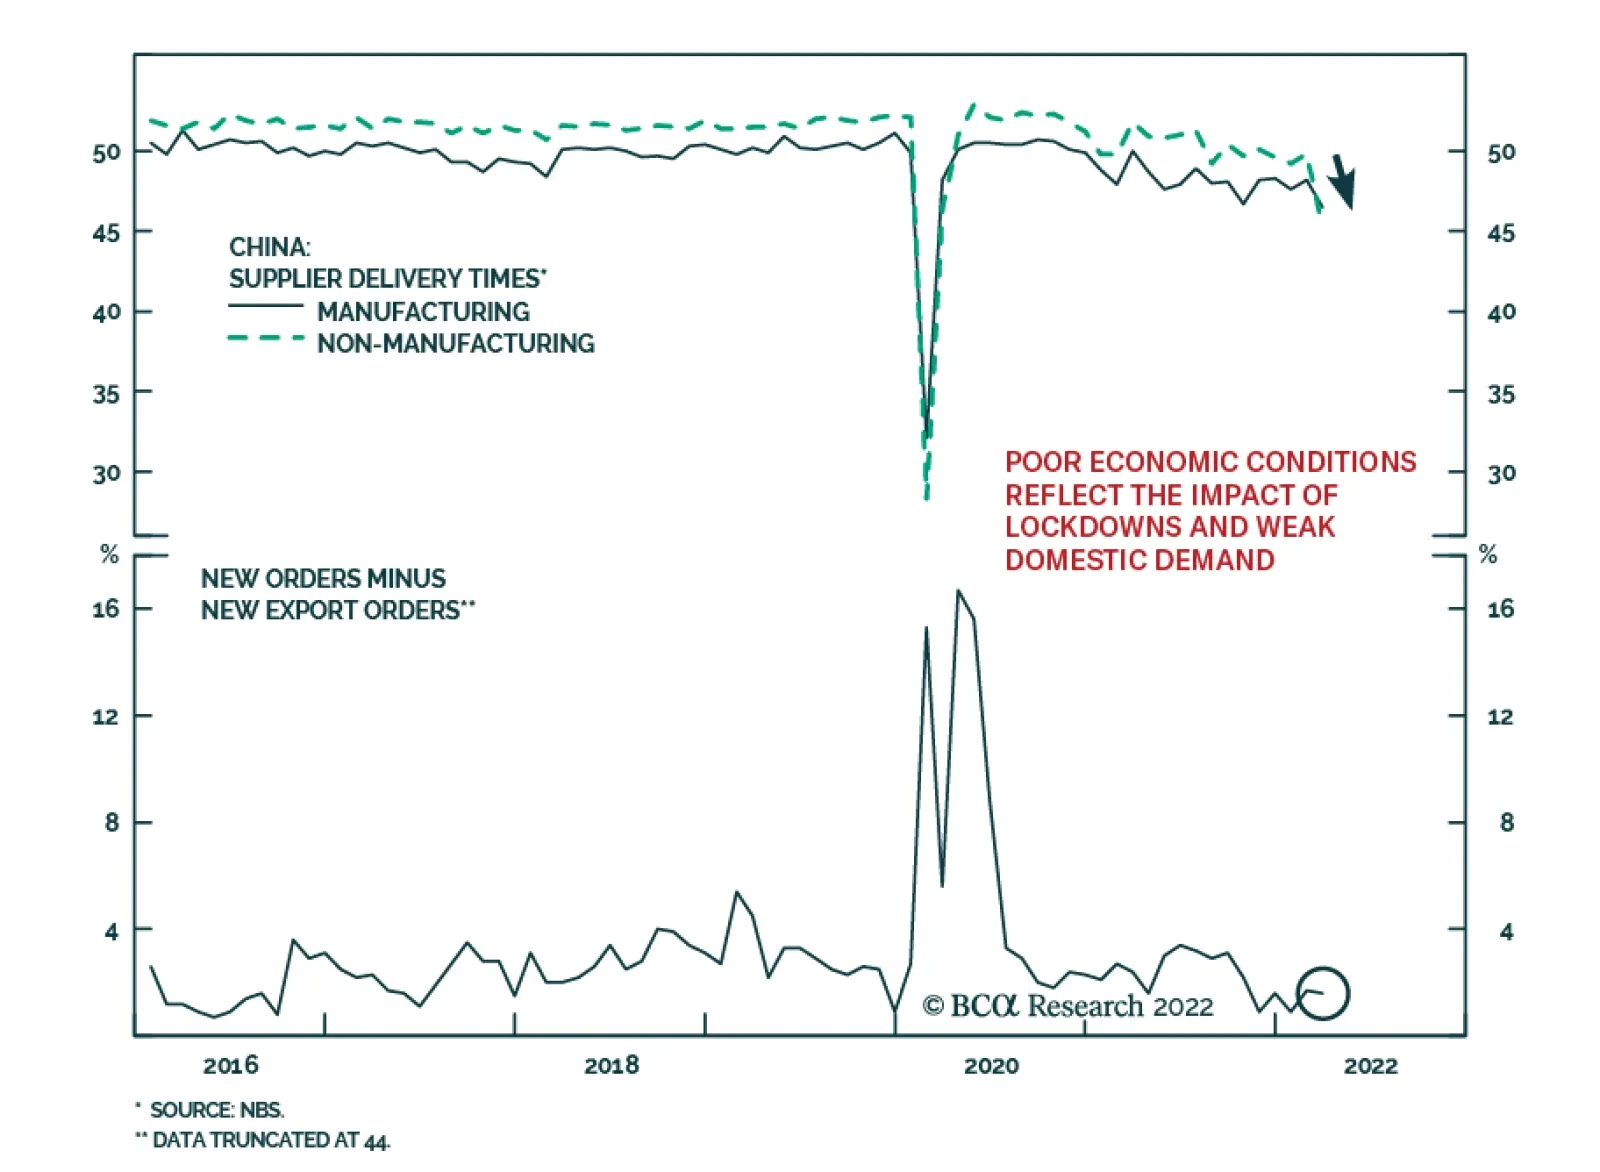
Data from the National Bureau of Statics indicates that Chinese economic activity deteriorated in March. The official composite PMI fell from 51.2 to 48.8 – below the 50-line separating expansion from contraction and the lowest reading since February 2020.…
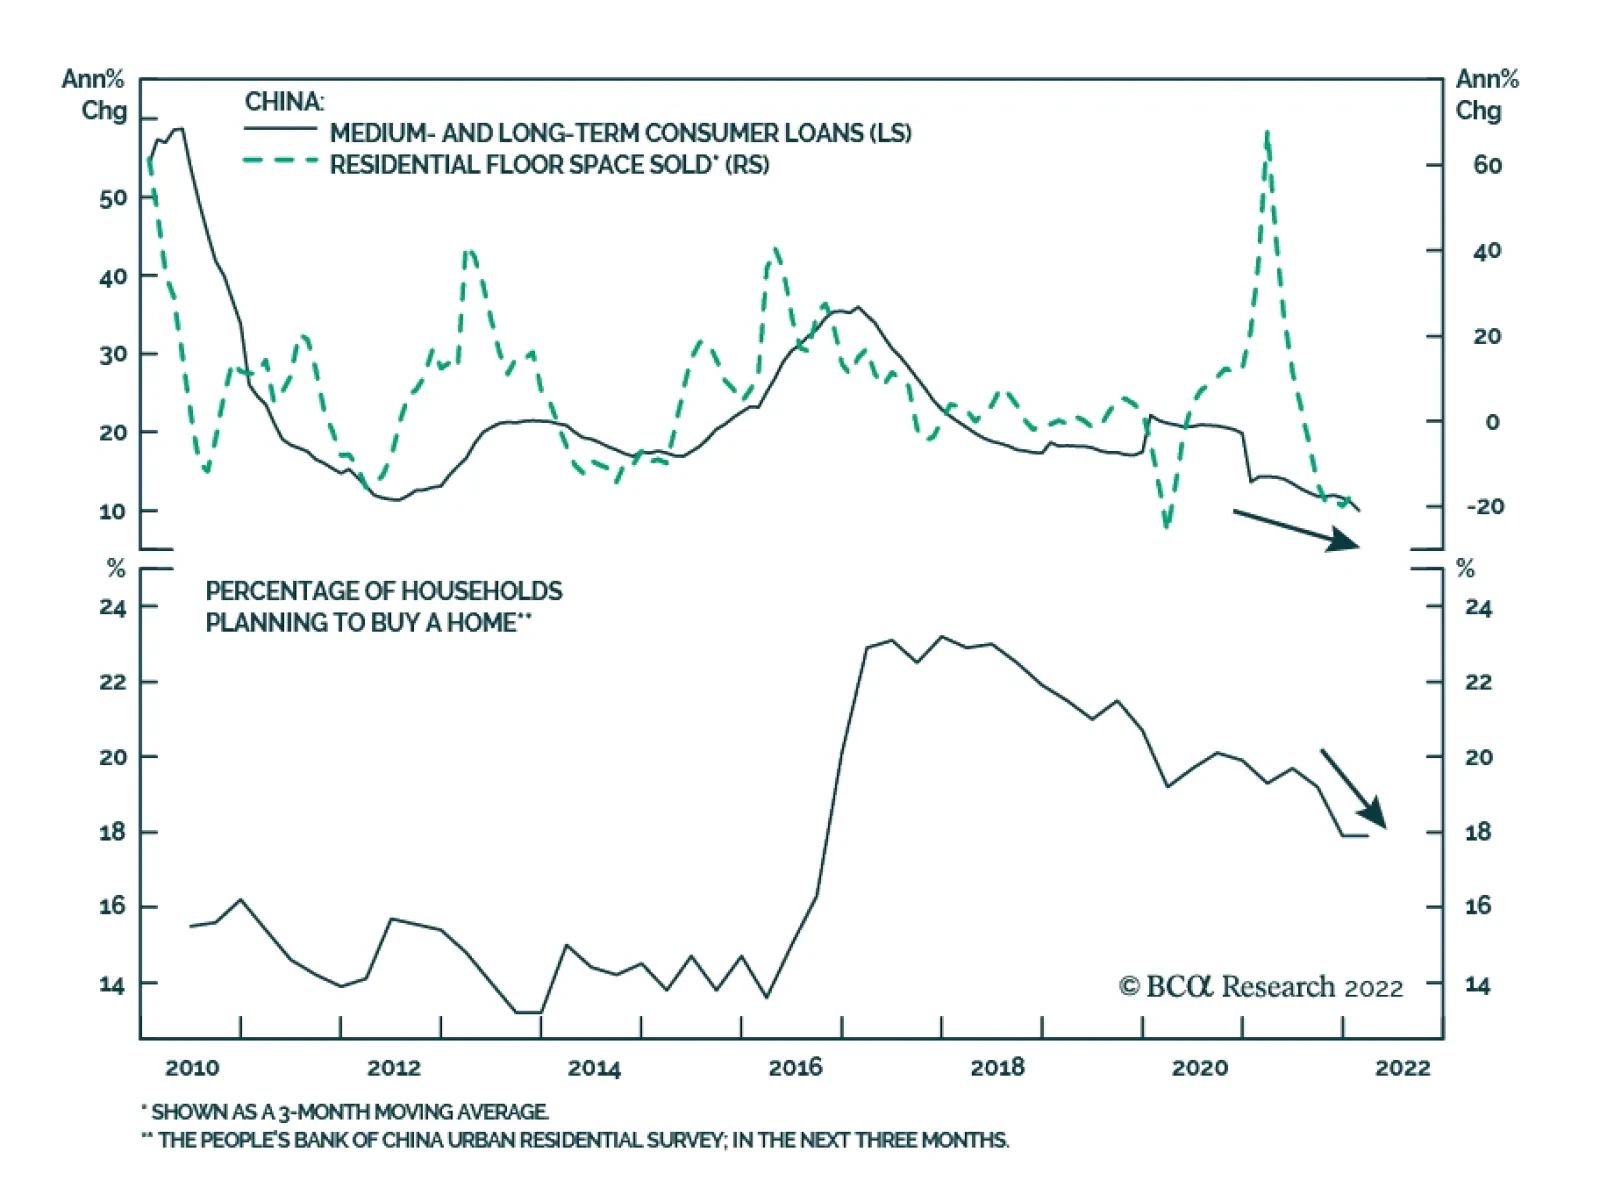
BCA Research’s China Investment Strategy service concludes that it is too early to turn bullish on Chinese equities. Beijing is stepping up its pro-growth stimulus, particularly on the fiscal front. However, unless there is a major reversal in the housing…
Executive Summary China’s Business Cycle Has Not Bottomed
China's Business Cycle Has Not Bottomed
China's Business Cycle Has Not Bottomed
Recent data showed a substantial improvement in the economy in the first two months of the year. However, the optimism is not well supported by other industry and high-frequency data. China’s exports were resilient, while infrastructure investment also rebounded sharply on the back of front-loaded fiscal stimulus. Nonetheless, domestic demand in China remains in the doldrums. Housing market indicators show a further deterioration in home sales and prices in January and February. Consumption in tourism during the Chinese New Year and service sector activities were also weaker compared with the same period last year. While we expect policymakers to roll out more measures to shore up domestic demand, China’s economy will likely have a choppy bottom in the first half of 2022. We maintain our neutral position on Chinese onshore stocks in a global portfolio. In absolute terms, we are cautious and are looking for a better price entry point in Q2. Bottom Line: Economic data in the first two months of the year sent mixed signals, which suggests that China’s economy has not reached a solid bottom. Feature Newly released economic data from January and February (i.e. industrial production, fixed-asset investment, retail sales and property investment) all generated sizable positive surprises. However, other industry and high-frequency data sent conflicting messages. The improvement in China’s total social financing (TSF) in the past few months has been due to local government (LG) bond issuance (Chart 1). Corporate credit showed little advancement, while household loans were extremely weak (Chart 2). In addition, further contracting home sales paint a bleak picture of housing demand. Soft readings in the service sector Purchasing Managers' Index (PMI) and core consumer price index (CPI) suggest that consumption remains sluggish. Chart 1The Credit Impulse Continued To Trend Down (Excluding LG Bond Issuance)
The Credit Impulse Continued To Trend Down (Excluding LG Bond Issuance)
The Credit Impulse Continued To Trend Down (Excluding LG Bond Issuance)
Chart 2No Improvement In Corporate Or Household Demand For Credit
No Improvement In Corporate Or Household Demand For Credit
No Improvement In Corporate Or Household Demand For Credit
Beijing is stepping up its pro-growth stimulus, particularly on the fiscal front. However, the country will unlikely undergo a strong recovery in its business cycle without a major reversal in the housing market and an improvement in demand from the private sector. Moreover, recent lockdowns to tame surging domestic COVID-19 cases amid China’s zero-tolerance pose major downside risks to the near-term economic outlook. Chinese equities sold off in response to lockdown news despite the release of better economic data earlier this month, highlighting investors’ weak sentiment. Chart 3China's Business Cycle Has Not Bottomed
China's Business Cycle Has Not Bottomed
China's Business Cycle Has Not Bottomed
We maintain our neutral view on China’s onshore stocks relative to their global peers, but we are cautious on Chinese equities in absolute terms. On a cyclical time horizon (6 to 12 months), there are increasing odds that Chinese policymakers will stimulate the economy more aggressively, particularly in the 2nd half of the year. However, it is too early to turn bullish on Chinese equities (Chart 3). The ongoing war in Ukraine and elevated oil prices, coupled with risks of further lockdowns in China and a prolonged downturn in domestic demand, present significant near-term risks to the performance of Chinese equities. Investors should closely watch for more reflationary efforts from Beijing and we believe a better entry point to upgrade Chinese stocks may emerge in Q2. Qingyun Xu, CFA Associate Editor qingyunx@bcaresearch.com Near-Term Outlook For The Housing Market Remains Bleak Real estate investment growth in January-February was surprisingly strong, according to data from China’s National Bureau of Statistics. However, headline growth in real estate investment deviates from the continued weaknesses in other housing market indicators (Chart 4). In addition, data on the production of some key construction materials showed little improvement (Chart 5). Chart 4Conflicting Signals From The January-February Housing Market Indicators
Conflicting Signals From The January-February Housing Market Indicators
Conflicting Signals From The January-February Housing Market Indicators
Chart 5Data On Building Materials Also Deviate From Strong Investment Growth In Real Estate
Data On Building Materials Also Deviate From Strong Investment Growth In Real Estate
Data On Building Materials Also Deviate From Strong Investment Growth In Real Estate
Demand for housing remains lackluster. February’s medium- to long-term household loan growth, which is mainly mortgage loans and is highly correlated with home sales, plunged to an all-time low (Chart 6). Meanwhile, the deep contraction in home sales growth continued in February, and sentiment among home buyers remains downbeat (Chart 6, bottom panel) Chart 6Demand For Housing Remains In The Doldrums
Demand For Housing Remains In The Doldrums
Demand For Housing Remains In The Doldrums
Chart 7Policymakers Are Trying To Avoid Further Inflating The Housing Price Bubble
Policymakers Are Trying To Avoid Further Inflating The Housing Price Bubble
Policymakers Are Trying To Avoid Further Inflating The Housing Price Bubble
Although authorities have reiterated that they want to stabilize the property market, the policy measures have been only fine-tuned. Regional governments have been allowed to initiate their own housing policies and some cities have eased processes for home purchases.1 However, given that maintaining stable home prices is an overarching goal and China’s leadership is trying to avoid further inflating the home price bubble, it is doubtful that the government will allow significant re-leveraging in the property market (Chart 7). Chart 8 shows that funds to real estate developers have slowed to the lowest level since 2010, which will further dampen housing construction. Chart 8Housing Construction Activities Will Weaken Further In 1H22
Housing Construction Activities Will Weaken Further In 1H22
Housing Construction Activities Will Weaken Further In 1H22
Chart 9The Latest Spike In Domestic COVID Cases Will Weigh On Home Sales
The Latest Spike In Domestic COVID Cases Will Weigh On Home Sales
The Latest Spike In Domestic COVID Cases Will Weigh On Home Sales
Moreover, high-frequency floor space sold data shows a broad-based decline in housing sales in tier-one, two and three cities through mid-March (Chart 9). The latest spike in China’s domestic COVID-19 cases and regional lockdowns will likely weigh on home sales in the short term. Property investment and construction will remain at risk without a decisive rebound in home sales. A Disrupted Recovery In Household Consumption Both retail and online sales of consumer goods held up better than expected in January and February (Chart 10). However, the subdued underlying data highlight that the strong reading in retail sales in the first two months of the year may be less than meets the eye. Chart 10Although Growth In Retail Sales Rebounded In January-February...
Although Growth In Retail Sales Rebounded In January-February...
Although Growth In Retail Sales Rebounded In January-February...
Chart 11...Service Sector Activities Still Struggle To Return To Pre-Pandemic Levels
...Service Sector Activities Still Struggle To Return To Pre-Pandemic Levels
...Service Sector Activities Still Struggle To Return To Pre-Pandemic Levels
Service sector and passenger activities are still well below their pre-pandemic levels, two years after the first COVID lockdowns in early 2020 (Chart 11). Consumption in tourism during the Chinese New Year holiday was weaker than last year. Households’ propensity to spend also showed few signs of rebounding (Chart 12 & 13). Chart 12Travel Consumption Was Weak During The Chinese New Year
Travel Consumption Was Weak During The Chinese New Year
Travel Consumption Was Weak During The Chinese New Year
Chart 13Households’ Propensity To Consume Continues To Trend Down
Households' Propensity To Consume Continues To Trend Down
Households' Propensity To Consume Continues To Trend Down
Furthermore, both core and service CPI weakened in February, reflecting lackluster demand from consumers (Chart 14). Labor market dynamics have also worsened and the unemployment rate, particularly among young workers, has risen rapidly since the beginning of the year (Chart 15). Chart 14Weak Core And Service CPIs In February Suggest Lackluster Household Demand
Weak Core And Service CPIs In February Suggest Lackluster Household Demand
Weak Core And Service CPIs In February Suggest Lackluster Household Demand
Chart 15Labor Market Situation Is Worsening
Labor Market Situation Is Worsening
Labor Market Situation Is Worsening
The ongoing fight against mounting new COVID cases in China will likely drag down service sector activities in the coming months (Chart 16A & 16B). Importantly, the new round of lockdowns and mobility restrictions are primarily in busier and more developed coastal metropolitans, such as Shenzhen and Shanghai. Therefore, the negative impact from social activity restrictions will be more substantive compared with previous lockdowns. Chart 16AEscalating New Cases In China Will Constrain Domestic Consumption
Escalating New Cases In China Will Constrain Domestic Consumption
Escalating New Cases In China Will Constrain Domestic Consumption
Chart 16BEscalating New Cases In China Will Constrain Domestic Consumption
Escalating New Cases In China Will Constrain Domestic Consumption
Escalating New Cases In China Will Constrain Domestic Consumption
Strong Rebound In Manufacturing Investment Growth In January-February Probably Not Sustainable A strong rebound in the growth of manufacturing investment helped to support overall fixed-asset investment in the first two months of the year (Chart 17). Robust external demand for China’s manufacturing goods has likely contributed to the pickup in manufacturing output and helped to sustain Chinese manufacturers’ near-maximum capacity (Chart 18). Chart 17Strong Pickup In Manufacturing Investment Growth
Strong Pickup In Manufacturing Investment Growth
Strong Pickup In Manufacturing Investment Growth
Chart 18Robust Exports Support Chinese Manufacturing Output And Capacity Utilization
Robust Exports Support Chinese Manufacturing Output And Capacity Utilization
Robust Exports Support Chinese Manufacturing Output And Capacity Utilization
While the volume of manufacturing output increased, prices that producers charge consumers have rolled over (Chart 19). Historically, prices have been more important in driving corporate profits than the volume of output. In addition, a strong RMB and sharply climbing shipping costs will also weigh on Chinese exporters’ profitability (Chart 20). Chart 19Manufacturing Output Picked Up While Prices Rolled Over
Manufacturing Output Picked Up While Prices Rolled Over
Manufacturing Output Picked Up While Prices Rolled Over
Chart 20Strong RMB And Rising Shipping Costs Will Reduce Chinese Exporters' Profitability
Strong RMB And Rising Shipping Costs Will Reduce Chinese Exporters' Profitability
Strong RMB And Rising Shipping Costs Will Reduce Chinese Exporters' Profitability
Chart 21Manufacturing Sector's Profit Margins Will Be Further Squeezed
Manufacturing Sector's Profit Margins Will Be Further Squeezed
Manufacturing Sector's Profit Margins Will Be Further Squeezed
The elevated prices of oil and global industrial metals will continue to disproportionally benefit upstream industries, which are mainly composed of commodity producers. Meanwhile, the manufacturing sector’s profit margins will be squeezed by rising input costs and sluggish final demand (Chart 21). Chinese manufacturers’ profit growth will likely weaken through 1H22 and the downtrend may be exacerbated by the ongoing struggle to contain COVID cases. The impact from recent lockdowns in the northern city of Jilin (an auto production center), Shenzhen (a high-tech manufacturing production and export hub), and Shanghai (a city with major ports and a key logistics provider) will disrupt China’s manufacturing production and curb investment in the near term. Infrastructure Sector Will Remain A Bright Spot Through 1H22 Related Report China Investment StrategyAiming High, Lying Low Infrastructure investment staged a strong recovery in January-February on the back of front-loaded fiscal stimulus (Chart 22). LG bond issuance started to accelerate last November and will boost both traditional and new-economy infrastructure spending at least through 1H22. Our calculations suggest that fiscal thrust will rise to more than 2% of GDP this year, a sharp reversal from last year’s negative impulse of 2% (Chart 23). Chart 22Fiscal Stimulus Is At Work
Fiscal Stimulus Is At Work
Fiscal Stimulus Is At Work
Chart 23Fiscal Thrust In 2022 Could Reach More Than 2% Of GDP
Fiscal Thrust In 2022 Could Reach More Than 2% Of GDP
Fiscal Thrust In 2022 Could Reach More Than 2% Of GDP
Chart 24Subdued Shadow Bank Activities Will Limit The Magnitude Of Rebound In Infrastructure Investment
Subdued Shadow Bank Activities Will Limit The Magnitude Of Rebound In Infrastructure Investment
Subdued Shadow Bank Activities Will Limit The Magnitude Of Rebound In Infrastructure Investment
However, shadow bank activity, which historically had a tight correlation with infrastructure investment, remains downbeat (Chart 24). February’s reading of shadow bank credit was extremely weak, highlighting that local governments still face constraints in off-balance sheet leveraging through local government financing vehicles (LGFVs). The trend in shadow bank loans bears close attention in the coming months because it will signal whether the central government will allow more backdoor financing to help local governments fund their infrastructure projects. A continued soft reading in shadow bank activities will likely limit the upside in infrastructure investment growth. Table 1China Macro Data Summary
A Choppy Bottom
A Choppy Bottom
Table 2China Financial Market Performance Summary
A Choppy Bottom
A Choppy Bottom
Footnotes 1 Guangzhou lowered its down-payment ratio from 30% to 20%, along with a 20bp cut in mortgage rates. Zhengzhou marginally relaxed home purchase restrictions by allowing families who bring elderly relatives to live in the city to buy one extra home and also lifted the “definition of second home ownership by physical unit & mortgage history”. Strategic Themes Cyclical Recommendations
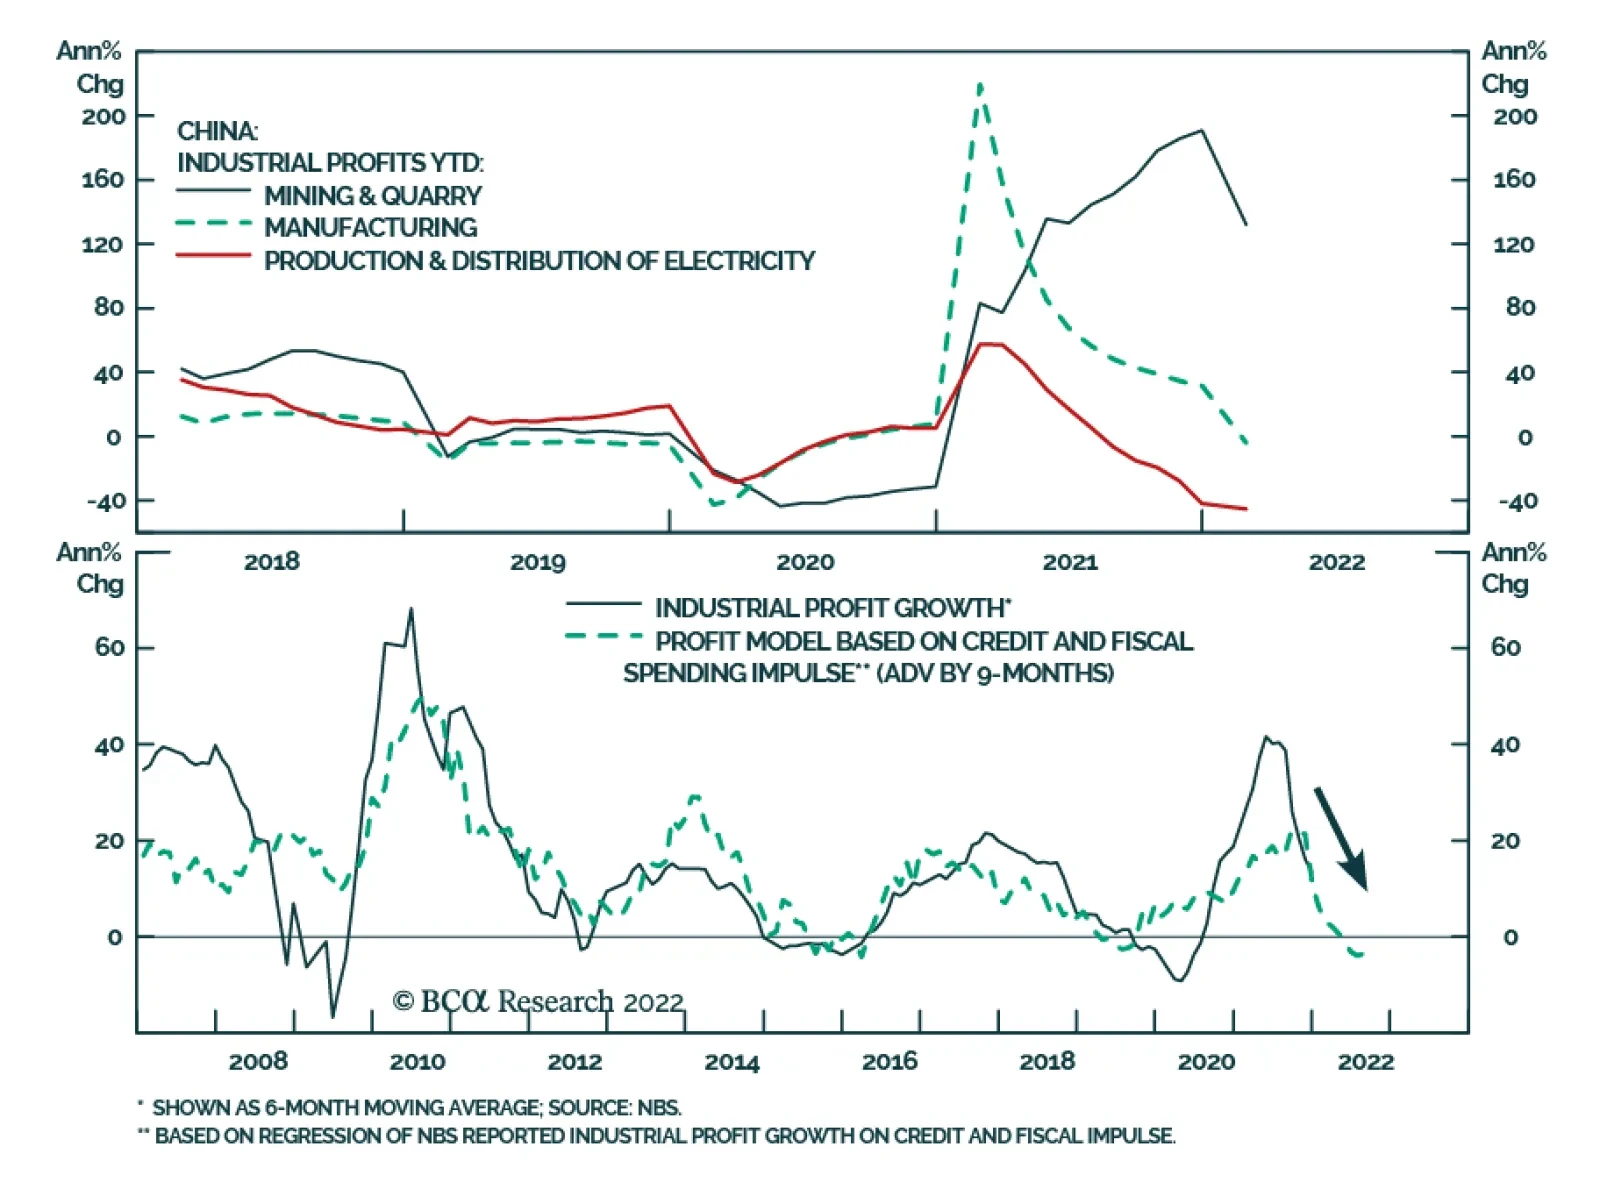
Chinese industrial profits grew 5.0% y/y in the first two months of this year – marking a slight acceleration from December’s 4.2% y/y increase. Nevertheless, the profit expansion is significantly below the average 13.4% y/y rate in the last six months of…