China

Listen to a short summary of this report. Executive Summary Small Caps Are Looking Attractive Relative To Their Large Cap Peers
Small Caps Are Looking Attractive Relative To Their Large Cap Peers
Small Caps Are Looking Attractive Relative To Their Large Cap Peers
Adverse supply shocks have pushed down global growth this year, while pushing up inflation. With the war raging in Ukraine and China trying to contain a major Covid outbreak, these supply shocks are likely to persist for the next few months. Things should improve in the second half of the year. Inflation will come down rapidly, probably even more than what markets are discounting. Global growth will reaccelerate as pandemic headwinds abate. The return of Goldilocks will allow the Fed and other central banks to temper their hawkish rhetoric, helping to support equity prices while restraining bond yields. Unfortunately, this benign environment will sow the seeds of its own demise. Falling inflation during the remainder of the year will lift real incomes, leading to increased consumer spending. Inflation will pick up towards the end of 2023, forcing central banks to turn hawkish again. Trade Inception Level Initiation Date Stop Loss Long iShares Core S&P Small Cap ETF (IJR) / SPDR S&P 500 ETF (SPY) 100 Apr 21/2022 -5% Trade Recommendation: Go long US small caps vs. large caps via the iShares Core S&P Small-Cap ETF (IJR) and the SPDR S&P 500 ETF (SPY). Bottom Line: Global equities are heading towards a “last hurrah” starting in the second half of this year. Stay overweight stocks on a 12-month horizon. Push or Pull? Economists like to distinguish between “demand-pull” and “cost-push” inflation. The former occurs in response to positive demand shocks while the latter reflects negative supply shocks. In order to tell one from the other, it is useful to look at real wages. When real wages are rising briskly, households tend to spend more, leading to demand-pull inflation. In contrast, when wages fail to keep up with rising prices, it is a good bet that we have cost-push inflation on our hands. Chart 1 shows that real wages have been falling across the major economies over the past year. The decline in real wages has coincided with a steep drop in consumer confidence (Chart 2). This points to cost-push forces as the main culprits behind today’s high inflation rates. Chart 1Real Wages Are Declining
Real Wages Are Declining
Real Wages Are Declining
Chart 2Consumer Confidence Has Soured
Consumer Confidence Has Soured
Consumer Confidence Has Soured
A close look at the breakdown of recent inflation figures supports this conclusion. The US headline CPI rose by 8.5% year-over-year in March. The bulk of the inflation occurred in supply-constrained categories such as food, energy, and vehicles (Chart 3). Chart 3The Acceleration In Inflation Has Been Driven By Pandemic And War-Impacted Categories
Here Comes Goldilocks
Here Comes Goldilocks
The Toilet Paper Economy When the pandemic began, shoppers rushed out to buy essential household supplies including, most famously, toilet paper. Chart 4In A Break From The Past, Goods Prices Soared During The Pandemic
In A Break From The Past, Goods Prices Soared During The Pandemic
In A Break From The Past, Goods Prices Soared During The Pandemic
The toilet paper used in offices is somewhat different than the sort used at home. So, to some extent, work-from-home (and do other stuff-at-home) arrangements did boost the demand for consumer-grade toilet paper. However, a much more important factor was household psychology. People scrambled to buy toilet paper because others were doing the same. As often occurs in prisoner-dilemma games, society moved from one Nash equilibrium – where everyone was content with the amount of toilet paper they had – to another equilibrium where they wanted to hold much more paper than they previously did. What has gone largely unnoticed is that the toilet paper fiasco was replicated across much of the global supply chain. Worried that they would not have enough intermediate goods on hand to maintain operations, firms began to hoard inputs. Retailers, anxious at the prospect of barren shelves, put in bigger purchase orders than they normally would have. All this happened at a time when demand was shifting from services to goods, and the pandemic was disrupting normal goods production. No wonder the prices of goods – especially durable goods — jumped (Chart 4). Peak Inflation? The war in Ukraine could continue to generate supply disruptions over the coming months. The Covid outbreak in China could also play havoc with the global supply chain. While the number of Chinese Covid cases has dipped in recent days, Chart 5 highlights that 27 out of 31 mainland Chinese provinces are still reporting new cases, up from 14 provinces in the beginning of February. The number of ships stuck outside of Shanghai has soared (Chart 6). Chart 527 Out Of 31 Chinese Provinces Are Reporting New Cases, Up From 14 Provinces In The Beginning Of February
Here Comes Goldilocks
Here Comes Goldilocks
Chart 6The Clogged-Up Port Of Shanghai
Here Comes Goldilocks
Here Comes Goldilocks
Chart 7Inflation Will Decelerate This Year Thanks To Base Effects
Inflation Will Decelerate This Year Thanks To Base Effects
Inflation Will Decelerate This Year Thanks To Base Effects
Nevertheless, the peak in inflation has probably been reached in the US. For one thing, base effects will push down year-over-year inflation (Chart 7). Monthly core CPI growth rates were 0.86% in April, 0.75% in May, and 0.80% in June of 2021. These exceptionally high prints will fall out of the 12-month average during the next few months. More importantly, goods inflation will abate as spending shifts back toward services. Chart 8 shows that spending on goods remains well above the pre-pandemic trend in the US, while spending on services remains well below. Excluding autos, US retail inventories are about 5% above their pre-pandemic trend (Chart 9). Core goods prices fell in March for the first time since February 2021. Fewer pandemic-related disruptions, and hopefully a stabilization in the situation in Ukraine, could set the stage for sharply lower inflation and a revival in global growth in the second half of this year. How long will this Goldilocks environment last? Our guess is that it will endure until the second half of next year, but probably not much beyond then. As inflation comes down over the coming months, real income growth will rise. What began as cost-push inflation will morph into demand-pull inflation by the end of 2023. The Fed will need to resume hiking at that point, potentially bringing rates to over 4% in 2024. Chart 8Spending On Services Remains Well Below The Pre-Pandemic Trend, While Spending On Goods Is Above It
Spending On Services Remains Well Below The Pre-Pandemic Trend, While Spending On Goods Is Above It
Spending On Services Remains Well Below The Pre-Pandemic Trend, While Spending On Goods Is Above It
Chart 9Shelves Are Well Stocked In The US
Shelves Are Well Stocked In The US
Shelves Are Well Stocked In The US
Investment Implications Wayne Gretzky famously said that he always tries to skate to where the puck is going to be, not where it has been. Macro investors should follow the same strategy: Ask what the global economy will look like in six months and invest accordingly. The past few months have been tough for the global economy and financial markets. Last week, bullish sentiment fell to the lowest level in 30 years in the American Association of Individual Investors poll (Chart 10). Global growth optimism dropped in April to a record low in the BofA Merrill Lynch Fund Manager Survey. Chart 10AAII Survey: Equity Bulls Are In Short Supply
AAII Survey: Equity Bulls Are In Short Supply
AAII Survey: Equity Bulls Are In Short Supply
Chart 11The Equity Risk Premium Remains Elevated
The Equity Risk Premium Remains Elevated
The Equity Risk Premium Remains Elevated
Yet, a Goldilocks environment of falling inflation and supply-side led growth awaits in the second half of the year. Even if this environment does not last beyond the end of 2023, it could provide a “last hurrah” for global equities. Despite the spike in bond yields, the earnings yield on stocks still exceeds the real bond yield by 5.4 percentage points in the US, and by 7.8 points outside the US (Chart 11). TINA’s siren song may have faded but it is far from silent. Global equities have about 10%-to-15% upside from current levels over a 12-month horizon. We recommend that investors increase allocations to non-US stock markets, value stocks, and small caps over the coming months (see trade recommendation below). Consistent with our view that the neutral rate of interest is higher than widely believed in the US and elsewhere, we expect the 10-year Treasury yield to eventually rise to around 4% in 2024. However, with US inflation likely to trend lower in the second half of this year, we do not expect much upside for yields over a 12-month horizon. If anything, the fact that bond sentiment in the latest BofA Merrill Lynch survey was the most bearish in 20 years suggests that the near-term risk to yields is to the downside. Trade Idea: Go Long US Small Caps Versus Large Caps Small caps have struggled of late. Over the past 12 months, the S&P 600 small cap index has declined 3%, even as the S&P has managed to claw out a 5% gain. At this point, small caps are starting to look relatively cheap (Chart 12). The S&P 600 is trading at 14-times forward earnings compared to 19-times for the S&P 500. Notably, analysts expect small cap earnings to rise more over the next 12 months, as well as over the long term, than for large caps. Chart 12Small Caps Are Looking Attractive Relative To Their Large Cap Peers
Small Caps Are Looking Attractive Relative To Their Large Cap Peers
Small Caps Are Looking Attractive Relative To Their Large Cap Peers
Chart 13Small Caps Tend To Outperform When Growth Is Picking Up And The Dollar Is Depreciating
Small Caps Tend To Outperform When Growth Is Picking Up And The Dollar Is Depreciating
Small Caps Tend To Outperform When Growth Is Picking Up And The Dollar Is Depreciating
Small caps tend to perform best in settings where growth is accelerating and the US dollar is weakening (Chart 13). Economic growth should benefit from a supply-side boost later this year as pandemic headwinds fade and more low-skilled workers rejoin the labor market. With inflation set to decline, the need for the Fed to generate hawkish surprises will temporarily subside, putting downward pressure on the dollar. Investors should consider going long the S&P 600 via the iShares Core S&P Small-Cap ETF (IJR) versus the S&P 500 via the SPDR S&P 500 ETF (SPY). Peter Berezin Chief Global Strategist peterb@bcaresearch.com Follow me on LinkedIn Twitter Global Investment Strategy View Matrix
Here Comes Goldilocks
Here Comes Goldilocks
Special Trade Recommendations Current MacroQuant Model Scores
Here Comes Goldilocks
Here Comes Goldilocks
Executive Summary China’s Daily New COVID Cases And City Lockdowns, 2020 To Present
China's Daily New COVID Cases And City Lockdowns, 2020 To Present
China's Daily New COVID Cases And City Lockdowns, 2020 To Present
The ongoing wave of local Omicron infections and city lockdowns pose the largest macro risk in China post Q1 2020. The current lockdowns in major cities - including Shanghai - may shave one percentage point from China’s 2022 GDP growth. Restrictions on activity and travel in Shanghai and surrounding areas in the Yangtze River Delta have led to severe supply-chain disruptions, created by both port and highway transportation congestion and manufacturing plant shutdowns. Unlike in 2H20, chances are lower for a quick and strong post-lockdown recovery in China’s economy and stock prices because the nation’s policy easing will be less aggressive and is less effective than two years ago. The scale of China’s monetary easing will be smaller than in H1 2020 given the Fed is rising interest rates. The country’s fiscal balance sheet is also in worse shape than in 2020, particularly at the local level. Bottom Line: The wave of lockdowns in China’s major cities will pose substantial risks to China’s economy this year. The post-lockdown recovery will likely be more muted than in 2H20 because there is limited room for the country to stimulate its economy and policy easing measures will likely be less effective than two years ago. Chart 1China's Daily New COVID Cases And City Lockdowns, 2020 To Present
China's Daily New COVID Cases And City Lockdowns, 2020 To Present
China's Daily New COVID Cases And City Lockdowns, 2020 To Present
The ongoing lockdowns linked to the spike in Omicron and China’s zero tolerance towards COVID are exacting a heavy toll on China’s economy. While the situation is fluid and official data is lagging, China’s economy faces the largest macro risk since early 2020. In the past four months, China has imposed more lockdowns, with full and partial mobility restrictions, than in the past two years combined (Chart 1). In particular, this round of citywide shutdowns occurred in some of China’s largest and most prosperous cities, such as Shanghai and Shenzhen, and several manufacturing hubs including Jilin province and cities in the Yangtze River Delta region. Furthermore, the post-lockdown recovery this year will likely be more muted than two years ago. Beijing has less room to ease policy and stimulate the economy than in early 2020. In addition, policy easing measures will be less effective in boosting domestic demand, given that private sector sentiment was already downbeat prior to the lockdowns and the country’s zero-COVID policy may lead to more stringent confinement measures in the rest of the year. Serious Economic Implications China’s aggregate economy is suffering significant damage from the current round of city- and province-wide lockdowns in some of China’s most populous and prosperous regions. Chart 2The Economic Impact From Hubei Lockdown In Q1 2020
The Cost Of China’s Zero-COVID Strategy
The Cost Of China’s Zero-COVID Strategy
Economic data following the shutdown of Hubei province in early 2020 can serve as a roadmap to illustrate what to expect from lockdowns in Shanghai, which accounts for 4% of China’s GDP and is the same size as Hubei. During a 60-day lockdown in Q1 2020, Hubei’s retail sales growth nose-dived by 43 percentage points (ppt) and fixed-asset investment growth tumbled by 83ppt in Q1 2020 compared with the previous three months (Chart 2). The aggregate economy in Hubei shrank by 40% in Q1 2020 from a year ago and the decline likely reduced Chinese GDP growth by 1.5% in that quarter alone (Chart 3). The lockdown also dragged Hubei’s government revenues, tourism income and corporate profits into a deep contraction for 2020 (Chart 4). Chart 3The Economic Impact From Hubei Lockdown In Q1 2020
The Cost Of China’s Zero-COVID Strategy
The Cost Of China’s Zero-COVID Strategy
Chart 4The Economic Impact From Hubei Lockdown In Q1 2020
The Cost Of China’s Zero-COVID Strategy
The Cost Of China’s Zero-COVID Strategy
A recent study estimating the economic impact of lockdowns by analyzing the flow of intercity trucking found that freight traffic would plummet by 54% under a full lockdown for a month, versus a 20% drop under a partial lockdown. In addition, the ripple effect of a lockdown would be felt by surrounding cities. According to the article, if the four most important economic centers of the country - Beijing, Shanghai, Guangzhou and Shenzhen - are shut down for one month at the same time, then their real income in that month would decrease by a whopping 61%. Meanwhile, the national real income in the same period would shrink by 8.6%, which translates into a 1ppt decline in China’s annual GDP growth. The scenario that China’s four major cities would be locked down was inconceivable before the onset of Omicron. However, as of April 15, it is estimated that local cities that have experienced full or partial lockdowns account for about 40% of China’s GDP, affecting more than 250 million residents. As such, the aggregate economic losses from the current round of lockdowns could reach 1ppt of China’s 2022 GDP growth. Bottom Line: The economic impact from the current lockdowns has the potential to reduce China’s GDP growth by 1ppt in 2022. Supply Chain Disruptions Shanghai’s lockdown has had economic repercussions on the Yangtze River Delta region, an important manufacturing hub and key supplier in the automobile and electronic equipment industries. Cross-regional travel restrictions have led to supply-chain disruptions through transportation blockades and manufacturing plant shutdowns. These obstacles include: Table 1Top Ten Ports In China
The Cost Of China’s Zero-COVID Strategy
The Cost Of China’s Zero-COVID Strategy
Increased port congestion. The Ports of Shanghai and its nearby Ningbo handle nearly 30% of China’s total ocean shipping volume and are key barometers of China’s foreign trade and logistics chain (Table 1). Data from VesselsValue shows an almost fivefold increase in the number of ships waiting to load or discharge at Shanghai in the second half of March (Chart 5). Port congestion worsened in April after the Shanghai lockdown began on March 28. Chart 5Ships Waiting To Load Or Discharge At Shanghai Port
The Cost Of China’s Zero-COVID Strategy
The Cost Of China’s Zero-COVID Strategy
Chart 6Chinese Suppliers' Delivery Times Have Lengthened
Chinese Suppliers' Delivery Times Have Lengthened
Chinese Suppliers' Delivery Times Have Lengthened
Road transport blockades. Road traffic in the Yangtze River Delta has been restricted, causing significant delays in suppliers’ delivery times (Chart 6). By April 7, nationwide vehicle logistics freight flow fell by 32% from a year ago and plunged more than 80% in the Shanghai area. Highway traffic mobility tracked by Gaode dipped to the same level as in early 2020. Production suspensions. A significant number of businesses from automakers Tesla and Volkswagen to notebook manufacturer Quanta Computer Inc. reportedly suspended operations at their Shanghai plants to comply with government restrictions for virus control. The city, together with Jilin and Guangdong provinces, account for more than 30% of China’s auto production. Even if employees at auto and chip makers in Shanghai can return to production plants and work through a “closed-loop” system whereby they live on-site and test regularly, a more serious challenge would be how manufacturers can secure trucks to get materials and products delivered on time.1 Supply-chain disruptions are starting to impact China’s trade. The country’s import growth in nominal value in March dropped sharply to a 0.1% contraction (on a year-on-year basis) (Chart 7). Even though China’s exports in March expanded by 14.7% from a year ago, exports are below that of its Asian manufacturing neighbors, such as South Korea and Vietnam (Chart 8). Chart 7Chinese Import Growth Fell Into Contraction In March
Chinese Import Growth Fell Into Contraction In March
Chinese Import Growth Fell Into Contraction In March
Chart 8China's Export Growth Has Dropped Below That Of Vietnam And South Korea
China's Export Growth Has Dropped Below That Of Vietnam And South Korea
China's Export Growth Has Dropped Below That Of Vietnam And South Korea
Bottom Line: The Shanghai lockdown is having spillover effects on the Yangzte River Delta region through supply-chain disruptions. Strong Post-Lockdown Rebound? Chart 9China Will Need A Stimulus That Is Comparable To 2020
China Will Need A Stimulus That Is Comparable To 2020
China Will Need A Stimulus That Is Comparable To 2020
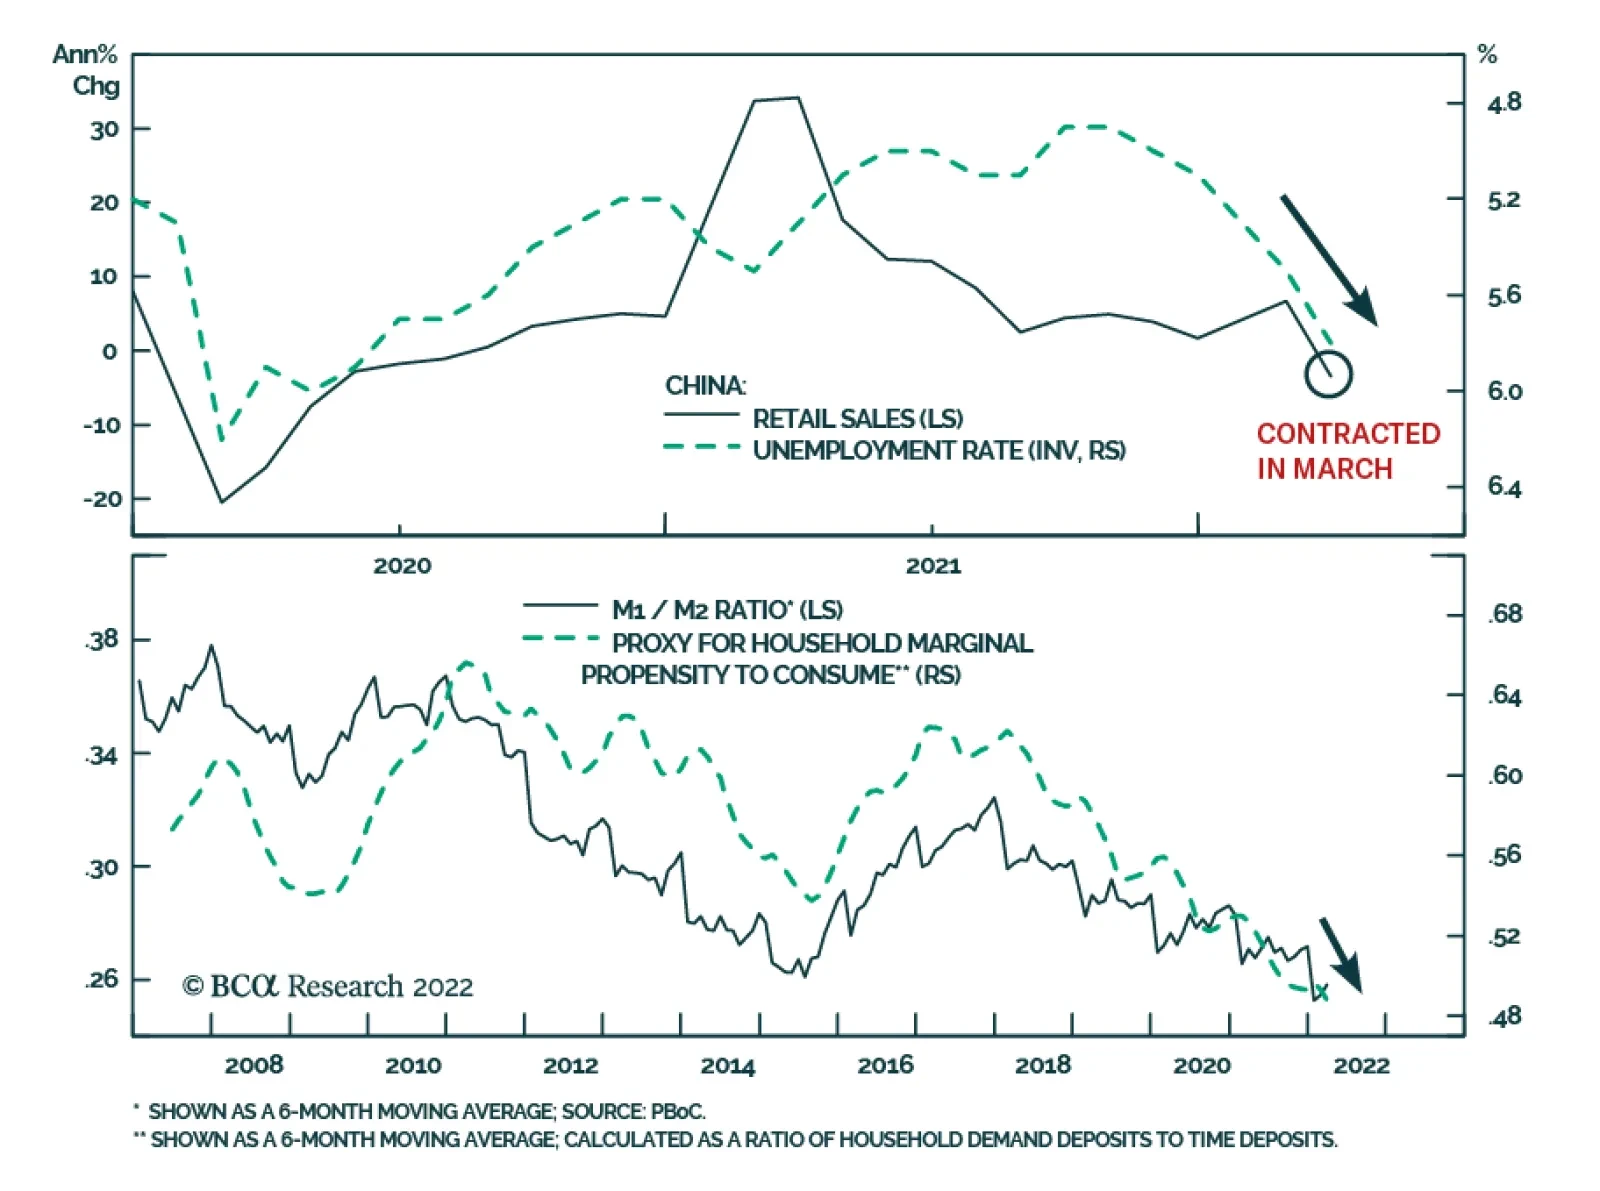
China’s economic growth and stock prices will unlikely repeat the quick and strong recovery registered following the early 2020 lockdown. Beijing has stepped up policy supports, but the challenges from both domestic conditions and the external environment are greater than in 2020. Thus, the country’s stimulus (measured by credit growth including local government bond issuance) will need to at least be similar to that of two years ago to shore up the economy (Chart 9). We are skeptical about both the magnitude and effectiveness of the stimulus in 2022, despite policymakers’ mounting efforts to support the economy. Therefore, we maintain a cautious view on Chinese risk assets (in both onshore and offshore markets). Our view is based on the following: There may be more frequent shutdowns of business activity as China continues upholding its zero-COVID approach. Even as we go to press, a few cities that recently recovered from COVID outbreaks have failed to resume their business and social activities. A flareup of COVID cases in the low double digits has dragged cities back to either mass COVID testing or partial city lockdowns. China’s COVID-containment measures escalated when the country’s business activity was already weak which was vastly different from prior to Q1 2020 when the economy was improving (Chart 10). Sentiment among the corporate and household sectors has been beaten down following two years of struggling with COVID, and the sectors’ propensities to invest or spend have been further dampened from last year’s harsh regulatory crackdowns (Chart 11). Chart 10Business Cycle Was On A Downtrend When Omicron Hit...
Business Cycle Was On A Downtrend When Omicron Hit...
Business Cycle Was On A Downtrend When Omicron Hit...
Chart 11...Sentiment Among Private Sector Has Been Downbeat
...Sentiment Among Private Sector Has Been Downbeat
...Sentiment Among Private Sector Has Been Downbeat
Input costs are much higher now than two years ago, while demand is weaker (Chart 12). Global energy and commodity prices will remain elevated this year, while external demand for Chinese manufactured goods will dwindle (Chart 13). China’s exports as a share of the global total peaked in July last year; a strong RMB and frequent supply-chain disruptions will likely reduce competitiveness of Chinese exports. Chart 12Elevated Input Costs, Subdued Domestic Demand
Elevated Input Costs, Subdued Domestic Demand
Elevated Input Costs, Subdued Domestic Demand
Chart 13Demand For Chinese Export Goods Will Likely Dwindle This Year
Demand For Chinese Export Goods Will Likely Dwindle This Year
Demand For Chinese Export Goods Will Likely Dwindle This Year
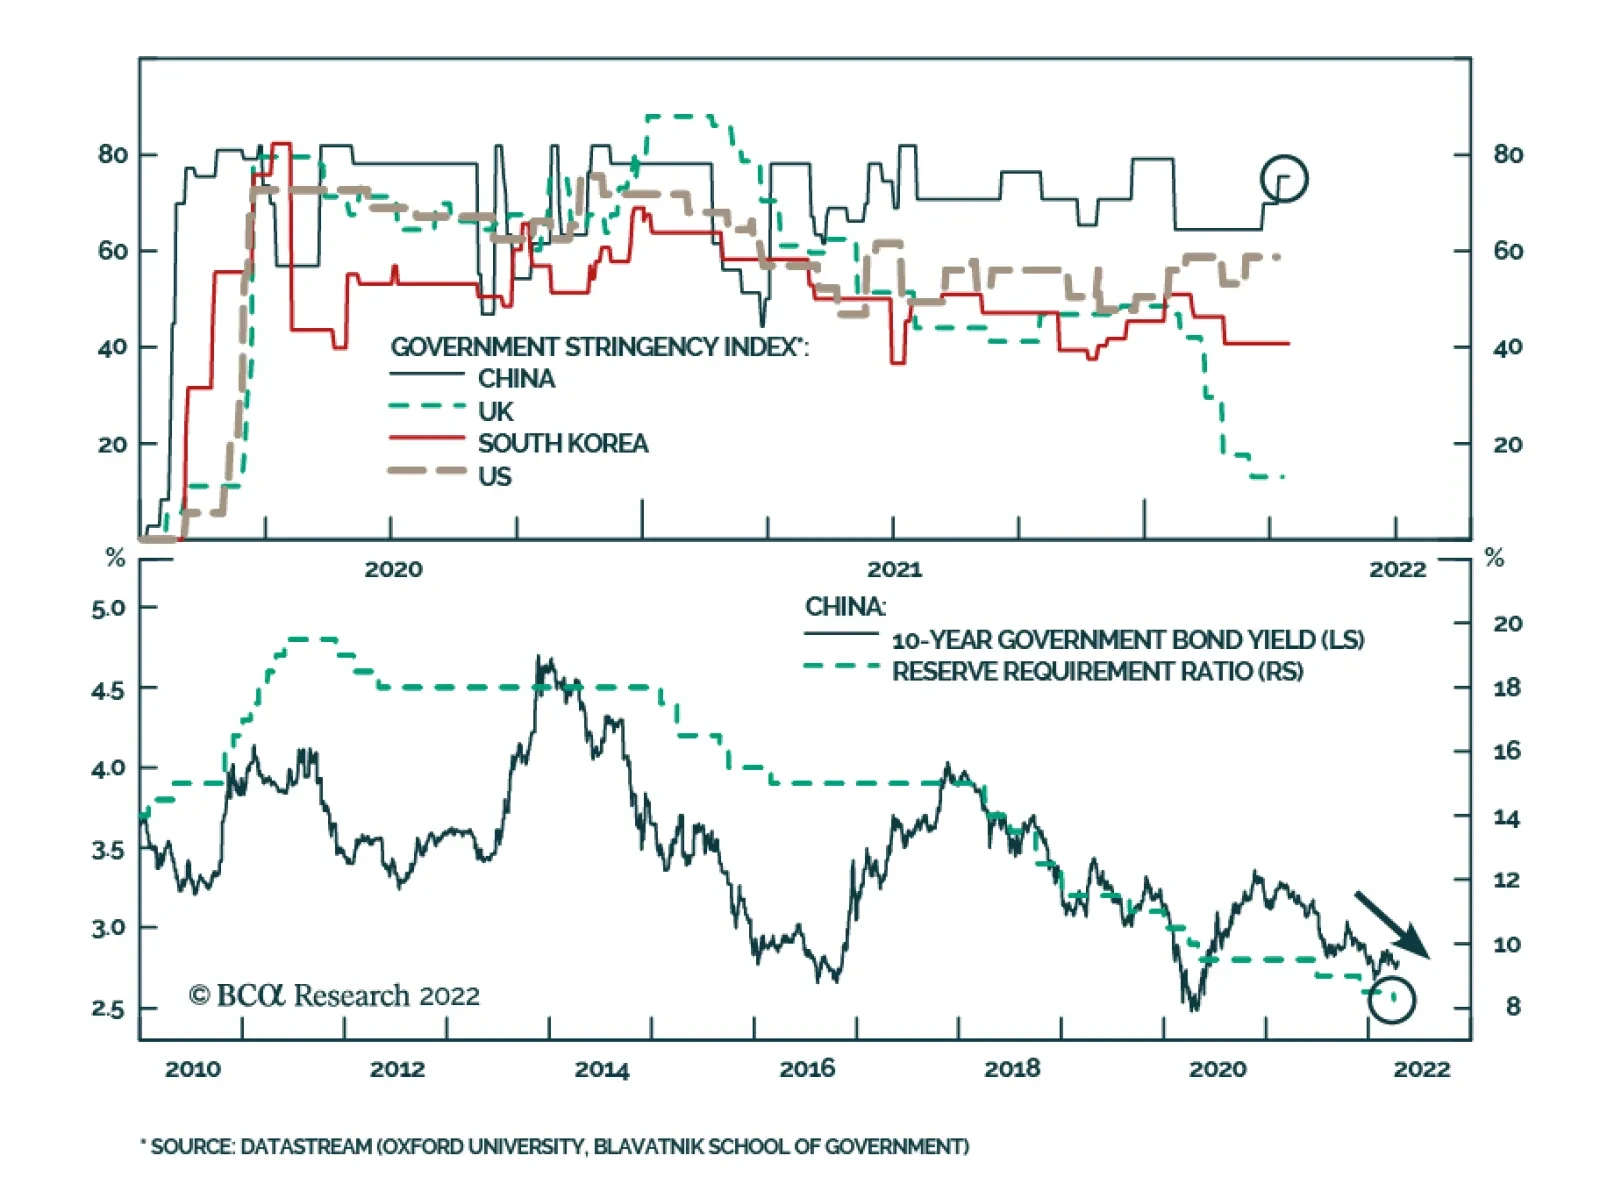
Granted the Fed’s tightening, unless China is willing to tolerate meaningful currency depreciation, the PBoC has limited room to cut interest rates. The US Federal Reserve is expected to raise interest rates by 270bps over the coming 12 months, which will further tighten US dollar liquidity conditions and may exacerbate capital flows out of emerging economies. China’s 10-year government bond yield in nominal terms dropped below that of the US for the first time in a decade, prompting global investors to offload Chinese bonds at a record pace (Chart 14). The PBoC refrained from a policy rate cut last week. The move underwhelmed investors and was a sign that the central bank may be cautious in adopting a monetary policy stance that further diverges from the Fed. Chart 14A Record Bond Market Outflow In Q1 This Year
A Record Bond Market Outflow In Q1 This Year
A Record Bond Market Outflow In Q1 This Year
Chart 15Growth In Gov Revenue From Land Sales In Deep Contraction
Growth In Gov Revenue From Land Sales In Deep Contraction
Growth In Gov Revenue From Land Sales In Deep Contraction
The room for further fiscal expansion is also more limited than two years ago as local governments are more constrained by funding. An expansionary fiscal policy in the past two years has pushed local governments’ debt ratios2 up by more than 20 percentage points to above the international standard of 100%, while the property market slump has led to a deep contraction in local government revenues from land sales (Chart 15). Bottom Line: Business activity will likely rebound when restrictions are eventually lifted, and the existing and/or forthcoming stimulus will work their way into the economy. However, the above mentioned hurdles suggest that China has limited room to further loosen its monetary and fiscal policies compared with two years ago, and the effectiveness of policy easing on the economy will be more muted. Jing Sima China Strategist jings@bcaresearch.com Footnotes 1 Recently the consumer and auto division head of Huawei Technologies warned that “If Shanghai cannot resume production by May, all of the tech and industrial players that have supply chains in the area will come to a complete halt, especially the automotive industry.” "China’s Auto Industry May Grind to a Halt Amid Shanghai Lockdown", Caixin Global 2 Measured by local governments’ total debt including general and special-purpose bonds, divided by their overall fiscal balance. Strategic Themes Cyclical Recommendations
Chinese data releases were mixed on Monday. GDP growth accelerated from 4.0% y/y to 4.8% y/y in Q1, beating expectations of 4.2% y/y. Fixed assets investment growth slowed to 9.3% y/y in the first three months of the year from 12.2% y/y in January and…
Chinese policymakers are facing a dilemma. COVID-19 cases are surging and restrictions amid the zero-tolerance policy towards the virus is weighing down on economic activity (see The Numbers). To boost the economy Beijing needs to either stimulate economic…
Executive Summary Macron Still Favored, But Le Pen Cannot Be Ruled Out
Le Pen And Other Hurdles (GeoRisk Update)
Le Pen And Other Hurdles (GeoRisk Update)
Macron is still favored to win the French election but Le Pen’s odds are 45%. Le Pen would halt France’s neoliberal structural reforms, paralyze EU policymaking, and help Russia’s leverage in Ukraine. But she would lack legislative support and would not fatally wound the EU or NATO. European political risk will remain high in Germany, Italy, and Spain. Favor UK equities on a relative basis. Financial markets are complacent about Russian geopolitical risk again. Steer clear of eastern European assets. Do not bottom feed in Chinese stocks. China faces social unrest. North Korean geopolitical risk is back. Australia’s election is an opportunity, not a risk. Stay bullish on Latin America. Prefer Brazil over India. Stay negative on Turkey and Pakistan. Trade Recommendation Inception Date Return TACTICALLY LONG US 10-YEAR TREASURY 2022-04-14 Bottom Line: Go long the US 10-year Treasury on geopolitical risk and near-term peak in inflation. Feature Last year we declared that European political risk had reached a bottom and had nowhere to go but up. Great power rivalry with Russia primarily drove this view but we also argued that our structural theme of populism and nationalism would feed into it. Related Report Geopolitical StrategyThe Geopolitical Consequences Of The Ukraine War In other words, the triumph of the center-left political establishment in the aftermath of Covid-19 would be temporary. The narrow French presidential race highlights this trend. President Emmanuel Macron is still favored but Marine Le Pen, his far-right, anti-establishment opponent, could pull off an upset victory on April 24. The one thing investors can be sure of is that France’s ability to pursue neoliberal structural reforms will be limited even if Macron wins, since he will lack the mandate he received in 2017. Our GeoRisk Indicators this month suggest that global political trends are feeding into today’s stagflationary macroeconomic context. Market Complacent About Russia Again Global financial markets are becoming complacent about European security once again. Markets have begun to price a slightly lower geopolitical risk for Russia after it withdrew military forces from around Kyiv in an open admission that it failed to overthrow the government. However, western sanctions are rising, not falling, and Russia’s retreat from Kyiv means it will need to be more aggressive in the south and east (Chart 1). Chart 1Russia: GeoRisk Indicator
Russia: GeoRisk Indicator
Russia: GeoRisk Indicator
Russia has not achieved its core aim of a militarily neutral Ukraine – so it will escalate the military effort to achieve its aim. Any military failure in the east and south would humiliate the Putin regime and make it more unpredictable and dangerous. The West has doubled down on providing Ukraine with arms and hitting Russia with sanctions (e.g. imposing a ban on Russian coal). Germany prevented an overnight ban on Russian oil and natural gas imports but the EU is diversifying away from Russian energy rapidly. Sanctions that eat away at Russia’s export revenues will force it to take a more aggressive posture now, to achieve a favorable ceasefire before funding runs out. Sweden and Finland are reviewing whether to join NATO, with recommendations due by June. Russia will rattle sabers to underscore its red line against NATO enlargement and will continue to threaten “serious military-political repercussions” if these states try to join. We would guess they would remain neutral as a decision to join NATO could lead to a larger war. Bottom Line: Global equities will remain volatile due to a second phase of the war and potential Russian threats against Ukraine’s backers. European equities and currency, especially in emerging Europe, will suffer a persistent risk premium until a ceasefire is concluded. What If Le Pen Wins In France? By contrast with the war in Ukraine, the French election is a short-term source of political risk. A surprise Le Pen victory would shake up the European political establishment but investors should bear in mind that it would not revolutionize the continent or the world, as Le Pen’s powers would be limited. Unlike President Trump in 2017, she would not take office with her party gaining full control of the legislature. Le Pen rallied into the first round of the election on April 10, garnering 23% of the vote, up from 21% in 2017. This is not a huge increase in support but her odds of winning this time are much better than in 2017 because the country has suffered a series of material shocks to its stability. Voters are less enthusiastic about President Macron and his centrist political platform. Macron, the favorite of the political establishment, received 28% of the first-round vote, up from 24% in 2017. Thus he cannot be said to have disappointed expectations, though he is vulnerable. The euro remains weak against the dollar and unlikely to rally until Russian geopolitical risk and French political risk are decided. The market is not fully pricing French risk as things stand (Chart 2). Chart 2France: GeoRisk Indicator
France: GeoRisk Indicator
France: GeoRisk Indicator
The first-round election results show mixed trends. The political establishment suffered but so did the right-wing parties (Table 1). The main explanation is that left-wing, anti-establishment candidate Jean-Luc Mélenchon beat expectations while the center-right Republicans collapsed. Macron is leading Le Pen by only five percentage points in the second-round opinion polling as we go to press (Chart 3). Macron has maintained this gap throughout the race so far and both candidates are very well known to voters. But Le Pen demonstrated significant momentum in the first round and momentum should never be underestimated. Table 1Results Of France’s First-Round Election
Le Pen And Other Hurdles (GeoRisk Update)
Le Pen And Other Hurdles (GeoRisk Update)
Chart 3French Election: Macron Maintains Lead
French Election: Macron Maintains Lead
French Election: Macron Maintains Lead
Are the polls accurate? Anti-establishment candidates outperformed their polling by 7 percentage points in the first round. Macron, the right-wing candidates, and the pro-establishment candidates all underperformed their March and April polls (Chart 4). Hence investors should expect polls to underrate Le Pen in the second round. Chart 4French Polls Fairly Accurate Versus First-Round Results
Le Pen And Other Hurdles (GeoRisk Update)
Le Pen And Other Hurdles (GeoRisk Update)
Given the above points, it is critical to determine which candidate will gather the most support from voters whose first preference got knocked out in the first round. The strength of anti-establishment feeling means that the incumbent is vulnerable while ideological camps may not be as predictable as usual. Mélenchon has asked his voters not to give a single vote to Le Pen but he has not endorsed Macron. About 21% of his supporters say they will vote for Le Pen. Only a little more of them said they would vote for Macron, at 27% (Chart 5). Chart 5To Whom Will Voters Drift?
Le Pen And Other Hurdles (GeoRisk Update)
Le Pen And Other Hurdles (GeoRisk Update)
Diagram 1, courtesy of our European Investment Strategy, illustrates that Macron is favored in both scenarios but Le Pen comes within striking distance under certain conservative assumptions about vote switching. Diagram 1Extrapolating France’s First-Round Election To The Second Round
Le Pen And Other Hurdles (GeoRisk Update)
Le Pen And Other Hurdles (GeoRisk Update)
Macron’s approval rating has improved since the pandemic. This is unlike the situation in other liberal democracies (Chart 6). Chart 6Macron Handled Pandemic Reasonably Well
Le Pen And Other Hurdles (GeoRisk Update)
Le Pen And Other Hurdles (GeoRisk Update)
The pandemic is fading and the economy reviving. Unemployment has fallen from 8.9% to 7.4% over the course of the pandemic. Real wage growth, at 5.8%, is higher than the 3.3% that prevailed when Macron took office in 2017 (Chart 7). Chart 7Real Wages A Boon For Macron
Le Pen And Other Hurdles (GeoRisk Update)
Le Pen And Other Hurdles (GeoRisk Update)
But these positives do not rule out a Le Pen surprise. The nation has suffered not one but a series of historic shocks – the pandemic, inflation, and the war in Ukraine. Inflation is rising at 5.1%, pushing the “Misery Index” (inflation plus unemployment) to 12%, higher than when Macron took office, even if lower than the EU average (Chart 8). Chart 8Misery Index The Key Threat To Macron
Misery Index The Key Threat To Macron
Misery Index The Key Threat To Macron
Le Pen has moderated her populist message and rebranded her party in recent years to better align with the median French voter. She claims that she will not pursue a withdrawal from the European Union or the Euro Area currency union. This puts her on the right side of the one issue that disqualified her from the presidency in the past. Yet French trust in the EU is declining markedly, which suggests that Le Pen is in step with the median voter on wanting greater French autonomy (Chart 9). Le Pen’s well-known sympathy toward Vladimir Putin and Russia is a liability in the context of Russian aggression in Ukraine. Only 35% of French people had a positive opinion of Russia back in 2019, whereas 50% had a favorable view of NATO, and the gap has likely grown as a result of the invasion (Chart 10). However, the historic bout of inflation suggests that economic policy could be the most salient issue for voters rather than foreign policy. Chart 9Le Pen Only Electable Because She Accepted Europe
Le Pen And Other Hurdles (GeoRisk Update)
Le Pen And Other Hurdles (GeoRisk Update)
Chart 10Le Pen’s NATO Stance Not Disqualifying
Le Pen And Other Hurdles (GeoRisk Update)
Le Pen And Other Hurdles (GeoRisk Update)
Le Pen’s economic platform is fiscally liberal and protectionist, which will appeal to voters upset over the rising cost of living and pressures of globalization. She wants to cut the income tax and value-added tax, while reversing Macron’s attempt at raising the retirement age and reforming the pension system. France’s tax rates on income, and on gasoline and diesel, are higher than the OECD average. In other words, Macron is running on painful structural reform while Le Pen is running on fiscal largesse. This is another reason to take seriously the risk of a Le Pen victory. What should investors expect if Le Pen pulls off an upset? France’s attempt at neoliberal structural reforms would grind to a halt. While Le Pen may not be able to pass domestic legislation, she would be able to halt the implementation of Macron’s reforms. Productivity and the fiscal outlook would suffer. Le Pen’s ability to change domestic policy will be limited by the National Assembly, which is due for elections from June 12-19. Her party, the National Rally (formerly the Front National), has never won more than 20% of local elections and performed poorly in the 2017 legislative vote. Investors should wait to see the results of the legislative election before drawing any conclusions about Le Pen’s ability to change domestic policy. France’s foreign policy would diverge from Europe’s. If Le Pen takes the presidency, she will put France at odds with Brussels, Berlin, and Washington, in much the same way that President Trump did. She would paralyze European policymaking. Yet Le Pen alone cannot take France out of the EU. The French public’s negative view of the EU is not the same as a majority desire to leave the bloc – and support for the euro currency stands at 69%. Le Pen does not have the support for “Frexit,” French exit from the EU. Moreover European states face immense pressures to work together in the context of global Great Power Rivalry. Independently they are small compared to the US, Russia, and China. Hence the EU will continue to consolidate as a geopolitical entity over the long run. Russia, however, would benefit from Le Pen’s presidency in the context of Ukraine ceasefire talks. EU sanctions efforts would freeze in place. Le Pen could try to take France out of NATO, though she would face extreme opposition from the military and political establishment. If she succeeded on her own executive authority, the result would be a division among NATO’s ranks in the face of Russia. This cannot be ruled out: if the US and Russia are fighting a new Cold War, then it is not unfathomable that France would revert to its Cold War posture of strategic independence. However, while France withdrew from NATO’s integrated military command from 1966-2009, it never withdrew fully from the alliance and was always still implicated in mutual defense. In today’s context, NATO’s deterrent capability would not be much diminished but Le Pen’s administration would be isolated. Russia would be unable to give any material support to France’s economy or national defense. Bottom Line: Macron is still favored for re-election but investors should upgrade Le Pen’s chances to a subjective 45%. If she wins, the euro will suffer a temporary pullback and French government bond spreads will widen over German bunds. The medium-term view on French equities and bonds will depend on her political capability, which depends on the outcome of the legislative election from June 12-19. She will likely be stymied at home and only capable of tinkering with foreign policy. But if she has legislative support, her agenda is fiscally stimulative and would produce a short-term sugar high for French corporate earnings. However, it would be negative for long-term productivity. UK, Italy, Spain: Who Else Faces Populism? Chart 11Rest Of Europe: GeoRisk Indicators
Rest Of Europe: GeoRisk Indicators
Rest Of Europe: GeoRisk Indicators
Between Russian geopolitical risk and French political risk, other European countries are likely to see their own geopolitical risk premium rise (Chart 11). But these countries have their own domestic political dynamics that contribute to the reemergence of European political risk. Germany’s domestic political risk is relatively low but it faces continued geopolitical risk in the form of Russia tensions, China’s faltering economy, and potentially French populism (Chart 11, top panel). In Italy, the national unity coalition that took shape under Prime Minister Mario Draghi was an expedient undertaken in the face of the pandemic. As the pandemic fades, a backlash will take shape among the large group of voters who oppose the EU and Italian political establishment. The Italian establishment has distributed the EU recovery funds and secured the Italian presidency as a check on future populist governments. But it may not be able to do more than that before the next general election in June 2023, which means that populism will reemerge and increase the political risk premium in Italian assets going forward (Chart 11, second panel). Spain is still a “divided nation” susceptible to a rise in political risk ahead of the general election due by December 10, 2023. However, the conservative People’s Party, the chief opposition party, has suffered from renewed infighting, which gives temporary relief to the ruling Socialist Worker’s Party of Prime Minister Pedro Sanchez. The Russia-Ukraine issue caused some minor divisions within the government but they are not yet leading to any major political crisis, as nationwide pro-Ukraine sentiment is largely unified. The Andalusia regional election, which is expected this November, will be a check point for the People’s Party’s new leadership and a test run for next year’s general election. Andalusia is the most populous autonomous community in Spain, consisting about 17% of the seats in the congress (the lower house). The risk for Sanchez and the Socialists is that the opposition has a strong popular base and this fact combined with the stagflationary backdrop will keep political polarization high and undermine the government’s staying power (Chart 11, third panel). While Prime Minister Boris Johnson has survived the scandal over attending social events during Covid lockdowns, as we expected, nevertheless the Labour Party is starting to make a comeback that will gain momentum ahead of the 2024 general election. Labour is unlikely to embrace fiscal austerity or attempt to reverse Brexit anytime soon. Hence the UK’s inflationary backdrop will persist (Chart 11, fourth panel). Bottom Line: European political risk has bottomed and will rise in the coming months and years, although the EU and Eurozone will survive. We still favor UK equities over developed market equities (excluding the US) because they are heavily tilted toward consumer staples and energy sectors. Stay long GBP-CZK. Favor European defense stocks over tech. Prefer Spanish stocks over Italian. China: Social Unrest More Likely China’s historic confluence of internal and external risks continues – and hence it is too soon for global investors to try to bottom-feed on Chinese investable equities (Chart 12). A tactical opportunity might emerge for non-US investors in 2023 but now is not the right time to buy. Chart 12China: GeoRisk Indicator
China: GeoRisk Indicator
China: GeoRisk Indicator
In domestic politics, the reversion to autocracy under Xi is exacerbating the economic slowdown. True, Beijing is stimulating the economy by means of its traditional monetary and fiscal tools. The latest data show that the total social financing impulse is reviving, primarily on the back of local government bonds (Chart 13). Yet overall social financing is weaker because private sector sentiment remains downbeat. The government is pursuing excessively stringent social restrictions in the face of the pandemic. Beijing is doubling down on “Covid Zero” policy by locking down massive cities such as Shanghai. The restrictions will fail to prevent the virus from spreading. They are likely to engender social unrest, which we flagged as our top “Black Swan” risk this year and is looking more likely. Lockdowns will also obstruct production and global supply chains, pushing up global goods inflation. Meanwhile the property sector continues to slump on the back of weak domestic demand, large debt levels, excess capacity, regulatory scrutiny, and negative sentiment. Consumer borrowing appetite and general animal spirits are weak in the face of the pandemic and repressive political environment (Chart 14). Chart 13China's Stimulus Has Clearly Arrived
China's Stimulus Has Clearly Arrived
China's Stimulus Has Clearly Arrived
Chart 14Yet Chinese Animal Spirits Still Suffering
Yet Chinese Animal Spirits Still Suffering
Yet Chinese Animal Spirits Still Suffering
Hence China will be exporting slow growth and inflation – stagflation – to the rest of the world until after the party congress. At that point President Xi will feel politically secure enough to “let 100 flowers bloom” and try to improve economic sentiment at home and abroad. This will be a temporary phenomenon (as were the original 100 flowers under Chairman Mao) but it will be notable for 2023. In foreign politics, Russia’s attack on Ukraine has accelerated the process of Russo-Chinese alliance formation. This partnership will hasten US containment strategy toward China and impose a much faster economic transition on China as it pursues self-sufficiency. The result will be a revival of US-China tensions. The implications are negative for the rest of Asia Pacific: Taiwanese geopolitical risk will continue rising for reasons we have outlined in previous reports. In addition, Taiwanese equities are finally starting to fall off from the pandemic-induced semiconductor rally (Chart 15). The US and others are also pursuing semiconductor supply security, which will reduce Taiwan’s comparative advantage. Chart 15Taiwan: GeoRisk Indicator
Taiwan: GeoRisk Indicator
Taiwan: GeoRisk Indicator
South Korea faces paralysis and rising tensions with North Korea. The presidential election on May 9 brought the conservatives back into the Blue House. The conservative People Power Party’s candidate, Yoon Suk-yeol, eked out a narrow victory that leaves him without much political capital. His hands are also tied by the National Assembly, at least for the next two years. He will attempt to reorient South Korean foreign policy toward the US alliance and away from China. He will walk away from the “Moonshine” policy of engagement with North Korea, which yielded no fruit over the past five years. North Korea has responded by threatening a nuclear missile test, restarting intercontinental ballistic missile tests for the first time since 2017, and adopting a more aggressive nuclear deterrence policy in which any South Korean attack will ostensibly be punished by a massive nuclear strike. Tensions on the peninsula are set to rise (Chart 16). Three US aircraft carrier groups are around Japan today, despite the war in Europe (where two are placed), suggesting high threat levels. Chart 16South Korea: GeoRisk Indicator
South Korea: GeoRisk Indicator
South Korea: GeoRisk Indicator
Australia’s elections present opportunity rather than risk. Prime Minister Scott Morrison formally scheduled them for May 21. The Australian Labor Party is leading in public opinion and will perform well. The election threatens a change of parties but not a drastic change in national policy – populist parties are weak. No major improvement in China relations should be expected. Any temporary improvement, as with the Biden administration, will be subject to reversal due to China’s long-term challenge to the liberal international order. Cyclically the Australian dollar and equities stand to benefit from the global commodity upcycle as well as relative geopolitical security due to American security guarantees (Chart 17). Chart 17Australia: GeoRisk Indicator
Australia: GeoRisk Indicator
Australia: GeoRisk Indicator
Bottom Line: China’s reversion to autocracy will keep global sentiment negative on Chinese equities until 2023 at earliest. Stay short the renminbi and Taiwanese dollar. Favor the Japanese yen over the Korean won. Favor South Korean over Taiwanese equities. Look favorably on the Australian dollar. Turkey, South Africa, And … Canada Turkish geopolitical risk will remain elevated in the context of a rampant Russia, NATO’s revival and tensions with Russia, the threat of commerce destruction and accidents in the Black Sea region, domestic economic mismanagement, foreign military adventures, and the threat posed to the aging Erdogan regime by the political opposition in the wake of the pandemic and the lead-up to the 2023 elections (Chart 18). Chart 18Turkey: GeoRisk Indicator
Turkey: GeoRisk Indicator
Turkey: GeoRisk Indicator
While we are tactically bullish on South African equities and currency, we expect South African political risk to rise steadily into the 2024 general election. Almost a year has passed since the civil unrest episode of 2021. Covid-19 lockdowns have been lifted and the national state of disaster has ended, which has helped quell social tensions. This is evident in the decline of our South Africa GeoRisk indicator from 2021 highs (Chart 19). While fiscal austerity is under way in South Africa, we have argued that fiscal policy will reverse course in time for the 2024 election. In this year’s fiscal budget, the budget deficit is projected to narrow from -6% to -4.2% over the next two years. Government has increased tax revenue collection through structural reforms that are rooting out corruption and wasteful expenditure. But the ANC will have to tap into government spending to shore up lost support come 2024. Thus South Africa benefits tactically from commodity prices but cyclically the currency is vulnerable. Chart 19South Africa: GeoRisk Indicator
South Africa: GeoRisk Indicator
South Africa: GeoRisk Indicator
Canadian political risk will rise but that should not deter investors from favoring Canadian assets that are not exposed to the property bubble. Prime Minister Justin Trudeau has had a net negative approval rating since early 2021 and his government is losing political capital due to inflation, social unrest, and rising difficulties with housing affordability (Chart 20). While he does not face an election until 2025, the Conservative Party is developing more effective messaging. Chart 20Canada: GeoRisk Indicator
Canada: GeoRisk Indicator
Canada: GeoRisk Indicator
India Will Stay Neutral But Lean Toward The West Chart 21Sino-Pak Alliance’s Geopolitical Power Is Thrice That Of India
Le Pen And Other Hurdles (GeoRisk Update)
Le Pen And Other Hurdles (GeoRisk Update)
US President Joe Biden has openly expressed his administration’s displeasure regarding India’s response to Russia’s invasion of Ukraine. This has led many to question the strength of Indo-US relations and the direction of India’s geopolitical alignments. To complicate matters, China’s overtures towards India have turned positive lately, leading clients to ask if a realignment in Indo-China relations is nigh. To accurately assess India’s long-term geopolitical propensities, it is important to draw a distinction between ‘cyclical’ and ‘structural’ dynamics that are at play today. Such a distinction yields crystal-clear answers about India’s strategic geopolitical leanings. In specific: Indo-US Relations Will Strengthen On A Strategic Horizon: As the US’s and China’s grand strategies collide, minor and major geopolitical earthquakes are bound to take place in South Asia and the Indo-Pacific. Against this backdrop, India will strategically align with the US to strengthen its hand in the region (Chart 21). While the Russo-Ukrainian war is a major global geopolitical event, for India this is a side-show at best. True, India will retain aspects of its historic good relations with Russia. Yet countering China’s encirclement of India is a far more fundamental concern for India. Since Russia has broken with Europe, and China cannot reject Russia’s alliance, India will gradually align with the US and its allies. India And China Will End Up As A Conflicting Dyad: Strategic conflict between the two Asian powers is likely because China’s naval development and its Eurasian strategy threaten India’s national security and geopolitical imperatives, while India’s alliances are adding to China’s distrust of India. Thus any improvement in Sino-Indian diplomatic relations will be short-lived. The US will constantly provide leeway for India in its attempts to court India as a key player in the containment strategy against China. The US and its allies are the premier maritime powers and upholders of the liberal world order – India serves its national interest better by joining them rather than joining China in a risky attempt to confront the US navy and revolutionize the world order. Indo-Russian Relations Are Bound To Fade In The Long Run: India will lean towards the US over the next few years for reasons of security and economics. But India’s movement into America’s sphere of influence will be slow – and that is by design. India is testing waters with America through networks like the Quadrilateral Dialogue. It sees its historic relationship with Russia as a matter of necessity in the short run and a useful diversification strategy in the long run. True, India will maintain a trading relationship with Russia for defense goods and cheap oil. But this trade will be transactional and is not reason enough for India to join Russia and China in opposing US global leadership. While these factors will mean that Indo-Russian relations are amicable over a cyclical horizon, this relationship is bound to fade over a strategic horizon as China and Russia grow closer and the US pursues its grand strategy of countering China and Russia. Bottom Line: India may appear to be neutral about the Russo-Ukrainian war but India will shed its historical stance of neutrality and veer towards America’s sphere of influence on a strategic timeframe. India is fully aware of its strategic importance to both the American camp and the Russo-Chinese camp. It thus has the luxury of making its leanings explicit after extracting most from both sides. Long Brazil / Short India Brazil’s equity markets have been on a tear. MSCI Brazil has outperformed MSCI EM by 49% in 2022 YTD. Brazil’s markets have done well because Brazil is a commodity exporter and the war in Ukraine has little bearing on faraway Latin America. This rally will have legs although Brazil’s political risks will likely pick back up in advance of the election (Chart 22). The reduction in Brazil’s geopolitical risk so far this year has been driven mainly by the fact that the currency has bounced on the surge in commodity prices. In addition, former President Lula da Silva is the current favorite to win the 2022 presidential elections – Lula is a known quantity and not repugnant to global financial institutions (Chart 23). Chart 22Brazil's Markets Have Benefitted From Rising Commodity Prices
Brazil's Markets Have Benefitted From Rising Commodity Prices
Brazil's Markets Have Benefitted From Rising Commodity Prices
Chart 23Brazil: Watch Out For Political Impact Of Commodity Prices
Brazil: Watch Out For Political Impact Of Commodity Prices
Brazil: Watch Out For Political Impact Of Commodity Prices
Whilst there is no denying that the first-round effects of the Ukraine war have been positive for Brazil, there is a need to watch out for the second-round effects of the war as Latin America’s largest economy heads towards elections. Surging prices will affect two key constituencies in Brazil: consumers and farmers. Consumer price inflation in Brazil has been ascendant and adding to Brazil’s median voter’s economic miseries. Rising inflation will thus undermine President Jair Bolsonaro’s re-election prospects further. The fact that energy prices are a potent polling issue is evinced by the fact that Bolsonaro recently sacked the chief executive of Petrobras (i.e. Brazil’s largest listed company) over rising fuel costs. Furthermore, Brazil is a leading exporter of farm produce and hence also a large importer of fertilizers. Fertilizer prices have surged since the war broke out. This is problematic for Brazil since Russia and Belarus account for a lion’s share of Brazil’s fertilizer imports. Much like inflation in general, the surge in fertilizer prices will affect the elections because some of the regions that support Bolsonaro also happen to be regions whose reliance on agriculture is meaningful (Map 1). They will suffer from higher input prices. Map 1States That Supported Bolso, Could Be Affected By Fertilizer Price Surge
Le Pen And Other Hurdles (GeoRisk Update)
Le Pen And Other Hurdles (GeoRisk Update)
Chart 24Long Brazil Financials / Short India
Long Brazil Financials / Short India
Long Brazil Financials / Short India
Given that Bolsonaro continues to lag Lula on popularity ratings – and given the adverse effect that higher commodity prices will have on Brazil’s voters – we expect Bolsonaro to resort to fiscal populism or attacks on Brazil’s institutions in a last-ditch effort to cling to power. He could even be emboldened by the fact that Sérgio Moro, the former judge and corruption fighter, decided to pull out of the presidential race. This could provide a fillip to Bolso’s popularity. Bottom Line: Brazil currently offers a buying opportunity owing to attractive valuations and high commodity prices. But investors should stay wary of latent political risks in Brazil, which could manifest themselves as presidential elections draw closer. We urge investors to take-on only selective tactical exposure in Brazil for now. Equities appear cheap but political and macro risks abound. To play the rally yet stave off political risk, we suggest a tactical pair trade: Long Brazil Financials / Short India (Chart 24). Whilst we remain constructive on India on a strategic horizon, for the next 12 months we worry about near-term macro and geopolitical headwinds as well as India’s rich valuations. Don’t Buy Into Pakistan’s Government Change Chart 25Pakistan’s Military Is Unusually Influential
Le Pen And Other Hurdles (GeoRisk Update)
Le Pen And Other Hurdles (GeoRisk Update)
The newest phase in Pakistan’s endless cycle of political instability has begun. Prime Minister Imran Khan has been ousted. A new coalition government and a new prime minister, Shehbaz Sharif, have assumed power. Prime Minister Sharif’s appointment may make it appear like risks imposed by Pakistan have abated. After all, Sharif is seen as a good administrator and has signaled an interest in mending ties with India. But despite the appearance of a regime change, geopolitical risks imposed by Pakistan remain intact for three sets of reasons: Military Is Still In Charge: Pakistan’s military has been and remains the primary power center in the country (Chart 25). Former Prime Minister Khan’s rise to power was possible owing to the military’s support and he fell for the same reason. Since the military influences the civil administration as well as foreign policy, a lasting improvement in Indo-Pak relations is highly unlikely. Risk Of “Rally Round The Flag” Diversion: General elections are due in Pakistan by October 2023. Sharif is acutely aware of the stiff competition he will face at these elections. His competitors exist outside as well as inside his government. One such contender is Bilawal Bhutto-Zardari of the Pakistan People’s Party (PPP), which is a key coalition partner of the new government that assumed power. Imran Khan himself is still popular and will plot to return to power. Against such a backdrop the newly elected PM is highly unlikely to pursue an improvement in Indo-Pak relations. Such a strategy will adversely affect his popularity and may also upset the military. Hence we highlight the risk of the February 2021 Indo-Pak ceasefire being violated in the run up to Pakistan’s general elections. India’s government has no reason to prevent tensions, given its own political calculations and the benefits of nationalism. Internal Social Instability Poor: Pakistan is young but the country can be likened to a social tinderbox. Many poor youths, a weak economy, and inadequate political valves to release social tensions make for an explosive combination. Pakistan remains a source of geopolitical risk for the South Asian region. Some clients have inquired as to whether the change of government in Pakistan implies closer relations with the United States. The US has less need for Pakistan now that it has withdrawn from Afghanistan. It is focused on countering Russia and China. As such the US has great need of courting India and less need of courting Pakistan. Pakistan will remain China’s ally and will struggle to retain significant US assistance. Bottom Line: We remain strategic sellers of Pakistani equities. Pakistan must contend with high internal social instability, a weak democracy, a weak economy and an unusually influential military. As long as the military remains excessively influential in Pakistan, its foreign policy stance towards India will stay hostile. Yet the military will remain influential because Pakistan exists in a permanent geopolitical competition with India. And until Pakistan’s economy improves structurally and endemically, its alliance with China will stay strong. Investment Takeaways Cyclically go long US 10-year Treasuries. Geopolitical risks are historically high and rising but complacency is returning to markets. Meanwhile inflation is nearing a cyclical peak. Favor US stocks over global. It is too soon to go long euro or European assets, especially emerging Europe. Favor UK equities over developed markets (excluding the US). Stay long GBP-CZK. Favor European defense stocks over European tech. Stay short the Chinese renminbi and Taiwanese dollar. Favor the Japanese yen over the Korean won. Favor South Korean over Taiwanese equities. Matt Gertken Chief Geopolitical Strategist mattg@bcaresearch.com Ritika Mankar, CFA Editor/Strategist ritika.mankar@bcaresearch.com Jesse Anak Kuri Associate Editor Jesse.Kuri@bcaresearch.com Yushu Ma Research Analyst yushu.ma@bcaresearch.com Guy Russell Senior Analyst GuyR@bcaresearch.com Alice Brocheux Research Associate alice.brocheux@bcaresearch.com Strategic Themes Open Tactical Positions (0-6 Months) Open Cyclical Recommendations (6-18 Months) Regional Geopolitical Risk Matrix Section III: Geopolitical Calendar
Executive Summary The structural downtrend in Chinese bond yields has a lot further to go, because it is helping to let the air out gently of stratospheric valuations in the real estate sector, and thereby preventing a hard landing for the Chinese economy. In the US, flagging mortgage and housing market activity is weighing on an already slowing economy. Buy US T-bonds. The long T-bond yield is close to a peak. Switch equity exposure into long-duration sectors such as healthcare and biotech. Go overweight US homebuilders versus US insurers. The peak in bond yields will also take pressure off US homebuilder shares whose recent collapse has been the mirror-image of the surge in the 30-year mortgage rate. Fractal trading watchlist: Basic resources; Switzerland versus Germany; and USD/EUR. The Collapse In US Homebuilder Shares Is The Mirror-Image Of The Surge In The Mortgage Rate
The Collapse In US Homebuilder Shares Is The Mirror-Image Of The Surge In The Mortgage Rate
The Collapse In US Homebuilder Shares Is The Mirror-Image Of The Surge In The Mortgage Rate
Bottom Line: The global bond yield cannot rise much further before it destabilises the $350 trillion global real estate market and thereby destabilises the global economy. Feature Quietly and largely unnoticed, Chinese long-dated bond yields have been drifting lower (Chart I-1 and Chart I-2). At a time that surging bond yields elsewhere in the world have grabbed all the attention, the largely unnoticed contrarian move in Chinese bond yields through the past year is significant because of something else that has gone largely unnoticed: Chinese real estate has become by far the largest asset-class in the world, worth $100 trillion.1 Chart I-1The Contrarian Downdrift In The Chinese 30-Year Bond Yield
The Contrarian Downdrift In The Chinese 30-Year Bond Yield
The Contrarian Downdrift In The Chinese 30-Year Bond Yield
Chart I-2The Contrarian Downdrift In The Chinese 10-Year Bond Yield
The Contrarian Downdrift In The Chinese 10-Year Bond Yield
The Contrarian Downdrift In The Chinese 10-Year Bond Yield
Chinese Real Estate Is Trading On A Stratospheric Valuation The $100 trillion valuation of Chinese real estate market is greater than the $90 trillion global economy, is more than twice the size of the $45 trillion US real estate market and the $45 trillion US stock market, and dwarfs the $18 trillion Chinese economy. Suffice to say, Chinese real estate’s pre-eminence as the world’s largest asset-class is mostly due to its stratospheric valuation. Prime residential rental yields in Guangzhou, Shanghai, Hangzhou, Shenzhen and Beijing have collapsed to 1.5 percent, the lowest rental yields in the world and less than half the global average of 3 percent. Versus rents therefore, Chinese real estate is now twice as expensive as in the rest of the world (Chart I-3). Chart I-3Versus Rents, Chinese Real Estate Is The Most Expensive In The World
$350 Trillion Of Global Real Estate Can’t Swallow Higher Bond Yields
$350 Trillion Of Global Real Estate Can’t Swallow Higher Bond Yields
To corroborate this point, while the US real asset market is worth around two times US annual GDP, the Chinese real estate market is worth more than five times China’s annual GDP! The structural downtrend in Chinese bond yields has a lot further to go. Crucially, the downward drift in Chinese bond yields is alleviating some of the pressure on the extremely highly valued Chinese real estate market – as it helps to let the air out gently of the stratospheric valuations, and thereby avoid a hard landing for the Chinese economy. Hence, the structural downtrend in Chinese bond yields has a lot further to go. The Surge In US Mortgage Rates Is Taking Its Toll Meanwhile, in the rest of the world, the surge in bond yields poses a major threat to the decade long housing boom. Versus rents, US house prices are the most expensive ever – more expensive even than during the early 2000s so-called ‘housing bubble’. For the first time since 2008, the US 30-year mortgage rate is higher than the prime residential rental yield. Until recently, the historically low rental yield on US real estate was justified by an extremely low bond yield. But the recent surge in the bond yield has changed all that. For the first time since 2008, the US 30-year mortgage rate is higher than the prime residential rental yield2 (Chart I-4). Chart I-4The US 30-Year Mortgage Rate Is Now Higher Than The Prime Residential Rental Yield
The US 30-Year Mortgage Rate Is Now Higher Than The Prime Residential Rental Yield
The US 30-Year Mortgage Rate Is Now Higher Than The Prime Residential Rental Yield
The surge in US mortgage rates is taking its toll. Since the end of January, US mortgage applications for home purchase have fallen by almost a fifth (Chart I-5), and the lower demand for home purchase mortgages is starting to weigh on home construction (Chart I-6). Building permits for new private housing units were already falling in February, but a more up-to-date sign of the pain is the 35 percent collapse in US homebuilder shares. Chart I-5US Mortgage Applications For Home Purchase Have Fallen By Almost A Fifth
US Mortgage Applications For Home Purchase Have Fallen By Almost A Fifth
US Mortgage Applications For Home Purchase Have Fallen By Almost A Fifth
Chart I-6The Lower Demand For Home Purchase Mortgages Is Starting To Weigh On Home Construction
The Lower Demand For Home Purchase Mortgages Is Starting To Weigh On Home Construction
The Lower Demand For Home Purchase Mortgages Is Starting To Weigh On Home Construction
$350 Trillion Of Global Real Estate Can’t Swallow Higher Bond Yields Mortgage rates drive real estate rental yields because of the arbitrage between buying versus renting a similar home. Given a fixed annual budget for housing, I must choose between how much home I can buy – which depends on the mortgage rate, versus how much home I can rent – which depends on the rental yield. The arbitrage should make me indifferent between the two options. As a simple example of this arbitrage, let’s assume my annual budget for housing is $10k, and both the mortgage rate and rental yield are 4 percent. I will be indifferent between spending the $10k on interest on a $250k mortgage loan to buy the home, or spending the $10k to rent a similar $250k home. If the mortgage rate rises to 5 percent, then the maximum loan that my $10k of interest payment will afford me falls to $200k, reducing my maximum bid to buy the home. If I am the marginal bidder, then the home price will fall to $200k, so that the $10k rent on the similar valued home will also equate to a higher rental yield of 5 percent. In practice, the simple arbitrage described above is complicated by several factors: the maximum loan-to-value that a lender will offer on the home; the different transaction costs of buying versus renting; and the fact that people prefer to buy than to rent because buying a home is an investment which also provides a consumption service – shelter, whereas renting a home only provides the consumption service. Nevertheless, these complications do not diminish the overarching connection between mortgage rates and rental yields. The lion’s share of the real estate boom has come from a massive valuation uplift, which in turn has come from structurally lower bond yields. All of which brings us to the decade long global real estate boom that has doubled the value of global real estate market to an eye-watering $350 trillion, four times the size of the $90 trillion global economy. During this unprecedented boom, global rents have risen by 40 percent, tracking world nominal GDP, as they should. This means that the lion’s share of the real estate boom has come from a massive valuation uplift, which in turn has come from structurally lower bond yields (Chart I-7). Chart I-7The Lion's Share Of The Global Real Estate Boom Has Come From A Massive Uplift In Valuations
The Lion's Share Of The Global Real Estate Boom Has Come From A Massive Uplift In Valuations
The Lion's Share Of The Global Real Estate Boom Has Come From A Massive Uplift In Valuations
Since the global financial crisis, there has been an excellent empirical relationship between the global long-dated bond yield (US/China average) and the global rental yield. The important takeaway is that the global bond yield cannot rise much further before it destabilises the $350 trillion global real estate market and thereby destabilises the global economy (Chart I-8). Chart I-8The Global Bond Yield Cannot Rise Much Further Before It Destabilises The $350 Trillion Global Real Estate Market
The Global Bond Yield Cannot Rise Much Further Before It Destabilises The $350 Trillion Global Real Estate Market
The Global Bond Yield Cannot Rise Much Further Before It Destabilises The $350 Trillion Global Real Estate Market
Some Investment Conclusions The good news is that the recent rise in the global bond yield has been limited by the downdrift in Chinese bond yields. Given the massive overvaluation of Chinese real estate, the structural downtrend in Chinese bond yields has a lot further to go. Meanwhile in the US, unless bond yields back down quickly, flagging mortgage and housing market activity will weigh on an already slowing economy. If US bond yields don’t back down quickly, the feedback from consequent slowdown in the economy will ultimately bring yields down anyway. As I explained last week in Fat-Tailed Inflation Signals A Peak In Bond Yields I do expect the long T-bond yield to back down relatively quickly. The sharp drop in US core inflation to just 0.3 percent month-on-month in March signals that inflation is peaking. Hence, medium to long term investors should be buying US T-bonds, and switching equity exposure into long-duration sectors such as healthcare and biotech. Finally, a peak in bond yields will also take pressure off US homebuilder shares whose recent collapse has been the mirror-image of the surge in the 30-year mortgage rate (Chart I-9). Hence, go overweight US homebuilders versus US insurers. Chart I-9The Collapse In US Homebuilder Shares Is The Mirror-Image Of The Surge In The Mortgage Rate
The Collapse In US Homebuilder Shares Is The Mirror-Image Of The Surge In The Mortgage Rate
The Collapse In US Homebuilder Shares Is The Mirror-Image Of The Surge In The Mortgage Rate
Fractal Trading Watchlist Given that inflation hedging investment demand has driven at least part of the strong rally in basic resources, a peak in inflation and bond yields threatens to unwind the recent outperformance of basic resources shares. This is corroborated by the extremely fragile 130-day fractal structure (Chart I-10). Accordingly, the recommended trade is to short basic resources (GNR) versus the broad market, setting the profit target and symmetrical stop-loss at 11.5 percent. This week we are also adding to our watchlist: Switzerland versus Germany; and USD/EUR. The full list of 20 investments that are experiencing or approaching turning points is available on our website: cpt.bcaresearch.com Chart I-10The Outperformance Of Basic Resources Is Vulnerable To Reversal
The Outperformance Of Basic Resources Is Vulnerable To Reversal
The Outperformance Of Basic Resources Is Vulnerable To Reversal
Switzerland's Outperformance Vs. Germany Could End
Switzerland's Outperformance Vs. Germany Could End
Switzerland's Outperformance Vs. Germany Could End
The Rally In USD/EUR Could End
The Rally In USD/EUR Could End
The Rally In USD/EUR Could End
Chart 1The Strong Trend In The 18-Month-Out US Interest Rate Future Is Fragile
The Strong Trend In The 18-Month-Out US Interest Rate Future Is Fragile
The Strong Trend In The 18-Month-Out US Interest Rate Future Is Fragile
Chart 2The Strong Trend In The 3 Year T-Bond Is Fragile
The Strong Trend In The 3 Year T-Bond Is Fragile
The Strong Trend In The 3 Year T-Bond Is Fragile
Chart 3AUD/KRW Is Vulnerable To Reversal
AUD/KRW Is Vulnerable To Reversal
AUD/KRW Is Vulnerable To Reversal
Chart 4Canada Versus Japan Is Vulnerable To Reversal
Canada Versus Japan Is Vulnerable To Reversal
Canada Versus Japan Is Vulnerable To Reversal
Chart 5Canada's TSX-60's Outperformance Might Be Over
Canada's TSX-60's Outperformance Might Be Over
Canada's TSX-60's Outperformance Might Be Over
Chart 6US Healthcare Providers Vs. Software At Risk of Reversal
US Healthcare Providers Vs. Software At Risk of Reversal
US Healthcare Providers Vs. Software At Risk of Reversal
Chart 7Bitcoin's 65-Day Fractal Support Is Holding For Now
Bitcoin's 65-Day Fractal Support Is Holding For Now
Bitcoin's 65-Day Fractal Support Is Holding For Now
Chart 8A Potential Switching Point From Tobacco Into Cannabis
A Potential Switching Point From Tobacco Into Cannabis
A Potential Switching Point From Tobacco Into Cannabis
Chart 9Biotech Is A Major Buy
Biotech Is A Major Buy
Biotech Is A Major Buy
Chart 10CAD/SEK Reversal Has Started
CAD/SEK Reversal Has Started
CAD/SEK Reversal Has Started
Chart 11Financials Versus Industrials To Reverse
Financials Versus Industrials To Reverse
Financials Versus Industrials To Reverse
Chart 12Norway's Outperformance Could End
Norway's Outperformance Could End
Norway's Outperformance Could End
Chart 13Greece's Brief Outperformance To End
Greece's Brief Outperformance To End
Greece's Brief Outperformance To End
Chart 14BRL/NZD At A Resistance Point
BRL/NZD At A Resistance Point
BRL/NZD At A Resistance Point
Chart 15The Outperformance Of Resources Versus Healthcare Is Vulnerable To Reversal
The Outperformance Of Resources Versus Healthcare Is Vulnerable To Reversal
The Outperformance Of Resources Versus Healthcare Is Vulnerable To Reversal
Chart 16The Outperformance Of Resources Versus Biotech Is Vulnerable To Reversal
The Outperformance Of Resources Versus Biotech Is Vulnerable To Reversal
The Outperformance Of Resources Versus Biotech Is Vulnerable To Reversal
Chart 17Cotton's Outperformance Is Vulnerable To Reversal
Cotton's Outperformance Is Vulnerable To Reversal
Cotton's Outperformance Is Vulnerable To Reversal
Chart 18US Homebuilders' Underperformance Is At A Potential Turning Point
US Homebuilders' Underperformance Is At A Potential Turning Point
US Homebuilders' Underperformance Is At A Potential Turning Point
Chart 19Fractal Trading Watch List
Fractal Trading Watch List
Fractal Trading Watch List
Chart 20Fractal Trading Watch List
Fractal Trading Watch List
Fractal Trading Watch List
Dhaval Joshi Chief Strategist dhaval@bcaresearch.com Footnotes 1 We estimate the value of Chinese real estate at the end of 2021 to be $97 trillion, comprising residential $85 trillion, commercial $6 trillion, and agricultural $6 trillion. The source is: the Savills September 2021 report ‘The total value of global real estate’, which valued the global real estate market to the end of 2020; and the February 2022 report ‘Savills Prime Residential Index: World Cities’ which allowed us to update the valuations to the end of 2021. 2 The US prime residential rental yield is the simple average of the prime residential rental yields in New York, Miami, Los Angeles and San Francisco. Source: Savills. Fractal Trading System Fractal Trades
$350 Trillion Of Global Real Estate Can’t Swallow Higher Bond Yields
$350 Trillion Of Global Real Estate Can’t Swallow Higher Bond Yields
$350 Trillion Of Global Real Estate Can’t Swallow Higher Bond Yields
$350 Trillion Of Global Real Estate Can’t Swallow Higher Bond Yields
6-Month Recommendations Structural Recommendations Closed Fractal Trades Indicators To Watch - Bond Yields Chart II-1Indicators To Watch - Bond Yields - Euro Area
Indicators To Watch - Bond Yields - Euro Area
Indicators To Watch - Bond Yields - Euro Area
Chart II-2Indicators To Watch - Bond Yields - Europe Ex Euro Area
Indicators To Watch - Bond Yields - Europe Ex Euro Area
Indicators To Watch - Bond Yields - Europe Ex Euro Area
Chart II-3Indicators To Watch - Bond Yields - Asia
Indicators To Watch - Bond Yields - Asia
Indicators To Watch - Bond Yields - Asia
Chart II-5Indicators To Watch - Bond Yields - Other Developed
Indicators To Watch - Bond Yields - Other Developed
Indicators To Watch - Bond Yields - Other Developed
Indicators To Watch - Interest Rate Expectations Indicators To Watch - Interest Rate Expectations
Indicators To Watch - Interest Rate Expectations
Indicators To Watch - Interest Rate Expectations
Chart II-6Indicators To Watch - Interest Rate Expectations
Indicators To Watch - Interest Rate Expectations
Indicators To Watch - Interest Rate Expectations
Chart II-7Indicators To Watch - Interest Rate Expectations
Indicators To Watch - Interest Rate Expectations
Indicators To Watch - Interest Rate Expectations
Chart II-8Indicators To Watch - Interest Rate Expectations
Indicators To Watch - Interest Rate Expectations
Indicators To Watch - Interest Rate Expectations
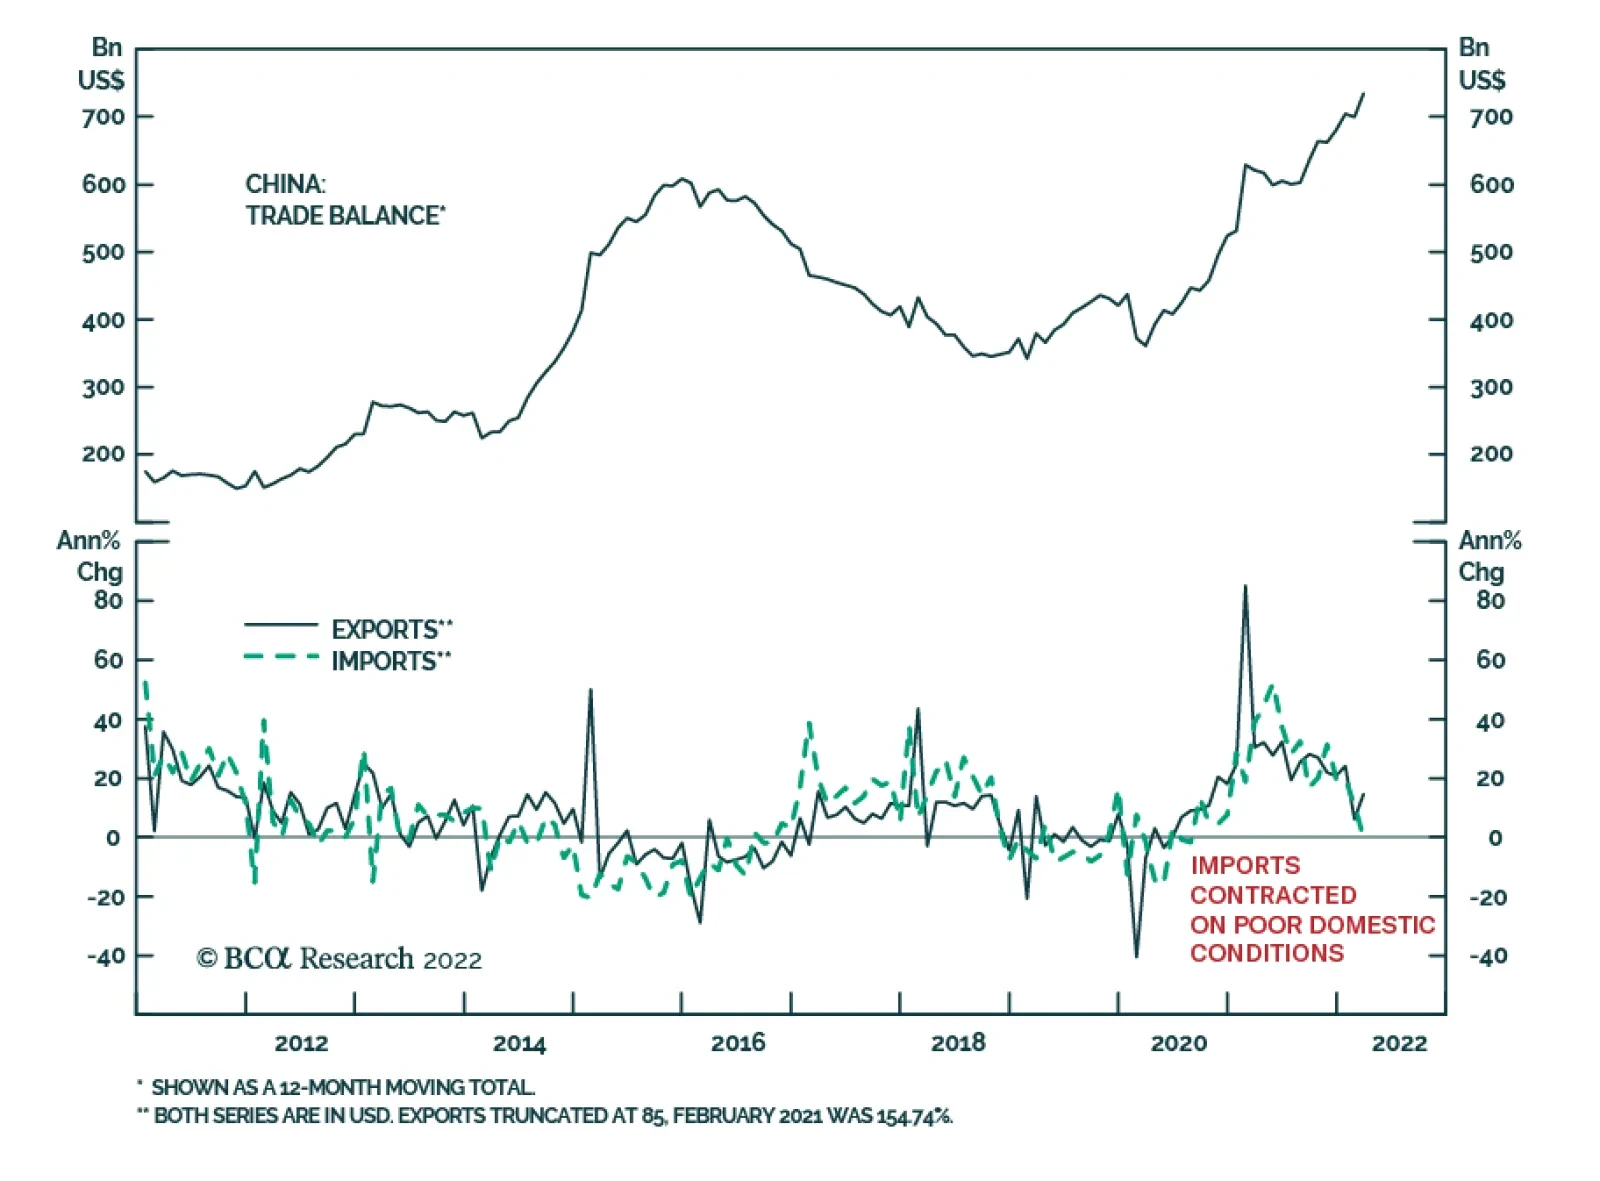
China’s trade surplus widened from USD 30.6 billion to USD 47.4 billion March, surprising expectations that it would narrow to USD 21.7 billion. Both export and import dynamics explain the wider surplus. On the export side, growth accelerated to 14.7% y/y…
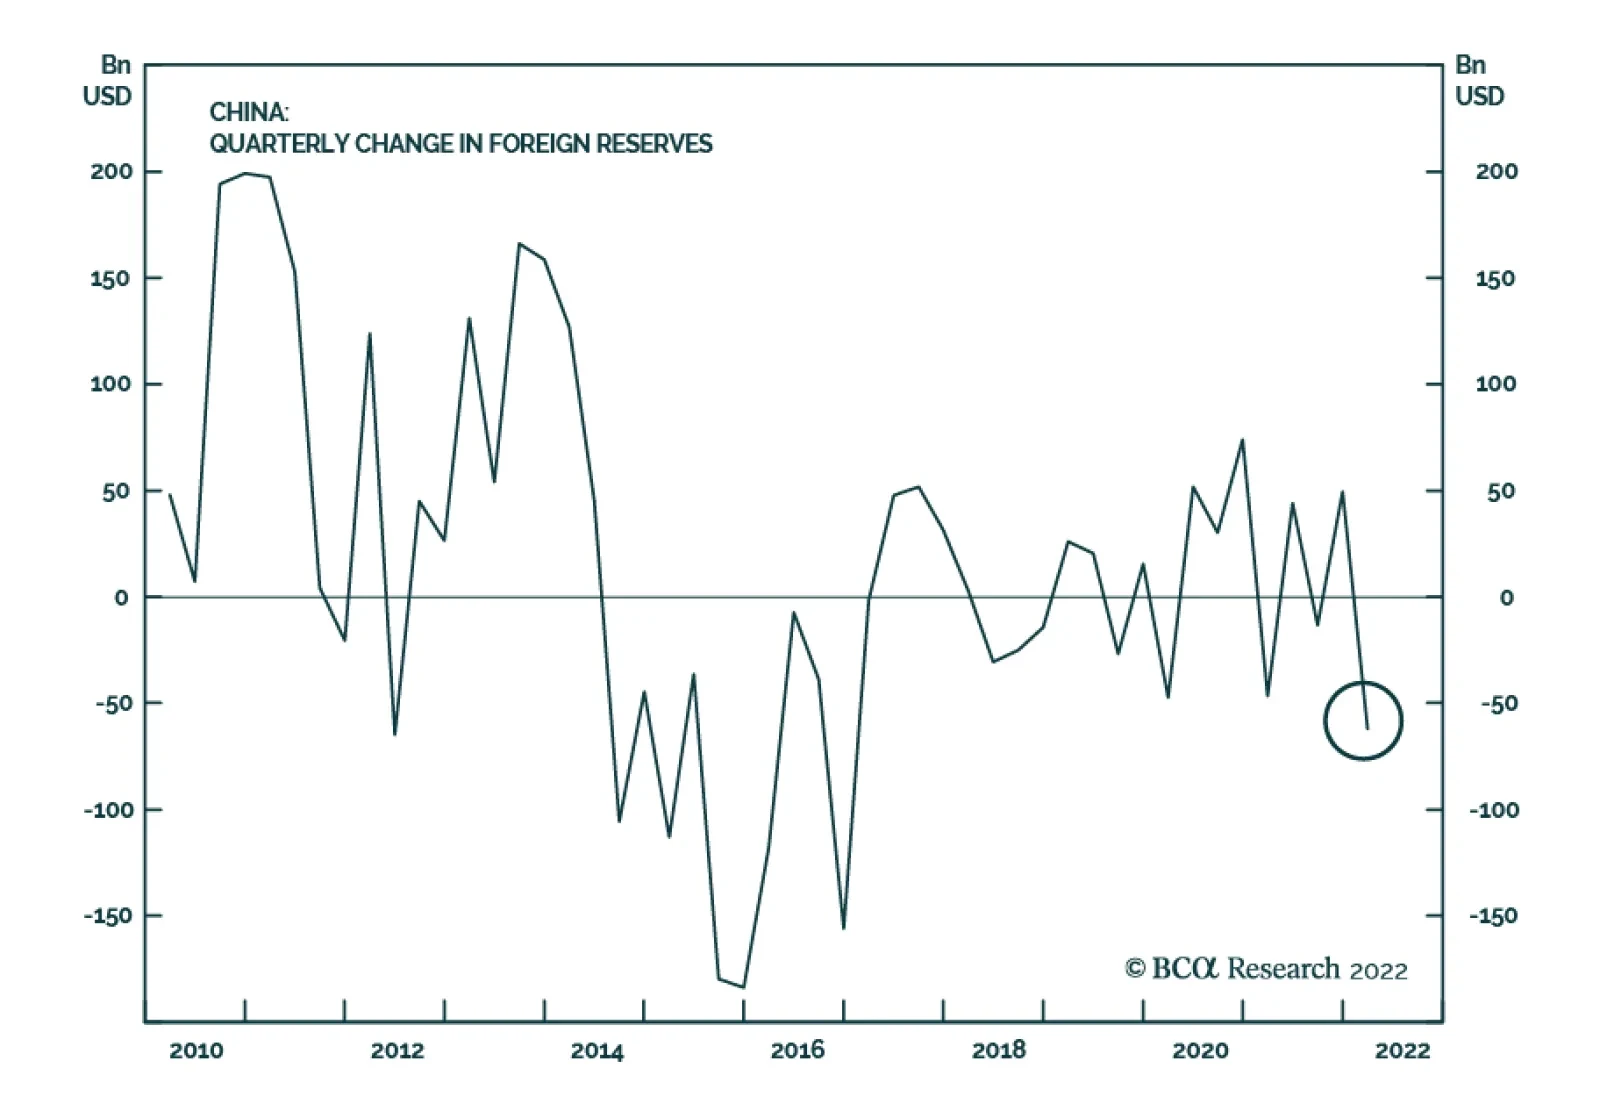
According to BCA Research’s China Investment Strategy service, the drop in the first quarter FX reserves reflects losses in China’s official FX asset portfolio and increased capital outflows. Newly released data shows that China’s FX reserves dropped by…
Executive Summary Onshore Equity Market Outflow Pressures Remain, At Least In The Near Term
Onshore Equity Market Outflow Pressures Remain, At Least In The Near Term
Onshore Equity Market Outflow Pressures Remain, At Least In The Near Term
China’s foreign exchange (FX) reserves fell in the first three months of 2022. The reduction was the largest quarterly fall since 2016, but it is minor in absolute terms given China’s massive FX reserves. However, the underlying drivers of the decline in the FX reserves are cause for concern. The current drawdown in FX reserves reflects losses in China’s official FX asset portfolio and increased capital outflows, which differs from in 2H20 when Chinese banks increased their FX purchases to slow the pace of the RMB appreciation. Onshore equity market net outflows will likely continue in the near term. Even though Beijing has stepped up stimulus measures, private sector sentiment and domestic demand remain subdued. The country’s zero-tolerance COVID policy will also continue to weigh down the effectiveness of the stimulus. Pressure on the bond market’s outflow will be sustained in the next 6 to 12 months as policy cycles between the US and China continue to diverge. The RMB will modestly devalue relative to the USD in the next few month. In the longer term, the RMB should be underpinned by fundamentals such as a current account surplus, positive real interest rates and a valuation cushion. Bottom Line: The drop in the first quarter FX reserves reflects losses in China’s official FX asset portfolio and increased capital outflows. Feature Chart 1The Quarterly Drop In China's FX Reserves This Year Was Largest Since 2016
The Quarterly Drop In China's FX Reserves This Year Was Largest Since 2016
The Quarterly Drop In China's FX Reserves This Year Was Largest Since 2016
Newly released data shows that China’s FX reserves dropped by US$25.8 billion to US$3.188 trillion in March. This represented a US$62 billion decrease from December 2021 and it was the largest quarterly drop since 2016 (Chart 1). The RMB also weakened slightly in March from February. The reduction in China’s FX reserves in Q1 is due to several factors, including fluctuations in the dollar versus other major currencies and the drop in market prices of foreign asset holdings. The country’s current account surplus also narrowed in the first three months of the year compared with Q4 last year. Notably, foreign holdings of Chinese local currency bonds posted a record decline in Q1 and onshore equity market outflows also accelerated. The illicit movement of capital via import over-invoicing has also picked up. We expect that the bond market outflow pressure will continue for the year and perhaps beyond as economic, inflation and monetary policy cycles in China and the US continue to diverge. Equity outflow pressures will also be sustained, at least through the next few months, while China’s COVID-induced lockdown measures in major cities significantly weaken the economic outlook. Furthermore, the country’s zero-tolerance toward COVID will continue restraining mobility in 2H22. Anticipated lockdowns will severely disrupt the local economy and weigh down the effectiveness of Chinese stimulus, which policymakers had pledged to boost. As such, we maintain our neutral position on Chinese onshore stocks and an underweight stance on Chinese investable stocks in a global portfolio. A Drawdown In FX Reserves Chart 2The Size Of Capital Outflows In Q1 Is Comparable To That In 2H20
The Size Of Capital Outflows In Q1 Is Comparable To That In 2H20
The Size Of Capital Outflows In Q1 Is Comparable To That In 2H20
Capital outflows intensified in Q1, with the magnitude similar to 2H20 (Chart 2). However, the underlying drivers of the depletion have changed. In 2H20, China’s state-owned banks strategically accumulated FX assets to slow the pace of a rising RMB, whereas the Q1 loss this year was mainly driven by fluctuations in global financial markets and weak domestic economic fundamentals. The reduction in China’s official FX reserves in the past three months was partly due to a stronger dollar versus other major currencies and price declines in China’s holdings of foreign currency assets. China's official FX reserves are marked-to-market and converted into US dollars. The value of China’s official reserves has been significantly impacted by two factors: the dollar’s increase of more than 4% in trade-weighted terms since its trough in May last year and the simultaneous decline in prices of both global stocks and bonds in Q1 2022 (Chart 3). In addition, China’s trade surplus narrowed in the first two months of the year from Q4 2021 and has likely dipped further in March (data has not yet been released) (Chart 4). Slower growth in China’s exports, coupled with rising global commodity prices that boosted China’s commodity import costs, has probably contributed to a smaller current account surplus, which was insufficient to offset the increased capital outflows. Chart 3The Dollar Exchange Rate And The Value Of China's Official FX Reserves
The Dollar Exchange Rate And The Value Of China's Official FX Reserves
The Dollar Exchange Rate And The Value Of China's Official FX Reserves
Chart 4China's Trade Surplus Narrowed In Q1 This Year
China's Trade Surplus Narrowed In Q1 This Year
China's Trade Surplus Narrowed In Q1 This Year
Meanwhile, the acceleration in capital outflows does not seem to be driven by an increase in China’s domestic banks and companies’ foreign currency holdings. It does not appear that banks have been buying foreign currencies to slow down the pace of the RMB appreciation against other currencies. As noted in a previous report since 2018 net FX purchases by China’s banks have been more tightly correlated with the spread between the CNY/USD exchange rate and the CFETS index (Chart 5, top panel). When the RMB falls relative to the USD, but not by enough to slow its increase against other trading partners, China’s banks would ramp up their FX purchases to push down the CNY/USD exchange rate and/or raise the value of other currencies in the CFETS basket (Chart 5, bottom panel). This occurred in 2H20 but does not seem to be the case this year. Chart 5No Sign Of Chinese Banks' Ramping Up FX Purchases This Year
No Sign Of Chinese Banks' Ramping Up FX Purchases This Year
No Sign Of Chinese Banks' Ramping Up FX Purchases This Year
Chart 6FX Settlement Has Been Net Positive...
FX Settlement Has Been Net Positive...
FX Settlement Has Been Net Positive...
Chinese companies have not increased their demands for USD either. Chart 6 shows a positive net FX settlement rate by banks on behalf of clients. This means more non-financial enterprises (such as exporters and investors) sold their foreign exchange holdings to banks than bought foreign exchange from banks. Moreover, Chart 7 highlights that the level of Chinese firms’ short-term foreign obligations (outstanding foreign currency loans, trade credit and liquid deposits) has remained steady. This implies that domestic firms have not been rushing to buy FX to pay back their dollar-denominated debts. Chart 7…And Chinese Firms Are Not Rushing To Pay Off External Debt
A Fall In China’s FX Reserves: Cause For Concern?
A Fall In China’s FX Reserves: Cause For Concern?
Bottom Line: Q1’s capital outflows were not driven by Chinese banks’ strategic accumulation of FX reserves to slow the pace of the RMB’s appreciation, nor by the demand for USD by Chinese companies. Accelerated Portfolio Outflows China's recent capital drain may be grouped into two categories: reduced foreign portfolio inflows (and accelerated outflows) and the illicit seepage of capital. China’s bond market contributed largely to the acceleration in Q1’s portfolio outflows. Foreign holding of Chinese bonds posted a record depletion of US$30 billion in February and March this year and the trend likely continued through April (Chart 8). As the Fed enters its hiking cycle following the March lift-off, the US-China nominal interest rate has narrowed meaningfully (Chart 9). Despite a widening inflation gap between the US and China, China’s bond market has become less attractive to global investors compared with last year (Chart 9, bottom panel). Chart 8A Record Bond Market Outflow In Q1 This Year
A Record Bond Market Outflow In Q1 This Year
A Record Bond Market Outflow In Q1 This Year
Chart 9Rate Differentials Between China and The US Have Narrowed Substantially, In Both Nominal And Real Terms
Rate Differentials Between China and The US Have Narrowed Substantially, In Both Nominal And Real Terms
Rate Differentials Between China and The US Have Narrowed Substantially, In Both Nominal And Real Terms
Outflows from onshore equity market also accelerated in Q1, in part because of China’s disappointing domestic economic data, rising geopolitical tensions and risk-off sentiment among global investors. Losses of Northbound net flows reached US$7.6 billion in March, comparable to the amount in early 2020 when China was hit hard by the pandemic (Chart 10). Importantly, while service trade deficits from outbound tourism continued to narrow due to international travel restrictions, our estimate of the illicit capital seepage through import over-invoicing has gathered speed since 2H21 (Chart 11). The sharp rise in our illicit capital outflow indicator suggests that the private sector and Chinese residents may be moving capitals offshore. Chart 10Chinese Onshore Equity Market Also Saw Substantial Investment Outflows In Q1
Chinese Onshore Equity Market Also Saw Substantial Investment Outflows In Q1
Chinese Onshore Equity Market Also Saw Substantial Investment Outflows In Q1
Chart 11Illicit Capital Outflows Picked Up
Illicit Capital Outflows Picked Up
Illicit Capital Outflows Picked Up
Bottom Line: The drain of capital escalated in Q1 through accelerated foreign portfolio outflows and perhaps illicit capital streaming out of the country. Investment Conclusions Chart 12Onshore Equity Market Outflow Pressures Remain, At Least In The Near Term
Onshore Equity Market Outflow Pressures Remain, At Least In The Near Term
Onshore Equity Market Outflow Pressures Remain, At Least In The Near Term
Equity market net outflows will likely continue, at least for the next couple months while China struggles to contain the ongoing COVID flareups in major cities. We maintain our recommended neutral allocation to Chinese onshore stocks and an underweight stance on Chinese offshore stocks in a global equity portfolio (Chart 12). While China’s stimulus should be able to stabilize the economy over a cyclical time horizon (the next 6 to 12 months), the nation’s zero-tolerance COVID position poses significant downside risks to the effectiveness of policy easing. It will be harder for China to contain infections as the virus mutates and variants become more contagious. There may be more frequent and larger-scale lockdowns affecting the economy than there have been in the past two years. Meanwhile, outflow pressures on China’s bond market may carry on through the next 6 to 12 months while the economic, inflation and monetary policy cycles in the US and China continue to diverge. Although the RMB has not moved into outright expensive territory, reduced foreign portfolio flows into RMB assets and a smaller current account surplus will pose near-term downward stress on the RMB against the USD. A depreciation in the RMB would be a boon to China’s domestic economy since it will help the export sector pricing power. Beyond the near term and in the next 12 to 18 months, however, fundamentals, such as China’s current account surplus, positive real interest rates and a valuation cushion, will underpin strength in the RMB (Chart 13A & 13B). Chart 13AOnshore Equity Market Outflow Pressures Remain, At Least In The Near Term
The RMB Is At Fair Value Based On Productivity Trends...
The RMB Is At Fair Value Based On Productivity Trends...
Chart 13B...But Is Cheap Based On Relative Prices
...But Is Cheap Based On Relative Prices
...But Is Cheap Based On Relative Prices
Jing Sima China Strategist jings@bcaresearch.com Strategic Themes Cyclical Recommendations
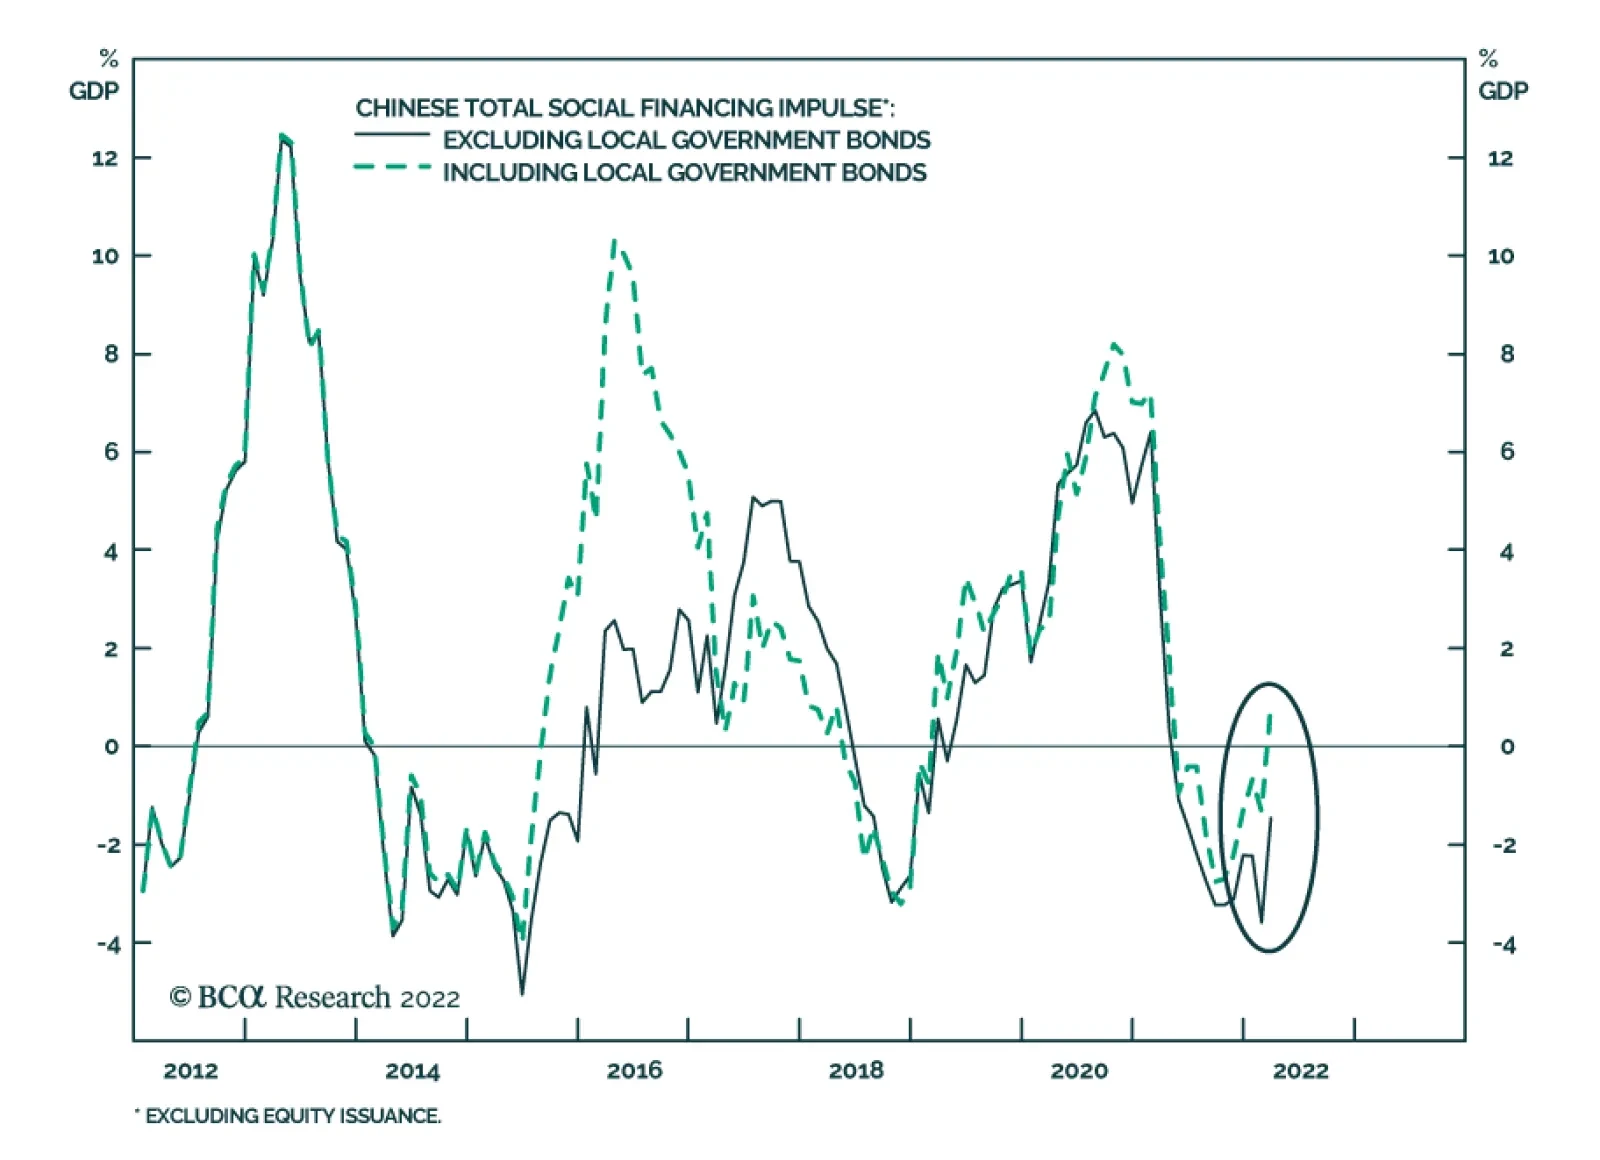
China’s money and credit data surprised to the upside in March. Aggregate financing jumped to CNY 4.65 trillion from CNY 1.19 trillion and beat expectations of a CNY 3.55 trillion increase. Similarly, new bank loans more than doubled from CNY 1.23 trillion to…