China

Executive Summary China's Unemployment
Questions From The Road
Questions From The Road
Over the past week we have been visiting clients along the US west coast. In this report we hit some of the highlights from the most important and frequently asked questions. Xi Jinping is seizing absolute power just as the country’s decades-long property boom turns to bust. He will stimulate the economy but Chinese stimulus is less effective than it used to be. The US and Israel are underscoring their red line against Iranian nuclear weaponization. If Iran does not freeze its nuclear program, the Middle East will begin to unravel again. The UK’s domestic instability is returning, with Scotland threatening to leave the union. Brexit, the pandemic, and inflation make a Scottish referendum a more serious risk than in the past. Shinzo Abe’s assassination makes him a martyr for a vision of Japan as a “normal country” – i.e. one that is not pacifist but capable of defending itself. Japan’s rearmament, like Germany’s, points to the decline of the WWII peace settlement and the return of great power competition. Bottom Line: Investors need a new global balance to be achieved through US diplomacy with Russia, China, and Iran. That is not forthcoming, as the chief nations face instability at home and a stagflationary global economy. Feature The world is becoming less stable as stagflation combines with great power competition. Global uncertainty is through the roof. From a macroeconomic perspective, investors need to know whether central banks can whip inflation without triggering a recession. From a geopolitical perspective, investors need to know whether Russia’s conflict with the West will expand, whether US-China and US-Iran tensions will escalate in a damaging way, and whether domestic political rotations in the US and China this fall will lead to more stable and productive economies. China: What Will Happen At The Communist Party Reshuffle? General Secretary Xi Jinping will cement another five-to-10 years in power while promoting members of his faction into key positions on the Politburo and Politburo Standing Committee. By December Xi will roll out a pro-growth strategy for 2023 and the government will signal that it will start relaxing Covid-19 restrictions. But China’s structural problems ensure that this good news for global growth will only have a fleeting effect. China’s governance is shifting from single-party rule to single-person rule. It is also shifting from commercially focused decentralization to national security focused centralization. Xi has concentrated power in himself, in the party, and in Beijing at the expense of political opponents, the private economy, and outlying regions like Hong Kong, the South China Sea, and Xinjiang. The subordination of Taiwan is the next major project, ensuring that China will ally with Russia and that the US and China cannot repair or deepen their economic partnership. Related Report Geopolitical StrategyWill China Let 100 Flowers Bloom? Only Briefly. Xi and the Communist Party began centralizing political power and economic control shortly after the Great Recession. At that time it became clear that a painful transition away from export manufacturing and close relations with the United States was necessary. The transition would jeopardize China’s long-term economic, social, political, and geopolitical stability. The Communist Party believed it needed to revive strongman leadership (autocracy) rather than pursuing greater liberalization that would ultimately increase the odds of political revolution (democratization). The Xi administration has struggled to manage the country’s vast debt bubble, given that total debt standing has surged to 287% of GDP. The global pandemic forced the government to launch another large stimulus package, which it then attempted to contain. Corporate and household deleveraging ensued. The property and infrastructure boom of the past three decades has stalled, as the regime has imposed liquidity and capital requirements on banks and property developers to try to avoid a financial crisis. Regulatory tightening occurred in other sectors to try to steer investment into government-approved sectors and reduce the odds of technological advancement fanning social dissent. China’s draconian “zero Covid” policy sought to limit the disease’s toll, improve China’s economic self-reliance, and eliminate the threat of social protest during the year of the twentieth party congress. But it also slammed the brakes on growth. China is highly vulnerable to social instability for both structural and cyclical reasons. Chinese social unrest was our number one “Black Swan” for this year and it is now starting to take shape in the form of angry mortgage owners across the country refusing to make mortgage payments on houses that were pre-purchased but not yet built and delivered (Chart 1). Chart 1China: Mortgage Payment Boycott
Questions From The Road
Questions From The Road
The mortgage payment boycott is important because it is stemming from the outstanding economic and financial imbalance – the property sector – and because it is a form of cross-regional social organization, which the Communist Party will disapprove. There are other social protests emerging, including low-level bank runs, which must be monitored very closely. Local authorities will act quickly to stop the spread of the mortgage boycott. But unhappy homeowners will be a persistent problem due to the decline of the property sector and industry. China’s property sector looks uncomfortably like the American property sector ahead of the 2006-08 bust. Prices for existing homes are falling while new house prices are on the verge of falling (Chart 2). While mortgages only make up 15% of bank assets, and household debt is only 62% of GDP, households are no longer taking on new debt (Chart 3). Chart 2China's Falling Property Prices
China's Falling Property Prices
China's Falling Property Prices
Chart 3China's Property Crisis
China's Property Crisis
China's Property Crisis
Chart 4China's Unemployment
China's Unemployment
China's Unemployment
Most likely China’s property sector is entering the bust phase that we have long expected – if not, then the reason will be a rapid and aggressive move by authorities to expand monetary and fiscal stimulus and loosen economic restrictions. That process of broad-based easing – “letting 100 flowers bloom” – will not fully get under way until after the party congress, say in December. Unemployment is rising across China as the economy slows, another point of comparison with the United States ahead of the 2008 property collapse (Chart 4). Unemployment is a manipulated statistic so real conditions are likely worse. There is no more important indicator. China’s government will be forced to ease policy, creating a positive impact on global growth in 2023, but the impact will be fleeting. Bottom Line: The underlying debt-deflationary context will prevail before long in China, weighing on global growth and inflation expectations on a cyclical basis. Middle East: Why Did Biden Go And What Will He Get? President Biden traveled to Israel and now Saudi Arabia because he wants Saudi Arabia and the Gulf Arab members of OPEC to increase oil production to reduce gasoline prices at the pump for Americans ahead of the midterm elections (Chart 5). Chart 5Biden Goes To Israel And Saudi Arabia
Biden Goes To Israel And Saudi Arabia
Biden Goes To Israel And Saudi Arabia
True, fears of recession are already weighing on prices, but Biden embarked on this mission before the growth slowdown was fully appreciated and he is not going to lightly abandon the anti-inflation fight before the midterm election. Biden also went because one of his top foreign policy priorities – the renegotiation of the 2015 nuclear deal with Iran – is falling apart. The Iranians do not want to freeze their nuclear program because they want regime survival and security. While Biden is offering a return to the 2015 deal, the conditions that produced the deal are no longer applicable: Russia and China are not cooperating with the US and EU to isolate Iran. Russia is courting Iran, oil prices are high and sanction enforcement is weak (unlike 2015). The Iranians now know, after the Trump administration, that they cannot trust the Americans to give credible security guarantees that will last across parties and administrations. The war in Ukraine also underscores the weakness of diplomatic security guarantees as opposed to a nuclear deterrent. Hence the joint US and Israeli declaration that Iran will never be allowed to obtain nuclear weapons. The good news is that this kind of joint statement is precisely what needed to occur – the underscoring of the red line – to try to change Ayatollah Ali Khamenei’s calculus regarding his drive to achieve nuclear breakout. In 2015 Khamenei gave diplomacy a chance to try to improve the economy, stave off social unrest, prepare the way for his eventual leadership succession process, and secure the Islamic Republic. The bad news is that Khamenei probably cannot make the same decision this time, as the hawkish faction now runs his government, the Americans are unreliable, and Russia and China are offering an alternative strategic orientation. The Saudis will pump more oil if necessary to save the global business cycle but not at the beck and call of a US president. The drop in oil prices reduces their urgency. The Americans can reassure the Saudis and Israel as long as the deal with Iran is not going forward. That looks to be the case. But then the US and Israel will have to undertake joint actions to underline their threat to Iran – and Iran will have to threaten to stage attacks across the region so as to deter any attack. Bottom Line: If a US-Iran deal does not materialize at the last minute, Middle Eastern instability will revive and a new source of oil supply constraint will plague the global economy. We continue to believe a US-Iran deal is unlikely, with only 40% odds of happening. Europe: Will Russia Turn Back On The Natural Gas? Russia’s objective in cutting off European natural gas is to inflict a recession on Europe. It wants a better bargaining position on strategic matters. Therefore we assume Russia will continue to squeeze supplies from now through the winter, when European demand rises and Russian leverage will peak. If Russia allows some flow to return, then it will be part of the negotiating process and will not preclude another cutoff before winter. It is possible that Russia is merely giving Europe a warning and will revert back to supplying natural gas. The problem is that Russia’s purpose is to achieve a strategic victory in Ukraine and in negotiations over NATO’s role in the Nordic countries. Russia has not achieved these goals, so natural gas cutoff will likely continue. Russia also hopes that by utilizing its energy leverage – while it still has it – it will bring forward the economic pain of Europe’s transition away from reliance on Russian energy. In that case European countries will experience recession and households will begin to change their view of the situation. European governments will be more likely to change their policies, to become more pragmatic and less confrontational toward Russia. Or European governments will be voted out of power and do the same thing. Other states could join Hungary in saying that Europe should never impose a full natural gas embargo on Russia. Russia would be able to salvage some of its energy trade with Europe over the long run, despite the war in Ukraine and the inevitable European energy diversification. In recent months we highlighted Italy as the weakest link in the European chain and the country most likely to see such a shift in policy occur. Italy’s national unity coalition had lost its reason for being, while the combination of rising bond yields and natural gas prices weighed on the economy. The Italian bond spread over German bunds has long served as our indicator of European political stress – and it is spiking now, forcing the European Central Bank to rush to plan an anti-fragmentation strategy that would theoretically enable it to tighten monetary policy while preventing an Italian debt crisis (Chart 6). The European Union remains unlikely to break up – Russian aggression was always one of our chief arguments for why the EU would stick together. But Italy will undergo a recession and an election (due by June 2023 but that could easily happen this fall), likely producing a new government that is more pragmatic with regard to Russia so as to reduce the energy strain. Chart 6Italy's Crisis Points To EU Divisions On Russia
Italy's Crisis Points To EU Divisions On Russia
Italy's Crisis Points To EU Divisions On Russia
Italy’s political turmoil shows that European states are feeling the energy crisis and will begin to shift policies to reduce the burden on households. Households will lose their appetite for conflict with Russia on behalf of Ukrainians, especially if Russia begins offering a ceasefire after completing its conquest of the Donetsk area. If Russia expands its invasion, then Europe will expand sanctions and the risk of further strategic instability will go up. But most likely Russia will seek to quit while it is ahead and twist Europe’s arm into foisting a ceasefire onto Ukraine. Bottom Line: A change of government in Italy will increase the odds that the EU will engage in diplomacy with Russia in the coming year, if Russia offers, so as to reach a new understanding, restore natural gas flows, and salvage the economy. This would leave NATO enlargement unresolved but a shift in favor of a ceasefire in Ukraine in 2023 would be less negative for European assets and the euro. UK: Who Will Replace Boris Johnson? Last week UK Prime Minister Boris Johnson fell from power and now the Conservative Party is engaging in a leadership competition to replace him. We gave up on Johnson after he survived his no-confidence vote and yet it became clear that he could not recover in popular opinion. The inflation outburst destroyed his premiership and wiped away whatever support he had gained from executing Brexit. In fact it reinforced the faction that believed Brexit was the wrong decision. Going forward the UK will be consumed with domestic political turmoil as the cost of stagflation mounts, and geopolitical turmoil as Scotland attempts to hold a second independence referendum, possibly by October 2023. Global investors should focus primarily on Scotland’s attempt to secede, since the breakup of the United Kingdom would be a momentous historical event and a huge negative shock for pound sterling. While only 44.7% of Scots voted for independence in 2014, now they have witnessed Brexit, Covid-19, and stagflation, producing tailwinds for the Scots nationalist vote (Chart 7). Chart 7Forget Bojo's Exit, Watch Scotland
Questions From The Road
Questions From The Road
There are still major limitations on Scotland exiting, since its national capabilities are limited, it would need to join the European Union, and Spain and possibly others will threaten to veto its membership in the European Union for fear of feeding their own secessionist movements. But any new referendum – including one done without the approval of Westminster – should be taken very seriously by investors. Bottom Line: Johnson’s removal will only marginally improve the Tories’ ability to manage the rebellion brewing in the north. A snap election that brings the Labour Party back into power would have a greater chance of keeping Scotland in the union, although it is not clear that such a snap election will happen in time to affect any Scottish decision. The UK faces economic and political turmoil between now and any referendum and investors should steer clear of the pound. (Though we still favor GBP over eastern European currencies). Britain will remain aggressive toward Russia but its ability to affect the Russian dynamic will fall, leaving the US and EU to decide the fate of Russian relations. Japan: What Is The Significance Of Shinzo Abe’s Assassination? Former Japanese Prime Minister Shinzo Abe was assassinated by a lone fanatic with a handmade gun. The significance of the incident is that Abe will become a martyr for a certain vision of Japan – his vision of Japan, which is that Japan can become a “normal country” that moves beyond the shackles of the guilt of its imperial aggression in World War II. A normal country is one that is economically stable and militarily capable of defending itself – not a pacifist country mired in debt-deflation. Abe stood for domestic reflation and a proactive foreign policy, along with the normalization of the Japanese Self-Defense Forces (JSDF). True, economic policy can become less dovish if necessary to deal with inflation. Some changes at the Bank of Japan may usher in a less dovish shift in monetary policy in particular. But monetary policy cannot become outright hawkish like it was before Abe. And Abe’s fiscal policy was never as loose as it was made out to be, given that he executed several hikes to the consumption tax. Japan’s structural demographic decline and large debt burden will continue to weigh on economic activity whenever real rates and the yen rise. The government will be forced to reflate using monetary and fiscal policy whenever deflation threatens to return. Debt monetization will remain an option for future Japanese governments, even if it is restrained during times of high inflation. Chart 8Shinzo Abe's Legacy
Questions From The Road
Questions From The Road
This is not only because Japanese households will become depressed if deflation is left unchecked but also because economic growth must be maintained in order to sustain the nation’s new and growing national defense budgets. Japan’s growing need for self defense stems from China’s strategic rise, Russia’s aggression, and North Korea’s nuclearization, plus uncertainty about the future of American foreign policy. These trends will not change anytime soon. Indeed the Liberal Democratic Party’s popularity has increased under Abe’s successor, Prime Minister Fumio Kishida, who will largely sustain Abe’s vision. The Diet still has a supermajority in favor of constitutional revision so as to enshrine the self-defense forces (Chart 8). And the de facto policy of rearmament continues even without formal revision. Bottom Line: Any Japanese leader who attempts to promote a hawkish BoJ, and a dovish JSDF, will fail sooner rather than later. The revolving door of prime ministers will accelerate. As Japan’s longest-serving prime minister, Shinzo Abe opened up the reliable pathway, which is that of a dovish BoJ and a hawkish foreign policy. This is important for the world, as well as Japan, because a more hawkish Japan will increase China’s fears of strategic containment. The frozen conflicts in Asia will continue to thaw, perpetuating the secular rise in geopolitical risk. We remain long JPY-KRW, since the BoJ may adjust in the short term and Chinese stimulus is still compromised, but that trade is on downgrade watch. Investment Takeaways Russia’s energy cutoff is aimed at pushing Europe into recession so as to force policy changes or government changes in Europe that will improve Russia’s position at the negotiating table over Ukraine, NATO, and other strategic disputes. Hence Russia is unlikely to increase the natural gas flow until it believes it has achieved its strategic aims and multiple veto players in the EU will prevent the EU from ever implementing a full-blown natural gas embargo. Chinese stimulus cannot be fully effective until it relaxes Covid-19 restrictions, likely beginning in December or next year when Xi Jinping uses his renewed political capital to try to stabilize the economy. However, China’s government powers alone are insufficient to prevent the debt-deflationary tendency of the property bust. The Middle East faces rising geopolitical tensions that will take markets by surprise with additional energy supply constraints. The implication is continued oil volatility given that global growth is faltering. Once global demand stabilizes, the Middle East’s turmoil will add to existing oil supply constraints to create new price pressures. The odds are not very high of the Federal Reserve achieving a “soft landing” in the context of a global energy shock and a stagflationary Europe and China. Matt Gertken Chief Geopolitical Strategist mattg@bcaresearch.com Strategic Themes Open Tactical Positions (0-6 Months) Open Cyclical Recommendations (6-18 Months) Regional Geopolitical Risk Matrix "Batting Average": Geopolitical Strategy Trades () Section II: Special (EDIT this Header) Section III: Geopolitical Calendar
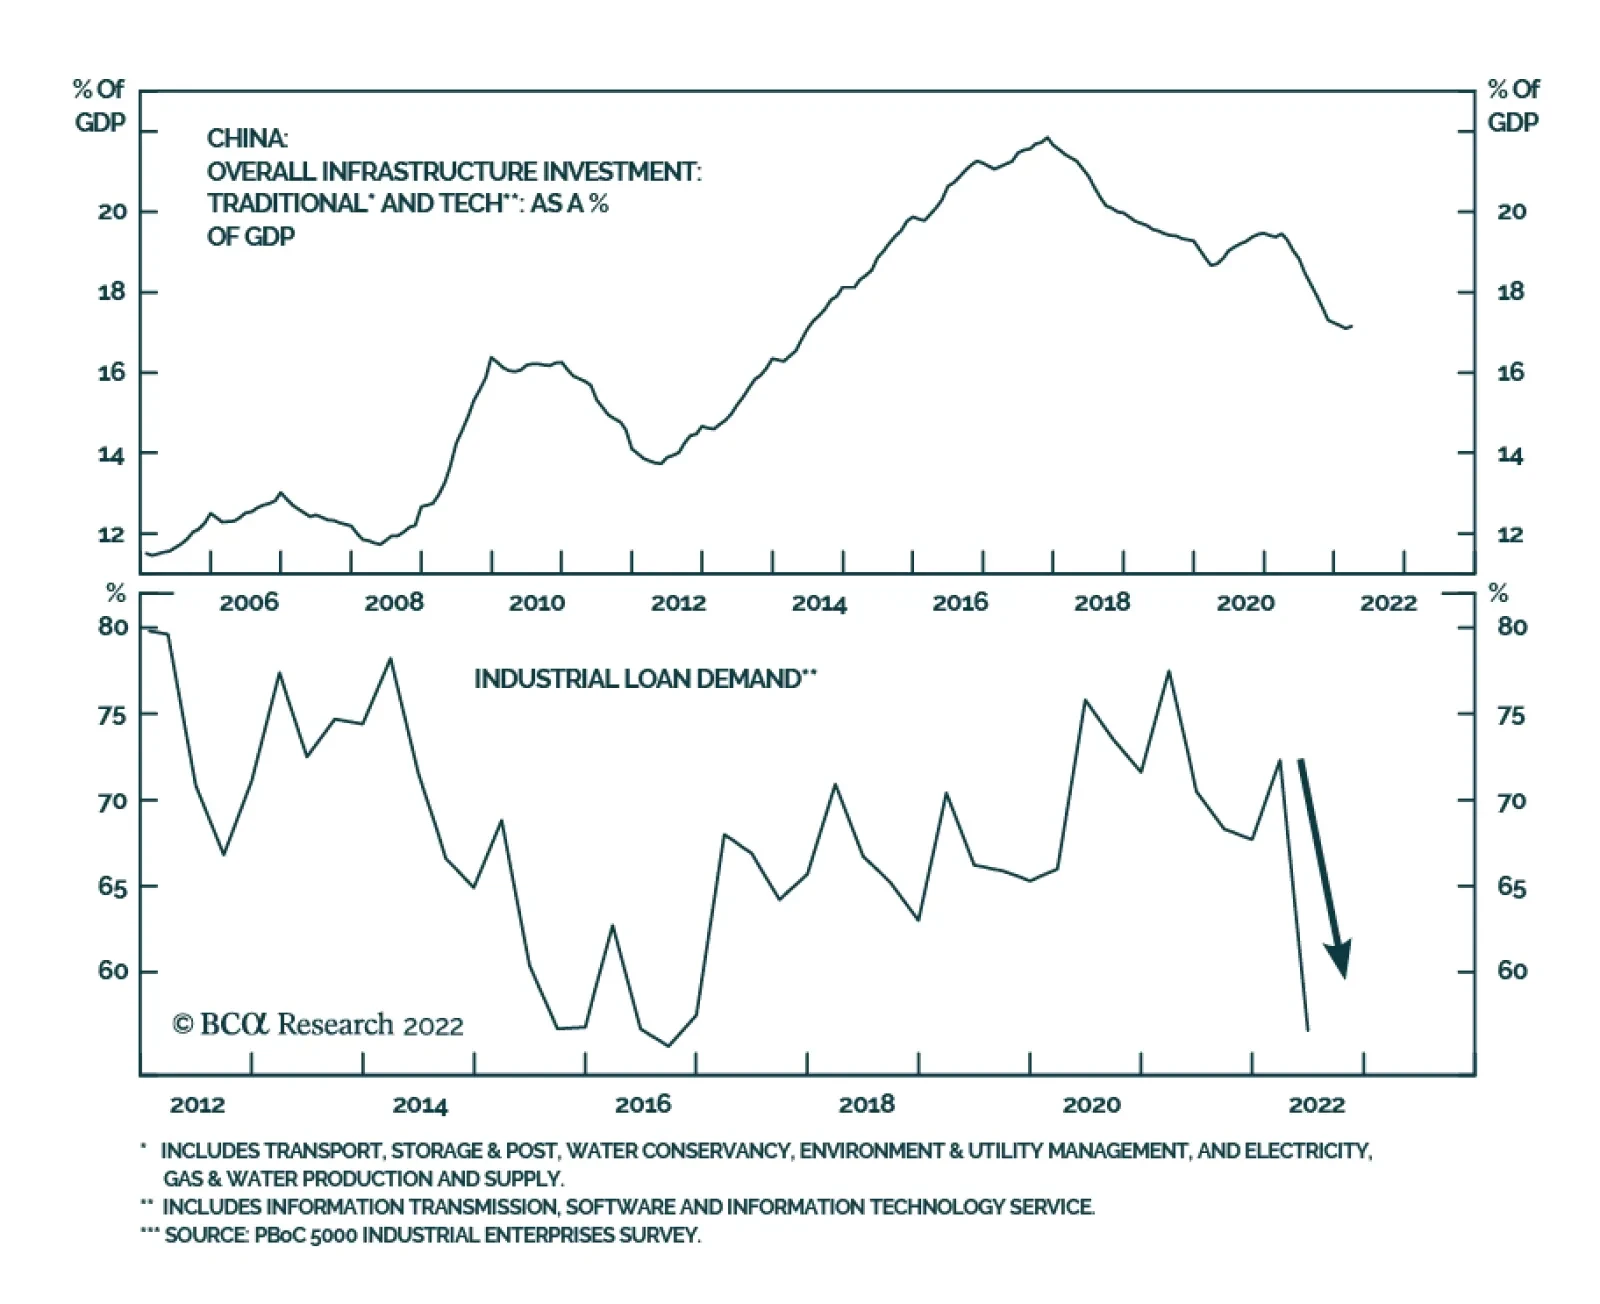
According to BCA Research’s China Investment Strategy service, Beijing’s plan to bring forward RMB 2.6 trillion of infrastructure financing in H2 will not result in new investments. Rather, it will offset the drop in local government (LG) revenues from land…
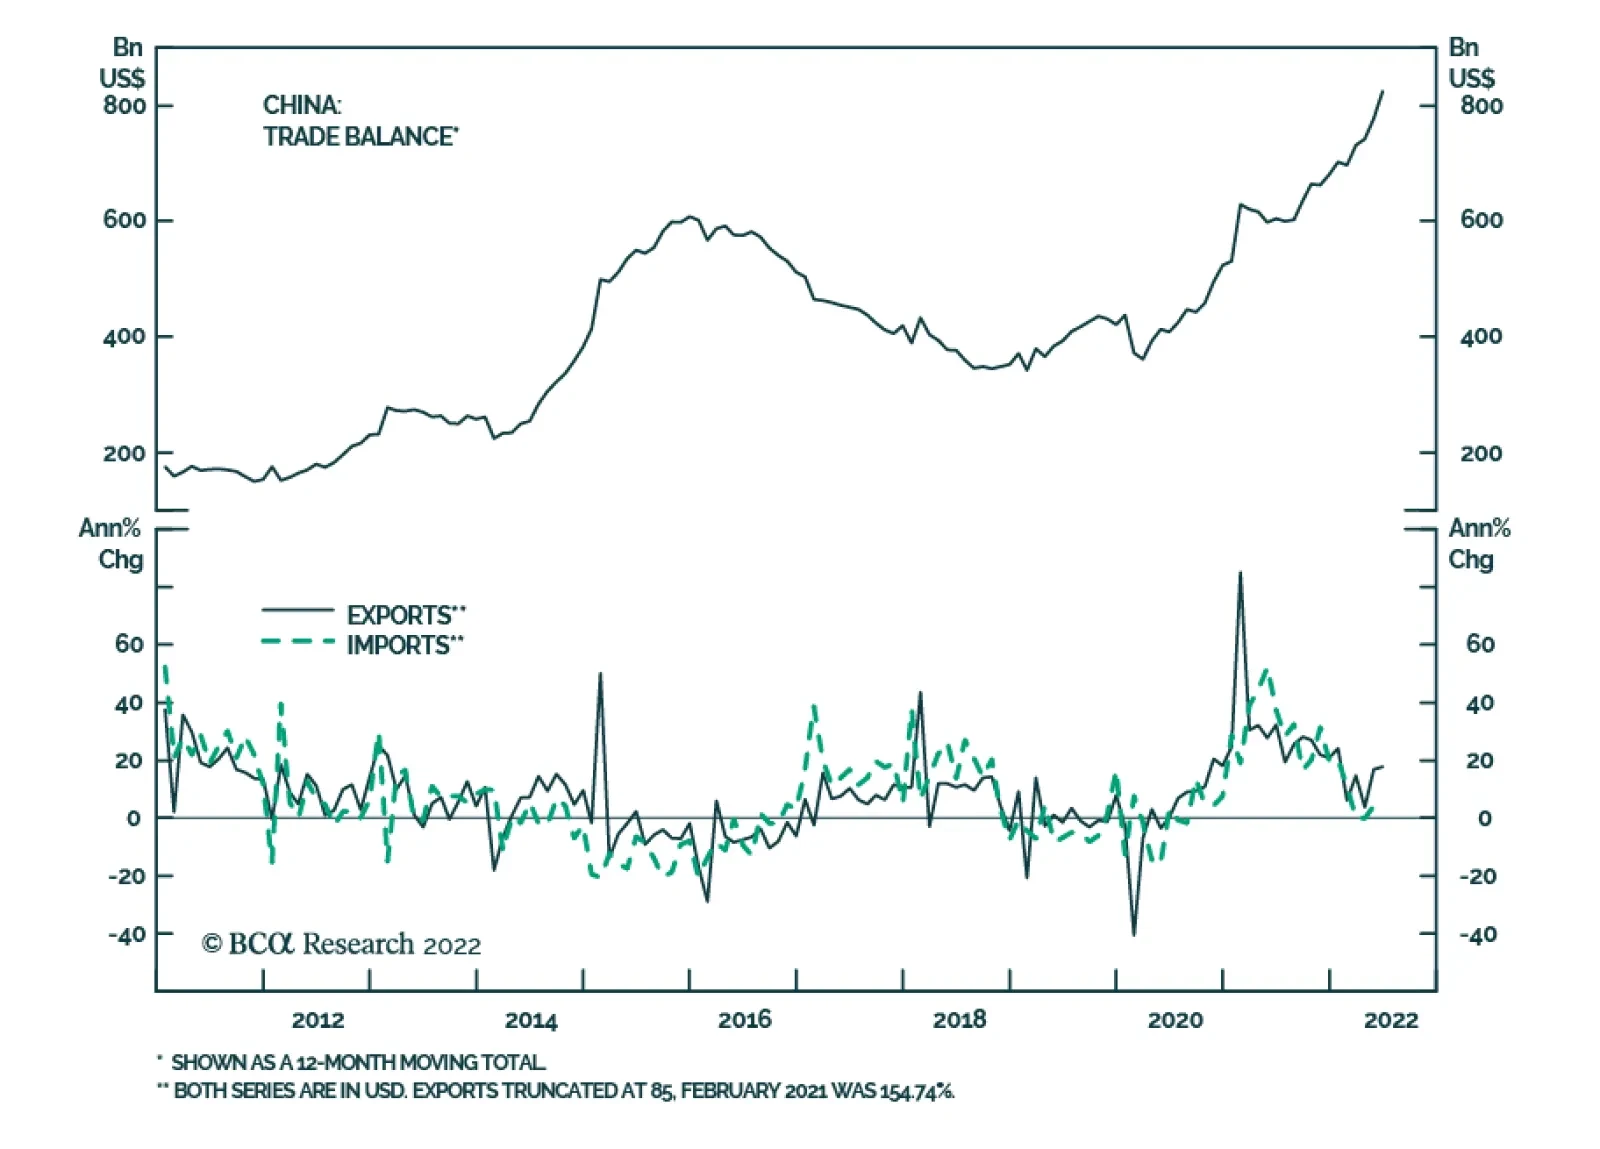
China’s trade surplus surged to an all-time high of USD 97.9 billion in June. The increase reflects an 18% y/y jump in exports as well as a slowdown in import growth from 4% y/y to 1% y/y. The post-lockdown normalization of economic activity is responsible…
Executive Summary No Funding For Property Developers, No Land Sales
No Funding For Property Developers, No Land Sales
No Funding For Property Developers, No Land Sales
Beijing’s plan to bring forward RMB 2.6 trillion of financing for infrastructure expenditures in H2 2022 is a considerable stimulus. However, this new funding will not result in new investments. Rather, it will, by and large, offset the drop in local government (LG) revenues from land sales this year. In short, there is little new stimulus for infrastructure beyond what has been approved in the budget plan earlier this year. Not only is the credit and fiscal impulse smaller in this cycle than in the previous ones, but also the multiplier effect will be lower. This will hinder the recovery in domestic demand. After the one-off rebound in economic activity following the lockdowns in April and May of this year, China’s business cycle recovery will be more U shaped rather than V shaped. Bottom Line: For absolute-return investors neither A-shares nor investable stocks offer an attractive risk-reward profile. Within a global equity portfolio, we continue to recommend a neutral allocation to China’s A-shares and an underweight allocation to Chinese investable stocks. Relative to the EM equity benchmark, investors should continue to overweight A-shares and remain neutral on investable stocks. Maintain the long A-shares / short offshore investable Chinese stocks position. Alleged plans of an additional RMB 1.5 trillion local government (LG) special bond issuance in H2 2022 have prompted investors to speculate about whether this stimulus initiative is sufficient to produce a considerable acceleration in infrastructure investment. This stimulus would be added to RMB 800 billion and 300 billion of policy bank funding for infrastructure that the government approved earlier in Q2 this year. Hence, the combined new infrastructure financing made available by Beijing is RMB 2.6 trillion. Below, we elaborate on how this RMB 2.6 trillion of additional infrastructure financing will be largely offset by a drop in LG revenues from land sales. In short, the stimulus will preclude downside in infrastructure investment rather than herald a major acceleration. In addition, the economic recovery still faces substantial headwinds from other segments of the economy. We believe that, approached as a whole, China’s business cycle recovery will be more U shaped than V shaped. Quantifying Infrastructure Stimulus The degree of new financing for infrastructure is considerable. This RMB 2.6 trillion in new financing in H2 2022 is equal to 7% of planned 2022 LG aggregate expenditures, 6% of planned 2022 aggregate total central and local government spending including budgetary and managed funds, 14% of fixed-asset investment (FAI) in traditional infrastructure, and 2% of GDP. The composition of general government spending is presented in Table 1. Table 1Structure And Composition Of Government Spending In China
Making Sense Of China’s New Stimulus
Making Sense Of China’s New Stimulus
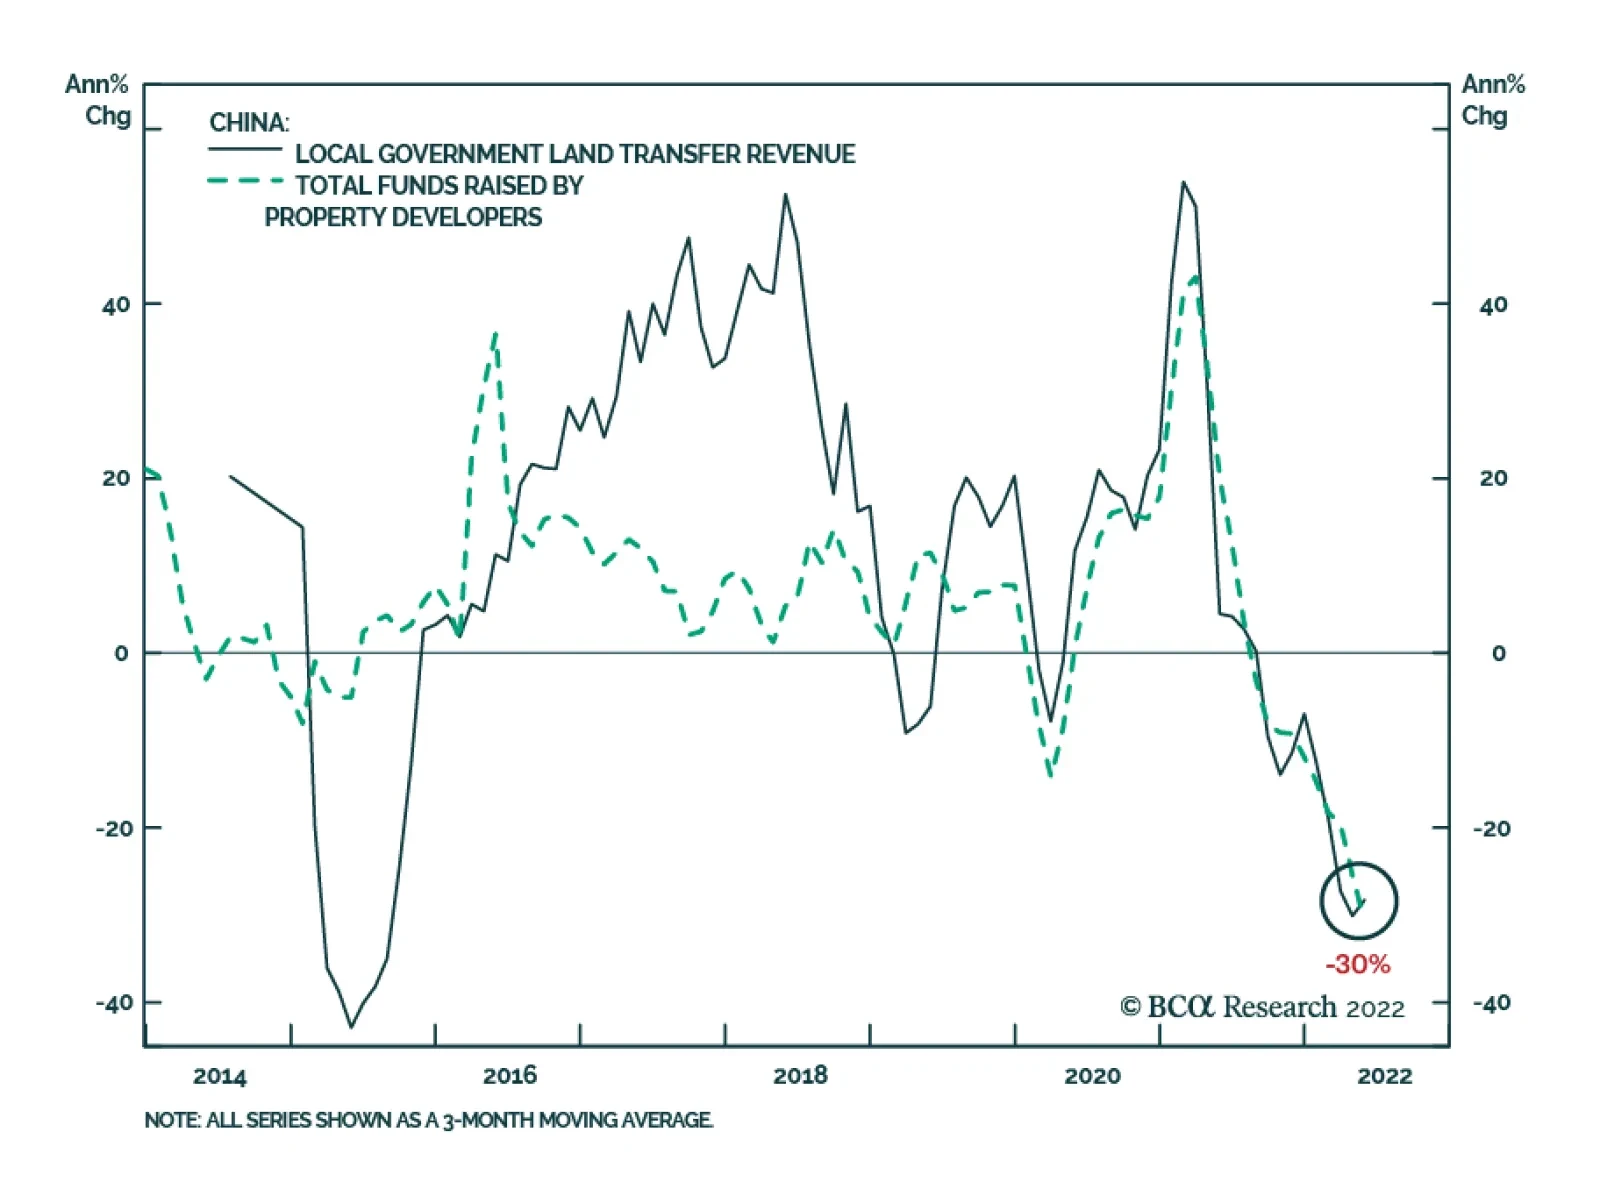
However, a caveat is in order: this new funding will not result in new investments. Rather, it will, by and large, offset the drop in LG revenues from land sales. The primary source of financing infrastructure investment is LG managed funds. LG managed funds budgets, however, are under severe stress because of the plunge in revenues from land sales. Notably, proceeds from land sales account for 23% of aggregate LG expenditures (Chart 1). Land sales have contracted by about 30% in the January-June period of this year, and there is little hope that they will pick up in H2 2022. The reason is that property developers’ financing is down by 30% and is unlikely to recover soon (Chart 2). Chart 1Land Sales Are Critical For LG Expenditures
Land Sales Are Critical For LG Expenditures
Land Sales Are Critical For LG Expenditures
Chart 2No Funding For Property Developers, No Land Sales
No Funding For Property Developers, No Land Sales
No Funding For Property Developers, No Land Sales
Chart 3Property Developers Are Facing Debt Deflation
Property Developers Are Facing Debt Deflation
Property Developers Are Facing Debt Deflation
As we have argued in our past reports, property developers carry a substantial inventory of real estate assets funded by a massive debt build-up (Chart 3, top panel). With housing prices beginning to deflate, property developers are about to face debt deflation – falling asset prices and a high debt burden (Chart 3, bottom panel). Thereby, they have little appetite or capacity to expand their assets and leverage. Assuming land sales for the full year will decline by 30%, this drop would lead to an RMB 2.52 trillion reduction in LGs managed fund revenues in 2022 (Table 2). Hence, the new RMB 2.6 trillion infrastructure financing will be used to offset the RMB 2.5 trillion shortfall in LG managed funds budgets because of the plunge in land transfer proceeds. Table 2China: New Stimulus For Infrastructure in H2 2022
Making Sense Of China’s New Stimulus
Making Sense Of China’s New Stimulus
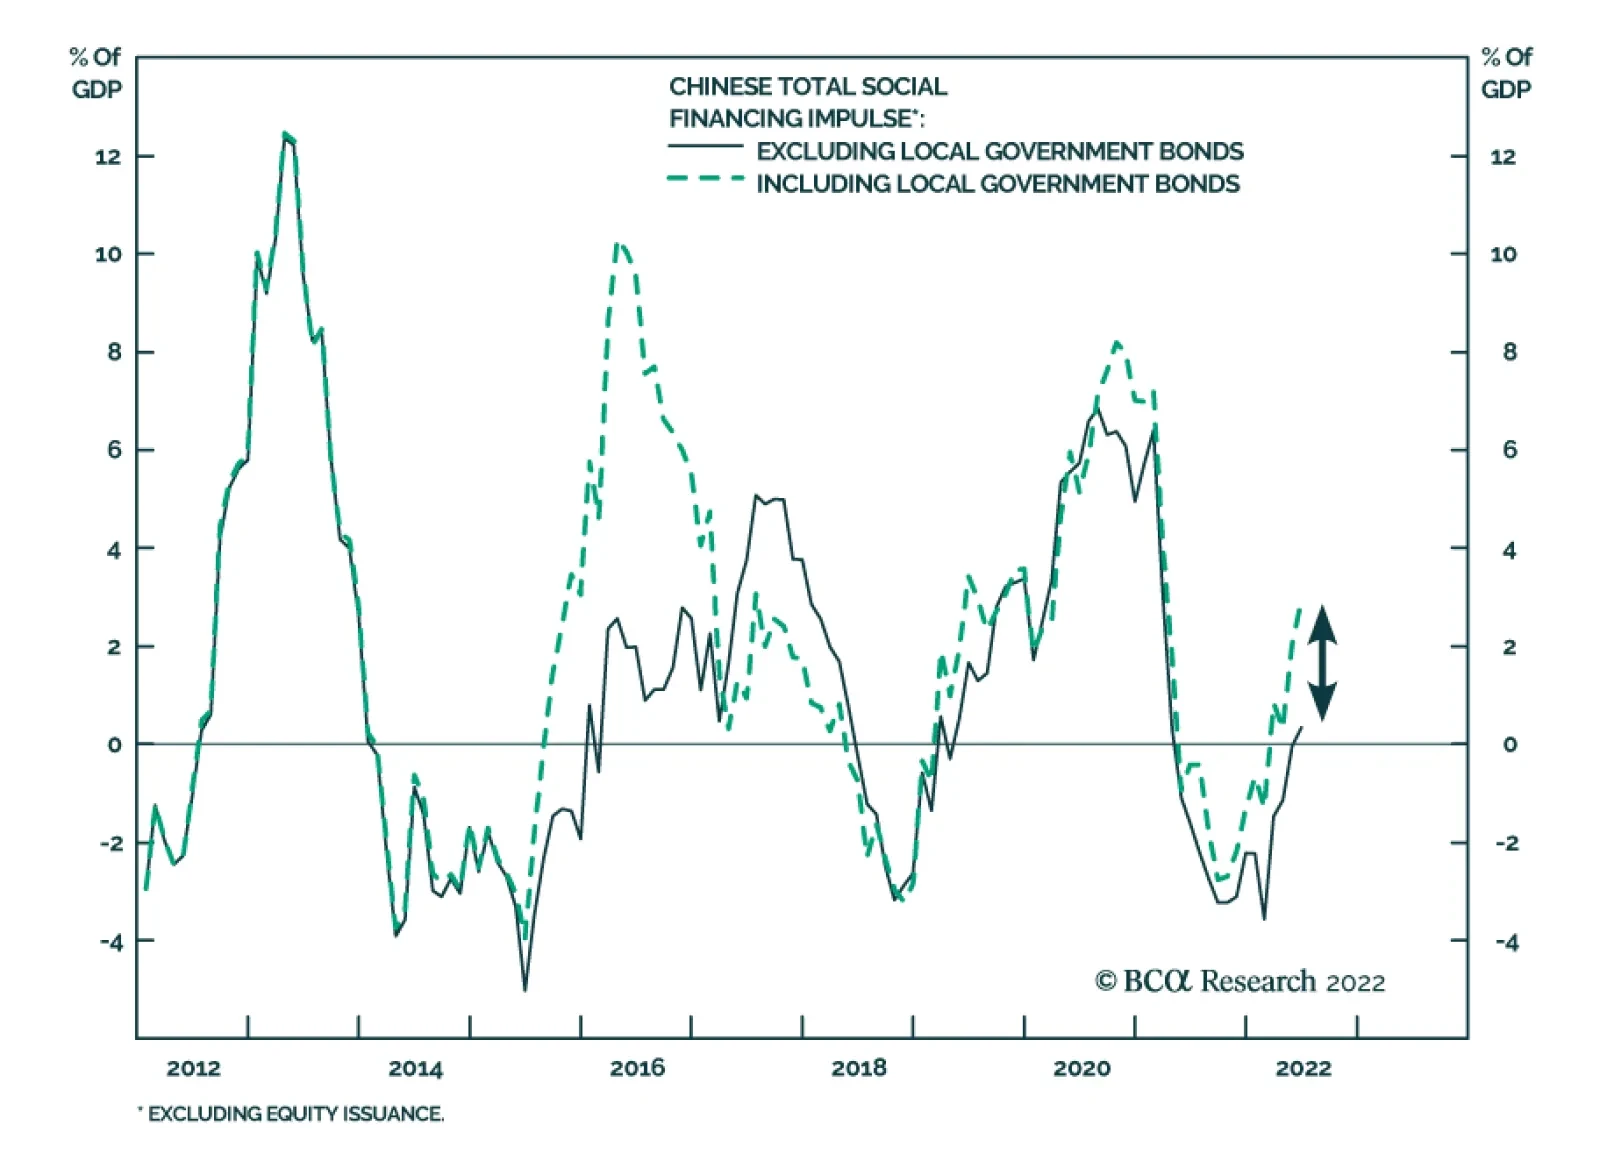
On the whole, there will be very little new funding available to boost infrastructure spending beyond what has been approved by the 2022 National People’s Congress (NPC) earlier this year. Chart 4The Credit And Fiscal Impulse Will Be Moderate
The Credit And Fiscal Impulse Will Be Moderate
The Credit And Fiscal Impulse Will Be Moderate
Hence, for this full year, there is no change to the aggregate fiscal spending impulse that incorporates central and local government budgetary spending as well as managed funds’ expenditures (Chart 4, top panel). The two scenarios for the non-government credit impulse are shown in the middle panel of Chart 4. The optimistic scenario assumes non-government credit will accelerate to 9.5% from 8.7%, and the pessimistic scenario is based on no acceleration in non-government credit growth. Finally, the bottom panel of Chart 4 illustrates the projections for the combined credit and fiscal spending impulse for the remainder of this year. Although the aggregate fiscal and credit impulse is non-trivial, it is smaller than those in 2020, 2016, 2013, and 2009. Bottom Line: The government has announced RMB 1.1 trillion in infrastructure funding and will likely raise the LG special bond quota by RMB 1.5 trillion. Yet, this RMB 2.6 trillion financing will only offset the shortfall in infrastructure financing from plunging land transfer revenue. In brief, there is little new stimulus for infrastructure beyond what has been approved in the budget plan from early this year. Economic Headwinds Chart 5China's Reopening Rebound
China's Reopening Rebound
China's Reopening Rebound
Economic activity in China has rebounded following the reopening of the economy. Chart 5 illustrates that high-frequency data, such as car sales, house sales, commercial truck cargo, and steel production have all recently improved. We expect the one-off renormalization of economic activity following the lockdowns in April and May to give way to more subdued growth. The reason is that the mainland economy is facing several major headwinds: The real estate market is unlikely to recover meaningfully given the “three red lines” policy has not been eased, and many of property market excesses have not been purged. Hence, the question remains whether the Chinese economy can stage a robust recovery without the participation of the property market. We doubt it can because of the vital role that real estate has played in the economy in the past 20 years as the result of its large share in GDP and its impact on consumer and business sentiment. Since 2008, there has been no business cycle recovery in China without the property market firing on all cylinders (Chart 6). Chart 6All Economic Recoveries Were Accompanied By A Revival In The Property Market
All Economic Recoveries Were Accompanied By A Revival In The Property Market
All Economic Recoveries Were Accompanied By A Revival In The Property Market
Chart 7China: The Willingness To Spend And Invest Is Very Low
China: The Willingness To Spend And Invest Is Very Low
China: The Willingness To Spend And Invest Is Very Low
Rolling lockdowns will likely persist. This will weigh on household and private business confidence. Diminishing confidence will undermine the willingness to spend, invest, and hire. Our marginal propensity to spend indicators for households & enterprises remain very depressed (Chart 7). Low propensity to spend entails that the multiplier effect of fiscal and credit stimulus will be lower in this cycle than in the previous ones. Not only is the credit and fiscal impulse smaller than in the previous cycles but also the multiplier will be lower. This will hinder the recovery in domestic demand. Finally, Chinese exports are set to contract in H2 2022 because of shrinking demand for consumer goods (ex-autos) in the US and Europe as well as mainstream EM. Bottom Line: After the one-off rebound in economic activity following the lockdowns in April and May, the business cycle recovery will be more U shaped rather than V shaped. Investment Conclusions For absolute-return investors, neither A-shares nor investable stocks offer an attractive risk-reward profile. Within the A-share market, our strongest conviction is to overweight interest rate-sensitive sectors like consumer staples, utilities, and healthcare. Consumer discretionary stocks should also be a slight overweight now. We continue to recommend a neutral allocation to Chinese A-shares and an underweight allocation to investable stocks within a global equity portfolio. Relative to the EM equity benchmark, investors should continue to overweight A-shares and remain neutral on investable Chinese stocks. Maintain the long A-shares / short offshore investable stocks position. The yuan, like all other emerging Asian currencies, is still facing near-term downside risk versus the US dollar. Chinese onshore government bond yields will likely drop further. Arthur Budaghyan Chief Emerging Markets Strategist arthurb@bcaresearch.com Strategic Themes Cyclical Recommendations
A decision is expected shortly on whether President Joe Biden will roll back some of the Trump-era tariffs on imports from China. Voices within President Biden’s administration are divided. US Treasury Secretary Janet Yellen is among those in favor of…
Chinese credit data suggest that credit demand rebounded in June. Aggregate financing surged to CNY 5.2tr from CNY 2.8tr in May, significantly above expectations of CNY 4.2tr. Similarly, new loans rose to CNY 2.8tr from CNY 1.9tr. All three measures of money…
Reports out of China suggesting that the Ministry of Finance is considering allowing local governments to bring forward 1.5 trillion yuan ($220 billion) of next year’s special bond issuance to the second half of this year catalyzed a rally in global China…
Executive Summary Caught In Risk-Off Selling
Copper Testing Support
Copper Testing Support
Weak Chinese and European economies are suppressing copper demand and helping to temper prices in a market that remains fundamentally tight. Weaker US GDP growth could put the three largest economies in the world in or close to recession in 2H22/1H23, which would contribute to demand-side weakness in copper markets. The odds manufacturing and base-metals refining will be curtailed in Europe are rising. Although a strike in Norway has been averted by government intervention, maintenance on Russia’s Nord Stream 1 pipeline scheduled to begin next week likely will serve as a pretext for longer and deeper natgas supply cuts to the EU. Bottom Line: Despite fundamental tightness in global copper markets, prices are being restrained by fears weaker Chinese and European economic performance will lead to a global recession. Early reads of US GDP pointing to negative growth in 2Q22 stoke these fears. Heightened economic policy uncertainty globally exacerbates them. We remain fundamentally bullish copper and will re-establish our long SPDR S&P Metals & Mining ETF (XME) – down ~ 40% from its highs in April – at tonight’s close. In addition, we went long the XOP oil and gas ETF at Tuesday’s close, after prompt Brent breached the buy-trigger we set last week of $105/bbl during this week’s crude-oil sell-off. Feature Lower GDP growth expectations in China and the EU – along with a wobbly US economy being flagged by an Atlanta Fed GDPNow forecast pointing to negative growth in 2Q22 – are stoking fears of a global manufacturing and industrial recession. This prompted a rout in industrial commodities – base metals and oil – this week, which still has markets on edge. This slow-down in the world’s three largest economies – accounting for almost 50% of global GDP expressed in purchasing-power terms – is the only thing keeping the level of global copper demand close to supply at present (Chart 1).1 At least for the time being, this is keeping the threat of sharply higher copper prices, which would be more in line with the low levels of supplies and inventories globally, at bay (Chart 2). As of the week ended May 27th, global copper stocks stood at just above 562k tons, which is ~ 31% lower y/y. Chart 1World’s Biggest Economies Slowing
Copper Prices Decouple From Fundamentals
Copper Prices Decouple From Fundamentals
Chart 2Copper Prices Disconnect From Fundamentals
Copper Prices Disconnect From Fundamentals
Copper Prices Disconnect From Fundamentals
Uncertainty Weakens Copper Prices Energy and metals markets remain extremely tight on a fundamental supply-demand basis.2 The sharp sell-off this week in oil and metals prices is, in our view, evidence industrial-commodity prices have decoupled from fundamentals. This makes traders – hedgers and speculators – extremely risk-averse, which reduces liquidity and increases volatility. On the back of these concerns, markets exhibit the sort of volatility associated with economic collapse, despite still-strong underlying fundamentals. Chart 3Rising Global Policy Uncertainty
Copper Prices Decouple From Fundamentals
Copper Prices Decouple From Fundamentals
Volatility is on the rise due to increasing economic uncertainty in these markets. This makes it extremely difficult to assign probabilities to different price outcomes (i.e., true uncertainty). The BBD Global Economic Policy Uncertainty is approaching levels seen during the early pandemic (Chart 3). We put this rising uncertainty down to poor policy and communication from central banks and governments; a pig’s breakfast of energy policy globally that increasingly adds nothing but confusion to markets; and a muddled public-health policy in China, which produces random shut-downs in global supply chains as covid infections randomly crop up in important port cities. Lastly, the East and West are moving toward a new Cold War, which already is having profound effects on all markets, trade flows and capital availability in the short- and medium-term. This keeps markets on edge and forces them to parse every geopolitical development that hits the tape.3 Re-forging supply chains, re-building basic industrial infrastructure as the West moves away from outsourcing to China and other EM states will be costly and volatile, especially as embargoes and sanctions increase between these blocs. This political and economic evolution will require increased investment in base metals production and exploration, along with similar commitments to oil and gas. Low and volatile prices will not support this, as they disincentivize investment, and set markets up for continued shortage and scarcity going forward. In the metals markets, years of underinvestment by major mining companies will keep copper supplies and inventories tight going forward (Chart 4). This will hinder and delay the global renewable-energy transition, which cannot be realized without higher base-metals supplies. Chart 4Structural Underinvestment In Mining Fundamentally Bullish Copper
Copper Prices Decouple From Fundamentals
Copper Prices Decouple From Fundamentals
Recession Fears Haunt Metals Globally … The proximate causes of the persistent weakening of copper prices is the demand destruction arising from the lockdown in China, and an increasing concern over the economic prospects of the EU as it prepares for a possible shut-off of Russian natgas exports. Should Russian supplies be cut off, the EU will be pushed into recession as natural-gas rationing – and the attendant prioritization of human needs going into winter – will constrict economic activity, particularly in manufacturing. This leaves two of the three largest economies in the world either in recession or not growing at all. Added to this is the fear of a wobbly US economy, which has been slowed by higher energy prices and the Fed’s hawkish tightening of monetary policy. The Atlanta Fed’s GDPNow forecast for 2Q22 estimates a 2.1% contraction in US GDP. This would be the second consecutive quarter of negative growth and would meet a widely held rule-of-thumb indicator or recession.4 In our modelling, we estimate the income elasticity of copper demand in DM economies like the EU and US (1.39) and EM-ex-China (0.87) states is higher than that of China (0.37). This means that a 1% contraction in p.a. Chinese real GDP would translate to a 0.37% p.a. fall in copper demand, all else equal. A contraction of real incomes – i.e., real GDP – in the EU and EM-ex-China will cause a larger relative adjustment in copper demand than in China, even though the level of copper demand in China is far greater in absolute terms (Chart 5). A recession in the EU will reduce import demand for China’s manufactured output in these markets (Chart 6). As China’s trade volumes fall, Chinese manufacturing PMIs will contract. Similarly, exports to China from the EU will weaken as manufacturing weakens and real GDP moves lower. We believe this will put more pressure on the Chinese government to provide fiscal and monetary stimulus to counter such a downdraft. Chart 5Copper Demand Sensitive to Real GDP (Income)
Copper Demand Sensitive to Real GDP (Income)
Copper Demand Sensitive to Real GDP (Income)
Chart 6Trade Channel Effects Follow GDP Weakness
Trade Channel Effects Follow GDP Weakness
Trade Channel Effects Follow GDP Weakness
… But China Worries Dominate The Chinese economy is showing signs of further slowing.5 Weakness in credit levels, infrastructure investment, manufacturing, the property sector, and exports all indicate the covid-policy lockdowns, high commodity prices, and parsimonious credit and fiscal policies have produced a dramatic slowing in economic activity. In our modelling, we find evidence that each of these components exhibits a long-run inverse relationship with Chinese copper inventories, which in turn exhibits a long-run inverse relationship with COMEX copper prices. Roughly 10 days after the initial Shanghai lockdown, copper prices went into contango (Chart 7). This occurred despite continuous declines in Chinese copper inventories during the lockdown months (Chart 8). Such anomalous behavior – i.e., as inventories fall markets become more backwardated – makes it difficult to connect prices and supply-demand-inventory fundamentals. Chart 7Copper In Contango For Most Of China’s Lockdown
Copper In Contango For Most Of Chinas Lockdown
Copper In Contango For Most Of Chinas Lockdown
Chart 8Chinese Copper Inventories Continue To Draw In Lockdown
Chinese Copper Inventories Continue To Draw In Lockdown
Chinese Copper Inventories Continue To Draw In Lockdown
BCA’s China Investment Strategy expects a muted 2H22 recovery for the Chinese economy. Rolling lockdowns due to China’s COVID policy will reduce the potency of fiscal and monetary stimulus. The stop-start nature of economic activity will stymie growth in disposable income and job creation, which in turn will translate to weaker aggregate demand. The knock-on effect of weaker business activity due to the lockdown earlier this year has been a higher propensity to save by households (Chart 9). Household surveys conducted by the PBoC show that, since 2017, household savings have been increasing, suggesting a precautionary sentiment (Chart 10). Chart 9Chinese Economic Slowdown Reduced Credit Demand
Chinese Economic Slowdown Reduced Credit Demand
Chinese Economic Slowdown Reduced Credit Demand
Chart 10Rising Precautionary Savings...
Rising Precautionary Savings...
Rising Precautionary Savings...
Chart 11...Will Impact Domestic Property Market
...Will Impact Domestic Property Market
...Will Impact Domestic Property Market
We do not expect the property market to recover in a manner similar to what occurred following China’s re-opening after the first wave of the COVID-19 pandemic. Depressed household purchasing power will keep housing demand subdued, while the “three red lines” policy, which limits the amount property developers can borrow, will keep supply low (Chart 11).6 Housing accounts for ~ 30% of copper consumption in China, which means weak property markets will remain a drag on copper demand. Investment Implications Continued weakness in China’s economy and a potentially deep recession in the EU will continue to restrain demand for copper globally. In addition, with the US economy looking wobbly, the third global pillar of economic strength also will be weakening going into 2H22. These fundamental demand-side effects will lower pressure on tight copper inventories and keep prices subdued, in our view. This does not, however, signal an all-clear for copper supply or inventory tightness. Weaker demand is the only thing keeping prices from rising sharply, given the tight supply and inventory position of global copper markets. On the supply side, governance issues in copper-rich Latin American states, which are in the process of revising their social contracts with copper producers and consumers, will increase mining costs for companies, disincentivizing long-term and large-scale investments in new mines.7 These costs ultimately will be borne by consumers as supply shortages mount and the need to increase capex grows. Ultimately, this will feed into longer-term inflation and inflation expectations. Chart 12Caught In Risk-Off Selling
Copper Testing Support
Copper Testing Support
We remain long-term bullish copper, as fundamentals remain tight and will get tighter. That said, over the short term, aggregate-demand weakness in the three major economic pillars in the world makes us leery of getting long copper futures, particularly as prompt COMEX prices test support (Chart 12). Persistently weak copper prices will disincentivize the needed investment in new supply the world will need to effect a transition to renewable energy in coming decades. For this reason, we are comfortable re-establishing our long XME metals and mining ETF at tonight’s close, as copper prices are down 40% from their April highs. Robert P. Ryan Chief Commodity & Energy Strategist rryan@bcaresearch.com Ashwin Shyam Research Analyst Commodity & Energy Strategy ashwin.shyam@bcaresearch.com Paula Struk Research Associate Commodity & Energy Strategy paula.struk@bcaresearch.com Commodity Round-Up Energy: Bullish. A strike by Norwegian energy-sector workers that would have hit the natural gas market in Europe particularly hard was averted earlier this week.8 This still leaves the EU and UK (Europe) at risk of additional losses of Russian natgas exports beginning next week when Nord Stream 1 (NS1) maintenance is due to start. These threats have pushed Dutch Title Transfer Facility (TTF) natural gas prices up close to 93% since 1 June, and close to 400% y/y as of Tuesday. For the first five months of this year, Europe’s been importing just under 15 Bcf/d of LNG, with ~ 8.5 Bcf/d of those volumes coming from the US, based on EIA data. The EIA expects US LNG exports to average ~ 11.9 Bcf/d this year and 12 Bcf/d in 2023. Europe accounted for just under 75% of US exports in January – April of this year, and we expect that to continue going forward. The IEA expects Russia to supply 25% of EU demand this year, the lowest in 20 years. Last year, Russian imports covered ~ 40% (~ 7 TCF) of EU demand. Base Metals: Zinc stocks are depleted but prices are dropping on recession fears (Chart 13). Smelting operations were hit last year following the power-supply crunches in China and Europe. While China has recovered its energy security, Europe, which accounts for ~15% of global refined zinc supply, has not. Reduced natgas supply from Russia will make the smelting shortage in Europe even more acute, especially if power and fuel rationing occur. In April, China was a net exporter of zinc for the first time since 2014, as low demand in the state and low European zinc supply incentivized Chinese smelters to ship metal to the West despite high outbound tariffs. Precious Metals: Markets switched from inflation to growth fears, as central banks, notably the Fed began hiking interest rates aggressively to curb inflation. Investors have been flocking to the USD, which hit a 20-year high on recession fears this week (Chart 14). This has happened at the expense of the yellow metal, which, since breaking through the USD 1800/oz mark last week, has continued to drop, hitting an 8-month low as of yesterday's close. Chart 13Global Copper Inventories Remain Tight
Global Copper Inventories Remain Tight
Global Copper Inventories Remain Tight
Chart 14
Copper Prices Decouple From Fundamentals
Copper Prices Decouple From Fundamentals
Footnotes 1 Please see China, US and EU are the largest economies in the world, which was published by Eurostat 19 May 2020. 2 For additional discussion of oil-market fundamentals, please see Recession Unlikely To Batter Oil Prices, which covers our expectation for global oil balances and prices. It was published 16 June 2022. 3 Please see Hypo-Globalization (A GeoRisk Update) published by BCA Research’s Geopolitical Strategy 30 July 2021. See also Commodities' Watershed Moment, which we published 22 March 2022. 4 Please see GDPNow, published by the Federal Reserve Bank of Atlanta 1 July 2022. 5 Please see Third Quarter Geopolitical Outlook: Thunder And Lightning, published by BCA’s Geopolitical Strategy 24 June 2022. This report notes, “China’s political crackdown, struggle with Covid-19, waning exports, and deflating property market have led to an abrupt slowdown this year. The government is responding by easing monetary, fiscal, and regulatory policy, though so far with limited effect … . Economic policy will not be decisive in the third quarter unless a crash forces the administration to stimulate aggressively.” 6 In August 2020, the Ministry of Housing and Urban-Rural Development and the People’s Bank of China proposed to implement a policy which kept a ceiling on companies’ asset to liability ratio at 70%, net debt to equity ratio at 100%, and cash to short-term borrowings ratio at 1. Developers whose liabilities are within these requirements may increase their liabilities by less than 15%. These were known as the “three red lines.” Per that policy, if one or more of these ceilings are surpassed, maximum liabilities growth is capped at a lower percentage. 7 Please see Add Local Politics To Copper Supply Risks, which we published 25 November 2021. It is available at ces.bcaresearch.com. See also Chile sticks to plan for new mining profit tax up to 32% linked to copper price, published by reuters.com via mining.com 1 July 2022. 8 Please see Norway’s government halts oil and gas strike published by ft.com 5 July 2022. Investment Views and Themes Strategic Recommendations Tactical Trades Trades Closed In 2022
Executive Summary Buying a home is now more expensive than renting in many parts of the world. In the US and UK, disappearing homebuyers combined with a flood of home-sellers will weigh on home prices over the next 6-12 months. Falling employment and falling house prices risk becoming a self-reinforcing negative feedback loop that turns a mild recession into a severe recession. To stop such a vicious cycle running out of control, policymakers will eventually bring down mortgage rates. For this reason, on a time horizon of 6-12 months, overweight bonds. A collapse in Chinese property development and construction activity will have negative long-term implications for commodities, emerging Asia, and developing countries that produce raw materials. Structurally underweight. On the other hand, stay structurally overweight the China 30-year government bond. Fractal trading watchlist: US Biotech versus Utilities. Buying A Home Is Now More Expensive Than Renting!
Buying A Home Is Now More Expensive Than Renting!
Buying A Home Is Now More Expensive Than Renting!
Bottom Line: The decade-long global housing boom is over. Feature For the first time since 2018, the number of Brits wanting to buy a home is less than the number of Brits wanting to sell their home. The balance of homebuyers versus homes for sale is the main driver of any housing market. When multiple homebuyers are competing for a home for sale, the subsequent bidding war puts upward pressure on house prices. But when, multiple homes for sale are competing for a homebuyer, the subsequent discounting war puts downward pressure on house prices. The balance of homebuyers versus homes for sale is the main driver of any housing market. This makes the number of homebuyers versus homes for sale the best leading indicator of house prices. The recent collapse of this leading indicator in the UK warns that UK house prices are likely to soften through the remainder of 2022 and into 2023 (Chart I-1). Chart I-1With Fewer UK Homebuyers Than UK Home-Sellers, UK House Prices Are Set To Drop
With Fewer UK Homebuyers Than UK Home-Sellers, UK House Prices Are Set To Drop
With Fewer UK Homebuyers Than UK Home-Sellers, UK House Prices Are Set To Drop
Homebuyers Are Disappearing While Home-Sellers Are Flooding The Market Disappearing homebuyers combined with a flood of home-sellers is also evident in the US. According to Realtor.com: “Weary US homebuyers face not only sky-high home prices but also rising mortgage rates, and that financial double whammy is hitting homebuyers hard: Compared with just a year ago, the cost of financing 80 percent of a typical home rose 57.6 percent, amounting to an extra $745 per month.” Compared with just a year ago, the cost of financing 80 percent of a typical US home rose 57.6 percent, amounting to an extra $745 per month. Unsurprisingly, US mortgage applications for home purchase have recently plunged by a third (Chart I-2) and homebuyer demand has declined by 16 percent since last June.1 Meanwhile, the inventory of homes actively for sale on a typical day in June has increased by 19 percent, the largest increase in the data history. Chart I-2With The Cost Of Financing A US Home Purchase Surging, Mortgage Applications Have Collapsed
With The Cost Of Financing A US Home Purchase Surging, Mortgage Applications Have Collapsed
With The Cost Of Financing A US Home Purchase Surging, Mortgage Applications Have Collapsed
The flood of new homes on the market means that the dwindling pool of homebuyers will have more negotiating leverage on the asking price (Chart I-3 and Chart I-4). This will balance the highly lopsided negotiating dynamics in the raging seller’s market of the past two years. The shape of things to come can be seen in Austin, Texas, which was one of the hottest markets during the early pandemic real estate frenzy. Chart I-3US Homebuyers Are Disappearing...
US Homebuyers Are Disappearing...
US Homebuyers Are Disappearing...
Chart I-4...While US Home-Sellers Are Flooding The Market
...While US Home-Sellers Are Flooding The Market
...While US Home-Sellers Are Flooding The Market
“Prices are definitely starting to go down again… last Friday, an Austin home was listed at $825,000. The next day, at the open house, no one came. A few months ago, there would have been 20 or more buyers showing up. The sellers didn’t want to test the market, so on Sunday, they dropped it to $790,000. It sold for $760,000.” Buying A Home Is Now More Expensive Than Renting The nub of the problem for homebuyers is that the mortgage rate is higher than the rental yield. In simple terms, buying a home is now more expensive than renting (Chart I-5). The housing bulls counter that the high mortgage rate will force rental yields to adjust upwards by rents going up, but this argument is flawed. Chart I-5Buying A Home Is Now More Expensive Than Renting!
Buying A Home Is Now More Expensive Than Renting!
Buying A Home Is Now More Expensive Than Renting!
The most important driver of rent inflation is the unemployment rate (inversely). Because, to put it bluntly, you need a steady job to pay the rent! Today, the Federal Reserve’s inflation problem, in a nutshell, is that rent inflation is too high even versus the tight jobs market (Chart I-6). Chart I-6The Fed Needs To Push Up Unemployment To Pull Down Rent Inflation
The Fed Needs To Push Up Unemployment To Pull Down Rent Inflation
The Fed Needs To Push Up Unemployment To Pull Down Rent Inflation
Although the Fed cannot say this explicitly, its mechanism to bring down inflation is to push up unemployment, and thereby to pull down rent inflation, which constitutes almost half of the core inflation basket. In this case, the rental yield (rent divided by house price) would adjust upwards by the denominator – house prices – going down. The most important driver of rent inflation is the unemployment rate (inversely). Yet the housing bulls also argue that the housing boom is the result of a structural undersupply of homes. They claim that as this structural undersupply persists, it will underpin house prices. But this ‘housing shortage’ narrative is another myth, which we can debunk with two simple observations. Through the past decade, home prices have risen simultaneously and exponentially everywhere in the world. Now ask yourself, is it plausible that there could be a structural undersupply of homes everywhere in the world at the precisely the same time? If this doesn’t debunk the housing shortage narrative, then try this second observation. Through the past decade, gross rents have tracked nominal GDP. Theory says that gross rents should track nominal GDP, because the quality of the housing stock improves broadly in line with GDP, and therefore so too should rents. If there really was a structural undersupply of housing, then gross rents would be structurally outperforming nominal GDP. But that hasn’t happened in any major economy (Chart I-7). Chart I-7Rents Have Tracked GDP, So There Is No 'Structural Undersupply' Of Homes
Rents Have Tracked GDP, So There Is No 'Structural Undersupply' Of Homes
Rents Have Tracked GDP, So There Is No 'Structural Undersupply' Of Homes
As an aside, if rents track GDP, then why do they constitute almost half of the core inflation basket? The answer is that the rents included in inflation are ‘hedonically adjusted’, meaning that are supposedly deflated for quality improvements – though there is always a niggling doubt whether the statisticians do this adjustment correctly! Pulling all of this together, the synchronized global housing boom of the past decade was not the result of a structural undersupply. Instead, it was the result of a valuation boom – meaning, plummeting rental yields, which in turn were the result of plummeting mortgage rates, which in turn were the result of plummeting bond yields. But now that mortgage rates are much higher than rental yields, this ‘virtuous’ cycle risks turning vicious. Falling employment and falling house prices risk becoming a self-reinforcing negative feedback loop that turns a mild recession into a severe recession. To stop such a vicious cycle running out of control, policymakers will eventually have no other choice than to bring down mortgage rates. For this reason, on a time horizon of 6-12 months, overweight bonds. But The Prize For The Biggest Housing Boom Goes To… China The housing booms in the UK, US and other Western economies, extreme as they are, are small fry compared to the housing boom in China. Chinese real estate, now worth $100 trillion, is by far the largest asset-class in the world. And Chinese rental yields, at around 1 percent, are well below the yield on cash. Begging the question, how can Chinese real estate valuations be in such stratospheric territory, with a yield even less than that on ‘risk-free’ cash? The simple answer is that investors have been led to believe that Chinese real estate is a risk-free investment! Without a social safety net and with limited places to park their money, Chinese savers have for years been encouraged to buy homes, in the widespread belief that property is the safest investment, whose price is only supposed to go up (Chart I-8). Chart I-8Chinese Real Estate Is Perceived To Be A 'Risk Free' Investment
Chinese Real Estate Is Perceived To Be A 'Risk Free' Investment
Chinese Real Estate Is Perceived To Be A 'Risk Free' Investment
With the bulk of Chinese households’ wealth in property acting as a perceived economic safety net, even a 10 percent decline in house prices would constitute a major shock to the household sector’s hopes and expectations of what property is. In turn, the ensuing ‘negative wealth effect’ would be catastrophic for household spending in the world’s second largest economy. Therefore, in contrast to the US housing debacle in 2008, the Chinese government will ensure that its property market adjustment does not come from a collapse in home prices. Rather, it will come from a collapse in property development and construction activity, combined with keeping interest rates structurally low. This will have negative long-term implications for commodities, emerging Asia, and developing countries that produce raw materials. Structurally underweight. On the other hand, Chinese bonds are an excellent investment for those investors who can accept the capital control risks. Stay structurally overweight the China 30-year government bond. Fractal Trading Watchlist Biotech and Utilities are both defensive sectors, based on the insensitivity of theirs profits to economic fluctuations. But whereas Biotech is ‘long duration’, Utilities is ‘shorter duration’. Over the coming months, as the economy falters and bond yields back down, long duration defensives, such as Biotech, are likely to be the winners. This is supported by the recent underperformance reaching the point of fractal fragility that has indicated previous major turning points (Chart I-9). The recommended trade is long US Biotech versus Utilities, setting a profit target and symmetrical stop-loss at 20 percent. This replaces our long US Biotech versus Tech position, which achieved its 17.5 percent profit target, and is now closed. Chart I-9Biotech Is Set To Be A Big Winner
Biotech Is Set To Be A Big Winner
Biotech Is Set To Be A Big Winner
Chart 1CNY/USD Has Reversed
CNY/USD Has Reversed
CNY/USD Has Reversed
Chart 2US REITS Are Oversold Versus Utilities
US REITS Are Oversold Versus Utilities
US REITS Are Oversold Versus Utilities
Chart 3CAD/SEK Reversal Has Started
CAD/SEK Reversal Has Started
CAD/SEK Reversal Has Started
Chart 4Financials Versus Industrials To Reverse
Financials Versus Industrials To Reverse
Financials Versus Industrials To Reverse
Chart 5The Outperformance Of Resources Versus Biotech Has Started To Reverse
The Outperformance Of Resources Versus Biotech Has Started To Reverse
The Outperformance Of Resources Versus Biotech Has Started To Reverse
Chart 6The Outperformance Of Resources Versus Healthcare Is Vulnerable To Reversal
The Outperformance Of Resources Versus Healthcare Is Vulnerable To Reversal
The Outperformance Of Resources Versus Healthcare Is Vulnerable To Reversal
Chart 7FTSE100 Outperformance Vs. Euro Stoxx 50 Is Reversing
FTSE100 Outperformance Vs. Euro Stoxx 50 Is Reversing
FTSE100 Outperformance Vs. Euro Stoxx 50 Is Reversing
Chart 8Netherlands Underperformance Vs. Switzerland Has Been Exhausted
Netherlands Underperformance Vs. Switzerland Has Been Exhausted
Netherlands Underperformance Vs. Switzerland Has Been Exhausted
Chart 9The Sell-Off In The 30-Year T-Bond Is Approaching Fractal Fragility
The Sell-Off In The 30-Year T-Bond Is Approaching Fractal Fragility
The Sell-Off In The 30-Year T-Bond Is Approaching Fractal Fragility
Chart 10The Sell-Off In The NASDAQ Is Approaching Fractal Fragility
The Sell-Off In The NASDAQ Is Approaching Fractal Fragility
The Sell-Off In The NASDAQ Is Approaching Fractal Fragility
Chart 11Food And Beverage Outperformance Has Been Exhausted
Food And Beverage Outperformance Has Been Exhausted
Food And Beverage Outperformance Has Been Exhausted
Chart 12AT REVERSAL
AT REVERSAL
AT REVERSAL
Chart 13AT REVERSAL
AT REVERSAL
AT REVERSAL
Chart 14The Strong Trend In The 18-Month-Out US Interest Rate Future Is Fragile
The Strong Trend In The 18-Month-Out US Interest Rate Future Is Fragile
The Strong Trend In The 18-Month-Out US Interest Rate Future Is Fragile
Chart 15The Strong Trend In The 3 Year T-Bond Is Fragile
The Strong Trend In The 3 Year T-Bond Is Fragile
The Strong Trend In The 3 Year T-Bond Is Fragile
Chart 16A Potential Switching Point From Tobacco Into Cannabis
A Potential Switching Point From Tobacco Into Cannabis
A Potential Switching Point From Tobacco Into Cannabis
Chart 17Biotech Is A Major Buy
Biotech Is A Major Buy
Biotech Is A Major Buy
Chart 18Norway's Outperformance Could End
Norway's Outperformance Could End
Norway's Outperformance Could End
Chart 19Cotton's Outperformance Is Vulnerable To Reversal
Cotton's Outperformance Is Vulnerable To Reversal
Cotton's Outperformance Is Vulnerable To Reversal
Chart 20Fractal Trading Watch List
Fractal Trading Watch List
Fractal Trading Watch List
Chart 21The Rally In USD/EUR Could End
The Rally In USD/EUR Could End
The Rally In USD/EUR Could End
Chart 22The Outperformance Of MSCI Hong Kong Versus China Is Vulnerable To Reversal
The Outperformance Of MSCI Hong Kong Versus China Is Vulnerable To Reversal
The Outperformance Of MSCI Hong Kong Versus China Is Vulnerable To Reversal
Chart 23A Potential New Entry Point Into Petcare
A Potential New Entry Point Into Petcare
A Potential New Entry Point Into Petcare
Chart 24GBP/USD At A Turning Point
GBP/USD At A Turning Point
GBP/USD At A Turning Point
Chart 25Fractal Trading Watch List
Fractal Trading Watch List
Fractal Trading Watch List
Chart 26Fractal Trading Watch List
Fractal Trading Watch List
Fractal Trading Watch List
Dhaval Joshi Chief Strategist dhaval@bcaresearch.com Footnotes 1 Realtor.com gauge homebuyer demand by so-called ‘pending listings’, the number of listings that are at various stages of the selling process that are not yet sold. Fractal Trading System Fractal Trades
The Global Housing Boom Is Over, As Buying Becomes More Expensive Than Renting
The Global Housing Boom Is Over, As Buying Becomes More Expensive Than Renting
The Global Housing Boom Is Over, As Buying Becomes More Expensive Than Renting
The Global Housing Boom Is Over, As Buying Becomes More Expensive Than Renting
6-12 Month Recommendations Structural Recommendations Closed Fractal Trades Indicators To Watch - Bond Yields Chart II-1Indicators To Watch - Bond Yields - Euro Area
Indicators To Watch - Bond Yields - Euro Area
Indicators To Watch - Bond Yields - Euro Area
Chart II-2Indicators To Watch - Bond Yields - Europe Ex Euro Area
Indicators To Watch - Bond Yields - Europe Ex Euro Area
Indicators To Watch - Bond Yields - Europe Ex Euro Area
Chart II-3Indicators To Watch - Bond Yields - Asia
Indicators To Watch - Bond Yields - Asia
Indicators To Watch - Bond Yields - Asia
Chart II-4Indicators To Watch - Bond Yields - Other Developed
Indicators To Watch - Bond Yields - Other Developed
Indicators To Watch - Bond Yields - Other Developed
Indicators To Watch - Interest Rate Expectations Chart II-5Indicators To Watch - Interest Rate Expectations
Indicators To Watch - Interest Rate Expectations
Indicators To Watch - Interest Rate Expectations
Chart II-6Indicators To Watch - Interest Rate Expectations
Indicators To Watch - Interest Rate Expectations
Indicators To Watch - Interest Rate Expectations
Chart II-7Indicators To Watch - Interest Rate Expectations
Indicators To Watch - Interest Rate Expectations
Indicators To Watch - Interest Rate Expectations
Chart II-8Indicators To Watch - Interest Rate Expectations
Indicators To Watch - Interest Rate Expectations
Indicators To Watch - Interest Rate Expectations
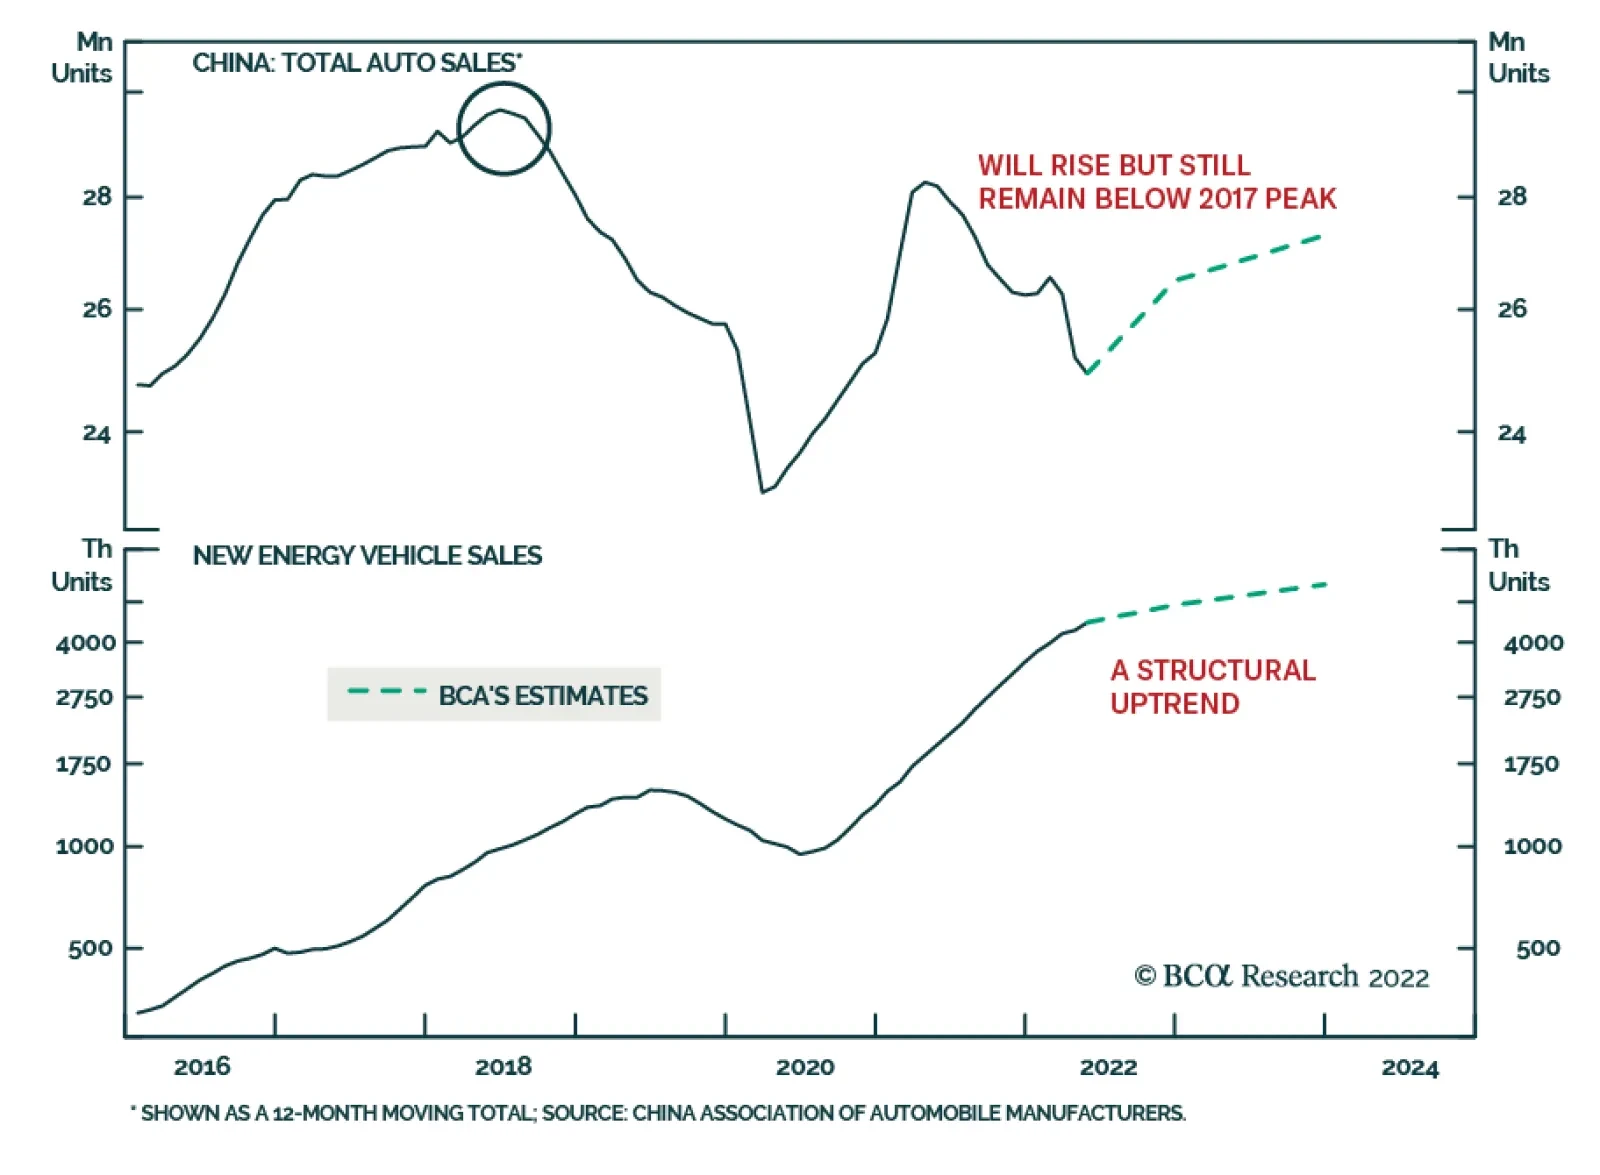
According to BCA Research’s China Investment Strategy service, China’s auto sales are set to have a gradual recovery in 2022H2. The team expects auto sales to reach 26.2-26.8 million units by the end of this year, with new energy vehicles (NEVs) and…