China

Listen to a short summary of this report. Executive Summary US Lead On Mega-Sized Firms: Is A Peak Nigh?
America's Lead On Mega-Sized Companies: Is A Peak Nigh?
America's Lead On Mega-Sized Companies: Is A Peak Nigh?
The US has been the star protagonist of global equity markets for decades. It offers investors the rare combination of a big economy and a large universe of mega-sized listed companies. In fact, the overwhelming majority of the top 20 largest firms globally by revenue today are American. But can the US maintain this degree of presence on this list over the next decade? We think that this is unlikely. For starters, a decline in the US’s footprint could be driven by the fact that there is a peculiar stagnation in the works in the middle tier of American firms. Given that this tier acts as a talent pool for big firms, a stagnation here could mean that the US spawns fewer super-sized firms. The high market share commanded by big American firms could also end up being a liability. This dominance could bait regulatory attention, thereby affecting these firms’ growth prospects. Finally, slowing GDP growth in the US, as compared to its Asian peers, will prove to be another headwind that American firms must contend with. What should strategic investors do to prepare for this tectonic shift? We recommend reducing allocations to US equities over the long run since the US’s weight in global indices will peak soon (or may have already peaked). Bottom Line: Irrespective of what the Fed does (or does not do), the US’s footprint in the global league tables of big firms by revenue will weaken over the next decade. Strategic investors can profit from this change by reducing allocations to US equities while increasing allocations to China as well as a basket of countries including Korea, Japan, Taiwan, and Germany. Dear Client, This week, we are sending you a Special Report by Ritika Mankar, CFA, who will be writing occasional special reports for the Global Investment Strategy service on a variety of topical issues. Ritika makes the case that the US economy’s ability to spawn mega-sized companies may become increasingly compromised over the next decade. We will return to our regular publishing schedule next week. Best Regards, Peter Berezin, Chief Global Strategist US: Home To The Largest Number Of Big Listed Firms 2022 has been a turbulent year for US markets so far. But it is worth bearing in mind that the US has been the star protagonist of global equity markets for decades. This is because the US has offered investors a near-perfect trifecta constituting of: (1) A mega-sized economy; (2) A large universe of mega-sized listed companies; and (3) A track record of market outperformance. Specifically: Largest Economy: For over a century now, the US has been the largest economy in the world – a title it is expected to defend over the next few years (Chart 1). Large Listed Companies: The US’s high nominal GDP has also translated into high sales growth for its listed space. This, in turn, powered a great rise in the American equity market’s capitalization (Chart 2). In fact, the US’s market cap is so large today that it exceeds the cumulative market cap of the next four largest economies in the world, by a wide margin. So unlike Germany or China (which have large economies but small markets), the US has a large economy and is also home to some of the largest, most liquid stocks globally. Chart 1The US Will Remain The World’s Largest Economy For The Next Few Years
America's Lead On Mega-Sized Companies: Is A Peak Nigh?
America's Lead On Mega-Sized Companies: Is A Peak Nigh?
Chart 2The Listed Universe In The US Has Grown From Strength To Strength
America's Lead On Mega-Sized Companies: Is A Peak Nigh?
America's Lead On Mega-Sized Companies: Is A Peak Nigh?
Chart 3Growing Sales In The US Have Powered Its Outperformance Over The Past Decade
Growing Sales In The US Have Powered Its Outperformance Over The Past Decade
Growing Sales In The US Have Powered Its Outperformance Over The Past Decade
Long History of Outperformance: And most importantly, the US market has a strong track record of outperformance. US markets have outperformed global benchmarks over the past decade thanks largely to the rapid sales growth seen by American firms (Chart 3). Notwithstanding the US’s star role in global markets thus far, in this report we highlight that the US’s heft will likely decline over the next decade. The Fed may or may not administer recession-inducing rate hikes in 2022. But irrespective of what the Fed does over the next 12-to-24 months, the US’s loss of influence in global equity markets appears certain because it will be driven by structural forces. Chart 4US Lead On Mega-Sized Firms: Is A Peak Nigh?
America's Lead On Mega-Sized Companies: Is A Peak Nigh?
America's Lead On Mega-Sized Companies: Is A Peak Nigh?
Firstly, while behemoths such as Apple and Amazon have been attracting record investor attention, it is worth noting that the next tier of mid-sized American companies is no longer thriving as it used to. The reason why this matters is because history suggests that the pool of mid-sized companies acts as a superset for the big companies of tomorrow. So, if this talent pool is not booming today in the US, then there is likely to be repercussions tomorrow. Secondly, the US’s largest firms will have to contend with two structural headwinds over the next decade, namely increased regulatory attention and slowing growth. To complicate matters for American firms, competitors in Asia will not have this albatross around their neck. Hence, the US may remain the largest economy of the world a few years from now but is unlikely to be home to as many big, listed companies as it is today (Chart 4). The rest of this report quantifies the strength of these forces, and then concludes with actionable investment ideas. Trouble In The Talent Pool Chart 5The US Is Home To Nearly A Dozen Mega-Sized Firms Today
America's Lead On Mega-Sized Companies: Is A Peak Nigh?
America's Lead On Mega-Sized Companies: Is A Peak Nigh?
2021 produced a special milestone for the American economy. This was the first year that ten listed American firms1 surpassed $200 billion in annual revenues (firms we refer to as ‘Big Shots’ from here on) (Chart 5). The US has been a global leader when it came to the size of its economy for decades, but last year it also became home to the largest number of big, listed corporations (Table 1). American Big Shots were striking both in terms of their number as well as their scale. In fact, such was their scale that the combined revenue of these ten Big Shots now exceeded the nominal GDP of major economies like India (Chart 6). Table 1The US Today Dominates The Global List Of Top 20 Firms
America's Lead On Mega-Sized Companies: Is A Peak Nigh?
America's Lead On Mega-Sized Companies: Is A Peak Nigh?
Chart 6The Revenues Of US Big Shot Firms Are Comparable To India’s Nominal GDP!
America's Lead On Mega-Sized Companies: Is A Peak Nigh?
America's Lead On Mega-Sized Companies: Is A Peak Nigh?
While the world has been captivated by the size that the US’s Big Shots have achieved (as well as the ideas of their unconventional founders), few have noticed that the talent pool for tomorrow’s Big Shots is no longer burgeoning. History suggests that most Big Shot firms tend to emerge from firms belonging to a lower revenue tier. For instance, Amazon and Apple, which have revenues in the range of $350-to-$500 billion today, were mid-sized firms a decade ago with revenues in the vicinity of $50-to-$100 billion (Chart 7). Chart 7Most Big Shots Today Were The Mid-Sized Firms Of Yesterday
America's Lead On Mega-Sized Companies: Is A Peak Nigh?
America's Lead On Mega-Sized Companies: Is A Peak Nigh?
This is why it is worrying that all is not well in the US’s ecosystem of mid-sized firms. If we define firms with annual revenues of $50-to-$200 billion as ‘core’ firms, then their share in the total number of American firms has stagnated over the past decade (Chart 8). Even the revenue share accounted for by core firms has been fading (Chart 9). This phenomenon contrasts with the situation in China, where the mid-sized firms’ cohort has been growing over the last decade (Charts 10 and 11). Chart 8Share Of Mid-Sized Firms In The US Has Stagnated
America's Lead On Mega-Sized Companies: Is A Peak Nigh?
America's Lead On Mega-Sized Companies: Is A Peak Nigh?
Chart 9The Revenue Share Of US Mid-Sized Firms Is Also Falling
America's Lead On Mega-Sized Companies: Is A Peak Nigh?
America's Lead On Mega-Sized Companies: Is A Peak Nigh?
Chart 10Share Of Mid-Sized Firms In China Is Expanding
America's Lead On Mega-Sized Companies: Is A Peak Nigh?
America's Lead On Mega-Sized Companies: Is A Peak Nigh?
Chart 11The Revenue Share Of Chinese Mid-Sized Firms Is Rising
America's Lead On Mega-Sized Companies: Is A Peak Nigh?
America's Lead On Mega-Sized Companies: Is A Peak Nigh?
Japan’s experience also suggests that when the mid-sized firms’ ecosystem weakens, the pipeline of future potential mega-cap companies get affected. In Japan, the proportion of core firms (Chart 12), as well as their revenue share (Chart 13), has not been growing as is the case, say, in China. And this is perhaps why, despite being the third-largest economy in the world today, Japan is home to only one listed mega-sized corporation with revenues of over $200 billion (Toyota).
Image
Chart 13The Revenue Share Of Japanese Mid-Sized Firms Has Plateaued
America's Lead On Mega-Sized Companies: Is A Peak Nigh?
America's Lead On Mega-Sized Companies: Is A Peak Nigh?
The US May Have Hit Peak Oligopolization The fact that ten Big Shot firms (i.e., firms with annual revenues of over $200 billion) exist in the US today is remarkable. After all, the number of Big Shot firms in the US today exceeds the total number of Big Shots in the next four largest economies of the world combined (Chart 14). Chart 14The US Today Is The Global Hub For Mega-Sized Companies
America's Lead On Mega-Sized Companies: Is A Peak Nigh?
America's Lead On Mega-Sized Companies: Is A Peak Nigh?
So why will the US’s leadership in this area come under pressure going forward? One reason is that the large size of American firms could itself become a liability. Specifically: Public Backlash Against The US’s Big Shots: The ten Big Shot firms of the US today account for more than a fifth of the revenue generated by all firms that constitute the MSCI US index (Chart 15). Also, the number of Big Shot firms, as a share of total firms, is high in the US (Chart 16). Chart 15Big Shots Account For More Than A Fifth Of Revenues Generated By The US Listed Space
America's Lead On Mega-Sized Companies: Is A Peak Nigh?
America's Lead On Mega-Sized Companies: Is A Peak Nigh?
Chart 16A Large Proportion Of Firms In The US Are Very Big
America's Lead On Mega-Sized Companies: Is A Peak Nigh?
America's Lead On Mega-Sized Companies: Is A Peak Nigh?
Notably, market leaders across a range of key sectors in the US account for an unusually large chunk of the sector’s revenues. Financials, Information Technology, and Consumer Discretionary together account for about half of the US equity market index’s weight. The dominant firm in each of these three sectors (as defined by MSCI) accounts for 15%-to-25% of that sector’s revenue (Chart 17). Market power usually benefits investors. But too much market power can be a problem. The growing oligopolization of the US economy has caused public dissatisfaction over the influence of corporations in the US to hit a multi-year high (Chart 18). Over 60% of Americans want major US corporations to have less influence. It is for this reason that the record scale acquired by American firms could prove to be an issue. American mega-scaled firms’ high market shares will provide them with pricing power, but this very power will end up baiting regulatory attention and anti-trust lawsuits which, in turn, will restrict their future growth rates. The fact that the US Federal Trade Commission (FTC) today is headed by a leader who wants to return the FTC to its trust-busting origins, and made her name by writing a paper arguing for Amazon to be broken up,2 is indicative of which way the wind is blowing. Chart 17Market Leaders In The US Are Too Big
America's Lead On Mega-Sized Companies: Is A Peak Nigh?
America's Lead On Mega-Sized Companies: Is A Peak Nigh?
Chart 18Public Dissatisfaction With US Big Shot Firms Is High And Rising
America's Lead On Mega-Sized Companies: Is A Peak Nigh?
America's Lead On Mega-Sized Companies: Is A Peak Nigh?
Interestingly, the speed at which the US restricts the market power of big firms will determine how quickly the US’s mid-sized firms begin to flourish again, thereby setting the stage for the US to spawn a new generation of big firms. Besides the growing regulatory risks for the US’s big firms, three other technical factors will end up slowing the pace at which the US can generate large firms, namely: Slowing GDP Growth: Since the US is a large and mature economy, the pace of its growth is bound to slow (Chart 19). Besides the deceleration in the US’s growth rate relative to its own past, it is projected to end up being lower than that of major economies like China. Chart 19US GDP Growth Is Set To Slow
America's Lead On Mega-Sized Companies: Is A Peak Nigh?
America's Lead On Mega-Sized Companies: Is A Peak Nigh?
Big Business ≠ Big GDP Growth: While GDP growth receives a fillip when small firms grow, the high pricing power that very large firms command can end up constraining an economy’s growth rate. This is because large firms can charge monopolistic prices, thereby restraining demand. Secondly, mega-sized firms may actively invest in manipulating institutions to block upstarts,3 a dynamic that can restrict productivity growth as well. Chart 20The Revenue-To-Nominal GDP Ratio Is Already Elevated In The US
America's Lead On Mega-Sized Companies: Is A Peak Nigh?
America's Lead On Mega-Sized Companies: Is A Peak Nigh?
Approaching Revenue Saturation: A cross-country comparison suggests that the revenue-to-nominal GDP ratio in the US is high1 (Chart 20). Only Japan has a superior ratio, which is likely to be an aberration rather than the norm (owing to Japanese firms’ unique tendency to prioritize revenues over profitability). Given that the US revenue-to-nominal GDP ratio is already elevated, it is likely that even as the US’s nominal GDP keeps growing, the pace of conversion of this GDP into revenues will stay the same or may even diminish over the coming decade. Prepare For A Brave New World “German judges…first read a description of a woman who had been caught shoplifting, then rolled a pair of dice that were loaded so every roll resulted in either a 3 or a 9. As soon as the dice came to a stop, the judges were asked whether they would sentence the woman to a term in prison greater or lesser, in months, than the number showing on the dice…On average, those who had rolled a 9 said they would sentence her to 8 months; those who rolled a 3 said they would sentence her to 5 months; the anchoring effect was 50%.” – Daniel Kahneman, Thinking, Fast and Slow (Farrar, Straus and Giroux, 2011) The US has been the largest economy in the world and has also been able to nurture some of the largest mega-scaled companies of today. Such is the might and size of these firms that it is impossible to imagine a world where American firms’ leadership could be disrupted. Moreover, it is mentally easier to extrapolate the US’s lead today into the future. It may even seem like there is no other alternative to the US since Japan’s economy has been stagnating, Europe lacks innovation, and the political environment in China is contentious. Also, it is true that the US today is the undisputed leader when it comes to qualitative factors such as the ability to attract top global talent, its education system, and its legal system. However, the case can be made that this belief (that the US’s lead on mega-sized companies will spill into the next decade) runs the risk of becoming a Kahneman-esque anchoring bias. This is because: History Suggests That Upsets Are The Norm: History suggests that the evolution of the top 20 global firms (by revenue) has been a story of upsets. For instance, Europe’s hold over this list in the 2000s was striking by all accounts (Chart 21). Back then, it would have been almost blasphemous to question Europe’s lead (Chart 22). But today firms from three Asian island-countries account for more companies on this list than all of pre-Brexit Europe put together. Chart 21In The 2000s, Europe Was The Epicenter Of Global Mega-Sized Firms
America's Lead On Mega-Sized Companies: Is A Peak Nigh?
America's Lead On Mega-Sized Companies: Is A Peak Nigh?
Chart 22How The Mighty Can, And Do, Fall
America's Lead On Mega-Sized Companies: Is A Peak Nigh?
America's Lead On Mega-Sized Companies: Is A Peak Nigh?
China’s Disadvantages < Its Competitive Advantages: Despite its political baggage, China has the most formidable capability today to displace the US’s leadership position on the league tables of top 20 global firms by revenue. This is because China has a thriving ecosystem of core firms (Chart 11) and is set to grow at a faster clip than the US over the next five years (Chart 19). Moreover, while the Chinese government’s tolerance for large tech giants could remain low, the establishment could be keen to grow firms in the industrials as well as financials space for the sake of common prosperity. EM Listed Space Can Catch Up: The listed space in the US has developed at an exceptionally fast pace relative to its peers. The gap between US nominal GDP and listed space parameters is low (Chart 20), while the gap is wider for countries like Germany, China, and several other EMs. Even in a ceteris paribus situation where nominal GDPs were to stay static, an increase in the size of the listed universe in other countries can adversely affect the US’s current footprint. So, what can investors do to prepare for this coming tectonic shift? We recommend reducing allocations to US equities since the US’s weight in global indices will peak soon. It is worth noting that this strategic investment recommendation dovetails nicely with our earlier view that strategic investors should rotate out of US stocks. Currently, about half of the 20 largest firms globally by revenue are American (Map 1). Owing to the dynamics listed above, the number of American firms in the global league of top 20 could fall from this high level to 7 or 8 over the coming decade. Given that this change is indicative of things to come, we would urge investors to reduce allocations to US equities in a global portfolio over a strategic horizon. A confluence of micro and macro factors is likely to result in the US’s weight in global indices to crest sooner rather than later. Map 1Could The Global Epicenter Of Big Firms Drift Eastwards Over The Next Decade?
America's Lead On Mega-Sized Companies: Is A Peak Nigh?
America's Lead On Mega-Sized Companies: Is A Peak Nigh?
In fact, US equities’ weight in a global index like the MSCI ACWI could have already peaked (Chart 23) and could fall by 500-to-600bps over the next decade if the last year’s trend is extrapolated into the future. As regards to sectors, health care appears to be the key industry where the US’s footprint could weaken (Table 2). Chart 23Loss Of US Influence Will Create Space For Underrepresented Markets To Grow
America's Lead On Mega-Sized Companies: Is A Peak Nigh?
America's Lead On Mega-Sized Companies: Is A Peak Nigh?
Table 2China’s Weight In Top 20 Firms Is Set To Grow
America's Lead On Mega-Sized Companies: Is A Peak Nigh?
America's Lead On Mega-Sized Companies: Is A Peak Nigh?
As the US cedes its leadership position, we expect the global epicenter of mega-sized listed corporates to drift eastwards (Map 1). Specifically: China: Currently, less than a quarter of the 20 largest firms globally by revenue are Chinese (Map 1). It is highly likely that the number of Chinese firms in the global list of top 20 firms will increase. China should be able to spawn more mega-sized companies since it already has a cache of promising large and mid-sized companies. Chinese companies will also benefit from the high growth rate of China’s domestic economy. From a sectoral perspective, financials and industrials appear to be two sectors where China’s footprint could grow the most (Table 2). Asia Ex-China: Asian countries like Korea, Taiwan, and Japan could potentially end up growing their weight in global equity indices by becoming home to more than one company that makes it to the global league tables of large companies. Besides the high GDP growth rate on offer in their domestic markets (Chart 20), firms in these countries could increase scale by feeding a stimulus-fueled industrial boom in the US. Additionally, these Asian countries have a competitive advantage when it comes to high-tech manufacturing capabilities (Chart 24). This will ensure that they will accrue any offshore opportunities that arise. Taiwan has the potential to grow its presence in the Information Technology space, given its innate competitive advantages (Chart 24) and the positive structural outlook for global semiconductor demand. In the case of India, it is worth noting that the country’s influence in the world economy will be ascendant over the next decade as its growing middle class flexes its muscles. Despite this, the probability of an Indian firm making an appearance among the largest firms of the world is low given the unusually small size of Indian companies today. Europe: Distinct from the Asian countries listed above, Germany could benefit from the industrial boom in the US given its capabilities when it comes to high-end manufacturing (Chart 24). Even as we believe that oil faces a bleak future on a structural basis, if a commodities supercycle were to take hold over the next decade, then the UK and France could improve their presence in global equity benchmarks given that Europe is home to some large firms in the energy sector. A commodities supercycle will also end up benefiting China and the US, since some large energy producers are also located in these countries. Chart 24Korea, Japan, And Germany Have An Edge In Manufacturing, While Taiwan, Japan, And China Have An Edge In Semiconductors
America's Lead On Mega-Sized Companies: Is A Peak Nigh?
America's Lead On Mega-Sized Companies: Is A Peak Nigh?
Appendix The Methodology The starting point for most country-level economic analyses tends to be a country’s nominal GDP. But as market economists we realized that some key advantages could be unlocked by focusing on ‘revenues’ generated by the listed universe of a country. These advantages include: Investment Focus: As compared to nominal GDP which ends up picking up signals about the health of the listed ‘and’ unlisted firms in any country, focusing on listed firms’ revenues allows us to home-in on the health of the listed space. This is a valuable merit since the listed space is what public equity investors can buy into. For example, India is the fifth largest economy of the world and is also one of the fastest growing economies globally. But India is also characterized by a listed space where the largest companies have revenues of only around $100 billion. This makes India less investable than countries like Taiwan or South Korea that have far smaller nominal GDPs as compared to India but are home to firms with revenue of around $200 billion. Taking note of this difference - between the size of a country’s nominal GDP and the size of investable firms in a country - is key for our clients. Focus On Cause, Not Effect: It is fashionable today in the financial press to focus on the daily changes in market capitalization of assets (and non-assets too). But it is critical to note that the market cap of a stock or the price of a security is a dependent variable. Revenue, on the other hand, is a key independent variable that influences prices. So, a focus on forecasting movement in revenues of companies in a country ten years down the line, can be a more fruitful exercise for strategic investors. Steady And Stable: Revenue generated by a firm, is also a superior measure as compared to the market capitalization of a firm because the latter can be volatile. Whilst it could be argued that earnings of a company as a variable also offer stability and influence prices, earnings suffer from one drawback which is that it is a function of revenues as well as costs. Revenues of companies on the other hand have a direct theoretical link to the nominal GDP of a country. So, to rephrase a popular adage - market cap is vanity, nominal GDP is sanity, but revenue is king. This is the reason why in this Special Report, we analyze investment opportunities through the lens of revenues generated by listed firms in some of the largest economies of the world. We do so by focusing on the constituents of MSCI Country Indices (Equity) for major world economies in 2021. Ritika Mankar, CFA Editor/Strategist ritika.mankar@bcaresearch.com Footnotes 1 Based on MSCI ACWI data for 2021. 2 Kiran Stacey, “Washington vs Big Tech: Lina Khan’s battle to transform US antitrust,” ft.com, August 2021. 3 Kathy Fogel, Randall Morck, and Bernard Yeung, “Big Business Stability And Economic Growth: Is What’s Good For General Motors Good For US?”, NBER Working Paper No. 12394, nber.org, July 2006.
Executive Summary Italy’s right-wing alliance, led by Brothers of Italy, will likely outperform in the upcoming election. The new government will prioritize the economy, posing a risk to the EU’s united front against Russia. It is conducive to an eventual ceasefire, which is marginally positive for risk assets in 2023. We recommend investors underweight Italian assets on a tactical basis. China’s political risks will remain elevated until Xi consolidates power this fall, positive news will come after, if at all. Geopolitical risk in the Taiwan Strait will remain high and persistent until China and the US reach a new understanding. Separately, we are booking a 9% gain on our long US equities relative to UAE equities trade. Italy: GeoRisk Indicator
Italy: GeoRisk Indicator
Italy: GeoRisk Indicator
Tactical Recommendation Inception Date Return LONG US / UAE EQUITIES (CLOSED) 2022-03-11 9.0% Bottom Line: Italy’s political turmoil suggests a more pragmatic policy toward Russia going forward. Europe’s energy cutoff will also motivate governments to negotiate with Russia. Feature In this report we update our GeoRisk Indicators, with a special focus on Italy’s newest political turmoil. Italy Over the past several months, we have argued that Italy was a source of political risk within the European Union and that the market underestimated the probability of an early Italian election. In the past two weeks, this forecast has become a reality (Chart 1). Chart 1Italy: GeoRisk Indicator
Italy: GeoRisk Indicator
Italy: GeoRisk Indicator
The grand coalition under Prime Minister Mario Draghi had fulfilled its two main purposes – to distribute EU recovery funds and secure an establishment politician in the Italian presidency. At the same time, headline inflation hit 8.5% in June, the highest since 1986, even as the Italian and global economy slowed down, Italian government bonds sold off, and Russia induced an energy crisis. The stagflationary economic environment is biting hard and the different coalition members are looking to their individual interests ahead of election season. On July 14, Giuseppe Conte, the former prime minister, pulled its populist Five Star Movement (M5S) out of Mario Draghi’s national unity government, triggering a new round of political turmoil in Italy. Draghi’s first resignation was rejected by Italian President Mattarella later that day. However, on July 21, the League and Forza Italia also defected from the grand coalition. After Draghi’s plan of reviving the coalition collapsed, President Mattarella accepted his resignation and called for a snap election to be held on September 25, ten months ahead of the original schedule. Based on the latest public opinion polls, right-wing political parties are well-positioned for the upcoming election. The far-right Brothers of Italy is now the front runner in the election race and is expected to win around 23% of the votes. Another far-right party, the League, is the third most popular party, with nearly 15% support despite a drop in support during its time within the grand coalition. In addition, the center-right Forza Italia receives 8.5% of the support. Together, the right-wing conservative bloc amounts to 46.5% of voting intentions. There is still positive momentum for Brothers of Italy to harvest more support given that they are the flag-bearer for anti-incumbent sentiment amid the stagflationary economy. By contrast, the left-wing parties – the Democrats, the Left, and the Greens – only command about 27%. The possibility of an extended left-wing coalition, even with the inclusion of the M5S, is looking slim. On July 25, Enrico Letta, the leader of the Democratic Party, publicly expressed his anger against party leader Giuseppe Conte and ruled out any electoral pact with the M5S because of the recent political chaos they caused. He stressed that the Democratic Party would seek ties with parties that had remained loyal to Draghi’s national unity. However, there are not many parties left for the Democrats to partner with. Apart from the Left and the Greens, the Democrats’ best chance would be the center-left Action Party and Italia Viva, which is led by Matteo Renzi, who served as the secretary of the Democratic Party from 2013 to 2018. However, these four parties are small and will not enable the Democrats to form a government. Courting M5S is the Democrats’ only chance to set up an alternative to the right-wing bloc, but that will require the election to force the two parties together. Related Report Geopolitical StrategyLe Pen And Other Hurdles (GeoRisk Update) The Democratic Party was the biggest supporter of Draghi’s government, while the Brothers of Italy were the sole major opposition. Thus the September 25 election will be a race between these two major parties. Both are expected to outperform current polling, as they will attract the most supporters from each side. The other right-wing parties, Forza Italia and the League, will at least perform in line with their polling, while the other left-wing parties will underperform. In the meantime, M5S’ popularity will continue to decline – the party is bruised over its role in Draghi’s coalition and divided over how to respond to the Ukraine war. Foreign policy is a major factor in this election. Italy has the highest share of citizens in the Eurozone who support solving the Russia-Ukraine conflict through peaceful dialogue (52% versus the Eurozone average of 35%). Italy has long maintained pragmatic relations with Russia, including the Putin administration, as it imported 40% of its natural gas from there prior to 2022. The EU is struggling to maintain a united front against Russia, and war policy will be a key focal point among the different parties. Draghi and the Democratic Party are the strongest supporters of the EU’s oil embargo on Russia and decision to send arms to support Ukraine. On the other side, the right-wing Forza Italia and the League have been more equivocal due to their traditional friendship with Russia. What’s more important is the stance of the Brothers of Italy on Russia, as it is the largest party now and will probably lead a right-wing government after the election. On July 27, the three right-wing parties struck a deal to officially form an alliance in the upcoming election and whichever party wins the most votes would determine the next prime minister if the alliance wins. This deal puts Giorgia Meloni, the leader of Brothers of Italy, one step closer to becoming Italy’s first female PM. Giorgia Meloni, unlike her right-wing peers, has endorsed Draghi’s hawkish stance towards Russia. Recently, she stressed that Italy would keep sending arms to Ukraine if her party forms a government after the election. However, Meloni’s speech could be a tactical move to win the election more than an unshakeable policy position. First, like the other two right-wing parties, the Brothers of Italy have had close connections with Russia. After the 2018 Russian presidential election, Meloni congratulated Putin and claimed his victory was “the unequivocal will of Russians.” In addition, she is close to Prime Minister Viktor Orban of Hungary and National Rally leader Marine Le Pen of France, both of whom have criticized the EU’s decision to provide military support to Kyiv. Hence her sharp change of stance this year seems calculated to avoid accusations of being pro-Russian. But that does not preclude a more pragmatic approach to Russia once in office. Second, Meloni has compromised other far-right positions to broaden her voter base. She has reversed the party’s original anti-EU stance and claimed it does not seek to leave the EU, as most European anti-establishment parties have had to do in order to make themselves electable. Being the only female in the election race, Meloni also pledged to protect women’s access to safe abortions in Italy, also a softer stance than before. Even if the Brothers of Italy distance themselves from some unpopular right-wing positions, including on Ukraine, they probably cannot form a government on their own. They will need to court Forza Italia and the League. These two parties prefer a more pragmatic approach to Russia and a peaceful resolution to the war. Thus while it will be hard to find a middle ground on the issue of Ukraine, the election will likely prevent Italy from taking a more confrontational stance toward Russia. It will probably do the opposite. Consider the context in which the next Italian government will operate. Russia declared on July 25 that it will further reduce natural gas supplies to Europe through Nord Stream 1, as we expected, bringing pipeline flows to 20% of its full capacity. Energy prices will go up even as European economic activity and industry will suffer greater strains. If Meloni is elected as the new prime minister this September, she will have to keep talking tough on Russia while simultaneously seeking a solution to soaring energy prices and economic crisis. This solution will be diplomacy – unless Russia seeks to expand its invasion all the way to Moldova. A right-wing victory is the most likely outcome based on opinion polling, the negative cyclical economy, and the underlying structural factors supporting populism in Italy that we have monitored for years. Such a coalition will not be pro-Russian but it will be pragmatic and focused on salvaging Italy’s economy, which means it will be highly inclined toward diplomacy. If Russia halts its military advance – does not attempt to conquer southwestern Ukraine to Moldova – then this point will be greatly reinforced. Italy will become a new veto player within the European Union when it comes to any major new sanctions on Russia. While Europeans will continue diversifying their energy mix away from Russia, it will be much harder for the EU to implement a natural gas embargo in the coming years if Italy as well as Hungary oppose it. Even if we are wrong, and the Democratic Party or other left-wing parties surprise to the upside in the election, the new coalition will most likely have to focus on mitigating the economic crisis and thus pursuing diplomacy with Russia. That is, as long as Russia pushes for a ceasefire after it achieves its military aims in Donetsk, the last holdout within the south-southeastern territories Russia is trying to conquer. Bottom Line: Due to persistent political uncertainty, we recommend investors underweight Italian stocks and bonds at least until a new government takes shape, which could take months even after the election. However, government bonds will remain vulnerable if a right-wing coalition assumes power, since it will pursue loose fiscal policies and will eschew structural reforms. Overall Italy’s early elections will lead to a new government that is focused on short-term economic growth, likely including pragmatism toward Russia. From an investment point of view that will not be a negative development, though much depends on whether Russia expands its invasion or declares victory after Donetsk. Russia Market-based measures of Russian geopolitical risk are rebounding after subsiding from peak levels hit during the invasion of Ukraine in February (Chart 2). Chart 2Russia: GeoRisk Indicator
Russia: GeoRisk Indicator
Russia: GeoRisk Indicator
Russia’s continued tightening of natural gas supplies (and food exports) this week is precisely what we predicted would happen despite a wave of wishful thinking from investors over the past month. The optimists claimed that Russia would resume Nord Stream 1 pipeline flows after a regular “maintenance” period. They also said that Canada’s cooperation in resolving some “technical” issues around turbines would stabilize natural gas supply. The truth is that Russia is seeking to achieve its war aims in Ukraine. Until it has achieved its aims, it will use a range of leverage, including tightening food and energy supplies. Most likely Russia will halt the advance after completing the conquest of the Donbas region and land-bridge to Crimea. Then it will seek to legitimize its conquests through a ceasefire agreement. However, it could launch a new phase of the war to try to take Odessa and Transniestria, which would cement European resolve, even in Italy, and trigger a new round of sanctions. Bottom Line: Russia faces a fork in the road once it completes the conquest of Donetsk. Most likely it will declare victory and start pushing for a ceasefire late this year or early next year. Movement toward a ceasefire would reduce geopolitical risk for global financial markets in 2023. But there is still a substantial risk that Russia could expand the invasion to eastern Moldova, which would escalate the overarching Russia-West conflict and sustain the high level of geopolitical risk for markets. China Chinese political and geopolitical risk will continue to rise and the bounce in Chinese relative equity performance is faltering as we expected (Chart 3). Chart 3China: GeoRisk Indicator
China: GeoRisk Indicator
China: GeoRisk Indicator
China’s leaders will hold their secretive annual meeting at Beidaihe in August ahead of the critical Communist Party national congress this fall. General Secretary Xi Jinping is attempting to cement himself as the paramount leader in China, comparable to Chairman Mao Zedong, transforming China’s governance from that of single-party rule to single-person rule. The reversion to autocratic government is coinciding with a historic economic slowdown consisting of cyclical factors (weak domestic demand, weakening foreign demand, draconian Covid-19 restrictions) and structural factors (labor force contraction, property sector bust, social change and unrest). Both Xi and US President Biden face major domestic political challenges in the coming months with the party congress and the US midterm election. Hence they are holding talks to try to stabilize relations. But we do not think they will succeed. China cannot reject Russia’s strategic overture, while the US cannot afford to re-engage with a China that is partnering with Russia in a challenge to the liberal-democratic world order. In addition, US policies are erratic and the US cannot credibly promise China that it will not pursue a containment strategy even if China offers trade concessions. Bottom Line: China-related political and geopolitical risks will remain very high until at least after the twentieth party congress. At that point we expect President Xi to loosen a range of policies to stabilize the economy and foreign trade relations. These policies may bring positive news in 2023, though China’s biggest macroeconomic and geopolitical problems remain structural in nature and we remain underweight Chinese assets. Taiwan For many years we have warned of a “fourth Taiwan Strait crisis” due to the unsustainable geopolitical situation between China, Taiwan, and the United States. After the war in Ukraine we argued that the US would try to boost its strategic deterrence around Taiwan, since it failed to deter Russia from invading Ukraine, but that the increased commitment to Taiwan would in fact provoke China (Chart 4). Chart 4Taiwan: GeoRisk Indicator
Taiwan: GeoRisk Indicator
Taiwan: GeoRisk Indicator
Until the US and China reach a new understanding over Taiwan, we argued that the region would be susceptible to rising tensions and crisis points that would send investors fleeing from risky assets, especially risky regional assets. It is possible that we have arrived at this crisis now, with House Speaker Nancy Pelosi making preparations to visit Taiwan, China pledging “forceful” countermeasures if she does, President Biden suggesting that the US military thinks Pelosi should not visit, and Biden and Xi preparing for a phone conversation. In essence China is giving an ultimatum and setting a new bar, and a very low bar, for taking some kind of action on Taiwan, i.e. the mere visit of a US House speaker, which has happened before (House Speaker Newt Gingrich in 1997). China’s purpose is to lay the groundwork for preventing the US from upgrading Taiwan relations in any more substantial way, whether political or military. If the Biden administration calls off the Pelosi visit, then American relations with Taiwan will have been curtailed, at least for this administration. If Biden goes forward with the visit, then Beijing will need to respond with an aggressive show of force to prevent any future president from repeating the exercise or building on it. And if this show threatens US personnel or security, a full-blown diplomatic or military crisis could ensue. While we doubt it would lead to full-scale war, it could lead to a frightening confrontation. Biden may want to stabilize relations with China, since he is primarily focused on countering Russia, but his options are limited. China cannot save him from inflation but it can solidify the public perception that he is weak. Hence he is more likely to maintain his administration’s hawkish approach. Biden’s approval rating is 38% and his party faces a drubbing in the midterm elections. A confrontation with Russia, China, Iran, or anyone else would likely help his party by producing a public rally around the flag. Any unilateral concessions will merely strengthen Xi’s power consolidation at the party congress, which is detrimental to US interests. Only if the Biden administration pursues a dovish policy of re-engagement that is subsequently confirmed by the 2024 presidential election will there be potential for a substantial US-China economic re-engagement. We are pessimistic. Bottom Line: Taiwan-related geopolitical risk will rise in the short run. If there is a new US-China understanding over Taiwan, then regional and global geopolitical risk will decline over the medium term. But we remain short Taiwanese assets. Investment Takeaways Investors should remain defensively positioned until the US midterm election ends with congressional gridlock; the Chinese party congress is over and Xi Jinping launches a broad pro-growth policy; and Russia starts pushing for a ceasefire in Ukraine. We also expect that markets will need to get over new, unexpected oil supply shocks arising from the failure of US-Iran nuclear negotiations, which remains off the radar and therefore a source of negative surprises. Any US-Iran nuclear deal would be a major positive surprise that postpones this risk for a few years. Having said that, we are booking a 9% gain on our long US versus UAE equity trade for technical reasons. Democrats have reached a deal to pass a budget reconciliation bill in an effort to mitigate midterm election losses. This development reinforces the 65% odds of passage that we have maintained for this bill’s passage in our US Political Strategy reports since last year. Yushu Ma Research Analyst yushu.ma@bcaresearch.com Matt Gertken Chief Geopolitical Strategist mattg@bcaresearch.com Appendix UK Chart 5UK: GeoRisk Indicator
United Kingdom: GeoRisk Indicator
United Kingdom: GeoRisk Indicator
Germany Chart 6Germany: GeoRisk Indicator
Germany: GeoRisk Indicator
Germany: GeoRisk Indicator
France Chart 7France: GeoRisk Indicator
France: GeoRisk Indicator
France: GeoRisk Indicator
Spain Chart 8Spain: GeoRisk Indicator
Spain: GeoRisk Indicator
Spain: GeoRisk Indicator
Canada Chart 9Canada: GeoRisk Indicator
Canada: GeoRisk Indicator
Canada: GeoRisk Indicator
Australia Chart 10Australia: GeoRisk Indicator
Australia: GeoRisk Indicator
Australia: GeoRisk Indicator
Korea Chart 11Korea: GeoRisk Indicator
Korea: GeoRisk Indicator
Korea: GeoRisk Indicator
Brazil Chart 12Brazil: GeoRisk Indicator
Brazil: GeoRisk Indicator
Brazil: GeoRisk Indicator
Turkey Chart 13Turkey: GeoRisk Indicator
Turkey: GeoRisk Indicator
Turkey: GeoRisk Indicator
South Africa Chart 14South Africa: GeoRisk Indicator
South Africa: GeoRisk Indicator
South Africa: GeoRisk Indicator
Strategic Themes Open Tactical Positions (0-6 Months) Open Cyclical Recommendations (6-18 Months) Regional Geopolitical Risk Matrix "Batting Average": Geopolitical Strategy Trades Geopolitical Calendar
Executive Summary If a loss of wealth persists for a year or more, it hurts the economy. The recent $40 trillion slump in global financial wealth is larger than that suffered in the pandemic of 2020, the global financial crisis of 2008, and the dot com bust of 2000-01. Partly countering this slump in global financial wealth is a $20 trillion uplift in global real estate wealth. However, Chinese home prices are already stagnating. And the recent disappearance of US and European homebuyers combined with a flood of home-sellers warns that US and European home prices will cool over the next 6 months. With the loss of wealth likely to persist, it will amplify a global growth slowdown already in train, aided and abetted by central banks that are willing to enter recession to slay inflation. The optimal asset allocation over the next 6-12 months is: overweight bonds, neutral stocks, and underweight commodities. A variation on this theme is: overweight conventional bonds and stocks versus inflation-protected bonds and commodities. Fractal trading watchlist: US telecoms versus utilities, and copper. We Have Just Suffered The Worst Loss Of Financial Wealth In A Generation
The World Is $20 Trillion Poorer. Why That Matters
The World Is $20 Trillion Poorer. Why That Matters
Bottom Line: On a 6-12 month horizon, overweight bonds, neutral stocks, and underweight commodities. Feature Since the end of last year, the world has lost $40 trillion of financial wealth, evenly split between the crashes in stocks and bonds (Chart I-1). The slump in financial wealth, both in absolute and proportionate terms, is the worst suffered in a generation, larger than that in the pandemic of 2020, the global financial crisis of 2008, and the dot com bust of 2000-01.1 Chart I-1Global Stocks And Global Bonds Have Both Slumped By $20 Trillion
Global Stocks And Global Bonds Have Both Slumped By $20 Trillion
Global Stocks And Global Bonds Have Both Slumped By $20 Trillion
Partly countering this $40 trillion slump in global financial wealth is a $20 trillion uplift in global real estate wealth. But in total, the world is still $20 trillion ‘asset poorer’ than at the end of last year. Given that global GDP is around $100 trillion, we can say that we are asset poorer, on average, by about one fifth of our annual income. Does this loss of wealth matter? A Loss Of Wealth Matters If It Persists For A Year Or More Some argue that we shouldn’t worry about the recent slump in our wealth, because we are still wealthier than we were, say, at the start of the pandemic (Chart I-2). Yet this is a facile argument. Whatever loss of wealth we suffer, there is always some point in the past against which we are richer! Chart I-2We Have Just Suffered The Worst Loss Of Financial Wealth In A Generation
We Have Just Suffered The Worst Loss Of Financial Wealth In A Generation
We Have Just Suffered The Worst Loss Of Financial Wealth In A Generation
Another argument is that people do not care about a short-lived dip in their wealth. This argument has more truth to it. For example, in the extreme event of a flash crash, an asset price can drop to zero and then bounce back in the blink of an eyelid. In this case, most people would be oblivious, or unconcerned, by this momentary collapse in their wealth. But people do care if the slump in their wealth becomes more prolonged. How long is prolonged? The answer is, if the slump persists for a year or more. Why a year? Because that is the timeframe over which governments, firms, and households make their income and spending plans. Governments and firms do this formally in their annual budgets that set tax rates, wages, bonuses, and investment spending. Households do it informally, because their wages, bonuses, and taxes – and therefore disposable incomes – also adjust on an annual basis. Into this yearly spending plan will also come any change in wealth experienced over the previous year. For example, firms often do this formally by converting an asset write-down to a deduction from profits, which will then impact the firm’s future spending. This illustrates that what impacts your spending is not the level of your wealth, but the yearly change in your wealth. Spending Is Impacted By The Change In Wealth The intellectual battle here is between Economics and Psychology. The economics textbooks insist that it is the level of your wealth that impacts your spending, whereas the psychology and behavioural finance textbooks insist that it is the change in your wealth that impacts your spending. (Chart I-3and Chart I-4). In my view, the psychologists and behavioural finance guys have nailed this better than the economists, through a theory known as Mental Accounting Bias. Chart I-3The Change And Impulse Of Stock Market Wealth Are Both Negative
The Change And Impulse Of Stock Market Wealth Are Both Negative
The Change And Impulse Of Stock Market Wealth Are Both Negative
Chart I-4The Change And Impulse Of Bond Market Wealth Are Both Negative
The Change And Impulse Of Bond Market Wealth Are Both Negative
The Change And Impulse Of Bond Market Wealth Are Both Negative
Nobel Laureate psychologist Daniel Kahneman points out that we categorise our money into different accounts, which are sometimes physical, sometimes only mental – and that there is a clear hierarchy in our willingness to spend these ‘mental accounts’. Put simply, we are willing to spend our income mental account, but we are much less willing to spend our wealth mental account. Still, wealth can generate income through interest payments and dividends, which we are willing to spend. Clearly, the level of income generated will correlate with the amount of wealth – $10 million of wealth will likely generate much more income than $1 million of wealth. So, economists get the impression that it is the level of wealth that impacts spending, but the truth is that it is the income generated by the wealth that impacts spending. We are willing to spend our income ‘mental account’, but we are much less willing to spend our wealth ‘mental account’. What about someone like Amazon founder Jeff Bezos who has immense wealth but seemingly negligible income – Mr. Bezos receives only a token salary, and his huge holding of Amazon shares pays no dividend – how then can we explain his largesse? The answer is that Mr. Bezos’ immense wealth generates tens of billions in trading income. So again, it is his income that is driving his spending. Wealth also generates an ‘income substitute’ via capital gains. For example, you should be indifferent between a $100 bond giving you $2 of income, or a $98 zero-coupon bond maturing in one year at $100, giving you $2 of capital gain. In this case the capital gain is simply an income substitute and fully transferred into the spending mental account. Nowhere is this truer than in China, where the straight-line appreciation in house prices through several decades has allowed homeowners to regard a reliable capital gain as an income substitute (Chart I-5). Which justifies rental yields on Chinese housing that are the lowest in the world and lower even than the yield on risk-free cash. In other words, which justifies a stratospheric valuation for Chinese real estate.
Image
Usually though, we tend to transfer only a proportion of our capital gains or losses into our spending mental account. As described previously, a firm will do this formally by transferring an asset write-down into the income statement. And households will do it informally by transferring some proportion of their yearly change in wealth into their spending mental account. The important conclusion is that spending is impacted by the yearly change in wealth. Meaning that spending growth is impacted by the yearly change in the yearly change in wealth, known as the wealth (1-year) impulse, where a negative impulse implies negative growth. Cracks Appearing In The Housing Market Given the recent slump in financial wealth, the global financial wealth impulse is in deeply negative territory. Yet by far the largest part of our wealth comprises housing, meaning the value of our homes2 (Chart I-6). In China, the recent stagnation of house prices means that the housing wealth impulse has turned negative. Elsewhere in the world though, the recent boom in house prices means that the housing wealth impulse is still positive, meaning a tailwind – albeit a rapidly fading tailwind – to spending (Chart I-7 and Chart I-8). Chart I-6Housing Comprises By Far The Largest Part Of Our Wealth
Housing Comprises By Far The Largest Part Of Our Wealth
Housing Comprises By Far The Largest Part Of Our Wealth
Chart I-7Chinese House Prices Have Stagnated, US House Prices Have Surged
The World Is $20 Trillion Poorer. Why That Matters
The World Is $20 Trillion Poorer. Why That Matters
Chart I-8The Chinese Housing Wealth Impulse Is Negative, The US Housing Wealth Impulse Is Fading
The Chinese Housing Wealth Impulse Is Negative, The US Housing Wealth Impulse Is Fading
The Chinese Housing Wealth Impulse Is Negative, The US Housing Wealth Impulse Is Fading
In China, the recent stagnation of house prices means that the housing wealth impulse has turned negative. Still, as we explained in The Global Housing Boom Is Over, As Buying Becomes More Expensive Than Renting, the disappearance of homebuyers combined with a flood of home-sellers is a tried and tested indicator that US and European home prices will cool over the next 6 months. US new home prices have already suffered a significant decline in June (Chart I-9). Some of this is because US homebuilders are building smaller and less expensive homes. Nevertheless, it seems highly likely that the non-China housing wealth impulse will also turn negative later this year. Chart I-9US New Home Prices Fell Sharply In June
US New Home Prices Fell Sharply In June
US New Home Prices Fell Sharply In June
To be clear, the wealth impulse is just one driver of spending growth. Nevertheless, it does have the potential to amplify the growth cycle in either direction. With global growth clearly slowing, and central banks willing to enter recession to slay inflation, the rapidly fading global wealth impulse will amplify the slowdown. Therefore, the optimal asset allocation over the next 6-12 months is: Overweight bonds. Neutral stocks. Underweight commodities. A variation on this theme is: Overweight conventional bonds and stocks versus inflation-protected bonds and commodities. Fractal Trading Watchlist After a 35 percent decline since March, copper has hit a resistance point on its short-term fractal structure, from which it could experience a countertrend move. Hence, we are adding copper to our watchlist. Of note also, the underperformance of US telecoms versus utilities has reached the point of fragility on its 260-day fractal structure that has signalled previous major turning points in 2012, 2014, and 2017 (Chart I-10). Hence, the recommended trade is long US telecoms versus utilities, setting a profit target and symmetrical stop-loss at 8 percent. Chart I-10US Telecoms Versus Utilities Are At A Potential Turnaround
US Telecoms Versus Utilities Are At A Potential Turnaround
US Telecoms Versus Utilities Are At A Potential Turnaround
Fractal Trading Watchlist: New Additions Copper’s Selloff Has Hit Short-Term Resistance
Copper's Selloff Has Hit Short-Term Resistance
Copper's Selloff Has Hit Short-Term Resistance
Dhaval Joshi Chief Strategist dhaval@bcaresearch.com Footnotes 1 The value of global equities has dropped by $20tn to $80tn, the value of global bonds by $20tn to around $100tn, while the value of global real estate has increased by $20tn to an estimated $370tn. 2 Strictly speaking, housing wealth should be measured net of the mortgage debt that is owed on our homes. But as the wealth impulse is a change of a change, and mortgage debt changes very slowly, it does not matter whether we calculate the impulse from gross or net housing wealth. Chart 1CNY/USD At A Potential Turning Point
CNY/USD At A Potential Turning Point
CNY/USD At A Potential Turning Point
Chart 2Copper's Selloff Has Hit Short-Term Resistance
Copper's Selloff Has Hit Short-Term Resistance
Copper's Selloff Has Hit Short-Term Resistance
Chart 3US REITS Are Oversold Versus Utilities
US REITS Are Oversold Versus Utilities
US REITS Are Oversold Versus Utilities
Chart 4CAD/SEK Is Reversing
CAD/SEK Is Reversing
CAD/SEK Is Reversing
Chart 5Financials Versus Industrials Has Reversed
Financials Versus Industrials Has Reversed
Financials Versus Industrials Has Reversed
Chart 6The Outperformance Of Resources Versus Biotech Has Ended
The Outperformance Of Resources Versus Biotech Has Ended
The Outperformance Of Resources Versus Biotech Has Ended
Chart 7The Outperformance Of Resources Versus Healthcare Has Ended
The Outperformance Of Resources Versus Healthcare Has Ended
The Outperformance Of Resources Versus Healthcare Has Ended
Chart 8FTSE100 Outperformance Vs. Euro Stoxx 50 Is Vulnerable To Reversal
FTSE100 Outperformance Vs. Euro Stoxx 50 Is Vulnerable To Reversal
FTSE100 Outperformance Vs. Euro Stoxx 50 Is Vulnerable To Reversal
Chart 9Netherlands' Underperformance Vs. Switzerland Has Ended
Netherlands' Underperformance Vs. Switzerland Has Ended
Netherlands' Underperformance Vs. Switzerland Has Ended
Chart 10The Sell-Off In The 30-Year T-Bond At Fractal Fragility
The Sell-Off In The 30-Year T-Bond At Fractal Fragility
The Sell-Off In The 30-Year T-Bond At Fractal Fragility
Chart 11The Sell-Off In The NASDAQ Is Approaching Fractal Fragility
The Sell-Off In The NASDAQ Is Approaching Fractal Fragility
The Sell-Off In The NASDAQ Is Approaching Fractal Fragility
Chart 12Food And Beverage Outperformance Is Exhausted
Food And Beverage Outperformance Is Exhausted
Food And Beverage Outperformance Is Exhausted
Chart 13German Telecom Outperformance Has Started To Reverse
German Telecom Outperformance Has Started To Reverse
German Telecom Outperformance Has Started To Reverse
Chart 14Japanese Telecom Outperformance Vulnerable To Reversal
Japanese Telecom Outperformance Vulnerable To Reversal
Japanese Telecom Outperformance Vulnerable To Reversal
Chart 15ETH Is Approaching A Possible Capitulation
ETH Is Approaching A Possible Capitulation
ETH Is Approaching A Possible Capitulation
Chart 16The Strong Trend In The 18-Month-Out US Interest Rate Future Has Ended
The Strong Trend In The 18-Month-Out US Interest Rate Future Has Ended
The Strong Trend In The 18-Month-Out US Interest Rate Future Has Ended
Chart 17The Strong Downtrend In The 3 Year T-Bond Has Ended
The Strong Downtrend In The 3 Year T-Bond Has Ended
The Strong Downtrend In The 3 Year T-Bond Has Ended
Chart 18A Potential Switching Point From Tobacco Into Cannabis
A Potential Switching Point From Tobacco Into Cannabis
A Potential Switching Point From Tobacco Into Cannabis
Chart 19Biotech Is A Major Buy
Biotech Is A Major Buy
Biotech Is A Major Buy
Chart 20Norway's Outperformance Has Ended
Norway's Outperformance Has Ended
Norway's Outperformance Has Ended
Chart 21Cotton Versus Platinum Has Reversed
Cotton Versus Platinum Has Reversed
Cotton Versus Platinum Has Reversed
Chart 22Switzerland's Outperformance Vs. Germany Is Exhausted
Switzerland's Outperformance Vs. Germany Is Exhausted
Switzerland's Outperformance Vs. Germany Is Exhausted
Chart 23USD/EUR Is Vulnerable To Reversal
USD/EUR Is Vulnerable To Reversal
USD/EUR Is Vulnerable To Reversal
Chart 24The Outperformance Of MSCI Hong Kong Versus China Has Ended
The Outperformance Of MSCI Hong Kong Versus China Has Ended
The Outperformance Of MSCI Hong Kong Versus China Has Ended
Chart 25A Potential New Entry Point Into Petcare
A Potential New Entry Point Into Petcare
A Potential New Entry Point Into Petcare
Chart 26GBP/USD At A Potential Turning Point
GBP/USD At A Potential Turning Point
GBP/USD At A Potential Turning Point
Chart 27US Utilities Outperformance Vulnerable To Reversal
US Utilities Outperformance Vulnerable To Reversal
US Utilities Outperformance Vulnerable To Reversal
Chart 28The Outperformance Of Oil Versus Banks Is Exhausted
The Outperformance Of Oil Versus Banks Is Exhausted
The Outperformance Of Oil Versus Banks Is Exhausted
Fractal Trading System Fractal Trades
The World Is $20 Trillion Poorer. Why That Matters
The World Is $20 Trillion Poorer. Why That Matters
The World Is $20 Trillion Poorer. Why That Matters
The World Is $20 Trillion Poorer. Why That Matters
6-12 Month Recommendations Structural Recommendations Closed Fractal Trades Indicators To Watch - Bond Yields Chart II-1Indicators To Watch - Bond Yields - Euro Area
Indicators To Watch - Bond Yields - Euro Area
Indicators To Watch - Bond Yields - Euro Area
Chart II-2Indicators To Watch - Bond Yields - Europe Ex Euro Area
Indicators To Watch - Bond Yields - Europe Ex Euro Area
Indicators To Watch - Bond Yields - Europe Ex Euro Area
Chart II-3Indicators To Watch - Bond Yields - Asia
Indicators To Watch - Bond Yields - Asia
Indicators To Watch - Bond Yields - Asia
Chart II-4Indicators To Watch - Bond Yields - Other Developed
Indicators To Watch - Bond Yields - Other Developed
Indicators To Watch - Bond Yields - Other Developed
Indicators To Watch - Interest Rate Expectations Chart II-5Indicators To Watch - Interest Rate Expectations
Indicators To Watch - Interest Rate Expectations
Indicators To Watch - Interest Rate Expectations
Chart II-6Indicators To Watch - Interest Rate Expectations
Indicators To Watch - Interest Rate Expectations
Indicators To Watch - Interest Rate Expectations
Chart II-7Indicators To Watch - Interest Rate Expectations
Indicators To Watch - Interest Rate Expectations
Indicators To Watch - Interest Rate Expectations
Chart II-8Indicators To Watch - Interest Rate Expectations
Indicators To Watch - Interest Rate Expectations
Indicators To Watch - Interest Rate Expectations
The Global Investment Strategy service tactically downgraded equities in February but then upgraded them in May. The decision to upgrade equities to overweight in May was clearly premature, as stocks fell significantly in June. However, the rally in July has brought stocks back above the level where we upgraded them. Hence, we are using this opportunity to shift our recommended equity allocation back to neutral. While our base case forecast still foresees no recession in the US over the next 12 months, the risks to this view have increased. In Europe, we see a recession as more likely than not. China’s economy will remain under pressure due to Covid lockdowns, a shift in global spending away from manufactured goods, and a weakening property market. Even if the US avoids a recession, this could prove to be a bittersweet outcome for stocks: While earnings will hold up, the Fed is unlikely to cut rates next year, as markets are currently discounting. Real bond yields, which have already risen steeply this year, will rise further, weighing on equity valuations. Time to Take Some Chips Off the Table The consensus view among investors these days seems to be that the US is heading into a recession (or may already be in one), which will cause stocks to fall during the remainder of the year as earnings estimates are slashed. Looking out to 2023, most investors expect stocks to recover as the Fed begins to cut rates. I have the opposite view. While the risks to growth have increased, the US will probably avoid a recession over the next 12 months. This will allow stocks to rise modestly from current levels into year-end. However, as we enter 2023, it will become obvious that the Fed has no reason to cut rates. This could cause stocks to give up some of their gains, thus producing a fairly flat profile for equities over a 12-month horizon. In past reports, we have argued that the neutral rate of interest – the interest rate consistent with full employment and stable inflation – is higher than widely believed in the US. The nice thing about a high neutral rate is that it insulates the economy from tighter monetary policy: Even if the Fed raises rates to 3.8% next year, as the dots are currently forecasting, that will only put rates in the middle of our fair value range of 3.5%-to-4% for the US neutral rate. The downside of a high neutral rate is that eventually, investors will need to value stocks using a higher discount rate. The 10-year TIPS yield has already increased from -0.97% at the start of the year to +0.36% today. It will rise to 1%-to-1.5% by the middle of 2023. A higher-than-expected neutral rate also raises inflation risks because it could cause the Fed to inadvertently keep monetary policy too loose. Inflation is likely to fall significantly over the coming months as supply-chain bottlenecks ease. However, this decline in inflation could sow the seeds of its own demise: As inflation falls, real wage growth – which is now negative – will turn positive. Rising real wages will booster consumer confidence and spending. A reacceleration in inflation in the second half of next year could prompt the Fed to start hiking rates again in late 2023, thus producing a recession not in 2022 but in 2024. Outside the US, the outlook is more challenging. In Europe, a recession is more likely than not in the second half of the year. We expect the recession to be fairly short-lived, with European governments moving aggressively to mitigate the fallout from gas shortages through various income support schemes for the private sector. Chinese growth should rebound in the second half of the year. However, the specter of future lockdowns, the shift in global spending away from manufactured goods towards services, and the weakening property sector will continue to weigh on activity. We will have much more to say about this view change early next week. In the meantime, please review our report from last week entitled “The Downside Of A Soft Landing” for further color on some of the points made in this short bulletin. Tomorrow, my colleague Ritika Mankar will be sending you a Special Report making the case that the US economy’s ability to spawn mega-sized companies may become increasingly compromised over the next decade. Peter Berezin Chief Global Strategist peterb@bcaresearch.com Follow me on LinkedIn & Twitter.
Executive Summary Copper prices still face substantial downside (15-20% from current levels). The global copper market is shifting from a deficit to a considerable surplus over the next 12 to 18 months. Global copper supply will likely grow by 4-4.5% year on year in both 2022H2 and 2023, surpassing global copper demand growth of 2-3% during the same period. Global copper ore output will increase thanks to a slew of new projects and expansions this year and next year. Regarding copper demand in 2022H2 and 2023, China will be the main driver due to a moderate boost in traditional infrastructure investment, an acceleration in the build-up of green sources of electricity generation and surging penetration of new energy vehicles (NEV). Global Copper Supply Balance: Shifting From A Deficit To A Surplus
Global Copper Supply Balance: Shifting From A Deficit To A Surplus
Global Copper Supply Balance: Shifting From A Deficit To A Surplus
Bottom Line: According to our projections, the global copper market will move from a deficit to a material surplus later this year and in 2023. This will continue weighing on copper and related equity prices. Even though copper prices have plunged over 30% from their peak, we expect them to fall further (Chart 1). Chart 1Copper Prices & Copper Mining Stocks: The Decline Is Not Over
Copper Prices & Copper Mining Stocks: The Decline Is Not Over
Copper Prices & Copper Mining Stocks: The Decline Is Not Over
The main reason is that the global copper market will swing from a deficit to a surplus over the next 12 to 18 months (Chart 2). Global copper output growth is currently accelerating and will average 4% in 2022 and 4.5% in 2023. This will outpace the 2-3% annual growth in global copper demand during the same period. Chart 2Global Copper Supply Balance: Shifting From A Deficit To A Surplus
Global Copper Supply Balance: Shifting From A Deficit To A Surplus
Global Copper Supply Balance: Shifting From A Deficit To A Surplus
Beware Of Rising Copper Supply In 2022-23 The global copper market balance is in the process of swinging from a 283,000-ton deficit at the end of 2021 to a 464,000-ton surplus at the end of 2023, based on our calculations. In comparison, the International Copper Study Group (ICSG) expects a smaller surplus of 350,000 tons next year. There are two key estimates for our global copper supply balance calculation. Supply We expect global copper output to grow at 4% in 2022 and a slightly faster rate of 4.5% in 2023 as many new mines/expansions are coming on stream. Table 1 lists 12 major global copper mines that will add new copper ore supply in 2022. The combined copper ore output of these projects will increase the global copper ore supply by about 4.5% this year. Table 1Major Global New Copper Ore Supply In 2022
Global Copper Market: No Bottom Yet
Global Copper Market: No Bottom Yet
Robust copper ore production growth in the Democratic Republic of Congo (Congo), Zambia, Peru and China will boost the global copper ore supply in the next 12 to 18 months. Congo has been the largest contributor to global copper ore growth, accounting for over 60% of the increase in global copper ore output during the past five years. This country has already become the third largest producer of copper ore in the world. Chart 3Congo, Zambia and Peru Will Continue Boosting Their Copper Ore Supply
Congo, Zambia and Peru Will Continue Boosting Their Copper Ore Supply
Congo, Zambia and Peru Will Continue Boosting Their Copper Ore Supply
Its Kamoa-Kalula copper mine listed in Table 1 began producing copper concentrates in May 2021 and its production will increase exponentially into 2023 (Chart 3, top panel). Zambia is another country with substantial potential for copper ore output (Chart 3, middle panel). President Hakainde Hichilema, who was elected last year, expects to increase the country’s annual copper ore production from 800,000 tons to three million tons in terms of copper content in 10 years. This will translate into new supply of 220,000 tons per year and constitutes about 1% growth in global copper ore supply this year and next year. Peru is the world’s second largest copper ore producer. Despite the number of strikes rising in past two years, the country's copper ore output has stayed at a near historical high level (Chart 3, bottom panel). China, which is the world’s fourth largest producer, is also set to boost its copper ore output within the next few years. The increase in supply will be driven by the construction of Tibet's Qulong copper mine, the second phase expansion of the Duobaoshan and the Jiama copper mines, and the Chifeng Fubo project. Chart 4New Mines Are Also Coming On Stream In Chile, Australia and Canada
New Mines Are Also Coming On Stream In Chile, Australia and Canada
New Mines Are Also Coming On Stream In Chile, Australia and Canada
Copper ore output in other top producers such as Chile, Australia and Canada have already declined considerably in the past several years due to lower ore quality, the pandemic, drought, and protests (Chart 4). Nevertheless, new mines coming on stream will likely prevent copper ore output from falling further in these countries. For example, the Australian government expects the country’s copper mine output to increase by 15% in the 2022-2023 financial year and by another 7% in the 2023-2024 financial year. Regarding Chile, the world’s largest copper ore producer (representing 26% of the world total), we expect copper ore output to increase over the next 12 to 18 months after declining for three consecutive years. The reason for this optimism is that the Quebrada Blanca Phase 2 (QB2) project is expected to begin production in the second half of 2022. The company estimates that QB2 copper output over the first five years will average 286,000 tons per year. This is equal to 1.3% of annual global copper output. The same company is also considering a third phase for the project, which could significantly boost capacity in the longer term. That said, investments in Chilean copper mining may struggle over the long term if the proposed mining royalties increase1 gets passed in September. Table 2The World’s Top 10 Copper Producing Companies’ Capex investment In 2022 & 2023
Global Copper Market: No Bottom Yet
Global Copper Market: No Bottom Yet
At a company level, Table 2 shows that the capex of the world’s top 10 copper producing companies has been planned to increase by 21% in 2022 and remain at an elevated level in 2023. Such large capex seems to support the strong copper ore output growth forecasts shown in Table 1. Demand We expect global copper consumption to grow by 2.5% in 2022 and a slightly higher rate of 3% in 2023. Table 3 shows our growth estimates for this year and next year for China, the US, the EU, and the rest of world. This year and in 2023, red metal consumption will likely rebound in China and will experience a slowdown in the rest of the world (Chart 5). We expect copper demand growth in China to recover from last year’s contraction to post 3% growth this year and then accelerate to 4% in 2023. A detailed discussion of Chinese copper demand is presented below. Copper demand growth in both the US and the EU is set to slow as their pandemic-triggered overspending on goods ex-autos has run its course (Chart 6). Given that the US lags the EU in terms of NEV sales/production and new energy development, we expect a lower growth in the US (0-2%) versus in the EU (2-4%). The ongoing energy crisis in the EU has incentivized the bloc to expedite its transition to green sources of energy. As a result, its copper demand will rise faster than copper demand in the US. Chart 5Global Copper Consumption: A Moderate Rise Across Regions
Global Copper Consumption: A Moderate Rise Across Regions
Global Copper Consumption: A Moderate Rise Across Regions
Chart 6Decelerating Copper Demand Growth In The US and The EU
Decelerating Copper Demand Growth In The US and The EU
Decelerating Copper Demand Growth In The US and The EU
Using these economies’ respective shares in global copper consumption in 2021, we estimate global copper consumption growth of 2.5% for 2022 and 3% for 2023 (Table 3). We are well aware that global copper demand from green sources – electric vehicles, wind turbines, solar panels and charging poles – will continue booming. Yet, their share of global copper consumption is about 4.2% according to our estimates (Table 4). It is too small to have any substantial effect on global copper demand in next 18 months. Table 3Global Copper Consumption Growth Forecast For 2022 & 2023
Global Copper Market: No Bottom Yet
Global Copper Market: No Bottom Yet
Table 4Global Green Demand For Copper
Global Copper Market: No Bottom Yet
Global Copper Market: No Bottom Yet
Bottom Line: Global copper demand growth will likely fall short of copper supply in the next 18 months. Consequently, we expect the global copper market to swing from a supply deficit to a supply surplus over the next 12 to 18 months. Chinese Copper Demand Why do we expect Chinese copper demand to grow at 3% in 2022 and 4% in 2023? Table 5 illustrates our rough estimates of the copper consumption growth from China’s main sources of red metal consumption. Table 5Chinese Underlying Copper Consumption: Growth Estimates For 2022 & 2023
Global Copper Market: No Bottom Yet
Global Copper Market: No Bottom Yet
The power sector is the largest copper user as this metal is among the best conductors of electricity. The metal is used in high-, medium-, and low-voltage power networks. Chart 7The Power Sector Will Be The Main Driver Of Chinese Copper Demand
The Power Sector Will Be The Main Driver Of Chinese Copper Demand
The Power Sector Will Be The Main Driver Of Chinese Copper Demand
Authorities will ensure a rapid expansion of renewable energy like wind power and solar power, as well as continue construction of smart power grids as the country strives to achieve its ambitious targets for 2030 peak carbon dioxide emissions and 2060 net-zero carbon dioxide emissions. Investment in the new and old power sector grew by about 4% y/y in nominal terms in the past 12 months (Chart 7). Production of power generation equipment output has risen by 8% y/y in real terms during the same period. All together, we forecast that the copper consumption from the power sector will grow by approximately 5% year on year both this year and next year. Chart 8Mean-Reversion IN The Appliance Sector
Mean-Reversion IN The Appliance Sector
Mean-Reversion IN The Appliance Sector
The output of air conditioner, freezer and refrigerator production are all currently in contraction (Chart 8). The global “stay-at-home” economy significantly boosted Chinese exports of air conditioners, freezers, and refrigerators in 2020 and 2021. These appliances are all durable goods, and consumers who had already purchased them are unlikely to buy again this year and next year. Thus, we expect a 3% contraction in copper use this year and a slight growth of 2% next year from this industry Capital expenditures in the transportation network will improve from current zero growth, and production of traditional automobiles may increase again (Chart 9). Meanwhile, NEV output and construction of charging poles will continue booming (Chart 10). NEV uses more copper per car than the traditional autos, and charging poles also use copper. Putting all this together, we forecast a 3% and 4% year-on-year growth of copper consumption in the transportation sector in 2022 and 2023, respectively. Assuming there will be two million more NEVs this year, copper use will increase by an additional 160,000 tons, equaling to about a 1.2% increase in Chinese copper consumption. Chart 9Copper Demand From The Transportation Sector: Supported By Rebounding Traditional Auto Sales...
Copper Demand From The Transportation Sector: Supported By Rebounding Traditional Auto Sales...
Copper Demand From The Transportation Sector: Supported By Rebounding Traditional Auto Sales...
Chart 10...As Well As Surging NEV Sales
...As Well As Surging NEV Sales
...As Well As Surging NEV Sales
Copper or copper base alloys are used in printed circuit boards, electronic connectors, as well as in many semiconductor products. The tech-related new infrastructure, which includes information transmission, software, and information technology services, such as 5G networks, industrial internet, and data centers, will remain the government’s focus in the coming years. Tech-related new infrastructure investment increased by 20% year on year in the January – June period (Chart 11). We expect year-on-year copper usage growth in this sector to be 15% in 2022 and 12% in 2023. Chart 11Copper Demand Will Benefit From Strong Tech Investment
Copper Demand Will Benefit From Strong Tech Investment
Copper Demand Will Benefit From Strong Tech Investment
Chart 12Chinese Property Market Is Negative For Copper Demand
Chinese Property Market Is Negative For Copper Demand
Chinese Property Market Is Negative For Copper Demand
The Chinese property market is in deep trouble. Our broad measure of China’s building construction activity/building area starts contracted 15% year on year in the second quarter of this year, and completions grew only moderately at 5% during the same period (Chart 12). Assuming half of this sector’s usage is in building area starts and the other half in completions, we expect the copper consumption in this sector to contract by 10% y/y in 2022. Next year, we expect the contraction to narrow to 5% as the government implements policies to support completions. Bottom Line: Chinese copper demand will increase moderately by 3% in 2022 and 4% in 2023. Investment Implications The global copper market is moving towards a surplus. This is one of reasons behind the red metal’s 30% price plunge since March 4, 2022. Copper inventories on global exchanges are low. Yet, that is not a sufficient reason to be bullish on copper prices as we elaborate in Box 1. Box 1 What About Copper Inventories? We believe inventory data released by exchanges – LME, COMEX and Shanghai Futures Exchange - do not provide a full picture of copper inventories. First, troughs in copper inventories – often but not always – coincide with peaks in copper prices and tops in inventories with bottoms in their prices (Chart 13). Hence, low inventory levels are not a reason to be bullish on copper prices. Chart 13Level of Copper Inventories In Exchanges Is Not A Good Forward-looking Indicator For Prices
Copper Inventories In Exchanges: These Do Not Provide A Full Picture Of Copper Inventories
Copper Inventories In Exchanges: These Do Not Provide A Full Picture Of Copper Inventories
Second, inventory data from commodity exchanges may overstate the supply tightness as there might have been some build-up in unreported inventories. The basis is that many end-users (companies) around the world might purchase copper for the purposes of hoarding and speculation. These inventories are not counted in the data published by commodity exchanges. Chart 14Copper: Bearish Sentiment Is Not Extreme Yet
Copper: Bearish Sentiment Is Not Extreme Yet
Copper: Bearish Sentiment Is Not Extreme Yet
Net speculative positions of copper in the US as a share of total open interest have already tanked to near multi-year low levels (Chart 14, top panel). However, bearish sentiment is still far from the extreme level (Chart 14, bottom panel). Putting all together, copper prices are vulnerable to the downside over the next 6 to 12 months. We expect a 15%-20% downside in copper prices from the current level. Shares prices of copper miners always move closely with red metal prices. Equity portfolios should underweight copper miners. Ellen JingYuan He Associate Vice President ellenj@bcaresearch.com Footnotes 1 The proposed tax reform applies to copper producers of more than 50,000 tons and combines the ad-valorem component based on the copper price with a tax based on mining operating margins (MOM). The ad-valorem component has two regimes depending on whether the production volume is above or below 200,000 tons. For the larger producers, the effective rate applied will move in a range of 1% to 4% of revenue depending on the copper price, while below 200,000 tons the rate will be between 1.0% and 1.6% of revenue. Source: "Proposed Tax Reform Weakens Cost Positions for Chilean Miners,” Fitch Ratings, July 7, 2022, www.fitchratings.com. Strategic Themes Cyclical Recommendations
Executive Summary Iran Reaches Nuclear Breakout
Biden And Putin Court The Middle East
Biden And Putin Court The Middle East
The next geopolitical crisis will stem from the Middle East. The US, Russia, and China are striving for greater influence there and Iran’s nuclear quest is reaching a critical juncture. The risk of US-Israeli attacks against Iran remains 40% over the medium term and will rise sharply if Iran attempts to construct a deliverable nuclear device. Saudi Arabia may increase oil production but only if global demand holds up, which OPEC will assess at its August 3 meeting. Global growth risks will prevail in the short term and reduce its urgency. Russia will continue to squeeze supplies of energy and food for the outside world. The restart of Nord Stream 1 and the Turkey-brokered grain export proposal are unreliable signals. Russia’s aim is victory in Ukraine and any leverage will be used. The US may be done with the Middle East but the Middle East may not be done with the US. Structurally we remain bullish on gold and European defense stocks but we are booking 17% and 18% gains on our current trades. The deterioration in global growth and likely pullback in inflation will temporarily undercut these trades. Tactical Recommendation Inception Date Return LONG GOLD (CLOSED) 2019-06-12 17.1% LONG EUROPEAN AEROSPACE & DEFENSE / EUROPEAN TECH EQUITIES (CLOSED) 2022-03-18 17.9% Bottom Line: Global demand is weakening, which will weigh on bond yields and commodities. Yet underlying oil supply constraints persist – and US-Iran conflict will exacerbate global stagflation. Feature Chart 1Equity Volatility And Oil Price Volatility
Equity Volatility And Oil Price Volatility
Equity Volatility And Oil Price Volatility
US President Joe Biden visited Saudi Arabia last week in a belated attempt to make amends with OPEC, increase oil production, and reduce inflation ahead of the midterm election. Biden also visited Israel to deter Iran, which is the next geopolitical crisis that markets are underrating. Meanwhile Russian President Vladimir Putin went to Iran on his second trip outside of Russia since this year’s invasion of Ukraine. Putin sought an ally in his conflict with the West, while also negotiating with Turkish President Recep Erdogan, who sought to position himself as a regional power broker. In this report we analyze Biden’s and Putin’s trips and what they mean for the global economy and macro investors. Macroeconomics is bearish for oil in the short term but geopolitics is bullish for oil in the short-to-medium term. The result is volatility (Chart 1). OPEC May Pump More Oil But Not On Biden’s Time Frame Here are the important developments from Biden’s trip: A credible threat against Iran: The US and Israel issued a joint declaration underscoring their red line against Iranian nuclear weaponization.1 Meanwhile the Iranians claimed to have achieved “nuclear breakout,” i.e. enough highly enriched uranium to construct a nuclear device (Chart 2). A balance-of-power coalition to contain Iran: Israel and Saudi Arabia improved relations on the margin. Each took action to build on the strategic détente between Israel and various Arab states that is embodied in the 2020 Abraham Accords.2 This strategic détente has staying power because it is a self-interested attempt by the various nations to protect themselves against common rivals, particularly Iran (Chart 3). Biden also tried to set up a missile defense network with Israel and the Arabs, although it was not finalized.3 Chart 2Iran Reaches Nuclear Breakout
Biden And Putin Court The Middle East
Biden And Putin Court The Middle East
A reaffirmed US-Saudi partnership: The US and Saudi Arabia reaffirmed their partnership despite a rocky patch over the past decade. The rocky patch arises from US energy independence, China’s growth, and US attempts to normalize ties with Iran (Chart 4). These trends caused the Saudis to doubt US support and to view China as a strategic hedge. Chart 3Iran: Surrounded And Outgunned
Biden And Putin Court The Middle East
Biden And Putin Court The Middle East
President Biden came into office aiming to redo the Iran deal and halt arms sales to Saudi Arabia. Since then he has been chastened by high energy prices, a low approval rating, and hawkish Iranian policy. On this trip he came cap in hand to the Saudis in a classic example of geopolitical constraints. If the US-Iran deal is verifiably dead, then US-Saudi ties will improve sustainably. (Though of course the Saudis will still do business with China and even start trading with China in the renminbi.) What global investors want to know is whether the Saudis and OPEC will pump more oil. The answer is maybe someday. The Saudis will increase production to save the global business cycle but not the Democrats’ election cycle. They told Biden that they will increase production only if there is sufficient global demand. Global Brent crude prices have fallen by 6% since May, when Biden booked his trip, so the kingdom is not in a great rush to pump more. Its economy is doing well this year (Chart 5). Chart 4Drivers Of Saudi Anxiety
Drivers Of Saudi Anxiety
Drivers Of Saudi Anxiety
Chart 5Saudis Won't Pump If Demand Is Weak
Saudis Won't Pump If Demand Is Weak
Saudis Won't Pump If Demand Is Weak
At the same time, if global demand rebounds, the Saudis will not want global supply constraints to generate punitive prices that cap the rebound or kill the business cycle. After all, a global recession would deplete Saudi coffers, set back the regime’s economic reforms, exacerbate social problems, and potentially stir up political dissent (Chart 6). Related Report Geopolitical StrategyThird Quarter Geopolitical Outlook: Thunder And Lightning Hence the Saudis will not increase production substantially until they have assessed the global economy and discussed the outlook with the other members of the OPEC cartel in August and September, when the July 2021 agreement to increase production expires. We expect global demand to weaken as Europe and China continue to struggle. Our Commodity & Energy Strategist Bob Ryan argues that further escalation in the energy war between the EU and Russia could push prices above $220 per barrel by Q4 2023, whereas an economic collapse could push Brent down to $60 per barrel. His base case Brent price forecast remains $110 per barrel on average in 2022 and $117 per barrel in 2023 (Chart 7). Chart 6Saudis Will Pump To Prevent Recession
Saudis Will Pump To Prevent Recession
Saudis Will Pump To Prevent Recession
Chart 7BCA's July 2022 Oil Price Forecast
BCA's July 2022 Oil Price Forecast
BCA's July 2022 Oil Price Forecast
The geopolitical view suggests upside oil risks over the short-to-medium time frame but the macroeconomic view suggests that downside risks will be priced first. Bottom Line: Saudi Arabia may increase production but not at any US president’s beck and call. The Saudis are not focused on US elections, they benefit from the current level of prices, and they do not suffer if Republicans take Congress in November. The downside risk in oil prices stems from demand disappointments in global growth (especially China) rather than any immediate shifts in Saudi production discipline. Volatility will remain high. US-Iran Talks: Dying But Not Dead Yet In fact the Middle East underscores underlying and structural oil supply constraints despite falling global demand. While Iran is a perennial geopolitical risk, the world is reaching a critical juncture over the next couple of years. Investors should not assume that Iran can quietly achieve nuclear arms like North Korea. Since August 2021 we have argued that the US and Iran would fail to put back together the 2015 nuclear deal (the Joint Comprehensive Plan of Action or JCPA). This failure would in turn lead to renewed instability across the Middle East and sporadic supply disruptions as the different nations trade military threats and potentially engage in direct warfare. This forecast is on track after Biden’s and Putin’s trip – but we cannot yet say that it is fully confirmed. Biden’s joint declaration with Israeli Prime Minister Yair Lapid closed any daylight that existed between the US and Israel. Given that there was some doubt about the intentions of Biden and the Democrats, it is now crystal clear that the US is determined to prevent Iran from getting nuclear weapons even if it requires military action. The US specifically said that it will use “all instruments of national power” to prevent that outcome. Chart 8Iran Not Forced To Capitulate
Iran Not Forced To Capitulate
Iran Not Forced To Capitulate
Judging by the tone of the statement, the Israelis wrote the document and Biden signed it.4 Biden’s foreign policy emphasizes shoring up US alliances and partnerships, which means letting allies and partners set the line. Israel’s Begin Doctrine – which says that Israel is willing to attack unilaterally and preemptively to prevent a hostile neighbor from obtaining nuclear weapons – has been reinforced. The US is making a final effort to intimidate Iran into rejoining the deal. By clearly and unequivocally reiterating its stance on nuclear weapons, and removing doubts about its stance on Israel, there is still a chance that the Iranian calculus could change. This is possible notwithstanding Ayatollah Khamenei’s friendliness with Putin and criticisms of western deception.5 After all, why would the Iranians want to be attacked by the US and Israeli militaries? Iran will need to think very carefully about what it does next. Khamenei just turned 83 years old and is trying to secure the Islamic Republic’s power transition and survival after his death. Here are the risks: Iran’s economy, buoyed by the commodity cycle, is not so weak as to force Khamenei to capitulate. Back in 2015 oil prices had collapsed and his country was diplomatically isolated. Today the economy has somewhat weathered the storm of the US’s maximum pressure sanctions (Chart 8). Iran is in bad shape but it has not been brought to its knees. Another risk is that Khamenei believes the American public lacks the appetite for war. Americans say they are weary of Middle Eastern wars and do not feel particularly threatened by Iran. However, this would be a miscalculation. US war-weariness is nearing the end of its course. The US engages in a major military expedition roughly every decade. Americans are restless and divided – and the political elite fear populism – so a new foreign distraction is not as unlikely as the consensus holds. Moreover a nuclear Iran is not an idle threat but would trigger a regional nuclear arms race and overturn the US grand strategy of maintaining a balance of power in the Middle East (as in other regions). In short, the US government can easily mobilize the people to accept air strikes to prevent Iran from going nuclear because there is latent animosity toward Iran in both political parties (Chart 9). Chart 9Risk: Iran Overrates US War-Weariness
Biden And Putin Court The Middle East
Biden And Putin Court The Middle East
Another risk is that Iran forges ahead believing that the US and Israel are unwilling or unable to attack and destroy its nuclear program. The western powers might opt for containment like they did with North Korea or they might attack and fail to eliminate the program. This is hard to believe but Iran clearly cannot accept US security guarantees as an alternative to a nuclear deterrent when it seeks regime survival. At the same time Russia is courting Iran, encouraging it to join forces against the American empire. Iran is planning to sell drones to Russia for use in Ukraine, while Russia is maintaining nuclear and defense cooperation with Iran. Putin’s trip highlighted a growing strategic partnership despite a low base of economic ties (Chart 10).6 Chart 10Russo-Iranian Ties
Russo-Iranian Ties
Russo-Iranian Ties
Chart 11West Vulnerable To Middle East War
Biden And Putin Court The Middle East
Biden And Putin Court The Middle East
While Russia does not have an interest in a nuclear-armed Iran, it is not afraid of Iran alone, and it would benefit enormously if the US and Israel got bogged down in a new war that destabilized the Middle East. Oil prices would rise, the US would be distracted, and Europe would be even more vulnerable (Chart 11). Chart 12China's Slowdown And Dependency On Middle East
China's Slowdown And Dependency On Middle East
China's Slowdown And Dependency On Middle East
China’s interest is different. It would prefer for Iran to undermine the West by means of a subtle and long-term game of economic engagement rather than a destabilizing war in the region that would upset China’s already weak economy. However, Beijing will not join with the US against Iran, especially if Iran and Russia are aligned. Ultimately China needs to access Iranian energy reserves via overland routes so that it gains greater supply security vis-à-vis the American navy (Chart 12). Since June 2019, we have maintained 40% odds of a military conflict with Iran. The logic is outlined in Diagram 1, which we have not changed. Conflict can take various forms since the western powers prefer sabotage or cyber-attacks to outright assault. But in the end preventing nuclear weapons may require air strikes – and victory is not at all guaranteed. We are very close to moving to the next branch in Diagram 1, which would imply odds of military conflict rise from 40% to 80%. We are not making that call yet but we are getting nervous. Diagram 1Iran Nuclear Crisis: Decision Tree
Biden And Putin Court The Middle East
Biden And Putin Court The Middle East
Moreover it is the saber rattling around this process – including an extensive Iranian campaign to deter attack – that will disrupt oil distribution and transport sooner rather than later. Bottom Line: The US and Iran could still find diplomatic accommodation to avoid the next step in our decision tree. Therefore we are keeping the odds of war at a subjective 40%. But we have reached a critical juncture. The next step in the process entails a major increase in the odds of air strikes. Putin’s Supply Squeeze Will Continue As we go to press, financial markets are reacting to President Putin’s marginal easing of Russian political pressure on food and energy supplies. First, Putin took steps toward a deal, proposed by Turkish President Erdogan, to allow Ukrainian grain exports to resume from the Black Sea. Second, Putin allowed a partial restart of the Nord Stream 1 natural gas pipeline, after a total cutoff occurred during the regular, annual maintenance period. However, these moves should be kept into perspective. Nord Stream 1 is still operating at only 40% of capacity. Russia reduced the flow by 60% after the EU agreed to impose a near-total ban on Russian oil exports by the end of the year. Russia is imposing pain on the European economy in pursuit of its strategic objectives and will continue to throttle Europe’s natural gas supply. Russia’s aims are as follows: (1) break up European consensus on Russia and prevent a natural gas embargo from being implemented in future (2) pressure Europe into negotiating a ceasefire in Ukraine that legitimizes Russia’s conquests (3) underscore Russia’s new red line against NATO military deployments in Finland and Sweden. Europe, for its part, will continue to diversify its natural gas sources as rapidly as possible to reduce Russia’s leverage. The European Commission is asking countries to decrease their natural gas consumption by 15% from August to March. This will require rationing regardless of Russia’s supply squeeze. The collapse in trust incentivizes Russia to use its leverage while it still has it and Europe to try to take that leverage away. The economic costs are frontloaded, particularly this winter. The same goes for the Turkish proposal to resume grain exports. Russia will continue to blockade Ukraine until it achieves its military objectives. The blockade will be tightened or loosened as necessary to achieve diplomatic goals. Part of the reason Russia invaded in the first place was to seize control of Ukraine’s coast and hold the country’s ports, trade, and economy hostage. Bottom Line: Russia’s relaxation of food and energy flows is not reliable. Flows will wax and wane depending on the status of strategic negotiations with the West. Europe’s economy will continue to suffer from a Russia-induced supply squeeze until Russia achieves a ceasefire in Ukraine. So will emerging markets that depend on grain imports, such as Turkey, Egypt, and Pakistan. Investment Takeaways The critical juncture has arrived for our Iran view. If Iran does not start returning to nuclear compliance soon, then a fateful path of conflict will be embarked upon. The Saudis will not give Biden more oil barrels just yet. But they may end up doing that if global demand holds up and the US reassures them that their regional security needs will be met. First, the path for oil over the next year will depend on the path of global demand. Our view is negative, with Europe heading toward recession, China struggling to stimulate its economy effectively, and the Fed unlikely to achieve a soft landing. Second, the path of conflict with Iran will lead to a higher frequency of oil supply disruptions across the Middle East that will start happening very quickly after the US-Iran talks are pronounced dead. In other words, oil prices will be volatile in a stagflationary environment. In addition, while inflation might roll over for various reasons, it is not likely to occur because of any special large actions by Saudi Arabia. The Saudis are waiting on global cues. Of these, China is the most important. We are booking a 17% gain on our long gold trade as real rates rise and China’s economy deteriorates (Chart 13). This is in line with our Commodity & Energy Strategy, which is also stepping aside on gold for now. Longer term we remain constructive as we see a secular rise in geopolitical risk and persistent inflation problems. Chart 13Book Gains On Gold ... For Now
Book Gains On Gold ... For Now
Book Gains On Gold ... For Now
We are booking an 18% gain on our long European defense / short European tech trade. Falling bond yields will benefit European tech (Chart 14). We remain bullish on European and global defense stocks. Chart 14Book Gains On EU Defense Vs Tech ... For Now
Book Gains On EU Defense Vs Tech ... For Now
Book Gains On EU Defense Vs Tech ... For Now
Chart 15Markets Underrate Middle East Geopolitical Risk
Biden And Putin Court The Middle East
Biden And Putin Court The Middle East
Stay long US equities relative to UAE equities. Middle Eastern geopolitical risk is underrated (Chart 15). Matt Gertken Chief Geopolitical Strategist mattg@bcaresearch.com Footnotes 1 The White House, “The Jerusalem U.S.-Israel Strategic Partnership Joint Declaration,” July 14, 2022, whitehouse.gov. 2 Israel and the US will remove international peacekeepers from the formerly Egyptian Red Sea islands of Tiran and Sanafir, which clears the way for Saudi Arabia to turn them into tourist destinations. Saudi Arabia also removed its tight airspace restrictions on Israel, enabling civilian Israeli airlines to fly through Saudi airspace on normal basis. Of course, Saudi allowance for Israeli military flights to pass through Saudi airspace would be an important question in any future military operation against Iran. 3 The US has long wanted regional missile defense integration. The Biden administration is proposing “integrated air defense cooperation” that would include Israel as well as the Gulf Cooperation Council (GCC). A regional “air and missile defense architecture” would counter drones and missiles from rival states and non-state actors such as Iran and its militant proxies. Simultaneously the Israelis are putting forward the proposed Middle East Air Defense Alliance (MEAD) in meetings with the same GCC nations. Going forward, Iran’s nuclear ambitions will give more impetus to these attempts to cooperate on air defense. 4 This is apparent from the hard line on Iran and the relatively soft line on Russia in the document. Israel is wary of taking too hard of a line against Russia because of its security concerns in Syria where Russian forces are present. See footnote 1 above. 5 Khamenei called for long-term cooperation between Russia and Iran; he justified Russia’s invasion of Ukraine as a defense against NATO encroachment; he called for the removal of the US dollar as the global reserve currency. See “Khamenei: Tehran, Moscow must stay vigilant against Western deception,” Israel Hayom, July 20, 2022, israelhayom.com. 6 Russia’s natural gas champion Gazprom signed an ostensible $40 billion memorandum of understanding with Iran’s National Oil Company to develop gas fields and pipelines. See Nadeen Ebrahim, “Iran and Russia’s friendship is more complicated than it seems,” CNN, July 20, 2022, cnn.com. However, while there are longstanding obstacles to Russo-Iranian cooperation, the West’s tough new sanctions on Russia and EU diversification will make Moscow more willing to invest in Iran. Strategic Themes Open Tactical Positions (0-6 Months) Open Cyclical Recommendations (6-18 Months) Regional Geopolitical Risk Matrix
Listen to a short summary of this report. Executive Summary The odds of a recession in the US are lower than widely perceived. The probability of a recession is higher in Europe, although this week’s partial resumption of gas flows through the Nord Stream 1 pipeline, along with increased use of coal-fired power plants, should soften the blow. Chinese growth should rebound in the second half of the year. However, the specter of future lockdowns, the shift in global spending away from manufactured goods towards services, and the weakening property sector will continue to weigh on activity. With the Twentieth Party Congress slated for later this year, it is increasingly likely that the authorities will open up a firehose of stimulus. Fading recession risks will buoy stocks in the near term. However, a brighter economic outlook also means that the Fed, and several other central banks, may see little need to cut policy rates in 2023, as the markets are currently discounting. The end result is that government bond yields will rise from current levels, implying that stock valuations will not return to last year’s levels even if a recession is averted. After Rapidly Raising Rates, Markets Expect Some DM Central Banks To Start Easing Next Year
The Downside Of A Soft Landing
The Downside Of A Soft Landing
Bottom Line: We recommend a modest overweight on global equities for now but would turn neutral if the S&P 500 were to rise above 4,050. Dear Client, I am delighted to announce that Ritika Mankar, CFA, has joined the Global Investment Strategy team. Ritika will be writing occasional special reports on a variety of topical issues. Next week, she will make the case that the US economy’s ability to spawn mega-sized companies may become increasingly compromised over the next decade. Best regards, Peter Berezin, Chief Global Strategist The Case for a Soft Landing in the US Chart 1Cyclicals Underperformed Defensives As Recession Risks Intensified
Cyclicals Underperformed Defensives As Recession Risks Intensified
Cyclicals Underperformed Defensives As Recession Risks Intensified
Over the last few months, investors have become concerned that the Fed and many other central banks will need to engineer a recession in order to bring inflation down to more comfortable levels. While these fears have abated over the past trading week, they still continue to dominate market action (Chart 1). We place the odds of a US recession at about 40%. This is arguably more optimistic than the consensus view. According to Bank of America, the majority of fund managers saw recession as likely in this month’s survey. Not surprisingly, investors consider recession to be a major risk for equities over the next 12 months (Chart 2). Chart 2Many Investors Now See Recession As Baked In The Cake
The Downside Of A Soft Landing
The Downside Of A Soft Landing
Even if a recession does occur, we have contended that it will likely be a mild one, perhaps so mild that it will be difficult to distinguish it from a soft landing. A number of things make a soft landing in the US more probable than in the past: Labor supply has scope to increase. The labor participation rate is still 1.2 percentage points below its pre-pandemic level, two-thirds of which is due to decreased participation among workers under the age of 55 (Chart 3). The share of workers holding multiple jobs is also below its pre-pandemic level (Chart 4). The number of multiple job holders has been rising briskly lately. That is one reason why job growth in the payroll survey – which double counts workers if they hold more than one job – has been stronger than job growth in the household survey. Increased labor supply would obviate the need for the Fed to take drastic actions to curtail labor demand in its effort to restore balance to the labor market. Chart 3Labor Supply Has Scope To Rise
Labor Supply Has Scope To Rise
Labor Supply Has Scope To Rise
Chart 4The Number Of Multiple Job Holders Is Still Below Pre-Pandemic Levels
The Number Of Multiple Job Holders Is Still Below Pre-Pandemic Levels
The Number Of Multiple Job Holders Is Still Below Pre-Pandemic Levels
A high level of job openings creates a moat around the labor market. There are almost two times as many job openings as there are unemployed workers in the US (Chart 5). Many firms are likely to pull job openings before they cut jobs in response to a slowing economy. A high level of job openings will also allow workers who lose their jobs to find employment more quickly than usual, thus limiting the rise in so-called frictional unemployment. It is worth noting that the job openings rate has declined from a record 7.3% in March to a still-high 6.9% in May, with no change in the unemployment rate over this period. Chart 5A High Level Of Job Openings Creates A Moat Around The Labor Market
A High Level Of Job Openings Creates A Moat Around The Labor Market
A High Level Of Job Openings Creates A Moat Around The Labor Market
A steep Phillips curve implies that only a modest increase in unemployment may be necessary to knock down inflation towards the Fed’s target. Just as was the case in the 1960s, the Phillips curve has proven to be kinked near full employment (Chart 6). Unlike in the late 1960s, however, when rising realized inflation caused long-term inflation expectations to reset higher, expectations have remained well anchored this time around (Chart 7). Chart 6The Phillips Curve Is Kinked At Very Low Levels Of Unemployment
The Downside Of A Soft Landing
The Downside Of A Soft Landing
Chart 7Long-Term Inflation Expectations Are Well Anchored
Long-Term Inflation Expectations Are Well Anchored
Long-Term Inflation Expectations Are Well Anchored
The unwinding of pandemic and war-related dislocations should push down inflation. A recent study by the San Francisco Fed estimates that about half of May’s PCE inflation print was the result of supply-side disturbances (Chart 8). While the ongoing war in Ukraine and the threat of another Covid wave in China will continue to unsettle global supply chains, these problems should fade over time. Falling inflation would allow real wages to start rising again. This would bolster confidence, making a soft landing more likely (Chart 9). Chart 8Supply Factors Explain Half Of The Increase In Prices Over The Past Year
The Downside Of A Soft Landing
The Downside Of A Soft Landing
Chart 9Positive Real Wage Growth Will Bolster Consumer Confidence
Positive Real Wage Growth Will Bolster Consumer Confidence
Positive Real Wage Growth Will Bolster Consumer Confidence
A lack of major financial imbalances makes the US economy more resilient to economic shocks. As a share of disposable income, US household debt is 34 percentage points below its 2008 peak (Chart 10). Relative to net worth, household debt is at multi-decade lows. About two-thirds of mortgages carry a FICO score above 760 compared to only one-third during the housing bubble (Chart 11). Non-mortgage consumer credit also remains in good shape, as my colleague Doug Peta elaborated in this week’s US Investment Strategy report. While corporate debt has risen over the past decade, the ratio of corporate debt-to-assets today is still below where it was during the 1990s. Moreover, thanks to stronger corporate profitability, the interest coverage ratio is near an all-time high (Chart 12). Chart 10AUS Household Debt Is Not Especially High Anymore (I)
US Household Debt Is Not Especially High Anymore (I)
US Household Debt Is Not Especially High Anymore (I)
Chart 10BUS Household Debt Is Not Especially High Anymore (II)
US Household Debt Is Not Especially High Anymore (II)
US Household Debt Is Not Especially High Anymore (II)
Chart 11FICO Scores For Residential Mortgages Have Improved Considerably Since The Pre-GFC Housing Bubble
The Downside Of A Soft Landing
The Downside Of A Soft Landing
Chart 12Corporate Balance Sheets Are In Decent Shape
Corporate Balance Sheets Are In Decent Shape
Corporate Balance Sheets Are In Decent Shape
Chart 13Tight Supply Limits The Downside Risks To Housing
Tight Supply Limits The Downside Risks To Housing
Tight Supply Limits The Downside Risks To Housing
Just like the US does not suffer from major financial imbalances, it does not suffer from any major economic imbalances either. The homeowner vacancy rate is near a record low, which should put a floor under residential investment (Chart 13). Outside of investment in intellectual property, which is not especially sensitive to the business cycle, nonresidential investment is still below pre-pandemic levels and not much above where it was as a share of GDP during the Great Recession (Chart 14). Spending on consumer durable goods has retraced four-fifths of its pandemic surge, with little ill-effect on aggregate employment (Chart 15). Chart 14Outside Of IP, Nonresidential Investment Is Still Low
Outside Of IP, Nonresidential Investment Is Still Low
Outside Of IP, Nonresidential Investment Is Still Low
Chart 15Spending On Durable Goods Has Been Normalizing Without Derailing The Economy
Spending On Durable Goods Has Been Normalizing Without Derailing The Economy
Spending On Durable Goods Has Been Normalizing Without Derailing The Economy
Europe: A Deep Freeze Will Likely Be Avoided Chart 16Russia Can Potentially Cause Significant Economic Damage In The EU If It Closes The Taps
The Downside Of A Soft Landing
The Downside Of A Soft Landing
The macroeconomic picture is less benign outside the US. Four years ago, German diplomats laughed off warnings that their country had become dangerously dependent on Russian energy. They are not laughing anymore. German industry, just like industry across much of Europe, is facing a major energy crunch. The IMF estimates that output losses associated with a full Russian gas shutoff over the next 12 months could amount to as much as 2.7% of GDP in the EU (Chart 16). In Central and Eastern Europe, output could shrink by 6%. Among the major economies, Germany and Italy are the most at risk. Fortunately, Europe is finally stepping up to the challenge. The highly ambitious REPowerEU plan seeks to displace two-thirds of Russian gas by the end of 2022. The plan does not include any additional energy that could be generated by increased usage of coal-fired power plants, a strategy that the European political establishment (including the German Green Party!) has only recently begun to champion. It is possible that EU leaders felt the need to generate a crisis mentality to justify the decision to burn more coal. Dire warnings about how Europe is prepared to ration gas also send a message to Russia that the EU is ready to suffer in order to thwart Putin’s despotic regime. Whether Europe actually follows through is a different story. It is worth noting that the Nord Stream 1 pipeline resumed operations this week after Germany received, over Ukrainian objections, a repaired turbine from Canada. The resumption of partial flows through the pipeline, along with increased fiscal support for households and firms, reduces the risks of a “deep freeze” recession in Europe. The unveiling of the ECB’s new Transmission Protection Instrument (TPI) this week should also help anchor sovereign credit spreads across the euro area. While the exact conditions under which the TPI will be engaged have yet to be fleshed out, we expect the terms to be fairly liberal, reflecting not only the lessons learned from last decade’s euro debt crisis, but also to serve as a powerful bulwark against Putin’s efforts to destabilize the EU economy. China: Government’s Growth Target Looks Increasingly Unrealistic Stronger growth in China would help European exporters (Chart 17). Chinese real GDP grew by just 0.4% in the second quarter from a year earlier as the economy was battered by Covid lockdowns. Activity should pick up in the second half of the year, but at this point, the government’s 5.5% growth target looks completely unachievable. The specter of future lockdowns, the shift in global spending away from manufactured goods towards services, and the weakening Chinese property sector are all weighing on the economy (Chart 18). Chart 17European Exporters Would Welcome A Stronger Chinese Economy
European Exporters Would Welcome A Stronger Chinese Economy
European Exporters Would Welcome A Stronger Chinese Economy
The authorities will likely seek to stimulate the economy by allowing local governments to bring forward $220 billion in bond issuance that had been originally slated for 2023. The problem is that land sales – the main source of local government revenue – have collapsed. Worried about the ability of local governments to service their obligations, both retail investors and banks have shied away from buying local government debt. Chart 18A Slowing Property Market And Covid Lockdowns Have Been Weighing On The Chinese Economy
A Slowing Property Market And Covid Lockdowns Have Been Weighing On The Chinese Economy
A Slowing Property Market And Covid Lockdowns Have Been Weighing On The Chinese Economy
Meanwhile, the inability of property developers to secure adequate financing to complete construction projects has left a growing number of home buyers in the lurch. In most cases, these properties were purchased off-the-plan. Understandably, home buyers have balked at the prospect of having to make mortgage payments on properties that they do not possess. With the Twentieth Party Congress slated for later this year, it is increasingly likely that the authorities will open up a firehose of stimulus, including increased assistance for property developers and banks, as well as income-support measures for households. While such measures will not address China’s myriad structural problems, they will help keep the economy afloat. Equity Valuations in a Soft-Landing Scenario A few weeks ago, the consensus view was that stocks would tumble in the second half of the year as the global economy fell into recession but would then rally in 2023 as central banks began lowering rates. We argued the opposite, namely that stocks would likely rebound in the second half of the year as the economy outperformed expectations but would then face renewed pressure in 2023 as it became clear that the Fed and several other central banks had no reason to cut rates (Chart 19). Chart 19After Rapidly Raising Rates, Markets Expect Some DM Central Banks To Start Easing Next Year
The Downside Of A Soft Landing
The Downside Of A Soft Landing
Chart 20Real Rates Have Jumped This Year
Real Rates Have Jumped This Year
Real Rates Have Jumped This Year
In a baseline scenario where a recession is averted, we argued that the S&P 500 could rise to 4,500 (60% odds). In contrast, we noted that the S&P 500 could fall to 3,500 in a mild recession scenario (30% odds) and to 2,900 in a deep recession scenario (10% odds). It is worth stressing that even at 4,500, the S&P 500 would still be 11% lower in real terms than it was on January 4th. At the stock market’s peak in January, the 10-year TIPS yield stood at -0.91%, while the 30-year TIPS yield stood at -0.27%. Today, they stand at 0.58% and 0.93%, respectively (Chart 20). If real rates do not return to their prior lows, it is unlikely that equity valuations will return to their prior highs. This limits the upside for stocks, even in a soft-landing scenario. The sharp rally in stocks over the past week has priced out some of this recession risk, moving equity valuations closer towards what we regard as fair value. As we noted last week, we will turn neutral on equities if the S&P 500 were to rise above 4,050. As we go to press, we are only 1.3% from that level. Peter Berezin Chief Global Strategist peterb@bcaresearch.com Follow me on LinkedIn & Twitter Global Investment Strategy View Matrix
The Downside Of A Soft Landing
The Downside Of A Soft Landing
Special Trade Recommendations Current MacroQuant Model Scores
The Downside Of A Soft Landing
The Downside Of A Soft Landing
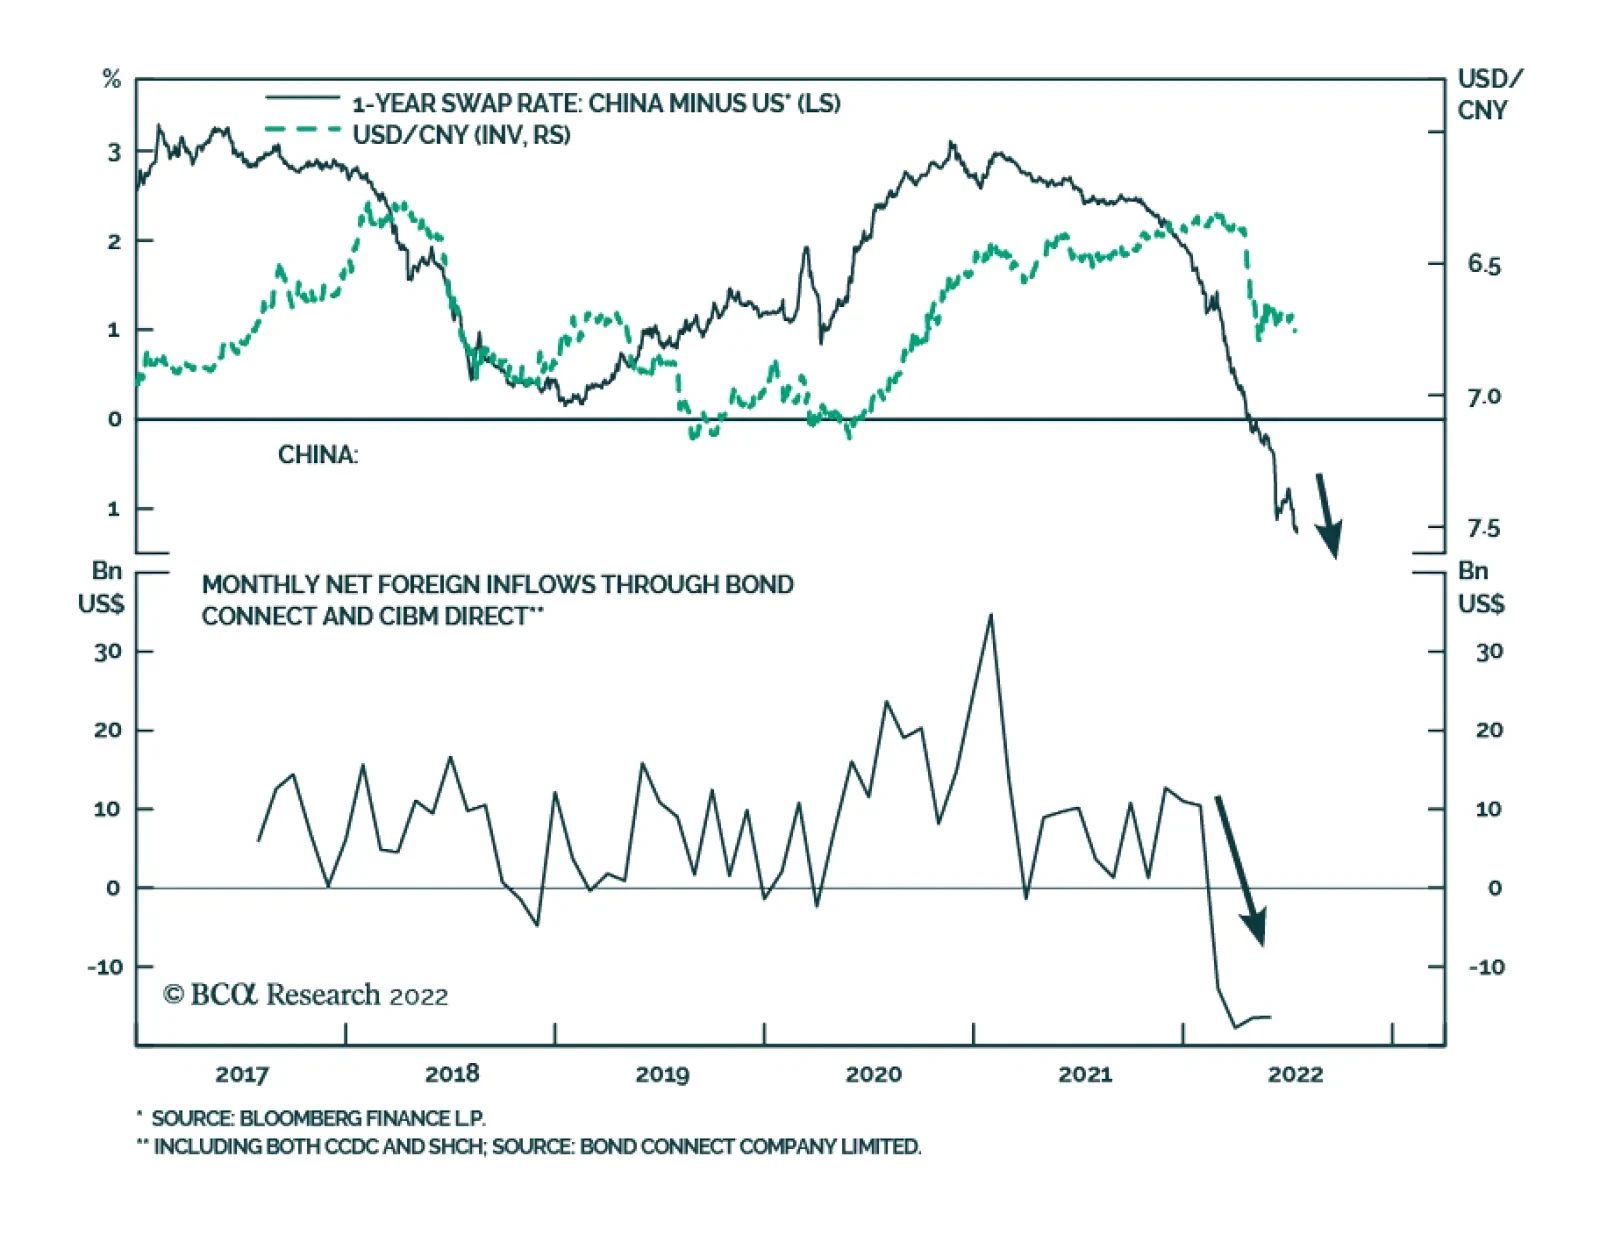
BCA Research’s China Investment Strategy service expects the RMB to continue to depreciate relative to the US dollar in the next few months. China’s interest rate differential versus the US dollar has fallen deeper into negative territory, and the gap may…
Executive Summary China: Can The Economy Recover Without Housing Revival
Can The Economy Recover Without Housing Revival
Can The Economy Recover Without Housing Revival
The rebound in China’s business activity in June reflects the release of pent-up demand from the economic reopening after lockdowns in April and May. China’s credit growth recovered meaningfully in June due to large local government (LG) bond issuance. Private sector sentiment and credit demand remain sluggish. Home sales relapsed in the first two weeks of July after a one-off improvement in June, corroborating that the housing market’s fundamentals remain gloomy. Despite posting strong growth in June, Chinese exports are facing strong headwinds from weakening external demand. A contraction in exports is very likely in the second half of this year. Chinese domestic demand remains weak. Renewed rolling lockdowns are likely in view of the escalating Covid-19 cases related to a more infectious Omicron subvariant. The RMB will probably continue to depreciate relative to the US dollar in the next few months. Bottom Line: Investors should maintain a neutral stance on Chinese onshore stocks and an underweight stance on investable stocks in a global equity portfolio. The risk-reward profile of Chinese onshore and offshore stocks in absolute terms is not yet attractive. Chart 1High-Frequancy(Daily) Economic Indicators
High-Frequancy(Daily) Economic Indicators
High-Frequancy(Daily) Economic Indicators
The recent recovery in economic activity in June mainly reflects the release of pent-up demand after reopening from lockdowns in April and May. Odds are that this rebound will fade. The relapse in house sales and slowdown in steel production during the first two weeks of July suggest that China’s economy is still struggling to gain traction (Chart 1). China’s business cycle recovery will be more U shaped rather than a repeat of the V-shaped resurgence experienced following the early 2020 lockdown. At that time, a quick and strong revival in the property market and exports shored up China’s recovery in 2H20. In contrast, the economy’s progress in the second half of this year will be dragged down by shrinking exports, weak consumption and depressed demand for housing. China’s recovery will be more U shaped than V shaped for the following reasons: New financing schemes for infrastructure investment recently announced by authorities will not lead to a surge in infrastructure investments in 2H22. The basis is that these new funding sources will largely offset a shortfall in local government (LG) revenues from this year’s land sales, as we discussed in last week’s report. Thus, there will be little new stimulus for infrastructure beyond what was already approved in the budget plan earlier this year. Rolling lockdowns will persist as long as China’s stringent dynamic zero-Covid policy remains in place. The recent flare-up of the more infectious Omicron BA.5 subvariant cases in a few cities raise the likelihood of more lockdowns. The number of cities under mobility restrictions or some form of lockdown climbed during the second week of July (Chart 2). These cities account for around 11% of China’s GDP. The rolling lockdowns will continue to disrupt the economy. Private sector sentiment remains in the doldrums. The willingness to spend or invest among households and enterprises remains very depressed (Chart 3). This will ensure that the multiplier effect of fiscal and credit stimulus will be small. Chart 2The Odds Of Renewed Lockdowns Are Rising
The Odds Of Renewed Lockdowns Are Rising
The Odds Of Renewed Lockdowns Are Rising
Chart 3Sluggish Sentiment Among Chinese Households And Enterprises
Sluggish Sentiment Among Chinese Households And Enterprises
Sluggish Sentiment Among Chinese Households And Enterprises
Chart 4China: Can The Economy Recover Without Housing Revival
Can The Economy Recover Without Housing Revival
Can The Economy Recover Without Housing Revival
Since 2008 there has been no recovery in the mainland economy without buoyant real estate construction and surging property prices (Chart 4). Chinese exports are set to contract as the demand for goods from US and European consumers continues to shrink. Bottom Line: In absolute terms, the risk-reward profile of Chinese stocks is not yet attractive. We continue to recommend that investors maintain a neutral stance on China’s onshore stocks and underweight allocation on Chinese investable stocks within a global equity portfolio. Qingyun Xu, CFA Associate Editor qingyunx@bcaresearch.com Peeling Off Credit Data Chart 5June's Credit Growth Was Largely Driven By LG Bond Issuance
June's Credit Growth Was Largely Driven By LG Bond Issuance
June's Credit Growth Was Largely Driven By LG Bond Issuance
June’s strong credit growth was again driven by large LG bond issuance (Chart 5, top panel). Consequently, the credit impulse – calculated as a 12-month change in the flow of total social financing (TSF) as a percentage of nominal GDP – is much more muted when LG bond issuance is excluded (Chart 5, bottom panel). Medium- to long-term corporate loan growth only ticked up in June, but short-term bill financing has dropped dramatically (Chart 6). While it is difficult to quantify, it is highly likely that the modest upturn in corporate credit flow was due to (1) corporates’ pent-up demand for financing after the spring lockdowns and (2) the PBoC’s moral suasion used to boost the banks’ credit origination. Meanwhile, a PBoC survey released on June 29-30, showed that loan demand for all types of industrial enterprises plunged sharply in Q2, suggesting that sentiment is very weak among corporates (Chart 7). Chart 6Corporate Loan Growth Improved In June...
Corporate Loan Growth Improved In June...
Corporate Loan Growth Improved In June...
Chart 7… But Corporate Loan Demand Remains Very Weak
... But Corporates Remain Low Demand Very Weak
... But Corporates Remain Low Demand Very Weak
Household loan demand, which is highly correlated with home sales, remains shaky too (Chart 8, top panel). Medium- to long-term consumer loans continued to plunge, and the annual change in household loan origination remains negative (Chart 8, bottom panel). Chart 8Household Loan Demand Is Still Depressed
Household Loan Demand Is Still Depressed
Household Loan Demand Is Still Depressed
Chart 9The Credit And Fiscal Impulse Will Be Moderate
The Credit And Fiscal Impulse Will Be Moderate
The Credit And Fiscal Impulse Will Be Moderate
Overall, our projections for the combined credit and fiscal spending impulse for the rest of this year suggest that the aggregate fiscal and credit impulse will be improving but will be smaller than in 2020, 2016, 2013 and 2009 (Chart 9). Property Market: A Vicious Cycle Unfolding Home sales relapsed in the first two weeks of July after a one-off rebound in June. The weakness was broad-based across all city tiers. This implies that June’s bounce was driven by pent-up demand after lockdowns and does not represent a sustained revival (Chart 10). Sentiment among home buyers remains downbeat. The percentage of households planning to buy homes slipped further according to the PBoC’s urban household survey released on June 29 (Chart 11, top panel). Moreover, the percentage of households expecting home prices to rise has dived to the lowest level since early 2015 according to the same survey (Chart 11, bottom panel). Chart 10No Snapback In Housing Sales
No Snapback In Housing Sales
No Snapback In Housing Sales
Chart 11Downbeat Sentiment Among Home Buyers
Downbeat Sentiment Among Home Buyers
Downbeat Sentiment Among Home Buyers
Chart 12Real Estate Developers' Deteriorating Funding Will Further Dampen Housing Construction
Real Estate Developers' Deteriorating Funding Will Further Dampen Housing Construction
Real Estate Developers' Deteriorating Funding Will Further Dampen Housing Construction
Property developers are caught in a vicious cycle. Financing has not strengthened because the “three red lines” policy remains in place, and developers’ borrowing from banks shows no signs of amelioration (Chart 12, top panel). Critically, the plunge in the sector’s financing is resulting in shrinking housing completions (Chart 12, bottom panel). As property developers are suffering from liquidity shortages, they are dragging on existing construction projects. The upshot is that many Chinese cities are seeing delays in the completion of new homes. The latter is depressing buyers’ sentiment, generating a reluctance to buy properties, and curtailing deposits and advances to developers. In recent years, deposits and advances accounted for 50% of property developers’ financing. Without a substantial improvement in their financing, developers will not be in a position to service their excessive debts and deliver houses they have presold in the recent years. The latter will undermine their financing, closing the vicious cycle. In short, real estate developers’ liquidity shortfalls are evolving into solvency problems. These will continue dampening construction activity. An Export Contraction Ahead China’s exports were robust in June as supply chain and logistic disruptions faded. This was corroborated by last month’s advance in suppliers’ delivery times and production subindexes of China’s official Purchasing Managers’ Index (PMI) (Chart 13). Chart 13Chinese Logistics And Backlog Orders Pressures Have Eased In June
Chinese Logistics And Backlog Orders Pressures Have Eased In June
Chinese Logistics And Backlog Orders Pressures Have Eased In June
Yet, China’s new exports orders remain in contractionary territory (Chart 14). Moreover, the softness of Shanghai’s export container freight index is also signaling weakness in China’s exports (Chart 15). Chart 14External Demand For Chinese Export Goods Will Be Dwindling
External Demand For Chinese Export Goods Will Be Dwindling
External Demand For Chinese Export Goods Will Be Dwindling
Chart 15Signs Of Moderation In China's Exports
Signs Of Moderation In China's Exports
Signs Of Moderation In China's Exports
The shift in consumer spending in developed economies from manufactured goods to services has created headwinds for Chinese exports. US and European consumption of goods (ex-autos) is set to decline below its long-term trend (Chart 16). Given that retail inventories in the US have skyrocketed well above their pre-pandemic trend, US demand for consumer goods and, hence, Chinese exports will dwindle significantly when US retailers start to destock (Chart 17). Falling real household disposable income in the US and Europe will also fortify the downward trend in demand for consumer goods that China is a major producer of. Therefore, we expect shrinking Asian and Chinese exports in the second half of this year. Chart 16Developed Economies’ Household Demand For Goods ex-Autos Will Shrink
Developed Economies' Household Demand For Goods ex-Autos Will Experience Mean Reversion
Developed Economies' Household Demand For Goods ex-Autos Will Experience Mean Reversion
Chart 17Well-Stocked Shelves In The US Bode Poorly For Chinese Exports
Well-Stocked Shelves In The US Bode Poorly For Chinese Export
Well-Stocked Shelves In The US Bode Poorly For Chinese Export
Very Sluggish Domestic Demand Both consumer spending and capital expenditure remain in the doldrums. Traditional infrastructure investments picked up strongly in June, while investments in the real estate sector weakened further (Chart 18). Contracting exports will weigh on investments in manufacturing. Even as infrastructure investment recovers modestly, the downtrend in manufacturing and property fixed-asset investments will cap China’s capital spending in 2H22. Capital spending in traditional infrastructure, real estate and manufacturing account for 24%, 19% and 31% of fixed-asset investment, respectively. Chart 18Shrinking Real Estate Investment Will Remain A Drag On Chinese Investment Growth In 2H
Shrinking Real Estate Investment Will Remain A Drag On Chinese Investment Growth In 2H
Shrinking Real Estate Investment Will Remain A Drag On Chinese Investment Growth In 2H
Chart 19Contracting Import Volume Reflects China's Sluggish Domestic Demand
Contracting Import Volume Reflects China's Sluggish Domestic Demand
Contracting Import Volume Reflects China's Sluggish Domestic Demand
Imports for domestic consumption (excluding imports for processing and re-exports) are a good proxy for domestic demand trajectory. In June, import volumes contracted deeply at 12% on a year-on-year basis, reflecting sluggish domestic demand (Chart 19). Worryingly, import volume contraction is widespread from key commodities to semiconductors and capital goods (Chart 20A and 20B). Chart 20ABroad-Based Contraction In Imports
Broad-Based Contraction In ... Chinese Imports Of Key Commodities Deteriorated In June
Broad-Based Contraction In ... Chinese Imports Of Key Commodities Deteriorated In June
Chart 20BBroad-Based Contraction In Imports
... Imports And key Imports Categories Chinese Domestic Demand Has Been Absent Over The Past 12 Months
... Imports And key Imports Categories Chinese Domestic Demand Has Been Absent Over The Past 12 Months
Chart 21Rising New Covid Cases In China Will Constrain Domestic Consumption Recovery
Rising New Covid Cases In China Will Constrain Domestic Consumption Recovery
Rising New Covid Cases In China Will Constrain Domestic Consumption Recovery
Moreover, the recent increase in Covid-19 cases and ensuing lockdowns in China will curb household consumption and the service sector’s activities in the next few months (Chart 21). Newly released labor market data show a mixed picture. The nationwide urban survey-based unemployment rate fell in June, but the unemployment rate among younger workers surged to the highest point since data collection began in 2018 (Chart 22, top panel). Reflecting weak employment conditions, new urban job creation in the first half of the year withered compared with the same period last year (Chart 22, bottom panel). Rapidly deteriorating income prospects are reinforcing households’ downbeat sentiment. A PBoC survey released on June 29 shows that confidence of future income in Q2 plummeted to its lowest level during the past two decades, while the preference for more saving deposits soared to the highest level since data collection began in 2002 (Chart 23). The latter entails that households’ consumption recovery will be gradual and halting, at best, in the second half of this year. Chart 22Skyrocketed Unemployment Rate Among Young Workers Is A Big Problem Of Chinese Labor Market
Skyrocketed Unemployment Rate Among Young Workers Is A Big Problem Of Chinese Labor Market
Skyrocketed Unemployment Rate Among Young Workers Is A Big Problem Of Chinese Labor Market
Chart 23Low Confidence In Future Income Contributes To Households' Unwillingness To Consume
low Confidence In Future Income Contributes To Households' Unwillingness To Consume
low Confidence In Future Income Contributes To Households' Unwillingness To Consume
The RMB Is Facing Downside Risks In The Near Term Chart 24RMB Is Still Vulnerable
RMB Is Still Vulnerable
RMB Is Still Vulnerable
The RMB has depreciated by about 6% against the US dollar since March, and we believe this trend will continue in the next few months. China’s interest rate differential versus the US dollar has fallen deeper into negative territory, and the gap may widen even more given that the inflation and monetary policy cycles in China and the US will continue to diverge (Chart 24, top panel). Thus, Chinese fixed-income market outflow pressures could endure this year (Chart 24, bottom panel). Moreover, as discussed in the section above, Chinese exports are set to shrink in the second half of the year. This will also weigh on the RMB. Notably, Chinese companies have started to increase their demand for USD. The net FX settlement rate by banks on behalf of clients has fallen below zero, albeit only marginally (Chart 25). This means more non-financial enterprises (such as exporters and investors) bought from than sold foreign currency to banks (Chart 25, bottom panel). Furthermore, foreign outflows from the onshore equity market have resumed and will likely be sustained, at least through the next few months (Chart 26). Foreign investors will likely flee from Chinese onshore stocks as global stocks continue selling off and China’s economic recovery disappoints in the second half of this year. Chart 25Contracting Exports Will Weigh On The RMB
Contracting Exports Will Weigh On The RMB
Contracting Exports Will Weigh On The RMB
Chart 26Onshore Equity Market Foreign Outflow Pressures Remain, At Least In The Near Term
Onshore Equity Market Foreign Outflow Pressures Remain, At Least In The Near Term
Onshore Equity Market Foreign Outflow Pressures Remain, At Least In The Near Term
Chinese Equity Market Technicals: Tell-Tale Signs Chart 27A-Shares Has Not Broken Above 200-Day Moving Average
A-Shares Has Not Broken Above 200-Day Moving Average
A-Shares Has Not Broken Above 200-Day Moving Average
The rebound in China’s onshore CSI 300 stock index had been obstructed at its 200-day moving average (Chart 27). A failure to break above this technical resistance would imply non-trivial downside – a retest of its recent lows, at least. The relative performance of the MSCI China All-Share Index – which includes all onshore- and offshore-listed stocks – versus the global equity index has petered off at its previous troughs (Chart 28). This is a tell-tale sign of a major relapse. Chart 28A Tell-Sign Of Major Downtrend
A Tell-Sign Of Major Downtrend
A Tell-Sign Of Major Downtrend
Chart 29Chinese Tech Stocks Still Appear Fragile
Chinese Tech Stocks Still Appear Fragile
Chinese Tech Stocks Still Appear Fragile
The Hang Seng Tech index – which tracks Chinese offshore tech stocks/platform companies – has also failed to break above its 200-day moving average (Chart 29). This entails that the bear market in these share prices might not be yet over. Chart 30Two Large-Cap Chinese Stocks
Two Large-Cap Chinese Stocks
Two Large-Cap Chinese Stocks
China’s two largest stocks (by market capitalization) – Tencent and Alibaba – may not be out of the woods: Alibaba has failed at its 200-day moving average (Chart 30, top panel). Tencent has failed to rebound at all (Chart 30, bottom panel). Odds are it will likely drop more. Table 1China Macro Data Summary
China’s Recovery: U Or V Shaped?
China’s Recovery: U Or V Shaped?
Table 2China Financial Market Performance Summary
China’s Recovery: U Or V Shaped?
China’s Recovery: U Or V Shaped?
Footnotes Strategic Themes Cyclical Recommendations
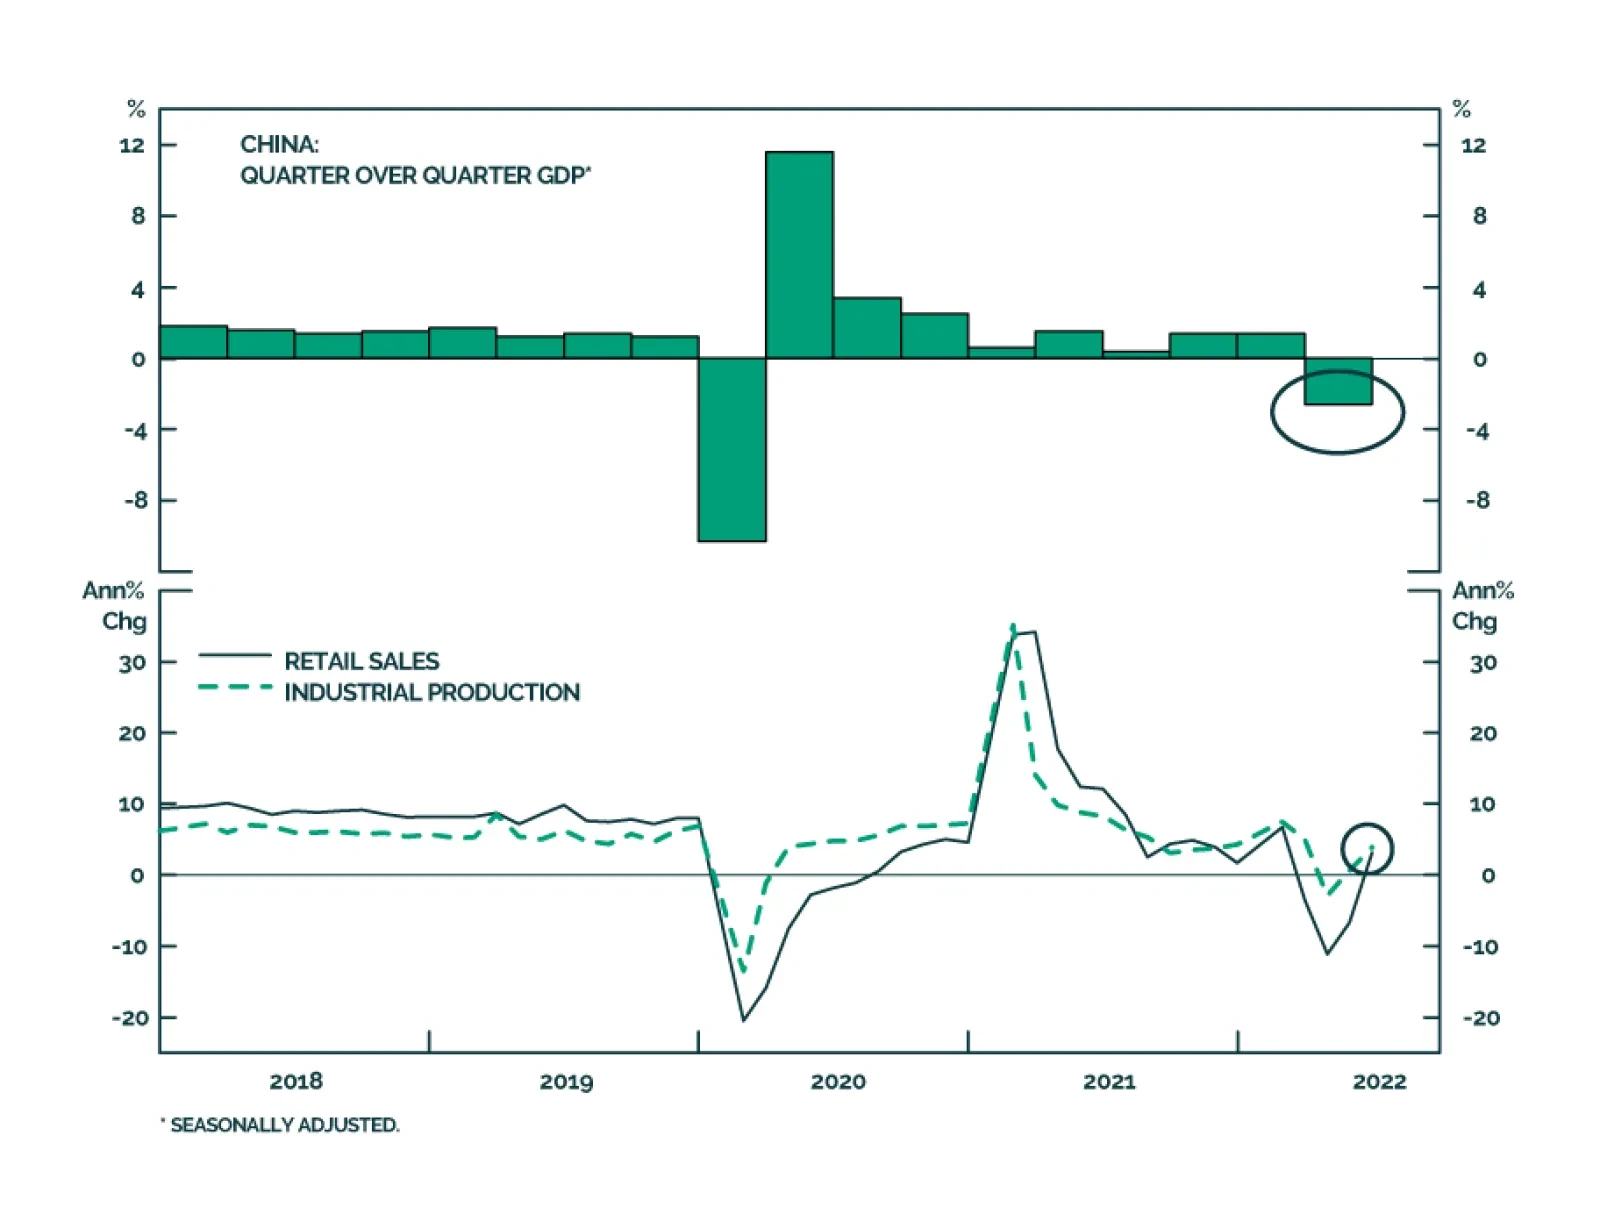
Chinese GDP expanded by a mere 0.4% y/y (-2.6% q/q) in Q2, slowing sharply from Q1’s 4.8% y/y rate and falling below expectations of 1.2% y/y. More recent data – rebounding retail sales and industrial production in June – confirm that economic conditions…