China
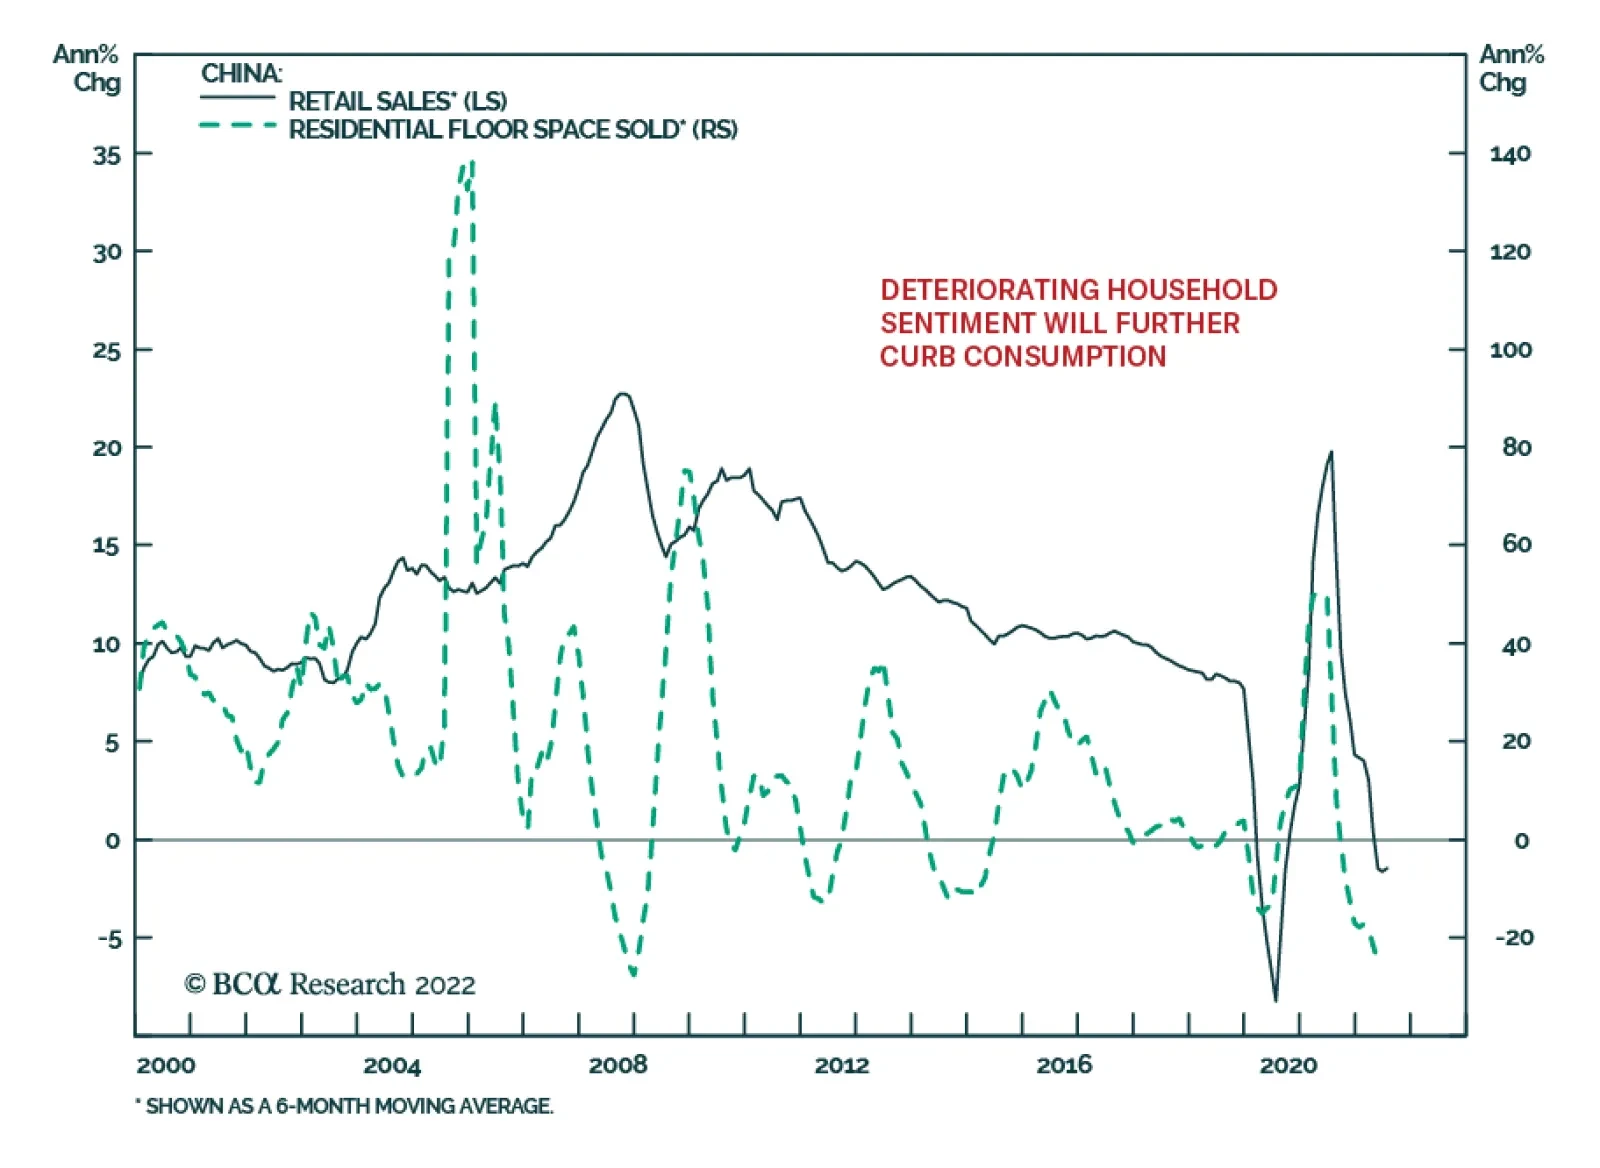
Chinese data releases on Monday reflected a broad-based deceleration in the country’s economy. Key indicators of domestic activity in July such as industrial production, fixed assets investment, retail sales, and property investment all generated negative…

Roulette With A Five-Shooter
Executive Summary With the fourth Taiwan Strait crisis materializing, the odds of a major war between the world’s great powers have gone up. Our decision trees suggest the odds are around 20%, or double where they stood from the Russian war in Ukraine alone. The world is playing “Russian roulette” … with a five-round revolver. Going forward, our base case is for Taiwan tensions to flatten out (but not fall) after the US and Chinese domestic political events conclude this autumn. However, if China escalates tensions after the twentieth national party congress, then the odds of an invasion will rise significantly. If conflict erupts in Taiwan, then the odds of Russia turning even more aggressive in Europe will rise. Iran is highly likely to pursue nuclear weapons. Not A Lot Of Positive Catalysts In H2 2022
Roulette With A Five-Shooter
Roulette With A Five-Shooter
Tactical Recommendation Inception Date Return LONG US 10-YEAR TREASURY 2022-04-14 1.3% LONG GLOBAL DEFENSIVES / CYCLICALS EQUITIES 2022-01-20 13.8% Bottom Line: Investors should remain defensively positioned at least until the Chinese party congress and the US midterm election conclude this fall. Geopolitical risk next year will depend on China’s actions in the Taiwan Strait. Feature Chart 1Speculation Rising About WWIII
Roulette With A Five-Shooter
Roulette With A Five-Shooter
Pessimists who pay attention to world events have grown concerned in recent years about the risk that the third world war might break out. The term has picked up in online searches since 2019, though it is the underlying trend of global multipolarity, rather than the specific crisis events, that justifies the worry (Chart 1).1 What are the odds of a major war between the US and China, or the US and Russia? How might that be calculated? In this report we present a series of “decision trees” to formalize the different scenarios and probabilities. If we define WWIII as a war in which the United States engages in direct warfare with either Russia or China, or both, then we arrive at a 20% chance that WWIII will break out in the next couple of years! Those are frighteningly high odds – but history teaches that these odds are not unrealistic and that investors should not be complacent. Political scientist Graham Allison has shown that the odds of a US-China war over the long term are about 75% based on historical analogies. The takeaway is that nations will have to confront this WWIII risk and reject it for the global political environment to improve. Most likely they will do so as WWIII, and the risk of nuclear warfare that it would bring, constitutes the ultimate constraint. But the current behavior of the great powers suggests that they have not recognized their constraints yet and are willing to continue with brinksmanship in the short term. The Odds Of A Chinese Invasion Of Taiwan The first question is whether China will invade Taiwan. In April 2021 we predicted that the fourth Taiwan Strait crisis would occur within 12-24 months but that it would not devolve into full-scale war. This view is now being tested. In Diagram 1 we provide a decision tree to map out China’s policy options toward Taiwan and assign probabilities to each option. Diagram 1Decision Tree For Fourth Taiwan Strait Crisis (Next 24 Months)
Roulette With A Five-Shooter
Roulette With A Five-Shooter
While China has achieved the capability to invade Taiwan, the odds of failure remain too high, especially without more progress on its nuclear triad. Hence we give only a 20% chance that China will mobilize for invasion immediately. Needless to say any concrete signs that China is planning an invasion should be taken seriously. Investors and the media dismissed Russia’s military buildup around Ukraine in 2021 to their detriment. At the same time, there is a good chance that the US and China are merely testing the status quo in the Taiwan Strait, which will be reinforced after the current episode. After all, this crisis was the fourth Taiwan Strait crisis – none of the previous crises led to war. If Presidents Biden and Xi Jinping are merely flexing their muscles ahead of important domestic political events this fall, then they have already achieved their objective. No further shows of force are necessary on either side, at least for the next few years. We give 40% odds to this scenario, in which the past week’s tensions will linger but the status quo is reinforced. In that case, the structural problem of the Taiwan Strait would flare up again sometime after the US and Taiwanese presidential elections in 2024, i.e. outside the time frame of the diagram. Unfortunately we are pessimistic over the long run and would give high probability to war in Taiwan. For that reason, we give equal odds (40%) to a deteriorating situation within the coming two years. If China expands drills and sanctions after the party congress, after Xi has consolidated power, then it will be clear that Xi is not merely performing for his domestic audience. Similarly if the Biden administration continues pushing for tighter high-tech export controls against China after the midterm election, and insists that US allies and partners do the same, then the US implicitly believes that China is preparing some kind of offensive operation. The danger of invasion would rise from 20% to 40%. Even in that case, one should still believe that crisis diplomacy between the US and China will prevent full-scale war in 2023-24. But the risk of miscalculation would be very high. The last element of this decision tree holds that China will prefer “gray zone tactics” or hybrid warfare rather than conventional amphibious invasion of the kind witnessed in WWII. The reasons are several. First, amphibious invasions are the most difficult military operations. Second, Chinese forces are inexperienced while the US and its allies are entrenched. Third, hybrid warfare will sow division among the US allies about how best to respond. Fourth, Russia has demonstrated several times over the past 14 years that hybrid warfare works. It is a way of maximizing strategic benefits and minimizing costs. The world knows how the West reacts to small invasions: it uses economic sanctions. It does not yet know how the West reacts to big invasions. So China will be incentivized to take small bites. And yet in Taiwan’s case those tactics may not be sustainable. Our Taiwan decision tree does not account for the likelihood that a hybrid war or “proxy war” will evolve into a major war. But that likelihood is in fact high. So we are hardly overrating the risk of a major US-China war. Bottom Line: Over the next two years, the subjective odds of a US-China proxy war over Taiwan are about 32% while the odds of a direct US-China war are about 4%. The true test comes after Xi Jinping consolidates power at this fall’s party congress. We expect Xi to focus on rebooting the economy so we continue to favor emerging Asian markets excluding China and Taiwan. The Odds Of Russian War With NATO The second question is whether Russia’s war in Ukraine will morph into a broader war with the West. The odds of a major Russia-West war are greater in this case than in China’s, as a war is already raging, whereas tensions in the Taiwan Strait are merely shadow boxing so far. An investor’s base case should hold that the Ukraine war will remain contained in Ukraine, as Europeans do not want to fight a devastating war with Russia merely because of the Donbas. But things often go wrong in times of war. The critical question is whether Russia will attack any NATO members. That would trigger Article Five of the alliance’s treaty, which holds that “an armed attack against one or more [alliance members] in Europe or North America shall be considered an attack against them all,” justifying the use of armed force if necessary to restore security. Since Russia’s invasion of Ukraine this year, President Biden has repeatedly stated that the US will “defend every inch of NATO territory,” including the Baltic states of Latvia, Lithuania, and Estonia, which joined NATO in 2004. This is not a change of policy but it is the US’s red line and highly likely to be defended. Hence it is a major constraint on Russia. In Diagram 2 we map out Russia’s different options and assign probabilities. Diagram 2Decision Tree For Russia-Ukraine War (Next 24 Months)
Roulette With A Five-Shooter
Roulette With A Five-Shooter
We give 55% odds that Russia will declare victory after completing the conquest of Ukraine’s Donbas region and the land bridge to Crimea. It will start looking to legitimize its conquests by means of some diplomatic agreement, i.e. a ceasefire. This is our base case for 2023. There is evidence that Russia is already starting to move toward diplomacy.2 The reason is that Russia’s economy is suffering, global commodity prices are falling, Russian blood and treasure are being spent. President Putin will have largely achieved his goal of hobbling Ukraine as long as he controls the mouth of the Dnieper river and the rest of the territory he has invaded. Putin needs to seal his conquests and try to salvage the economy and society. The sooner the better for Russia, so that Europe can be prevented from forming a consensus and implementing a full natural gas embargo in the coming years. However, there is a risk that Putin’s ambition gets the better of him. So we give 35% odds that the invasion expands to southwestern Ukraine, including the strategic port city of Odessa, and to eastern Moldova, where Russian troops are stationed in the breakaway region of Transdniestria. This new campaign would render Ukraine fully landlocked, neutralize Moldova, and give Russia greater maritime access. But it would unify the EU, precipitate a natural gas embargo, and weaken Russia to a point where it could become desperate. It could retaliate and that retaliation could conceivably lead to a broader war. We allot only a 7% chance that Putin attacks Finland or Sweden for attempting to join NATO. Stalin failed in Finland and Putin’s army could not even conquer Kiev. The UK has pledged to support these states, so an attack on them will most likely trigger a war with NATO. A decision to attack Finland would only occur if Russia believed that NATO planned to station military bases there – i.e. Russia’s declared red line. Any Russian attack on the Baltic states is less likely because they are already in NATO. But there is some risk it could happen if Putin grows desperate. We put the risk of a Baltic invasion at 3%. In short, if Russia uses its energy stranglehold on Europe not to negotiate a favorable ceasefire but rather to expand its invasions, then the odds of a broader war will rise. Bottom Line: The result is a 55% chance of de-escalation over the next 24 months, a 35% chance of a small escalation (e.g. Odessa, Moldova), and a 10% chance of major escalation that involves NATO members and likely leads to a NATO-Russia war. Tactically, investors should buy developed-market European currency and assets if the global economy rebounds and Russia makes a clear pivot to halting its military campaign and pursuing ceasefire talks. Cyclically, there needs to be a deeper US-Russia understanding for a durable bull market in European assets. The Odds Of US-Israeli Strikes On Iran The third geopolitical crisis taking place this year could be postponed as we go to press – if President Biden and Ayatollah Ali Khamenei agree to rejoin the 2015 US-Iran nuclear deal. But we remain skeptical. The Biden administration wants to rejoin the 2015 nuclear deal and free up about one million barrels per day of Iranian crude oil to reduce prices at the pump before the midterm election. US grand strategy also wants to engage with Iran and stabilize the Middle East so that the US can pivot to Asia. The EU is proposing the deal since it has even greater need for Iranian resources and wants to prevent Iran from getting nuclear weapons. Russia and China are also supportive as they want to remove US sanctions for trading with Iran and do not necessarily want Iran to get nukes. There is only one problem: Iran needs nuclear weapons to ensure its regime’s survival over the long run. The question is whether Khamenei is willing to authorize a deal with the Americans a second time. The first deal was betrayed at great cost to his regime. President Ebrahim Raisi, who hopes to replace the 83-year-old Khamenei before long, is surely staunchly opposed to wagering his career and personal security on whether Republicans win the 2024 election. Iran has already achieved nuclear breakout capacity – it has enough 60%-enriched uranium to construct nuclear devices – and it is unclear why it would achieve this capacity if it did not ultimately seek to obtain a nuclear deterrent. Especially given that it may someday need to protect its regime from military attacks by the US and its allies. However, our conviction level is medium because President Biden wants to lift sanctions and can do so unilaterally. The Biden administration has not taken any of the preliminary actions to make a deal come together but that could change.3 There is a good cyclical case to be made for short-term, stop-gap deal. According to BCA’s Commodity & Energy Strategist Bob Ryan, Saudi Arabia and the UAE only have about 1.5 million barrels of spare oil production capacity between them. The EU oil embargo and western sanctions on Russia will force about two million barrels per day to be stopped, soaking up most of OPEC’s capacity. Hence the Biden administration needs the one million barrels that Iran can bring. We cannot deny that the Iranians may sign a deal to allow Biden to lift sanctions. That would benefit their economy. They could allow nuclear inspectors while secretly shifting their focus to warhead and ballistic missile development. While Iran will not give up the long pursuit of a nuclear deterrent, it is adept at playing for time. Still, Iran’s domestic politics do not support a deal – and its grand strategy only supports a deal if the US can provide credible security guarantees, which the US cannot do because its foreign policy is inconsistent. US grand strategy supports a deal but only if it is verifiable, i.e. not if Iran uses it as cover to pursue a bomb anyway. Iran has not capitulated after three years of maximum US sanctions, a pandemic, and global turmoil. And Iran sees a much greater prospect of extracting strategic benefits from Russia and China now that they have turned aggressive against the West. Moscow and Beijing can be strategic partners due to their shared acrimony toward Washington. Whereas the US can betray the Raisi administration just as easily as it betrayed the Rouhani administration, with the result that the economy would be whipsawed again and the Supreme Leader and the political establishment would be twice the fools in the eyes of the public. Diagram 3 spells out Iran’s choices. Diagram 3Decision Tree For Iran Nuclear Crisis (Next 24 Months)
Roulette With A Five-Shooter
Roulette With A Five-Shooter
If negotiations collapse (50% odds), then Iran will make a mad dash for a nuclear weapon before the US and Israel attack. If the US and Iran agree to a deal (40%), then Iran might comply with the deal’s terms through the 2024 US election, removing the issue from investor concerns for now. But their long-term interest in obtaining a nuclear deterrent will not change and the conflict will revive after 2024. If talks continue without resolution (10%), Iran will make gradual progress on its nuclear program without the restraints of the deal (though it may not need to make a mad dash). In short, Russia and China need Iran regardless of whether it freezes its nuclear program, whereas the US and Israel will form a balance-of-power Abraham Alliance to contain Iran even if it does freeze its nuclear program. Bottom Line: Investors should allot 40% odds to a short-term, stop-gap US-Iran nuclear deal. The oil price drop would be fleeting. Long-term supply will not be expanded because the US cannot provide Iran with the security guarantees that it needs to halt its nuclear program irreversibly. The Odds Of World War III Now comes the impossible part, where we try to put these three geopolitical crises together. In what follows we are oversimplifying. But the purpose is to formalize our thinking about the different players and their options. Diagram 4 begins with our conclusions regarding the China/Taiwan conflict, adjusts the odds of a broader Russian war as a result, and adds our view that Iran is highly likely to pursue nuclear weapons. Again the time frame is two years. Diagram 4Decision Tree For World War III (Next 24 Months)
Roulette With A Five-Shooter
Roulette With A Five-Shooter
The alternate conflict scenario to WWIII consists of “limited wars” – a dangerous concept that refers to hybrid and proxy wars in which the US is not involved, or only involved indirectly. Or it could be a conflict with Iran that does not involve Russia and China. We begin with China because China is the most capable and most ambitious global power today. China’s strategic rise is upsetting the global order and challenging the United States. We also start with China because we have some evidence this year that Russia does not intend to expand the war beyond Ukraine. Either China takes further aggressive action in Taiwan – creating a unique opportunity for Russia to take greater risks – or not. If not, then the odds of WWIII fall precipitously over the two-year period. This scenario is our base case. But if China attacks Taiwan and the US defends Taiwan, we give a high probability to Russia invading the Baltics. If China stages hybrid attacks and the US only supports Taiwan indirectly, then we increase the odds of Russian aggression only marginally. The result is 20% odds of WWIII, i.e. a direct war between the US and Russia, or China, or both. Whether this war could remain limited is debatable. War gaming since 1945 shows that any war between major nuclear powers will more likely escalate than not. But nuclear weapons bring mutually assured destruction, the ultimate constraint. The nuclear escalation risk is why we round down the probability of WWIII in our decision trees. The more likely 59% risk scenario of “limited wars” may seem like a positive outcome but it includes major increases in geopolitical tensions from today’s level, such as a Chinese hybrid war against Taiwan. Bottom Line: According to this exercise the odds of WWIII could be as high as 20%. This is twice the level in our Russia decision tree, which is appropriate given that our Taiwan crisis forecast has materialized. The critical factor is whether Beijing continues escalating the pressure on Taiwan after the party congress this fall. That could unleash a dangerous chain reaction. The global economy and financial markets still face downside risk from geopolitics but 2023 could see improvements if Russia moves toward a ceasefire and China delays action against Taiwan to reboot its economy. Investment Takeaways When Russia invaded Ukraine earlier this year, our colleague Peter Berezin, Chief Global Strategist, argued that the odds of nuclear Armageddon were 10%. At very least this is a reasonable probability for the odds that Russia and NATO come to blows. Now the expected Taiwan crisis has materialized. We guess that the odds of a major war have doubled to 20%. The corollary is an 80% chance of a better outcome. Analytically, we still see Russia as pursuing a limited objective – neutralizing Ukraine so that it cannot be prosperous and militarily powerful – while China also pursues a limited objective – intimidating Taiwan so that it pursues subordination rather than nationhood. Unless these objectives change, we are still far from World War III. The world can live with a hobbled Ukraine and a subordinated Taiwan. However, there can be no denying that the trajectory of global affairs since the 2008 global financial crisis has followed a pathway uncomfortably similar to the lead up to World War II: financial crisis, economic recession, deflation, domestic unrest, currency depreciation, trade protectionism, debt monetization, military buildup, inflation, and wars of aggression. If roulette is the game, then the odds of a global war are one-sixth or 17%, not far from the 20% outcome of our decision trees. Even assuming that we are alarmist, the fact that we can make a cogent, formal argument that the odds of WWIII are as high as 20% suggests that investors should wait for the current tensions over Ukraine and Taiwan to decrease before making large new risky bets. A simple checklist shows that the global macro and geopolitical context is gloomy (Table 1). We need improvement on the checklist before becoming more optimistic. Table 1Not A Lot Of Positive Catalysts In H2 2022
Roulette With A Five-Shooter
Roulette With A Five-Shooter
Chart 2Stay Defensively Positioned In H2 2022
Stay Defensively Positioned In H2 2022
Stay Defensively Positioned In H2 2022
Specifically what investors need is to be reasonably reassured that Russia will not expand the war to NATO and that China will not invade Taiwan anytime soon. This requires a new diplomatic understanding between the Washington and Moscow and Washington and Beijing that forestalls conflict. That kind of understanding can only be forged in crisis. The relevant crises are under way but not yet complete. There is likely more downside for global equity investors before war risks are dispelled through the usual solution: diplomacy. Wait for concrete and credible improvements to the global system before taking a generally overweight stance toward risky assets. Favor government bonds over stocks, US stocks over global stocks, defensive sectors over cyclicals, and disfavor Chinese and Taiwanese currency and assets (Chart 2). Matt Gertken Chief Geopolitical Strategist mattg@bcaresearch.com Footnotes 1 See Graham Allison, Destined For War: Can America and China Escape Thucydides’s Trap? (New York: Houghton Miffin Harcourt, 2017). 2 For example, the Turkish brokered deal to ship grain out of Odessa, diplomatic support for rejoining the 2015 Iran nuclear deal, referendums in conquered territories like Kherson, and attempts to build up leverage in arms reduction talks. Cutting off Europe’s energy is ultimately a plan to coerce Europe into settling a ceasefire favorable for Russia. 3 Iran is still making extraneous demands – most recently that the IAEA drop a probe into how certain manmade uranium particles appeared in undisclosed nuclear sites in Iran. The IAEA has not dropped this probe and its credibility will suffer if it does. Meanwhile Biden is raising not lowering sanctions on Iran, even though sanction relief is a core Iranian demand. Biden has not removed the Iranian Revolutionary Guards or the Qods Force from the terrorism list. None of these hurdles are prohibitive but we would at least expect to see some movement before changing our view that a deal is more likely to fail than succeed. Strategic Themes Open Tactical Positions (0-6 Months) Open Cyclical Recommendations (6-18 Months) Regional Geopolitical Risk Matrix "Batting Average": Geopolitical Strategy Trades ()
Executive Summary Iron Ore & Steel Prices: Facing Downward Pressure
Iron Ore & Steel Prices: Facing Downward Pressure
Iron Ore & Steel Prices: Facing Downward Pressure
Global iron ore and steel supply is likely to grow faster than demand over the next six months. As a result, the prices of both metals will likely fall. Chinese steel output will likely rebound moderately in the absence of government-mandated steel production cutbacks. In the meantime, mainland steel demand will continue to contract because of its crumbling property sector. Global steel output excluding China will contract over the next six months on the back of weakening industrial demand for steel. Even though Chinese iron ore consumption may rise moderately over the next six months, its imports will not improve much because of robust growth in domestic iron ore production. Furthermore, global iron ore demand excluding China will decline as steel demand and output contract. In the intervening six months, global iron ore production growth will rise. This will lead to an oversupplied iron ore market. Bottom Line: Both iron ore and steel prices will likely deflate over the next several months. Therefore, Chinese steel share prices as well as global mining and steel stocks have more downside. China’s demand for iron ore and steel are key to their respective price outlooks because these metals account for about 70% of global iron ore imports and over 50% of global steel consumption. Considerable reduction in Chinese steel output (hence, demand for iron ore) and rising domestic iron ore supply have resulted in a contraction in Chinese iron ore imports since last June. In the meantime, domestic steel demand weakened sharply, primarily because of plunging property construction. The upshot has been lower domestic steel prices (Chart 1). This report evaluates the direction of iron ore and steel prices over the next six months. Chart 1Crumbling Property Sector: Lower Steel Demand Ahead
Crumbling Property Sector: Lower Steel Demand Ahead
Crumbling Property Sector: Lower Steel Demand Ahead
Chart 2Iron Ore & Steel Prices: Facing Downward Pressure
Iron Ore & Steel Prices: Facing Downward Pressure
Iron Ore & Steel Prices: Facing Downward Pressure
We expect Chinese steel output to rise in the absence of government-mandated production cuts and on positive profit margins. This will lift Chinese iron ore imports. In the meantime, Chinese steel demand will likely continue to contract. Thus, steel prices will continue falling over the next several months (Chart 2, top panel). For iron ore, an increase in Chinese imports will not be enough to offset contracting global demand. As a result, the price of iron ore will face downward pressure over the coming months (Chart 2, bottom panel). From The Chinese Steel Market… The Chinese steel market may experience an increasing oversupply over the next six months. Chinese Steel Supply Chinese steel production is likely to rise moderately in the next six months. First, there are no government-mandated cuts in steel production currently in place. Chart 3Mandated Steel Output Cuts In 2021: Unlikely Repeat In 2022H2
Mandated Steel Output Cuts In 2021: Unlikely Repeat In 2022H2
Mandated Steel Output Cuts In 2021: Unlikely Repeat In 2022H2
Last June, Chinese authorities ordered steel mills to cut output from record levels in a bid to restrain carbon emissions. This resulted in a 15% year-on-year drop in Chinese crude steel1 output and a 10% year-on-year decline in Chinese steel products production during 2021H2 (Chart 3). In 2022Q1, to ensure smog-free skies in February as China hosted the 2022 Winter Olympic Games, some steel producers were again ordered to cut their production. As a result, the year-on-year decline of Chinese steel output and steel product output for 2022Q1 were at 10% and 5%, respectively. In 2022Q2, however, the picture is more of a mixed bad. While many small firms increased volumes, medium and large sized steel producers voluntarily chose to reduce their output. As a result, China’s steel output is remains in contraction. Further, tightness in electricity supply over the summer curbed any potential recovery in steel output. Over the next six months, we expect decreasing voluntary cuts and easing electricity supply will lift steel output moderately. Chart 4Steelmakers' Profit Margins: Low, Albeit Still Positive
Steelmakers' Profit Margins: Low, Albeit Still Positive
Steelmakers' Profit Margins: Low, Albeit Still Positive
Second, overall profit margins for Chinese steel producers are still positive, albeit at a low level (Chart 4). Even at a very low profit margin, steel producers in China still tend to produce steel as much as they can to cover their very large fixed costs. In other words, if they do not produce, they will experience greater losses. In addition, given deteriorating employment conditions in the broader economy, maintaining employment has become a major focus of local governments. The latter will guide state-owned enterprises (SOEs) – many steel mills are SOEs or government-affiliated – to raise output and employment. For now, the government has simply asked steel producers to cut their production voluntarily, rather than mandating cuts as authorities did last year and earlier this year. In brief, in the absence of government-mandated steel output reduction, some producers will opt to increase their output to cover their fixed costs and maintain/increase employment. Will the Chinese government demand mandated cuts again later this year? We believe the odds are low. Last year, the mandated cuts were the result of more aggressive emissions reduction targets, with a deadline at the end of 2025 for the Chinese steel sector. In February of this year, the authorities extended this deadline to 2030 to grant its steel sector the ability to reach peak emissions. This will allow a gradual output reduction instead of a sharp reduction in mills with high-emission steel-producing capacity. With such a deadline extension already in place, the government is unlikely to implement mandated steel output cuts again. Chinese Steel Demand Chinese steel consumption will likely continue to contract over the next six months. Chart 5 shows that 58% of Chinese steel consumption is from building and construction, which mainly comprises the property sector and the infrastructure sector. Based on our estimate, Chinese steel demand will decline about 3.8% over the next six months, mainly dragged down by the shattered property market (Table 1). Chart 5Chinese Steel Consumption Composition
Iron Ore And Steel: Where Are The Prices Headed?
Iron Ore And Steel: Where Are The Prices Headed?
Table 1Chinese Steel Demand Growth Estimates
Iron Ore And Steel: Where Are The Prices Headed?
Iron Ore And Steel: Where Are The Prices Headed?
Chart 6Property Market is in a Crisis
Property Market is in a Crisis
Property Market is in a Crisis
The property sector is the largest steel consumer, accounting for about 35% of Chinese steel consumption. This sector is going through a crisis, and there are no signs of improvement yet. Property sales, new construction, and completion are all in a deep and unprecedented contraction (Chart 6, panels 1, 2, and 3). Even the commodity building floor space under construction entered contraction for the first time in at least the past two decades (Chart 6, bottom panel). Both central and local governments have implemented policies to revive the property sector since late last year. Following a wave of mortgage boycotts, the July 28 Central Politburo meeting demanded local governments to ensure those sold-but-unfinished housing projects to be completed. However, due to the extreme shortage of funding faced by real estate developers and the fragmented nature of this industry in China, it will take time to get the current property sector crisis resolved. Nonetheless, we expect supportive policies will work to some extent. We expect the year-on-year contraction in property construction to narrow to 10% over the next six months from about 13% in the past six months. Chart 7Infrastructure Sector: The Main Supportive Force for Chinese Steel Demand
Infrastructure Sector: The Main Supportive Force for Chinese Steel Demand
Infrastructure Sector: The Main Supportive Force for Chinese Steel Demand
The infrastructure sector is another major source for Chinese steel demand (Chart 7). The sector contributes about 23% of Chinese steel consumption. Although the traditional infrastructure investment shows a solid 10% growth, we only assume 7% of growth in the sector’s steel demand. This is because, within the traditional infrastructure sector, two heavy steel consuming subsectors –railway and highway constructions – will register slower growth in their respective investments than overall infrastructure. Chart 8Steel Demand In the Machinery Sector: Likely to Remain In Contraction The 2016-2019 Boom: Only Sales Excavators And Cranes Hit A New High...
Steel Demand In the Machinery Sector: Likely to Remain In Contraction The 2016-2019 Boom: Only Sales Excavators And Cranes Hit A New High...
Steel Demand In the Machinery Sector: Likely to Remain In Contraction The 2016-2019 Boom: Only Sales Excavators And Cranes Hit A New High...
Machinery production, the third largest steel consuming sector, will remain in contraction because of the depressed property market. Sales of major construction equipment – excavators, loaders, and cranes – have declined 36%, 23%, and 50% year-on-year in 2022H1 (Chart 8). With continuing weakness in the property market, we expect steel demand from machinery producers to be in a similar contraction (10%) over the next six months. Autos and electric appliances together account for about 7.3% of Chinese steel consumption. Weekly data shows Chinese auto sales are in a recovery phase (Chart 9). We expect the sector’s steel use to increase by 8% year-on-year over the next six months based on our projections from our research on the auto industry. Affected by the faltering domestic property market, the outlook for electric appliances is also dismal. The output of air conditioners, freezers, refrigerators, and washing machines is contracting (Chart 10). The expected contraction in global demand for consumer goods will ensure a continuous drop in their production in China, the largest world producer of white goods. We expect these sectors' steel consumption growth to improve from a 9% contraction in 2022H1 to a 5% contraction over the next six months. Chart 9Steel Demand From Auto Sales is Recovering
Steel Demand From Auto Sales is Recovering
Steel Demand From Auto Sales is Recovering
Chart 10Steel Demand by Electric Appliances: Smaller Contraction Ahead
Steel Demand by Electric Appliances: Smaller Contraction Ahead
Steel Demand by Electric Appliances: Smaller Contraction Ahead
Chart 11Steel Demand in Other Sectors: Will Likely Stay in Contraction
Steel Demand in Other Sectors: Will Likely Stay in Contraction
Steel Demand in Other Sectors: Will Likely Stay in Contraction
Other sectors that consume steel include many industrial goods, such as civil steel ships and containers. The shipping industry has boomed during the past two years because of a global increase in goods demand. This also significantly increased demand for metal containers, and to a lesser extent, civil steel ships between 2020 and 2021 (Chart 11). As global trade volumes contract over the next six months, we expect steel consumption in these other sectors to contract by 3% over the same period. What about external demand for Chinese steel? Chinese steel products exports, which account for about 5% of the country’s steel products output, will grow moderately in the next six months. Historically, the Chinese government had provided a VAT rebate of around 13% to encourage steel exports. Last year, it removed such export tax rebates on various steel products in a bid to slow domestic carbon emissions. Chart 12Chinese Steel Exports: Moderate Growth Ahead
Chinese Steel Exports: Moderate Growth Ahead
Chinese Steel Exports: Moderate Growth Ahead
However, this has not considerably reduced Chinese steel exports. Chinese exports of steel products only had a year-on-year contraction from January to April 2022, largely because of COVID-related shutdowns, and then experienced considerable growth during May-July of the same year (Chart 12). At the same time, Chinese imports of steel products have been contracting since last May. This pattern shows the strong global competitiveness of Chinese steel products. We expect moderate growth in Chinese steel products exports over the next six months, which will be much lower than last year’s growth. In 2021, Chinese steel products exports surged by 25% year-on-year, as steel exporters rushed to export their products to take advantage of the rebates before its removal. Bottom Line: Chinese steel supply is likely to exceed demand over the next six months. This will result in an oversupplied steel market in China, exerting downward pressure on steel prices. …To The Global Iron Ore Market Chart 13Chinese Steel Production: Largely Determines the Country's Iron Ore Imports
Chinese Steel Production: Largely Determines the Country's Iron Ore Imports
Chinese Steel Production: Largely Determines the Country's Iron Ore Imports
Iron ore is mainly used in the steel-making process. Limited iron ore supplies within China mean that about 80% of the country’s iron ore demand are satisfied by imports. As a result, variations in Chinese steel production largely determine swings in Chinese iron ore imports (Chart 13). Based on our expectations of the Chinese steel market, we can provide our supply-demand analysis for the global iron ore market. Global Iron Ore Demand While rebounding Chinese steel output will lift the nation’s iron ore consumption, iron ore demand from the rest of the world will shrink materially. Net-net, global iron ore demand will weaken, albeit only marginally over the next six months. Steel production is declining in the world outside China. We expect such contraction will continue into early 2023, as the pandemic-triggered overspending on goods ex-autos reverses (Chart 14). In addition, in Europe, energy rationing and sky-high energy prices will likely lead to defunct mills as a response to reducing their output; hence, their iron ore consumption will tank. Given that Europe accounts for about 10% of world steel production and nearly 50% of its steel production is using electric furnaces,2 this will reduce global iron ore demand. Last year, global steel production excluding China increased by 13% year-on-year, the highest growth since 2011 (Chart 15). This is much higher than the average 2% growth during 2017-2019, reflecting the overconsumption of goods by advanced economies in 2021. Indeed, steel production has already declined for four consecutive months. We expect a year-on-year contraction of about 5% global steel production in the world excluding China over the next six months. Chart 14The World Outside China: Steel Output Will Continue Declining
The World Outside China: Steel Output Will Continue Declining
The World Outside China: Steel Output Will Continue Declining
Chart 15Falling DM PMI Signals Weaker Steel Output in the World Outside China
Falling DM PMI Signals Weaker Steel Output in the World Outside China
Falling DM PMI Signals Weaker Steel Output in the World Outside China
Scrap steel is one substitute for iron ore in the steel-making process, but, this time, there will be limited replacement from scrap steel in China. Tight supply of scrap steel and relatively high scrap steel prices will make iron ore more appealing than scrap steel as feedstock for Chinese steel producers over the next several months. Scrap prices are currently high relative to both steel product prices and imported iron ore prices (Chart 16). Chart 16Iron Ore Substitute in China: Limited Scrap Steel Demand in 2022H2
Iron Ore Substitute in China: Limited Scrap Steel Demand in 2022H2 More Scrap Steel Will Replace Iron Ore In Steel Production
Iron Ore Substitute in China: Limited Scrap Steel Demand in 2022H2 More Scrap Steel Will Replace Iron Ore In Steel Production
Chart 17China: Domestic Iron Ore Output is Rising
China: Domestic Iron Ore Output is Rising
China: Domestic Iron Ore Output is Rising
Global Iron Ore Supply Global iron ore supply will rise slightly over the next six months. Chinese iron ore output is set to continue increasing as well (Chart 17, top panel). The authorities plan to boost domestic iron ore output by 6.5% per year until 2025. Profit margins for Chinese producers are currently at a multi-year high (Chart 17, bottom panel). This will encourage domestic iron ore production over the next six months. Currencies in global major iron ore producing countries (Brazil, Australia and South Africa) have depreciated considerably. As a result, iron ore prices in these countries in local currency terms are currently still elevated. This will incentivize more iron ore production and exports by producers in these countries. Bottom Line: Global iron ore supply will increase slightly, while demand will contract slightly over the next six months. This will be negative for iron ore prices. Investment Implications Chart 18Global Mining Stocks and Steelmaker Stock Prices: More Downside Ahead Avoid Global Steel And Mining Stocks For Now
Global Mining Stocks and Steelmaker Stock Prices: More Downside Ahead Avoid Global Steel And Mining Stocks For Now
Global Mining Stocks and Steelmaker Stock Prices: More Downside Ahead Avoid Global Steel And Mining Stocks For Now
Both iron ore and steel prices will likely deflate over the next six months. Hence, global mining stocks and steelmakers stock prices will experience more downside in the coming months (Chart 18). Global ex-China steel producers have benefited from strong steel demand in DM and from surging steel prices (Chart 15 above). As we expect that DM demand for consumer goods will contract over the next six months, steel prices will drop, weighing on global steelmakers’ share prices. Concerning equity valuations, global mining and steel stocks trade at very low trailing P/E ratios. However, for highly cyclical stocks, such a low trailing P/E ratio is often a sign of peak profits. At peaks of cycles, share prices drop first, while EPS remains elevated, as it is a backward-looking variable. In fact, more often than not, buying these stocks when the P/E ratio is very high and selling them when the P/E ratio is very low has been a very profitable strategy. In short, a low P/E ratio for mining share prices and steel producers is not a reason to be long these stocks. The direction of both the global industrial cycle and steel and iron ore prices is what matters. On both counts, the outlook remains downbeat for now. Ellen JingYuan He Associate Vice President ellenj@bcaresearch.com Footnotes 1 According to the World Steel Association, crude steel is defined as steel in its first solid (or usable) form, including ingots, semi-finished products (billets, blooms, slabs), and liquid steel for castings. 2 The electric furnace is using electricity and scrap steel to produce crude steel. As Europe is facing energy constraint, this will likely affect European steel output greatly. Strategic Themes Cyclical Recommendations
Listen to a short summary of this report. Executive Summary The Euro And The Chinese Credit Impulse
The Euro And The Chinese Credit Impulse
The Euro And The Chinese Credit Impulse
The US dollar has bounced off its 50-day moving average. In the recent past, that had led to a period of cyclical strength. The yen rally can be explained by the decline in Treasury yields and the fall in energy prices. Where next for the yen will depend on the time horizon. For investors trying to time the bottom, the euro is not yet a buy, but the common currency is incredibly cheap. Much depends on global/Chinese growth (Feature Chart). One of the key drivers of the dollar is volatility, and the correlation with the MOVE index. Less uncertainty will ease safe-haven demand. Stay short EUR/JPY and CHF/JPY. Remain long EUR/GBP. Maintain a limit sell on CHF/SEK at 10.76. RECOMMENDATIONS inception date RETURN Short EUR/JPY 2022-07-21 3.68 Bottom Line: We are tactically neutral the dollar but will be sellers on strength. Questions And Answers Chart 1Currencies And Yield Differentials
Currencies And Yield Differentials
Currencies And Yield Differentials
It is rare that we receive clients in our Montreal office. This has obviously been doubly the case due to the pandemic and the general hassle of travel nowadays. But when we do, it is a delight. In this week’s report, we got asked a few difficult questions on a tea date. The most important was not surprisingly the dollar view, but also our highest conviction trades in FX markets. We enjoyed the conversation and the intellectual debate, so we thought we would share this with our clients. Hopefully, this answers some of the most pressing questions. We have sliced this into as brief and concise a conversation as we could. Question: It is hard not to notice the steep decline in the dollar over the last few weeks. Should we fade this decline or lean into it? That is a tough question, but our educated guess is to fade it for now. That said, longer-term asset allocators should really be looking at buying extremely cheap G10 currencies on any declines. The drivers of dollar downside have been clear. First, long-term interest rates in the US have fallen substantially. The US 10-year Treasury yield has fallen from 3.5% to 2.7%. In real terms, they have also declined. The 10-year TIPS yield has fallen from 0.85% to 0.23%. On a relative basis, the market is also pricing in that the Fed will cut interest rates next year much faster than other central banks. More simply put, 2-year real bond yields in the US are rolling over, relative to the euro area and Japan, the biggest components of the DXY index (Chart 1). Related Report Foreign Exchange StrategyHow Deep A Recession Is The Dollar Pricing In? Specific to Japan and the euro area, there has also been another critical factor – the decline in energy import costs. Germany’s trade balance improved markedly in June (Chart 2). This has been the first genuine improvement in a year. There is also discussion to extend the life of existing nuclear power plants, which will help assuage energy import costs. In Japan, trade balance data comes out on Monday next week, so we will see what it reveals. But what has been clear is a political drive to restart nuclear power and wean the Japanese economy off its dependence on oil and gas (Chart 3). Japanese prime minister Fumio Kishida has been very vocal about this in recent speeches. Chart 2Euro Area And Japanese Trade Balances Are Improving
Euro Area And Japanese Trade Balances Are Improving
Euro Area And Japanese Trade Balances Are Improving
Chart 3A Nuclear Renaissance In Japan?
A Nuclear Renaissance In Japan?
A Nuclear Renaissance In Japan?
Turning to the more important part of your question, should we fade the decline or lean into it? We are of two minds on this to be honest, and here is why. The DXY has bounced off its 50-day moving average, which has been a sign in the past that the rally is not over (Chart 4). Our Geopolitical and Commodity & Energy colleagues are telling us not to trust the decline in oil prices. Our bond strategists think US yields are heading higher, with a whisper floor of 2.5%. Chart 4The DXY Has Support At The 50-Day Moving Average
The DXY Has Support At The 50-Day Moving Average
The DXY Has Support At The 50-Day Moving Average
Given these crosscurrents, there are many better opportunities that exist in FX at the crosses, rather than playing the dollar outright. But of course, the dollar call is critical. We would be neutral over the next three-to-six months but be incremental sellers of the dollar on strength. Question: Okay, neutral dollar for now, but bearish long term. We tend to consider longer-term investments as well, and we are confused about the euro, but even more so about the yen. Would you buy the yen today? If so, why? Our starting point for many currencies is valuation. On this basis, the yen is incredibly cheap. So, if you have a five-to-ten-year horizon, you can unlock incredible value in Japan, simply on a buy-and-hold basis. Our in-house curated model shows that the yen is at a multi-general low in value terms (Chart 5). Currencies mean-revert. Consider this for a minute – we are not equity experts, but Toyota trades at a P/E of 10.75, while Tesla trades at a P/E of 109.15. And yes, Toyota has electric cars. Chart 5The Japense Yen Is Incredibly Cheap
The Japense Yen Is Incredibly Cheap
The Japense Yen Is Incredibly Cheap
Chart 6The Yen Is A Favorite Short
The Yen Is A Favorite Short
The Yen Is A Favorite Short
It is true that a winner-takes-all mantra can be attributed to Tesla’s valuation over Toyota, but our colleagues in the Global Investment Strategy are telling us this era is over. As such, at a 40% discount, the yen is a long-term buy in our books. Interestingly, nobody likes the yen, at least by our preferred measure – net speculative positions. It is one of the most shorted G10 currencies (Chart 6). A cheap currency that is the most shorted ranks quite well in our evaluation of bargains in currency markets. Given my discussion above about the dollar, we have played the yen at the crosses. We are short EUR/JPY and CHF/JPY. On the euro, Japanese car manufacturers are simply becoming more competitive than their eurozone or US counterparts. This is not only related to the car industry, but according to the OECD, EUR/JPY is expensive on a purchasing power parity basis (Chart 7). Meanwhile, a short EUR/JPY trade is a perfect hedge for a pro-cyclical portfolio. The DXY index has historically traded in perfect inverse correlation to the euro-yen exchange rate (Chart 8). This suggests the collapse in the yen, relative to the euro, is very much overdone. In a risk-off environment, EUR/JPY will sell off. Meanwhile, there are also fundamental reasons to suggest that the yen should trade higher vis-à-vis the euro. Chart 7Remain Short ##br##EUR/JPY
Remain Short EUR/JPY
Remain Short EUR/JPY
Chart 8The DXY And EUR/JPY Usually Track Each Other
The DXY And EUR/JPY Track Each Other EUR/JPY And The DXY: Unsustainable Gap
The DXY And EUR/JPY Track Each Other EUR/JPY And The DXY: Unsustainable Gap
Question: Okay, let’s switch to the euro. I know you are short EUR/JPY, which has been working out well in the last few days. But the euro touched parity and I get a sense that it has bottomed. You have often mentioned that the euro has priced in one of the deepest recessions in the eurozone. I am surprised you are not trumpeting this currency and a once-in-a-lifetime buying opportunity. We agree somewhat with your conclusion but not the premise. Let’s consider the narrative over the last few months in the media. The first was that eurozone inflation will never catch up to the US, because the economy was structurally weak. Well, it did, albeit due to an exogenous shock. So, among a ranking of stagflationary candidates, the euro area is a top contender. If you believe in the idea that currencies are driven by real interest rates, rising inflation, and falling growth are an anathema for the exchange rate. When we typically have doubts about the euro area economy, and the outlook for its financial markets, we consult with our European Investment Strategy colleagues. We did just that and Mathieu Savary, who heads the service, mentioned two things: one – Chinese import volumes are imploding. For net creditor nations, this is a negative as their source of income is waning. The euro area falls into that category. The second thing to consider is that the dollar is a momentum currency. So is the euro. We mentioned earlier that the dollar bounced off its 50-day moving average, which explains euro weakness in recent trading days. In the end, Mathieu and the FX team did not really disagree, but I highlighted two charts to track. The euro tracks the Chinese credit impulse due to the importance of Chinese import demand for the euro area. It looks like our measure of that impulse has bottomed (Chart 9). If it has, you buy the euro on a long-term view. Relatedly, financial conditions are easing in China. As the Chinese bond market becomes more open and liberalized, bond yields become a financial conditions valve. That has been the case and has perfectly tracked the propensity for imports in the last few years (Chart 10). Chart 9The Euro And The Chinese Credit Impulse
The Euro And The Chinese Credit Impulse
The Euro And The Chinese Credit Impulse
Chart 10Financial Conditions Are Easing In China
Financial Conditions Are Easing In China
Financial Conditions Are Easing In China
In short, we will buy the euro if it touches parity, and even more so below parity with a 5–10-year view, but we think EUR/USD could touch 0.95 in the near term. I guess what we are saying is that a 5%-7% move is big in FX markets, but a 26% move (the undervaluation of the euro) is a whale. We do not see the catalyst for a whale in our current compass. Question: We have talked about the yen and the euro. I do not want to get into the pound, Australian dollar, and other currencies as you have told me your team has upcoming reports on those. But the Chinese yuan is very important in my investment portfolio. Any ideas on its next move? USD/CNY topped out near 6.8 in May. Since then, it has been in a trading range despite the DXY breaking to multi-decade highs (Chart 11). When a pattern like this emerges, it is always useful to revisit fundamentals. Those fundamentals are real interest rate differentials. We care about the yuan because China is a big trading partner of the US. As such, it is also a huge weight in the broad trade-weighted dollar index. China has huge problems, especially related to the property market, which need to be resolved. Bond yields have also collapsed. But the real interest rate in China is very attractive (Chart 12). It is also important to consider that if the dollar is the global safe haven, that means that the yuan could be becoming the haven in Asia. So, yuan downside is not a big risk for our long-term dollar bearish call. That said, we will be short CNY versus the yen, but not the dollar. Chart 11The RMB Has Been Relatively Resilient
The RMB Has Been Relatively Resilient
The RMB Has Been Relatively Resilient
Chart 12The RMB Has Undershot Real Rate Differentials
The RMB Has Undershot Real Rate Differentials
The RMB Has Undershot Real Rate Differentials
Question: I think I could sit with you all morning to discuss other aspects of FX, but I respect you have a tight stop due to the BLU meeting. Any concluding thoughts? I have one. Very often, we debate with our colleagues about capital flows. The dollar rises (in general), as capital inflows accelerate into the US and vice versa. It is often said that getting the dollar call right gets everything else right. So, if you can predict the path of the dollar, the performance of, say, US versus non-US equities becomes easy. Chart 13The Dollar And Earnings Revisions
The Dollar And Earnings Revisions
The Dollar And Earnings Revisions
We agree that the dollar is a real-time indicator of relative fundamentals. But here is one important observation: relative earnings revisions are deteriorating in the US vis-à-vis other countries (Chart 13). That has historically had an impact on exchange rates, as it affects equity capital flows. If the Federal Reserve also cut rates next year as the market is predicting, that will also be a negative for bond inflows. We think the global economy will avoid a deep recession, and that will allow growth to pick up outside the US. When the euro area and China bottom, then the dollar will truly peak, as capital flows to these economies will accelerate. So we are watching relative earnings and bond yield differentials closely. Chester Ntonifor Foreign Exchange Strategist chestern@bcaresearch.com Trades & Forecasts Strategic View Cyclical Holdings (6-18 months) Tactical Holdings (0-6 months) Limit Orders Forecast Summary
Executive Summary China Copper Consumption Failed To Revive Post-Pandemic
China Copper Consumption Failed To Revive Post-Pandemic
China Copper Consumption Failed To Revive Post-Pandemic
A greater-than-expected contraction in manufacturing and construction in China – evidenced by the latest PMI and home sales data – will keep pressure on copper prices. Higher inflation will continue to drive the cost of labor, fuels and materials higher. Lower copper prices and higher input costs will weaken margins, leading to reduced capex. This also will put pressure on the rate of spending on projects already sanctioned. Payouts to shareholders – buybacks and dividends – will fall, reducing the appeal of miners’ equities. Debt-service costs will rise as interest rates are pushed higher by central banks. Civil unrest in critically important metals-producing provinces is forcing some miners to suspend production guidance. This will be exacerbated in Chile by changing tax regimes, which likely will reduce capex as well. Bottom Line: As global demand for copper increases with the renewable-energy transition and higher arms spending in Europe, miners’ ability to expand supply is being seriously challenged. Falling prices and rising costs – along with higher tax burdens and civil unrest in key mining provinces – are forcing copper miners to lower production and capex guidance, which will redound to the detriment of supply growth. With demand expected to double by 2030-35, copper prices will have to move higher to keep capex flowing to support supply growth. We remain long the XME ETF as the best way to express our bullish, decade-long view. Feature Just as the world is scrambling to develop additional energy supplies in the wake of Russia’s invasion of Ukraine, copper supplies – the critical element of the renewable-energy buildout – are being squeezed by an unusual convergence of fundamental, financial and social factors. Chart 1China Copper Consumption Failed To Revive Post-Pandemic
China Copper Consumption Failed To Revive Post-Pandemic
China Copper Consumption Failed To Revive Post-Pandemic
Firstly, copper demand is weak, which, all else equal, is suppressing prices. This is largely down to China’s zero-tolerance COVID-19 policy, and uncertainty over whether the EU will be pushed into a massive recession, following the cutoff of its natural gas supplies from Russia. These are two of the three major pillars of the global economy, and their economies are entwined via trade in goods. China’s COVID-19 policy is hammering its critically important property market – sales were down almost 40% y/y in July – and forcing a contraction in manufacturing. Construction represents ~ 30% of total copper demand in China. Manufacturing is contracting, based on China’s official July PMI report, which showed the index fell below 50 to 49.0 for July.1 Related Report Commodity & Energy StrategyOne Hot Mess: EU Energy Policy China accounts for more than half of global copper demand, and, because of its zero-tolerance COVID-19 policy, was the only major economy to register a year-on-year contractions in copper demand throughout the pandemic up to the present (Chart 1). The EU accounts for ~ 12.5% of global copper demand, which we expect will continue to be supported by the bloc’s renewable-energy and defense buildouts.2 We noted in earlier research the odds of the EU going into recession remain high as the bloc scrambles to prepare for winter, in the wake of its attempts to replace its dependence on Russian natural gas supplies.3 We continue to expect the EU will avoid a major recession, and that it will be able to navigate this transition, leaving it on a better energy footing in subsequent years.4 Lower Copper Prices Will Hurt Capex Chart 2Copper Price Rally Fades
Copper Price Rally Fades
Copper Price Rally Fades
After bottoming in March 2020 at $2.12/lb on the COMEX, copper prices staged a 125% rally that ended in March of this year. This was due to the post-pandemic reopening of most economies ex-China, which was accompanied by massive fiscal and monetary stimulus that super-charged consumer demand. Copper prices have since fallen ~33% from their March highs on the back of a substantial weakening of demand resulting from China’s zero-tolerance COVID policy and a concerted global effort to rein in the inflation caused by governments’ largess (Chart 2). Most year-end 2021 capex expectations for 2022 and into the future among copper miners were drawn up prior to the price collapse in June. After that, fear of central-bank policy mistakes – chiefly over-tightening of monetary policy that pushes the global economy into recession – and weak EM demand took prices from ~ $4.55/lb down to less than $3.20/lb by mid-July. A strong USD also pushed demand lower during this time. Chart 3DRC Offsets Chile, Peru Weakness
Copper Capex Under Pressure
Copper Capex Under Pressure
Following the copper-price rout, miners are re-thinking production goals, dividend policy and capex. Social and governance issues also are contributing to weaker copper output. Rio Tinto, for example, notified markets it would shave $500mm from its $8 billion 2022 capex budget. For 1H22, Rio cut its dividend to $2.67/share from $5.61/share in 1H21. Elsewhere, Glencore said copper output from its Katanga mine in the DRC now is expected to come in 15% lower this year, at 1.06mm MT, owing to geological difficulties. Separately, output guidance for Chinese miner MMG Ltd’s Las Bambas mine in Peru has been suspended, following a 60% drop in production. The company expected it would be producing up to 320k tons this year. Civil unrest at Las Bambas has been ongoing since production started in 2016, according to Reuters. Big producers like Chile and Peru – accounting for ~ 35% of global ore production – along with the DRC face multiple challenges. Chile accounts for ~ 25% of global copper ore production. Its output fell ~ 6% in 2Q22 vs year-earlier output due to falling ore quality, water-supply constraints, and rising input costs (Chart 3). Chile’s government expects copper ore output to decline 3.4% y/y in 2022, with many of the country’s premier mines faltering (Chart 4). Chart 4Chile Expecting Lower Copper Output
Copper Capex Under Pressure
Copper Capex Under Pressure
Chile also is proposing to increase taxes and royalties, to raise money for its budget. However, this may have the effect of driving away investment in the country’s copper mining industry. Fitch notes, “Increased costs will decrease mining cash flows and discourage new mining investments in Chile, favoring the migration of investors to other copper mining districts.”5 BHP Billiton, on que, said it will reconsider further investment in Chile, if the new legislation is approved. Renewables Buildout Will Widen Copper Deficit Markets appear to be trading without regard for the huge increase in copper supply that will be required for the global renewable-energy transition, to say nothing of the upcoming re-arming of the EU and continued military spending by the US and China. In our modeling of supply-demand balances, we move beyond our usual real GDP-based estimates of demand, which estimates the cyclical copper demand, and include assumptions for the demand the green-energy transition will contribute. Hence, this additional copper demand for green energy needs to be added to the copper demand forecast generated by the model. Using projections for global supply taken from the Resource and Energy Quarterly published by the Australian Government’s Department of Industry, Science and Resources, we estimate there will be a physical refined copper deficit of 224k tons in 2022 and 135K tons next year (Chart 5). Among other things, we are assuming refined copper demand will double by 2030 and reach 50mm tons/yr by then. This is a somewhat more aggressive assumption than S&P Global’s estimate of demand doubling by 2035. If we assume refined copper production is 2% lower than the REQ’s estimate, we expect the physical deficit in the refined copper market rise to a ~ 532k-ton deficit in 2022 and ~ 677k-ton deficit in 2023. These results including renewables demand highlight the need to not only account for cyclical demand but also the new demand that will be apparent as the EU, the US and China kick their renewables investments into high gear. Importantly, this kick-off is occurring with global commodity-exchange inventories still more than ~ 35% below year-ago levels (Chart 6). Chart 5Coppers Deficit Will Narrow On Lower Demand
Coppers Deficit Will Narrow On Lower Demand
Coppers Deficit Will Narrow On Lower Demand
Chart 6Exchange Inventories Remain Exceptionally Low
Exchange Inventories Remain Exceptionally Low
Exchange Inventories Remain Exceptionally Low
Investment Implications Copper prices will have to move higher to keep capex flowing to support supply growth normal cyclical demand and renewable-energy demand will require over coming decades. Falling prices and rising costs – along with higher tax burdens and civil unrest in key mining provinces – are forcing copper miners to lower production and capex guidance, which will redound to the detriment of supply growth. This situation cannot persist unless governments call off their renewable-energy transition, and, in the case of the EU, their efforts to re-arm Europe’s militaries following the invasion of Ukraine by Russia. We remain bullish base metals, particularly copper. We remain long the XME ETF as the best way to express this decade-long view. Commodities Round-Up Energy: Bullish OPEC 2.0 agreed a token increase in oil production Wednesday of 100k b/d, partly as a sop to the US following President Biden’s visit to the Kingdom last month. KSA will be producing close to 11mm b/d in 2H22. We have argued this is about all KSA will be willing to put on the market, in order to maintain some spare capacity in the event of another exogenous shock. OPEC 2.0 spare capacity likely falls close to 1.5mm b/d in 2023 vs. an average of 3mm b/d this year, which will limit the capacity of core OPEC 2.0 – KSA and the UAE – to backstop unforeseen production losses. Separately, the US EIA reported total US stocks of crude oil and refined products rose 3.5mm barrels (ex SPR inventory). Demand for refined products in the US was down 28mm barrels in the week ended 29 July, or 4mm b/d. We continue to expect prices to average $110/bbl this year and $117/bbl next year (Chart 7). Base Metals: Bullish China flipped from a net importer of refined zinc in 2021 to a net exporter for the first half of 2022, despite a high export tax on the metal. This is indicative of the premium Western zinc prices are commanding over the domestic price. Chinese zinc demand has fallen, following reduced manufacturing activity and an ailing property sector. Thursday’s Politburo meeting did little to encourage markets of a Chinese rebound later this year. A subdued Chinese recovery, along with European zinc smelters operating at reduced capacity, if at all, could see this reversal in trade flow perpetuate for the rest of the year. Precious Metals: Bullish As BCA’s Geopolitical Strategy highlighted, US House Speaker Nancy Pelosi’s visit to Taiwan will increase tensions between the US and China but will not lead to war. For now. Increased uncertainty normally is good for gold and its rival, the USD. While geopolitical uncertainty from Russia’s invasion of Ukraine initially buoyed the yellow metal, gold has since dropped below the USD 1800/oz level. The greenback was the main beneficiary from the war (Chart 8). It is yet to be seen how this round of geopolitical risk will impact gold and USD, with the backdrop of increasing odds of a US recession and a hawkish Fed. Chart 7
Brent Backwardation Will Steepen
Brent Backwardation Will Steepen
Chart 8
Gold Prices Going Down Along With USD
Gold Prices Going Down Along With USD
Robert P. Ryan Chief Commodity & Energy Strategist rryan@bcaresearch.com Ashwin Shyam Research Analyst Commodity & Energy Strategy ashwin.shyam@bcaresearch.com Paula Struk Research Associate Commodity & Energy Strategy paula.struk@bcaresearch.com Footnotes 1 Please see China’s factory activity contracts unexpectedly in July as Covid flares up published by cnbc.com on July 31, 2022. The PMI summary noted contractions in oil, coal and metals smelting industries led the index’s decline. 2 Please see One Hot Mess: EU Energy Policy, which we published on May 26, 2022, for additional discussion. 3 Please see Copper Prices Decouple From Fundamentals, which we published on July 7, 2022. It is available at ces.bcaresearch.com. 4 Please see Energy Security Rolls Over EU's ESG Agenda published on July 28, 2022. It is available at ces.bcaresearch.com. 5 Please see Proposed Tax Reform Weakens Cost Positions for Chilean Miners (fitchratings.com), published by Fitch Ratings on July 7, 2022. Investment Views and Themes Strategic Recommendations Trades Closed in 2022
Executive Summary Non-Commodity Enterprises: No Profit Expansion For 12 Years
Flat Profits For Non-Commodity Enterprises
Flat Profits For Non-Commodity Enterprises
The past decade has seen a deterioration in the financial performance metrics of industrial Chinese companies. Declining efficiency of investments, rising labor compensation and slowing productivity growth will constitute formidable headwinds to the long-term profitability of China’s industrial sector. Potential deleveraging by local governments, companies and households will cap revenue growth for enterprises and, hence, weigh on their profitability. High commodity prices in the past 18 months have improved profitability and financial metrics for commodity producers. These strengths will reverse as commodity prices sink in the coming months. Corporate earnings are set to disappoint in 2H. Bottom Line: We maintain a neutral stance on Chinese onshore stocks and an underweight stance on investable stocks in a global equity portfolio. In absolute terms, risks to Chinese shares prices are to the downside. Among Chinese industrial companies, underweight commodity producers and overweight food & beverage, autos and utilities. The data for this report for industrial enterprises, which are sourced from China’s National Bureau of Statistics (NBS), encompass state-owned and holding enterprises (SOEs) and other forms of ownership, including private ones. It covers both listed and non-listed companies. The sectors included are construction materials, steel, non-ferrous metals, energy, coal, machinery, auto, tech hardware, food & beverage and utilities. An analysis based on this dataset shows that China’s corporate profitability and efficiency ratios have experienced a prolonged structural downturn since the early 2010s (Chart 1 and 2). Chart 1Chinese Industrial Companies: Structural Deterioration in Productivity...
Chinese Industrial Companies: Structural Deterioration in Productivity...
Chinese Industrial Companies: Structural Deterioration in Productivity...
Chart 2… And Operational Efficiency
...And Operational Efficiency
...And Operational Efficiency
Chart 3Cyclical Improvements Within Structural Downtrend
Cyclical Improvements Within Structural Downtrend
Cyclical Improvements Within Structural Downtrend
In the past 10 years, these measures improved only modestly during recovery periods and stumbled during downturns (Chart 3). The structural deterioration in corporate profitability from 2011 onward has followed structural improvements from the late 1990s to 2010. Beyond cyclical upswings, China's corporate profitability will likely continue to face structural headwinds. Declining efficiency of investments, rising labor compensation and slowing productivity growth will constitute formidable headwinds to the long run profitability of China’s industrial sector. Furthermore, potential deleveraging by local governments, companies and households will curtail revenue growth for enterprises and, hence, weigh on profitability. Investigating The Financial Performance Of Industrial Enterprises Our analysis of corporates’ financial ratios shows the following: Corporate leverage: The total liabilities (debt)-to-sales ratio rose sharply from 2011 until 2021. However, the leverage ratio has declined in the past 18 months. A close examination suggests that the descent in the debt-to-sales ratio has been due to surging revenues of resource producing companies propelled by rising commodity prices. Chart 4 illustrates that the debt-to-sales ratio has dropped substantially for commodity producers, but much less so for other industrial companies. In the case of non-commodity industrial enterprises, the leverage ratio has not declined much because nominal sales have been lackluster. As resource prices continue to drop, revenues of commodity companies will be devastated, and their debt-to-sales ratios will spike. The thesis that corporate leverage has not yet dropped in China is corroborated by data on all companies. The country’s corporate leverage remains the highest worldwide (Chart 5). Chart 4The Decline In Debt-To-Sales Ratio For Commodity Producers Was Largely Due to Surging Commodity Prices
The Decline In Debt-To-Sales Ratio For Commodity Producers Was Largely Due to Surging Commodity Prices
The Decline In Debt-To-Sales Ratio For Commodity Producers Was Largely Due to Surging Commodity Prices
Chart 5China's Corporate Leverage Remains The Highest In the World
China's Corporate Leverage Remains The Highest In the World
China's Corporate Leverage Remains The Highest In the World
Chart 6Corporates' Debt servicing Ability Has Been propelled by falling interest rates
Corporates' Debt Servicing Ability Has Improved Due To Lower Interest Rates
Corporates' Debt Servicing Ability Has Improved Due To Lower Interest Rates
Debt servicing: Even though debt levels of industrial companies remain elevated, their interest coverage ratios – operating profits-to-interest expense – have improved since late 2020. For all industries, interest expenses have dropped substantially because of falling interest rates (Chart 6). On the margin, this has also helped industrials’ profit margins. Efficiency: Asset turnover (sales/assets), inventory turnover (sales/inventory) and receivables turnover (sales/receivables), have all have sunk in the past 10 years, as shown in Chart 2. Lower turnover indicates falling efficiency. Coal, steel and non-ferrous metals have been the only sectors experiencing an improvement in inventory turnover due to China’s capacity reduction campaign. Meanwhile, there has been no improvement in inventory turnover for non-commodity enterprises. Profit margins: Net profit margins for industrial corporates have recently risen slightly. However, the entire improvement in industrial profit margins is attributable to commodity producers. With the exception of commodity producing sectors, there has not been any upturn in operating profit margins and/or net profit margins (Chart 7). Rising corporate income taxes from 2011 to 2020 were one of the reasons worsening profitability (Chart 8). Chart 7Improvement In Industrial Profit Margins Is Attributable To Commodity Producers
Improvement In Industrial Profit Margins Is Attributable To Commodity Producers
Improvement In Industrial Profit Margins Is Attributable To Commodity Producers
Chart 8Rising Corporate Income Taxes Have Contributed The Divergency Between GPM And Net Profit Margin
Corporate Tax Burden Rose From 2010 To 2020
Corporate Tax Burden Rose From 2010 To 2020
Profitability: The return on assets (RoA) and the return on equity (RoE) for industrial corporates have dwindled during the past decade (Chart 1 above). The spike in commodity prices in the past two years has helped profitability of commodity producers, but this is about to reverse. A DuPont analysis1 illustrates that the downturn in corporate profitability was driven by poor operating efficiency and a lack of improvement in net profit margins. Chart 9 shows that the profitability of non-commodity producers has worsened dramatically during the past 10 years. After more than a decade-long structural downturn, the RoA and RoE for commodity producers have recently strengthened along with asset turnovers and net profit margins (Chart 10). However, the commodity bonanza is over for now and profitability measures of resource companies are set to worsen significantly.2 Chart 9A DuPont Analysis: Non-Commodity Enterprises
A DuPont Analysis: Non-Commodity Enterprises
A DuPont Analysis: Non-Commodity Enterprises
Chart 10A DuPont Analysis: Commodity Enterprises
A DuPont Analysis: Commodity Enterprises
A DuPont Analysis: Commodity Enterprises
Bottom Line: The past decade has seen a deterioration in the financial performance metrics of industrial companies. The profitability of corporates has undergone a structural decline along with a prolonged slump in operating efficiency. High commodity prices in the past 18 months have ameliorated profitability and efficiency parameters for commodity producers. Nevertheless, these improvements will vanish as commodity prices fall materially in the coming months. Structural Headwinds To Corporate Profitability The following factors will weigh on China’s corporate profitability in the long term: 1. Demographics and rising labor costs: A shrinking workforce since mid-2010s has led to higher wages that have weighed on the corporate sector’s profitability (Chart 11). This dynamic is also confirmed by rising labor compensation as a share of non-financial corporates’ value added, as illustrated in Chart 12. Chart 11China: Shrinking Labor Force
China: Shrinking Labor Force
China: Shrinking Labor Force
Chart 12Labor Compensation As A Share Of Corporate Revenues
Labor Compensation As A Share Of Corporate Revenues
Labor Compensation As A Share Of Corporate Revenues
In China, blue-collar labor shortages and upward pressures on wages will likely intensify in the coming decade. A rapid decline in the population’s natural growth rate with the third lowest fertility rate in the world (below Japan) foreshadows a decline in China’s working age population which started in 2015. 2. Common prosperity policies: The share of labor compensation in GDP has risen since 2011 at the expense of the share of corporate profits (Chart 13). China’s common prosperity policies will only reinforce this trend. These policies will encourage enterprises to assume more social duties, distributing a larger share of profits to society at the expense of shareholders. Chart 13Labor's Share Will Continue Rising In China's National Income
Labor's Share Will Continue Rising In China's National Income
Labor's Share Will Continue Rising In China's National Income
Chart 14Output Per Unit Of Capex Is Falling
Output Per Unit Of Capex Is Falling
Output Per Unit Of Capex Is Falling
3. Declining efficiency of investments: A deteriorating output-to-capital ratio indicates capital misallocation or falling efficiency (Chart 14). When a nation attempts to invest substantially for a long time, capital will likely be misallocated and the return on new investment will be low. This will drag down the overall return on capital. Falling efficiency ultimately entails lower productivity. 4. Slowing productivity growth: China’s productivity growth has downshifted, and total factor productivity growth slipped again recently. Notably, total factor productivity – a measure of productivity calculated by dividing economy-wide total production by the weighted average of inputs – has contributed less and less to China’s real GDP growth in the past decade. It is unrealistic to expect that China will reverse the downward trend in productivity growth in the next few years. 5. Deleveraging by companies and households: China’s corporate sector continues to face deleveraging pressures. Although some industrial enterprises underwent deleveraging in recent years, the country’s overall corporate debt is still very elevated. Remarkably, Chinese corporate debt as a share of nominal GDP is the highest in the world, as shown in Chart 5. China’s households are reducing debt. Depressed household income growth and deflating home prices have curbed borrowing. Deleveraging by households heralds weaker consumption, which is negative for corporates revenues. Bottom Line: Rising labor compensation and declining efficiency of investments constitute formidable headwinds to the profitability of China’s industrial sector. Moreover, the secular outlook of corporates’ profitability is also vulnerable to lower productivity growth and weaker top-line growth due deleveraging among companies and households. The Cyclical Outlook In our report two weeks ago, we discussed how China’s business cycle recovery in the second half of this year will be more U rather than V shaped. Both sluggish domestic demand and contracting external demand for Chinese exports will curb the rebound of the industrial sector in 2H. Industrial earnings are set to disappoint. Chart 15Non-Commodity Enterprises: No Profit Expansion For 12 Years
Flat Profits For Non-Commodity Enterprises
Flat Profits For Non-Commodity Enterprises
Manufacturing producers have not been able to fully pass on higher input prices to consumers given weak demand. This weakness together with elevated commodity prices has led to a substantial profit divergence between upstream and mid- and downstream industries since late 2020 (Chart 15). However, upstream commodity producers face the headwind of commodity price deflation. At the margin, weakening resource prices will benefit mid- and downstream industries that use commodities. However, their revenue growth will remain fragile due to subdued domestic and external demand and a lack of pricing power. The tight correlation between industrial profits and raw material prices reinforces the importance of commodity prices as a driver of China’s industrial profit cycles Therefore, if commodity prices drop meaningfully in the second half of this year, then overall industrial profits in China will suffer markedly. Chart 16The share of loss-making industrial enterprise ventures has Rocketed
The Share of Loss-Making Industrial Enterprises Has Been Surging
The Share of Loss-Making Industrial Enterprises Has Been Surging
Furthermore, overcapacity and operational inefficiencies persist despite supply-side reforms and a capacity reduction campaign implemented by China’s authorities. Chart 16 demonstrates that the share of loss-making industrial enterprise ventures has soared to 24%, implying capital misallocation. With a further rising share of enterprises making losses as commodity prices plunge, the ability of companies to service debt will deteriorate and hence banks will experience climbing non-performing loans. Bottom Line: China’s recovery in the second half of this year will be more U than V shaped. Corporate earnings are set to disappoint in 2H. Investment Strategy The gloomy outlook for corporate profitability does not bode well for the performance of Chinese stocks. Chinese A-shares are struggling to bottom on the back of shaky economic fundamentals, while investable stocks are cheap for a reason. We maintain a neutral stance on Chinese onshore stocks and an underweight stance on investable stocks in a global equity portfolio. Lower profitability and return on equity have ramifications for the valuations of China’s industrial companies. Remarkably, China’s industrial profits have been flat in the past 12 years (Chart 15 above). That is a reason why many Chinese stocks have been de-rated. Among A-share industrial companies, sectors with higher profitability are coal, non-ferrous metals, auto, construction materials and food & beverage. However, coal, non-ferrous metals and construction materials are pro-cyclical sectors, and their profit growth is positively correlated with economic growth, which is facing downward pressure at least through the end of this year. In addition, resources and commodity plays are vulnerable in the next 6 to 12 months. We recommend to underweight these sectors. Within the Chinese equity universe, we recommend overweighting autos, food & beverage, and utilities sectors. Food & beverage and utilities are interest rate-sensitive sectors, which will continue to benefit from lower onshore bond yields. In addition, utilities sector’s profit margin and earnings will improve as coal prices decline. The auto sector will gain an advantage from China’s stimulus for auto purchases, especially for new energy vehicles. Qingyun Xu, CFA Associate Editor qingyunx@bcaresearch.com Arthur Budaghyan Chief Emerging Markets Strategist arthurb@bcaresearch.com Footnotes 1 The DuPont analysis breaks down return on equity in three distinct elements: net profit margin, operational efficiency, and leverage. This analysis enables to identify how various drivers impact return on equity. 2Please see China Investment Strategy Special Report "Global Copper Market: No Bottom Yet," dated July 27, 2022, and Emerging Markets Strategy Report "A Cocktail Of Falling Oil Prices And Surging US Wages," dated July 21, 2022, available at bcaresearch.com Strategic Themes Cyclical Recommendations
Listen to a short summary of this report. Executive Summary Investors Are Pricing In A Much More Aggressive Tightening Cycle Than At The Start Of The Year
Investors Are Pricing In A Much More Aggressive Tightening Cycle Than At The Start Of The Year
Investors Are Pricing In A Much More Aggressive Tightening Cycle Than At The Start Of The Year
Following last week’s sharp post-FOMC rally, we shifted our 12-month equity recommendation from overweight to neutral. We expect stock prices to rise further during the remainder of the year as US recession risks abate, but then to give up most of their gains early next year as it becomes clear that the Fed has no intention of cutting rates and may even need to raise rates. We have more conviction that US growth will hold up over the next 12 months than we do that inflation will fall as fast as the Fed expects or the breakevens imply. These varying degrees of conviction stem from the same reason: The neutral rate of interest in the US is higher than widely believed. A high neutral rate implies that it may take significant monetary tightening to slow the economy. That reduces the risk of a recession in the near term, but it raises the risk that inflation will remain elevated. A recession is now our base case for the euro area. However, we expect the European economy to bounce back early next year, as gas supplies increase and fiscal policy turns more stimulative. The euro has significant upside over the long haul. Bottom Line: Stocks will continue to recover over the coming months before facing renewed pressure early next year. We are retaining our tactical (3-month) overweight on global equities but are shifting our 12-month recommendation to neutral. Taking Some Chips Off the Table Following last week’s sharp post-FOMC rally, we shifted our cyclical 12-month equity recommendation from overweight to neutral. This note lays out the key considerations in a Q&A format. Q: Have any of your underlying views about the economy changed recently or has the market simply moved towards pricing in your benign outlook? A: Mainly the latter. While we continue to see a higher-than-normal risk of a US recession over the next 12 months, our baseline (60% odds) remains no recession. Q: Many would say that we are in a recession already. A: While two consecutive quarters of negative growth does not officially constitute a recession, it is correct to say that every time real GDP has contracted for two quarters in a row, the NBER has ultimately deemed that episode a recession (Chart 1). Chart 1In The Past, Two Consecutive Quarters Of Negative Growth Have Always Coincided With A Recession
In The Past, Two Consecutive Quarters Of Negative Growth Have Always Coincided With A Recession
In The Past, Two Consecutive Quarters Of Negative Growth Have Always Coincided With A Recession
That said, one should keep two things in mind. First, preliminary GDP estimates are subject to significant revisions. According to our calculations, there is a 35% chance that real GDP growth in Q2 will ultimately be revised into positive territory (Chart 2). Even Q1 may eventually show positive growth. Real Gross Domestic Income (GDI), which conceptually should equal GDP, rose by 1.8% in Q1. Chart 2After Further Revisions, It Is Possible That GDP Growth Ends Up Being Positive In Q2 2022
Shifting Into Neutral: A Q&A
Shifting Into Neutral: A Q&A
Second, every single US recession has seen an increase in the unemployment rate (Chart 3). So far, that has not happened, and there is good reason to think it will not happen for some time: There are 1.8 job openings per unemployed worker (Chart 4). For the foreseeable future, most people who lose their jobs will be able to walk across the street to find a new one. Chart 3Recessions And Spikes In The Unemployment Rate Go Hand-In-Hand
Recessions And Spikes In The Unemployment Rate Go Hand-In-Hand
Recessions And Spikes In The Unemployment Rate Go Hand-In-Hand
Chart 4A High Level Of Job Openings Creates A Moat Around The Labor Market
A High Level Of Job Openings Creates A Moat Around The Labor Market
A High Level Of Job Openings Creates A Moat Around The Labor Market
Chart 5Spending On Durable Goods Has Been Normalizing Without Derailing The Economy
Spending On Durable Goods Has Been Normalizing Without Derailing The Economy
Spending On Durable Goods Has Been Normalizing Without Derailing The Economy
Q: Aren’t other measures of economic activity such as the ISM, consumer confidence, and homebuilder sentiment all signaling that a major slowdown is in progress? A: They are but we should take them with a grain of salt. The composition of consumer spending is shifting from goods to services. This is weighing on manufacturing output. As Chart 5 shows, goods spending has already retraced two-thirds of its pandemic surge, with no ill effects on the labor market. Consumer confidence tends to closely track real wages (Chart 6). Despite an extraordinarily tight labor market, real wages have been shrinking all year. As supply-chain bottlenecks abate, inflation will fall, allowing real wages to rise. This will bolster consumer confidence and spending. Falling gasoline prices will also boost disposable incomes. Prices at the pump have fallen for seven straight weeks and the futures market is pointing to further declines in the months ahead (Chart 7). Chart 6Falling Inflation Will Boost Real Wages And Consumer Confidence
Falling Inflation Will Boost Real Wages And Consumer Confidence
Falling Inflation Will Boost Real Wages And Consumer Confidence
Chart 7The Futures Market Points To Further Declines In Gasoline Prices
The Futures Market Points To Further Declines In Gasoline Prices
The Futures Market Points To Further Declines In Gasoline Prices
It is also critical to remember that the Fed is trying to slow the economy by tightening monetary policy. At the start of the year, investors expected the Fed funds rate to be 0.9% in early 2023. Today, they expect it to be 3.4% (Chart 8). Chart 8Investors Are Pricing In A Much More Aggressive Tightening Cycle Than At The Start Of The Year
Investors Are Pricing In A Much More Aggressive Tightening Cycle Than At The Start Of The Year
Investors Are Pricing In A Much More Aggressive Tightening Cycle Than At The Start Of The Year
Chart 9Housing Activity Should Recover Now That Mortgage Rates Have Stabilized
Housing Activity Should Recover Now That Mortgage Rates Have Stabilized
Housing Activity Should Recover Now That Mortgage Rates Have Stabilized
Rising rate expectations curb aggregate demand. This temporarily leads to lower growth. However, once rate expectations stabilize – and demand resets to a lower level – growth will tend to return to trend. The 6-month mortgage yield impulse has already turned up. This suggests that housing and other interest-rate sensitive parts of the economy will begin to recover by the end of the year (Chart 9). Admittedly, if the unemployment rate rises in response to lower aggregate demand, this could set off a vicious circle where higher unemployment leads to less spending, leading to even higher unemployment. However, as noted above, given that the current starting point is one where labor demand already exceeds labor supply by a wide margin, the odds of a such a labor market doom loop are much lower than during past downturns. Q: Does the question of whether we officially enter a recession or not really matter that much? A: It is a matter of degree. As Chart 10 shows, macroeconomic factors are by far the most important determinant of equity returns over medium-term horizons of about 12 months. As a rule of thumb, bear markets almost always coincide with recessions (Chart 11). Chart 10Macro Forces Are An Important Driver Of Equity Returns On Cyclical Horizons
Macro Forces Are An Important Driver Of Equity Returns On Cyclical Horizons (I)
Macro Forces Are An Important Driver Of Equity Returns On Cyclical Horizons (I)
Chart 11Equity Bear Markets And Recessions Go Hand-In-Hand
Equity Bear Markets And Recessions Go Hand-In-Hand
Equity Bear Markets And Recessions Go Hand-In-Hand
Chart 12Soaring Energy Prices Have Boosted Earnings Estimates This Year
Soaring Energy Prices Have Boosted Earnings Estimates This Year
Soaring Energy Prices Have Boosted Earnings Estimates This Year
Q: Are you surprised that earnings estimates have not come down faster this year as economic risks have intensified? A: Most analysts have not baked in a recession in their forecasts, so from that perspective, if our baseline scenario of no recession does not pan out, earnings estimates will almost certainly come down (Chart 12). That said, the bar for major downward earnings revisions is quite high. This is partly because we think that if a recession does occur, it is likely to be a mild one. It is also because earnings are reported in nominal terms. In contrast to real GDP, nominal GDP grew by 6.6% in Q1 and 7.8% in Q2. Q: Let’s turn to interest rates. Why do you think the Fed will not cut rates next year as markets are discounting? A: It all boils down to the neutral rate of interest. In past reports, we made the case that the neutral rate in the US is higher than widely believed. The fact that job vacancies are so plentiful provides strong evidence in favor of our thesis. If the neutral rate were low, the labor market would not have overheated. But it did, implying that monetary policy must have been exceptionally accommodative. The good news for investors is that a high neutral rate implies that the Fed is unlikely to induce a recession by raising rates in accordance with its dot plot. That reduces the risk of a recession in the near term. The bad news is that a high neutral rate will essentially preclude the Fed from cutting rates next year. The economy will simply be too strong for that. Worse still, if the Fed is too slow in bringing rates to neutral, inflation – which is likely to fall over the coming months as supply-chain pressures ease – could reaccelerate at some point next year. That could force the Fed to start hiking rates again. Chart 13Real Yields Have Scope To Rise Further
Real Yields Have Scope To Rise Further
Real Yields Have Scope To Rise Further
Q: What is your estimate for the neutral rate in the US? A: In the past, we have written that the neutral rate in the US is around 3.5%-to-4%. However, I must admit, I’m not a big fan of this formulation. Real rates matter more for economic growth than nominal rates, and long-term rates matter more than short-term rates. Thus, a better question is what level of real long-term bond yields is consistent with stable inflation and full employment. Based on research we have published in the past, my best bet is that the neutral long-term real bond yield is between 1.5%-and-2%. That is substantially above the 10-year TIPS yield (0.27%) and the 30-year TIPS yield (0.79%) (Chart 13). Given that the yield curve is inverted, the Fed may have to raise policy rates well above 4% in order to drag up the long end of the curve. It is a bit like how oil traders say you need to lift spot crude prices in order to push up long-term futures prices when the oil curve is backwardated. Chart 14Investors Expect Inflation To Fall Rapidly Over The Next Few Years
Shifting Into Neutral: A Q&A
Shifting Into Neutral: A Q&A
Q: So presumably then, you would favor a short duration position in fixed-income portfolios? A: Yes, if the whole yield curve shifts higher, you will lose a lot less money in short-term bonds than in long-term bonds. Relatedly, we would overweight TIPS versus nominal bonds. The TIPS market is pricing in a very rapid decline in inflation over the next few years (Chart 14). The widely followed 5-year, 5-year forward TIPS inflation breakeven rate is trading at 2.28%, toward the bottom end of the Fed’s comfort zone of 2.3%-to-2.5%.1 Q: What about credit? A: US high-yield bonds are pricing in a default rate of 6.1% over the next 12 months. This is up from an expected default rate of 3.8% at the start of the year and is significantly higher than the trailing 12-month default rate of 1.4%. In a typical recession, high-yield default rates rise above 8% (Chart 15). Thus, spreads would probably increase if the US entered a recession. That said, it is important to keep in mind that many corporate borrowers took advantage of very low long-term yields over the past few years to extend the maturity of their debt. Only 7% of US high-yield debt, and less than 1% of investment-grade debt, held in corporate credit ETFs matures in less than two years. This suggests that the default cycle, if it were to occur, would be less intense and more elongated than previous ones. Chart 15High-Yield Bonds Are Pricing In Higher Default Rates
High-Yield Bonds Are Pricing In Higher Default Rates
High-Yield Bonds Are Pricing In Higher Default Rates
On balance, we recommend a modest overweight to high-yield bonds within fixed-income portfolios. Chart 16High Energy Prices Are Weighing On The European Economy
High Energy Prices Are Weighing On The European Economy
High Energy Prices Are Weighing On The European Economy
Q: Let’s turn to non-US markets. The dollar has strengthened a lot against the euro this year as the economic climate in Europe has soured. Can Europe avoid a recession? A: Probably not. European natural gas prices are back near record highs and business surveys increasingly point to recession (Chart 16). That said, the nature of Europe’s recession could turn out to be quite different from what many expect. There are a few useful parallels between the predicament Europe finds itself in now and what the global economy experienced early on during the pandemic. Just like the Novel coronavirus, as it was called back then, represented an external shock to the global economy, the partial cut-off in Russian energy flows represents an external shock to the European economy. Policymakers in advanced economies responded to the pandemic by showering their economies with various income-support measures. European governments will react similarly to the energy crunch. In fact, the political incentive to respond generously is even greater this time around because the last thing European leaders want is for Putin to succeed in his efforts to destabilize the region. For its part, the ECB will set an extremely low bar for buying Italian bonds and the debt of other vulnerable economies. Just like the world eventually deployed vaccines, Europe is taking steps to inoculate itself from its dangerous addiction to Russian energy. The official REPowerEU plan seeks to displace two-thirds of Russian natural gas imports by the end of the year. While some aspects of the plan are probably too optimistic, others may not be optimistic enough. For example, the plan does not envision increased energy production from coal-fired plants, which is something that even the German Green Party has now signed on to. The euro is trading near parity to the dollar because investors expect growth in the common-currency bloc to remain depressed for an extended period of time. If investors start to price in a more forceful recovery, the euro will rally. Q: China’s economy remains in the doldrums. Could that undermine your sanguine view on the global economy? A: China’s PMI data disappointed in July, as anxiety over the zero-Covid policy and a sagging property market continued to weigh on activity (Chart 17). We do not expect any change to the zero-Covid policy until the conclusion of the Twentieth Party Congress later this year. After that, the government is likely to ease restrictions, which will help to reignite growth. Chart 17The Zero-Covid Policy And Slumping Property Market Are Weighing On Chinese Economic Activity
The Zero-Covid Policy And Slumping Property Market Are Weighing On Chinese Economic Activity
The Zero-Covid Policy And Slumping Property Market Are Weighing On Chinese Economic Activity
Chart 18China Faces A Structural Decline In The Demand For Housing
China Faces A Structural Decline In The Demand For Housing
China Faces A Structural Decline In The Demand For Housing
The property market has probably entered a secular downturn (Chart 18). If a weakening property market were to cause a banking crisis, similar to what happened in the US and parts of Europe in 2008, this would destabilize the global economy. However, we doubt that this will happen given the control the government has over the banking system. In contrast, a soft landing for the Chinese real estate market might turn out to be a welcome development for the global economy, as less Chinese property investment would keep a lid on commodity prices, thus helping to ease inflationary pressures. Peter Berezin Chief Global Strategist peterb@bcaresearch.com Follow me on LinkedIn & Twitter Footnotes 1 The Federal Reserve targets an average inflation rate of 2% for the Personal Consumption Expenditures (PCE) index. The TIPS breakeven is based on the CPI index. Due to compositional differences between the two indices, CPI inflation has historically averaged 30-to-50 basis points higher than PCE inflation. This is why the Fed effectively targets a CPI inflation rate of 2.3%-to-2.5%. View Matrix
Image
Special Trade Recommendations Current MacroQuant Model Scores
Shifting Into Neutral: A Q&A
Shifting Into Neutral: A Q&A
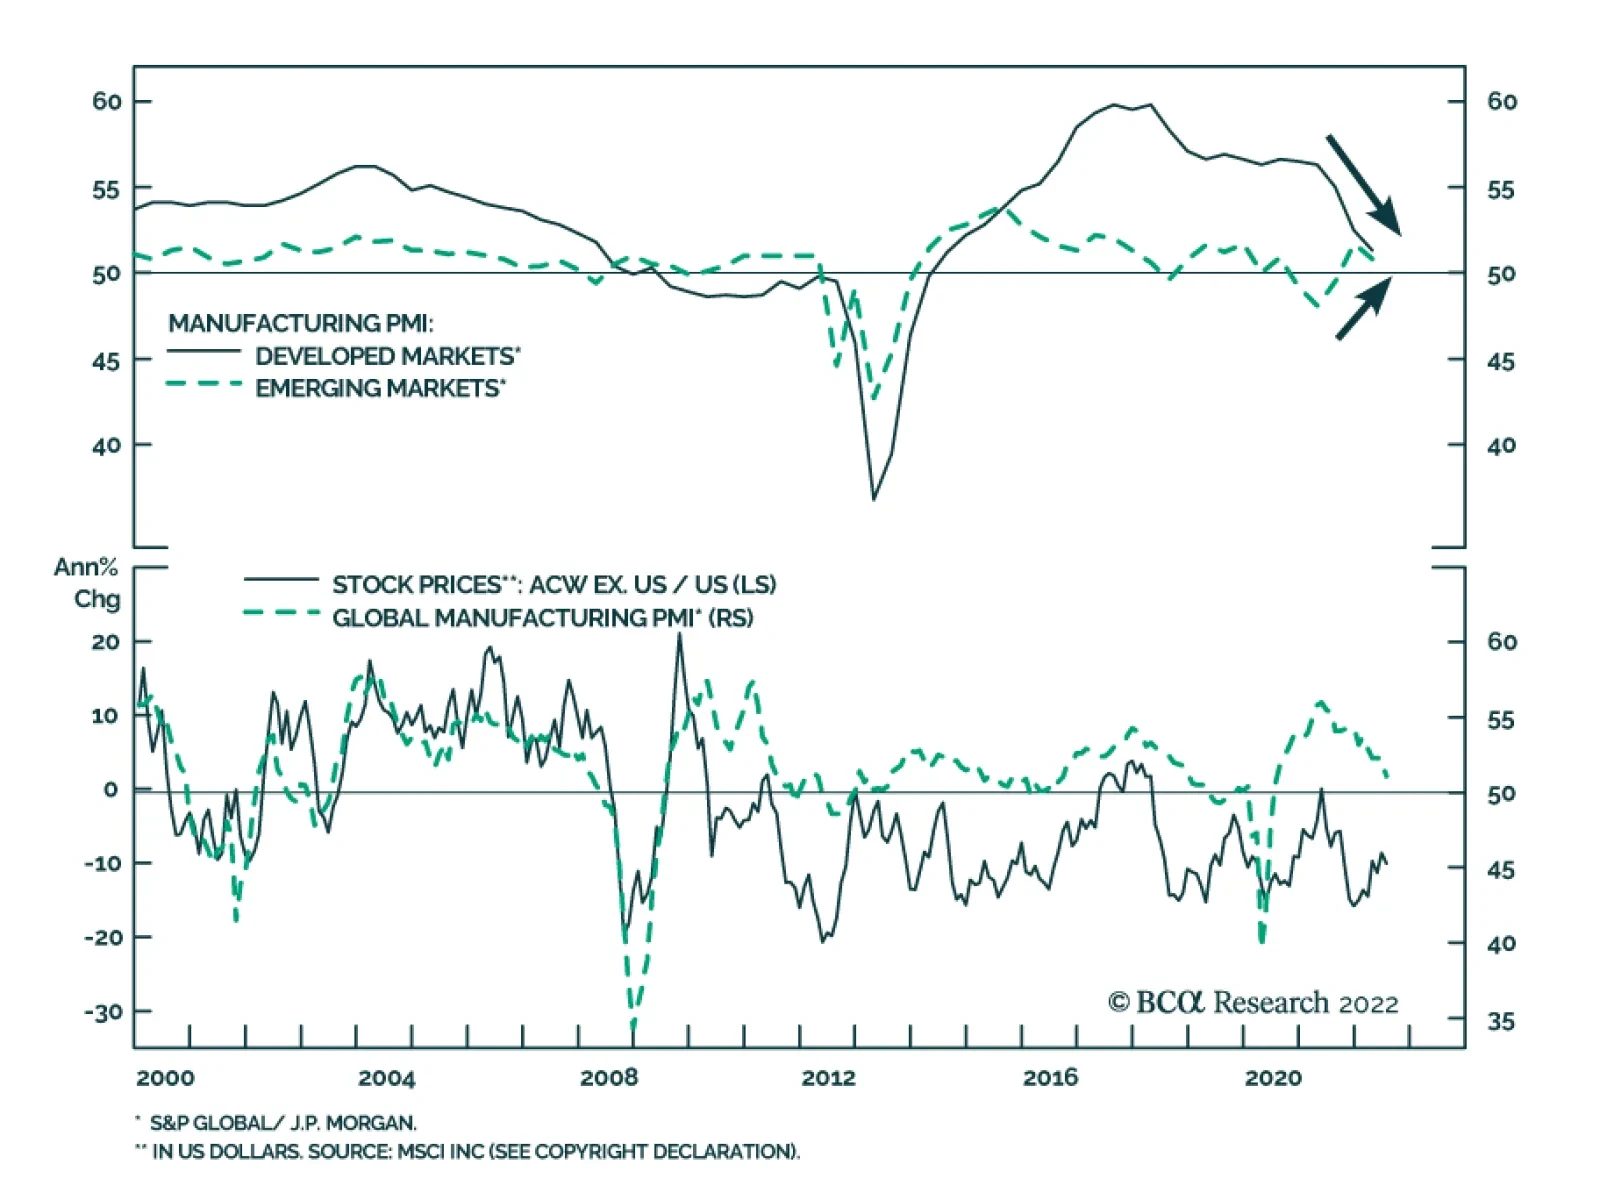
The Global Manufacturing PMI declined to a two-year low of 51.1 in July, from 52.2 in June indicating that global economic activity continues to lose momentum. Notably, manufacturing output stagnated in July, after having briefly returned to growth in June.…
Executive Summary Biden Can Take Risks Ahead Of Midterms
The Fourth Taiwan Strait Crisis
The Fourth Taiwan Strait Crisis
News reports suggest House Speaker Nancy Pelosi will travel to Taiwan and meet with Taiwanese President Tsai Ing-wen in the coming days. China has promised military counter-measures if she visits. Structural factors suggest US-China tensions over Taiwan could explode: China’s reversion to autocracy and hawkish foreign policy, Taiwan’s assertion of autonomy, and the US’s political instability and foreign policy reactiveness. Cyclical factors also suggest that tensions could escalate: China’s instability in the wake of Covid-19, the ramifications of Russia’s invasion of Ukraine, the budding Russo-Chinese alliance, the Biden administration’s domestic political vulnerability, and the Xi administration’s domestic political vulnerability. In particular, Xi cannot back down. A diplomatic crisis or military showdown is likely in the short run but not yet a full-scale war. Taiwan is harder to invade than Ukraine, the US is not attempting a radical boost to Taiwan’s military, Taiwan is not moving toward formal independence, and the Chinese economy is not yet collapsing beyond all hope. However, over the long run we fear that a Taiwan war is more likely than not. Tactically investors should prefer government bonds to equities, US equities to global, defensive sectors to cyclicals, and safe havens to risky assets. Investors should short Chinese and Taiwanese currencies and assets. Tactical Recommendation Inception Date Return LONG US SEMICONDUCTOR & SEMI EQUIPMENT / TAIWAN EQUITIES 2022-06-23 14.6% LONG KOREA/ SHORT TAIWAN EQUITIES 2020-03-27 -23.5% Bottom Line: Tactically investors should buy safe-haven assets and await a resolution of the US-China confrontation over Taiwan, which could cause a dramatic escalation in strategic tensions. Feature A fourth Taiwan Strait crisis is likely upon us. Speaker of the US House of Representatives Nancy Pelosi will visit Taiwan during her travel around Asia Pacific this week, according to the Wall Street Journal on August 1. Chinese President Xi Jinping warned US President Joe Biden in a phone conversation on July 28 that “those who play with fire will eventually get burned,” referring specifically to US relations with Taiwan. Chinese foreign ministry officials have threatened “forceful” countermeasures if Pelosi visits the island, explicitly saying that the People’s Liberation Army would respond in some way. There is still some uncertainty over whether Pelosi will go. She delayed the trip in April. Rumors emerged over July that she would resume but President Joe Biden suggested on July 20 that US military officials opposed the trip, believed the timing to be inappropriate. Taiwan was not mentioned in Pelosi’s official itinerary published on July 31, which includes Singapore, Japan, South Korea, and Malaysia. But the Wall Street Journal report has been corroborated by US and Taiwanese officials. Assuming Pelosi goes, China will respond with some military show of force. The US may pretend that one hand (the White House, the Department of Defense) does not know what the other hand is doing (the House of Representatives). But China will not be convinced. There are three major reasons that we have predicted a fourth Taiwan Strait crisis: 1. China’s reversion to autocracy and foreign policy hawkishness: After the Great Recession, China was forced into a painful downshift in potential economic growth, stemming from a contracting labor force, excessive debt, and changes in the international economy (Chart 1). As economic growth has slowed, China has pursued political centralization, economic mercantilism, military modernization, and foreign policy assertiveness, offering nationalism as a distraction from the disappointments of the new middle class. While China may not be ready to launch a full-scale invasion of Taiwan, it is willing to do so if the Communist Party regime’s survival is at stake. Chart 1China's Slowdown Leads To Hawkishness
China's Slowdown Leads To Hawkishness
China's Slowdown Leads To Hawkishness
2. Taiwan’s reassertion of autonomy: Taiwanese people began to sour on mainland China with the Great Recession and increasingly developed an independent identity (Chart 2). China’s growing economic influence, combined with Xi Jinping’s re-centralization of power across Greater China, provoked a backlash in Taiwan beginning in 2013 that culminated in the nominally pro-independence Democratic Progressive Party gaining full control of the island in 2016. The US-China trade war, China’s imposition of control over critical buffer spaces (including the South China Sea and Hong Kong), and US export controls on advanced technologies thrust Taiwan into the middle of a strategic confrontation. While Taiwan is not seeking war or formal political independence, it is seeking closer ties with the US and democratic allies to protect against Beijing’s encroachment. 3. US political instability and foreign policy reaction: The Great Recession brought the US’s latent political instability from a simmer to a boil. The Washington establishment withdrew from the war on terrorism only to face discontent at home and strategic competition from China and Russia. China intensified its acquisition of US technology while North Korea obtained a nuclear arsenal under China’s watch. A surge in populism led the US to initiate a trade war against China and to impose restrictions on critical technologies to slow China’s modernization. While the US political factions bickered over domestic policy, they both tapped into a popular consensus on economic nationalism and hawkishness toward China (Chart 3). While the US is struggling to curb Russia and Iran, its greatest long-term challenge stems from China and it is increasingly focused on containing China’s economy and strategic ambitions. Chart 2Taiwanese Souring On China
The Fourth Taiwan Strait Crisis
The Fourth Taiwan Strait Crisis
Chart 3US Hawkish Consensus On China
The Fourth Taiwan Strait Crisis
The Fourth Taiwan Strait Crisis
In addition, there are important cyclical reasons why investors should take very seriously the risk of a major geopolitical crisis emanating from Taiwan in the short run: The Covid-19 pandemic intensified US (and global) distrust of China and accelerated the divorce of the US and Chinese economies. It also threw the Chinese economy into a downward spin, threatening Xi Jinping’s personal security and the Communist Party’s regime security. Hypo-globalization reduces critical economic constraints on military conflict. The Ukraine war highlighted the willingness of ambitious strongman regimes to go to war to prevent neighboring countries from allying with the United States. Taiwan is critical to Chinese security just as Ukraine is critical to Russian. Taiwan, like Ukraine, lacks a mutual defense treaty with the US and yet is attempting to create a de facto treaty through political, economic, and military cooperation – a scenario that will incentivize Chinese military action if it ever believes the US will take irrevocable steps to increase its commitment to defend Taiwan. At the same time, the US will try to deter China more effectively, since its deterrence failed in the case of Ukraine, which entails upgrading the Taiwanese relationship. Hence China will feel threatened and accuse the US of altering the status quo. Russo-Chinese alliance prevents US-China reengagement. Russia threw itself into China’s arms by cutting off natural gas to Europe. China cannot reject Russia’s overture because it needs Russia’s alliance to break through American strategic containment in the coming years. China needs Russia’s natural resources and its cooperation in gaining economic access to Central Asia and the Middle East. The US cannot pursue strategic détente with China if China is allying with Russia, since a Russo-Chinese alliance poses an unprecedented threat to American global influence and security (Chart 4). The Democratic Party is desperate to mitigate looming election losses. President Biden’s approval rating has fallen to 39%, while headline inflation hits 9% and the economy slips into a technical recession. The Republican Party is lined up for a victory in the midterm elections, yet Democrats view the populist Republicans as an existential threat. Hence Biden and Democratic leaders like Pelosi are willing to take significant risks to salvage the election, including provoking foreign rivals. The administration is contemplating tougher export controls on China’s access to semiconductor manufacturing equipment and Congress is passing bipartisan legislation to make the US more competitive against China. Any major confrontation abroad would generate a patriotic rally among voters, as did the Cuban Missile Crisis in 1962, which saved the Democrats from heavy losses in the midterms that year (Chart 5). China’s domestic politics support a foreign confrontation. As Xi attempts to cement another five-to-ten years in power at the twentieth national party congress this fall, the pandemic restrictions, political repression, property bust, and economic slowdown ensure that he has little good news to celebrate at home. He could benefit from taking an aggressive stance against the imperialist Americans over Taiwan – and he cannot afford to back down or lose face. Ultimately China’s regime legitimacy is at stake in Taiwan so it is willing to take greater risks than the United States. Chart 4US Cannot Engage With Russo-Chinese Behemoth
US Cannot Engage With Russo-Chinese Behemoth
US Cannot Engage With Russo-Chinese Behemoth
Chart 5Biden Can Take Risks Ahead Of Midterms
The Fourth Taiwan Strait Crisis
The Fourth Taiwan Strait Crisis
All of the above demonstrates that investors should not be complacent but should take risk off the table until the Pelosi trip blows over. A major diplomatic or geopolitical crisis will occur if Pelosi indeed visits Taiwan, for China will be required to react to uphold the credibility of its warnings, and Beijing will have a national and political interest in overreacting rather than underreacting. The Americans will then have a national and political interest in preserving their own credibility. This dynamic could lead to a major escalation in strategic tensions. Could a crisis lead to full-scale war? Yes it could but most likely it will not – at least not yet. Here are some important limitations, which investors should monitor closely. If these are reduced or overcome, then a larger conflict becomes more probable: Taiwan is harder to invade than Ukraine. Taiwan is an island and islands that are politically unified can only be subdued with enormous cost of blood and treasure even by the most powerful armies. Taiwan is critical to the global economy, unlike Ukraine. While it lacks defense treaties, it has stronger strategic partnerships than Ukraine did. The Chinese military has not fought an expeditionary war since Vietnam in 1979. The US sent aircraft carriers to the Taiwan Strait in each of the previous three crises since the 1950s, signaling that it is willing to defend Taiwan, and currently has at least two aircraft carriers in Asia Pacific (Map 1). China needs to be prepared for potential American and Japanese intervention if it is to attack Taiwan, which requires an advanced triad of nuclear arms. Map 1US Aircraft Carriers Suggest Taiwan Risk Is Substantial
The Fourth Taiwan Strait Crisis
The Fourth Taiwan Strait Crisis
The US is not sending any game-changing offensive weapon systems. Instead the US is sending a mere politician. China opposes anything resembling state-to-state relations but Taiwan’s defensive capability would not be improved. Hence China would not be forced to take aggressive military action. Instead China is attempting to set a very low bar for intervening in US-Taiwan political relations. Beijing can intervene in a way that enforces the new line but remains beneath the threshold of war. Going forward, US arms sales to Taiwan will be a much riskier affair and the delivery of a weapons system could trigger conflict (Chart 6). Chinese economy is not (yet) beyond help. China still has authoritarian powers to manipulate the domestic economy, suggesting that policy makers will intervene to slow down the property bust and stimulate activity. After Xi Jinping consolidates power, we expect a pro-growth strategy to be unveiled that will lead to a stabilization of growth in 2023. This is necessary for Xi to maintain domestic stability, which is existential to the regime and its long-term security. If stimulus and interventions fail utterly and China collapses into a full-blown financial crisis, then China will lose the ability to improve its security over the long run and the risk of conflict with foreign powers will rise. But as long as China’s economy is not collapsing, China maintains the prospect of building its influence and power over time and conquering Taiwan through absorption rather than extremely risky armed conflict (Chart 7). Chart 6US Arms Sales Could Trigger A Real Conflict
US Arms Sales Could Trigger A Real Conflict
US Arms Sales Could Trigger A Real Conflict
Chart 7More Economic Stimulus Is Coming
More Economic Stimulus Is Coming
More Economic Stimulus Is Coming
Taiwan is not moving toward formal independence. The Tsai Ing-wen administration is nominally in favor of independence but has chosen rhetorical sleight of hand over any formal change to Taiwan’s status. Taiwanese people support the status quo knowing that they will live in a war zone if they declare independence. The long-term problem stems from the fact that a clear majority opposes unification with the mainland (Chart 8). Taiwan and the US face elections in 2022 and 2024. If the Kuomintang stages a comeback in Taiwanese politics, or the Democrats win reelection in 2024, then China still has the ability to pursue its aims through diplomacy. Whereas if the Democratic Progressive Party remains in full control of Taiwan, and the Republicans regain the White House, Beijing may conclude that little can be gained through diplomacy. Especially if these US and Taiwanese parties proceed to press their interests aggressively. Chart 8Taiwanese Not Declaring Independence
The Fourth Taiwan Strait Crisis
The Fourth Taiwan Strait Crisis
Hence the most likely outcome if Pelosi visits Taiwan is a US-China geopolitical crisis of some sort but not a full-scale war. A crisis short of war could establish a new set of red lines over Taiwan that could govern the US-China relationship in the medium term with reduced uncertainty. But it would bring very bad news in the short run and lead to a permanent deterioration in US-China relations and global stability over the long run, which markets must price first. Bottom Line: Tactically investors should prefer government bonds to equities, US equities to global, defensive sectors to cyclicals, and safe havens to risky assets. Stay short Chinese and Taiwanese currencies and assets. While semiconductor stocks stand at risk, investors should favor US semiconductor companies over Chinese and Taiwanese (Chart 9). Chart 9Investors Should Seek Safe Havens
Investors Should Seek Safe Havens
Investors Should Seek Safe Havens
Matt Gertken Chief Geopolitical Strategist mattg@bcaresearch.com Strategic Themes Open Tactical Positions (0-6 Months) Open Cyclical Recommendations (6-18 Months) Regional Geopolitical Risk Matrix
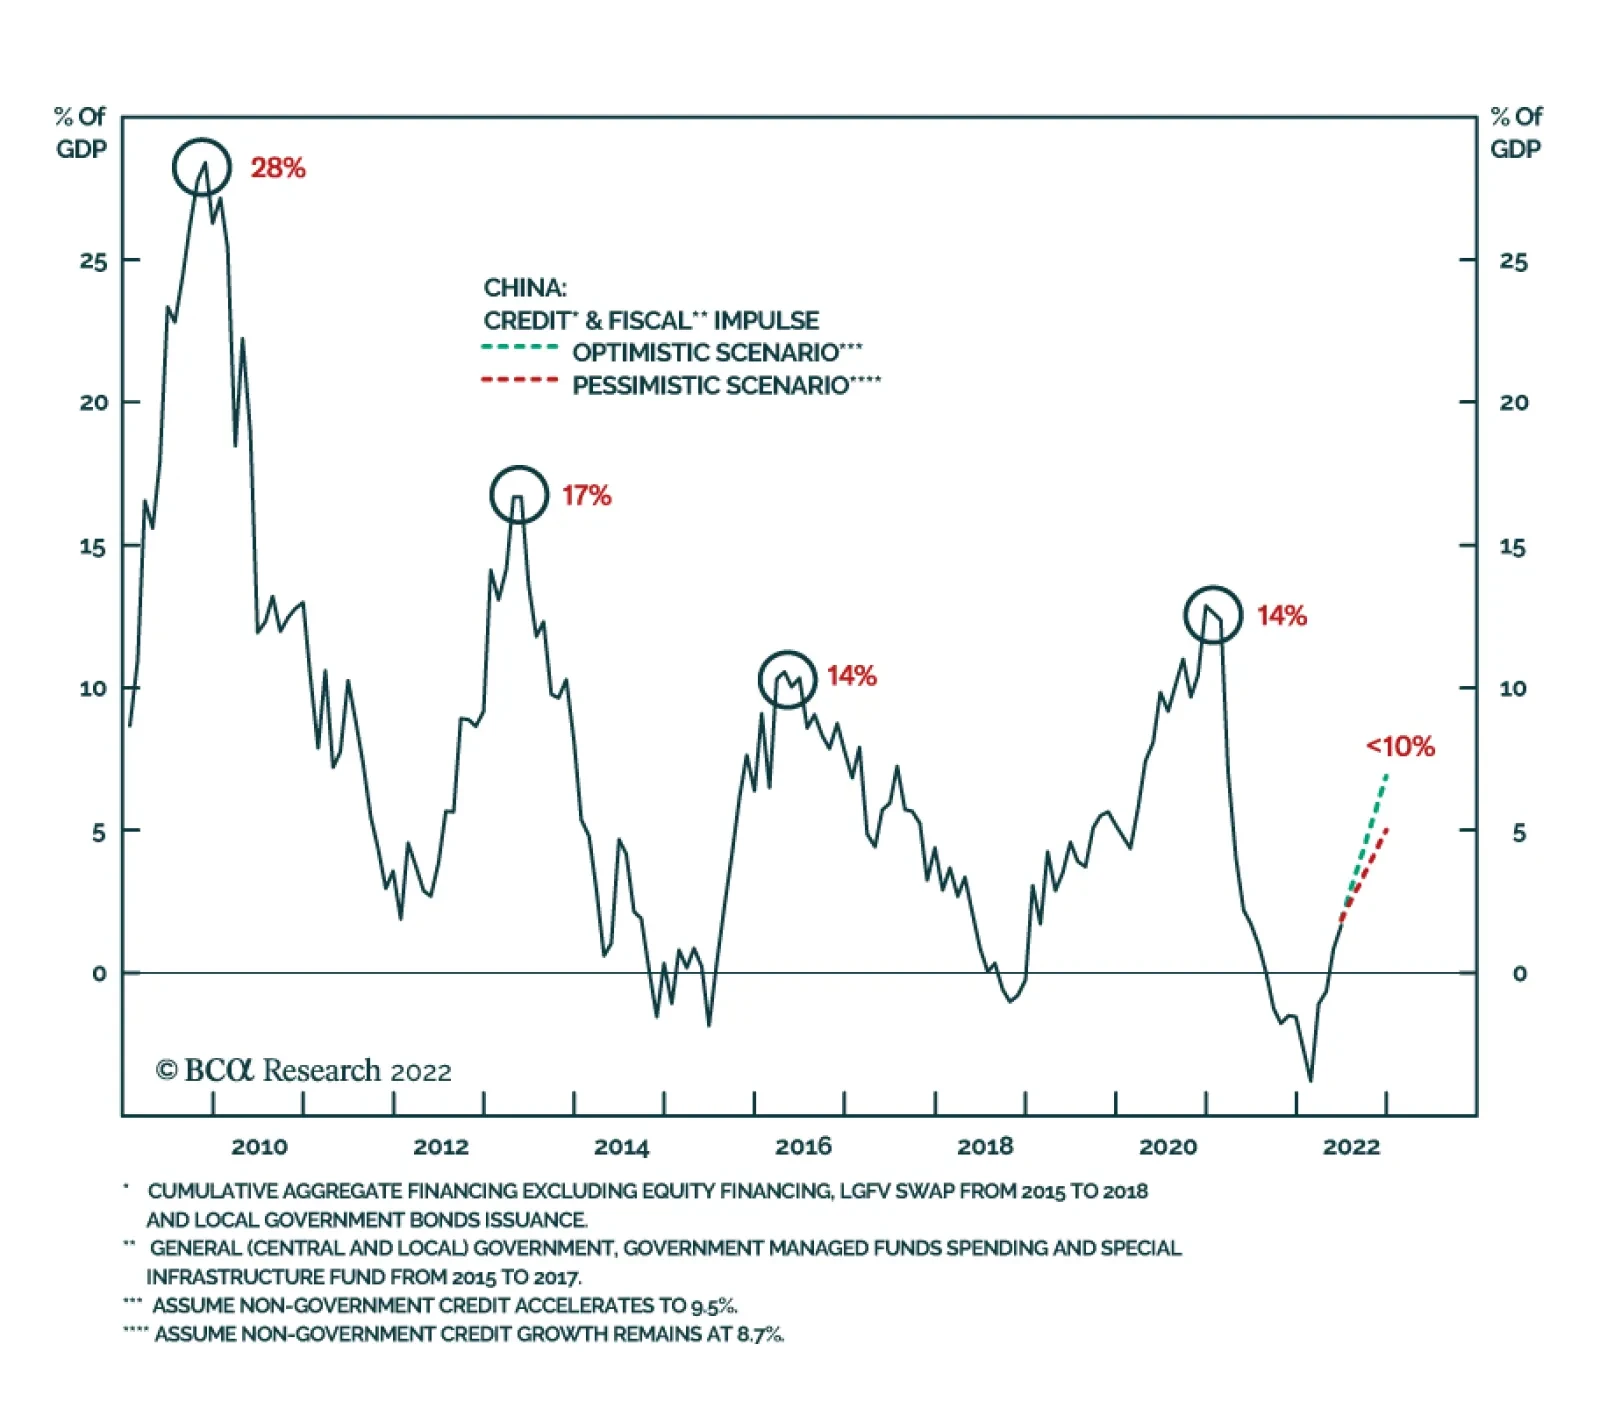
The Politburo, China’s top decision-making body, held its quarterly meeting on Thursday to assess the country’s economic performance and set the priorities for the remainder of the year. Notably, the meeting follows the recent disappointing GDP print which…