China

Executive Summary Liquidity Will Shrink Further In Hong Kong
Liquidity Will Shrink Further In Hong Kong
Liquidity Will Shrink Further In Hong Kong
The HKD is facing its most critical test in several decades. While the peg is likely to survive (Feature Chart), the economic costs for Hong Kong SAR will be far reaching. Critically, monetary policy in Hong Kong SAR is being tailored behind a hawkish Fed, while economic ties with China increasingly warrant easier policy settings. This tug of war will be resolved via a reset in domestic spending and asset prices. Equity shares have been the first shoe to drop. Real estate values and consumer spending will be next. A hypothetical delinking of the peg will see the HKD depreciate since it is expensive on a real effective exchange rate basis. Longer term, the rising use of the RMB in Hong Kong SAR will render the peg a relic. It will also fit with China’s aims to internationalize the RMB. Bottom Line: The HKD peg is likely to survive in the near term, but the economic repercussions from maintaining the linked exchange-rate system will trigger a rethinking by the Hong Kong Monetary Authority (HKMA) and mainland authorities. Eventually, HKD could be replaced by the CNY. For now, HKD interest rates are slated to rise further, which will have ramifications for domestic spending and asset prices. Feature Chart 1HKD Has Been Tracking Interest Rates
HKD Has Been Tracking Interest Rates
HKD Has Been Tracking Interest Rates
The Hong Kong dollar (HKD) has been trading on the weak side of its convertibility band since May. In theory, this suggests there is intense pressure for the peg to be delinked, which should lead to a much weaker exchange rate. In practice, interest rates in Hong Kong have failed to keep up with the surge in US rates, which has led to widening interest rate differentials between Hong Kong and the US. As a result, investors have embarked on a massive carry trade, funding USD purchases with HKDs (Chart 1). HKD’s weakness has raised questions about whether the exchange rate could face a crisis of confidence. This will be a severe blow to the HKMA whose sole role is currency stability, with the HKD being the underlying bedrock of Hong Kong’s financial system. In this report, we suggest that the HKD will survive this crisis, just as it has navigated previous shocks since 1983. The brunt of the adjustment will be domestic, first from Hong Kong equities, but spreading to real estate and consumer spending. Longer term, the HKD might become a relic as transactions in Hong Kong are increasingly conducted in RMB. Will The Peg Be Sustained? Historically, currency pegs more often than not fail. Specific to the HKD, the peg is facing its most critical test in decades but is likely to survive for a few reasons. First, every HKD that the region of Hong Kong has ever printed is backed by USD reserves, to the tune of 1.8 times. Quite simply, FX reserves are much higher than the Hong Kong monetary base (Chart 2). This suggests the HKMA’s “convertibility promise” remains credible. Second, Hong Kong also ranks favorably when looking at the ratio of broad money supply to FX reserves. Every 42.3 cents of broad money creation can be backed by foreign currency, a ratio much higher than China and on par with Singapore (Chart 3). With a monetary base fully backed by FX reserves and a broad money-to-FX reserve ratio largely in line with other linked exchange rate systems, our bias is that the peg will remain in place at least over a cyclical horizon (12-18 months). Chart 2In Theory, The HKMA Can Defend The Peg
In Theory, The HKMA Can Defend The Peg
In Theory, The HKMA Can Defend The Peg
Chart 3The HKMA Ranks Favorably To The PBoC
The HKMA Ranks Favorably To The PBoC
The HKMA Ranks Favorably To The PBoC
This credibility will come at a huge cost to the domestic economy, however. By having a fixed exchange rate system and an open capital account, Hong Kong has given up control over domestic monetary policy. Consequently, it must import monetary policy from the US. As interest rates rise in the US, demand for US dollar deposits from Hong Kong concerns goes up, putting downward pressure on the exchange rate. To maintain the convertibility ratio, the HKMA must drain the system of Hong Kong dollars to lift domestic interest rates. This is quite visible not only from the drop in foreign exchange reserves, but also the drawdown in the aggregate balance of domestic banks parked at the HKMA (Chart 4). From May 11 through August, the HKMA has absorbed a total of HKD 213 billion, shrinking the aggregate balance in the banking system by more than 60%. Chart 4Liquidity Will Shrink Further In Hong Kong
Liquidity Will Shrink Further In Hong Kong
Liquidity Will Shrink Further In Hong Kong
Historically, the aggregate balance has had to drop much more to restore an equilibrium between interest rates in the US and Hong Kong SAR. The implication is that liquidity will continue to be drained from the system to ultimately defend the peg, and local interest rates will rise. There is one important caveat: Hong Kong SAR’s net international investment position stands at 580% of GDP, much higher than broad money supply. As such, the Hong Kong SAR does not have a solvency problem. What it faces is too much domestic liquidity, which is pushing HKD interest rates lower (Chart 5). Chart 5The HKD Is Facing A Liquidity, Rather Than A Solvency Crisis
The Future Of The Hong Kong Dollar Peg
The Future Of The Hong Kong Dollar Peg
Ramifications Of The USD Peg When the HKD was tied to the US dollar in 1983, it made economic sense. Hong Kong SAR’s economy was more linked via trade to the US, compared to China (Chart 6). As such, stability vis-à-vis the US dollar was a vital appeal for traders, financiers, and all industries tied to the Hong Kong hub. Since then, there has been a tectonic shift in economic dependence. Exports to China now account for almost 60% of the total, while those to the US have fallen well below 8%. Quite simply, Hong Kong SAR still imports monetary policy from the US, while it is increasingly dependent on the Chinese economy. Nonetheless, there have been a few adjustments. The use of the RMB in Hong Kong SAR has been gradually gaining momentum. RMB deposits have risen to over HKD 800bn. As a share of narrow money supply (M1), it is almost 50% (Chart 7). There are also over 140 licensed banks in Hong Kong allowed to engage in RMB-based business. Chart 6Hong Kong And China Are Tied To The Hip
Hong Kong And China Are Tied To The Hip
Hong Kong And China Are Tied To The Hip
Chart 7Hong Kong Is Transitioning Into A Defacto RMB System
Hong Kong Is Transitioning Into A Defacto RMB System
Hong Kong Is Transitioning Into A Defacto RMB System
These links extend beyond just banking turnover. First introduced in 2014, the southbound trading links between China and Hong Kong SAR have become a major conduit for mainland investors to gain exposure to foreign firms. The China-Hong Kong stock connect has now handled over 2.6tn RMB in cumulative flows. This represented as high as 40% of the equity turnover in Hong Kong SAR (Chart 8). Capital account transactions have also been progressively relaxed, and the issuance of RMB bonds has been rising rapidly since 2008. Chart 8Lots Of Financial Links Between The HKD and RMB
Lots Of Financial Links Between The HKD and RMB
Lots Of Financial Links Between The HKD and RMB
Hong Kong SAR’s strengthening ties with China comes with some good news. The increase in Chinese domestic liquidity is lowering the cost of capital for local enterprises. At the same time, it might also be fuelling very low domestic interest rates, forcing locals to chase higher rates elsewhere. This does not affect the peg if people sell the RMB to buy other currencies, including the dollar or maybe even the HKD. The bad news is that Hong Kong has now become a high-beta play on China as both economies are inexorably interlinked. Chart 9 shows that consumers in Hong Kong SAR tend to have much more volatile spending patterns compared to China, especially when economic growth is about to slow. One reason is that Hong Kong concerns are highly levered notably to the property market (Chart 10). For example, the debt service ratio in Hong Kong SAR sits at 32% of disposable income, much higher than China or other indebted economies (Chart 11). This makes the economy very vulnerable to rising interest rates. Chart 9Hong Kong Is Economically More Volatile Than China
Hong Kong Is Economically More Volatile Than China
Hong Kong Is Economically More Volatile Than China
Chart 10Hong Kong Cannot Escape A Hard Landing (Part 1)
Property Prices In Hong Kong Will Drop
Property Prices In Hong Kong Will Drop
Chart 11Hong Kong Cannot Escape A Hard Landing (Part 2)
Hong Kong Cannot Escape A Hard Landing (Part 2)
Hong Kong Cannot Escape A Hard Landing (Part 2)
The bottom line is that as the HKMA withdraws domestic liquidity, this will reassert downward pressure on business activity and asset prices, particularly real estate. With private consumption a whopping 65% of GDP, household deleveraging will also prove to be a formidable headwind for domestic spending. Outside interest rates, Hong Kong SAR remains a trade hub. If global trade slows down meaningfully, this will lead to a deterioration in the current account. This triple whammy from slowing global trade, rising interest rates and consumer deleveraging could prove indigestible for Hong Kong assets. Policy Options Chart 12The Government Could Bail Out Hong Kong
The Government Could Bail Out Hong Kong
The Government Could Bail Out Hong Kong
As highlighted above, the HKD peg will remain in place for the foreseeable future, but this will come at a huge cost. The advantage of the HKD peg is that the choice of the nominal anchor, the US dollar, renders it credible. As a financial hub, this is crucial for Hong Kong. Meanwhile, such an anchor also imposes fiscal discipline since government deficits cannot be monetized by money printing. In the case where the government tries to be profligate, the rise in inflation will lower real rates and lead to capital outflows. This will force the HKMA to sell US dollars and absorb local currency. Indeed, over the past several years, government debt in Hong Kong has been close to nil (Chart 12). The drawback of a fixed exchange-rate regime is that Hong Kong SAR has relinquished control over independent monetary policy. Such a union was justified when the economic cycles between the US and Hong Kong SAR were in sync, but now the region needs easier policy settings. The roadmap of the late 1990s could be what is in store for Hong Kong SAR. In short, the peg survived but the region went through a severe internal devaluation. During the Asian crisis, property prices fell by more than 60%. If that were to occur today, it would herald a prolonged period of high unemployment and stagnant wages to realign the region’s competitiveness with its trading partners. Hong Kong SAR stocks have already borne the brunt of an internal adjustment and are trading at very cheap multiples (Chart 13). The MSCI Hong Kong stock index is composed of mostly financials (47% of market cap) and property stocks (21% of market cap). As HKD rates are rising, loan growth in Hong Kong SAR is contracting and net interest margins have collapsed (Chart 14). This does not bode well for the near-term performance of financials. Chart 13Markets Have Already Discounted A Pessimistic Scenario For Hong Kong Shares
Markets Have Already Discounted A Pessimistic Scenario For Hong Kong Shares
Markets Have Already Discounted A Pessimistic Scenario For Hong Kong Shares
Chart 14Banks In Hong Kong Are Facing A Tough ##br##Reckoning
Banks In Hong Kong Are Facing A Tough Reckoning
Banks In Hong Kong Are Facing A Tough Reckoning
The good news is that similar to the late 1990s, banks are unlikely to go bust. Hong Kong SAR banks are well capitalized and delinquency rates are quite low, suggesting a banking crisis is unlikely to be a source of pain for the HKD peg (Chart 15). In fact, Hong Kong SAR banks rank favorably among their global peers in terms of capital adequacy (Chart 16). Chart 15Banks In Hong Kong Are Well Capitalized (Part 1)
Banks In Hong Kong Are Well Capitalized (Part 1)
Banks In Hong Kong Are Well Capitalized (Part 1)
Chart 16Banks In Hong Kong Are Well Capitalized (Part 2)
The Future Of The Hong Kong Dollar Peg
The Future Of The Hong Kong Dollar Peg
Specific to the currency, Hong Kong is also running recurring current account surpluses. This is boosting its FX reserves (Chart 17). That lends credibility to the peg in the near term. The bad news is that as the domestic economy slows down, and global trade comes close to a standstill, these surpluses could evaporate. One cost to Hong Kong is that the peg to the US dollar has made HKD incrementally expensive. Our model shows that the real effective exchange for HKD is about 2.5 standard deviations above fair value (Chart 18). Our view on the US dollar is that we could see depreciation over a 12-to-18-month horizon, but an overshoot in the near term is quite likely. A drop in the US dollar will help realign competitiveness in the HKD. Meantime, the market has also been pushing the currency towards the weaker side of its convertibility band. Chart 17Balance Of Payments Remain Favorable For The HKD
Balance Of Payments Remain Favorable For The HKD
Balance Of Payments Remain Favorable For The HKD
Chart 18The HKD Is Expensive
The HKD Is Expensive
The HKD Is Expensive
Longer term, as Hong Kong SAR continues to become more entwined with China, a peg to the CNY will make sense. This process will be the initial step in the region’s official embrace of the RMB system. That said, the process will be gradual since the US dollar remains very much a reserve currency, and the relevance of Hong Kong SAR as a financial center hinges upon easy access to the USD. What is more likely is that any re-pegging to the RMB will come many years down the road, when the yuan has become a fully convertible currency. The de-pegging of the HKD from the USD or adjusting the peg is as much a political discussion as an economic one. Political conditions for this change are not yet present given such a change will have major ramifications for the economy of Hong Kong SAR and will likely also reverberate through financial asset prices. One can imagine a scenario where HKD yields are forced to adjust to a new nominal anchor. Investors have been convinced through almost 30 years of history to treat the HKD as a proxy for the US dollar. That said, the economic pain associated with maintaining the HKD-USD peg will ensure authorities accelerate the use of RMBs in Hong Kong, with a goal of eventually adopting the yuan as the de facto currency. Adopting a currency board akin to Singapore is another option that makes sense, especially since this would give the HKMA scope to link to cheaper currencies, such as the yen and euro. That said, this is unlikely to be politically palatable, especially for Beijing. A link to the yuan that already does this job makes sense. Finally, there is always the option to fully float the peg, but this would probably increase currency volatility. This is unlikely in the near term. The Goldilocks scenario for policymakers is when the US dollar eventually depreciates against major currencies, easing financial conditions for Hong Kong SAR concerns. This will dovetail nicely with the goals of the monetary authorities, maintain credibility while easing financial concerns for a very levered economy. Investment Conclusions The HKD peg will remain in place, but the financial dislocations will lead to significant internal devaluation in Hong Kong SAR. As US interest rates rise, the HKD will be under considerable pressure. The HKMA will have no choice but to allow HKD interest rates to rise. This will tip the property market and thrust the economy into deflation and a recession. Chinese bonds are the best hedge against this risk. Avoid property and financial shares for the time being. Were the peg to break today, the HKD will depreciate according to our valuation models. This suggests markets are right to push the HKD-linked rate towards the weaker end of the convertibility band. Despite the economic and financial pain, the HKMA will not abandon the peg. That means carry trades will continue to make money. Using the HKD as a funding currency still makes sense in the near term. In long run, the economic pain associated with maintaining the HKD-USD peg will make authorities in Beijing accelerate the use of the RMB in Hong Kong’s special administrative region. The eventual goal will be for Hong Kong SAR to adopt the yuan as its currency. Chester Ntonifor Foreign Exchange Strategist chestern@bcaresearch.com Qingyun Xu, CFA Associate Editor qingyunx@bcaresearch.com Trades & Forecasts Strategic View Cyclical Holdings (6-18 months) Tactical Holdings (0-6 months) Limit Orders Forecast Summary
Executive Summary Liquidity Will Shrink Further In Hong Kong
Liquidity Will Shrink Further In Hong Kong
Liquidity Will Shrink Further In Hong Kong
The HKD is facing its most critical test in several decades. While the peg is likely to survive (Feature Chart), the economic costs for Hong Kong SAR will be far reaching. Critically, monetary policy in Hong Kong SAR is being tailored behind a hawkish Fed, while economic ties with China increasingly warrant easier policy settings. This tug of war will be resolved via a reset in domestic spending and asset prices. Equity shares have been the first shoe to drop. Real estate values and consumer spending will be next. A hypothetical delinking of the peg will see the HKD depreciate since it is expensive on a real effective exchange rate basis. Longer term, the rising use of the RMB in Hong Kong SAR will render the peg a relic. It will also fit with China’s aims to internationalize the RMB.. Bottom Line: The HKD peg is likely to survive in the near term, but the economic repercussions from maintaining the linked exchange-rate system will trigger a rethinking by the Hong Kong Monetary Authority (HKMA) and mainland authorities. Eventually, HKD could be replaced by the CNY. For now, HKD interest rates are slated to rise further, which will have ramifications for domestic spending and asset prices. Feature Chart 1HKD Has Been Tracking Interest Rates
HKD Has Been Tracking Interest Rates
HKD Has Been Tracking Interest Rates
The Hong Kong dollar (HKD) has been trading on the weak side of its convertibility band since May. In theory, this suggests there is intense pressure for the peg to be delinked, which should lead to a much weaker exchange rate. In practice, interest rates in Hong Kong have failed to keep up with the surge in US rates, which has led to widening interest rate differentials between Hong Kong and the US. As a result, investors have embarked on a massive carry trade, funding USD purchases with HKDs (Chart 1). HKD’s weakness has raised questions about whether the exchange rate could face a crisis of confidence. This will be a severe blow to the HKMA whose sole role is currency stability, with the HKD being the underlying bedrock of Hong Kong’s financial system. In this report, we suggest that the HKD will survive this crisis, just as it has navigated previous shocks since 1983. The brunt of the adjustment will be domestic, first from Hong Kong equities, but spreading to real estate and consumer spending. Longer term, the HKD might become a relic as transactions in Hong Kong are increasingly conducted in RMB. Will The Peg Be Sustained? Historically, currency pegs more often than not fail. Specific to the HKD, the peg is facing its most critical test in decades but is likely to survive for a few reasons. First, every HKD that the region of Hong Kong has ever printed is backed by USD reserves, to the tune of 1.8 times. Quite simply, FX reserves are much higher than the Hong Kong monetary base (Chart 2). This suggests the HKMA’s “convertibility promise” remains credible. Second, Hong Kong also ranks favorably when looking at the ratio of broad money supply to FX reserves. Every 42.3 cents of broad money creation can be backed by foreign currency, a ratio much higher than China and on par with Singapore (Chart 3). With a monetary base fully backed by FX reserves and a broad money-to-FX reserve ratio largely in line with other linked exchange rate systems, our bias is that the peg will remain in place at least over a cyclical horizon (12-18 months). Chart 2In Theory, The HKMA Can Defend The Peg
In Theory, The HKMA Can Defend The Peg
In Theory, The HKMA Can Defend The Peg
Chart 3The HKMA Ranks Favorably To The PBoC
The HKMA Ranks Favorably To The PBoC
The HKMA Ranks Favorably To The PBoC
This credibility will come at a huge cost to the domestic economy, however. By having a fixed exchange rate system and an open capital account, Hong Kong has given up control over domestic monetary policy. Consequently, it must import monetary policy from the US. As interest rates rise in the US, demand for US dollar deposits from Hong Kong concerns goes up, putting downward pressure on the exchange rate. To maintain the convertibility ratio, the HKMA must drain the system of Hong Kong dollars to lift domestic interest rates. This is quite visible not only from the drop in foreign exchange reserves, but also the drawdown in the aggregate balance of domestic banks parked at the HKMA (Chart 4). From May 11 through August, the HKMA has absorbed a total of HKD 213 billion, shrinking the aggregate balance in the banking system by more than 60%. Chart 4Liquidity Will Shrink Further In Hong Kong
Liquidity Will Shrink Further In Hong Kong
Liquidity Will Shrink Further In Hong Kong
Historically, the aggregate balance has had to drop much more to restore an equilibrium between interest rates in the US and Hong Kong SAR. The implication is that liquidity will continue to be drained from the system to ultimately defend the peg, and local interest rates will rise. There is one important caveat: Hong Kong SAR’s net international investment position stands at 580% of GDP, much higher than broad money supply. As such, the Hong Kong SAR does not have a solvency problem. What it faces is too much domestic liquidity, which is pushing HKD interest rates lower (Chart 5). Chart 5The HKD Is Facing A Liquidity, Rather Than A Solvency Crisis
The Future Of The Hong Kong Dollar Peg
The Future Of The Hong Kong Dollar Peg
Ramifications Of The USD Peg When the HKD was tied to the US dollar in 1983, it made economic sense. Hong Kong SAR’s economy was more linked via trade to the US, compared to China (Chart 6). As such, stability vis-à-vis the US dollar was a vital appeal for traders, financiers, and all industries tied to the Hong Kong hub. Since then, there has been a tectonic shift in economic dependence. Exports to China now account for almost 60% of the total, while those to the US have fallen well below 8%. Quite simply, Hong Kong SAR still imports monetary policy from the US, while it is increasingly dependent on the Chinese economy. Nonetheless, there have been a few adjustments. The use of the RMB in Hong Kong SAR has been gradually gaining momentum. RMB deposits have risen to over HKD 800bn. As a share of narrow money supply (M1), it is almost 50% (Chart 7). There are also over 140 licensed banks in Hong Kong allowed to engage in RMB-based business. Chart 6Hong Kong And China Are Tied To The Hip
Hong Kong And China Are Tied To The Hip
Hong Kong And China Are Tied To The Hip
Chart 7Hong Kong Is Transitioning Into A Defacto RMB System
Hong Kong Is Transitioning Into A Defacto RMB System
Hong Kong Is Transitioning Into A Defacto RMB System
These links extend beyond just banking turnover. First introduced in 2014, the southbound trading links between China and Hong Kong SAR have become a major conduit for mainland investors to gain exposure to foreign firms. The China-Hong Kong stock connect has now handled over 2.6tn RMB in cumulative flows. This represented as high as 40% of the equity turnover in Hong Kong SAR (Chart 8). Capital account transactions have also been progressively relaxed, and the issuance of RMB bonds has been rising rapidly since 2008. Chart 8Lots Of Financial Links Between The HKD and RMB
Lots Of Financial Links Between The HKD and RMB
Lots Of Financial Links Between The HKD and RMB
Hong Kong SAR’s strengthening ties with China comes with some good news. The increase in Chinese domestic liquidity is lowering the cost of capital for local enterprises. At the same time, it might also be fuelling very low domestic interest rates, forcing locals to chase higher rates elsewhere. This does not affect the peg if people sell the RMB to buy other currencies, including the dollar or maybe even the HKD. The bad news is that Hong Kong has now become a high-beta play on China as both economies are inexorably interlinked. Chart 9 shows that consumers in Hong Kong SAR tend to have much more volatile spending patterns compared to China, especially when economic growth is about to slow. One reason is that Hong Kong concerns are highly levered notably to the property market (Chart 10). For example, the debt service ratio in Hong Kong SAR sits at 32% of disposable income, much higher than China or other indebted economies (Chart 11). This makes the economy very vulnerable to rising interest rates. Chart 9Hong Kong Is Economically More Volatile Than China
Hong Kong Is Economically More Volatile Than China
Hong Kong Is Economically More Volatile Than China
Chart 10Hong Kong Cannot Escape A Hard Landing (Part 1)
Property Prices In Hong Kong Will Drop
Property Prices In Hong Kong Will Drop
Chart 11Hong Kong Cannot Escape A Hard Landing (Part 2)
Hong Kong Cannot Escape A Hard Landing (Part 2)
Hong Kong Cannot Escape A Hard Landing (Part 2)
The bottom line is that as the HKMA withdraws domestic liquidity, this will reassert downward pressure on business activity and asset prices, particularly real estate. With private consumption a whopping 65% of GDP, household deleveraging will also prove to be a formidable headwind for domestic spending. Outside interest rates, Hong Kong SAR remains a trade hub. If global trade slows down meaningfully, this will lead to a deterioration in the current account. This triple whammy from slowing global trade, rising interest rates and consumer deleveraging could prove indigestible for Hong Kong assets. Policy Options Chart 12The Government Could Bail Out Hong Kong
The Government Could Bail Out Hong Kong
The Government Could Bail Out Hong Kong
As highlighted above, the HKD peg will remain in place for the foreseeable future, but this will come at a huge cost. The advantage of the HKD peg is that the choice of the nominal anchor, the US dollar, renders it credible. As a financial hub, this is crucial for Hong Kong. Meanwhile, such an anchor also imposes fiscal discipline since government deficits cannot be monetized by money printing. In the case where the government tries to be profligate, the rise in inflation will lower real rates and lead to capital outflows. This will force the HKMA to sell US dollars and absorb local currency. Indeed, over the past several years, government debt in Hong Kong has been close to nil (Chart 12). The drawback of a fixed exchange-rate regime is that Hong Kong SAR has relinquished control over independent monetary policy. Such a union was justified when the economic cycles between the US and Hong Kong SAR were in sync, but now the region needs easier policy settings. The roadmap of the late 1990s could be what is in store for Hong Kong SAR. In short, the peg survived but the region went through a severe internal devaluation. During the Asian crisis, property prices fell by more than 60%. If that were to occur today, it would herald a prolonged period of high unemployment and stagnant wages to realign the region’s competitiveness with its trading partners. Hong Kong SAR stocks have already borne the brunt of an internal adjustment and are trading at very cheap multiples (Chart 13). The MSCI Hong Kong stock index is composed of mostly financials (47% of market cap) and property stocks (21% of market cap). As HKD rates are rising, loan growth in Hong Kong SAR is contracting and net interest margins have collapsed (Chart 14). This does not bode well for the near-term performance of financials. Chart 13Markets Have Already Discounted A Pessimistic Scenario For Hong Kong Shares
Markets Have Already Discounted A Pessimistic Scenario For Hong Kong Shares
Markets Have Already Discounted A Pessimistic Scenario For Hong Kong Shares
Chart 14Banks In Hong Kong Are Facing A Tough ##br##Reckoning
Banks In Hong Kong Are Facing A Tough Reckoning
Banks In Hong Kong Are Facing A Tough Reckoning
The good news is that similar to the late 1990s, banks are unlikely to go bust. Hong Kong SAR banks are well capitalized and delinquency rates are quite low, suggesting a banking crisis is unlikely to be a source of pain for the HKD peg (Chart 15). In fact, Hong Kong SAR banks rank favorably among their global peers in terms of capital adequacy (Chart 16). Chart 15Banks In Hong Kong Are Well Capitalized (Part 1)
Banks In Hong Kong Are Well Capitalized (Part 1)
Banks In Hong Kong Are Well Capitalized (Part 1)
Chart 16Banks In Hong Kong Are Well Capitalized (Part 2)
The Future Of The Hong Kong Dollar Peg
The Future Of The Hong Kong Dollar Peg
Specific to the currency, Hong Kong is also running recurring current account surpluses. This is boosting its FX reserves (Chart 17). That lends credibility to the peg in the near term. The bad news is that as the domestic economy slows down, and global trade comes close to a standstill, these surpluses could evaporate. One cost to Hong Kong is that the peg to the US dollar has made HKD incrementally expensive. Our model shows that the real effective exchange for HKD is about 2.5 standard deviations above fair value (Chart 18). Our view on the US dollar is that we could see depreciation over a 12-to-18-month horizon, but an overshoot in the near term is quite likely. A drop in the US dollar will help realign competitiveness in the HKD. Meantime, the market has also been pushing the currency towards the weaker side of its convertibility band. Chart 17Balance Of Payments Remain Favorable For The HKD
Balance Of Payments Remain Favorable For The HKD
Balance Of Payments Remain Favorable For The HKD
Chart 18The HKD Is Expensive
The HKD Is Expensive
The HKD Is Expensive
Longer term, as Hong Kong SAR continues to become more entwined with China, a peg to the CNY will make sense. This process will be the initial step in the region’s official embrace of the RMB system. That said, the process will be gradual since the US dollar remains very much a reserve currency, and the relevance of Hong Kong SAR as a financial center hinges upon easy access to the USD. What is more likely is that any re-pegging to the RMB will come many years down the road, when the yuan has become a fully convertible currency. The de-pegging of the HKD from the USD or adjusting the peg is as much a political discussion as an economic one. Political conditions for this change are not yet present given such a change will have major ramifications for the economy of Hong Kong SAR and will likely also reverberate through financial asset prices. One can imagine a scenario where HKD yields are forced to adjust to a new nominal anchor. Investors have been convinced through almost 30 years of history to treat the HKD as a proxy for the US dollar. That said, the economic pain associated with maintaining the HKD-USD peg will ensure authorities accelerate the use of RMBs in Hong Kong, with a goal of eventually adopting the yuan as the de facto currency. Adopting a currency board akin to Singapore is another option that makes sense, especially since this would give the HKMA scope to link to cheaper currencies, such as the yen and euro. That said, this is unlikely to be politically palatable, especially for Beijing. A link to the yuan that already does this job makes sense. Finally, there is always the option to fully float the peg, but this would probably increase currency volatility. This is unlikely in the near term. The Goldilocks scenario for policymakers is when the US dollar eventually depreciates against major currencies, easing financial conditions for Hong Kong SAR concerns. This will dovetail nicely with the goals of the monetary authorities, maintain credibility while easing financial concerns for a very levered economy. Investment Conclusions The HKD peg will remain in place, but the financial dislocations will lead to significant internal devaluation in Hong Kong SAR. As US interest rates rise, the HKD will be under considerable pressure. The HKMA will have no choice but to allow HKD interest rates to rise. This will tip the property market and thrust the economy into deflation and a recession. Chinese bonds are the best hedge against this risk. Avoid property and financial shares for the time being. Were the peg to break today, the HKD will depreciate according to our valuation models. This suggests markets are right to push the HKD-linked rate towards the weaker end of the convertibility band. Despite the economic and financial pain, the HKMA will not abandon the peg. That means carry trades will continue to make money. Using the HKD as a funding currency still makes sense in the near term. In long run, the economic pain associated with maintaining the HKD-USD peg will make authorities in Beijing accelerate the use of the RMB in Hong Kong’s special administrative region. The eventual goal will be for Hong Kong SAR to adopt the yuan as its currency. Chester Ntonifor Foreign Exchange Strategist chestern@bcaresearch.com Qingyun Xu, CFA Associate Editor qingyunx@bcaresearch.com
Listen to a short summary of this report Executive Summary GIS Projection For The EUR/USD
It’s Time To Buy The Euro
It’s Time To Buy The Euro
We went long the euro early last week, as EUR/USD hit our buy limit price of $0.99. Despite a near cut-off of Russian gas imports, European gas inventories have reached 84% of capacity – above the 80% target that the EU set for November 1st. The latest meteorological forecasts suggest that Europe will experience a warmer-than-normal winter. This will cut heating usage, likely making gas rationing unnecessary. Currencies fare best in loose fiscal/tight monetary environments. This is what Europe faces over the coming months, as governments boost income support for households and businesses, while ramping up spending on energy infrastructure and defense. For its part, the ECB has started hiking rates. Since mid-August, interest rate differentials have moved in favor of the euro at both the short and long end. Rising inflation expectations make it less likely that the ECB will be able to back off from its tightening campaign as it did in past cycles. A hawkish Fed is the biggest risk to our bullish EUR/USD view. We expect US inflation to trend lower over the coming months, before reaccelerating in the second half of 2023. However, as the August CPI report highlights, the danger is that any dip in inflation proves to be shallower and shorter-lived than previously anticipated. Bottom Line: Although significant uncertainty remains, the risk-reward trade-off favors being long EUR/USD. Our end-2022 target is $1.06. Dear Client, I will be meeting clients in Asia next week while also working on our Fourth Quarter Strategy Outlook, which will be published at the end of the month. In lieu of our regular report next Friday, you will receive a Special Report from my colleague, Ritika Mankar, discussing the sources of US equity outperformance over the past 14 years and the likely path ahead. Best Regards, Peter Berezin, Chief Global Strategist It’s Just a Clown Chart 1Investors Are Bullish The Dollar, Not The Euro
Investors Are Bullish The Dollar, Not The Euro
Investors Are Bullish The Dollar, Not The Euro
The scariest part of a horror movie is usually the one before the monster is revealed. No matter how good the special effects, the human brain can always conjure up something more frightening than anything Hollywood can dream up. Investors have been conjuring up all sorts of cataclysmic scenarios for the upcoming European winter. In financial markets, the impact has been most visible in the value of the euro, which has tumbled to parity against the US dollar. Only 23% of investors are bullish the euro at present, down from a peak of 78% in January 2021 (Chart 1). Conversely, 75% of investors are bullish the US dollar. More than half of fund managers cited “long US dollar” as the most crowded trade in the latest BofA Global Fund Manager Survey (“long commodities” was a distant second at 10%). As we discuss below, the outlook for the euro may be a lot better than most investors realize. While my colleagues, Chester Ntonifor, BCA’s chief FX strategist, and Mathieu Savary, BCA’s chief European strategist, are not quite ready to buy the euro just yet, we all agree that EUR/USD will rise over the long haul. Cutting Putin Loose Natural gas accounts for about a quarter of Europe’s energy supply. Prior to the Ukraine war, about 40% of that gas came from Russia (Chart 2). With the closure of the NordStream 1 pipeline, that number has fallen to 9% (some Russian gas continues to enter Europe via Ukraine and the TurkStream supply route). Yet, despite the deep drop in Russian natural gas imports, European natural gas inventories are up to 84% of capacity – roughly in line with past years and above the EU’s November 1st target of 80% (Chart 3). Chart 2Despite A Sharp Drop In Imports Of Russian Natural Gas…
It’s Time To Buy The Euro
It’s Time To Buy The Euro
Chart 3...Europeans Managed To Stock Up On Natural Gas For The Winter Season
...Europeans Managed To Stock Up On Natural Gas For The Winter Season
...Europeans Managed To Stock Up On Natural Gas For The Winter Season
Europe has been able to achieve this feat by aggressively buying natural gas on the open market. While this has caused gas prices to soar, it sets the stage for a retreat in prices in the months ahead. European spot natural gas prices have already fallen from over €300/Mwh in late August to €214/Mwh, and the futures market is discounting a further decline in prices over the next two years (Chart 4). Chart 4The Futures Market Is Discounting A Further Decline In Natural Gas Prices
It’s Time To Buy The Euro
It’s Time To Buy The Euro
Chart 5Futures Prices Of Energy Commodities Provide Some Limited Information On Where Spot Prices Are Heading
It’s Time To Buy The Euro
It’s Time To Buy The Euro
Follow the Futures? Futures prices are not a foolproof guide to where spot prices are heading. As Chart 5 illustrates, the correlation between the slope of the futures curve and subsequent changes in spot prices in energy markets is quite low. Nevertheless, future spot returns do tend to be negative when the curve is backwardated, as it is now, especially when assessed over horizons of around 12-to-18 months (Table 1). Table 1Energy Commodity Spot Price Returns Tend To Be Negative When The Futures Curve Is Backwardated
It’s Time To Buy The Euro
It’s Time To Buy The Euro
Our guess is that European natural gas prices will indeed fall further from current levels. The latest meteorological forecasts suggest that Europe will experience a milder-than-normal winter (Chart 6). This is critical considering that natural gas accounts for over 40% of EU residential heating use once electricity and heat generated in gas-fired plants are included (Chart 7). Chart 6Meteorological Models Suggest Above-Normal Temperatures In Europe This Winter
It’s Time To Buy The Euro
It’s Time To Buy The Euro
Chart 7Natural Gas Is An Important Source Of Energy For Heating Homes In The EU
It’s Time To Buy The Euro
It’s Time To Buy The Euro
A warm winter would bolster the euro area’s trade balance, which has fallen into deficit this year as the energy import bill has soared (Chart 8). An improving balance of payments would help the euro. Europe is moving quickly to secure new sources of energy supply. In less than one year, Europe has become America’s biggest overseas market for LNG (Chart 9). A new gas pipeline linking Spain with the rest of Europe should be operational by next spring. Chart 8Soaring Energy Costs Have Pushed The Euro Area Trade Balance Into Deficit
Soaring Energy Costs Have Pushed The Euro Area Trade Balance Into Deficit
Soaring Energy Costs Have Pushed The Euro Area Trade Balance Into Deficit
Chart 9Europe Is America's Largest LNG Customer
It’s Time To Buy The Euro
It’s Time To Buy The Euro
In the meantime, Germany is building two “floating” LNG terminals. It has also postponed plans to mothball its nuclear power plants and has restarted its coal-fired power plants, a decision that even the German Green Party has supported. France is aiming to boost nuclear capacity, which had fallen below 50% earlier this summer. Électricité de France has pledged to nearly double daily production by December. For its part, the Dutch government has indicated it will raise output from the massive Groningen natural gas field if the energy crisis intensifies. Fiscal Policy to the Rescue On the policy front, European governments are taking steps to buttress household balance sheets during the energy crisis, with nearly €400 billion in support measures announced so far (and surely more to come). Although these support measures will be offset with roughly €140 billion of windfall profit taxes on the energy sector, the net effect will be to raise budget deficits across the region. However, following the old adage that one should “finance temporary shocks but adjust to permanent ones,” a temporary spike in fiscal support may be just what the doctor ordered. The last thing Europe needs is a situation where energy prices fall next year, but the region remains mired in recession as households seek to rebuild their savings. Such an outcome would depress tax revenues, likely leading to higher government debt-to-GDP ratios. Get Ready For a V-Shaped Recovery Stronger growth in the rest of the world should give the euro area a helping hand. That would be good news for the euro, given its cyclical characteristics (Chart 10). The European economy is especially leveraged to Chinese growth. It is likely that the authorities will loosen the zero-Covid policy once the Twentieth Party Congress concludes next month, and new anti-viral drugs and possibly an Omicron-specific booster shot become widely available later this year. That should help jumpstart China’s economy. More stimulus will also help. Chart 11 shows that EUR/USD is highly correlated with the Chinese credit/fiscal impulse. Chart 10The Euro Is A Cyclical Currency
The Euro Is A Cyclical Currency
The Euro Is A Cyclical Currency
Chart 11EUR/USD Is Highly Correlated With The Chinese Credit & Fiscal Impulse
EUR/USD Is Highly Correlated With The Chinese Credit & Fiscal Impulse
EUR/USD Is Highly Correlated With The Chinese Credit & Fiscal Impulse
All this suggests that the prevailing view on European growth is too pessimistic. Even if Europe does succumb to a technical recession in the months ahead, it is likely to experience a V-shaped recovery. That will provide a nice tailwind for the euro. Loose Fiscal/Tight Monetary Policies: The Winning Combo for Currencies Chart 12Fiscal Policy Has Eased Structurally In The Euro Area More Than In Other Advanced Economies
It’s Time To Buy The Euro
It’s Time To Buy The Euro
A tight monetary and loose fiscal policy has historically been the most bullish combination for currencies. Recall that the US dollar soared in the early 1980s on the back of Paul Volcker’s restrictive monetary policy and Ronald Reagan’s expansionary fiscal policy, the latter consisting of huge tax cuts and increased military spending. While not nearly on the same scale, the euro area’s current configuration of loose fiscal/tight monetary policies bears some resemblance to the US in the early 1980s. Even before the war in Ukraine began, the IMF was forecasting a much bigger swing towards expansionary fiscal policy in the euro area than in the rest of the world (Chart 12). The war has only intensified this trend, triggering a flurry of spending on energy and defense – spending that is likely to persist for most of this decade. The ECB’s Reaction Function After biding its time, the ECB has joined the growing list of central banks that are hiking rates. On September 8th, the ECB jacked up the deposit rate by 75 bps. Investors expect a further 185 bps in hikes through to September 2023. While US rate expectations have widened relative to euro area expectations since the August US CPI report (more on that later), the gap is still narrower than it was on August 15th. Back then, investors expected euro area 3-month rates to be 233 bps below comparable US rates in June 2023. Today, they expect the gap to be only 177 bps (Chart 13). Real long-term bond spreads, which conceptually at least should be the more important driver of currency movements, have also moved in the euro’s favor. In the past, ECB rate hikes were swiftly followed by cuts as the region was unable to tolerate even moderately higher rates. While this very well could happen again, the odds are lower than they once were, at least over the next 12 months. Chart 13Interest Rate Differentials Have Moved In Favor Of The Euro Since Mid-August
Interest Rate Differentials Have Moved In Favor Of The Euro Since Mid-August
Interest Rate Differentials Have Moved In Favor Of The Euro Since Mid-August
Chart 14Euro Area: Inflation Expectations Have Risen Briskly
Euro Area: Inflation Expectations Have Risen Briskly
Euro Area: Inflation Expectations Have Risen Briskly
For one thing, median inflation expectations three years ahead in the ECB’s monthly survey have risen briskly (Chart 14). The Bundesbank’s own survey paints an even more alarming picture, with median expected inflation over the next five years having risen to 5% from 3% in mid-2021 (Chart 15). Expected German inflation over the next ten years stands at a still-elevated 4%. Whether this reflects Germans’ heightened historical sensitivity to inflation risks is unclear, but it is something the ECB cannot ignore. Structurally looser fiscal policy has raised the neutral rate of interest in the euro area, giving the ECB more leeway to lift rates. A narrowing in competitiveness gaps across the currency bloc has also mitigated the need for the ECB to set rates based on the needs of the weakest economies in the region. Chart 16 shows that collectively, unit labor costs among the countries most afflicted by the sovereign debt crisis a decade ago have completely converged with Germany. Chart 15German Inflation Expectations Are Elevated
German Inflation Expectations Are Elevated
German Inflation Expectations Are Elevated
Chart 16Europe's Periphery Has Closed The Competitiveness Gap With Germany
Europe's Periphery Has Closed The Competitiveness Gap With Germany
Europe's Periphery Has Closed The Competitiveness Gap With Germany
While Italy is still a laggard in the competitiveness rankings, the ECB’s new Transmission Protection Instrument (TPI) – which allows the central bank to buy sovereign debt with less stringent conditionality than under the Outright Monetary Transactions (OMT) program – should keep a lid on sovereign spreads. This, in turn, will allow the ECB to raise rates more than it otherwise could. Hawkish Fed is the Biggest Risk to Our Bullish EUR/USD View Chart 17Supplier Delivery Times Have Fallen Sharply
Supplier Delivery Times Have Fallen Sharply
Supplier Delivery Times Have Fallen Sharply
Tuesday’s hotter-than-expected August US CPI report pulled the rug from under the euro’s incipient rally, pushing EUR/USD back to parity. We have been flagging the risks of high inflation for several years (see, for example, our February 19, 2021 report, 1970s-Style Inflation: Yes, It Could Happen Again). Our thesis is that inflation will follow a “two steps up, one step down” pattern. We are probably near the top of those two steps now, with the next leg for inflation likely to be to the downside, driven by ebbing pandemic-related supply side-dislocations. Perhaps most notably, supplier delivery times have fallen sharply in recent months (Chart 17). These pandemic-related dislocations extend to the housing rental market. Rent inflation dropped after rent moratoriums were put in place, only to rebound forcefully once the moratoriums were lifted and the labor market tightened. Although official measures of rent inflation will remain elevated for some time, owing to lags in how they are constructed, timelier data on new rental units coming to market already point to a sharp decline in rent inflation (Chart 18). This is something that the Fed is sure to notice. Ironically, falling inflation could sow the seeds of its own demise. Nominal wage growth is currently very elevated, yet because of high inflation, real wages are still shrinking. As inflation comes down, real wage growth will turn positive. This will lift consumer sentiment, helping to buoy consumption (Chart 19). A pickup in consumer spending will cause the economy to overheat again, leading to a second wave of inflation in the back half of 2023. Chart 18Timelier Measures Of Rent Inflation Have Rolled Over
Timelier Measures Of Rent Inflation Have Rolled Over
Timelier Measures Of Rent Inflation Have Rolled Over
Chart 19Falling Inflation Will Boost Real Wages And Consumer Confidence
Falling Inflation Will Boost Real Wages And Consumer Confidence
Falling Inflation Will Boost Real Wages And Consumer Confidence
As we discussed in our August 18th Special Report Dispatches From The Future: From Goldilocks To President DeSantis, the Fed will respond to this second inflationary wave by hiking the Fed funds rate to 5%. This will temporarily push up the value of the dollar, a process that will only stop once the US falls into recession in 2024 and the Fed is forced to cut rates again. Our projected rollercoaster ride for EUR/USD is depicted in Chart 20. We see the euro rising to $1.06 by year-end, peaking at $1.11 in the spring of 2023, falling back to $1.05 by late 2023, and then beginning a prolonged rally in 2024. Chart 20GIS Projection For The EUR/USD
It’s Time To Buy The Euro
It’s Time To Buy The Euro
Chart 21The Dollar Is Very Overvalued Against The Euro Based On PPP
The Dollar Is Very Overvalued Against The Euro Based On PPP
The Dollar Is Very Overvalued Against The Euro Based On PPP
Chart 21 shows that the dollar is 30% overvalued against the euro based on its Purchasing Power Parity (PPP) exchange rate. Thus, there is significant long-term upside to EUR/USD. Implications for Other Currencies and Regional Equity Allocation Chart 22Stock Markets Outside The US Tend To Fare Best When The Dollar Is Weakening
Stock Markets Outside The US Tend To Fare Best When The Dollar Is Weakening
Stock Markets Outside The US Tend To Fare Best When The Dollar Is Weakening
The strengthening in the euro that we envision over the next six months or so will be part of a broad-based dollar decline. While BCA’s Foreign Exchange Strategy service sees more upside for the euro than the pound, GBP/USD will likely follow the same trajectory as EUR/USD. The yen is one of the cheapest currencies in the world and should finally gain some traction. If China abandons its zero-Covid policy and increases fiscal support for its economy, the RMB and other EM currencies should strengthen. Stock markets outside the US tend to fare best when the dollar is weakening. This includes Europe. As Chart 22 illustrates, there is a close correlation between EUR/USD and the relative performance of European versus US stocks. Thus, an above-benchmark exposure to international markets is appropriate during the coming months. Peter Berezin Chief Global Strategist peterb@bcaresearch.com Follow me on LinkedIn & Twitter Global Investment Strategy View Matrix
It’s Time To Buy The Euro
It’s Time To Buy The Euro
Special Trade Recommendations Current MacroQuant Model Scores
It’s Time To Buy The Euro
It’s Time To Buy The Euro
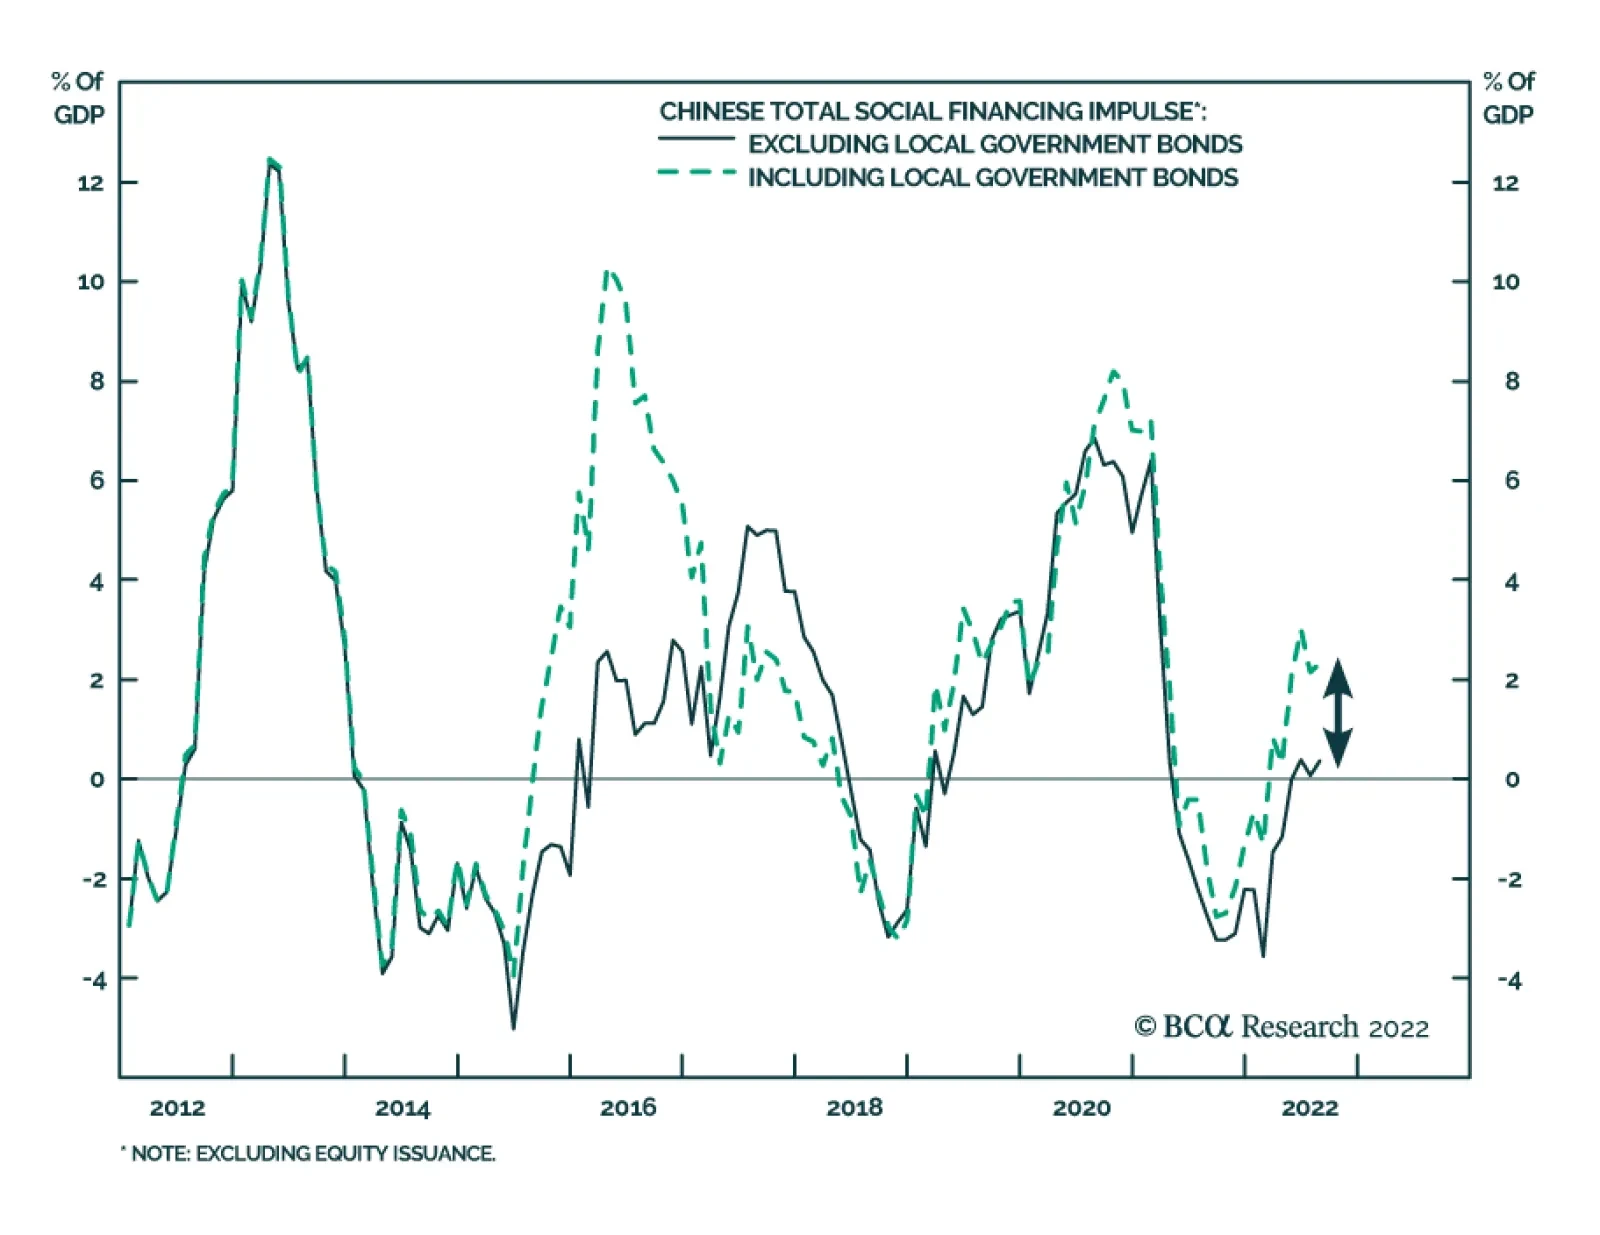
China’s aggregate financing in August tripled to a larger-than-expected CNY 2.43 tr, following a CNY 0.76 tr in July and beating expectations of CNY 2.08 tr. New bank loans doubled, reaching CNY 1.25 tr from CNY 0.68 tr, albeit below expectations. Seasonal…
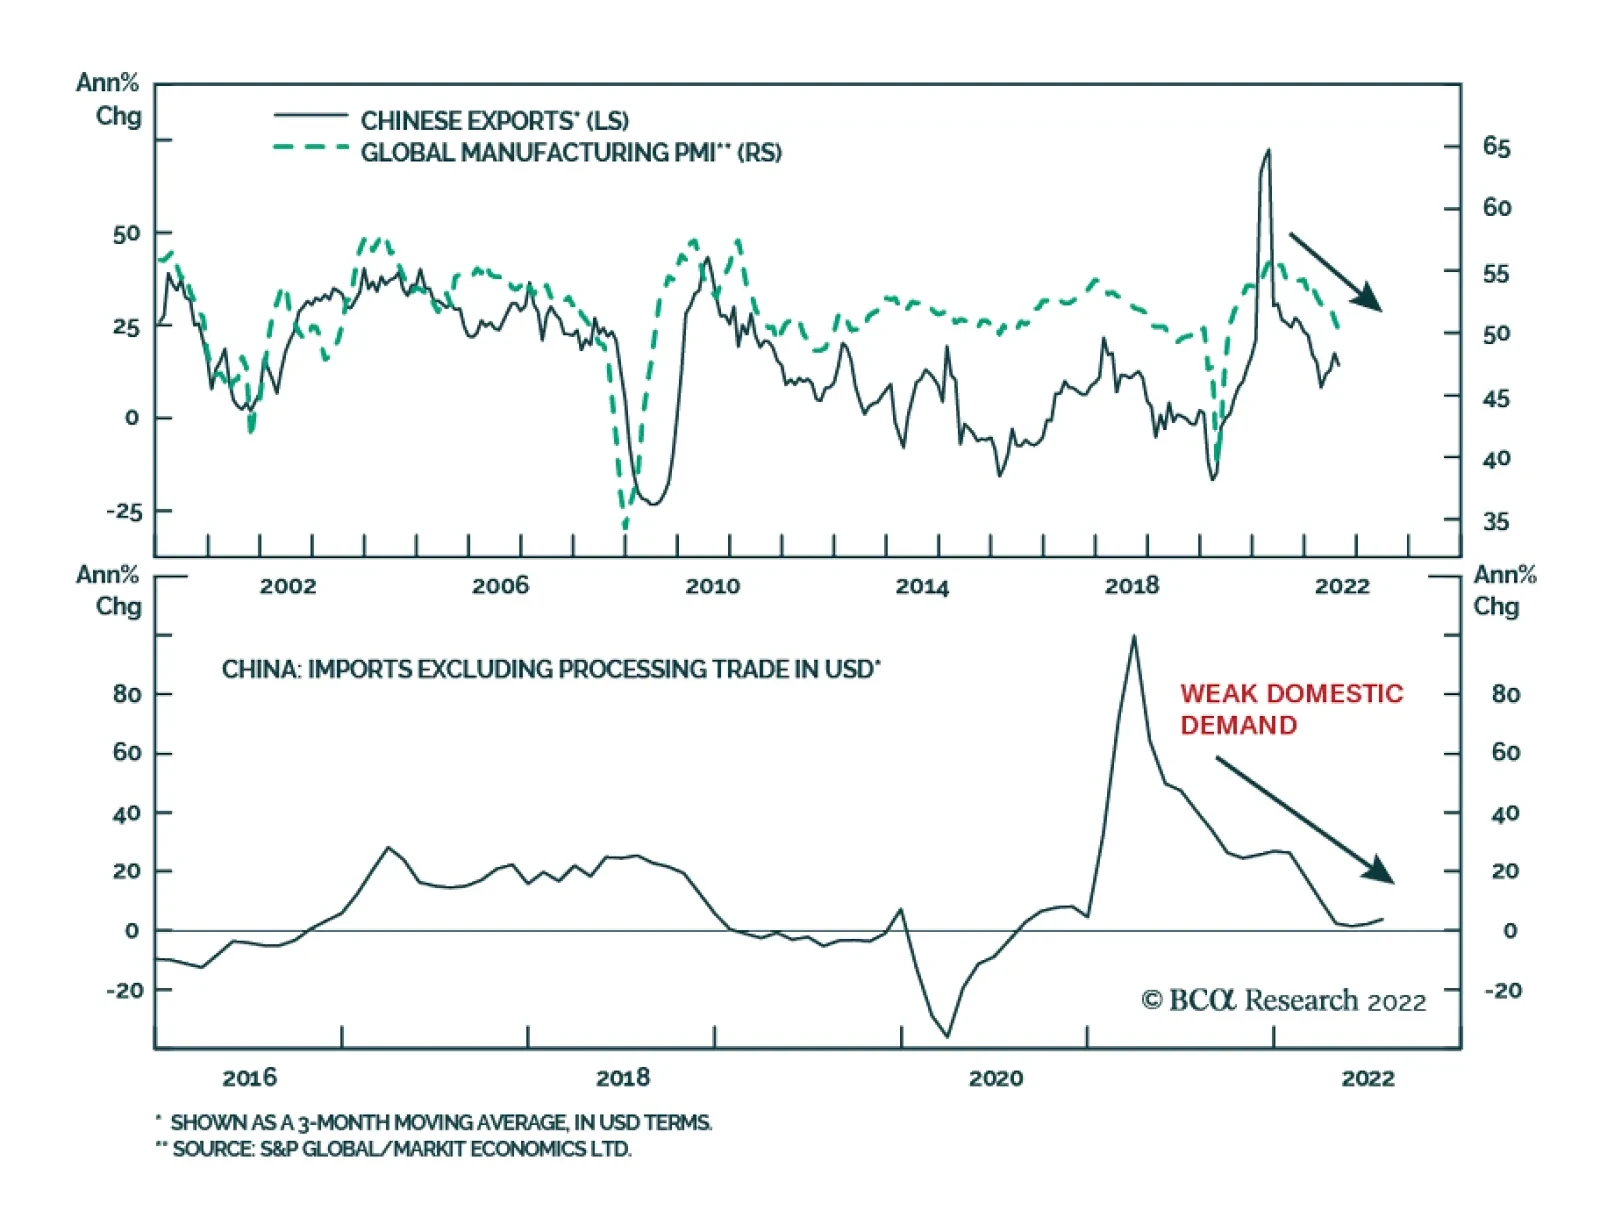
Chinese imports and exports significantly missed expectations in August. Exports grew by 7.1% y/y in US dollar terms, down from 18.0% y/y and largely below the 13.0% y/y anticipated. Imports rose 0.3% y/y in August, down from 2.3% y/y in July and below…
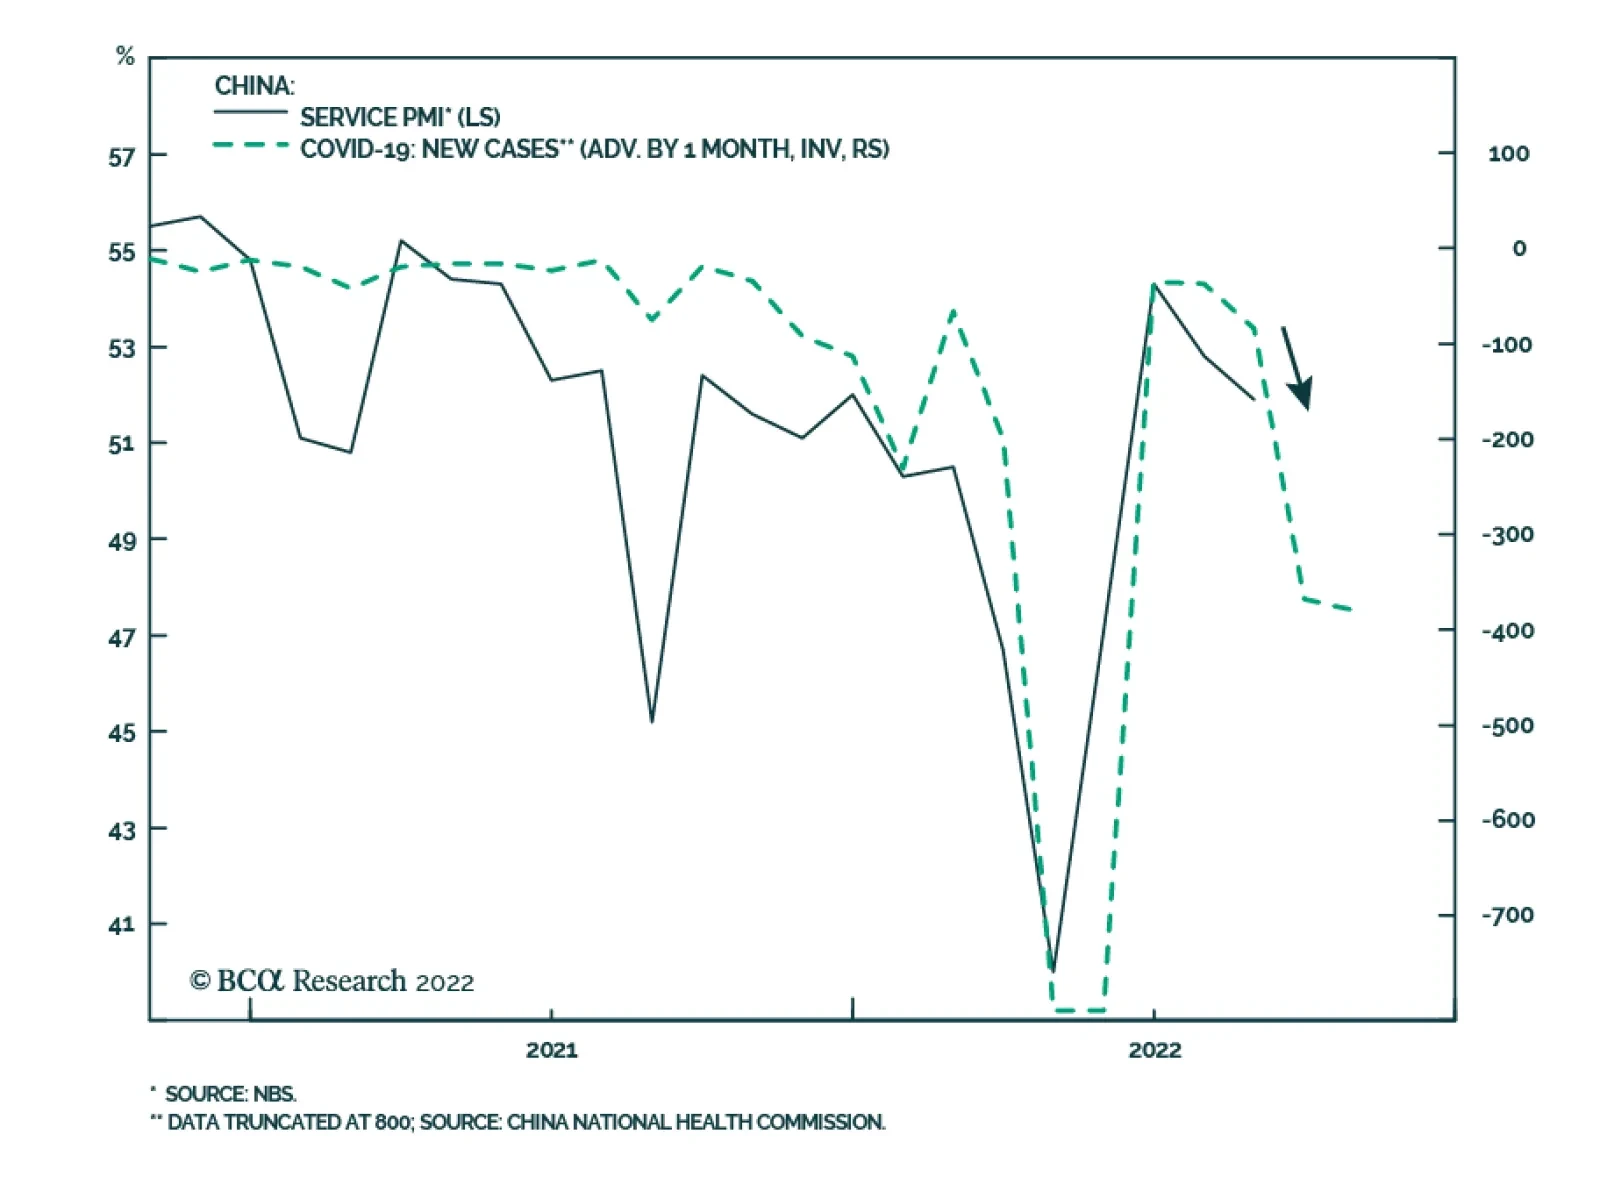
BCA Research’s China Investment Strategy service concludes that the conditions do not seem to be met for a drastic change in Beijing’s dynamic zero-Covid strategy. China’s transition from zero tolerance to an orderly, managed approach to life with an evolving…
Executive Summary A Structural Downshift In China’s Real Estate Investment Growth
Real Estate Investment Growth In China Will Structurally Shift Lower
Real Estate Investment Growth In China Will Structurally Shift Lower
The Politburo has set a date for the much-anticipated 20th Communist Party Congress at which President Xi will most likely secure his third term as general secretary. Although we expect China’s leaders to focus on supporting the economy following the Party Congress, there are high odds that the authorities will underdeliver on policy easing. Beijing may recalibrate its stringent zero-Covid policy next year, but the conditions are presently not yet met for a turnaround in the current strategy. China’s structural issues remain, and policymakers will likely continue to tackle them while downplaying the importance of GDP growth. The housing market remains the epicenter of risk to both China’s financial system and social stability. China’s leaders have incrementally introduced accommodative initiatives, but they still continue to seek reduced leverage among property developers. Investors should be prepared for a scenario that China will avoid “irrigation-type” stimulus in the next six months. Therefore, the economy will continue to expand at below potential growth. Bottom Line: There is a nontrivial risk that China’s stimulus will fall short of market expectations following the upcoming Party Congress. This poses risks to Chinese share prices. Market participants believe that the 20th Communist Party Congress beginning October 16 will be a jumping off point for Chinese leaders to stimulate the economy more aggressively. This would signal a shift in the leadership’s focus, from securing political stability ahead of the Party Congress to ensuring an economic recovery next year. However, to achieve a meaningful and sustainable rebound in economic activity and equity market performance, policymakers will need to overcome two major hurdles: the zero-Covid policy and the "three red lines" regulation for property developers. At the risk of being wrong, we identify some of the factors that will preclude using irrigation type of stimulus after the conclusion of the Party Congress. Given the prevailing headwinds to China’s economy and the lack of “all-in” type of stimulus, we recommend that global equity portfolios stay neutral for now on Chinese onshore stocks and underweight offshore stocks. The Date Is Set! The Politburo’s announcement that the 20th Party Congress would take place earlier than November, in our view, is a sign of political stability and marginally positive for the economy. On the opening day, President Xi will deliver the Party’s work report, which will chart China’s policy trajectory for the next five years and beyond. It is generally believed that President’s Xi’s vision to turn China into an advanced global power will be endorsed by the Party. The earlier date for the Congress is significant for the following reasons: It shows that preparations for the Party Congress are progressing on schedule. President Xi will most likely cement his third term as general secretary, leaving little room for surprises from a political standpoint. The Party Congress will provide some indication whether the leadership will revise policies, including the zero-Covid strategy and industry regulations. Lower-level officials have been waiting to see which way the political winds are blowing. The Party Congress will clarify the situation and allow officials to focus on their economic work. Bottom Line: The Party Congress, along with the Central Economic Work Conference in December, will set the tone for China’s key economic, social, and industry policies for 2023 and beyond. Endgame To The Zero-Covid Strategy? Chart 1The Primary Risk To China's Economic Recovery Is Its Zero-Covid Policy
The Primary Risk To China's Economic Recovery Is Its Zero-Covid Policy
The Primary Risk To China's Economic Recovery Is Its Zero-Covid Policy
The primary risk to China’s economic recovery is its stringent zero-Covid policy, which has significantly impacted the service sector, household income and consumption (Chart 1). In recent months policymakers have incrementally adjusted their Covid-containment measures, such as shortening the quarantine period for international travelers and streamlining mass testing procedures. However, the fundamental goal of eradicating domestic Covid cases remains intact. The best scenario in the coming year, in our view, is that China will adopt hybrid measures to combat Covid. Countries like Japan, South Korea, New Zealand, and Australia have all adopted a mixed series of Covid-control policies. These include a gradual reduction in testing and quarantine protocols, an increase in targeted vaccination among the elderly, an introduction of antiviral drugs and strengthening the quality of primary care. However, China may not tolerate the level of Covid experienced in these countries, especially since their number of new cases and related deaths have risen of late (Chart 2A and 2B). Chart 2ACovid Case Counts In Other Countries Have Risen Or Remain Elevated...
Covid Case Counts In Other Countries Have Risen Or Remain Elevated...
Covid Case Counts In Other Countries Have Risen Or Remain Elevated...
Chart 2B...Along With Number Of Deaths
...Along With Number Of Deaths
...Along With Number Of Deaths
China sees its extremely low case count as proof that the dynamic zero-Covid policy has succeeded (Chart 3). It argues that if it shifts course and re-opens before proper protective measures have been introduced, then the losses might exceed a million deaths. China’s authorities believe that Hong Kong SAR’s high death rate in the spring is stark proof of that possible scenario (Chart 4). Chart 3China Has Managed To Keep Its Covid Case And Death Counts Extremely Low
China Has Managed To Keep Its Covid Case And Death Counts Extremely Low
China Has Managed To Keep Its Covid Case And Death Counts Extremely Low
Chart 4Situation In HK SAR Earlier This Year Has Probably Sent A Warning Sign To The Mainland
Situation In HK SAR Earlier This Year Has Probably Sent A Warning Sign To The Mainland
Situation In HK SAR Earlier This Year Has Probably Sent A Warning Sign To The Mainland
Thus, a sudden pivot from zero-Covid to living with the virus next year seems farfetched. China’s National Health Commission experts recently stated that victory over the virus would require effective vaccines, treatments and mild variants. We examine these three premises as follows: Covid vaccination rate: China’s overall Covid vaccination rate is high at 90% as of August this year. However, more than 35% of Chinese over age 60 have not received a booster dose and only 61% above age 80 have had a primary vaccination. Given that the majority of China’s population has not been exposed to the virus and is immunologically naïve, unlike their Western counterparts, the population relies completely on immunity acquired through Covid vaccines. Chart 5China's Vaccination Progress Has Stalled
China's Vaccination Progress Has Stalled
China's Vaccination Progress Has Stalled
China’s daily vaccination rate has fallen to below 200,000 per day, sharply down from the peak of 3-5 million per day in March and April (Chart 5). Even if we assume that three doses of China’s domestically produced vaccines are as effective as the West’s mRNA vaccines, at the current pace it would take several years to provide three doses of Covid vaccines to China’s 1.4 billion people. Hence, to significantly loosen zero-Covid policy, we would need to see a huge acceleration in the country’s vaccination rate. Treatment drugs: China okayed the imports and use of Pfizer’s antiviral drug Paxlovid in February and approved its first homegrown Covid antiviral medication “Azvudine” in July. Azvudine’s efficacy in reducing Covid-related hospitalization and deaths remains to be seen. The manufacturer, Genuine Biotech, says that the facility's annual production capacity is 1 billion tablets (each tablet is 1 mg), but is expected to reach 3 billion tablets in the future. Assuming each patient will need 50 mgs of Azvudine to complete a full course of treatment (as instructed by the drug manufacturer), the company can provide enough tablets for approximately 20 million Chinese within one year. To put the number into respective, China has more than 26 million people over age 80, of which more than 10 million have not had their first Covid vaccine. Chart 6The Level Of Beijing's Covid Policy Stringency Remains Elevated
The Level Of Beijing's Covid Policy Stringency Remains Elevated
The Level Of Beijing's Covid Policy Stringency Remains Elevated
Milder variants: Another possibility is if new mild variants emerge next year and they cause no harm or panic among the population. However, there is no guarantee that Beijing will be willing to relent on its Covid policy based on evidence and statistics from other countries where the populations may have received mRNA vaccines. Even statistics provided within China may not warrant a decisive reopening of the economy. A recent study conducted by leading Chinese public health experts found that only 22 of the nearly 34,000 Covid patients hospitalized in Shanghai from March 22 to May 3 developed severe illness. Nonetheless, the study has not prompted policymakers to step back from the tight Covid control protocols (Chart 6). Bottom Line: The conditions do not seem to be met for a drastic change in Beijing’s dynamic zero-Covid strategy. China’s transition from zero tolerance to an orderly, managed approach to life with an evolving Covid virus will likely be long and difficult. The Housing Market Policy Dilemma The other key to achieving a meaningful recovery in China’s economy is through stimulating the country’s housing market. We expect that more accommodative real estate policy initiatives will be introduced later this year and early next year. However, structural headwinds in the property market will limit the government's willingness to stimulate the sector as aggressively as in previous cycles. China’s shrinking working population since 2015 likely led to a peak in the demand for housing in 2017/18. Moreover, it is estimated that China's total population growth will turn negative this year, further suppressing demand (Chart 7). The combination of demographic headwinds and a slowdown in urbanization, means that if policymakers overstimulate the sector as in the past, then they will have a bigger bubble to pop in the future. There is no indication that the authorities will stop focusing on deleveraging and reducing financial risks in the real estate sector. The magnitude of mortgage rate cuts so far this year is much smaller than in the 2008/09 and 2015/16 cycles. Moreover, mortgage rates remain higher than growth in household income and home prices (Chart 8). The positive gaps between mortgage rates and both household income growth and house price appreciation discourage house purchases. Chart 7Demand For Housing In China Is On A Structural Downtrend
Demand For Housing In China Is On A Structural Downtrend
Demand For Housing In China Is On A Structural Downtrend
Chart 8Current Rate Cuts Are Not Enough To Meaningfully Spur Demand For Housing
Current Rate Cuts Are Not Enough To Meaningfully Spur Demand For Housing
Current Rate Cuts Are Not Enough To Meaningfully Spur Demand For Housing
Importantly, while policymakers have intervened and provided liquidity to cash-strapped real estate developers, the “three red lines” policies restraining developers’ leverage remain intact. The message is clear: Beijing will use all necessary tools to prevent systemic risks and social unrest by ensuring the completion of existing housing projects. However, the authorities will continue to force developers to structurally shift their business models and reduce their leverage. Chinese authorities would be more incentivized to bail out the sector if there were risks of widespread mortgage loan defaults among households. In our view, this risk remains low in the next 6 to 12 months. The mortgage down payment ratio is relatively high in China and mortgages are full recourse loans as borrowers are personally liable beyond the collateral (i.e., the property asset). This combination reduces the incentive for homebuyers to stop paying mortgages even in a situation of negative equity (i.e., when the value of the property asset falls below the outstanding mortgage). Indeed, ongoing mortgage boycotts have been isolated to unfinished apartments in stalled projects. The boycotts are driven by homebuyers to pressure developers to finish these projects and are not due to household financial difficulties. There will likely be more defaults by overleveraged developers next year. The sector will consolidate further, with opportunistic, well-funded developers taking advantage of the situation to acquire distressed assets at a discount. Many of these may be state-owned or state-backed companies and investment funds. Chart 9Real Estate Investment Growth In China Will Structurally Shift Lower
Real Estate Investment Growth In China Will Structurally Shift Lower
Real Estate Investment Growth In China Will Structurally Shift Lower
Bottom Line: Policymakers will continue to feed the housing sector with stimulus measures, but the leadership might be reluctant to overstimulate the sector. China’s real estate market dynamics, particularly the completion of existing projects, will likely improve on the margin in the next 6 to 12 months. Structurally, however, China’s home sales and real estate investment growth will continue shifting to a lower gear (Chart 9). Investment Conclusions At the start of the year, China was expected to aggressively stimulate its economy. This was based on the premise that policymakers would not tolerate slower economic growth ahead of the Party Congress. Nonetheless, Chinese leaders downplayed the annual GDP growth target this year, a major deviation from the past. Post October’s Party Congress, we think that the authorities will continue to roll out measures to support the economy, but we recommend that investors remain realistic about the magnitude of policy easing. There are nontrivial risks that policymakers will continue to tackle structural issues, while allowing the economy to muddle through. With piecemeal stimulus, China may still be able to manage a soft landing in its property market and prevent the risks from spilling over to other sectors of the economy. In this case, we will monitor macro and financial market dynamics and change our stance on Chinese equities if warranted (Chart 10A and 10B). Chart 10AWithout More Aggressive Stimulus, Upsides In Chinese Equity Prices Are Capped
Without More Aggressive Stimulus, Upsides In Chinese Equity Prices Are Capped
Without More Aggressive Stimulus, Upsides In Chinese Equity Prices Are Capped
Chart 10BWithout More Aggressive Stimulus, Upsides In Chinese Equity Prices Are Capped
Without More Aggressive Stimulus, Upsides In Chinese Equity Prices Are Capped
Without More Aggressive Stimulus, Upsides In Chinese Equity Prices Are Capped
Lastly, investors should be prepared for greater emphasis of common prosperity policies at the Party Congress. Reducing income inequality and improving social welfare will remain core principles of President Xi’s political agenda. Common property policies mean that there will be a continued shift towards a larger share of labor compensation versus capital in the country’s national income (Chart 11). The pandemic in the past 2.5 years has likely exacerbated the country’s income inequality and discontent among middle-class households. Chart 11Implications Of China’s Common Prosperity Policy
Implications Of China's Common Prosperity Policy
Implications Of China's Common Prosperity Policy
Arthur Budaghyan Chief Emerging Markets Strategist arthurb@bcaresearch.com Jing Sima Consulting China Strategist Strategic Themes Cyclical Recommendations
BCA Research’s China Investment Strategy service continues to hold a bearish view on the share prices of both onshore and offshore Chinese property developers in absolute terms and relative to China’s overall equity benchmark. Despite considerable…
Executive Summary The Recovery of Chinese Property Market Relies On Home Sales
The Recovery of Chinese Property Market Relies on Home Sales
The Recovery of Chinese Property Market Relies on Home Sales
Property sales, starts, developers’ total financing, and construction activity will likely continue to contract in the next three-to-six months, albeit at a slower rate. More supportive government policies will be released in the coming months, including mortgage rate cuts. It will take time for a recovery in sales and construction activity to occur, because of enormous excesses in the mainland property market/industry. Plus, China’s economy is challenged by the dynamic zero-COVID policy, a budding contraction in exports, and generally weak income growth. Property developers started to shift their business model from “pre-selling, then completing” to “completing first, selling after.” The move is a long-term positive for China’s property market by reducing financial stability risk. However, it means that the industry will take a longer time to contribute to growth in the broader economy. Bottom Line: We continue to hold a bearish view on the share prices of both onshore and offshore Chinese property developers in absolute terms and relative to China’s overall equity benchmark. A continued weakness in construction volume in the next few months implies less demand for commodities, such as iron ore, steel, cement, and glass. Chart 1Low Sentiment in Both Current and Future Income
Low Sentiment in Both Current and Future Income
Low Sentiment in Both Current and Future Income
The turmoil in China’s property market has not abated. Homebuyers remain unwilling to buy houses because of concerns over widespread sold but unfinished properties, falling confidence in future incomes, and worsening employment expectations (Chart 1). Property sales, starts, and completions have all collapsed by 25-45% from their mid-2021 peak (Chart 2 and 3). However, these variables will likely start to improve on a rate-of-change basis (i.e., the pace of contraction will moderate) in the months ahead (Chart 3). The rationale is that accelerated policy easing in the housing sector will help on the margin. Notably, policies curbing housing demand have loosened much more this year than they did in 1H2020. Plus, the authorities will introduce more accommodative real estate policy initiatives later this year and early next year, including additional mortgage rate cuts. Chart 2Property Sales, Starts, And Completions Will Further Decline In Their Level Terms…
Property Sales, Starts And Completions: Further Decline In Their Level Terms...
Property Sales, Starts And Completions: Further Decline In Their Level Terms...
Chart 3...Albeit Improving On A Rate-Of-Change Basis
...Albeit Improving On A Rate-Of-Change Basis
...Albeit Improving On A Rate-Of-Change Basis
Nevertheless, the construction industry, its suppliers, and the entire economy will take small consolation from the moderating pace of decline in the property sector. The basis for this response is that the level of activity will continue falling in the next three-to-six months, albeit at a slower rate than that of the present moment. Overall, aggressive policy easing will take time to produce a meaningful recovery in the mainland’s property market because it is occurring amid the structural breakdown in the real estate market and a confidence crisis among stakeholders. Policy Support Has Accelerated Chinese authorities have accelerated their policy initiatives in the real estate sector to restore homebuyers’ confidence and stabilize the sagging domestic property market. Chart 4The Recovery of Chinese Property Market Relies On Home Sales
The Recovery of Chinese Property Market Relies On Home Sales
The Recovery of Chinese Property Market Relies On Home Sales
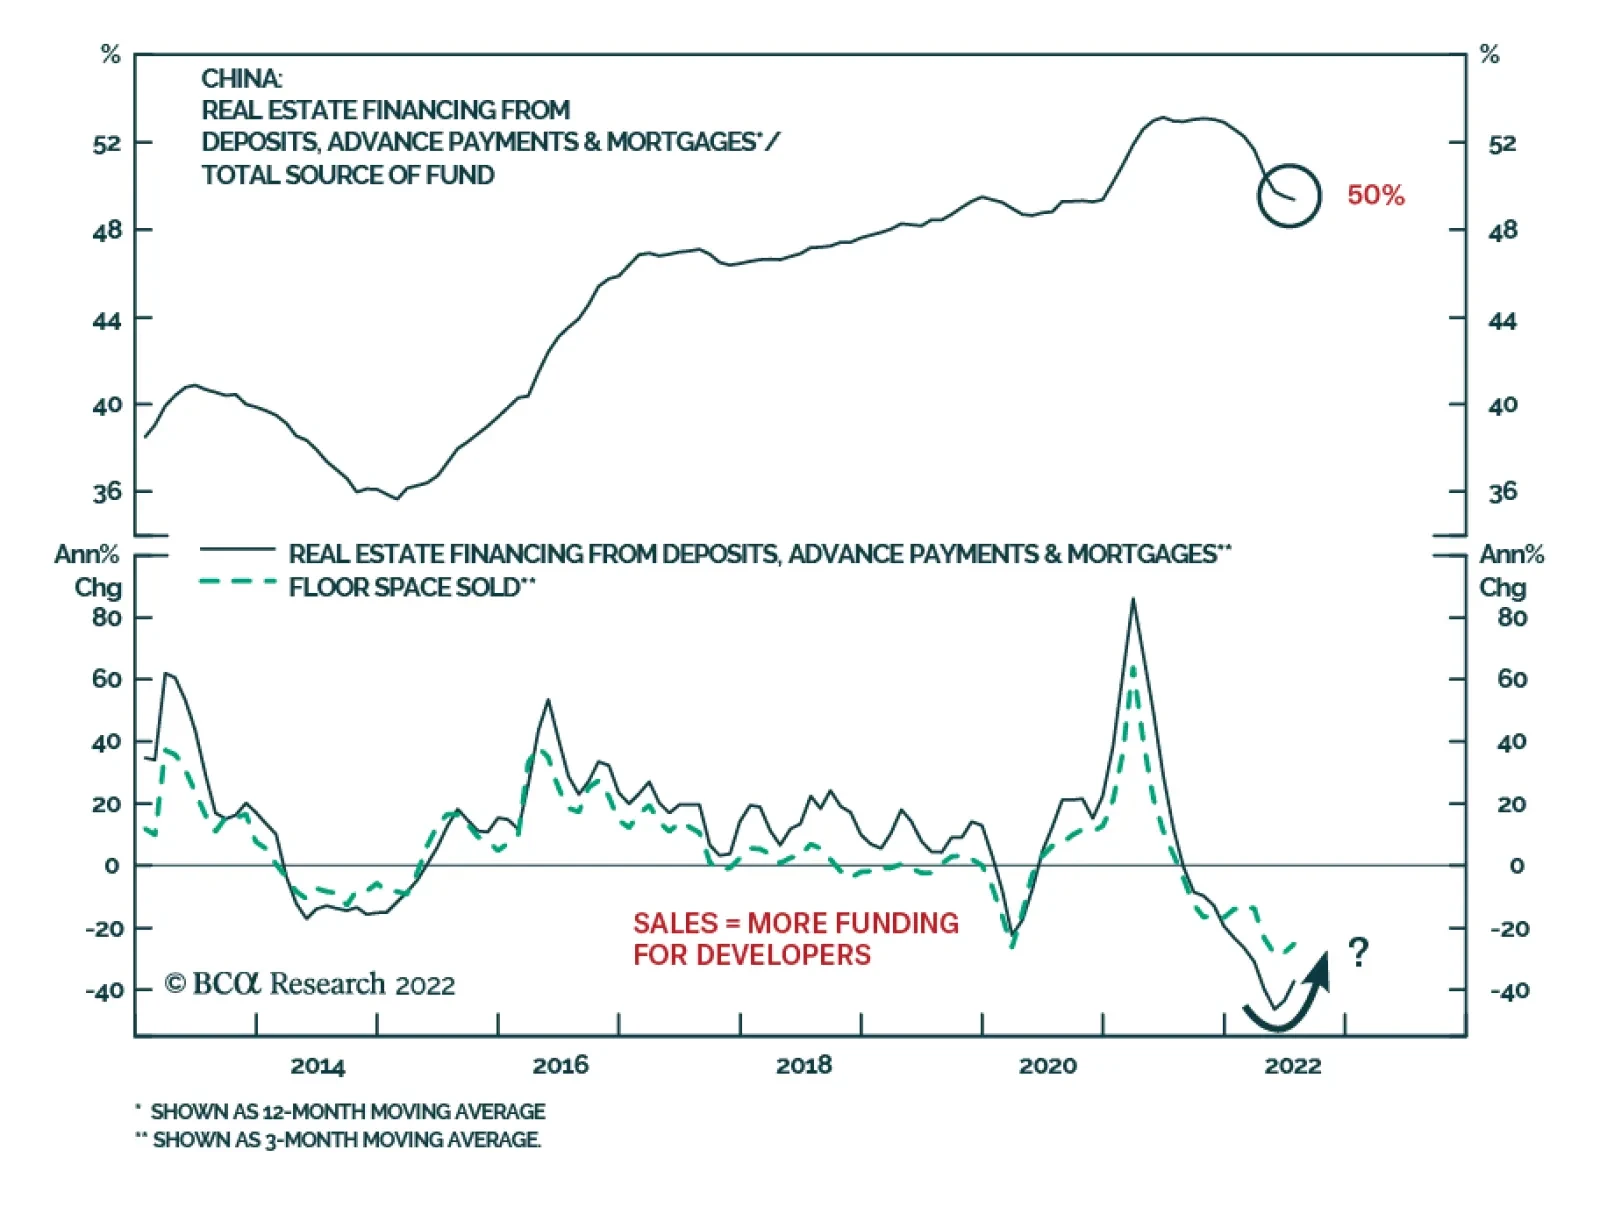
A nearly 30% year-on-year decline in floor space sold in residential commodity buildings has exacerbated a liquidity crisis among property developers. Deposits, advanced payments, and mortgage payments originating from property pre-sales, have historically contributed to about 50% of property developers’ financing (Chart 4, top panel). Hence, renewed homebuyers’ confidence and a revival in house purchases would alleviate the liquidity crunch among cash-strapped developers (Chart 4, bottom panel), who could then complete more housing units under construction. Chinese authorities have introduced an assortment of supportive housing measures, including the following: Measures To Help Complete Pre-Sold Apartments In response to the homebuyer confidence crisis, the Politburo demanded that local governments be responsible for ensuring the delivery of housing projects. Since July, at least 36 local governments in 15 provinces have released concrete policies in this respect (Box 1). Box 1 Local Governments: The Delivery Of Pre-sold Housing Units Turns into a Political Task "Pre-sale fund supervision"1 is an important policy related to "guaranteed delivery" for presold properties. Real estate development enterprises must deposit pre-sale funds into a bank's special supervision account, which can only be used for the construction of a specific project and cannot be withdrawn or used at will. Another important policy is implementing "one building, one policy" and stipulating local government involvement to resolve problems. With the support of local government, a fund required to complete an unfinished building can be raised in various ways including, but not limited to the following: 1) increasing financing from local banks or asset management companies;2 2) encouraging good SOEs or high-quality homebuilders to take over stalled projects; 3) local governments purchasing back unused land from property developers; or 4) asking desperate buyers of those pre-sold and unfinished projects to contribute additional funds.3 Last month, the authorities also established a real estate fund of initially RMB 80 billion, which was funded by China Construction Bank and the central bank. In mid-August, China introduced procedures to ensure property projects are delivered to buyers through special loans from policy banks. The amount of this special loan will be about RMB 200 billion.4 This will be also a part of the real estate fund established last month, which could potentially be increased to RMB 300-400 billion and will be used only to ensure the delivery of presold but unfinished projects. Moreover, the government started to ease policies on property developers’ onshore bond issuance. In August, Chinese regulators instructed China Bond Insurance to provide guarantees for onshore bond issuance by private property developers. We expect more policy easing on developers raising funds though bank loans and more onshore bond issuance (Chart 5). Measures To Increase Homebuyers’ Affordability The average mortgage rate has been decreased three times so far this year, falling to 4.3% for first-time home buyers. This is the lowest rate since 2009 (Chart 6). Chart 5Chinese Developers Needs More Policy Easing On Their Borrowing
Chinese Developers Needs More Policy Easing On Their Borrowing
Chinese Developers Needs More Policy Easing On Their Borrowing
Chart 6Easing Policies On Mortgage Rate
Easing Policies On Mortgage Rate
Easing Policies On Mortgage Rate
Since the beginning of this year, over 80 cities relaxed their restrictive policies on loan borrowing. Among these cities, nearly 60 lowered their down payment ratio for a first home purchase, while about 40 reduced their down payment ratio for a second home purchase.5 Local governments also offered financial support for shantytown renewal and cash rebates for home purchases. Multiple cities have also issued incentives to encourage households with second or third children to buy additional properties. Bottom Line: Authorities have ramped up their supportive housing policies in recent months. We expect more policy stimulus (e.g., another mortgage rate cut) to be announced over the next three-to-six months. Housing Turnaround Takes Time Despite considerable supportive policies in place, housing starts and construction activity will continue to contract and home prices will deflate further in the next three-to-six months. The policies will take time to work, especially ones related to ensuring the delivery of pre-sold housing. A significant amount of financing will be required for problematic projects that real estate developers are unable to build and deliver. Many local governments are also facing financial distress. Therefore, it will take time to arrange financing from third parties. Even after securing financing for incomplete housing projects, there will be delays in the construction and delivery of these units. Potential homebuyers may be willing to purchase in installments and provide funds to developers, but only if they witness increased deliveries of pre-sold homes. These funds are critical to developers as they account for about half of their total financing (Chart 4 above). The willingness to buy has been suppressed by falling confidence over future incomes, worsening future employment expectations and weakening growth of current income (Chart 1 on page 2). The willingness of households to save recently hit a record level; it is higher than during the first outbreak of COVID-19 in early 2020. Meantime, the propensity to invest has tumbled to a multi-year low (Chart 7). Chart 7More Chinese Households Intend To Save Rather Than Invest
More Chinese Households Intend To Save Rather Than Invest
More Chinese Households Intend To Save Rather Than Invest
Chart 8Property Sales In Rich Eastern Provinces: Still In A Deep Contraction
Property Sales In Rich Eastern Provinces: Still In A Deep Contraction
Property Sales In Rich Eastern Provinces: Still In A Deep Contraction
The growth of residential floor space sold in the eastern provinces often leads the rest of China (Chart 8). The Eastern provinces account for about 44% of China’s total residential floor space sales. Residential floor space sales in the Eastern provinces were still down by 30% in July. The lack of an upturn in the Eastern provinces, especially after the re-opening in Shanghai and Shenzhen, indicates that a property market recovery will not be imminent or V-shaped. Chart 9A Majority Of Key Cities Have Declining Housing Prices
A Majority Of Key Cities Have Declining Housing Prices
A Majority Of Key Cities Have Declining Housing Prices
Currently still 70% and 85% of the 70-city house price indexes are showing year-over-year price declines in newly constructed houses and secondary houses, respectively (Chart 9). Shrinking pre-sales mean less financing for homebuilders and, ultimately, contracting property investment in the next three-to-six months (Chart 10). Many developers will continue to struggle to attract sufficient financing. Hence, they must cut their starts and completions (Chart 11). Chart 10Shrinking Pre-sales Will Lead To Falling Property Investment
Shrinking Pre-sales Will Lead To Falling Property Investment
Shrinking Pre-sales Will Lead To Falling Property Investment
Chart 11Property Developers Have Been Starting And Preselling But Not Completing
Property Developers Have Been Starting And Preselling But Not Completing
Property Developers Have Been Starting And Preselling But Not Completing
High prices/low affordability, speculative behavior of both developers and homebuyers, very high leverage and risky financing schemes, large volumes of supply and high inventories and vacancies , all need to be absorbed. A dynamic zero-COVID policy, a budding contraction in exports and generally weak income growth will challenge China’s economy in general. Chart 12Insufficient Financing Will Lead To Weaker Construction Activity Ahead
Insufficient Financing Will Lead To Weaker Construction Activity Ahead
Insufficient Financing Will Lead To Weaker Construction Activity Ahead
Bottom Line: The authorities’ supportive policies will take time to relieve the liquidity crisis among property developers and boost sentiment among homebuyers. Property sales, starts, developers’ total financing and construction activity will likely continue to contract in the next three-to-six months, albeit at a slower rate (Chart 12). A Structural Shift In Developers’ Business Model Chinese property developers started to shift their business model from “preselling, then completing” to “completing first, selling after.” The move is a long-term positive for China’s property market. It will lower the leverage of and curb real estate assets hoarding by developers and, thereby, improve stability in the industry. The old model of “preselling then completing” is not sustainable. In the past decade, Chinese real estate developers aggressively pursued a business model of “buying land, quickly starting property projects, and preselling unfinished homes but not completing them.”6 Chart 13A Structural Shift In Developers' Business Model
A Structural Shift In Developers' Business Model
A Structural Shift In Developers' Business Model
As this model was essentially raising funds via launching property starts despite shrinking completions (Chart 13, top panel), it has resulted in a significant increase in Chinese property developers’ liabilities and unfinished construction carried on the balance sheet of developers. In short, as we have argued before, real estate developers have been involved in a massive carry trade. This is one of the root causes of the current crisis in China’s real estate sector. With this business model, developers carried real estate assets (land and started properties) on their balance sheets to benefit from the positive “carry”; i.e., the difference between the cost of funding and real estate asset price appreciation. However, the carry has turned negative as property asset prices are now flat or deflating rather than rising at double-digit rates. Hence, developers are under pressure to liquidate their assets and reduce their debts. Yet, to sell their not-pre-sold housing projects that are under construction, they first need new funds to complete unfinished homes before they can be sold. Furthermore, both the “three-red lines” policy for property developers and the new bank lending regulations limiting lending to the real estate sector – both put into effect in H2 2020 – remain in place. This means that Chinese real estate developers have no choice but to change their business model to a more sustainable one – the one with more sales coming from existing properties instead of pre-sales. The new model of “completing first, selling after” is a sustainable one. Homebuyers fear buying unfinished houses, preferring existing ones. Critically, increasing sales of existing houses will provide extra funds to debt-laden builders. In contrast, delivery of pre-sold units does not generate new cash for developers because most cash are received long before completion of a dwelling. Facing a liquidity crunch, there is no incentive for developers to complete pre-sold units. Chart 13 shows such a shift has been underway since mid-2021. Sales of completed houses increased considerably, while properties sold in advance plummeted. This trend also reflects a rising preference among homebuyers for completed properties. Buyers can visit and check the quality of a construction-completed unit versus paying for a future unknown unit. Meanwhile, property developers’ leverage will decline with this new business model. A caveat is that less financing from pre-sales means that developers will have a diminished ability to complete projects already started, and that they also need to reduce land purchases and land hoarding. Local government financing will remain tight as land sales account for 23% of local government aggregate expenditure. This will have negative ramifications on infrastructure spending. Bottom Line: Chinese real estate developers have begun shifting from an unsustainable and high-leverage business model to a new way of operating by which sales of completed properties will be prioritized at the expense of falling pre-sales. This will reduce financial stability risks in the future. Investment Implications We expect a continued decline in property sales, starts, completions, and property price deflation in the next three-to-six months. Thus, we maintain our bearish view of both onshore and offshore Chinese property developers’ share prices in absolute terms and relative to China’s overall equity benchmark (Chart 14). Construction volume will be persistently weak in the coming months, which means less demand for commodities, such as iron ore, steel, cement, and glass. Hence, we expect prices for those commodities to drop further in the near run (Chart 15). Chart 14Chinese Property Developers' Stocks: Structural Breakdown
Chinese Property Developers' Stocks: Structural Breakdown
Chinese Property Developers' Stocks: Structural Breakdown
Chart 15Bearish On Prices Of Construction-related Commodities
Bearish On Prices Of Construction-related Commodities
Bearish On Prices Of Construction-related Commodities
Ellen JingYuan He Associate Vice President ellenj@bcaresearch.com Footnotes 1 Supervision of pre-sale funds of presold properties refers to the third-party supervision of such funds by the real estate administrative department in conjunction with the bank. 2 This year, at least six asset management companies injected funds into stalled property projects. So far, the total funds raised for three projects amounts to RMB 17 billion. Source: https://m.huxiu.com/article/644633.html?f=rss 3 Desperate buyers face two options: either add funds to build an unfinished home or continue to wait for an indeterminate period. Buyers tend to increase funds to enable the resumption of construction. 4 Source: https://www.bloomberg.com/news/articles/2022-08-22/china-plans-29-billion-in-special-loans-to-troubled-developers 5 Source: https://news.stcn.com/sd/202208/t20220826_4822460.html 6 Please see China Investment Strategy Special Reports "China’s Property Market: Making Sense Of Divergences," dated May 9, 2019, and "China: Is The Property Carry Trade Over?" dated October 28, 2021, available at cis.bcaresearch.com Strategic Themes Cyclical Recommendations
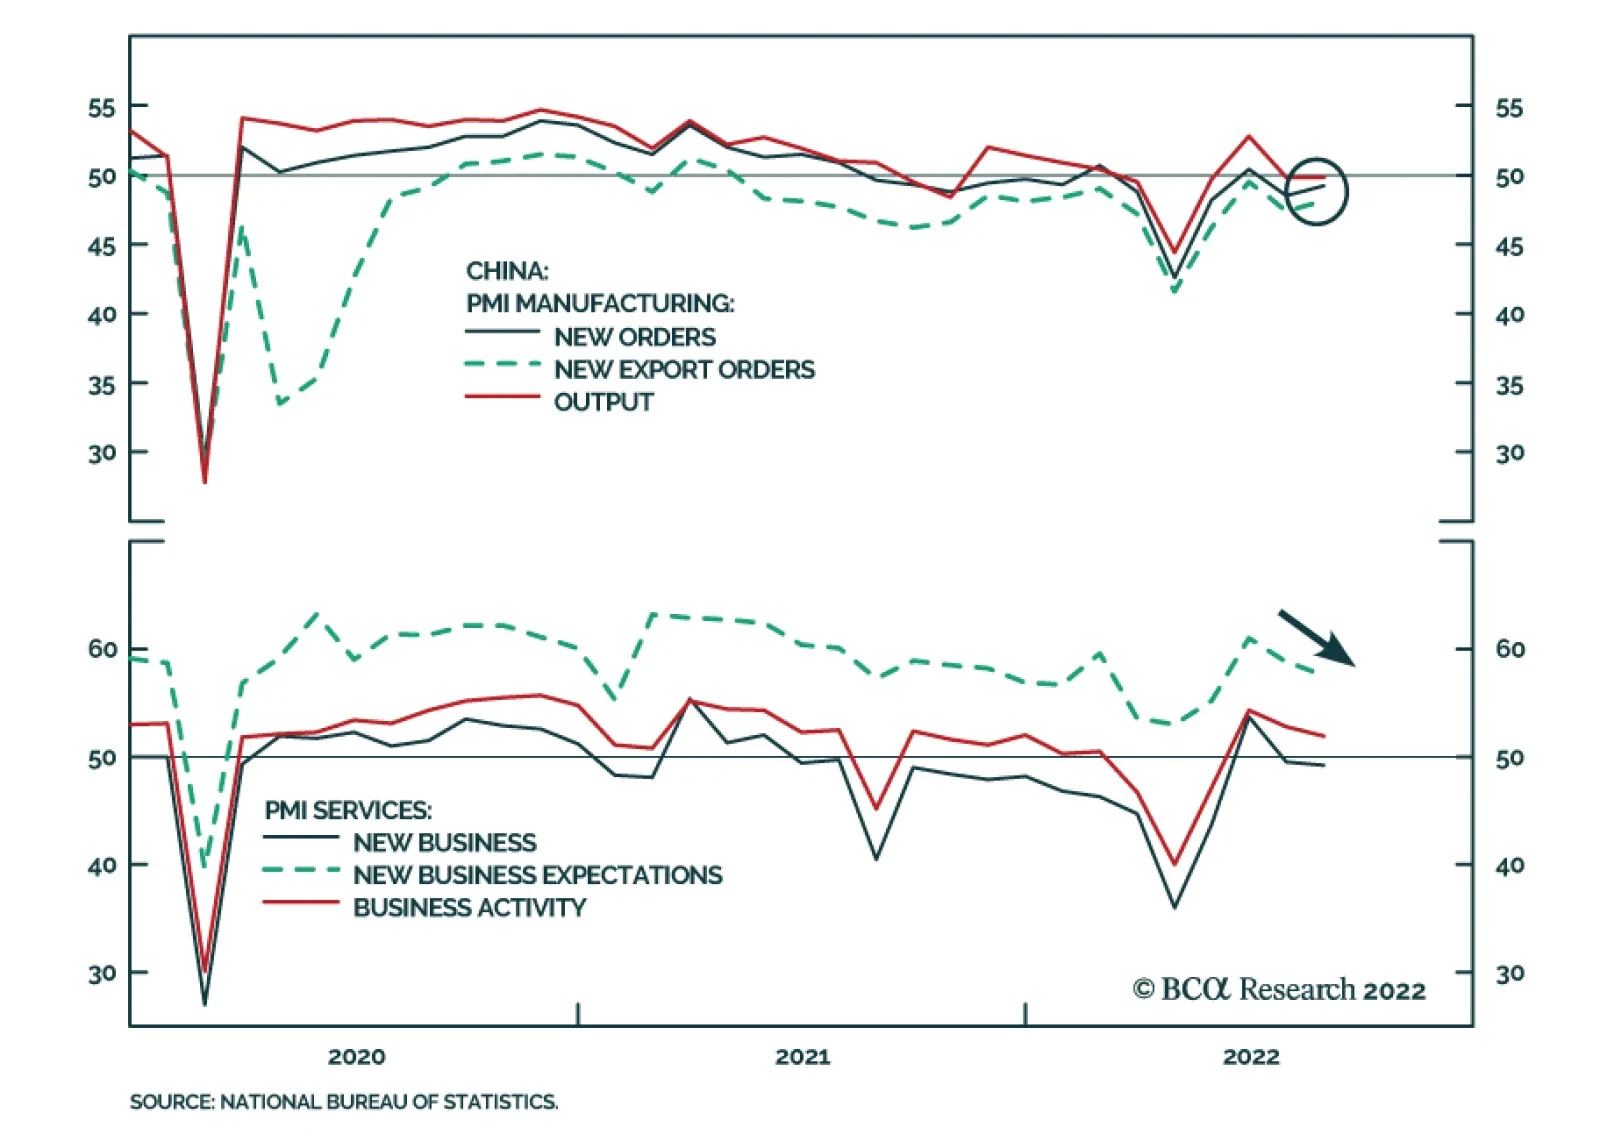
Chinese PMIs from the National Bureau of Statistics surprised to the upside in August. Although the manufacturing PMI remains in contractionary territory, it ticked up from 49.0 to 49.4, slightly above expectations of 49.2. Meanwhile, the nonmanufacturing PMI…