China

Highlights The US dollar’s reserve status will remain intact for the foreseeable future. While this privilege is fraying at the edges, there are no viable alternatives just yet. There is an overarching incentive for any country to hold onto its currency’s power. For the US, it is still well within their ability to keep this “exorbitant privilege.” That said, there will be rolling doubts about the ability of the US to maintain its large currency sphere. This will create tidal waves in the currency’s path, providing plenty of trading opportunities for investors. China is on track to surpass the US in economic size, but it is far from dethroning the US in the military realm. However, it is gradually gaining the ability to deny the US access to its immediate offshore areas and may already be capable of winning a war over nearby islands like Taiwan. Watch the RMB over the next few decades. From a macro and cyclical perspective, the dollar is likely to decline as global growth picks up and the Fed lags market expectations in raising rates. From a geopolitical perspective, however, the backdrop is neutral-to-bullish for the dollar over the next three to five years. Feature Having the world’s reserve currency comes with a few advantages, which any governments would be loath to give up. The most important advantage is the ability to settle one’s balance of payments in one’s own currency. This not only facilitates trade for the reserve nation, it also reinforces the turnover of the reserve currency internationally. The value of this privilege is as much symbolic as economic. This “first mover advantage” or adoption of one’s currency internationally automatically ordains the resident central bank as the world’s bank. The primary advantage here is being able to dictate global financial conditions, expanding and contracting money supply to address domestic and global funding pressures. As compensation for this task, the world provides one with non-negligible seigniorage revenue. Being the world’s central bank also comes with another crucial advantage: being able to choose which international projects will be funded, while using cheaply issued local debt to finance these investments. Of course, any sensible society will earn more on its investments than it pays on the debt issued. There is a geopolitical angle to having the world’s reserve currency. A nation’s currency is widely held because of strategic depth—its ability to secure the people who trade in that currency and the property denominated in it. Deposits and transactions can be monitored, secured, or even halted at the behest of the sovereign. Holding the currency means one can maintain one’s purchasing power, given that it is backed by the most powerful country in the world. As the reserve currency becomes the de facto international medium of exchange, having stood the test of time through various crises, this allows the resident country to alter its purchasing power to achieve both national and international goals. Throughout history, having the world’s reserve currency has been the pursuit of many governments and kingdoms. In the current paradigm, the US enjoys this privilege. But could that change? And if so, how and when? Our goal in this report is threefold. First, why would any country want to maintain reserve status? Second, does the US still possess the apparatus to keep the dollar as a reserve asset over the next decade? And finally, are there any identifiable threats to the US dollar reserve status beyond a ten-year horizon? The Imperative To Maintain Status Quo Global trade is still largely conducted in US dollars. According to the BIS triennial central bank survey, 88.3% of transactions globally were in dollars just before the pandemic, a percentage that has been rather resilient over the last two decades (Chart I-1). It is true that currencies such as the Chinese renminbi have been gaining international acceptance, but displacing a currency that dominates almost 90% of global transactions is a herculean task. Surprisingly, the world has been transacting less often in euros and Japanese yen, currencies that also commanded international appeal in recent history. Chart I-1The US Dollar Still Dominates Global Transactions
Is The Dollar’s Reserve Status Under Threat?
Is The Dollar’s Reserve Status Under Threat?
The big benefit for the US comes from being able to settle its balance of payments in dollars. This not only lowers transaction costs (by lowering exchange rate risk), but it also provides the ability to cheaply borrow in your own currency to pay for imports. Having global trade largely denominated in US dollars also establishes a network of systems that make it much easier to settle trade in that currency. It is remarkable that, despite running a persistent current account deficit, the US dollar has tended to appreciate during crises, a privilege other deficit countries do not enjoy (Chart I-2). Strong network effects make the US dollar the currency of choice during crises. Chart I-2Despite Running A Current Account Deficit, The Dollar Tends To Rise During Crises
Is The Dollar’s Reserve Status Under Threat?
Is The Dollar’s Reserve Status Under Threat?
Chart I-3The US Generates Non-Negligible Seignorage Revenue
The US Generates Non-Negligible Seignorage Revenue
The US Generates Non-Negligible Seignorage Revenue
Being at the center of the global financial architecture comes with an important benefit beyond trade: the ability to dictate financial conditions both domestically and globally. Consider a scenario in which the US and the global economy are facing a downturn. In this scenario, the Federal Reserve can be instrumental in turning the tide: To stimulate the US economy, the Fed lowers interest rates and/or runs a wider fiscal deficit. The central bank helps finance this fiscal deficit by expanding the monetary base (benefitting from seigniorage revenue). As the Fed drops interest rates, the yield curve steepens. Banks use the positive term structure to borrow at the short end of the curve and lend at the longer end. This boosts the US money supply. As firms borrow to invest, this increases demand for imports (machinery, commodities, consumer goods), widening the US current account deficit. US trade is settled in dollars, increasing the international supply of the greenback. To maintain competitiveness, other central banks purchase these dollars from the private sector, in exchange for their local currency. As global USD reserves rise, they can be reinvested back into Treasuries and held in custody at the Fed. In essence, the US can finance its budget deficit through a strong capital account surplus. The seigniorage revenue that the US enjoys by easing both domestic and international financing conditions is about $100 billion a year or roughly 0.5% of GDP (Chart I-3). But the goodwill from being able to dictate both domestic and international financial conditions is far greater. At BCA, one of our favorite measures of global dollar liquidity is the sum of the Fed’s custody holdings together with the US monetary base. Every time this measure has severely contracted in the past, the shortage of dollars has triggered a financial crisis somewhere, typically among other countries running deficits (Chart I-4), a highlight of the importance of the US as a global financier. Chart I-4US Money Supply And Global Liquidity
US Money Supply And Global Liquidity
US Money Supply And Global Liquidity
Chart I-5Despite A Liability Shortfall, US Assets Generate A Net Profit
Despite A Liability Shortfall, US Assets Generate A Net Profit
Despite A Liability Shortfall, US Assets Generate A Net Profit
Beyond seigniorage revenue, the US enjoys another advantage—being able to earn much more on its international investments than it pays on its liabilities. The US generates an excess return of 1% of GDP from its external assets, despite having a net liability shortfall of 67% of GDP (Chart I-5). The ability to issue debt that will be gobbled up by foreigners, and in part use these proceeds to generate a higher overall return on investments made abroad, does indeed constitute an “exorbitant privilege.” In a nutshell, there is a very strong incentive for the US to keep the dollar as the world’s reserve currency. One short-term implication is that the Fed might only taper asset purchases and/or raise interest rates in an environment in which both global and US growth are strong, or it could otherwise trigger a global liquidity crisis. This will be particularly the case given the Delta variant of COVID-19 is still hemorrhaging global economic activity. An Overreach In The Dollar’s Influence There is a political advantage to the US dollar’s reserve status that is often overlooked: transactions conducted in US dollars anywhere in the world fall under US law. In simple terms, if a company in any country buys energy from Iran and the transaction is done in US dollars, the Treasury has powers to sanction the parties involved. Since most companies across the world cannot afford to be locked out of the US financial system, they will tend to comply with US sanctions. Even companies that operate under the umbrella of great powers, such as China and Russia, still tend to adhere to US sanctions, because they do not want to jeopardize their trade with US allies, such as the European Union. Of course, China, Russia, and Iran are actively seeking alternative transaction systems to bypass the dollar and US sanctions. But they do not yet trust each other’s currencies. Chart I-6A Deep And Liquid Pool Of Treasurys
A Deep And Liquid Pool Of Treasurys
A Deep And Liquid Pool Of Treasurys
The euro is the only viable alternative; however, the euro’s share of global transactions has fallen, despite the EU’s solidification as a monetary union over the past decade and despite the unprecedented deterioration of US relations with China and Russia. The EU could do great damage to the USD’s standing if it joined Russia’s and China’s efforts wholeheartedly, but the EU is still a major trading partner of the US and shares many of the same foreign policy aims. It is also chronically short of aggregate demand and runs trade and current account surpluses, depriving trade partners of euro savings or a debt market to recycle those savings (Chart I-6). Historically, having the world’s reserve currency allows the US to conduct international accords that serve both domestic and foreign interests. The Plaza Accord, signed in the 1980s to depreciate the US dollar, served both US interests in rebalancing the deficit and international interests in financing global trade. The 1980s were golden years for Japan and the Asian tigers on the back of a weak USD, allowing entities to borrow in greenbacks and profitably invest in Asian growth. Once the US dollar had depreciated by a fair amount, threatening its store of value, the US engineered the Louvre Accord to stabilize exchange rates. Ultimately, when various Asian bubbles popped, investors thought of nowhere better to flee than to the safety of the US dollar. The same thing happened after the emerging market boom of the 2000s and the eventual bust of the 2010s. Today, the US may not be able to organize an international intervention, if one should be necessary in the coming years. Past experience shows that countries act unilaterally and coordinated interventions lack staying power. Neither Europe nor Japan is in the position today to allow currency appreciation, as they were in the past. And the US has shown itself unable to combat its trading partners’ depreciation, as in the case of China, whose renminbi remains below 2014 levels. The bottom line is that there is nothing to stop the US from attempting to stretch its overreach too far, which would create a backlash that diminishes the dollar’s status. This is especially the case given trust in the US government is quite low by historical standards, which for now points to a lower dollar cyclically (Chart I-7). Chart I-7Trust In The US Government And The Dollar
Is The Dollar’s Reserve Status Under Threat?
Is The Dollar’s Reserve Status Under Threat?
This is not to say that other countries with reserve aspirations can tolerate sustained appreciation. China has recommitted to manufacturing supremacy in its latest five-year plan, as it fears the political consequences of rapid deindustrialization. As such, the renminbi will be periodically capped to maintain competitiveness. Can The US Maintain Status Quo? Chart I-8A Lifespan Of Reserve Currencies
Is The Dollar’s Reserve Status Under Threat?
Is The Dollar’s Reserve Status Under Threat?
Over the last few centuries, reserve currencies have tended to have a lifespan of about 100 years (Chart I-8). The reason is that global wars tend to knock the leading power off its geopolitical pedestal, devaluing its currency and giving rise to a new peace settlement with a new ascendant country whose currency then becomes the basis for international trade. Such was the case for Spain, France, the UK, and the United States in a pattern of war and peace since the sixteenth century. Granting that the US dollar took the baton from sterling in the 1920s and that the post-World War II peace settlement is eroding in the face of escalating geopolitical competition, it is reasonable to ask whether or not the US might lose its grip on this power. To assess this possibility, it is instructive to revisit the anatomy of a reserve currency: Typically, a reserve currency tends to be that of the “greatest” nation. For the same reason, the reserve nation tends to be the wealthiest, which ensures that its currency is a store of value and that it can act as a buyer of last resort during crisis (Chart I-9). This reasoning is straightforward when a global empire is recognizable and unopposed. But in the current context of multipolarity, or great power competition, the paradigm could start to shift. Global trade is slowing globally, but it is accelerating in Asia (Chart I-10). China is a larger trading partner than the US for many emerging markets and is slated to surpass the US economy over the next decade. The renminbi has a long way to go to rival the dollar, but it is gradually rising and its place within the global reserve currency basket is much smaller than its share of global trade or output, implying room for growth (Chart I-11). Chart I-9Wealth And Reserve Currency Status Go Hand-In-Hand
Is The Dollar’s Reserve Status Under Threat?
Is The Dollar’s Reserve Status Under Threat?
Chart I-10Trade In Asia Is Booming
Is The Dollar’s Reserve Status Under Threat?
Is The Dollar’s Reserve Status Under Threat?
Chart I-11Adoption Of The RMB Has Room To Grow
Adoption Of The RMB Has Room To Grow
Adoption Of The RMB Has Room To Grow
To maintain hegemonic power (especially controlling the vital supply routes of prosperity), the reserve nation needs military might above and beyond everyone else. It helps that US military spending remains the biggest in the world, in part financed by US liabilities (Chart I-12). China is far from dethroning the US in the military realm. But it is gradually gaining the ability to deny the US access to its immediate offshore areas and may already be capable of winning a war over nearby islands like Taiwan. Moreover, its naval power is set to grow substantially between now and 2030 (Table I-1). Already, over the past decade, the US stood helplessly by when Russia and China annexed Crimea and the reefs of the South China Sea. It is possible to imagine a series of events that erode US security guarantees in the region, even as the US loses economic primacy. Chart I-12The US Still Maintains Military Might
Is The Dollar’s Reserve Status Under Threat?
Is The Dollar’s Reserve Status Under Threat?
Table I-1China’s Economic And Naval Growth Slated To Reduce American Primacy In Asia Pacific
Is The Dollar’s Reserve Status Under Threat?
Is The Dollar’s Reserve Status Under Threat?
The reserve currency nation needs to run deficits to finance activity in the rest of the world. That requires having deep and liquid capital markets to absorb global savings. There is considerable trust or “goodwill” that makes the US Treasury market the most liquid debt exchange pool in the world. This remains the case today (previously mentioned Chart I-6). Even so, this trend is shifting. The growth in euro- and yen-denominated debt is exploding. This mirrors the gradual shift in the allocation of FX reserves away from dollars into other currencies. If the US began to use the dollar as a geopolitical weapon recklessly, foreign entities may have no other choice but to rally into other currency blocks, including the euro (and perhaps eventually the yuan). This will take years, but it is worth noting that global allocation to FX reserves have fallen from around 80% toward USDs in the 70s to around 60% today (Chart I-13). Chart I-13The Dollar Reserve Status Has Been Ebbing
The Dollar Reserve Status Has Been Ebbing
The Dollar Reserve Status Has Been Ebbing
On the political front, there is some evidence that public opinion on the dollar is fading, although it is far from damning. A Pew survey on the trust in the US government is near decade lows and has tracked the ebb and flow of changes in the dollar (previously shown Chart I-7). Trust in government will probably not get much worse in the coming years, as the pandemic will wane and stimulus will secure the economic recovery, but too much stimulus could conceivably ignite an inflation problem that weighs on trust. True, populism has driven the US government under two administrations into extreme deficit spending. With the pandemic as a catalyst, US deficits have reached WWII levels despite the absence of a war. However, the Biden administration’s $3.5 trillion spending bill will be watered down heavily – and the 2022 midterms will likely restore gridlock in Congress, freezing fiscal policy through at least 2025. In other words, fiscal policy is negative for the dollar in the very near term, but the fiscal outlook is not yet so extravagant as to suggest a loss of reserve currency status. After all, there is some positive news for the US. The US demonstrated its leadership in innovation with the COVID-19 vaccines; it survived its constitutional stress test in the 2020 election; it is now shifting from failed “nation building” abroad to nation building at home; and its companies remain the most innovative and efficient, judging by global equity market capitalization (Chart I-14). China, meanwhile, is facing the most severe test of its political and economic system since it marketized its economy in 1979. Investors should not lose sight of the fact that, since the rise of President Xi Jinping and Russia’s invasion of Ukraine, global policy uncertainty has tended to outpace US policy uncertainty, attracting flows into the dollar (Chart I-15). Given that China and Russia are both pursuing autocratic governments at the expense of the private economy, it would not be surprising to see global policy uncertainty take the lead once again, confirming the decade trend of global flows favoring the US when uncertainty rises. Chart I-14American Primacy Still Clear In Equity Market
American Primacy Still Clear In Equity Market
American Primacy Still Clear In Equity Market
Chart I-15Higher Policy Uncertainty Good For Dollar
Higher Policy Uncertainty Good For Dollar
Higher Policy Uncertainty Good For Dollar
The bottom line is that the US dollar is gradually declining as a share of the global currency reserve basket, just as the US economy and military are gradually declining as a share of global output and defense spending. Yet the US will remain the first or second largest economy and premier military power for a long time, and the dollar still lacks a viable single replacement. A major war or geopolitical crisis is probably necessary to precipitate a major breakdown. The Iranian Revolution and September 11 attacks both had this kind of effect (see 1979 and 2001 in Chart I-13 above). But COVID-19 is less clear. If China and Europe emerge as more stable than the US, then the post-pandemic aftermath will bring more bad news for the dollar. Investment Implications From a geopolitical perspective, the backdrop is neutral for the dollar beyond the next twelve to eighteen months. An escalating conflict with Iran—which is possible in the near term—would echo the early 2000s and weigh on the currency. But a deal with Iran and a strategic pivot to Asia would compound China’s domestic political problems and likely boost the greenback. Chart I-16US Twin Deficits And The Dollar
US Twin Deficits And The Dollar
US Twin Deficits And The Dollar
From a macro and cyclical perspective, however, the view is clearly negative for the dollar. Over the next five years, the U.S. Congressional Budget Office (CBO) estimates that the U.S. budget deficit will shrink and then begin expanding again to -5% of GDP. If one assumes that the current account deficit will widen somewhat, then stabilize, the twin deficits will be pinned at around -10% of GDP. Markets have typically punished the dollar on rising twin deficits (Chart I-16). This suggests near-term pressure on the dollar’s reserve status is to the downside. EM currencies may hold a key to the performance of the dollar. While most EM economies remain hostage to the virus, a coiled-spring rebound cannot be ruled out as populations become vaccinated. China’s Politburo signaled in July that it will no longer tighten monetary and fiscal policy. We would expect policy easing over the next twelve months to ensure the economy is stable in advance of the fall 2022 party congress. If the virus wanes and China’s economy is stimulated, global growth will improve and the dollar will fall. Chester Ntonifor Foreign Exchange Strategist chestern@bcaresearch.com Matt Gertken Geopolitical Strategist mattg@bcaresearch.com
BCA Research's Geopolitical Strategy and Commodity & Energy Strategy services have published a Special Report that argues that commodity markets will face growing supply challenges over the next decade as the competition between the US and China…
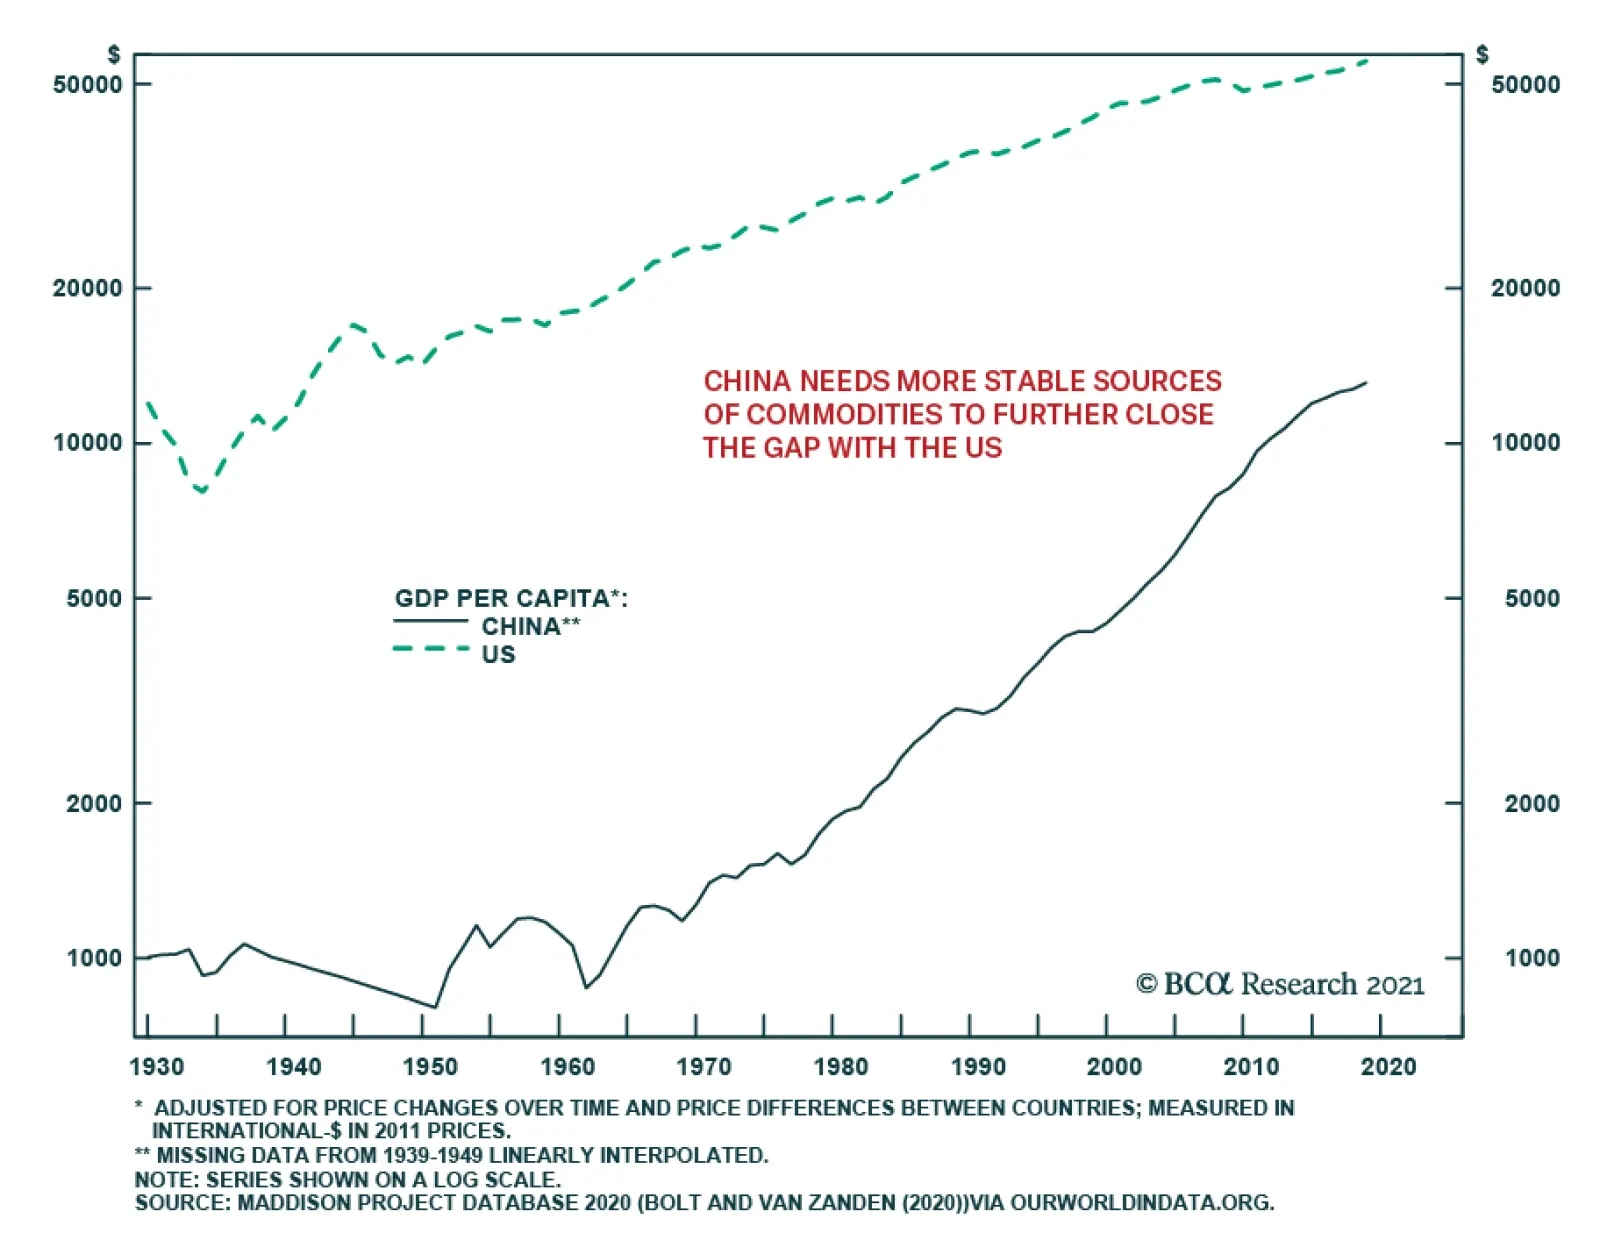
Highlights Commodity markets will face growing supply challenges over the next decade as the US and China prepare for war, if only to deter war. Chinese President Xi Jinping's push for greater self-reliance at home and supply chain security abroad is reinforced by the West’s focus on the same interests. The erosion of a single rules-based global trade system increases the odds of economic and even military conflict. The competition for security is precipitating a reforging of global supply chains and a persistent willingness to use punitive measures, which can escalate into boycotts, embargoes, and even blockades (i.e. not only Huawei). The risk of military engagements will rise, particularly along global chokepoints and sea lanes needed to transport vital commodities. Import dependency and supply chain risk are powerful drivers of decarbonization efforts, especially in China. On net, geopolitical trends will keep the balance of commodity-price risks tilted to the upside. Commodity and Energy Strategy remains long commodity index exposure on a strategic basis via the S&P GSCI and the COMT ETF. Note: Even in the short term, a higher geopolitical risk premium is warranted in oil prices due to US-Iran conflict. Feature The Chinese Communist Party (CCP) under President Xi Jinping has embarked on a drive toward autarky, or economic self-sufficiency, that has enormous implications, especially for global commodities. Beijing believes it can maintain central control, harness technology, enhance its manufacturing prowess, and grow at a reasonable rate, all while bulking up its national security. The challenge is to maintain social stability and supply security through the transition. China lives in desperate fear of the chaos that reigned throughout most of the twentieth and twenty-first centuries, which also enabled foreign domination (Chart 1). The problem for the rest of the world is that Chinese nationalism and assertive foreign policy are integral aspects of the new national strategy. They are needed to divert the public from social ills and deter foreign powers that might threaten China’s economy and supply security. Chart 1China Fears Any Risk Of Another ‘Century Of Humiliation’
US-China: War Preparation Pushes Commodity Demand
US-China: War Preparation Pushes Commodity Demand
The chief obstacle for China is the United States, which remains the world leader even though its share of global power and wealth is declining over time. The US is formally adopting a policy of confrontation rather than engagement with China. For example, the Biden administration is co-opting much of the Trump administration's agenda. Infrastructure, industrial policy, trade protectionism, and the “pivot to Asia” are now signature policies of Biden as well as Trump (Table 1).1 Table 1US Strategic Competition Act Highlights Return Of Industrial Policy, Confrontation With China
US-China: War Preparation Pushes Commodity Demand
US-China: War Preparation Pushes Commodity Demand
Many of these policies are explicitly related to the strategic aim of countering China’s rise, which is seen as vitiating the American economy and global leadership. Biden’s Trump-esque policies are a powerful indication of where the US median voter stands and hence of long-term significance (Chart 2). Thus competition between the US and China for global economic, military, and political leadership is entering a new phase. China’s drive for self-reliance threatens the US-led global trade system, while the US’s still-preeminent geopolitical power threatens China’s vital lines of supply. Chart 2US Public’s Fears Are China-Centric
US-China: War Preparation Pushes Commodity Demand
US-China: War Preparation Pushes Commodity Demand
Re-Ordering Global Trade The US’s and China’s demonstrable willingness to use tariffs, non-tariff trade barriers, export controls, and sanctions cannot be expected to abate given that they are locked in great power competition (Chart 3). More than likely, the US and China will independently pursue trade relations with their respective allies and partners, which will replace the mostly ineffective World Trade Organization (WTO) framework. The WTO is the successor to the rules-based and market-oriented system known as the General Agreement on Tariffs and Trade (GATT), which was formed following World War II. The GATT’s founders shared a strong desire to avoid a repeat of the global economic instability brought on by World War I, the Great Crash of 1929, and the retreat into autarky and isolationism that led to WWII. Chart 3US and China Imposing Trade Restrictions
US and China Imposing Trade Restrictions
US and China Imposing Trade Restrictions
This inter-war period saw domestically focused monetary policies and punishing tariffs that spawned ruinous bouts of inflation and deflation. Minimizing tariffs, leveling the playing field in trading markets, and reducing subsidization of state corporate champions were among the GATT's early successes. The WTO, like the GATT before it, has no authority to command a state to change its economy or the way it chooses to organize itself. At its inception the GATT's modus vivendi was directed at establishing a rules-based system free of excessive government intrusion and regulation. If governments agreed to reduce their domestic favoritism, they could all improve their economic efficiency while avoiding a relapse into autarky and the military tensions that go with it.2 The prime mover in the GATT's founding and early evolution – the USA – firmly believed that exclusive trading blocs had created the groundwork for economic collapse and war. These trading blocs had been created by European powers with their respective colonies. During the inter-war years the revival of protectionism killed global trade and exacerbated the Great Depression. After WWII, Washington was willing to use its power as the global hegemon to prevent a similar outcome. Policymakers believed that European and global economic integration would encourage inter-dependency and discourage protectionism and war. The fall of the Soviet Union reinforced this neoliberal Washington Consensus. Countries like India and China adopted market-oriented policies. The WTO was formed along with a range of global trade deals. Ultimately the US and the West cleared the way for China to join the trading bloc, hoping that the transition from communism to capitalism would eventually be coupled with social and even political liberalization. The world took a very different turn as the United States descended into a morass of domestic political divisions and foreign military adventures. China seized the advantage to expand its economy free of interference from the US or West. The West failed to insist that liberal economic reforms keep pace.3 Moreover, when China joined the WTO in 2001, the organization was in a state of "regulatory stalemate," which made it incapable of dealing with the direct challenges presented by China.4 Today President Xi has consolidated control over the Communist Party and directs its key economic, political, and military policymaking bodies. He has deepened party control down to the management level of SOEs – hiring and firing management. SOEs have benefited from Xi’s rule (Chart 4). But now the West is also reasserting the role of the state in the economy and trade, which means that punitive measures can be brought to bear on China’s SOEs. Chart 4State-Owned Enterprises Benefit From Xi Administration
State-Owned Enterprises Benefit From Xi Administration
State-Owned Enterprises Benefit From Xi Administration
What Comes After The WTO? The CCP has shown no interest in coming around to the WTO's founding beliefs of government non-interference in the private sector. For example, it is doubling down on subsidization and party control of SOEs, which compete against firms in other WTO member states. Nor has the party shown any inclination to accept a trade system based on the GATT/WTO founding members' Western understanding of the rule of law. These states represent market-based economies with long histories of case law for settling disputes. Specifically, China’s fourteenth five-year plan and recent policies re-emphasize the need to upgrade the manufacturing sector rather than rebalancing the economy toward household consumption. The latter would reduce imbalances with trade deficit countries like the US but China is wary of the negative social consequences of too rapidly de-industrializing its economy. It wants to retain its strategic and economic advantage in global manufacturing and it fears the social and political consequences of fully adopting consumer culture (Chart 5). Chart 5China’s Economic Plans Re-Emphasize Manufacturing, Not Consumption
US-China: War Preparation Pushes Commodity Demand
US-China: War Preparation Pushes Commodity Demand
The US, EU, and Japan have proposed reform measures for the WTO aimed at addressing “severe excess capacity in key sectors exacerbated by government financed and supported capacity expansion, unfair competitive conditions caused by large market-distorting subsidies and state owned enterprises, forced technology transfer, and local content requirements and preferences.”5 But these measures are unlikely to succeed. China disagrees with the West’s characterization. In 2018-19, during the trade war with the US, Beijing contended that WTO members must “respect members’ development models.” China formally opposes “special and discriminatory disciplines against state-owned enterprises in the name of WTO reform.”6 In bilateral negotiations with the US this year, China’s first demand is that the US not to oppose its development model of “socialism with Chinese characteristics” (Table 2). Table 2China’s Three Diplomatic Demands Of The United States (2021)
US-China: War Preparation Pushes Commodity Demand
US-China: War Preparation Pushes Commodity Demand
Yet it is hard for the US not to oppose this model because it involves Beijing using the state’s control of the economy to strengthen national security strategy, namely by the fusion of civil and military technology. Going forward, the Biden administration will violate the number one demand that Chinese diplomats have made: it will attempt to galvanize the democracies to put pressure on China’s development model. China’s demand itself reflects its violation of the US primary demand that China stop using the state to enhance its economy at the expense of competitors. If a breakdown in global trading rules is replaced by the US and China forming separate trading blocs with their allies and partners, the odds of repeating the mistakes of the inter-bellum years of 1918-39 will significantly increase. Tariff wars, subsidizing national champions, heavy taxation of foreign interests, non-tariff barriers to trade, domestic-focused monetary policies, and currency wars would become more likely. China’s Strategic Vulnerability The CCP has delivered remarkable prosperity and wealth to the average Chinese citizen in the 43 years since it undertook market reforms, and especially since its accession to the WTO in 2001 (Chart 6). China has transformed from an economic backwater into a $15.4 trillion (2020) economy and near-peer competitor to the US militarily and economically.7 This growth has propelled China to the top of commodity-importing and -consuming states globally for base metals and oil. We follow these markets closely, because they are critical to sustaining economic growth, regardless of how states are organized. Production of and access to these commodities, along with natural gas, will be critical over the next decade, as the world decarbonizes its energy sources, and as the US and China address their own growth and social agendas while vying for global hegemony. Decarbonization is part of the strategic race since all major powers now want to increase economic self-sufficiency and technological prowess. Chart 6CCPs Remarkable Success In Growing Chinas Economy
CCPs Remarkable Success In Growing Chinas Economy
CCPs Remarkable Success In Growing Chinas Economy
Over recent decades China has become the largest importer of base metals ores (Chart 7) and the world's top refiner of many of these metals. In addition, it is the top consumer of refined metal (Chart 8). Chart 7China Is World’s Top Ore Importer
US-China: War Preparation Pushes Commodity Demand
US-China: War Preparation Pushes Commodity Demand
Chart 8China Is Worlds Top Refined Metal Consumer
China Is Worlds Top Refined Metal Consumer
China Is Worlds Top Refined Metal Consumer
By contrast, the US is not listed among ore importers or metals consumers in the Observatory of Economic Complexity (OEC) databases we used to map these commodities. This reflects not only domestic supplies but also the lack of investment and upgrades to the US's critical infrastructure over 2000-19.8 Going forward, the US is trying to invest in “nation building” at home. An enormous change has taken shape in strategic liabilities. In the oil market, the US went from being the world's largest importer of oil in 2000, accounting for more than 24% of imports globally, to being the largest oil and gas producer by 2019, even though it still accounted for more than 12% of the world's imports (Chart 9). In 2000, China accounted for ~ 3.5% of the world's oil imports and by 2019 it was responsible for nearly 21%. China is far behind per capita US energy consumption, given its large population, but it is gradually closing the gap (Chart 10). Overall energy consumption in China is much higher than in the US (Chart 11). Chart 9US Oil Imports Collapse As Shale Production Grows
US-China: War Preparation Pushes Commodity Demand
US-China: War Preparation Pushes Commodity Demand
Chart 10Energy Use Per Capita In China Far From US Levels...
Energy Use Per Capita In China Far From US Levels...
Energy Use Per Capita In China Far From US Levels...
Chart 11China Is World’s Largest Primary Energy Consumer
US-China: War Preparation Pushes Commodity Demand
US-China: War Preparation Pushes Commodity Demand
China's impressive GDP growth in the twenty-first century is primarily responsible for China's stunning growth in imports and consumption of oil (Chart 12) and copper (Chart 13), which we track closely as a proxy for the entire base-metals complex. Chart 12Global Oil Demand Forecast Remains Steady Chinas GDP Drives Oil Consumption, Imports
Global Oil Demand Forecast Remains Steady Chinas GDP Drives Oil Consumption, Imports
Global Oil Demand Forecast Remains Steady Chinas GDP Drives Oil Consumption, Imports
Chart 13Global Oil Demand Forecast Remains Steady Chinas GDP Drives Refined Copper Consumption And Ore Imports
Global Oil Demand Forecast Remains Steady Chinas GDP Drives Refined Copper Consumption And Ore Imports
Global Oil Demand Forecast Remains Steady Chinas GDP Drives Refined Copper Consumption And Ore Imports
China’s importance in these markets points to an underlying strategic weakness, which is its dependency on imports. This in turn points to the greatest danger of the breakdown in US-China relations and the global trade system. The Road To War? China is extremely anxious about maintaining supply security in light of these heavy import needs. Its pursuit of economic self-sufficiency, including decarbonization, is driven by its fear of the US’s ability to cut off its key supply lines. China’s first goal in modernizing its military in recent years was to develop a naval force capable of defending the country from foreign attack, particularly in its immediate maritime surroundings. Historically China suffered from invaders across the sea who took advantage of its weak naval power to force open its economy and exploit it. Today China is thought to have achieved this security objective. It is believed to have a high level of capability within the “first island chain” that surrounds the coast, from the Korean peninsula to the Spratly Islands, including southwest Japan and Taiwan (Map 1).9 China’s militarization of the South China Sea, suppression of Hong Kong, and intimidation of Taiwan shows its intention to dominate Greater China, which would put it in a better strategic position relative to other countries. Map 1China’s Navy Likely Achieved Superiority Within The First Island Chain
US-China: War Preparation Pushes Commodity Demand
US-China: War Preparation Pushes Commodity Demand
China’s capability can be illustrated by comparing its naval strength to that of the United States, the most powerful navy in the world. While the US is superior, China would be able to combine all three of its fleets within the first island China, while the US navy would be dispersed across the world and divided among a range of interests to defend (Table 3). China would also be able to bring its land-based air force and missile firepower to bear within the first island chain, as opposed to further abroad.10 Table 3China’s Naval Growth Enables Primacy Within First Island Chain
US-China: War Preparation Pushes Commodity Demand
US-China: War Preparation Pushes Commodity Demand
In this sense China is militarily capable of conquering Taiwan or other nearby islands. President Xi Jinping had in fact ordered China’s armed forces be capable of doing so by 2020.11 Taiwan continues to be the most significant source of insecurity for the regime. True, a military victory would likely be a pyrrhic victory, as Taiwan’s wealth and tech industry would be destroyed, but China probably has the raw military capability to defeat Taiwan and its allies within this defined space. However, this military capability needs to be weighed against economic capability. If China seized military control of Taiwan, or Okinawa or other neighboring territories, the US, Japan, and their allies would respond by cutting off China’s access to critical supplies. Most obviously oil and natural gas. China’s decarbonization has been impressive but the reliance on foreign oil is still a fatal strategic vulnerability over the next few years (Chart 14). China is rapidly pursuing a Eurasian strategy to diversify away from the Middle East in particular. But it still imports about half its oil from this volatile region (Chart 15). The US navy is capable of interdicting China’s critical oil flows, a major inhibition on China’s military ambitions within the first island chain. Chart 14Chinas Energy Diversification Still Leaves Vulnerabilities
Chinas Energy Diversification Still Leaves Vulnerabilities
Chinas Energy Diversification Still Leaves Vulnerabilities
Of course, if the US and its allies ever blockaded China, or if China feared they would, Beijing could be driven to mount a desperate attack to prevent them from doing so, since its economic, military, and political survival would be on the line. Chart 15China Still Dependent On Middle East Energy Supplies
China Still Dependent On Middle East Energy Supplies
China Still Dependent On Middle East Energy Supplies
The obvious historical analogy is the US-Japan conflict in WWII. Invasions that lead to blockades will lead to larger invasions, as the US and Japan learned.12 However, the lesson from WWII for China is that it should not engage the US navy until its own naval power has progressed much further. In the event of a conflict, the US would be imposing a blockade at a distance from China’s naval and missile forces. When it comes to the far seas, China’s naval capabilities are extremely limited. Military analysts highlight that China lacks a substantial naval presence in the Indian Ocean. China relies on commercial ports, where it has partial equity ownership, for ship supply and maintenance (Table 4). This is no substitute for naval basing, because dedicated military facilities are lacking and host countries may not wish to be drawn into a conflict. Table 4China’s Network Of Part-Owned Ports Across The World: Useful But Not A Substitute For Military Bases
US-China: War Preparation Pushes Commodity Demand
US-China: War Preparation Pushes Commodity Demand
Further, Beijing lacks the sea-based air power necessary to defend its fleets should they stray too far. And it lacks the anti-submarine warfare capabilities necessary to defend its ships.13 These capabilities are constantly improving but at the moment they are insufficient to overthrow US naval control of the critical chokepoints like the Strait of Hormuz or Strait of Malacca. While China’s naval power is comparable to the US’s Asia Pacific fleet (the seventh fleet headquartered in Japan), it is much smaller than the US’s global fleet and at a much greater disadvantage when operating far from home. China’s navy is based at home and focused on its near seas, whereas US fleet is designed to operate in the far seas, especially the Persian Gulf, which is precisely the strategic area in question (Chart 16).14 China is gradually expanding its navy and operations around the world, so over time it may gain the ability to prevent the US from cutting off its critical supplies in the Persian Gulf. But not immediately. The implication is that China will have to avoid direct military conflict with the United States until its military and naval buildup has progressed a lot further. Chart 16China’s Navy At Huge Disadvantage In Distant Seas
US-China: War Preparation Pushes Commodity Demand
US-China: War Preparation Pushes Commodity Demand
Meanwhile Beijing will continue diversifying its energy sources, decarbonizing, and forging supply chains across Eurasia via the Belt and Road Initiative. What could go wrong? We would highlight a few risks that could cause China to risk war even despite its vulnerability to blockade: Chart 17China’s Surplus Of Males Undergirds Rise In Nationalism
US-China: War Preparation Pushes Commodity Demand
US-China: War Preparation Pushes Commodity Demand
Domestic demographic pressure. China is slated to experience a dramatic bulge in the male-to-female ratio over the coming decade (Chart 17).15 A surfeit of young men could lead to an overshoot of nationalism and revanchism. This trend is much more important than the symbolic political anniversaries of 2027, 2035, and 2049, which analysts use to predict when China’s military might launch a major campaign. Domestic economic pressure. China’s turn to nationalism reflects slowing income growth and associated social instability. An economic crisis in China would be worrisome for regional stability for many reasons, but such pressures can lead nations into foreign military adventures. Domestic political pressure. China has shifted from “consensus rule” to “personal rule” under Xi Jinping. This could lead to faulty decision-making or party divisions that affect national policy. A leadership that carefully weighs each strategic risk could decay into a leadership that lacks good information and perspective. The result could be hubris and belligerence abroad. Foreign aggression. Attempts by the US or other powers to arm China’s neighbors or sabotage China’s economy could lead to aggressive reaction. The US’s attempt to build a technological blockade shows that future embargoes and blockades are not impossible. These could prompt a war rather than deter it, as noted above. Foreign weakness. China’s capabilities are improving over time while the US and its allies lack coordination and resolution. An opportunity could arise that China’s strategists believe they cannot afford to miss. Afghanistan is not one of these opportunities, but a US-Iran war or another major conflict with Russia could be. The breakdown in global trade is concerning because without an economic buffer, states may resort to arms to resolve disputes. History shows that military threats intended to discourage aggressive behavior can create dilemmas that incentivize aggression. The behavior of the US and China suggests that they are preparing for war, even if we are generous and assume that they are doing so only to deter war. Both countries are nuclear powers so they face mutually assured destruction in a total war scenario. But they will seek to improve their security within that context, which can lead to naval skirmishes, proxy wars, and even limited wars with associated risks of going nuclear. Investment Takeaways The pursuit of the national interest today involves using fiscal means to create more self-sufficient domestic economies and reduce international supply risks. Both China and the West are engaged in major projects to this end, including high-tech industrialization, domestic manufacturing, and decarbonization. These trends are generally bullish for commodities, even though they include trends like military modernization and naval expansion that could well be a prelude to war. War itself leads to commodity shortages and commodity price inflation, but of course it is disastrous for the people and economies involved. Fortunately, strategic deterrence continues to operate for the time being. The underlying geopolitical trend will put commodity markets under continual pressure. A final urgent update on oil and the Middle East: The US attempt to conduct a strategic “pivot” to Asia Pacific faces a critical juncture. Not because of Afghanistan but because of Iran. The Biden administration will have trouble unilaterally lowering sanctions on Iran after the humiliating Afghanistan pullout. The new administrations in both Iran and Israel are likely to establish red lines and credible threats. A higher geopolitical risk premium is thus warranted immediately in global oil markets. Beyond short-term shows of force, everything depends on whether the US and Iran can find a temporary deal to avoid the path to a larger war. But for now short-term geopolitical risks are commodity-bullish as well as long-term risks. Robert P. Ryan Chief Commodity & Energy Strategist rryan@bcaresearch.com Matt Gertken Vice President Geopolitical Strategy mattg@bcaresearch.com Footnotes 1 There are also significant differences between Biden and Trump in other areas such as redistribution, immigration, and social policy. 2 See Ravenhill, John (2020), Regional Trade Agreements, Chapter 6 in Global Political Economy, which he edited for Oxford University Press, particularly pp. 156-9. 3 “As time went by, the United States realized that Communism not only did not retreat, but also further advanced in China, with the state-owned economy growing stronger and the rule of the Party further entrenched in the process." See Henry Gao, “WTO Reform and China Defining or Defiling the Multilateral Trading System?” Harvard International Law Journal 62 (2021), p. 28, harvardilj.org. 4 See Mavroidis, Petros C. and Andre Sapir (2021), China and the WTO, Why Multilateralism Still Matters (Princeton University Press) for discussion. See also Confronting the Challenge of Chinese State Capitalism published by the Center for Strategic & International Studies 22 January 2021. 5 Gao (2021), p. 19. 6 Gao (2021), p. 24. 7 Please see China's GDP tops 100 trln yuan in 2020 published by Xinhuanet 18 January 2021. 8 We excluded 2020 because of the COVID-19 pandemic's effects on supply and demand for these ores, metals and crude oil. 9 See Captain James Fanell, “China’s Global Navy Strategy and Expanding Force Structure: Pathway To Hegemony,” Testimony to the US House of Representatives, May 17, 2018, docs.house.gov. 10 Fanell (2018), p. 13. 11 He has obliquely implied that his vision for national rejuvenation by 2035 would include reunification with Taiwan. Others suggest that the country’s second centenary of 2049 is the likely deadline, or the 100th anniversary of the People’s Liberation Army. 12 The US was a major supplier of oil to Japan, and in 1941 it froze Japan's assets in the US and shut down all oil exports, in response to Japan's military incursion into China in the Second Sino-Japanese War of 1937-45. Please see Anderson, Irvine H. Jr. (1975), "The 1941 De Facto Embargo on Oil to Japan: A Bureaucratic Reflex," Pacific Historical Review, 44:2, pp. 201-231. 13 See Jeffrey Becker, “Securing China’s Lifelines Across the Indian Ocean,” China Maritime Report No. 11 (Dec 2020), China Maritime Studies Institute, digital-commons.usnwc.edu. 14 See Rear Admiral Michael McDevitt, “Becoming a Great ‘Maritime Power’: A Chinese Dream,” Center for Naval Analyses (June 2016), cna.org. 15 For discussion see Major Tiffany Werner, “China’s Demographic Disaster: Risk And Opportunity,” 2020, Defense Technical Information Center, discover.dtic.mil.
BCA Research’s Geopolitical Strategy service maintains a pessimistic outlook on Chinese currency and assets. Chinese President Xi Jinping laid out a plan on August 18 for “common prosperity” in China that will help guide national policy over the coming…
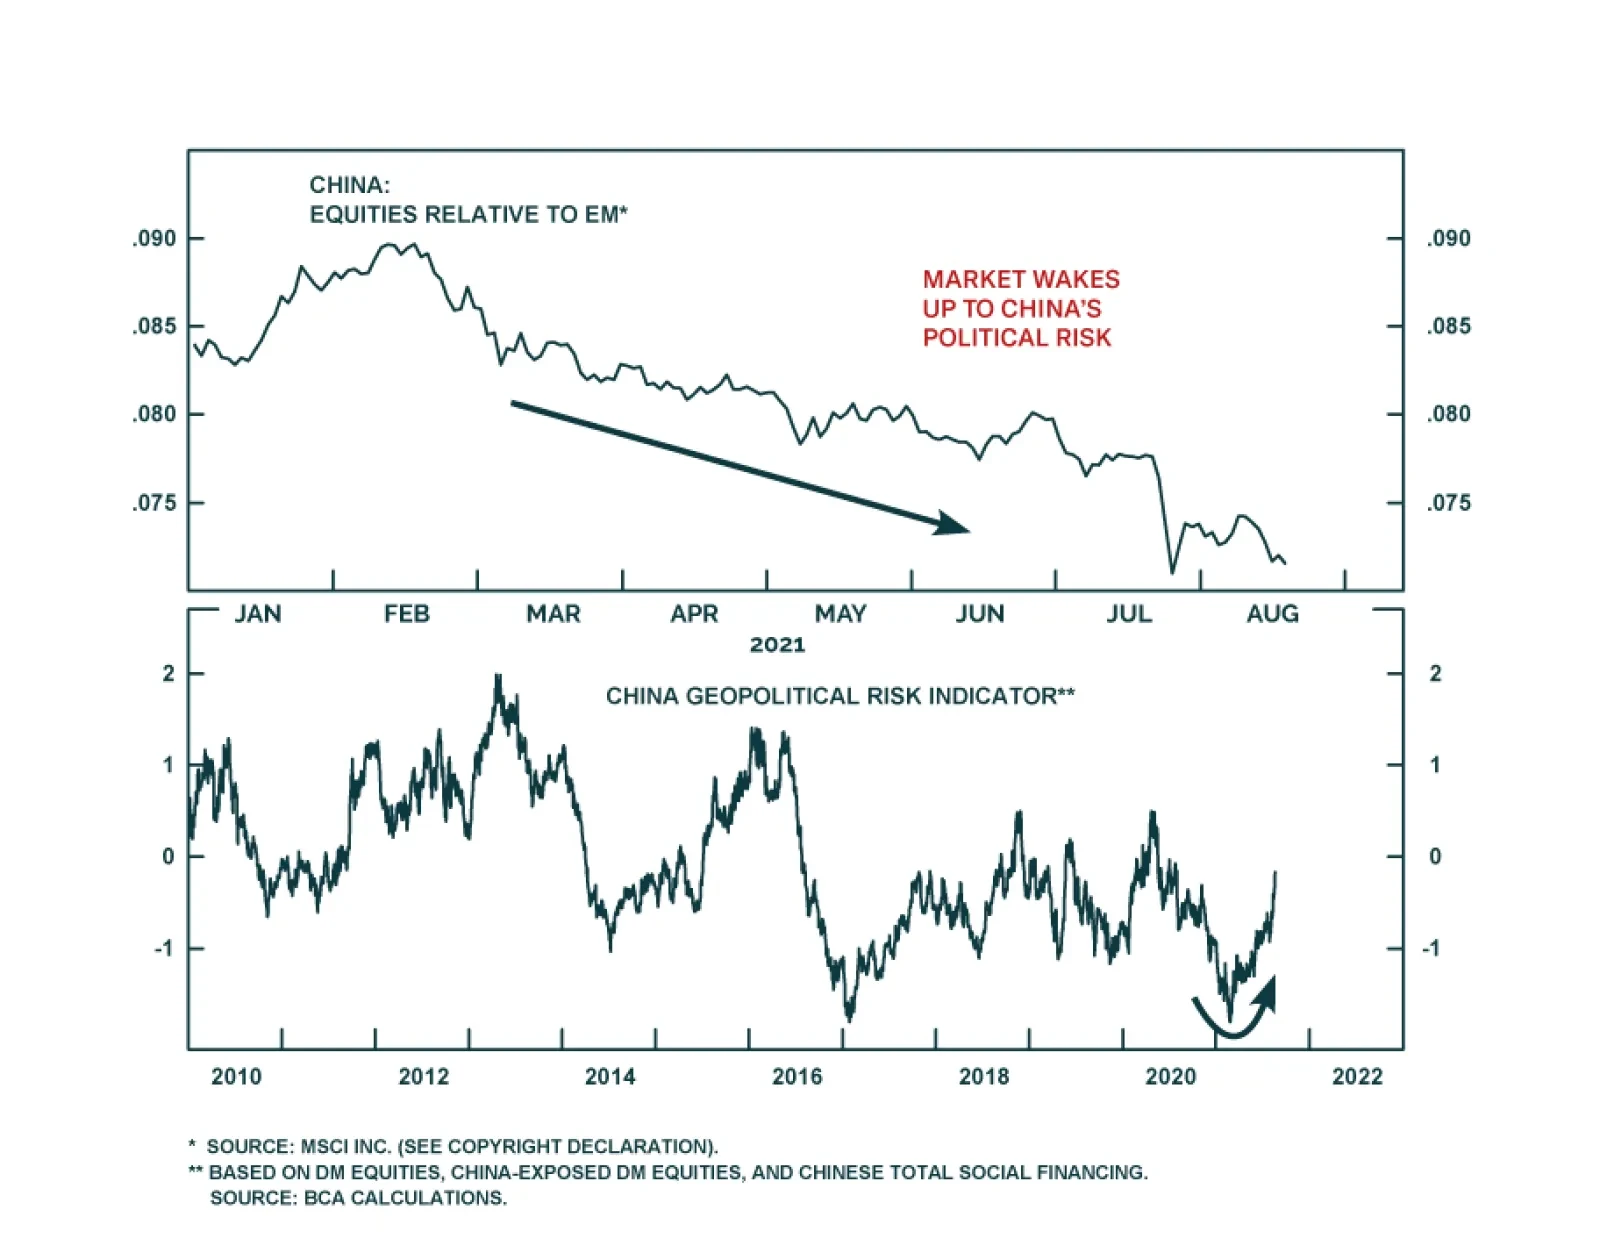
Highlights China’s new plan for “common prosperity” is a long-term strategic plan to bulk up the middle class that will strengthen China – if it is implemented successfully. The record on implementing reforms is mixed. Large budget deficits to provide subsidies for households and key industries are inevitable. But fiscal reforms will be more difficult. Implementation will proceed gradually and some provinces will move faster than others. Cyclically, the common prosperity plan will not be allowed to interfere with the post-pandemic economic recovery. Beijing will have to ease monetary and fiscal policy to secure the recovery. But large debt levels create a limit on the ability to push through key reforms. Macro policy easing is beneficial for the rest of the world but Chinese investors must deal with a rise in uncertainty and an anti-business turn in the policy environment. Beijing has centralized political power to move rapidly on reforms. However, centralization creates new structural problems while antagonizing foreign nations. Feature Chinese President Xi Jinping laid out a plan on August 18 for “common prosperity” in China that will help guide national policy over the coming decades. The plan seeks to reduce social and economic imbalances and hence strengthen China and reinforce the Communist Party’s rule. The plan confirms our top key view for the year – China’s confluence of internal and external risks – as well as our long-running theme that Chinese domestic political risk is greater than it looks because of underlying problems like inequality and weak governance. The market has woken up to these views and themes (Chart 1). Now Beijing is turning to address these problems, which is positive if it follows through. But investors will have to cope with new policies and laws that reverse the pro-business context of recent decades. In this report we review the new plan and its implications in the context of overall Chinese economic policy. The chief investment takeaway is that while China will push forward various reforms, Beijing cannot afford to self-inflict an economic collapse. Monetary and fiscal policy will ease over the coming 12 months. As such China policy tightening will not short-circuit the global recovery. However, Chinese corporate earnings and the renminbi will not benefit from the country’s anti-business turn. Chart 1Market Wakes Up To China's Political Risk
Market Wakes Up To China's Political Risk
Market Wakes Up To China's Political Risk
What Is In The Common Prosperity Plan? The first thing to understand about Beijing’s new plan for “common prosperity” is that it is aspirational: it contains few specific targets or concrete policies. It builds on existing policy goals set for 2049, the hundredth anniversary of the People’s Republic. Implementation will be gradual. The plan is consistent with the Xi administration’s previous emphasis on improving the country’s quality of life and tackling systemic risks. It takes aim at social immobility, income and wealth inequality, poor public services, a weak social safety net, and other problems that did not receive enough attention during China’s rapid growth phase over the past forty years. Left unattended, China’s socioeconomic imbalances could fester and eventually destabilize the regime. From the beginning, the Xi administration has tackled the most pressing popular concerns to try to rebuild the party’s legitimacy, increase public support, and avoid crises. Crackdowns on pollution and excessive debt are prime examples. China does indeed suffer from high income inequality and low social mobility, as we have highlighted in key reports. It is comparable to the United States as well as Italy, Argentina, and Chile, all of which have suffered from significant social and political upheaval in recent memory (Chart 2). By contrast, Japan, Germany, and Australia have been relatively politically stable. Chart 2China Risks Social Unrest Like The Americas
China Spreads The Wealth Around
China Spreads The Wealth Around
Table 1 summarizes the common prosperity plan. The key takeaways are the long 2049 deadline, the emphasis on “mixed ownership” in the corporate sphere (retaining a big role for state control and state-owned enterprises but attracting private capital), the redistribution of household income (reform the tax code), the establishment of property rights, the censorship of media/discourse, and the need to reduce rural disparity. The most important point of all is that Beijing intends to grow the size and wellbeing of the middle class – the foundation of a country’s strength. Table 1China’s “Common Prosperity” Plan For 2049
China Spreads The Wealth Around
China Spreads The Wealth Around
Coastal China today has reached Taiwanese and Korean levels of per capita income and has slightly exceeded their levels of wealth inequality (Chart 3). These countries witnessed social unrest and regime change in the 1980s due to such problems. The urban-rural gap is even more problematic in China due to its large rural population and territory. The Chinese public is expected to become more demanding as it evolves. Hence Beijing is pledging to redistribute wealth, grow the middle class, speed up income growth among the poorest, reduce rural disparities, expand access to elderly care, medicine, and housing, and establish a better legal framework for business. These goals are positive in principle, especially for household sentiment, social stability, and political support for the administration. But they also entail a higher tax/wage/regulation environment for business and corporate earnings. The question for investors centers on implementation. Chart 3China's Wealth Disparities Outstrip Comparable Neighbors
China's Wealth Disparities Outstrip Comparable Neighbors
China's Wealth Disparities Outstrip Comparable Neighbors
What About Vested Interests? Table 1 above shows that the super-committee that issued the common prosperity plan also addressed China’s ongoing battle against financial risk. The financial policy statement was neither new nor surprising but it highlights something important: “preventing risks” will have to be balanced with “ensuring stable growth.” This balancing of reform and growth is essential to Chinese government and will guide the implementation of the common prosperity plan just as it has guided President Xi’s crackdown on shadow banking. This is an especially pertinent point today, as Beijing runs the risk of overtightening monetary, fiscal, and regulatory policies. While Beijing’s vision of a better regulated, more heavily taxed, and higher-wage society should not be underrated, reform initiatives will be delayed if they threaten to derail the post-pandemic recovery. Time and again the Xi administration has ruled against a rapid, resolute, and disruptive approach to reform, such as the “assault phase of reform” spearheaded by Premier Zhu Rongji in the late 1990s. In the plan’s own words: “achieving common prosperity will be a long-term, arduous, and complicated task and it should be achieved in a gradual and progressive manner.” Having said that, the pattern of reform has been a vigorous launch, a market riot, and then backtracking or delay. This means markets face more volatility first before things settle down. An initial volley of policy actions should be expected between now and spring of 2023, when the National People’s Congress solidifies the plans of the twentieth National Party Congress in fall 2022. As with the ongoing regulatory crackdown on Big Tech, the market may experience a technical rebound but the political assessment suggests government pressure will be sustained for at least the next 12 months. We do not recommend bottom feeding in Chinese equities. Will the reforms be effective over time? When the Xi administration took power in 2012-13, it issued a visionary policy document calling for wide-ranging reforms to China’s economy (“Decision on Several Major Questions About Deepening Reform”).1 Over the past decade these reforms have had mixed success. Rhodium Group maintains a reform tracker to monitor progress – the results are lackluster (Table 2). Some core principles, such as the claim that China would make market forces “decisive” in allocating resources, have been totally reversed. Table 2China’s Progress On Reforms Over Past Decade
China Spreads The Wealth Around
China Spreads The Wealth Around
While China’s government model is absolutist, there are still social and economic limits on what the government can achieve. Beijing cannot raise a nationwide property tax, estate tax, and capital gains tax overnight just to reduce inequality. In fact, the long saga of the property tax tells a very different story. Beijing is limited in how it can tax the bubbling property sector because Chinese households store their wealth in houses and because any sustained price deflation would lead to a national debt crisis. Officials have pledged to advance a nationwide property tax in the past three five-year plans with little progress. A serious effort to impose the tax in 2014 was only implemented in two provinces, notably Shanghai’s tax on second or third homes owned by the same household.2 The common prosperity plan entails that the government will revive the property tax but the rollout will still be gradual and step-by-step reform. The tax will focus on major urban areas, not minor ones where population decline could weigh on prices. The government work report in early 2023 will be a key watchpoint for where and when the property tax will be levied but there can be little doubt that it will gradually be levied for top-tier cities. Other aspects of the common prosperity plan will be implemented with provincial trial runs. It all begins with a “demonstration zone,” namely Zhejiang province, a wealthy coastal state where President Xi Jinping once served as party secretary and first army secretary. Zhejiang is expected to make some progress by 2025 and achieve most the goals by 2035 (in keeping with Xi’s 2035 strategic vision). The Zhejiang plan includes concrete numerical targets and as such sheds light on the broader national plan and how other provinces will implement it. The most important target is the desire to have 80% of the population earn an annual disposable income of CNY 100,000-500,000 ($15,400-77,000). The labor share of output should be greater than 50%, compared to a national average of 35%-40%. The urbanization rate should hit 75%, up from 72%. Urban incomes should be capped at just short of twice that of rural income. Enrollment rates in higher education will go up, life expectancy should reach above 80 years, pollution should be further controlled, and the unemployment rate should stay below 5.5%. A host of other goals, ranging from technology to fertility and the social safety net, are shown in Table 3. Table 3China: Zhejiang Province As Bellwether For “Common Prosperity” Plan
China Spreads The Wealth Around
China Spreads The Wealth Around
Some of the plan’s intentions will be undermined by Chinese governance. It is difficult to improve social fairness and property rights in the context of autocracy because the central and local governments create distortions and cannot be held to account for their own mistakes and abuses. The immediate political context of the common prosperity plan should not be missed: the president is outlining a bright future to justify the fact that he will not step down from power as earlier term limits required in fall 2022. The president’s 2035 vision implies an important strategic window in which to accomplish ambitious goals but the lack of checks and balances suggests that the next 14 years could be very similar to the last 10 years, in which arbitrary and absolutist decisions govern policy. The problem is highlighted by China’s recent 10-point plan on government under rule of law, which is undercut by the arbitrary actions of regulators in the tech crackdown (see Appendix). In other words, while social stability may improve in many ways, the shift away from consensus rule, toward rule of a single person, will increase policy uncertainty and create new governance problems at the same time that could produce greater instability over the long run. Having said all that, it is essential to acknowledge that a comprehensive plan to grow the middle class and expand the social safety net could be very positive for China if implemented. A Global Social Justice Race? If investors are thinking that the Xi administration’s calls for “social fairness and justice” and big new investments in “elderly care, medical security, and housing supply” resemble those of US President Joe Biden in his American Families Plan, then they are right. But while the US is already at historic levels of social division after failing to deal with inequality, China is attempting to learn from the US’s problems and rebalance society before polarization, factionalization, and social unrest occur. The Communist Party tends to take major action in response to American crises. Beijing’s crackdown on extremism and domestic terrorism in the early 2000s followed from the September 11 attacks. Its crackdown on local government debt and shadow banking stemmed from the 2008 financial crisis. And its crackdown on Big Tech, social media, and inequality today responds to the rise of populism in the US and Europe. The fact that deindustrialization has led to political crises in the developed world, and that social media companies can both exacerbate social unrest and silence a sitting president, is not lost on the Chinese administration. Unfortunately, China’s approach will probably escalate conflict with the West. First, Beijing is coupling its new social agenda with an aggressive campaign of military modernization and technological acquisition. It is doubling down on advanced manufacturing as its future economic model. The liberal democracies will not only be forced to defend their own political systems and governance models but will also be pressured into more hawkish stances on foreign, trade, and defense policy toward China. So far China is still attractive to foreign investors but the combination of socialist policy, import substitution, and foreign protectionism should put a cap on investment flows over time (Chart 4). What is the net effect of social largesse at home and great power competition abroad? Larger budget deficits. Fiscal expansionism is the key mechanism for the US and China to reboot their economies, reduce social pressures, secure supply chains, and compete with other each other. And expansionary fiscal policies will boost inflation expectations on the margin. One thing is clear: China’s regime will be imperiled if instead of common prosperity and “national rejuvenation” it gets economic collapse. Beijing is already seeing capital outflows reminiscent of the crisis period in 2014-15 when aggressive reforms triggered a collapse in risk appetite and a stock market crash (Chart 5). The implication is that monetary and fiscal easing will accompany the reform agenda. Chart 4China's New Policies Will Deter Foreign Investment
China's New Policies Will Deter Foreign Investment
China's New Policies Will Deter Foreign Investment
Chart 5Capital Flight And Capital Controls A Risk If Implementation Aggressive
Capital Flight And Capital Controls A Risk If Implementation Aggressive
Capital Flight And Capital Controls A Risk If Implementation Aggressive
That would be marginally positive for global growth and EM countries that export to China. Investors in China, however, will have to deal with greater policy uncertainty as China attempts to redistribute wealth while waging a cold war abroad. Investment Takeaways None of Beijing’s social goals can be met if overall growth and job creation slow too much. Reforms are constantly subject to the ultimate constraint of maintaining overall stability. Already in 2021 Beijing is verging on excessive monetary and fiscal policy tightening (Chart 6). The Politburo signaled in July that it would take its foot off the brakes but policy uncertainty is still wreaking havoc in the equity market and overall animal spirits are downbeat. We expect policy to ease over the coming year to ensure stability ahead of the twentieth national party congress. This would be marginally good news for global growth, contingent on the effects of the global pandemic. Of course we cannot deny that more bad news for global risk assets may be necessary in the very near term to prompt the policy easing that we expect. Policymakers will backtrack on various policies when the market revolts or when the risk of debt-deflation rears its ugly head. Corporate and even household debt have expanded so much in recent years that Chinese policymakers have their hands tied when they try to push reforms too aggressively (Chart 7). A Japanese-style combination of a shrinking and graying population could create a feedback loop with debt deleveraging in the event of a sharp drop in asset prices. On the whole we maintain a pessimistic outlook on Chinese currency and assets. Chart 6China Runs Risk Of Overtightening Policy
China Runs Risk Of Overtightening Policy
China Runs Risk Of Overtightening Policy
Chart 7Debt Trap Must Be Avoided - Monetary/ Fiscal Policy Will Stay Accommodative
Debt Trap Must Be Avoided - Monetary/ Fiscal Policy Will Stay Accommodative
Debt Trap Must Be Avoided - Monetary/ Fiscal Policy Will Stay Accommodative
Matt Gertken Vice President Geopolitical Strategist mattg@bcaresearch.com Appendix Table A1China: 10-Point Guidelines On Government Under Rule Of Law (2021-25)
China Spreads The Wealth Around
China Spreads The Wealth Around
Footnotes 1 See Arthur R. Kroeber, “Xi Jinping’s Ambitious Agenda for Economic Reform in China,” Brookings, November 17, 2013, brookings.edu. 2 Chongqing’s property tax only affects luxury houses. Shenzhen and Hainan are the next pilot projects.
According to BCA Research’s China Investment Strategy & Global Asset Allocation services, adding a simple 50-50 Chinese stock-bond portfolio may boost the return/risk profile of global multi-asset portfolios. Chinese onshore stocks on their own are not…
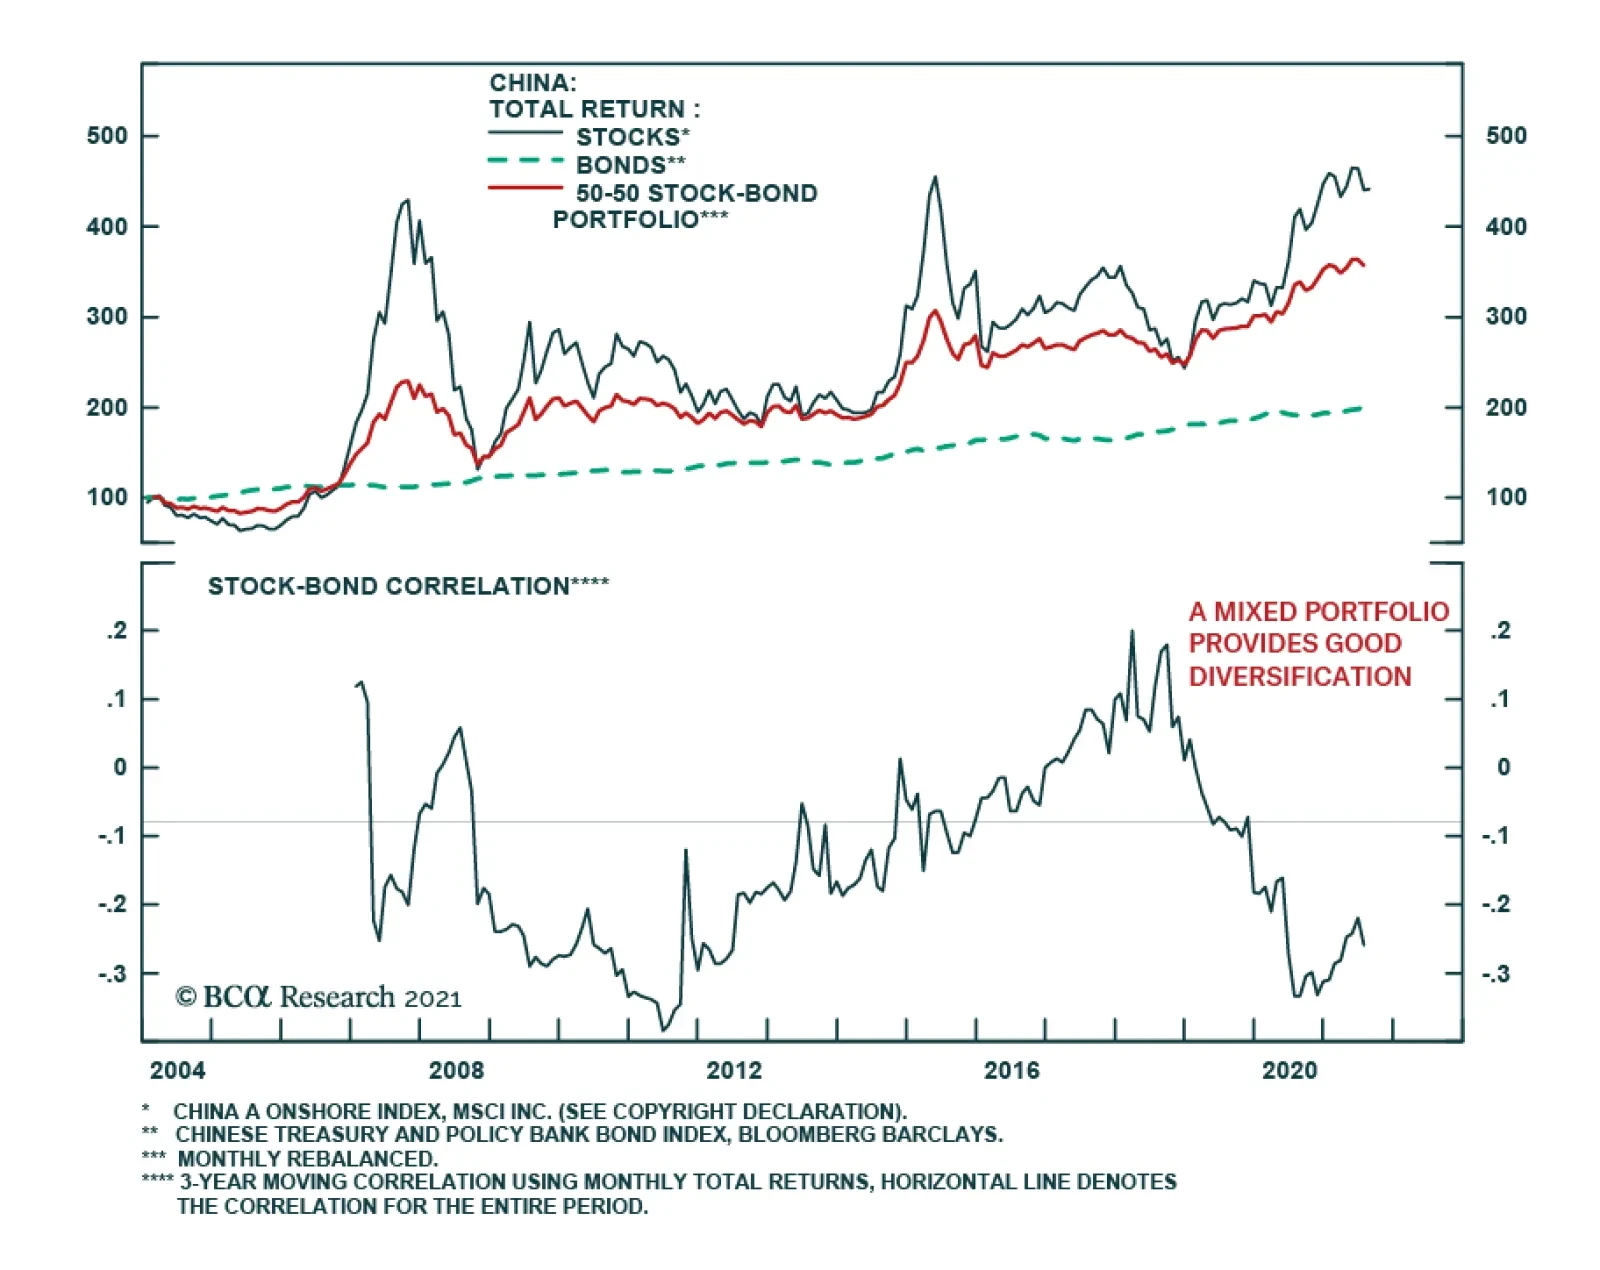
Dear Client, This week we are sending you a joint Special Report written by my colleagues Xiaoli Tang, Associate Vice President at BCA Research’s Global Asset Allocation, and Qingyun Xu, Associate Editor at China Investment Strategy. In the Special Report Xiaoli and Qing investigate the impact on global portfolios when adding onshore Chinese assets. Their findings confirm our view that Chinese onshore equities have not been a good long-term, buy-and-hold asset for global equity investors due to extremely high volatility. However, they conclude that to improve both the absolute and risk-adjusted returns of the onshore equity market, investors can apply an equal-weighted, five-factor smart-beta strategy or active sector/industry allocation strategies. More importantly, they find that both hedged and unhedged Chinese onshore bonds are excellent risk diversifiers for DM bond investors, and Chinese onshore bonds are also a good risk-diversifier and complementary to Chinese equity-centric portfolios. I trust you will find it insightful. Next week the China Investment Strategy team will take our second of the two-week summer break. We will resume our publication on Wednesday, September 1st. Best regards, Jing Sima, China Strategist Highlights Global investors have become increasingly interested in Chinese onshore equities and bonds as part of their multi-asset portfolios as Chinese onshore equities and bonds have been included in major global stock and bond indexes. In this report, we investigate the impact on global portfolios when adding onshore Chinese assets. Three assets (stocks, bonds and stock-bond combinations) and six home currencies (the USD, JPY, EUR, GBP, CAD and AUD) are included in our portfolio analysis. Chinese onshore equities have not been a good long-term, buy-and-hold asset for global equity investors due to extremely high volatility. To improve both the absolute and risk-adjusted returns of the onshore equity market, however, investors can apply an equal-weighted, five-factor smart-beta strategy or active sector/industry allocation strategies. Hedged Chinese onshore bonds are excellent risk diversifiers for DM bond investors, but higher absolute and risk-adjusted returns may be derived from unhedged bonds, thanks to the positive carry and negative correlation between the onshore Chinese bond index and CNY crosses. Chinese onshore bonds are also a good risk-diversifier and complementary to Chinese equity-centric portfolios, given the negative correlation between the performance of Chinese bonds and equities. Adding a stand-alone Chinese portfolio with equally weighted onshore bonds and equities to a typical 70-30 domestic equity-bond portfolio would significantly improve a non-USD investor’s risk-adjusted return. Global investors may access China’s onshore equity and bond markets through Stock Connect(s), Bond Connect and CIBM Direct. Risk management tools are also available via both onshore and offshore instruments. Feature In the past three decades, China’s financial markets have become the second largest in the world both in terms of equity capitalization and bonds outstanding. Pro-market financial reforms have made the onshore markets increasingly accessible to foreign investors (Appendix 1). As China’s domestic equities and bonds are gradually added to major global equity and bond indexes, the onshore markets have become too sizeable to be ignored by global investors. Chart 1China A Onshore Shares: Highly Volatile Driven By Policy Swings
China A Onshore Shares: A Poor Long-Term Asset
China A Onshore Shares: A Poor Long-Term Asset
Gyrations in China’s equity market in July in response to regulatory changes imposed on various industries (internet, property, education, healthcare and capital markets), however, should be a reminder that volatility in this market is an ever-present aspect. The instability is driven by China’s profound cyclicality in credit, money and macroeconomic policies (Chart 1). Moreover, the unpredictability is exacerbated by periods of geopolitical tensions and domestic political events. We focus on the portfolio impact of adding onshore equities and bonds to global investors’ domestic portfolios with six different home currencies: the USD, euro (EUR), Japanese yen (JPY), British pound (GBP), Australian dollar (AUD) and Canadian dollar (CAD). We also address how to access the onshore markets and what risk management tools are available. Many global investors already have a significant home bias in their portfolios, therefore this report will look at replacing part of a domestic portfolio with Chinese onshore assets. Part 1. Are Chinese Onshore Equities A Good Alternative For Global Equity Investors? 1.1: Chinese Equities Have A Poor Long-Term Return-Risk Profile Chart I-1How Does China A Compare With Global Equities
Can Global Investors Afford To Ignore China’s Onshore Markets?
Can Global Investors Afford To Ignore China’s Onshore Markets?
The extremely volatile nature of the MSCI China A onshore equity index (referred to as ‘China A’ in this report) is not a recent phenomenon. Although the volatility in China A has moderated since 2015, the stocks in the index remain highly cyclical and closely correlated with China’s credit growth. China A has gone through two full boom-bust cycles since December 2000 and the third up-cycle started in 2019 is being challenged, as shown in Chart I-1 panel 1. On a rolling three-year basis, China A’s volatility has steadily declined since its peak in early 2015 and is currently comparable to other markets. Meanwhile, its correlation with the rest of the world has steadily risen, standing at around 60% with major equity markets (Chart I-1, bottom 3 panels). The change in correlation with global equity markets could be linked to the launch of the Shanghai Stock Connect and Shenzhen Stock Connect as well as a more market-based RMB exchange rate in the past six years. Compared with domestic equities for investors in the US, euro area, Japan, UK, Canada and Australia, however, China’s A-shares’ unhedged return-risk profile did not become more attractive after the launch of the Shanghai Stock Connect. As illustrated in Table 1, China A’s underperformance has spanned the entire upcycle in global equities starting in March 2009. It was only in the early years following China’s entrance into the WTO in 2001 that China A-shares performed better than their peers in Japan and the euro area. Table 1Return-Risk Profiles: China A Onshore Index vs Global Equity Indexes and CNY Crosses
Can Global Investors Afford To Ignore China’s Onshore Markets?
Can Global Investors Afford To Ignore China’s Onshore Markets?
USD/CNY exchange rate volatility has increased since the 2015 de-pegging from the US dollar, but remains at very low level compared with other CNY crosses. The People’s Bank of China (PBoC) primarily manages the RMB against the dollar by targeting a daily USD/CNY fixing rate, while allowing market forces to drive the RMB value against a basket of currencies in the China Foreign Exchange Trade System (CFETS) index. Chart I-2Correlations Between China A And DM Currencies
Can Global Investors Afford To Ignore China’s Onshore Markets?
Can Global Investors Afford To Ignore China’s Onshore Markets?
Interestingly, even though CNY crosses with the euro, GBP, JPY, AUD and CAD have much higher volatility, the volatility in unhedged China A-shares in each of those currencies is similar to or lower than that in USD. For example, from December 2014 to July 2021, AUD/CNY had an annualized volatility of 8.8%, much higher than the 4.5% of the USD/CNY, yet the unhedged China A-share's volatility in AUD was 21%, lower than the 24% in USD. The reason lies in correlation, as shown Chart I-2. While China A-shares in CNY have a positive correlation with USD/CNY and JPY/CNY (i.e. China A-share prices tend to rise when China’s currency appreciates against the US dollar and Japanese yen), they have falling and negative correlations with the other four currencies. For equity investors in the US and Japan, exposure to the CNY would increase potential volatility to their home-currency portfolios, but the opposite would be true for investors in the euro area, the UK, Australia and Canada. In addition, Chinese onshore equity correlations with DM equities and EM-ex China equities were low, but have increased since 2015, making onshore shares less attractive for global equity investors looking to diversify. Bottom Line: Chinese onshore shares are a poor long-term asset for global equity investors. 1.2: Factor Strategies Work Well In The Onshore Market Despite Chinese equities’ poor long-term performance, applying a factor strategy to Chinese onshore stocks can create impressive results. In a GAA Special Report on smart-beta strategies for MSCI DM and EM markets, we concluded that a simple, equally weighted five-factor strategy would smooth out the cyclicality of individual factors and outperform the broad market. These five factors are value, equal weight (i.e. size), quality, momentum and minimum volatility, as defined and calculated by MSCI (see Box 1). When we apply the same methodology to the MSCI China A onshore market, the result is even more impressive as shown in Chart I-3. Box 1MSCI Factor Indices
Can Global Investors Afford To Ignore China’s Onshore Markets?
Can Global Investors Afford To Ignore China’s Onshore Markets?
Chart I-3Factor Performance: China A Vs Global
Can Global Investors Afford To Ignore China’s Onshore Markets?
Can Global Investors Afford To Ignore China’s Onshore Markets?
Since December 2004, the value and small cap factors have outperformed the broad benchmark by about 11% and 47%, respectively, in the China A universe, despite sharp corrections since December 2016 for small cap and Oct 2018 for value. In contrast, in the global universe, value and small cap have underperformed the global benchmark by 24% and 7%, respectively, in the same time frame (Chart I-3, panels 2 and 6.) This confirms anecdotal evidence that the onshore equity market was less efficient than its global peer, although efficiency has improved. Momentum is a consistent factor for global markets. A GAA Special Report on momentum strategy shows that momentum works better in markets with higher individuality where self-attribution and self-confidence are more pervasive, according to Hofstede’s Cultural Dimension theory. This behavioral aspect is confirmed by the performance of momentum in China’s onshore market: in the early years, momentum did not work well, but strengthened after both Shanghai and Shenzhen shares were accessible to foreign investors via the two Stock Connects and mainland institutional investors became more prevalent (Chart I-3, panel 4) Quality is the most consistent factor for global markets because investors reward companies with solid fundamentals. As shown in (Chart I-3, panel 3), this factor has worked even better in the China A market than in the global universe. The fact that good fundamentals have generated superior equity return repels the “myth” that the China A market is a “casino” driven by individual investors, who totally ignore company fundamentals. The minimum volatility factor works in a similar fashion in the onshore Chinese market as in the global markets. Chart I-4Onshore Equity Market Can Be Improved By Smart-Beta Strategies
Can Global Investors Afford To Ignore China’s Onshore Markets?
Can Global Investors Afford To Ignore China’s Onshore Markets?
Factor timing can hardly generate consistent outperformance. BCA’s GAA team advocates equally weighting the five time-tested factors for the MSCI global universe. This approach also applies to China’s onshore market (Chart I-3, panel 1). Since all the factor indexes became available in August 2013, the equally weighted, five-factor portfolio has outperformed the benchmark by about 20% in total with similar volatility. On a rolling one- and three-year basis, this strategy also performs better than the benchmark (Chart I-4). Some investors may prefer a more active and quantitative approach; they should refer to CIS’s Special Report on factor investing in the A-share market. The CIS report recommends that global investors should opt for industry groups with above-median return on equity (ROE) and below-median ex-post beta when investing in the onshore market. ROE is a quality factor in MSCI (see Box 1 above) and below-median beta is a variation of low volatility. Bottom Line: Factor strategies can improve the return and risk profiles of China’s onshore equity market. Part 2. Chinese Onshore Bonds Chinese onshore bonds have attracted global investors because they offer much higher yields than DM government bonds (Chart II-1). At the same time, as shown in Chart II-2, Chinese onshore bond yields have low to negative correlations with major government bond yields. Thus, the onshore bonds offer potential risk diversification for global bond portfolios. Chart II-1Chinese Bonds Offer Higher Yields
Can Global Investors Afford To Ignore China’s Onshore Markets?
Can Global Investors Afford To Ignore China’s Onshore Markets?
Chart II-2Chinese Yields Have Low Correlation With DM Bond Yields
Can Global Investors Afford To Ignore China’s Onshore Markets?
Can Global Investors Afford To Ignore China’s Onshore Markets?
For foreign DM government bonds, the conventional wisdom is to hedge foreign currency exposure because currency fluctuations outweigh bond volatility. A GAA Special Report shows that hedged foreign bonds have favorable return-risk profiles compared with domestic bonds in major DM countries. For EM local currency debt (based on the JP Morgan GBI-EM Global Diversified Local Currency Debt Index), USD investors should hedge their EM FX exposure while non-USD DM investors should not hedge. However, non-USD investors should avoid EM local currency debt if their objective is to maximize risk-adjusted return on the long-term horizon. Do Chinese bonds share the same traits as the EM aggregate? Our analysis suggests that Chinese bonds have historically provided better risk-adjusted returns to USD-based bond investors, hedged and unhedged. Thus, allocating a portion of the US Treasury portfolio to Chinese onshore bonds would improve a US bond portfolio’s return-risk profile. The Bloomberg Barclays (BB) China Treasury and Policy Bank Bond Index is used for the analysis. The index has a history starting in January 2004, even though it was included in BB's three flagship bond indexes only in April 2019. On a hedged basis, Chinese onshore bonds deliver similar returns to global bonds as shown in Chart II-3. This is not surprising because interest-rate parity implies that the expected return on domestic assets equals the exchange-rate adjusted return on foreign currency assets, given foreign exchange market equilibrium. Unhedged returns, however, have outperformed both local and foreign government bonds for bond investors in the US, Japan, UK and the euro area since 2004 (Chart II-4). Carry was negative for USD-, GBP- and euro-based investors before the Global Financial Crisis, but has become positive since that time. The CNY has appreciated in general, albeit with greater movement against the non-USD crosses. Chart II-3Chinese Bond Performance In A Global Context
Can Global Investors Afford To Ignore China’s Onshore Markets?
Can Global Investors Afford To Ignore China’s Onshore Markets?
Chart II-4Carry And Spot CNY Exchange Rate
Can Global Investors Afford To Ignore China’s Onshore Markets?
Can Global Investors Afford To Ignore China’s Onshore Markets?
Unhedged Chinese bonds have much higher absolute returns and also much higher volatility when compared with hedged bonds. How do Chinese onshore bonds fare on a risk-adjusted return basis? Table 2 compares the risk-return profiles of hedged and unhedged Chinese bonds with local and hedged foreign DM bonds in two periods: one from January 2004 and the other from July 2017 when the Bond Connect was launched. Table 2Return-Risk Profiles: Chinese Onshore Bond Index Vs DM Local Bond Indexes
Can Global Investors Afford To Ignore China’s Onshore Markets?
Can Global Investors Afford To Ignore China’s Onshore Markets?
Several observations from Table 2: In local currency terms, Chinese bonds have the best risk-adjusted return and the second lowest volatility – only higher than Japanese government bonds (JGBs) – both from January 2004 and from July 2017. Since the start of Bond Connect, the risk-adjusted return of Chinese bonds in CNY has strengthened significantly with higher return and lower volatility. In contrast, there has been a deterioration in DM local bonds and their corresponding hedged foreign government bonds’ return/risk profiles. In the past four years, Chinese bonds have outperformed all DM local bonds when unhedged, both in terms of absolute return and risk-adjusted return. When compared with a hedged foreign government bond, however, the absolute return advantage has been offset by much higher FX volatility. Still, euro- and JPY-based bond investors enjoy higher risk-adjusted returns from unhedged Chinese bonds than their respective hedged foreign DM government bonds. However, GBP-based investors would be better off with hedged non-UK government bonds. For USD-based bond investors, unhedged Chinese bonds would only be slightly inferior to hedged non-US government bonds. On a hedged basis, Chinese bonds have lower returns and less volatility than local bonds (with the exception of Japan), but they have higher risk-adjusted returns than local bonds in all but the euro area. When compared with hedged foreign bonds, euro- and USD-based investors would do slightly better with the Chinese bonds while JPY- and GBP-based investors would earn slightly more with other DM government bonds. How much should a bond investor replace local bonds with Chinese ones? For illustration, Chart II-5 plots the efficient frontiers for bond investors in the US, euro area, Japan and the UK when hedged Chinese bonds are added to their respective domestic bond portfolios. This addition would reduce portfolio volatility for all domestic bond portfolios, regardless of time frame. This is especially impressive for JGB investors because JGBs already have the lowest volatility among DM bonds. Moreover, returns would be improved for USD- and JPY-based investors when Chinese bonds are gradually included in domestic bond portfolios up to the risk-minimizing point. Chart II-5Adding Hedged Chinese Bonds Reduces Volatility For All DM Domestic Bond Portfolios*
Can Global Investors Afford To Ignore China’s Onshore Markets?
Can Global Investors Afford To Ignore China’s Onshore Markets?
For GBP- and euro-based investors, however, adding hedged Chinese bonds would reduce absolute returns, but significantly improve risk-adjusted returns for GBP-based bond investors. Interestingly, even though euro zone local bonds have had superior risk-adjusted returns to hedged Chinese bonds since 2017, their risk-adjusted returns would still increase by about 18% when 50% of their local-bond portfolio is allocated to Chinese bonds. What is more striking is how unhedged Chinese bonds impact the return/risk profiles of global investors’ domestic bond portfolios. Unlike DM foreign bonds, which have inferior risk-adjusted returns when foreign currency exposure is not hedged, unhedged Chinese onshore bonds actually enhance a domestic bond investor’s absolute and risk-adjusted returns, as shown in Chart II-6. This is because of Chinese bonds’ superior risk-adjusted return measured in CNY (Table 2), negative correlations with CNY crosses (Chart II-7) and low to negative correlations with DM government bonds (Chart II-2). Chart II-6Adding Unhedged Chinese Bonds Enhances Absolute and Risk-Adjusted Returns For All DM Domestic Bond Portfolios*
Can Global Investors Afford To Ignore China’s Onshore Markets?
Can Global Investors Afford To Ignore China’s Onshore Markets?
For US bond investors who seek to maximize risk-adjusted return, the domestic Treasury portfolio would be improved significantly if about 40-50% of their holding were allocated to unhedged Chinese bonds. In comparison, the ratios would be lower for bond investors in the euro area, Japan and the UK. The key message is that global investors do not need to hedge the RMB exposure when investing in the Chinese onshore bond market. Chart II-7Chinese Bond Correlation With DM Currencies
Can Global Investors Afford To Ignore China’s Onshore Markets?
Can Global Investors Afford To Ignore China’s Onshore Markets?
Chart II-8Chinese Yuan Still Has Upside Potential
Can Global Investors Afford To Ignore China’s Onshore Markets?
Can Global Investors Afford To Ignore China’s Onshore Markets?
We still have a favorable cyclical outlook for the CNY against the US dollar, supporting the case not to hedge the currency. The CNY is at about one standard deviation below fair value even though the gap has been narrowing since mid-2020 (Chart II-8). We expect the CNY to keep appreciating in the coming years barring major disruptive geopolitical/political events. China’s relatively strong productivity growth should continue to support the currency’s rising fair value. On a cyclical basis, given that the US Fed is firmly staying behind the curve (capping the upside in real bond yields in the US), the differential in real interest rates between China and other major economies should remain favorable for the RMB. Bottom line: In a search-for-yield environment, the return-risk profiles of dedicated DM government bond portfolios may be enhanced by adding some exposure to Chinese onshore bonds on an unhedged basis. Part 3. Chinese Onshore Assets For Global Multi-Asset Portfolios Chinese onshore stocks on their own are not suitable for long-term, buy-and-hold strategic investments due to extremely high volatility, and the positive and rising correlation with global stocks and with CNY crosses. Chinese bonds, on the other hand, have an attractive risk-return profile with very low volatility, low correlation with global bonds, and negative correlation with CNY crosses. The negative correlation between Chinese stocks and bonds means that a mixed portfolio of the two assets would provide good diversification (Chart III-1). Chart III-1Chinese Onshore Assets
Can Global Investors Afford To Ignore China’s Onshore Markets?
Can Global Investors Afford To Ignore China’s Onshore Markets?
Chart III-2Chinese Multi-Asset Portfolio Correlation With Global Multi-Asset Portfolios
Can Global Investors Afford To Ignore China’s Onshore Markets?
Can Global Investors Afford To Ignore China’s Onshore Markets?
Investors may have different stock-bond allocations based on their return-risk objectives and constraints. For illustration, we constructed a stand-alone Chinese multi-asset portfolio by equally weighting onshore stocks and bonds. The correlations of this portfolio with six DM domestic 70-30 stock-bond portfolios have varied over time and by different countries, as shown in Chart III-2. Our Chinese-asset portfolio has a relatively high correlation with US and Japanese assets, but a low correlation with European assets, and almost no correlation with Australian and Canadian assets. Accordingly, the diversification effects are much stronger for GBP-, euro-, AUD- and CAD-based investors than for USD- and JPY-based investors, as shown in Chart III-3. Chart III-3Chinese Multi-Asset Portfolio Should Be Treated As A Standalone Asset By Non-US Asset Allocators
Can Global Investors Afford To Ignore China’s Onshore Markets?
Can Global Investors Afford To Ignore China’s Onshore Markets?
Chart III-3 shows how the risk-return profile of a standard 70-30 stock-bond portfolio in the US, UK, Japan, euro area, Australia and Canada may be improved by adding some exposure to a 50-50 Chinese stock-bond portfolio. Even though this equally weighted Chinese onshore asset portfolio has unimpressive returns, when added to a domestic stock-bond portfolio there is an improvement in the return-risk profile of all non-USD-based portfolios. The optimal allocation to the stand-alone Chinese onshore portfolio varies with different home currencies, objectives and time periods, as shown in Table 3. Table 3Chinese Assets Improve Global Multi-Asset Portolios' Return-Risk Profiles
Can Global Investors Afford To Ignore China’s Onshore Markets?
Can Global Investors Afford To Ignore China’s Onshore Markets?
Bottom Line: Unhedged Chinese onshore stocks and bonds may be treated as a stand-alone asset for global asset allocators, especially non-US ones. Adding a simple 50-50 Chinese stock-bond portfolio may boost the return/risk profile of global multi-asset portfolios. Part 4. Operational Q&A Many foreign investors believe that China’s onshore markets are hard to access. However, regulatory changes in the past 10 years, partially since Stock Connect was launched in 2014, have made it simpler from an operational point-of-view to buy and sell Chinese onshore equities and bonds. Below we answer some questions that international investors may have about market access. Q: Are there any access or quota restrictions for offshore investors to invest in China A-shares via Stock Connect? Historically, access to China’s mainland equity market by offshore investors was restricted through investment quotas and local currency controls. Since 2014, with the launch of Stock Connect, offshore investors no longer have access or repatriation restrictions. Stock Connect allows offshore investors to trade selected A-share stocks listed on the Shanghai (SSE) and Shenzhen (SZSE) Stock Exchanges through offshore brokers. Although not all A-shares listed on the SSE or SZSE can be invested in through Stock Connect, eligible stocks include almost all large- and medium-cap A-shares.1 Note that the Shanghai-Hong Kong (SH-HK) Stock Connect and the Shenzhen-Hong Kong (SZ-HK) Stock Connect complement each other, but they have a dual-channel, independent operation mechanism with two distinct Connect operations. Therefore, their shares cannot be cross-traded. Q: How to purchase China’s A-Shares via Stock Connect? Offshore investors need a Hong Kong or international broker (see MMA <GO> on Bloomberg for a list of Offshore brokers for Stock Connect northbound trading), through whom they buy A-shares. Brokers instruct Hong Kong Exchange’s (HKEX) participants to conduct northbound trades on the SSE or SZSE. Hong Kong Exchange’s subsidiary (a SSE or SZSE participant) also takes instructions to conduct trades on the SSE or SZSE stock exchanges. Clearing and settlement services of A-shares executed through Stock Connect are provided by the Hong Kong Securities Clearing Company (HKSCC), a solely-owned subsidiary of the HKEX, through clearing links established with the China Securities Depository and Clearing Corporation Limited (ChinaClear). The shares of offshore investors are held in an onshore omnibus securities account registered under the HKSCC. Q: Is margin trading or short selling allowed for Stock Connect northbound trading stocks? Yes, most eligible Stock Connect northbound trading A-shares are permitted for margin trading or short selling. Nowadays, more than 80% of the total eligible Stock Connect northbound trading stocks in the SSE and more than 70% of that in the SZSE are permitted for margin trading and short selling. HKEX provides a list of eligible equities for margin trading and short selling in a timely manner.2 Q: Are there other ways to tactically manage exposure to China’s A-shares? There are offshore ETFs that investors can use to hedge their exposure to Chinese equities (Table 4). For example, Direxion Daily CSI 300 China A Share Bear 1X ETF listed on the New York Stock Exchange (NYEX) provides 100% of the inverse exposure of the performance for the CSI 300 index. This ETF may be used to hedge offshore investors’ exposure to domestic China A- shares. Table 4ETFs That Can Be Used To Hedge Investors’ Exposure To Chinese Equities
Can Global Investors Afford To Ignore China’s Onshore Markets?
Can Global Investors Afford To Ignore China’s Onshore Markets?
Q: Describe the main differences between Bond Connect and CIBM Direct. How do overseas investors hedge their currency exposure when investing in China’s onshore bond market? Bond Connect and China Interbank Bond Market (CIBM) Direct are the official channels for offshore investors to invest in China's onshore bond market except for Qualified Foreign Institutional Investors (QFII) and RMB Qualified Foreign Institutional Investors (RQFII). Around 680 foreign institutional investors have entered China’s interbank bond market since Bond Connect’s launch in July 2017.3 Here are some differences between CIBM Direct and Bond Connect: Bond Connect is based offshore, which gives overseas investors easy and quota-free access to China’s onshore interbank bond market through offshore trade platforms. Bond Connect permits investors to open accounts, trade, and settle transactions in the offshore market whereas CIBM Direct stipulates the process must be completed in the onshore market. CIBM Direct offers greater access to opportunities in the onshore market because it has access to a wider range of products and hedge tools, such as repos, interest rate swaps, bond lending and bond forwards. In comparison, the only Bond Connect products are bonds traded in China’s inter-bank bond market, and hedge tools are limited. In terms of currency hedging, both CIBM Direct and Bond Connect allow FX hedge tools such as forwards, swaps and options to help investors hedge their exposure to CNY (Chinese yuan traded in the onshore market). CIBM Direct trades in CNY rather than CNH (CNH is Chinese yuan traded in the offshore market) and allows investors to hold onshore balances in CNY. Bond Connect, however, does not allow investors to hold CNY balances. Under Bond Connect, investors are required to exchange CNY into CNH for any excess cash from trading or coupon payments, which can be a currency risk when funds are repatriated. However, offshore investors can hedge their FX exposure with FX Settlement Banks by engaging in various FX trades and FX hedge tools that match their bond position. FX Settlement Banks are banks in Hong Kong approved by the China Foreign Exchange Trade System (CFETS) to access the FX market of CIBM as RMB participation banks. Offshore FX Settlement Banks may square positions in either offshore or onshore FX markets. Investors should contact their Hong Kong custodians, which will appoint an FX Settlement Bank for FX conversion and hedging. Q: Is there another currency hedge mechanism for investors’ CNY exposure? CNY exposure can be hedged using the usual instruments, such as CNH-forwards or CNY-non deliverable forwards (NDF). However, the CNH-forward has CNH basis risk, which arises from the differences between CNY and CNH spot rates. Investors may consider short CNY currency ETFs listed on the offshore market, such as the WisdomTree Chinese Yuan Strategy Fund (CYB) on the NYEX. CYB offers exposure to the overnight Chinese yuan and uses both short- and long-forward currency contracts for both CNH and CNY to manage its expectations for the currency. It seeks to achieve total returns reflective of money market rates in China available to foreign investors and of changes in the value of the yuan versus the dollar. Xiaoli Tang Associate Vice President, Global Asset Allocation xiaoliT@bcaresearch.com Qingyun Xu, CFA Associate Editor, China Investment Strategy qingyunx@bcaresearch.com Appendix 1: The Evolution of The Chinese Onshore Markets China’s onshore equity and bond markets have grown dramatically in the past two decades. The equity market is the second largest in the world with more than 4,400 listed companies; the combined market capitalization of the Shanghai and Shenzhen stock exchanges has reached USD12.2 trillion (Chart A1). China’s bond market also is ranked second globally, after the US, with amounts outstanding at USD18.6 trillion (Chart A2). Chart A1China’s Stock Market Has Grown Sharply In The Past Two Decades
China's Stock Market Has Grown Sharply In The Past Two Decades
China's Stock Market Has Grown Sharply In The Past Two Decades
Chart A2China’s Onshore Bond Market Is Second Largest In World
Can Global Investors Afford To Ignore China’s Onshore Markets?
Can Global Investors Afford To Ignore China’s Onshore Markets?
Thanks to China’s financial market liberalization since the early 2000s, foreign investors can now access China's onshore stock and bond markets to include China A-shares and onshore bonds in portfolios. Various tools are available, including QFII, RQFII, Stock Connect, CIBM Direct and Bond Connect (Diagram 1). Since the launch of Stock Connect in late 2014, the cumulative net northbound flows to the Shanghai and Shenzhen exchanges have been more than RMB1.2 trillion (Chart A3, top panel). The cumulative net capital inflows through CIBM Direct and Bond Connect have reached more than RMB3.5 trillion since these mechanisms were introduced in 2016 and 2017, respectively (Chart A4, bottom panel). Diagram 1China’s Financial Market Liberalization Roadmap
Can Global Investors Afford To Ignore China’s Onshore Markets?
Can Global Investors Afford To Ignore China’s Onshore Markets?
Chart A3Net Inflows To China’s Onshore Markets Through Stock And Bond Connect
Net Inflows To China's Onshore Markets Through Stock And Bond Connect
Net Inflows To China's Onshore Markets Through Stock And Bond Connect
Chart A4Growing Foreign Holdings Of China’s Onshore Equities And Bonds
Growing Foreign Holdings Of China's Onshore Equities And Bonds
Growing Foreign Holdings Of China's Onshore Equities And Bonds
Although foreign investors’ holding of RMB-denominated assets increased significantly in recent years, their share of the total onshore market is still small, highlighting the potential for more capital inflows to China’s onshore market (Chart A4). Following the inclusion of China A-shares in global equity indexes, bond indexes have followed suit and Chinese government bonds are now offered in the world’s three major bond indices. Bloomberg Barclays Global Aggregate Index (BBGA) was the first to include Chinese government bonds in April 2019, followed by the JP Morgan Government Bond-Emerging Market Index (GBI-EM) in February 2020 and finally FTSE Russell’s World Government Bond Index (WGBI) in October 2021. Footnotes 1The list of eligible A-shares for Shanghai and Shenzhen Connect can be accessed via the HK Exchange 2List of eligible equities for margin trading and short selling 3List of approved investors under Bond Connect Market/Sector Recommendations Cyclical Investment Stance
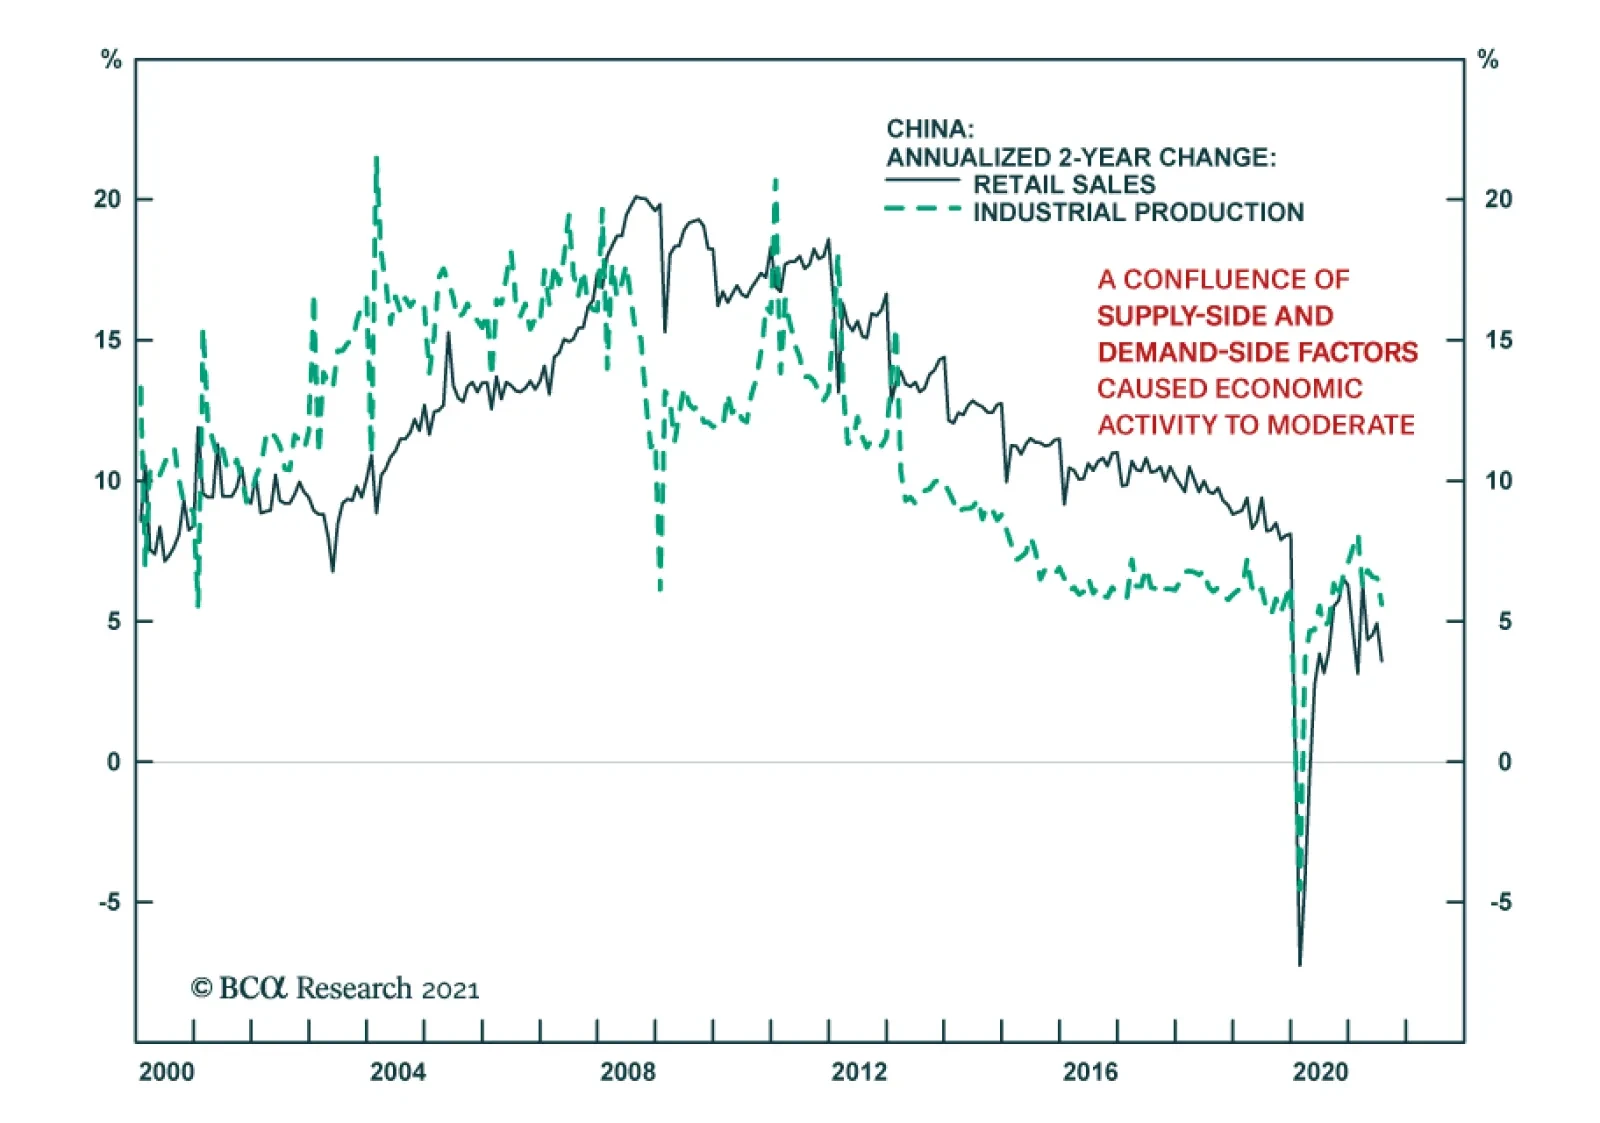
Chinese retail sales, industrial production, and fixed assets investment data for July disappointed. Retail sales slowed to 8.5% y/y in July from 12.1%, versus expectations of 10.9%. Similarly, industrial production decelerated to 6.4% y/y from 8.3% while…
Highlights The chaotic US withdrawal from Afghanistan is symbolic – the US is conducting a strategic pivot to Asia Pacific to confront China. US-Iran negotiations are the linchpin of this pivot. If they fail, war risk will revive in the Middle East and the US will remain entangled in the region. At the moment, there is no deal, so investors should brace for a geopolitical risk premium in oil prices. That is, as long as global demand holds up despite COVID-19, and as long as the OPEC 2.0 cartel remains disciplined. We think they will in the short run. The US and Iran still have fundamental reasons to agree to a deal. If they do, the US will regain global room for maneuver while China’s and Russia’s window of opportunity will close. The implication is that markets face near-term oil supply risks – and long-term geopolitical risks due to Great Power rivalry in Eastern Europe and East Asia. Feature Events in Afghanistan have little macroeconomic significance but the geopolitical changes underway are profound and should be viewed through the lens of our second key view for 2021: the US strategic pivot to Asia. Chart 1The US Pivot To Asia Runs Through Iran Not Afghanistan
The US Pivot To Asia Runs Through Iran Not Afghanistan
The US Pivot To Asia Runs Through Iran Not Afghanistan
As we go to press the Taliban is reconquering swathes of Afghanistan while US armed forces evacuate embassy staff and civilians. The chaotic scenes are reminiscent of the US’s humiliating flight from Saigon, Vietnam in 1975. As with Vietnam, the immediate image is one of American weakness but the reality over the long run is likely to be different. Over the past decade we have chronicled the US’s efforts to disentangle itself from wars of choice in the Middle East and South Asia. In accordance with US grand strategy, Washington is refocusing its attention on its rivalries with Russia and especially China, the only power capable of supplanting the US as a global leader (Chart 1). The US has struggled to conduct this “pivot to Asia” over the past decade but the underlying trajectory is clear: while trying to manage its strategic interests in the Middle East through naval power, the US will need to devote greater resources and attention to shoring up its economic and military ties in Asia Pacific (Map 1). The Middle East still plays a critical role – notably through China’s energy import needs – but primarily via the Persian Gulf. Map 1The US Seeks Balance In Middle East In Order To Pivot To Asia And Confront China
Afghanistan? Watch Iran And China
Afghanistan? Watch Iran And China
Thus the critical geopolitical risks today stem from Iran and the Middle East on one hand, and China on the other. They do not stem from the US’s belated and messy exit from Afghanistan, which has limited market relevance outside of South Asia. First, however, we will address the political impact in the United States. US Political Implications Chart 2Americans Agree With Biden And Trump On Exit From Afghanistan
Afghanistan? Watch Iran And China
Afghanistan? Watch Iran And China
American popular opinion has long turned against the “forever wars” in Iraq and Afghanistan, which cumulatively have cost $6.4 trillion and about 7,000 American troops dead1 (Chart 2). Three presidents, from two political parties, campaigned and won election on the basis of winding down these wars. The only presidential candidate since Republicans George W. Bush and John McCain who took a hawkish stance for persistent military engagement, Hillary Clinton, nearly lost the Democratic nomination and did lose the general election to a Republican, President Trump, who had reversed his party’s stance to advocate strategic withdrawal. War hawks have been sidelined in both parties. This is notable even if it were not the case that the current President Biden, whose son Beau fought in Afghanistan, had opposed the troop surge there under Obama. True, Biden will use drones, surgical strikes, and limited troop rotations to manage the aftermath in Afghanistan, both militarily and politically. Americans are still concerned about terrorism in general and any sign of a resurgent terrorist threat to the US homeland will be politically potent (Chart 3). But neither Biden nor the US can roll back the Taliban’s latest gains or achieve anything in Afghanistan that has not been achieved over the past twenty years. Chart 3American Public Cares About Terrorism, Not Afghanistan Per Se
Afghanistan? Watch Iran And China
Afghanistan? Watch Iran And China
True, Biden will suffer a political black eye from Afghanistan. His approval rating has already fallen to 49.6%, slipping beneath 50% for the first time, in the face of the Delta variant of COVID-19 and the Afghan debacle. In both cases his early optimistic statements have now become liabilities. Biden is also 79 years old, which will make the 2024 campaign questionable, and he faces mounting problems in other areas, from lax border security and immigration enforcement to rising domestic crime. Nevertheless, Biden still has sufficient political capital to push through one or both of his major domestic legislative proposals by the end of the year, despite thin majorities in both the House and Senate. Afghanistan will not affect that, for three reasons: 1. The US economy is likely to continue to recover despite hiccups due to the lingering pandemic, since the vaccines so far are effective. The labor market is recovering and business capex and government support are robust. Setbacks, such as volatile consumer confidence, will help Biden pass bills designed to shore up the economy. 2. The public fundamentally agrees with Biden (and Trump) on military withdrawal, as mentioned. Voters will only turn against him if a major attack reinforces an image of weakness on terrorism. A major attack based in Afghanistan is not nearly as likely to succeed as it was prior to the September 11, 2001 attacks. But Biden also faces an imminent increase in tensions in the Middle East that could result in attacks on the US or its allies, or other events that reinforce any image of foreign policy failure. 3. Biden has broad popular support for his infrastructure deal, which also has bipartisan buy-in, with 19 Republican Senators already having voted for it. Further, the Democratic Party has a special fast-track mechanism for passing his social spending agenda, though conviction levels must be modest on this $3.5 trillion bill, which is controversial and will have to be winnowed to pass on a partisan vote in the Senate. If we are correct that Afghanistan will not derail Biden’s legislative efforts then it will not fundamentally affect US fiscal policy or the global macro outlook. Note, however, that a failure of Biden’s bills would be significant for both domestic and global economy and financial markets as it would suggest that US fiscal policy is dysfunctional even under single party rule and would thus help to usher back in a disinflationary context. Might Afghanistan affect the midterm elections and hence the US policy setup post-2022? Not decisively. Republicans are more likely than not to retake at least the House of Representatives regardless. This is a cyclical aspect of US politics driven by voter turnout and other factors. Democrats are partly shielded in public opinion due to the Trump administration’s attempts to pull out of foreign wars. But surely a black eye on terrorism or foreign policy would not help. Similarly, a major failure to manage the Middle East, South Asia, and the pivot to Asia Pacific would marginally hurt the Democrats in 2024, but that is a long way off. Geopolitical Implications The Taliban’s reconquest of Afghanistan has very little if any direct significance for global financial markets. Pakistan and India are the two major markets most likely to be directly affected – and their own geopolitical tensions will escalate as a result – yet both equity markets have been outperforming over the course of the Taliban’s military gains (Chart 4). Afghanistan’s impacts are indirect at best. However, the US withdrawal connects with major geopolitical currents, with both macro and market significance. Afghanistan often marks the tendency of empires to overreach. Russia’s failure in Afghanistan contributed to the collapse of the Soviet Union, though Russia’s command economy was unsustainable anyway. British failures in Afghanistan in the nineteenth and twentieth centuries did not lead to the British empire’s decline – that was due to the world wars – but Afghanistan did accentuate its limitations. Since 9/11 and the US’s wars in Iraq and Afghanistan, the US public’s economic malaise, political polarization, and loss of faith in public institutions have gotten worse. In turn, political divisions have impeded the government’s ability to respond cogently to financial and economic crisis, the resurgence of Russia, the rise of China, nuclear proliferation, constitutional controversies, and the COVID-19 pandemic. Once again Afghanistan marked imperial overreach. It is natural for investors to be concerned about the stability of the United States. And yet the US’s global power has recently stabilized (Chart 5). The US survived the 2020 stress test and innovated new vaccines for the pandemic. It is passing laws to upgrade its domestic technological, manufacturing, and infrastructural base and confronting its global rivals. Chart 4If Indo-Pak Markets Shrug Off Taliban Wins, So Can You
If Indo-Pak Markets Shrug Off Taliban Wins, So Can You
If Indo-Pak Markets Shrug Off Taliban Wins, So Can You
Chart 5US Geopolitical Power Is Stabilizing
Afghanistan? Watch Iran And China
Afghanistan? Watch Iran And China
Chart 6US Not Shrinking From Global Role
US Not Shrinking From Global Role
US Not Shrinking From Global Role
The US is not retreating from its global role, judging by defense spending or trade balances (Chart 6). While the desire to phase out wars could theoretically open the way to defense cuts, the reality is that the great power confrontation with China and Russia will demand continued large defense spending. The US also continues to run large trade deficits, due to its shortage of domestic savings, which gives it influence as a consumer and provider of dollar liquidity across the world. The critical geopolitical problem is Iran, where events have reached a critical juncture: To create a semblance of a balance of power in the Middle East, the US needs an understanding with Iran, which is locked in a struggle with Saudi Arabia over the vulnerable buffer state of Iraq. President Biden was not able to rejoin the 2015 détente with Iran prior to the inauguration of the new president, Ebrahim Raisi, who is a hawk and whose confrontational policies will lead to an escalation of Middle Eastern geopolitical risk in the short term – and, if no US-Iran deal is reached, over the long term. Iran recognizes the US’s war-weariness, as demonstrated by withdrawals from Iraq and Afghanistan. It was also exposed to economic sanctions after the US’s 2018-19 abrogation of the 2015 nuclear deal – it cannot trust the US to hold to a deal across administrations. Still, both the US and Iran face substantial strategic forces pressuring them to conclude a deal. The US needs to pivot to Asia while Iran needs to improve its economy and reduce social unrest prior to its looming leadership succession. But the time frame for negotiation is uncertain. Any failure to agree would revive the risk of a major war that would keep the US entangled in the region. Thus the pivot to Asia could be disrupted again, with major consequences for global politics, not because of Afghanistan but because of a failure to cut a deal with Iran. If the US succeeds in reducing its commitments to the Middle East and South Asia, the window of opportunity that China and Russia have enjoyed since 2001 will close. They will face a United States that has greater room for maneuver on a global scale. This is a threat to their own spheres of influence. But neither Beijing nor Moscow has an interest in a nuclear-armed Iran, so a US-Iran deal is still possible. Unless and until the US and Iran normalize relations, the Middle East is exposed to heightened geopolitical risk and hence oil supply risk. Global oil spare capacity is sufficient to swallow small disturbances but not major risks to stability, such as in Iraq or the Strait of Hormuz. Investment Takeaways Chart 7Near-Term US-Iran Risks Help Oil...Long-Term US-China Risks Help Dollar
Near-Term US-Iran Risks Help Oil...Long-Term US-China Risks Help Dollar
Near-Term US-Iran Risks Help Oil...Long-Term US-China Risks Help Dollar
Back in 2001, the combination of American war spending, and conflict in the Middle East, combined with China’s massive economic opening after joining the WTO, led to a falling US dollar and an oil bull market. Today the US’s massive budget deficits and current account deficits present a structural headwind to the US dollar. Yet the greenback has remained resilient this year. While the pandemic will fade as long as vaccines continue to be effective, China’s potential growth is slowing even as it faces an unprecedented confrontation with the US and its allies. Until the US and Iran normalize relations, geopolitics will tend to threaten Middle Eastern oil supply and put upward pressure on oil prices. However, if the US manages the pivot to Asia, China will face more resolute opposition in its sphere of influence, which will tend to strengthen the dollar. The dollar and oil still tend to move in opposite directions. These geopolitical trends will be influential in determining which direction prevails (Chart 7). Thus geopolitics poses an upward risk to oil prices for now. Matt Gertken Vice President Geopolitical Strategy mattg@bcaresearch.com Footnotes 1 Please see Crawford, Neta, "United States Budgetary Costs and Obligations of Post 9/11 Wars Through FY 2020: $6.4 trillion", Watson Institute, Brown University.
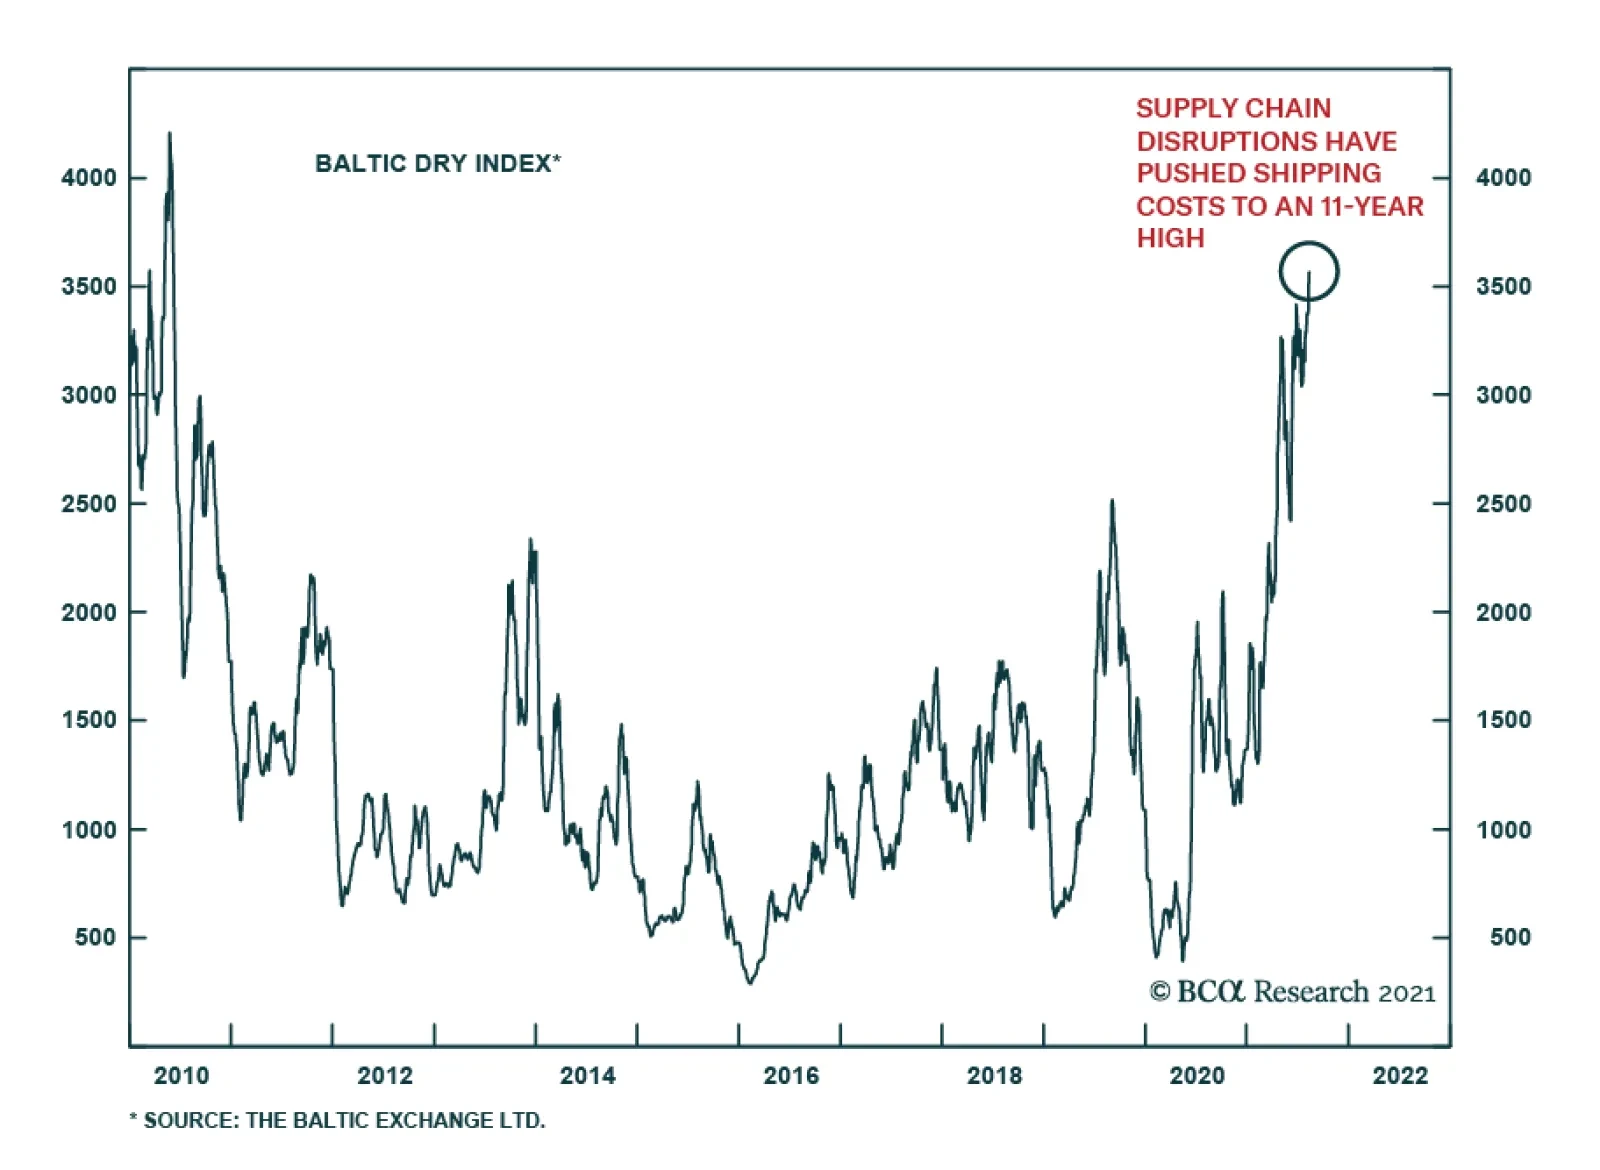
On Friday, the Baltic Dry Index jumped to an 11-year high on the back of the partial closure of the world’s third busiest port. The shutdown of China’s Ningbo-Zhoushan port comes as Beijing battles a resurgence in COVID-19 cases that have resulted in…